


Languages
Pages
Legal


www.mineravia.com

www.mineravia.com
Aim of Presentation
Road Design
Why are good mine roads necessary?
What is the impact of poor road design?
How do you assess and target a road improvement strategy?

www.mineravia.com
Aim of Presentation
What causes high rolling resistance on mine roads?
What does road design and construction involve?
How do I benchmark an operating road?
What do you see?
What does it mean?
How does you fix the problem?

www.mineravia.com
Introduction
Poor road design impacts traffic management, safety & cost per tonne hauled.
Traffic Management plans must include a formal approach to road design to;
Leverage the benefits of good traffic management and,
Improve road ‘performance’.
Engineering &Mining Journal, vol 210,n5 June 2009. Mining Media Ltd.

www.mineravia.com
Rolling Resistance
Primary measure of mine road ‘performance’ is often based on ‘rolling resistance’
Frequently the basis of a cost benefit evaluation, but…
… what is rolling resistance and how is it generated?

www.mineravia.com
Rolling Resistance
Rolling resistance is the resistance to truck motion due to:
Road deformation under the tyre,
Tyre penetration into the road,
Tyre deformation effects on the road surface.

www.mineravia.com
Road deformation under tyre pressure
Tyre penetration into the road surface
Tyre deformation effects on the road surface

www.mineravia.com
Rolling Resistance
RR%
GR% (+ve against the load)
(-ve with the load)
Total resistance% = RR% ± GR%

www.mineravia.com
Practical Application
Ramps
1%RR 10%KPH
Surface roads
1%RR 26%KPH

www.mineravia.com
Practical Application
Ramps
1%RR 10%KPH
Surface roads
1%RR 26%KPH
0 1 2 3 4 5 6 7 8 9 10 11 12
0
5
10
15
20
25
Pe
rce
nt
red
uc
tio
n in
sp
ee
d
pe
r 1
% R
R in
cre
as
e (
%)
Grade (%) of road
Effect of rolling resistance on truck speed
Base case rolling resistance (RR) = 2%
2% to 3% RR
3% to 4% RR
4% to 5% RR
Rear dump truck (electric drive) with 4,27kW/t GVM
RR%
GR%
RR%
GR%
Performance Chart Liebherr T282B 4.32kW(net)/tonne GVM
50/80R63 Tyres and 37.33:1 Drive ratio
0
100
200
300
400
500
600
700
800
900
1000
1100
1200
1300
1400
0 10 20 30 40 50 60 70 80 90
Speed (km/h)
Rim
pu
ll (
kN
)
Propulsion
Retard
Propulsion (trolley)
Full truck
(GVM = 592 tonnes)Empty truck
(EVM = 229 tonnes)
Eff
ecti
ve G
rad
e (
%)
20
18
16
14
12
10 8
6
4 2
1
Effective grade (UPHILL) % = Grade % + rolling resistance% Effective grade (DOWNHILL)% = Grade % – rolling resistance%

www.mineravia.com
Rolling resistance also effects the ‘optimum’ grade of a ramp – the grade at which the truck travel time is minimised.
In this example, TOTAL resistance (Grade% + RR%) is ‘optimum’ at 13% for this model of truck ; 11%+2%, 10%+3%, etc…
Practical Application

www.mineravia.com
Haul Road Design
How do we ensure the best possible road design which
Maximises safety
Minimises rolling resistance and,
Minimises total-road users costs:
$construct+$operate+$maintain?

www.mineravia.com
Haul Road Design
From a rolling resistance perspective, minimise;
Structural Design – deformation under tyre,
Functional Design – penetration and tyre deformation,
Maintenance Design – road deterioration rate.

www.mineravia.com
Improving Mine Haul Roads
Unsprung mass acceleration due to two 100mm road defects
374t GVM RDT
-15
-10
-5
0
5
10
15
0 0.5 1 1.5 2 2.5 3 3.5 4
Arbitrary time (s)
Accele
rati
on
(m
/s2)
0
0.1
0.2
0.3
0.4
0.5
0.6
Measured truck response Actual road defect
Ro
ad
defe
ct
heig
ht
(m)
Unsprung mass acceleration due to two 100mm road defects
374t GVM RDT
-15
-10
-5
0
5
10
15
0 0.5 1 1.5 2 2.5 3 3.5 4
Arbitrary time (s)
Accele
rati
on
(m
/s2)
0
0.1
0.2
0.3
0.4
0.5
0.6
Measured truck response Actual road defect
Ro
ad
defe
ct
heig
ht
(m)

www.mineravia.com
Improving Mine Haul Roads
First, you need to know what is wrong before you can decided to fix it.
Real-time monitoring can be used to record the truck and tyre response to the road, and when linked with GPS, gives the first indication of WHERE and WHAT the haul road problems are.
Truck path
start
Defect 0.05 to 0.10m
Defect 0.11 to 0.20m
Defect 0.21 to 0.30m
Defect 0.31 to 0.40m
Defect 0.41 to 0.50m

www.mineravia.com
Improving Mine Haul Roads
The cure is not necessarily just ‘more frequent’ maintenance.
No amount of maintenance will fix a poorly-designed road. Each component of the road infrastructure must be correctly addressed at the design stage.

www.mineravia.com
Improving Mine Haul Roads
Investigate the root-cause of the under – performance before deciding on a remediation strategy.
Follow an ‘integrated’ approach to road design, examine each design ‘component’.

www.mineravia.com
BASIC HAUL ROAD
DESIGN DATA
STRUCTURAL DESIGN
GUIDELINES
GEOMETRIC DESIGN
GUIDELINES
FUNCTIONAL DESIGN
GUIDELINES
MAINTENANCE
MANAGEMENT
GUIDELINES MO
DIF
Y W
EA
RIN
G
CO
UR
SE
MA
TE
RIA
L
CH
EM
ICA
L
PA
LL
IAT
ION
OR
WA
TE
R-B
AS
ED
SP
RA
YIN
G
IS PERFORMANCE
OPTIMUM
AND
DELIVERING MINIMUM TOTAL
ROAD-USER COSTS?
MOST COST EFFICIENT SOLUTION TO HAUL ROAD DESIGN AND OPERATION

www.mineravia.com
Integrated Road Haul Design BASIC HAUL ROAD
DESIGN DATA
STRUCTURAL DESIGN
GUIDELINES
GEOMETRIC DESIGN
GUIDELINES
FUNCTIONAL DESIGN
GUIDELINES
MAINTENANCE
MANAGEMENT
GUIDELINES MO
DIF
Y W
EA
RIN
G
CO
UR
SE
MA
TE
RIA
L
CH
EM
ICA
L
PA
LL
IAT
ION
OR
WA
TE
R-B
AS
ED
SP
RA
YIN
G
IS PERFORMANCE
OPTIMUM
AND
DELIVERING MINIMUM TOTAL
ROAD-USER COSTS?
MOST COST EFFICIENT SOLUTION TO HAUL ROAD DESIGN AND OPERATION

www.mineravia.com
Geometric Design
X

www.mineravia.com
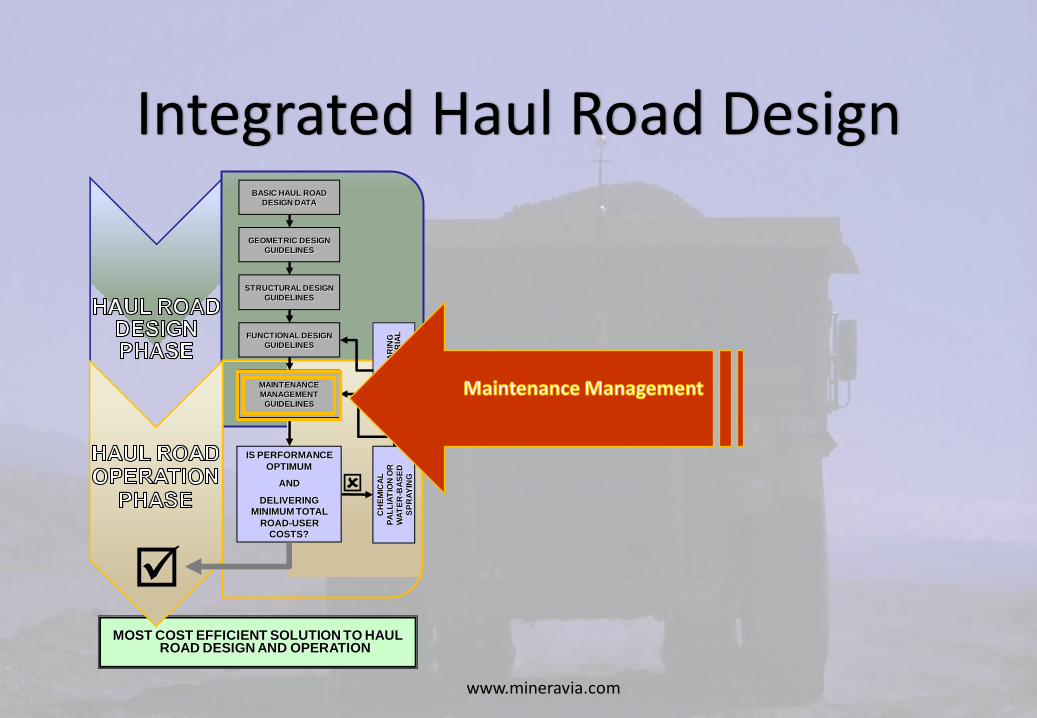
Integrated Haul Road Design BASIC HAUL ROAD
DESIGN DATA
STRUCTURAL DESIGN
GUIDELINES
GEOMETRIC DESIGN
GUIDELINES
FUNCTIONAL DESIGN
GUIDELINES
MAINTENANCE
MANAGEMENT
GUIDELINES MO
DIF
Y W
EA
RIN
G
CO
UR
SE
MA
TE
RIA
L
CH
EM
ICA
L
PA
LL
IAT
ION
OR
WA
TE
R-B
AS
ED
SP
RA
YIN
G
IS PERFORMANCE
OPTIMUM
AND
DELIVERING MINIMUM TOTAL
ROAD-USER COSTS?
MOST COST EFFICIENT SOLUTION TO HAUL ROAD DESIGN AND OPERATION

www.mineravia.com
Structural Design

www.mineravia.com
Integrated Road Haul Design BASIC HAUL ROAD
DESIGN DATA
STRUCTURAL DESIGN
GUIDELINES
GEOMETRIC DESIGN
GUIDELINES
FUNCTIONAL DESIGN
GUIDELINES
MAINTENANCE
MANAGEMENT
GUIDELINES MO
DIF
Y W
EA
RIN
G
CO
UR
SE
MA
TE
RIA
L
CH
EM
ICA
L
PA
LL
IAT
ION
OR
WA
TE
R-B
AS
ED
SP
RA
YIN
G
IS PERFORMANCE
OPTIMUM
AND
DELIVERING MINIMUM TOTAL
ROAD-USER COSTS?
MOST COST EFFICIENT SOLUTION TO HAUL ROAD DESIGN AND OPERATION

www.mineravia.com
Functional Design

www.mineravia.com
Integrated Haul Road Design BASIC HAUL ROAD
DESIGN DATA
STRUCTURAL DESIGN
GUIDELINES
GEOMETRIC DESIGN
GUIDELINES
FUNCTIONAL DESIGN
GUIDELINES
MAINTENANCE
MANAGEMENT
GUIDELINES MO
DIF
Y W
EA
RIN
G
CO
UR
SE
MA
TE
RIA
L
CH
EM
ICA
L
PA
LL
IAT
ION
OR
WA
TE
R-B
AS
ED
SP
RA
YIN
G
IS PERFORMANCE
OPTIMUM
AND
DELIVERING MINIMUM TOTAL
ROAD-USER COSTS?
MOST COST EFFICIENT SOLUTION TO HAUL ROAD DESIGN AND OPERATION

www.mineravia.com
Maintenance frequency
Rolling resistance
Max
Min
Minimum total
cost solution
Max
Min
Costs

www.mineravia.com
Geometric Design
Geometric design;
Determines the road layout – or alignment, both horizontally and vertically.
Practically, we often need to compromise between an ideal layout and what mine geometry and hauling economics will allow.

www.mineravia.com
Establish start and end
points of road. Feasible (mine plan) and
economic route (topography)
selection.
Optimise truck performance
against route grades and
speeds and construction
costs.
Design horizontal and
vertical alignments. Check
sight distances throughout.
Check additional road
geometric requirements
against ALL road-user
vehicles.
Survey and peg the route
centre lines. Test soil
properties for Structural
Design phase
Check drainage requirements
with topographic contours in
vicinity of route.
Assess junction and
intersection layouts and
associated safety
components.
www.mineravia.com
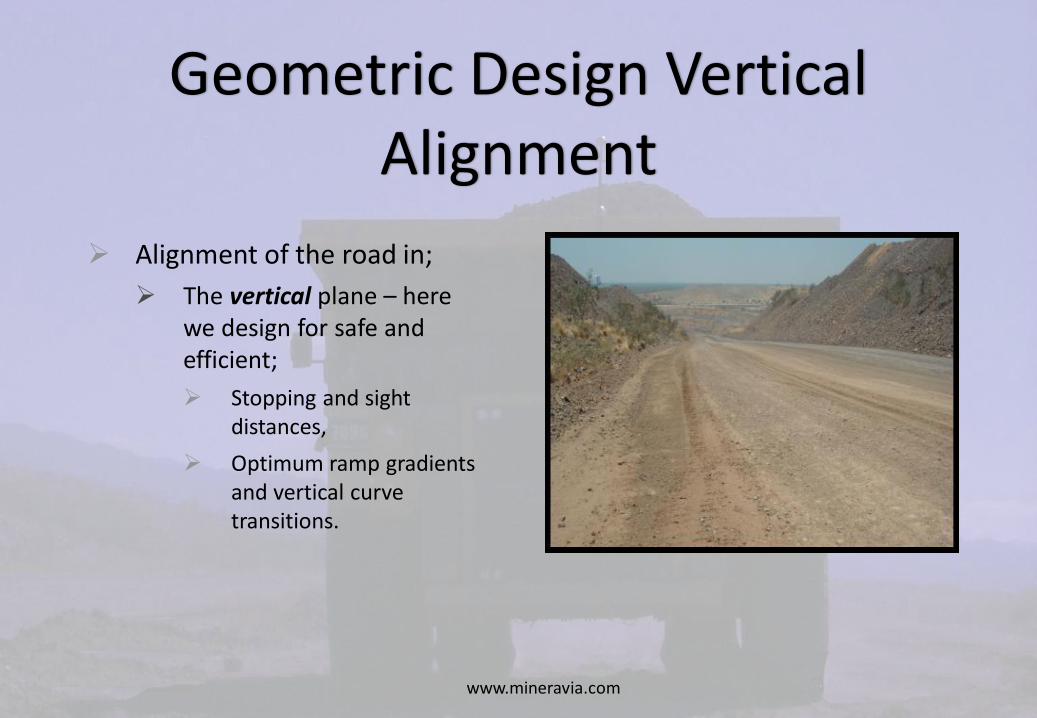
Geometric Design Vertical Alignment
Alignment of the road in;
The vertical plane – here we design for safe and efficient;
Stopping and sight distances,
Optimum ramp gradients and vertical curve transitions.

www.mineravia.com
Geometric Design Vertical Alignment
Stopping distances;
Truck manufacturers and site testing should confirm the distances required to bring a truck to a stop under various conditions of load, speed, grade and traction.

www.mineravia.com
Geometric Design Vertical Alignment
Sight distances; precautions should be applied when sight distance falls below stopping distance;
Bench edge obstructions require lay-backs or batter,
Vertical curves – crests often require flattening to improve sight distances,
Use a minimum vertical curve length of 150m and radius of 1500m for design work.
Apply speed limits.

www.mineravia.com
Geometric Design Vertical Alignment
Sight distances and machine factors;
In addition to sight distances – also consider driver blind spots – where the driver has limited or no sight of parts of the road.
Final Report Blind Area Study Large Mining Equipment, Contract Report
200-2005-M-12695, CDC/NIOSH, USA, 2006.

www.mineravia.com
Geometric Design Horizontal Alignment
Alignment of the road in the horizontal plane – here we design for safe and efficient;
Road width,
Curvature and super-elevations,
Crown or cross-fall.

www.mineravia.com
Geometric Design Horizontal Alignment
Ramp W3Ramp W3
Ramp W5Ramp W5
Ramp W4Ramp W4
Ramp W3Ramp W3
Ramp W5Ramp W5
Ramp W4Ramp W4

www.mineravia.com
Geometric Design Horizontal Alignment
Main haul roadMain haul road
Ramp W1 (E)Ramp W1 (E)Ramp W1 (W)Ramp W1 (W)
Main haul roadMain haul road
Ramp W1 (E)Ramp W1 (E)Ramp W1 (W)Ramp W1 (W)

www.mineravia.com
Geometric Design Horizontal Alignment
Width of road;
Sufficient for the required number of lanes (pavement width), and shoulders (carriageway width) and all the associated safety and drainage features (formation width).

www.mineravia.com
Geometric Design Horizontal Alignment
The widest vehicles proposed determine the pavement width.
The Table summarizes these design roadway widths.
Truck images courtesy Caterpillar Inc

www.mineravia.com
Geometric Design Horizontal Alignment
Curves and switchbacks;
Designed with the maximum radius possible and be kept smooth and consistent.
Changes in curve radii (compound curves) should be avoided. A larger curve radius allows a higher safe road speed and increased truck stability - 200m minimum radius ideal.

www.mineravia.com
Geometric Design Horizontal Alignment
Super-elevation;
Banking applied on the outside of a curve to allow the truck to maintain stability in the curve at speed.
Should not exceed 5% -7%, unless high-speed haulage is maintained and the possibility of sliding minimized by using median berms to split super-elevations. Refer Table.
Speed (km/h) and super-elevation (m/m width of road) Curve Radius (m) 15 20 25 30 35 40
45km 50 55
50 0.035 0.060 0.090
75 0.025 0.045 0.070 0.090
100 0.020 0.035 0.050 0.075 0.090
150 0.020 0.025 0.035 0.050 0.065 0.085
200 0.020 0.020 0.025 0.035 0.050 0.065 0.080
300 0.020 0.020 0.020 0.025 0.035 0.045 0.055 0.065 0.080
400 0.020 0.020 0.020 0.020 0.025 0.035 0.040 0.050 0.060
500 0.020 0.020 0.020 0.020 0.020 0.025 0.030 0.040 0.050
X

www.mineravia.com
Geometric Design Horizontal Alignment
Cross-fall, crown or camber;
Critical to the design and successful operation of mine roads.
Ensures water does not gather on and penetrate into the road surface.

www.mineravia.com
Geometric Design Horizontal Alignment
Cross-slope should be used with caution, possibility of collision increases or run-off bench edge.
Large deflection berms should be placed at the road center and edge.
Cross-slope easier to maintain.
Center-line
Drain
2-3% 2-3%
2-3%
Camber
(crown)
example
Cross-slope
example
DrainDrain
DrainDrain

www.mineravia.com
Geometric Design
Safety berms;
A 'crest' or road-edge berm will not effectively stop trucks (especially high speed laden or unladen trucks) from leaving the road.
At best, they will provide limited deflection and warning to the driver that the truck path needs correcting.

www.mineravia.com
Geometric Design
The slope of the sides of the safety berm should be as steep as possible (1.5V:1H ideally), but ensure stability and maintenance of height.
For large haul trucks, the berm height should be at least 50%- 66% of the truck wheel diameter.
Steep berm side aids deflection. Flatter berms allow the truck to ‘climb’ and overturn.
Outslope
Bench face
Height
Conventional berm
Median berm
Section A-A
Section on A-A
Downgrade unladen
Median berm Conventional berm
Outslope

www.mineravia.com
Geometric Design
Also included in the geometric design is drainage;
No matter how good the design, water will always damage a mine road. Keep water OFF the roads – or at the very least lead water off the road as soon as possible.
Investigate geometry AND drainage patterns.

www.mineravia.com
Integrated Haul Road Design BASIC HAUL ROAD
DESIGN DATA
STRUCTURAL DESIGN
GUIDELINES
GEOMETRIC DESIGN
GUIDELINES
FUNCTIONAL DESIGN
GUIDELINES
MAINTENANCE
MANAGEMENT
GUIDELINES MO
DIF
Y W
EA
RIN
G
CO
UR
SE
MA
TE
RIA
L
CH
EM
ICA
L
PA
LL
IAT
ION
OR
WA
TE
R-B
AS
ED
SP
RA
YIN
G
IS PERFORMANCE
OPTIMUM
AND
DELIVERING MINIMUM TOTAL
ROAD-USER COSTS?
MOST COST EFFICIENT SOLUTION TO HAUL ROAD DESIGN AND OPERATION

www.mineravia.com
Structural Design
Structural design refers to the load carrying capacity of the road;
Better pavement response to applied loads,
Reduced deflection on surface,
Eliminate deformation in sub-grade or in-situ.

www.mineravia.com
Structural Design
Two approaches;
Mechanistic design approach using pavement layer limiting vertical strain criteria &
CBR cover-curve approach using pavement layer CBR values.

www.mineravia.com
Structural Design - Mechanistic
Mechanistic design approach using pavement layer limiting vertical strain criteria;
Limiting strain criteria tailored to traffic volumes, type and life of mine road (ramp, pit or main haul).

www.mineravia.com
Structural Design - Mechanistic
Wearing course
Selected blasted
waste rock
(structural) layer
In-situ
The strains resulting from
the truck wheel loads
decrease with depth –
except where these strain
fields overlap. Here, higher
strains are found – and if
more than 2000 microstrains
– the in-situ material is liable
to ‘collapse’ leading to
structural failure.

www.mineravia.com
Structural Design - Mechanistic
Haul Road Category
Maximum permissible vertical strains can also be
determined from (kt/day x performance index).
Where performance index is defined as;
1 Adequate but fairly maintenance intensive,
2 Good with normal maintenance interventions,
3 Outstanding with low maintenance requirements .
Category I
Permanent life-of-mine high volume main hauling roads and ramps in- and ex-pit. Operating life >20 years
Category II
Semi-permanent high volume ramp roads in-pit. Operating life >10 years
Category III
Semi-permanent medium- to low-volume in-pit bench access, ex-pit dump, or ramp roads. Operating life <5 years (>50kt/day) or <10 years (<50kt/day)
Limiting pavement layer vertical compressive strain
values for mine haul road structural design
100
1000
10000
0 40 80 120 160 200 240 280 320
Traffic volume (kt/day) x performance index
Lim
itin
g m
icro
str
ain
s
Category III Haul Road
Category II Haul Road
Category I Haul Road
Limiting pavement layer vertical compressive strain
values for mine haul road structural design
100
1000
10000
0 40 80 120 160 200 240 280 320
Traffic volume (kt/day) x performance index
Lim
itin
g m
icro
str
ain
s
Limiting pavement layer vertical compressive strain
values for mine haul road structural design
100
1000
10000
0 40 80 120 160 200 240 280 320
Traffic volume (kt/day) x performance index
Lim
itin
g m
icro
str
ain
s
Category III Haul Road
Category II Haul Road
Category I Haul Road
Limiting pavement layer vertical compressive strain
values for mine haul road structural design
100
1000
10000
0 40 80 120 160 200 240 280 320
Traffic volume (kt/day) x performance index
Lim
itin
g m
icro
str
ain
s
Category III Haul Road
Category II Haul Road
Category I Haul Road
Limiting pavement layer vertical compressive strain
values for mine haul road structural design
100
1000
10000
0 40 80 120 160 200 240 280 320
Traffic volume (kt/day) x performance index
Lim
itin
g m
icro
str
ain
s
Limiting pavement layer vertical compressive strain
values for mine haul road structural design
100
1000
10000
0 40 80 120 160 200 240 280 320
Traffic volume (kt/day) x performance index
Lim
itin
g m
icro
str
ain
s
Category III Haul Road
Category II Haul Road
Category I Haul Road

www.mineravia.com
Structural Design - Mechanistic
When a base layer of selected blasted waste rock is used in the structure, a mechanistic approach is more appropriate.
The selected waste rock layer is located under the wearing course,
Road performance is significantly improved, primarily due to the load carrying capacity of the waste rock layer.

www.mineravia.com
Practical Application Mechanistic
Design chart (examples) are based on a fully laden haul truck, at maximum GVM, (tons) with standard radial tyres, inflated to 800kPa.
The road design incorporates 200mm of sheeting with CBR=80%, a selected blasted waste rock base layer, built on 3m of in-situ material with the indicated E-modulus shown on the charts.
0
200
400
600
800
1000
1200
1400
10 100 1000
Th
ickn
ess (m
m)
E Modulus (MPa)
CAT789C Base Layer Thickness Design800kPa tyre pressure, fully laden truck at OEM GVM
For limiting strains of 2000με
Category I Category II Category III
Wearing course 200mm
E = 350MPa
Base layer thickness
E = 3000MPa
In-situThickness 3000mm
Eeff Modulus of In-situ material (MPa)

www.mineravia.com
Structural Design CBR Cover Curve
CBR cover-curve design approach uses pavement layer CBR values;
Thickness of successive layers based on CBR (strength) of underlying layer and truck wheel load (tonnes).
65 55 40 25 150.0
500.0
1000.0
1500.0
2000.0
2500.0
3000.0
3500.0
4000.0
4500.0
1 10 100
Cover Thickness (mm)
California Bearing Ratio CBR (%)
. 1 2 3 4 6 8 . 10 , 20 40 60 80 100
10 14 21 28 35 41 55 69 104 138 207 276 345 414
. .
Subgrade soil category
Unified Soil Classification
CBR (%)
Modulus (Eeff)(MPa) .
AASHTO Soil Classification
A-1-b A-1-a
A-2-7 A-2-6 A-2-5 A-2-4
A-3
A-5
A-4
A-6
CH
MH
CL
SW
SP
SW-SC
SM
GW
GP
GW-GC
GP-GM
GC
ML
SW-SM
SP-SC
SP-SM
SC
GW-GC
GP-GC
GM
ExcellentPoor Medium Good
A-7-6 A-7-5
Truck Truck wheel GVM (t) load (t)90 15
150 25
240 40
320 55
390 65450 75510 85570 95630 105

www.mineravia.com
In-situ CBR 7%
Sub-base CBR 30%
Base CBR 55%
Wearing course CBR 80%
Compacted In-situ CBR 13%

www.mineravia.com
Integrated Road Haul Design BASIC HAUL ROAD
DESIGN DATA
STRUCTURAL DESIGN
GUIDELINES
GEOMETRIC DESIGN
GUIDELINES
FUNCTIONAL DESIGN
GUIDELINES
MAINTENANCE
MANAGEMENT
GUIDELINES MO
DIF
Y W
EA
RIN
G
CO
UR
SE
MA
TE
RIA
L
CH
EM
ICA
L
PA
LL
IAT
ION
OR
WA
TE
R-B
AS
ED
SP
RA
YIN
G
IS PERFORMANCE
OPTIMUM
AND
DELIVERING MINIMUM TOTAL
ROAD-USER COSTS?
MOST COST EFFICIENT SOLUTION TO HAUL ROAD DESIGN AND OPERATION

www.mineravia.com
Functional Design
Wearing course material selection. Design for;
Reduced rolling resistance – through reduced wearing course ‘defects’,
Reduced deterioration rates and maintenance frequency.

www.mineravia.com
Here, the stones in the mix – or ‘aggregate’ is too big – this can’t easily be graded and if it is, the large stones will come loose creating potholes and cutting truck tyres.
In this case – the wearing course has too much fine material and it forms a slippery soft layer on the road.

www.mineravia.com
Functional Design
This is probably a good mix of crushed rock to use, everything smaller than 40mm in size and not too much fine material (<20% smaller than 2mm).
Watch out for smooth round alluvial aggregate in the mix.
This will not easily interlock and will ravel out of the wearing course.

www.mineravia.com
Functional Design
A small jaw crusher can be used to prepare blasted rock as a wearing course aggregate, often in a mix of one or more other materials to form the final product.
It is also useful for creating a fine aggregate from waste rock to be placed as a dressing in loading areas – to reduce tyre damage in these areas.

www.mineravia.com
Functional Design
Correct wearing course material selection will;
Reduce road rolling resistance – through reduced wearing course ‘defects’ &
Reduce road deterioration rates and maintenance frequency.
Wearing Course Selection
0
50
100
150
200
250
300
350
400
0 5 10 15 20 25 30 35 40 45 50
Grading Coefficient
Sh
rin
kag
e P
rod
uct
.
Recommended (1) Recommended (2)
Dustiness Slippery when wet
Loose material
Loose stones
Tyre damage Corrugates

www.mineravia.com
Functional Design Wearing Course Selection
0
50
100
150
200
250
300
350
400
0 5 10 15 20 25 30 35 40 45 50
Grading Coefficient
Sh
rin
kag
e P
rod
uct
.
Recommended (1) Recommended (2)
Dustiness Slippery when wet
Loose material
Loose stones
Tyre damage Corrugates

www.mineravia.com
Practical Application
0
50
100
150
200
250
300
350
400
450
500
550
0 10 20 30 40 50
Grading coefficient
Sh
rin
ka
ge
pro
du
ct
.
Dustiness
Wet skid resistance
Loose
stoniness
Corrugations
Loose material
Dry skid resistance
1
2

www.mineravia.com
Practical Application
0
50
100
150
200
250
300
350
400
450
500
550
0 10 20 30 40 50
Grading coefficient
Sh
rin
ka
ge
pro
du
ct
.
Dustiness
Loose
stoniness
Dry skid
resistance
1

www.mineravia.com
Dust Palliatives
Dust is caused through loss of fines, so consider specifically;
Wearing course material selection;
Size distribution, clay content,
Restraint of fines,
Traffic volumes,
Climatic conditions.

www.mineravia.com
Dust Palliatives
All suppression systems aim to minimise erosivity of the wearing course. Options include;
Improved wearing course material,
Regular watering,
Use of chemical suppressants.

www.mineravia.com
Dust Palliatives
Chemical palliatives available include;
Water/wetting agents, Hygroscopic salts,
Lignosulphonates,
Modified waxes,
Polymers,
Tar/bitumen products,
Sulphonated oils,
Enzymes.

www.mineravia.com
Dust Palliatives
Use of chemical dust suppressants;
Should be considered only as an adjunct to other methods,
Chemical dust suppressants have a limited life and will require regular applications,
Various generic types to choose from, based mainly on climatic conditions and wearing surface material.

www.mineravia.com
Dust Palliatives
Trial a chemical dust suppressant first before making a firm commitment,
Careful attention should be given to whole-of-life costing before using a chemical dust suppressant.

www.mineravia.com
Dust Palliatives
The most appropriate selection and management strategy should consider;
Safety and health benefits,
Road management philosophy,
Improved cost-efficiency.
Locality Data
Equipment Data
Water Data
Determine Cost of Establishment
Determine Cost of Water-based
Spraying
Summarise Annual Costs (Application and Road Maintenance)
Method selection
Cost ($/kilo-liter) and application
rates (l/m2)
Road, Climate, Wearing course parameters
Hours per day of dust control required
Productivity and operating costs of road (re)-construction, maintenance and (spraying) equipment
Palliative Data
Cost ($/litre) and application rates
(establishment and rejuvenation)
Determine Cost of Rejuvenation (re-
application) and Interval
Determine Wearing Course
Maintenance Interval and Cost with
Palliative Applied
Determine Wearing Course
Maintenance Interval and Cost with
Water-based Spraying
Set Maximum Dust Defect Allowable

www.mineravia.com
Locality Data
Equipment Data
Water Data
Determine Cost of Establishment
Determine Cost of Water-based
Spraying
Summarise Annual Costs (Application and Road Maintenance)
Method selection
Cost ($/kilo-liter) and application
rates (l/m2)
Road, Climate, Wearing course parameters
Hours per day of dust control required
Productivity and operating costs of road (re)-construction, maintenance and (spraying) equipment
Palliative Data
Cost ($/litre) and application rates
(establishment and rejuvenation)
Determine Cost of Rejuvenation (re-
application) and Interval
Determine Wearing Course
Maintenance Interval and Cost with
Palliative Applied
Determine Wearing Course
Maintenance Interval and Cost with
Water-based Spraying
Set Maximum Dust Defect Allowable
www.mineravia.com
Integrated Haul Road Design BASIC HAUL ROAD
DESIGN DATA
STRUCTURAL DESIGN
GUIDELINES
GEOMETRIC DESIGN
GUIDELINES
FUNCTIONAL DESIGN
GUIDELINES
MAINTENANCE
MANAGEMENT
GUIDELINES MO
DIF
Y W
EA
RIN
G
CO
UR
SE
MA
TE
RIA
L
CH
EM
ICA
L
PA
LL
IAT
ION
OR
WA
TE
R-B
AS
ED
SP
RA
YIN
G
IS PERFORMANCE
OPTIMUM
AND
DELIVERING MINIMUM TOTAL
ROAD-USER COSTS?
MOST COST EFFICIENT SOLUTION TO HAUL ROAD DESIGN AND OPERATION

www.mineravia.com
Maintenance Management
Maintenance design and management;
Routine road maintenance as a result of progressive wearing course deterioration.
A satisfactory road design will require minimum maintenance.
Too frequent maintenance? Review design data to find root of problem.

www.mineravia.com
Maintenance Management
Maintenance frequency
Rolling resistance
Max
Min
Minimum total
cost solution
LOW VOLUME
SURFACE
ROADS
Max
Min
Costs
Maintenance frequency
Rolling resistance
Max
Min
Minimum
total
cost solution
- RAMPS
Max
Min
Costs
Maintenance frequency
Rolling resistance
Max
Min
Minimum total
cost solution
Max
Min
Costs

www.mineravia.com
Maintenance Management Percentage increase in total road-user costs with
maintenance interval
0
5
10
15
20
25
30
35
40
0 1 2 3 4 5 6 7 8 9 10
Days between maintenance
Perc
en
t ch
an
ge
B02 B03 B04
B05 S Ramp

www.mineravia.com
Practical Applications
Why is the segment maintenance intensive?
Poor design and/or build specs;
Geometrics,
Structure (layer works and materials),
Functional (wearing course – surfacing materials).

www.mineravia.com
Benchmarking Rolling Resistance
Road performance evaluation,
Use the same idea, but for the first 5 defects only to determine RR%.

www.mineravia.com
Defect extent % road area
effected
Extent
score
Not seen or isolated only <5 1
Intermittent 6-15 2
Regular 16-30 3
Frequent 31-60 4
Extensive >60 5

www.mineravia.com

www.mineravia.com
Practical Application
Defect Degree
(1-5)
Extent
(1-5)
Degree
x
Extent
Potholes 5 1 5
Corrugations 3 3 9
Rutting 3 5 15
Loose material 5 2 10
Stones - fixed 5 2 10
Total score 49

www.mineravia.com
Practical Application
49
3,25%

www.mineravia.com
Percentage increase in total road-user costs with
maintenance interval
0
5
10
15
20
25
30
35
40
0 1 2 3 4 5 6 7 8 9 10
Days between maintenance
Perc
en
t ch
an
ge
B02 B03 B04
B05 S Ramp

www.mineravia.com
Top Related