


Languages
Pages
Legal

Midwest Connect: Hyperloop One Global Challenge Proposal
October 28, 2016
Introduction .................................................................................................. 05
About the Corridor ....................................................................................... 06
Strategic Transformation Potential .......................................................... 10
Passenger and Cargo Flows ...................................................................... 14
Government and Policy .............................................................................. 19
Acceleration Plan ........................................................................................ 24
Appendices ................................................................................................... 26
TABLE OF CONTENTS
Submitted by:
William Murdock, AICP
Executive Director [email protected]
T: (614) 233-4102
111 Liberty Street, Suite 100
Columbus, Ohio 43215 USA
Staff Contributors:
Thea Walsh, Director, Transportation Systems and Funding
Nick Gill, Assistant Director
Zhuojun Jiang, Senior Engineer
Dina López, Principal Planner, Freight
Nathaniel Kaelin, Competitive Advantage Program Manager
Mike Borger, Associate Planner
www.morpc.org
TT
October 28, 2016
Dear Hyperloop One Team,
The Mid-Ohio Regional Planning Commission (MORPC) is pleased to submit this
proposal for the Midwest Connect corridor to the Hyperloop Global Challenge. The
prospect of high-speed, cost-effective intercity freight and passenger service is
exciting, and we believe the Midwest—especially its boom cities of Chicago and
Columbus—are a perfect place to start a U.S. national Hyperloop network.
The proposed Midwest Connect corridor will connect four states and three major
cities of the Midwest, the epicenter of the U.S. transportation network. One end is
anchored by Chicago, the third largest metropolitan area in the U.S. and the
single largest rail hub in the country. The route continues through Indiana, known
as the ‘Crossroads of America’ because it sees the highest number of highway
pass-thrus nationally. Up next is Ohio, dubbed as the ‘Heart of It All’ because of
its central location and 500 mile proximity to more than half of the U.S.
population. Ohio’s route centers on Columbus, the recently-designated ‘Smart
City’ for transportation and a region expected to gain up to a million residents in
the next 30 years. Pittsburgh, the emerging Silicon Valley of the East because of
its growing technology scene and educational assets, anchors the other end.
Despite the prominence of these cities, there are no direct highway or passenger
rail connections across the corridor. Driving from Chicago to Pittsburgh requires a
detour through Greater Indianapolis or Cleveland. Hopping a train from Pittsburgh
back to Chicago requires a connection and a layover. Freight rail between
Pittsburgh and Columbus was abandoned long ago, leaving only trucks as a direct
transport mode. A Hyperloop connection would not be creating a redundant
surface connection, it would be forging a new connection.
Significant freight and passenger travel occurs within the catchment area of the
proposed corridor. Using only the three anchor cities as origin and destination
points, passenger flows exceeded 1.5 million in 2015. In the same year, more
than $16.7 billion in freight was transported.
We thank Hyperloop One for the opportunity to submit this proposal and look
forward to further developing this proposal with additional public and private
partners across the Midwest. Please feel free to contact me directly at
614.233.4102 or [email protected] if you have any questions.
Kind Regards,
William Murdock, AICP
Executive Director
Mid-Ohio Regional Planning Commission
Midwest Connect – Hyperloop One
Global Challenge Proposal
INTRODUCTION
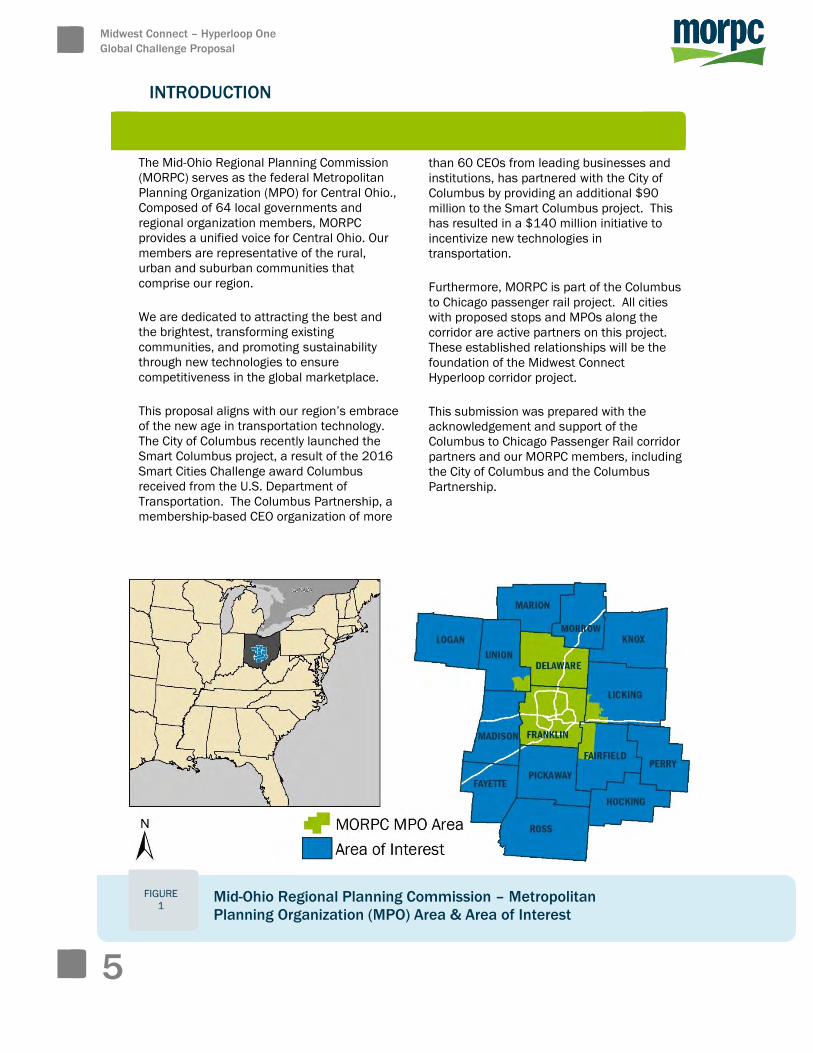
The Mid-Ohio Regional Planning Commission
(MORPC) serves as the federal Metropolitan
Planning Organization (MPO) for Central Ohio.,
Composed of 64 local governments and
regional organization members, MORPC
provides a unified voice for Central Ohio. Our
members are representative of the rural,
urban and suburban communities that
comprise our region.
We are dedicated to attracting the best and
the brightest, transforming existing
communities, and promoting sustainability
through new technologies to ensure
competitiveness in the global marketplace.
This proposal aligns with our region’s embrace
of the new age in transportation technology.
The City of Columbus recently launched the
Smart Columbus project, a result of the 2016
Smart Cities Challenge award Columbus
received from the U.S. Department of
Transportation. The Columbus Partnership, a
membership-based CEO organization of more
than 60 CEOs from leading businesses and
institutions, has partnered with the City of
Columbus by providing an additional $90
million to the Smart Columbus project. This
has resulted in a $140 million initiative to
incentivize new technologies in
transportation.
Furthermore, MORPC is part of the Columbus
to Chicago passenger rail project. All cities
with proposed stops and MPOs along the
corridor are active partners on this project.
These established relationships will be the
foundation of the Midwest Connect
Hyperloop corridor project.
This submission was prepared with the
acknowledgement and support of the
Columbus to Chicago Passenger Rail corridor
partners and our MORPC members, including
the City of Columbus and the Columbus
Partnership.
5
FIGURE
1 Mid-Ohio Regional Planning Commission – Metropolitan
Planning Organization (MPO) Area & Area of Interest
ABOUT THE CORRIDOR
Overview
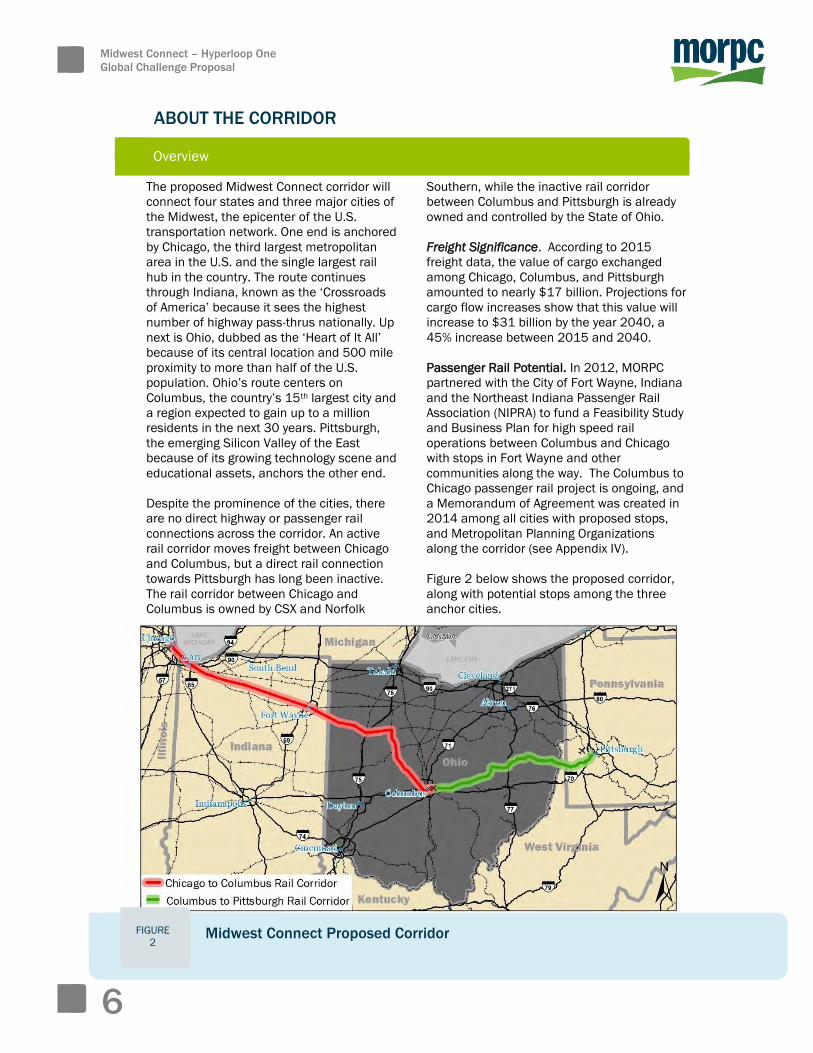
The proposed Midwest Connect corridor will
connect four states and three major cities of
the Midwest, the epicenter of the U.S.
transportation network. One end is anchored
by Chicago, the third largest metropolitan
area in the U.S. and the single largest rail
hub in the country. The route continues
through Indiana, known as the ‘Crossroads
of America’ because it sees the highest
number of highway pass-thrus nationally. Up
next is Ohio, dubbed as the ‘Heart of It All’
because of its central location and 500 mile
proximity to more than half of the U.S.
population. Ohio’s route centers on
Columbus, the country’s 15th largest city and
a region expected to gain up to a million
residents in the next 30 years. Pittsburgh,
the emerging Silicon Valley of the East
because of its growing technology scene and
educational assets, anchors the other end.
Despite the prominence of the cities, there
are no direct highway or passenger rail
connections across the corridor. An active
rail corridor moves freight between Chicago
and Columbus, but a direct rail connection
towards Pittsburgh has long been inactive.
The rail corridor between Chicago and
Columbus is owned by CSX and Norfolk
Southern, while the inactive rail corridor
between Columbus and Pittsburgh is already
owned and controlled by the State of Ohio.
Freight Significance. According to 2015
freight data, the value of cargo exchanged
among Chicago, Columbus, and Pittsburgh
amounted to nearly $17 billion. Projections for
cargo flow increases show that this value will
increase to $31 billion by the year 2040, a
45% increase between 2015 and 2040.
Passenger Rail Potential. In 2012, MORPC
partnered with the City of Fort Wayne, Indiana
and the Northeast Indiana Passenger Rail
Association (NIPRA) to fund a Feasibility Study
and Business Plan for high speed rail
operations between Columbus and Chicago
with stops in Fort Wayne and other
communities along the way. The Columbus to
Chicago passenger rail project is ongoing, and
a Memorandum of Agreement was created in
2014 among all cities with proposed stops,
and Metropolitan Planning Organizations
along the corridor (see Appendix IV).
Figure 2 below shows the proposed corridor,
along with potential stops among the three
anchor cities.
Midwest Connect – Hyperloop One
Global Challenge Proposal
6
FIGURE
2 Midwest Connect Proposed Corridor
Major Traffic Generators
Population centers: The proposed corridor
would serve the Chicago, Columbus and
Pittsburgh areas, as well as communities
where there is potential for stops/stations:
Gary, Valparaiso, Plymouth, Warsaw, and
Fort Wayne in Indiana; Lima, Kenton,
Marysville, and Newark in Ohio. This
proposal focuses on the three anchor cities
of Chicago, Columbus and Pittsburgh. The
potential stations listed above will be further
examined as the project develops, along
with other possible stations as deemed
viable by the project team.
Transportation Hubs: The corridor connects
two international airports in Chicago (O’Hare
and Chicago Midway), two international
airports in Columbus (Rickenbacker Cargo
Airport and John Glenn), and two airports in
Pittsburgh (Pittsburgh International and
Northeast Pittsburgh Airport).
The corridor is also home to a host of
intermodal freight rail terminals and depots.
In addition to Pittsburgh and Chicago’s
many freight intermodal yards, Central Ohio
is home to four rail intermodal yards,
including Marysville Honda, CSX Buckeye
yard, Norfolk Southern’ s Rickenbacker
intermodal yard, and the Marion Intermodal.
While Central Ohio does not currently have
passenger rail service, Chicago is a major
Amtrak hub, connecting eight corridors that
span the nation. Pittsburgh is also a
passenger rail hub albeit a smaller one, and
connects corridors to the west with Amtrak’s
Northeast passenger rail corridor.
Businesses: Chicago is a major business
headquarters location with 32 Fortune 500
Companies including Boeing, Walgreens,
United Airlines, Allstate Insurance, Sears
Holdings, McDonald’s Corporation, Exelon,
Motorola, Discover Financial Services, U.S.
Foods, Navistar International, Abbot
Laboratories, and Jones Lang LaSalle. In
addition to the many prominent companies
headquartered in Chicago, major businesses
along the Indiana corridor portion include
NiSource Inc., Parkview Health Systems, Steel
Dynamics, Zimmer Biomet, Lutheran Health
Network, General Motors, BFGoodrich, BAE
Systems Platform Solutions, and Frontier
Communications.
Businesses served by the corridor in Ohio
include Marathon Petroleum, Honda of
America, Scotts Miracle-Gro, Veyance
Technologies, Nestle PTC, Parker Hannifin,
Nationwide Insurance and many others with
a global focus, such as Ford Motor Company,
L Brands, Amazon, Procter & Gamble, Dana,
General Dynamics, Husky Energy, Ashland
Chemicals, PCS Nitrogen, Innovene, Linde,
American Trim, and Metokote.
Major businesses in the Pittsburgh area
include Alcoa, Allegheny Technologies,
American Eagle Outfitters, Bayer,
Kraft Heinz, Calgon Carbon Corporation, PPG
Industries, U.S. Airways and the U.S. Steel
Corporation, to name a few.
Professional Services: Professional services
within the corridor communities include
hospital and medical services, legal and
accounting, architects and designers, and
financial advisors. These point-of-service
type industries rely on the strong economic
base of the rest of the region.
Colleges and Universities: The corridor
serves a total of 181 higher education
institutions that are located within 25 miles
of the potential stops as shown in Figure 2.
This includes Ohio State University, the
second largest college campus in the U.S., as
well as the numerous private and public
colleges located in Chicago and Pittsburgh.
Sporting Events: Pittsburgh is home to six
professional sports teams, Columbus has
two professional teams, and Chicago has
seven professional teams that attract regular
attendance. Additionally, college teams
attract major attendance. The Ohio State
Buckeyes can attract 100,000 people to
Columbus on game days, drawing from
alumni all across the Midwest.
Appendix II provides more details on major
traffic generators along the corridor.
Midwest Connect – Hyperloop One
Global Challenge Proposal
7
Corridor Right-of-Way, Distances and Nodal Point Connections
As mentioned previously, the Midwest
Connect Hyperloop corridor follows the same
right-of-way as the existing rail corridor (see
Figure 2).
As the project develops, new right-of-way
options may need to be examined in corridor
segments where the existing rail alignment is
not conducive for Hyperloop movements. For
example, a sharp turn exists in the rail line
north of the City of Kenton.
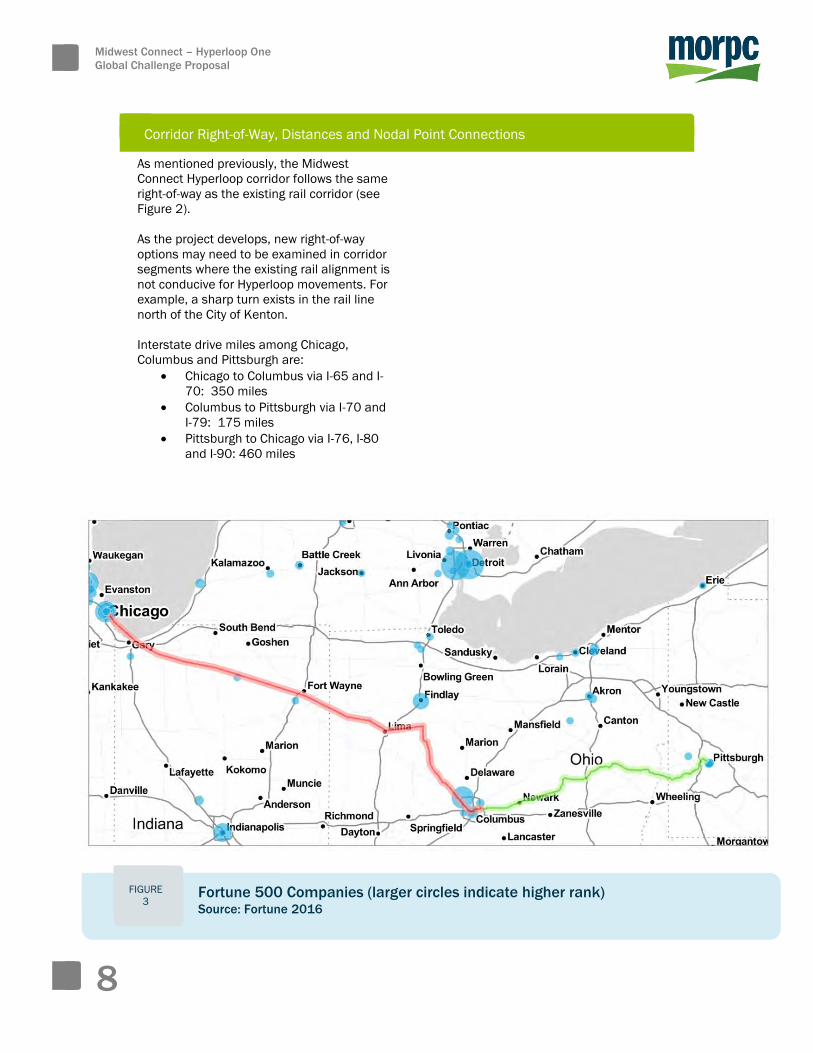
Interstate drive miles among Chicago,
Columbus and Pittsburgh are:
Chicago to Columbus via I-65 and I-
70: 350 miles
Columbus to Pittsburgh via I-70 and
I-79: 175 miles
Pittsburgh to Chicago via I-76, I-80
and I-90: 460 miles
Midwest Connect – Hyperloop One
Global Challenge Proposal
8
FIGURE
3 Fortune 500 Companies (larger circles indicate higher rank) Source: Fortune 2016
Midwest Connect – Hyperloop One
Global Challenge Proposal
9
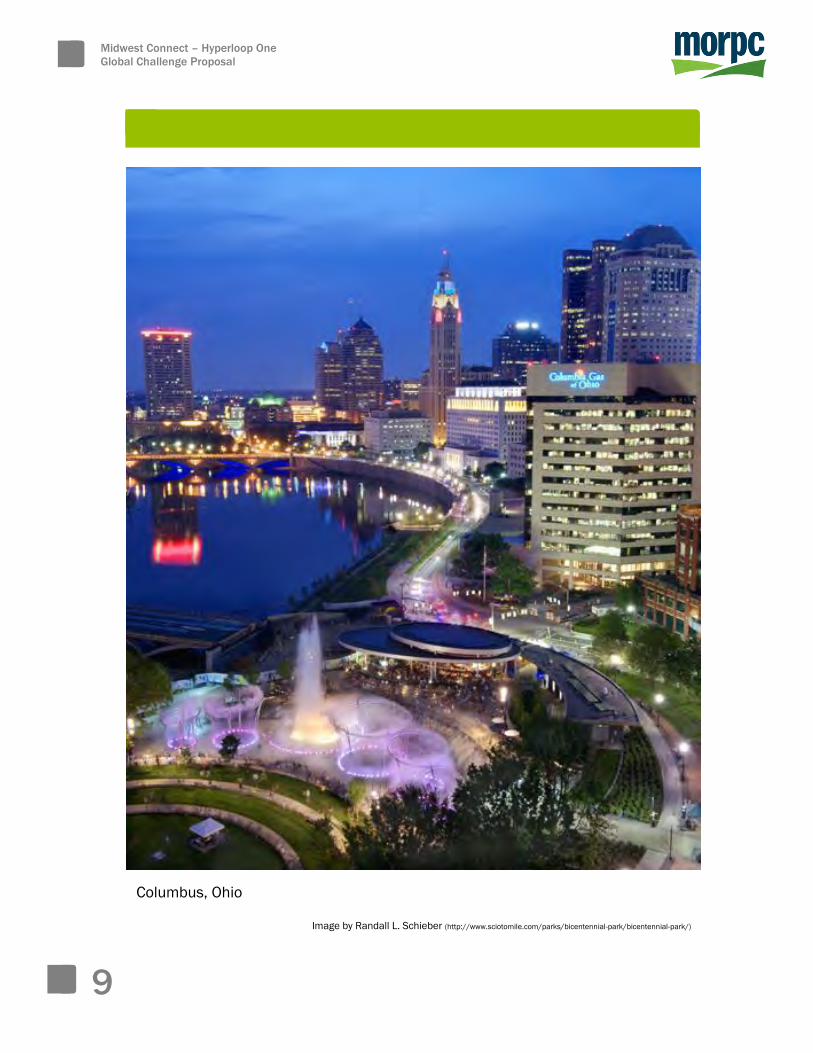
Columbus, Ohio
Image by Randall L. Schieber (http://www.sciotomile.com/parks/bicentennial-park/bicentennial-park/)
STRATEGIC TRANSFORMATION POTENTIAL
What Happens When…
...Hyperloop service enables travel hours to
become travel minutes? The travel speeds
achievable through Hyperloop will dramatically
change the way regional economies interact in
a similar way as the railroad, the automobile,
and the airplane revolutionized how people
and goods travel across regions.
Today, traveling among Chicago, Columbus and
Pittsburgh involves either a day’s drive, or up to
half a day in the air. Hyperloop will allow for
faster, more frequent freight movements and
critical cargo shipments traditionally moved by
plane (such as seafood, flowers, and sensitive
equipment) will be transferred at greater
speeds.
People will be able to take more frequent trips
among communities along the corridor.
Imagine family members living several hours
away from one another being able to see each
other weekly because the multi-hour trip has
been reduced to minutes. Imagine a college
student able to join her family for the holidays
when she could not previously leave her
studies long enough to make the commute.
Imagine good friends, separated by an
employment decision, reunited regularly
because their new home cities invested in
Hyperloop. Travel connects us to the people
and places that matter to us, and reducing the
time of travel will bring societal benefits one
cannot measure in a ledger book.
…Hyperloop makes trips to remote cities
shorter than trips to the suburbs by traditional
modes? One of the biggest challenges facing
American communities is retaining and
attracting job-generating businesses that
employ a skilled labor force. Hyperloop will
allow communities like Lima, Kenton, and
Marysville in Ohio and Fort Wayne, Warsaw,
and Plymouth in Indiana to have more access
to jobs outside these small cities. Commuting
between Lima and Columbus for work will be a
possibility, and businesses will be able to
access a larger area to expand their business
while also drawing from a larger number of
potential employees.
Small cities along the corridor will also have
better access to medical care. Residents of
cities like Kenton and Lima have to travel to
bigger metropolitan areas to receive
specialized health care. The transport of
sensitive, time-critical equipment and medical
supplies will be facilitated by a Hyperloop
corridor, and improve the quality of health
care in remote cities where today,
comprehensive health care access is limited.
…We can capture the value of new
development to contribute to the capital cost
of a Hyperloop network? The potential for
public-private partnerships in the
development of the Midwest Connect
Hyperloop corridor is strong.
In Columbus alone, the partnership among the
region’s major companies and local
governments is best exemplified by the recent
collaboration among the Columbus
Partnership, the City of Columbus, Battelle
Memorial Institute, and MORPC that led to the
successful bid for the Smart Cities Challenge.
The same model of public-private
collaboration will be pursued with developers
along the corridor, and creative tools will be
explored when and where appropriate.
Hyperloop has the potential to create major
new nodes of development. Central Ohio and
many communities across the Midwest have
experience leveraging financing tools to
ensure that revenues from new development
support the supporting infrastructure.
Examples of these financing tools include
direct impact fees, tax increment financing,
payments in lieu of taxes abated, new
community authorities, special assessments,
and special districts like business
improvement districts or energy districts.
MORPC works closely with economic
development agencies and chambers of
commerce, and we understand the
importance of working with economic
developers to create a comprehensive
strategy for the development of the corridor.
As the project unfolds, economic developers,
commercial investors, and business leaders
will be a critical contributing stakeholder.
Midwest Connect – Hyperloop One
Global Challenge Proposal
10
What Happens When… (Continued)
...Prime waterfront land currently covered by
ports is liberated by a Hyperloop container-
shifter link to an inland container distribution
hub? We envision Hyperloop as a mode choice
to complement existing modes. While
traditional transportation modes will not become
fully obsolete, land use changes resulting from
the impacts of a Hyperloop corridor will include
the down-scaling of port-related land uses along
waterfronts.
Chicago is the only city in the corridor with
significant prime waterfront land, and as freight-
related land uses on the waterfront decrease,
redevelopment of the waterfront into more
aesthetic and higher revenue-generating uses
will occur. Existing bottlenecks in the Chicago
rail system will be alleviated, enabling industries
to transport their goods in less time while
providing a mode choice.
The shift from freight land uses on the Chicago
waterfront ports to inland ports could result in
more businesses resettling along inland
communities along the Hyperloop corridor.
Existing inland ports such as the Rickenbacker
Airport in Central Ohio have spent many years
implementing improvements to handle
increasing volumes of freight via rail, air and
truck. With a Hyperloop corridor, this and other
inland ports along the corridor will experience
growth and add capacity as economic
development occurs.
…Just-in-Time deliveries can be made within
minutes along your corridor? How do your
supply chains in the vicinity of the corridor
evolve and benefit from Hyperloop? As foreign
trade agreements, advancements in freight
transportation technologies, and the
globalization of goods and cultural habits have
evolved, we have grown accustomed to having
access to global products that were once only
available at a regional level. Sustaining access
to these commodities is growing increasingly
difficult as the world faces fuel resource and
price uncertainties (not to mention
environmental concerns associated with fossil
fuel consumption). Hyperloop technology will
not only reduce time and costs associated with
the movement of goods, but it will also reduce
impacts current supply chains have on the
Midwest Connect – Hyperloop One
Global Challenge Proposal
11
environment as they transport freight across
the Hyperloop corridor—faster, cheaper,
safer, and cleaner than through traditional
transportation modes.
The evolution of supply chains along the
Midwest Connect Hyperloop corridor will
involve an unprecedented level of access by
way of and additional mode choice,
increased capacity and faster delivery times.
Corridor assets such as the intermodal
facilities in the Rickenbacker area of
Columbus will have increased access to
supply chains in the Northeast region
through Pittsburgh, which when leveraged
by local stakeholders, could lead to more
businesses settling along the corridor.
…Two or more major airports are linked via
Hyperloop, essentially creating a single
multi-runway super-hub and optimizing
capacity? Many communities across the
world have embraced the significance of
multimodal hubs for freight and passenger
movements. A Hyperloop system that
connects commercial airports, regional
transit systems, bikeways, passenger rail
and single occupancy vehicles (such as car
sharing, traditional car rentals, taxis, etc.) is
ideal as transportation trends continue to
show a preference for multiple mode
choices when traveling. Columbus does not
currently have a multimodal hub for
passenger service, providing limited mode
options.
In the same manner, a Hyperloop corridor
will enable the freight industry to have a
mode choice. As the project develops,
opportunities to integrate existing freight
intermodal hubs into the Hyperloop corridor
will be explored. MORPC sees great
potential in connecting Chicago’s O’hare
International Airport with Rickenbacker
International Airport in Columbus. As these
facilities are already major airports for
freight, connecting them would create a sub-
hub for freight and position the Grea Lakes
megaregion as a major logistics hub.
...What happens when Hyperloop connections
build powerhouse economies by creating
supercities?
Connecting the communities from Chicago to
Pittsburgh with Hyperloop speeds will build
prosperity for the Midwest. In fact, this potential
builds on current work by the Federal Highway
Administration (FHWA) that recognizes planning
must occur at the megaregion scale. FHWA has
identified the Great Lakes Megaregion,
anchored by Chicago and extending to the east
to Pittsburgh. They have identified strengths of
the region—including high educational
attainment and abundant water resources—but
identify that a major challenge is congestion
attributed to future freight demand. The
Midwest Connect Hyperloop Corridor has
potential to help alleviate this freight
congestion, as well as connect the Great Lakes
megaregion to the Northeast megaregion
stretching from Central Pennsylvania, through
New York State, and into New England. For more
information, visit: http://www.fhwa.dot.gov/planning/publications/megaregion
s_report/megaregions06.cfm
Numerous corporations, including JPMorgan
Chase, Kraft Heinz, and Abbot Laboratories
already maintain operations that span across
multiple cities along the Midwest Connect
corridor. Providing faster connections between
these cities will allow their business associates
to personally engage more regularly. Similarly,
other businesses may see opportunities to
position specific functions of their operations
across the region, maximizing business costs,
labor pools, and other assets of the diverse
communities along the corridor.
Midwest Connect – Hyperloop One
Global Challenge Proposal
12
Midwest Connect – Hyperloop One
Global Challenge Proposal
13
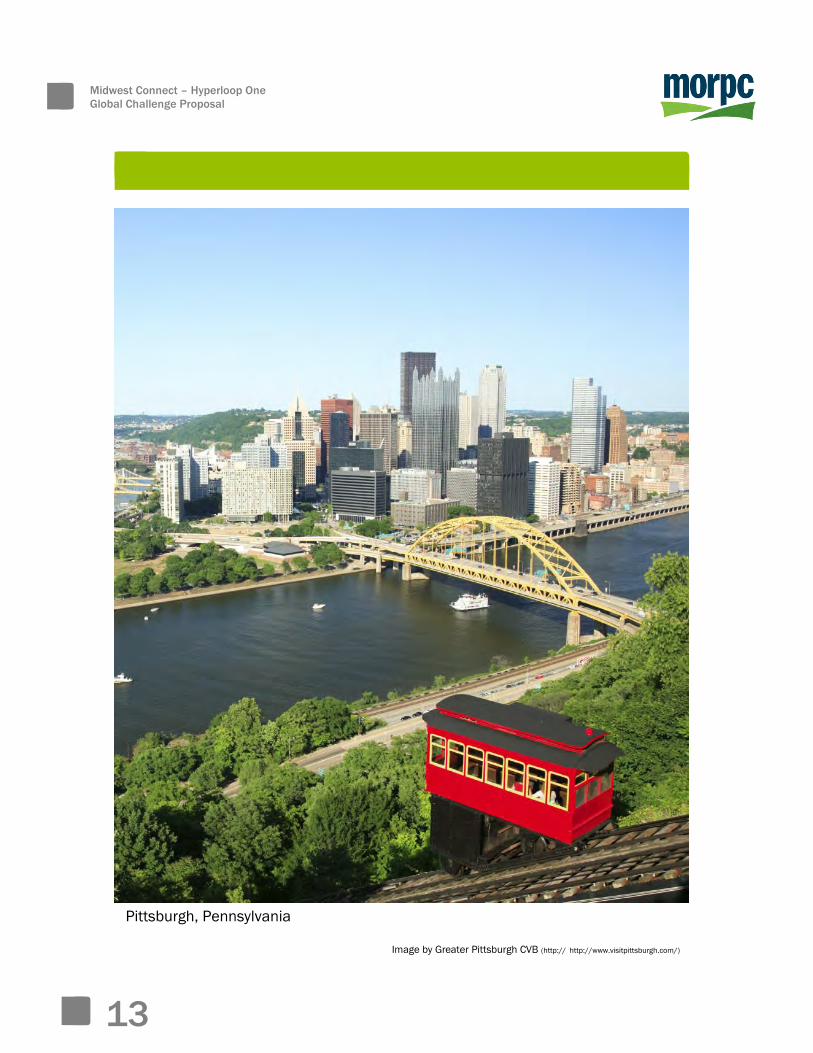
Pittsburgh, Pennsylvania
Image by Greater Pittsburgh CVB (http:// http://www.visitpittsburgh.com/)
Midwest Connect – Hyperloop One
Global Challenge Proposal
14
PASSENGER AND CARGO FLOWS
Passenger Demand
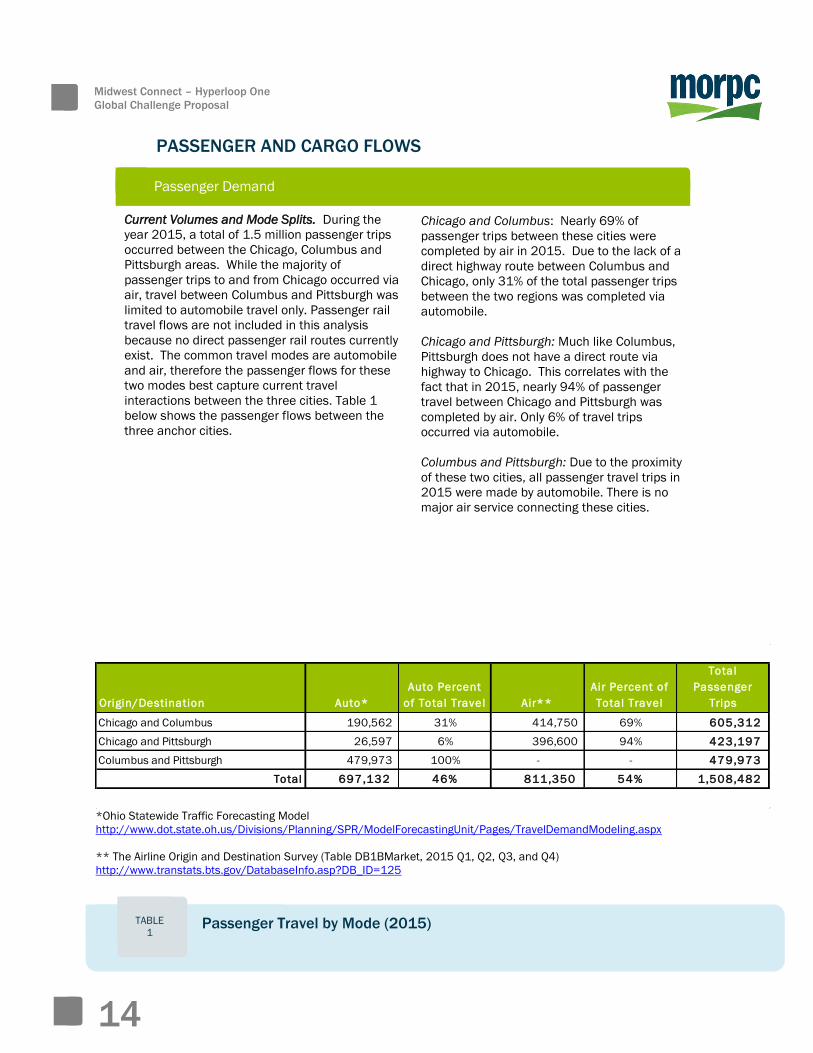
Current Volumes and Mode Splits. During the
year 2015, a total of 1.5 million passenger trips
occurred between the Chicago, Columbus and
Pittsburgh areas. While the majority of
passenger trips to and from Chicago occurred via
air, travel between Columbus and Pittsburgh was
limited to automobile travel only. Passenger rail
travel flows are not included in this analysis
because no direct passenger rail routes currently
exist. The common travel modes are automobile
and air, therefore the passenger flows for these
two modes best capture current travel
interactions between the three cities. Table 1
below shows the passenger flows between the
three anchor cities.
Chicago and Columbus: Nearly 69% of
passenger trips between these cities were
completed by air in 2015. Due to the lack of a
direct highway route between Columbus and
Chicago, only 31% of the total passenger trips
between the two regions was completed via
automobile.
Chicago and Pittsburgh: Much like Columbus,
Pittsburgh does not have a direct route via
highway to Chicago. This correlates with the
fact that in 2015, nearly 94% of passenger
travel between Chicago and Pittsburgh was
completed by air. Only 6% of travel trips
occurred via automobile.
Columbus and Pittsburgh: Due to the proximity
of these two cities, all passenger travel trips in
2015 were made by automobile. There is no
major air service connecting these cities.
*Ohio Statewide Traffic Forecasting Model
http://www.dot.state.oh.us/Divisions/Planning/SPR/ModelForecastingUnit/Pages/TravelDemandModeling.aspx
** The Airline Origin and Destination Survey (Table DB1BMarket, 2015 Q1, Q2, Q3, and Q4)
http://www.transtats.bts.gov/DatabaseInfo.asp?DB_ID=125
Origin/Destination Auto*
Auto Percent
of Total Travel Air**
Air Percent of
Total Travel
Total
Passenger
Trips
Chicago and Columbus 190,562 31% 414,750 69% 605,312
Chicago and Pittsburgh 26,597 6% 396,600 94% 423,197
Columbus and Pittsburgh 479,973 100% - - 479,973
Total 697,132 46% 811,350 54% 1,508,482
TABLE
1 Passenger Travel by Mode (2015)
Midwest Connect – Hyperloop One
Global Challenge Proposal
Passenger Demand (Continued)
Trip Duration. Trip duration by automobile
depends on weather conditions and
construction along the chosen route. On
average, travel between Columbus and
Pittsburgh takes approximately 2.5 hours.
Travel between Columbus and Chicago takes
5.5 hours, and driving between Chicago and
Pittsburgh can take over 7 hours.
Travel by air varies depending on whether it
is a direct flight. Direct flights between
Chicago and Pittsburgh take approximately
1.5 hours, while direct air travel between
Chicago and Columbus takes a little over one
hour. This excludes travel time associated
with flight/baggage check-ins, security
clearance, commuting time to the airport,
parking, etc., which can easily add two to
three hours to trip length.
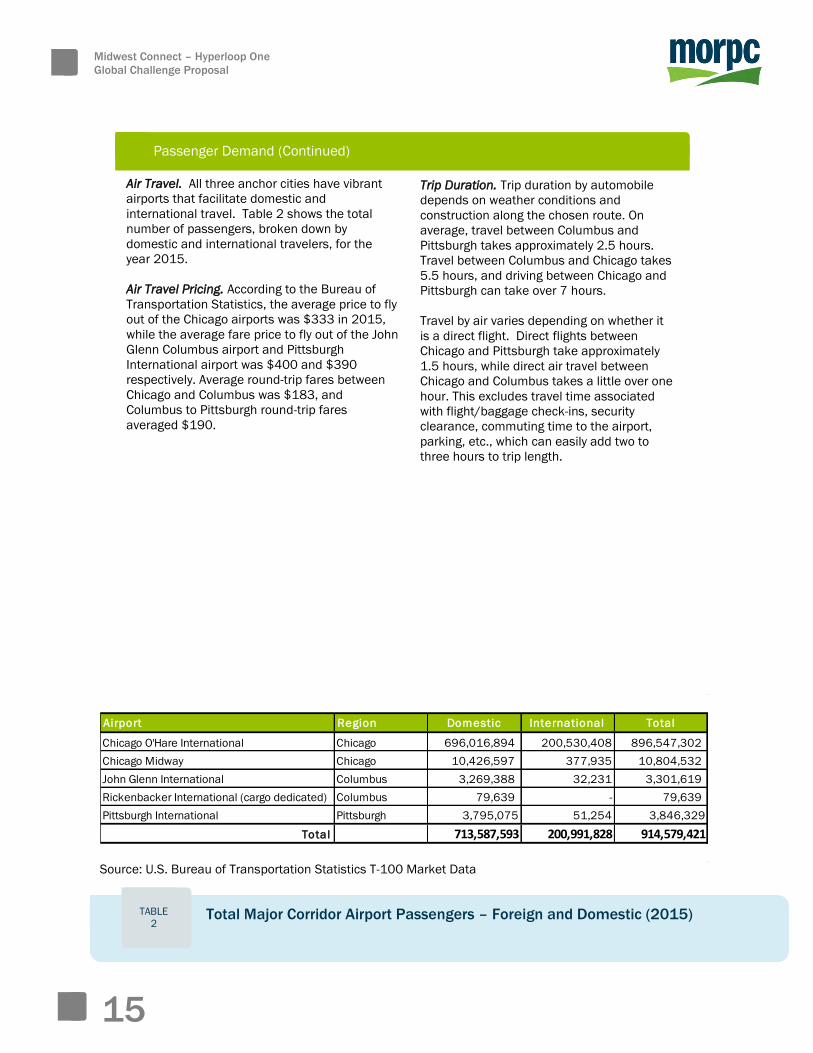
TABLE
2 Total Major Corridor Airport Passengers – Foreign and Domestic (2015)
Source: U.S. Bureau of Transportation Statistics T-100 Market Data
Airport Region Domestic International Total
Chicago O'Hare International Chicago 696,016,894 200,530,408 896,547,302
Chicago Midway Chicago 10,426,597 377,935 10,804,532
John Glenn International Columbus 3,269,388 32,231 3,301,619
Rickenbacker International (cargo dedicated) Columbus 79,639 - 79,639
Pittsburgh International Pittsburgh 3,795,075 51,254 3,846,329
Total 713,587,593 200,991,828 914,579,421
Air Travel. All three anchor cities have vibrant
airports that facilitate domestic and
international travel. Table 2 shows the total
number of passengers, broken down by
domestic and international travelers, for the
year 2015.
Air Travel Pricing. According to the Bureau of
Transportation Statistics, the average price to fly
out of the Chicago airports was $333 in 2015,
while the average fare price to fly out of the John
Glenn Columbus airport and Pittsburgh
International airport was $400 and $390
respectively. Average round-trip fares between
Chicago and Columbus was $183, and
Columbus to Pittsburgh round-trip fares
averaged $190.
15
Midwest Connect – Hyperloop One
Global Challenge Proposal
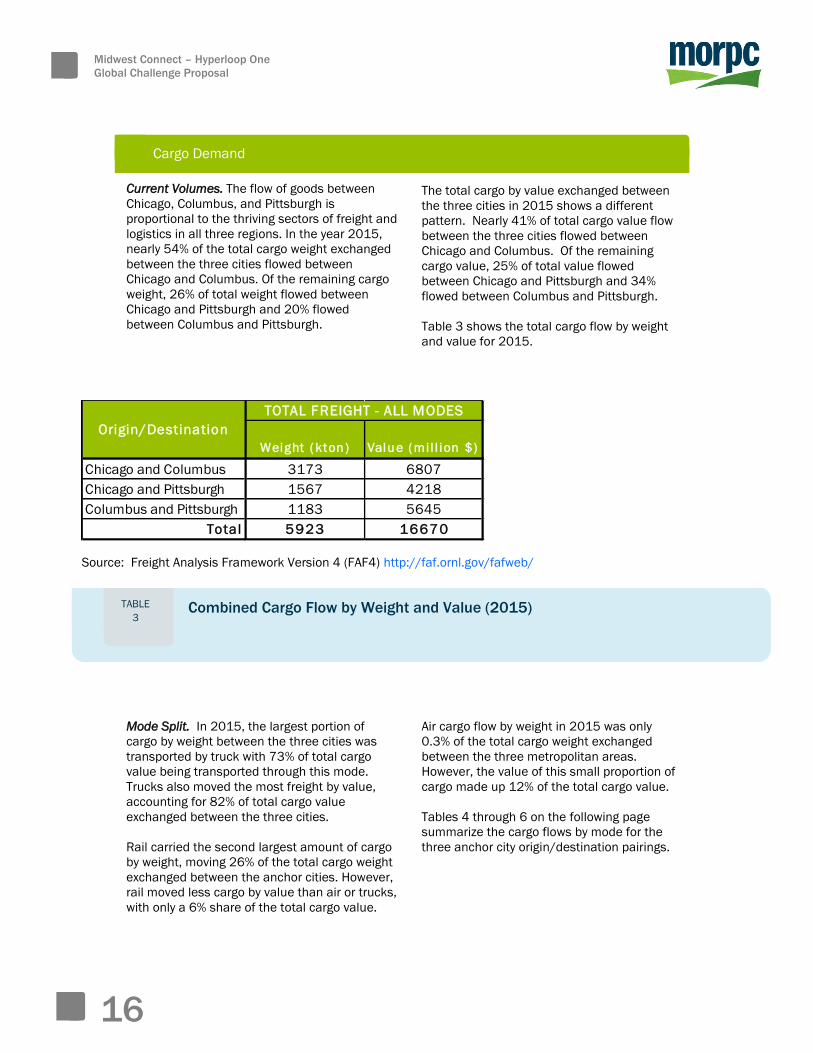
Cargo Demand
The total cargo by value exchanged between
the three cities in 2015 shows a different
pattern. Nearly 41% of total cargo value flow
between the three cities flowed between
Chicago and Columbus. Of the remaining
cargo value, 25% of total value flowed
between Chicago and Pittsburgh and 34%
flowed between Columbus and Pittsburgh.
Table 3 shows the total cargo flow by weight
and value for 2015.
Current Volumes. The flow of goods between
Chicago, Columbus, and Pittsburgh is
proportional to the thriving sectors of freight and
logistics in all three regions. In the year 2015,
nearly 54% of the total cargo weight exchanged
between the three cities flowed between
Chicago and Columbus. Of the remaining cargo
weight, 26% of total weight flowed between
Chicago and Pittsburgh and 20% flowed
between Columbus and Pittsburgh.
Combined Cargo Flow by Weight and Value (2015)
Source: Freight Analysis Framework Version 4 (FAF4) http://faf.ornl.gov/fafweb/
Source: U.S. Bureau of Transportation Statistics T-100 Market Data
Weight (kton ) Value (mi l l ion $)
Chicago and Columbus 3173 6807
Chicago and Pittsburgh 1567 4218
Columbus and Pittsburgh 1183 5645
Total 5923 16670
TOTAL FREIGHT - ALL MODES
Origin/Destination
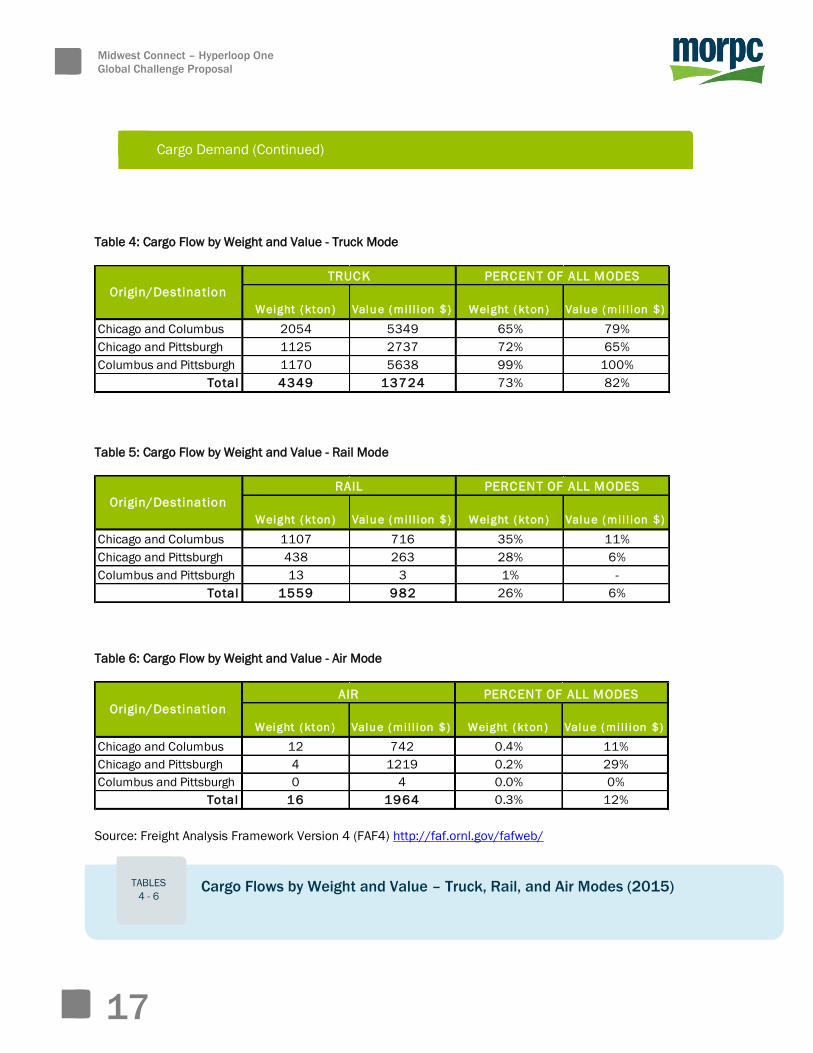
Mode Split. In 2015, the largest portion of
cargo by weight between the three cities was
transported by truck with 73% of total cargo
value being transported through this mode.
Trucks also moved the most freight by value,
accounting for 82% of total cargo value
exchanged between the three cities.
Rail carried the second largest amount of cargo
by weight, moving 26% of the total cargo weight
exchanged between the anchor cities. However,
rail moved less cargo by value than air or trucks,
with only a 6% share of the total cargo value.
Air cargo flow by weight in 2015 was only
0.3% of the total cargo weight exchanged
between the three metropolitan areas.
However, the value of this small proportion of
cargo made up 12% of the total cargo value.
Tables 4 through 6 on the following page
summarize the cargo flows by mode for the
three anchor city origin/destination pairings.
TABLE
3
16
Midwest Connect – Hyperloop One
Global Challenge Proposal
Cargo Demand (Continued)
17
Cargo Flows by Weight and Value – Truck, Rail, and Air Modes (2015)
TABLES
4 - 6
Table 4: Cargo Flow by Weight and Value - Truck Mode
Table 5: Cargo Flow by Weight and Value - Rail Mode
Table 6: Cargo Flow by Weight and Value - Air Mode
Source: Freight Analysis Framework Version 4 (FAF4) http://faf.ornl.gov/fafweb/
Weight (kton ) Value (mi l l ion $) Weight (kton ) Value (mi l l ion $)
Chicago and Columbus 2054 5349 65% 79%
Chicago and Pittsburgh 1125 2737 72% 65%
Columbus and Pittsburgh 1170 5638 99% 100%
Total 4349 13724 73% 82%
Origin/Destination
TRUCK PERCENT OF ALL MODES
Weight (kton ) Value (mi l l ion $) Weight (kton ) Value (mi l l ion $)
Chicago and Columbus 1107 716 35% 11%
Chicago and Pittsburgh 438 263 28% 6%
Columbus and Pittsburgh 13 3 1% -
Total 1559 982 26% 6%
Origin/Destination
PERCENT OF ALL MODESRAIL
Weight ( kton ) Value (mi l l ion $) Weight ( kton ) Value (mi l l ion $)
Chicago and Columbus 12 742 0.4% 11%
Chicago and Pittsburgh 4 1219 0.2% 29%
Columbus and Pittsburgh 0 4 0.0% 0%
Total 16 1964 0.3% 12%
PERCENT OF ALL MODESAIR
Origin/Destination

Midwest Connect – Hyperloop One
Global Challenge Proposal
18
Chicago, Illinois
Image by Destinations for Holidays (https://destinationsforholidays.wordpress.com/tag/chicago-places/)
Midwest Connect – Hyperloop One
Global Challenge Proposal
19
GOVERNMENT & POLICY
How does the state normally invest in
infrastructure projects? The predominant model
of transportation infrastructure investment
employed by government entities across the
corridor involves direct funding of both capital
construction and operation costs. Typically, a
combination of federal, state, and local
government funds comprise infrastructure
spending. Private participation is more common
for projects with a more local transportation
benefit, potentially incentivizing a developer or
business to invest in a transportation
improvement.
However, as government resources have become
increasingly scarce, government agencies have
become more innovative in project delivery.
Public private partnerships have increasingly
been identified and employed to deliver large-
scale improvements and operations, including
bridge replacements, highway construction and
maintenance, and freight improvements.
Examples of innovative financing and project
delivery include: the Indiana Toll Road, the
Portsmouth Bypass, Interstate 55 toll lanes, and
Rickenbacker air cargo terminal and east-west
corridor improvements. For more details on these
examples, please see Appendix I, Item No. 1.
These projects represent only a sampling of the
more innovative partnerships that governments
across the region have employed to advance
transportation projects. All four states, Illinois,
Indiana, Ohio and Pennsylvania, have some form
of enabling legislation permitting public-private
partnership (P3) project structures and each has
experience and success implementing such
partnerships.
Examples of completed infrastructure projects:
The Midwest has completed a number of large-
scale infrastructure projects in recent years,
including the Chicago Rail Improvement Program
(CREATE), U.S. 24 Fort to Port, I-69 Indianapolis to
Evansville, and Cleveland Voinovich Bridge. For
more details on these examples, see Appendix I,
Item No. 2.
What risk mitigations or guarantees does
government offer to the private sector?
The federal government’s Transportation
Infrastructure Finance and Innovation Act
(TIFIA) provides multiple protections through
credit assistance for partners undertaking
large-scale transit-oriented development,
intelligent transportation, and surface
transportation projects. The program offers
secured direct loans with flexible repayment
terms, loan guarantees on the full-faith-and-
credit of the federal government, and standby
lines of credit during the first ten years of
project operations. For more information on
TIFIA, please see Appendix I, Item No. 3.
What transport appraisal model is used by
government and how effective is this model?
There is not a universal model used to
evaluate transportation projects in the U.S.
However, federal and state departments of
transportation do employ evaluation
mechanisms to evaluate projects for inclusion
in short- and long-range planning documents
and specific funding opportunities. For
instance, the Ohio Department of
Transportation determines how funds for
major new projects will be allocated by using
an evaluation through its Transportation
Review Advisory Council (TRAC). Each project
is scored based on factors of transportation,
local investment, economic impact, and
project funding. Once each project is scored the TRAC board finalizes allocations based on
the evaluation results, funding availability,
and support. For more information, visit: http://www.dot.state.oh.us/trac/Pages/TRAC-Application-
Toolkit.aspx
TRAC is representative of formal government
evaluation tools because it contains both
objective and subjective process components.
The subjective components provide flexibility
for decision makers to consider both the
technical evaluation and other factors that
the evaluation may not be able to measure,
such as political or community support or a
unique project benefit. Therefore, if the
Midwest Connect Hyperloop corridor were to
compete for state or federal funding, many of
the funders would have flexibility to consider
the unique impacts of the project, including
the economic revitalization impact on the
major cities along the corridor and the strong
support from the partnership we will build.
Midwest Connect – Hyperloop One
Global Challenge Proposal
20
Government & Policy (Continued)
What Value of Time is typically employed by
government in your region? The United States
Department of Transportation (USDOT) recognizes
that the value of travel time is a critical factor in
evaluating the benefits of transportation
infrastructure investment. To this end, USDOT
maintains and regularly updates guidance for
valuing travel delays and time savings. This
guidance is employed by USDOT when evaluating
federal funding of competitive grant applications
and/or when conducting benefit-cost analysis of
projects. Additionally, the guidance has also been
used as a tool and framework by some state
transportation agencies.
USDOT’s guidance recognizes three major
principles in the value of reducing travel time:
Time saved from travel that could be
dedicated to production and provide a
monetary benefit to travelers/businesses
Time saved that could be spent in
recreation or leisure for which an
individual is willing to pay
Conditions of travel that could be
unpleasant or stressful to the traveler
As mentioned above, beyond formal government
evaluation tools, transportation improvements
within the United States must have political
support to move forward. Generally, travel time is
highly valued among elected officials. When the
State of Ohio was considering rail connections
between Cincinnati, Columbus, and Cleveland—
the state’s three largest cities—one of the major
arguments of political critics was that the average
speed would not be competitive with a private
automobile. The speeds discussed in the
development of Hyperloop would certainly catch
the attention of the public and elected officials
alike, removing a key argument against
alternatives to highways for inter-city
transportation.
What do you consider the top 3 socioeconomic
benefits from Hyperloop? There are numerous
socioeconomic benefits to constructing a
Hyperloop along our proposed corridor, but the
top three include:
Safety: Reducing highway crashes and fatalities
continues to be a priority for our region and the
United States at large. In Ohio alone last year, the
state recorded 302,307 traffic crashes and
1,110 deaths. Public safety officials continue
to address common contributors such as
impaired driving, but they have faced a new
challenge in recent years. Busy commuters
are using their driving time to talk on their cell
phones or send text messages, causing
distracted driving that negatively impacts
driver performance.
Hyperloop provides an opportunity to remove
drivers from our highways and place them on
a mode of transport that eliminates the
possibility of human control errors and
impacts of unpredictable weather. This not
only benefits the passengers using the
Hyperloop, but all highway drivers who will
experience a reduction in crash-generating
traffic. Reducing highway injuries and
fatalities will require multiple approaches, and
the Hyperloop can be a major contributor on
the path to zero traffic-related deaths.
Access to Jobs & Education: Our region was
the epicenter of industrialization in the United
States. The industries of Chicago, Fort Wayne,
Columbus, Pittsburgh, and other Midwestern
cities produced steel, appliances,
automobiles, building materials, and
numerous other products beginning in the
late 1800’s. In recent decades, however,
deindustrialization and globalization have led
to major changes in manufacturing, resulting
in plant closings and job losses that have
helped to give the Midwest its secondary
name—the Rust Belt.
Job loss and economic restructuring have
forced our region to be more creative in terms
of economic development and revitalization.
White collar jobs, within company
headquarters and vendors, are also
concentrated in metropolitan areas.
Therefore, accessing our cities has become a
major priority for our region. Creating easier
and quicker connections between major job
centers and educational facilities are critical
to the continued revitalization of the region.
The ability to make these connections at the
speeds and ease of Hyperloop will be a game
changer in terms of economic growth.
Midwest Connect – Hyperloop One
Global Challenge Proposal
21
Government & Policy (Continued)
Time Savings: The old phrase “time is money” has
never been more relevant. As our cities and
workforce strive to compete in the modern,
globalized, and fast-paced world, every second
counts. Reducing travel times between major
cities not only means improved access to jobs
and education as previously mentioned, but it will
benefit regional businesses by strengthening
connections, contribute to tourism by making
travel quicker and easier in the context of our
already over-scheduled lives, and lead to
economic and physical revitalization of our city
cores through spin-off development at Hyperloop
stations. All of these time saving benefits will
translate to dollars in the pockets of business
owners, employees, and local governments.
The benefits of time savings are not only
monetary, however. Reducing travel times
between cities will also benefit quality of life for
the residents of our region.
Are there any policy measures planned to
stimulate modal-shift towards sustainable modes,
energy efficiency programs, improved congestion
methods, innovation and open data collection?
The Midwest, and specifically Central Ohio, is a
major hotbed for innovation in transportation. The
City of Columbus recently beat out 77 cities
across the U.S. in the Smart City Challenge.
Launched by the United States Department of
Transportation (USDOT), the Smart City Challenge
invited cities across the country to define what it
means to be a “smart city” and become the first
city in the country to fully integrate innovative
technologies such as autonomous cars,
connected vehicles, smart sensors, and electric
vehicles. Beating out finalists including San
Francisco, California and Austin, Texas; Columbus
will receive $50 million in grant funding through
USDOT and Vulcan, Inc. This grant funding was
leveraged by $90 million in locally generated
matching funds, meaning that $140 million in
smart technologies will be researched and
implemented in Central Ohio. This award was
immediately followed up with another $6 million
from USDOT to create a smart corridor on US 33,
which connects urban Columbus with the
industries of Logan, Union and Northwest Franklin
Counties, home of major industry partners such
as Honda of America. For more information on
Smart Columbus see Appendix I, Item No. 4.
How does government in your region support
or incentivize inward investment?
Governments within the region work
aggressively to support and incentivize inward
investment. Each state within the region is
equipped with various tools and organizations
to attract investment and job creation. In
Indiana, the Indiana Economic Development
Corporation recently announced a 10-year, $1
billion initiative to accelerate innovation
across the state through various business
development and research initiatives. In Ohio,
the state has formed JobsOhio, a statewide
non-profit charged with job creation that has
made impressive strides attracting investment
around nine industry sectors ranging from
aerospace to advanced manufacturing to
logistics and distribution. Each state also
offers an array of funding options including
low-interest loans, private activity bond
allocations, credits and abatements on both
state and local taxes, loan guarantees, and
grants for training and development. As the
states of the Midwest have seen the boom
and bust of industry, all have realized that
government must be a partner in economic
development and that often means being an
active participant in financing.
The Midwest has a robust Community
Development Finance Institution (CDFI)
network with all four states boasting a number
with regional or statewide focus (Illinois – 29,
Indiana – 9, Ohio – 20, Pennsylvania – 30).
These CDFIs have collectively been awarded
more than $4.6 billion in New Markets tax
credit funding since the program was created in 2002. New Markets is a federal program
that leverages investment with low income
communities and is one of hundreds of federal
funding programs aimed at inward investment.
Besides the USDOT, other federal agencies
including the Departments of Treasury,
Housing and Urban Development, Agriculture,
Commerce, and Labor provide various funding
and technical assistance sources that could
be beneficial to a comprehensive
transportation and/or economic revitalization
project.
Midwest Connect – Hyperloop One
Global Challenge Proposal
22
Government & Policy (Continued)
There are also a number of tools that
governments have employed to reduce risk for
the private sector, such as the aforementioned
TIFIA program. Additionally, each state in our
region has their own Public Private Partnership
(P3) legislation. Illinois’ PPP for Transportation Act
allows the state’s transportation department,
tollway authority, and municipalities to pursue
PPP agreements and has specific provisions for
high-speed rail and magnetic levitation (mag lev)
projects, demonstrating interest in non-highway
projects. Indiana boasts some of the earliest P3
legislation in the country and demonstrated early
success with the aforementioned toll road lease.
Ohio is newer to the P3 game, but has passed
enabling legislation, closed on its first major
transaction, and has several transportation and
non-transportation projects on the drawing table.
Finally, Pennsylvania is putting its P3 legislation
to use in an innovative fashion along the
Pennsylvania Turnpike. A P3 partnership is being
used to install a broadband network along the
550-mile turnpike to meet future communication
and smart vehicle needs. Although additional
legislative changes or approvals may be required
to support Hyperloop in a model that shares risk
and crosses state borders, each state’s prior
success with P3 demonstrates strong potential
for success.
What legislative process is typically required in
your region for the Government to approve and
what is a typical rough timeline for infrastructure
projects? Transportation improvements in our
region are generally planned for and approved
through a federal-state-local partnership. The
USDOT and its agencies, including the Federal
Highway Administration (FHWA), Federal Railroad
Administration (FRA), and Federal Transit
Administration (FTA) administer national
transportation planning and federal funding
programs. Each state has created its own
department of transportation that has
responsibility for certain federal and state
transportation facilities, as well as statewide
planning and funding programs. On the regional
level within states, Metropolitan Planning
Organizations (MPOs) coordinate local
governments and decision makers to plan for and
fund transportation improvements with the
region. MPOs are responsible for both short-range
(within 4 years) and long-range (20 year)
planning. Included in MPO short and long-
range plans are a requirement for federal
transportation funding.
The timeline for approving a transportation
improvement can vary greatly on the nature of
a project, required environmental reviews,
right-of-way acquisition, funding availability,
and other considerations. Recognizing that
government may not always be as agile as
necessary to address infrastructure needs,
USDOT and states have been working to
expedite project development processes. In
2009, the FHWA launched the Every Day
Counts initiative to develop innovative
methods to shorten the project delivery
process at the state level. This work has
resulted in the development of best practice
models that could be implemented for high-
priority projects, such as a Midwest Connect
Hyperloop. The Smart City Challenge and
Columbus project is an excellent example of
innovative and expedited project delivery
when a specific effort is prioritized by federal,
state, and local partners.
Which regulatory bodies are responsible for
current modes of transport in your region?
New technologies are typically evaluated and
tested by the same bodies that are planning
for and developing transportation
infrastructure. The Smart City Challenge has
made Columbus a hotbed of transportation
innovation where new technologies are tested
and advanced. As the Smart Columbus
project creates an environment more
accepting to new ideas and innovations, the
table is already set for discussions of how to
incorporate and compliment inter-city
Hyperloop connections.
Other major regulatory agencies that intersect
with transportation include state departments
of public safety, highway patrols/state police,
and utility commissions. These agencies will
need to be engaged early on to see if any
legislative or policy changes are necessary to
accommodate Hyperloop. These entities have
potential to be major supporters of a
Hyperloop effort as congestion will be reduced
and safety of existing transit modes will
benefit.
Midwest Connect – Hyperloop One
Global Challenge Proposal
23
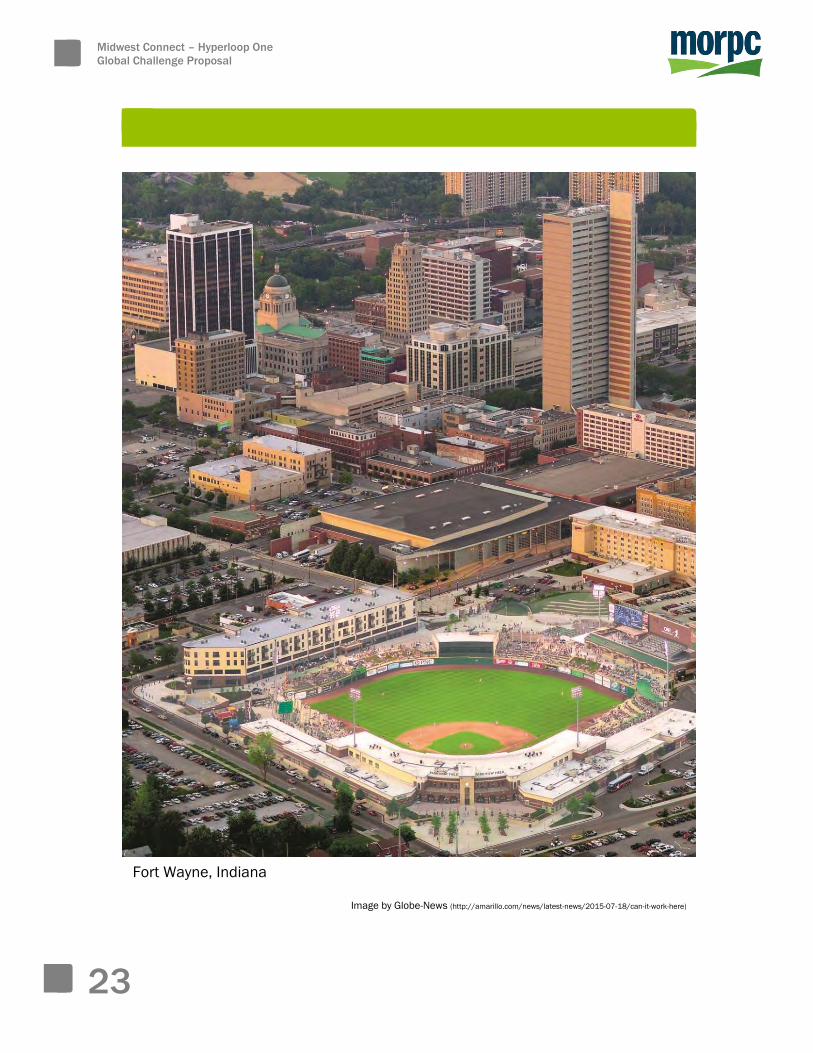
Fort Wayne, Indiana
Image by Globe-News (http://amarillo.com/news/latest-news/2015-07-18/can-it-work-here)
The Midwest Connect Hyperloop corridor
proposal is still in its early stages of
development and further partnerships,
specifically along the corridor between
Columbus and Pittsburgh, must still be forged
to permit the acceleration plan to be defined.
However, MORPC believes that existing
partnerships along the Chicago to Columbus
corridor route and the state-controlled right-
of-way between Columbus and Pittsburgh are
major assets to advancing the project.
MORPC is prepared to coordinate and lead
the necessary steps to develop a vetted and
financially sound acceleration plan.
Legislative Strategy. MORPC and our
members are highly active on the legislative
front, maintaining lobbyists at both the state
and federal levels and regularly engaging with
our legislative delegations. We believe that
this legislative expertise and relationship,
combined with the legislative partnerships of
future partners, can be leveraged to result in
legislative changes necessary at both the
state and federal levels to advance a
Hyperloop corridor within the region. We
understand that finding an appropriate
funding split between public and private
entities will be necessary to achieve rapid
governmental support, and we will make this
a priority from the start of the coordination
effort.
Prior to the legislative advocacy process,
detailed plans for regulatory approvals and
procurement will be developed following best
practice models from the USDOT and other
models employed by partner states. If this
exploration determines that there are
statuary roadblocks to expedited delivery of
the project, legislative changes will be sought
to remove or reduce those requirements as
part of the advocacy efforts.
Corridor Partnerships – Private Sector.
Additionally, the federal government and all
states along the corridor already have
enabling legislation for P3 approaches.
Project plans will examine these statues and
successful project models completed across
the country to maximize the benefit to private
sector investors in an effort to attract more
non-government participation. Further, an
examination of the P3 statues in each state will
be examined to determine if changes need to
be made to ensure that all provide for the
necessary components in the proposed
Hyperloop project, including crossing state
borders. MORPC also understands that a brand
new, innovative implementation path will have
to be forged for this Hyperloop corridor, as it
represents an entirely different model of
providing transportation and existing tools may
not be the best avenue for success.
Corridor Partnerships – Local Government
Agencies. As a regional association of local
governments, MORPC is highly experienced in
working with local communities. MORPC also
understands that the key to both maximizing
government inward investment incentives and
attracting economic development along the
corridor requires highly coordinated
development surrounding Hyperloop stations.
As part of the plans for the project, MORPC
envisions tasking each community with
planning for the appropriate placement of
stations, based on right-of-way considerations;
connections to jobs, education and medical
facilities; redevelopment opportunities; and
local priorities. Station planning will require
each city to develop a plan and development
strategy for appropriate transit oriented
development and intermodal connectivity
around the Hyperloop stations. With both an
eye towards economic development and
financing for the Hyperloop, the plan should
include specific strategies for incentivizing the
development through inward investment
incentives and financial tools that will ensure
the developments benefiting from proximity to
the Hyperloop contribute to the system’s
construction and/or operation. This could
include direct impact fees, tax increment
financing, payments in lieu of taxes abated,
new community authorities, special
assessments, special districts, upfront
investment in completion of the Hyperloop or
other strategies. During project development,
MORPC envisions an iterative process where
each city will be asked to develop a model that
will generate specific revenue and ridership
projections.
Midwest Connect – Hyperloop One
Global Challenge Proposal
24
ACCELERATION PLAN
Midwest Connect – Hyperloop One
Global Challenge Proposal (Continued)
Acceleration Plan (Continued)
Do you envision opportunities to partner with
another region(s), and if so, what is the
purpose of this collaboration? Midwest
Connect seeks to connect four major sub
regions within the Midwest, including Greater
Chicago, Northwest Indiana/Ft. Wayne,
Central Ohio/Columbus, and Western
Pennsylvania/Pittsburgh. MORPC has already
developed partnership agreements with
communities from Chicago to Columbus,
including Gary and Ft. Wayne, Indiana and
Lima, Kenton, Marysville, and Columbus,
Ohio to study passenger rail connections.
These existing relationships will be leveraged
to form a consortium to support exploration
of the Hyperloop corridor as an alternative.
Partners in the corridor between Columbus
and Pittsburgh will be acquired as the
Midwest Connect Hyperloop corridor project
advances.
As the Midwest Connect concept is still under
development, the nature of the partnership(s)
necessary to finance, build, operate, and
maintain the Hyperloop corridor have not yet
been determined. It will be necessary to
coordinate between the USDOT, its agencies,
and the four state departments of
transportation involved in this effort. MORPC
is prepared to lead the initial coordination of
these parties in an effort to further study and
define the correct partnership and oversight
framework to successfully erect and operate
a Hyperloop connection across the Midwest
region.
Are there potential investors in your project
group? At this time, investors have not been
secured for this partnership. However,
MORPC envisions great potential for both
public and private sector investors in the
proposed Midwest Connect Hyperloop
corridor project. Columbus has already
proven its ability to raise local equity through
the Smart Columbus project, with more than
$90 million raised from local partners—mostly
from the private sector—through the
leadership of the Columbus Partnership. The
Partnership is a group of more than 60 CEOs
from the Columbus region’s leading
businesses and institutions. The organization
has been a major leader in championing
advanced, game changing transportation
technologies and was an early supporter of the
Midwest Connect effort. As this project
continues, the Columbus Partnership will be an
important leader in the effort.
Additionally, Columbus and the Midwest are
quickly becoming hotspots for venture
capitalism with the launch of Silicon Valley
tycoon Mark Kvamme’s Drive Capital. In just
three years, Drive Capital has raised and
deployed two $300 million tranches of funds
for Midwest start-ups, including an initial
investment of $50 million by OSU. As the
project partnerships further develop along the
corridor, MORPC will work with partners across
the Midwest region to identify and engage
private sector partners in an effort to attract
investment in both the study and development
of a Hyperloop corridor.
Please identify any expertise that you would
like to contribute to further study. One of
MORPC’s greatest strengths lies within our
technical team. MORPC staffs an exceptional
group of transportation technical experts who
will be ready to contribute to the Midwest
Connect Hyperloop corridor project. MORPC
also excels at building lasting relationships in a
stakeholder setting. We are known as the
region’s “collaboration table”, and we assist
our members and external professional peers
in advancing transportation planning.
MORPC is ready to provide support in land use,
population, and transportation forecasting;
overall project coordination; and financing and
operations technical assistance. We also
believe that powerhouse institutional leaders
such as the Ohio State University and Battelle
Memorial Institute can provide important
contributions as the project further develops.
Both were key contributors to the Smart
Columbus effort and will see similar benefits
from the Midwest Connect Hyperloop corridor.
Finally, we would like to reemphasize our
existing partnerships with communities from
Chicago to Columbus that have been working
on improving passenger connections. This
foundation will allow further planning for the
Midwest Connect Hyperloop corridor to quickly
accelerate with the support of the Hyperloop
One team.
25
Appendix I Government & Policy
October 28, 2016
Government & Policy
This appendix supplements the “Government and Policy” section of this proposal. More
information is provided, including details on specific projects, to demonstrate collaboration among
the corridor stakeholders. The goal of this providing this detailed information is to demonstrate
our thorough knowledge of the mechanisms involved in infrastructure improvement investments.
1. Innovative financing and project delivery strategies:
Indiana Toll Road: Spanning 157 miles between the Chicago Skyway and Ohio Turnpike in
Northern Indiana, the Indiana toll road links Chicago with the eastern seaboard of the
United States. Also known as Interstates 80 and 90, the limited-access highway was
opened to traffic in 1956. By the early 2000’s, the tollway was challenged with significant
deferred maintenance at the same time that the State of Indiana was facing a $3 billion
gap between transportation funding needs and projected revenues. In an effort to tackle
both challenges, the state entered into a 75-year concessionaire lease agreement with
the newly-formed Indiana Toll Road Concession Company (ITRCC), a joint venture between
a Spanish toll road operator and an investment bank. The lease netted the state an
upfront payment of $3.8 billion, which was used to complete highway projects throughout
the state, pay down all debt on the toll road, and create a trust fund for future
infrastructure projects. Additionally, the ITRCC is responsible for continued maintenance
of tollway throughout the lease, removing the state from this responsibility. Currently,
ITRCC is undertaking $200 million in improvements throughout the corridor,
reconstructing 70 miles of asphalt and 53 bridges. In Illinois, the Chicago Skyway, a 7.8
mile elevated segment of Interstate 90 was also leased for 99 years, trading all
operations and maintenance responsibilities for $1.83 billion in upfront payments to the
City of Chicago.
Portsmouth Bypass: Located in South Central Ohio, the Portsmouth bypass provides a
four-lane, limited access highway around the City of Portsmouth. The route allows traffic
to avoid traffic signals, intersections, and access points on the current 26-mile route the
follows US 52 and US 23 through urban Portsmouth and New Boston. The Ohio
Department of Transportation (ODOT) originally planned to complete the project under a
design-build model over three phases and 13 years. After re-evaluating the project, ODOT
determined the project could be completed in one four year phase by implementing a
DBFOM – Design, Build, Finance, Operate, and Maintain P3 approach. Using this model,
the private sector will complete design and construction during a four year period and
then provide operations and maintenance for a 35 year period. As the highway will not
charge a toll, the private sector is repaid through availability payments through a mix of
state and federal Appalachian Development Highway System funds. This approach
attracted $49 million in private equity and is estimated to save the State of Ohio at least
20% compared to the design-build approach for the $634 million project.
Interstate 55 Toll Lanes: After seeing success with other P3 projects, the State of Illinois
is pursuing such an arrangement for Interstate 55 in Greater Chicago. The proposed
project calls for construction of an express toll lane in each direction along a 25-mile
stretch of the highway. The corridor carries approximately 175,000 vehicles a day. At
least 15% of the daily traffic are trucks, making the corridor important for both freight and
Appendix I: Government & Policy
27
commuting. The Illinois Department of Transportation has issued a Request for
Information to gather private sector input on the proposal and a joint resolution to enable
a P3 approach is moving through the Illinois General Assembly. The state is currently
anticipating that if P3 is ultimately implemented, it would involve a revenue risk toll
concession with private financing under a DBFOM – Design, Build, Finance, Operate, and
Maintain approach.
Rickenbacker Air Cargo Terminal: Rickenbacker International Airport, located in Central
Ohio, is one of the few cargo-dedicated airports in the world. The airport compliments an
intermodal rail terminal, industrial and warehousing development, and a foreign-trade
zone to comprise the growing Rickenbacker Inland Port. As the volume of incoming
international cargo increased, the need for additional air cargo space became apparent.
The Columbus Regional Airport Authority and local businesses created a unique
partnership to develop a new $17 million air cargo facility. The logistics arm of L Brands, a
major fashion retailed headquartered in Columbus, developed the new warehouse on
ground leased from the airport authority with incentives from local governments and the
non-profit JobsOhio. The company, and its third-party operator, are responsible for
operation and maintenance of the facility, as well as marketing and attraction. Although
this facility was only recently completed in summer of 2016, the number of weekly
inbound flights have increased six fold since opening.
Rickenbacker Intermodal Connector: Located in close proximity to the aforementioned
Rickenbacker International Airport, Rickenbacker Intermodal is a major Norfolk Southern
train to truck transfer facility for cargo containers. Its location allows containers to reach
Columbus from the Port of Virginia overnight. To provide a grade-separated secondary
connection to Rickenbacker Intermodal, Rickenbacker Airport, and the adjacent logistics
parks, a collaborative project between multiple local governments, the State of Ohio, and
the USDOT was launched. Utilizing a federal grant, the $12 million improvement was
completed in 2015, linking the Rickenbacker area with an east-west connector to U.S. 23.
Further phases of the project may include further widening of the connector and an
upgraded interchange with U.S. 23.
These projects represent only a sampling of the more innovative partnerships that governments
across the region have employed to advance transportation projects. All four states, Illinois,
Indiana, Ohio and Pennsylvania, have some form of enabling legislation permitting P3 project
structures and each has experience and success implementing such partnerships.
2. Examples of completed infrastructure projects:
Chicago Rail Improvement Program (CREATE) – Comprehensive improvements that include 70
projects: grade separations, chokepoint reductions, viaduct restorations, and safety
enhancements. Cost: $31.5 million. Construction timeframe: 2003-2033.
U.S. 24 Fort to Port: A 90 mile, four-lane highway connection between Ft. Wayne, Indiana
(fort) and Toledo, Ohio (port). This project connects Ft. Wayne with the Great Lakes region,
Canada, and eastern seaboard. Cost: $93 million (Indiana) and$169 million (Ohio).
Construction timeframe: 2006-2012 (completed).
Appendix I: Government & Policy
28
29
I-69 Evansville to Indianapolis: An Interstate highway connecting Evansville, Indiana to
Indianapolis, Indiana. This project links to I-69, an interstate that is planned to transverse
areas from Mexico to Canada. Cost: $3.5 billion. Construction timeframe: 2007-2016
(Sections 1-5 of 6 completed).
Voinovich Bridge: An urban inner-belt bridge located in Downtown Cleveland, it is a critical
component of the Interstate 90 inner-belt reconstruction. A 1950s bridge replacement, it
serves 140,000 motorists a day. This project is innovative in its design-build expedited
construction delivery. Cost: $500 million. Construction timeframe: 2011-2016 (completed).
3. Transportation Infrastructure Finance and Innovation Act (TIFIA)
The federal government’s Transportation Infrastructure Finance and Innovation Act (TIFIA)
provides multiple protections through credit assistance for partners undertaking large-scale
transit-oriented development, intelligent transportation, and surface transportation projects. The
program offers secured direct loans with flexible repayment terms, loan guarantees on the full-
faith-and-credit of the federal government, and standby lines of credit during the first ten years of
project operations.
TIFIA recognizes the challenges of non-traditional financing strategies for transportation projects,
given the uncertainty of potential revenue streams derived from tolls, other user-backed revenues,
or development-related revenue sources such as tax-increment financing districts. As these
revenues can be difficult to predict, especially for new facilities, TIFIA offerings can reduce risk for
both public and private partners by providing federal guarantees.
Although the four individual states in the region may not have specific complimentary programs
like TIFIA that address risk by private investors, the success of all four in completing transportation
improvement or operations/managements projects through the use of public-private partnerships
demonstrates that these states understand that some level of risk must be shared by both public
and private partners.
4. Smart Columbus – Proposed Technologies
Smart Columbus includes many diverse technologies that will seek to accomplish multiple goals.
LED and connected smart street and traffic lights will contribute to energy efficiency. Parking and
truck delivery coordination systems will reduce congestion in the downtown core. Connected
vehicles will allow trucks to platoon and reduce connections along major freight corridors. A smart
transportation card serving all modes of transport will provide for better open data tracking
commuting trends. Autonomous vehicles will provide “last mile” connections in Easton, a major
mixed-use shopping, office, and residential district, improving access to employment and reducing
congestion. While each one of the technologies are impressive in their own right, the major benefit
to Columbus, the Midwest region, and the country will be the experimentation and innovation
sparked in the context of defining what a smart city means. Further funding will need to be raised.
Legislative changes will be needed to support new technologies. Habits may need to be adjusted.
These challenges are not taken for granted, but we are confident the Columbus region will prevail
because of the initial and immediate commitment of both the public and private sectors that
brought about the $90 million match commitment. Adding Hyperloop connections into the new
definition of smart cities will be a benefit to Columbus and Hyperloop alike.
Appendix I: Government & Policy
Appendix II Major Traffic Generators
October 28, 2016
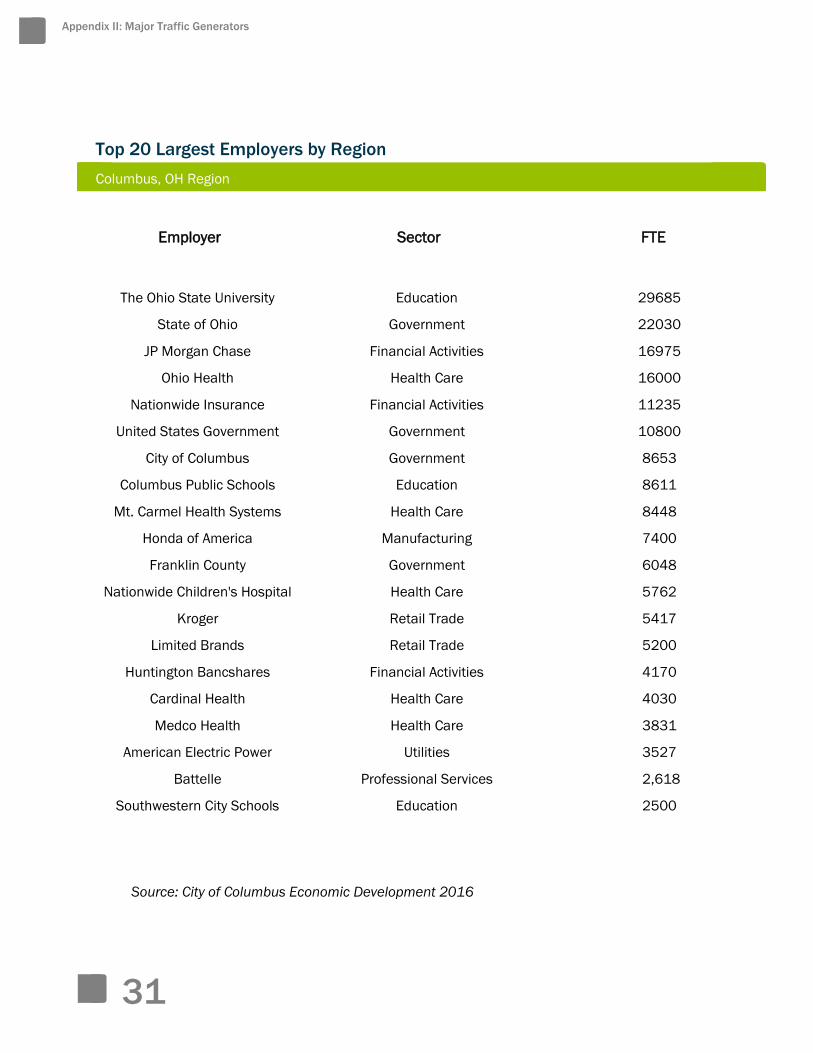
Employer Sector FTE
The Ohio State University Education 29685
State of Ohio Government 22030
JP Morgan Chase Financial Activities 16975
Ohio Health Health Care 16000
Nationwide Insurance Financial Activities 11235
United States Government Government 10800
City of Columbus Government 8653
Columbus Public Schools Education 8611
Mt. Carmel Health Systems Health Care 8448
Honda of America Manufacturing 7400
Franklin County Government 6048
Nationwide Children's Hospital Health Care 5762
Kroger Retail Trade 5417
Limited Brands Retail Trade 5200
Huntington Bancshares Financial Activities 4170
Cardinal Health Health Care 4030
Medco Health Health Care 3831
American Electric Power Utilities 3527
Battelle Professional Services 2,618
Southwestern City Schools Education 2500
31
Top 20 Largest Employers by Region
Columbus, OH Region
Appendix II: Major Traffic Generators
Source: City of Columbus Economic Development 2016
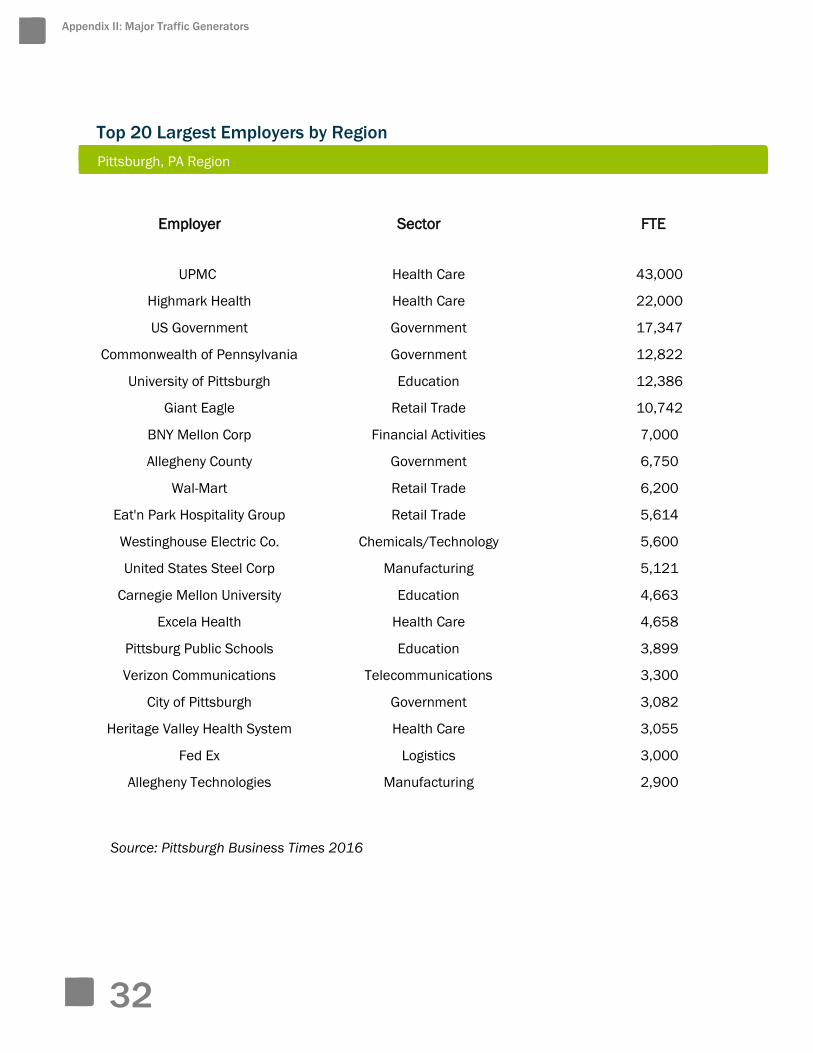
Employer Sector FTE
UPMC Health Care 43,000
Highmark Health Health Care 22,000
US Government Government 17,347
Commonwealth of Pennsylvania Government 12,822
University of Pittsburgh Education 12,386
Giant Eagle Retail Trade 10,742
BNY Mellon Corp Financial Activities 7,000
Allegheny County Government 6,750
Wal-Mart Retail Trade 6,200
Eat'n Park Hospitality Group Retail Trade 5,614
Westinghouse Electric Co. Chemicals/Technology 5,600
United States Steel Corp Manufacturing 5,121
Carnegie Mellon University Education 4,663
Excela Health Health Care 4,658
Pittsburg Public Schools Education 3,899
Verizon Communications Telecommunications 3,300
City of Pittsburgh Government 3,082
Heritage Valley Health System Health Care 3,055
Fed Ex Logistics 3,000
Allegheny Technologies Manufacturing 2,900
32
Top 20 Largest Employers by Region
Pittsburgh, PA Region
Appendix II: Major Traffic Generators
Source: Pittsburgh Business Times 2016
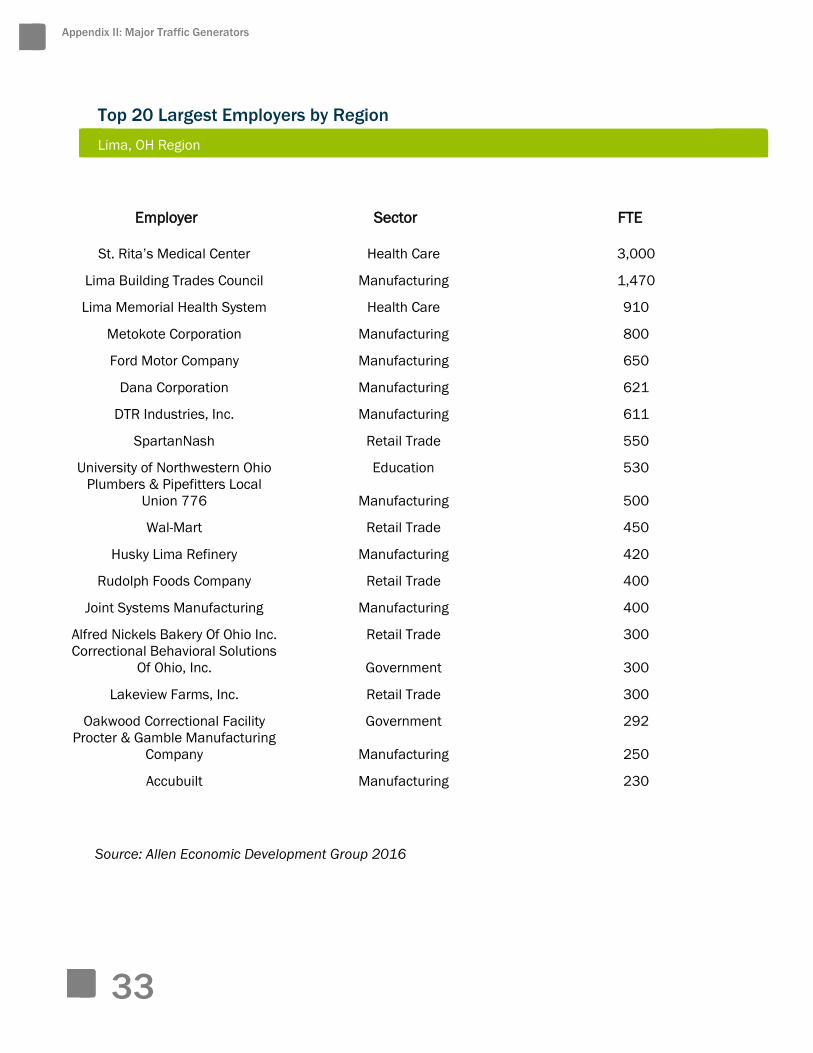
Employer Sector FTE
St. Rita’s Medical Center Health Care 3,000
Lima Building Trades Council Manufacturing 1,470
Lima Memorial Health System Health Care 910
Metokote Corporation Manufacturing 800
Ford Motor Company Manufacturing 650
Dana Corporation Manufacturing 621
DTR Industries, Inc. Manufacturing 611
SpartanNash Retail Trade 550
University of Northwestern Ohio Education 530
Plumbers & Pipefitters Local
Union 776 Manufacturing 500
Wal-Mart Retail Trade 450
Husky Lima Refinery Manufacturing 420
Rudolph Foods Company Retail Trade 400
Joint Systems Manufacturing Manufacturing 400
Alfred Nickels Bakery Of Ohio Inc. Retail Trade 300
Correctional Behavioral Solutions
Of Ohio, Inc. Government 300
Lakeview Farms, Inc. Retail Trade 300
Oakwood Correctional Facility Government 292
Procter & Gamble Manufacturing
Company Manufacturing 250
Accubuilt Manufacturing 230
33
Top 20 Largest Employers by Region
Lima, OH Region
Appendix II: Major Traffic Generators
Source: Allen Economic Development Group 2016
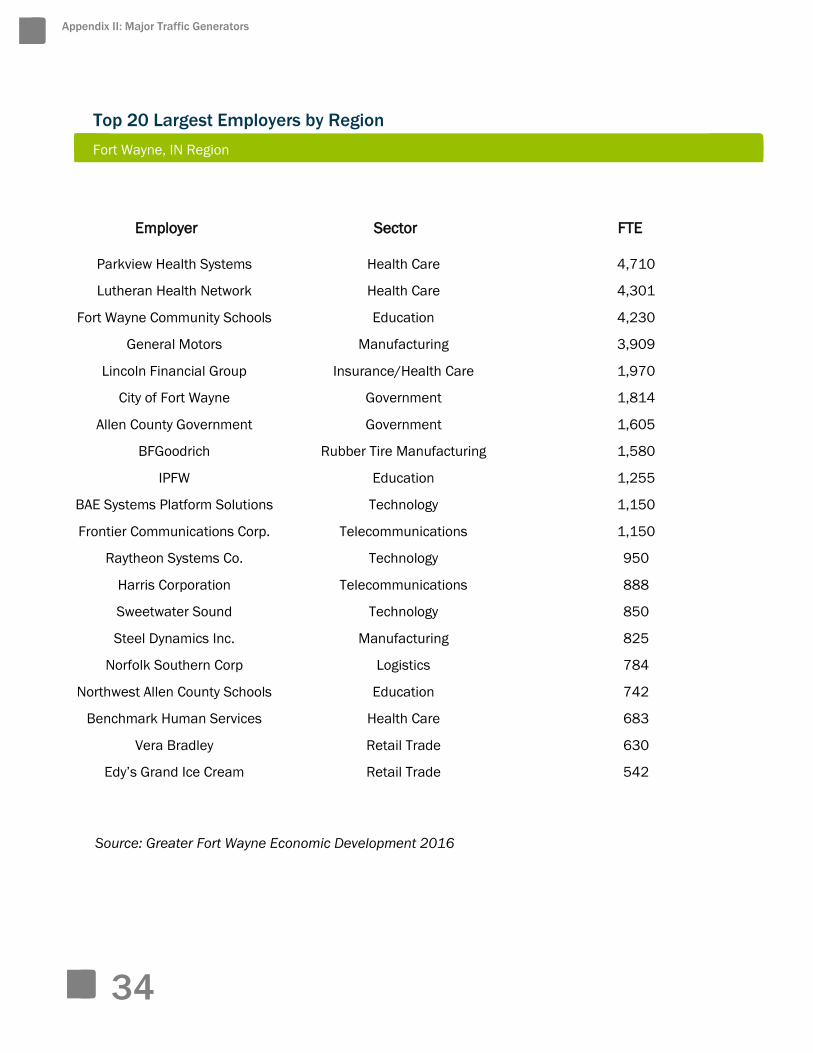
Employer Sector FTE
Parkview Health Systems Health Care 4,710
Lutheran Health Network Health Care 4,301
Fort Wayne Community Schools Education 4,230
General Motors Manufacturing 3,909
Lincoln Financial Group Insurance/Health Care 1,970
City of Fort Wayne Government 1,814
Allen County Government Government 1,605
BFGoodrich Rubber Tire Manufacturing 1,580
IPFW Education 1,255
BAE Systems Platform Solutions Technology 1,150
Frontier Communications Corp. Telecommunications 1,150
Raytheon Systems Co. Technology 950
Harris Corporation Telecommunications 888
Sweetwater Sound Technology 850
Steel Dynamics Inc. Manufacturing 825
Norfolk Southern Corp Logistics 784
Northwest Allen County Schools Education 742
Benchmark Human Services Health Care 683
Vera Bradley Retail Trade 630
Edy’s Grand Ice Cream Retail Trade 542
Top 20 Largest Employers by Region
Fort Wayne, IN Region
Appendix II: Major Traffic Generators
34
Source: Greater Fort Wayne Economic Development 2016
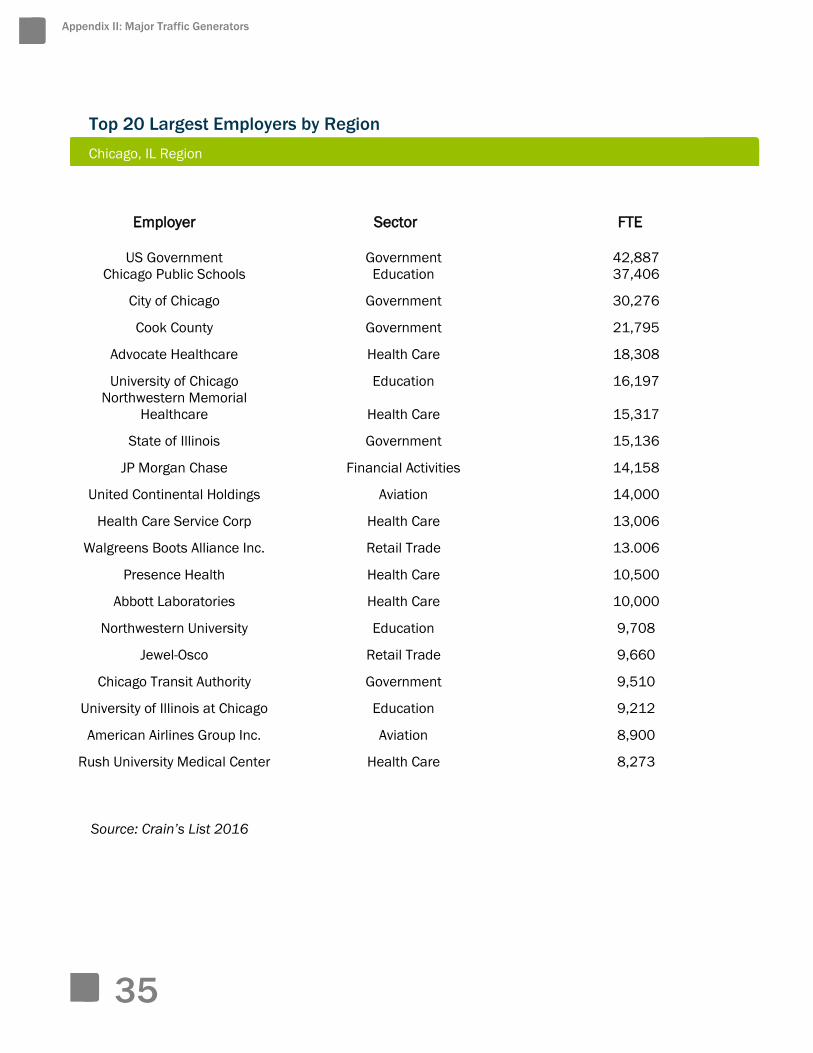
Employer Sector FTE
US Government Government 42,887
Chicago Public Schools Education 37,406
City of Chicago Government 30,276
Cook County Government 21,795
Advocate Healthcare Health Care 18,308
University of Chicago Education 16,197
Northwestern Memorial
Healthcare Health Care 15,317
State of Illinois Government 15,136
JP Morgan Chase Financial Activities 14,158
United Continental Holdings Aviation 14,000
Health Care Service Corp Health Care 13,006
Walgreens Boots Alliance Inc. Retail Trade 13.006
Presence Health Health Care 10,500
Abbott Laboratories Health Care 10,000
Northwestern University Education 9,708
Jewel-Osco Retail Trade 9,660
Chicago Transit Authority Government 9,510
University of Illinois at Chicago Education 9,212
American Airlines Group Inc. Aviation 8,900
Rush University Medical Center Health Care 8,273
Top 20 Largest Employers by Region
Chicago, IL Region
Appendix II: Major Traffic Generators
35
Source: Crain’s List 2016
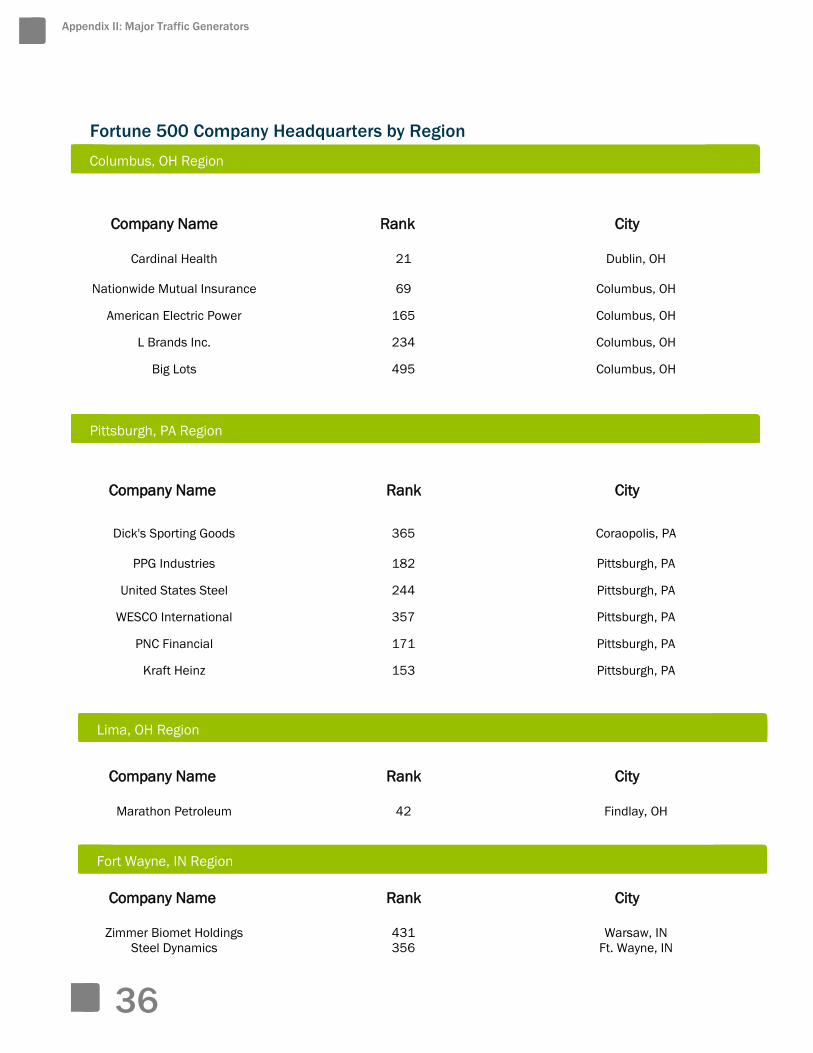
Company Name Rank City
Cardinal Health 21 Dublin, OH
Nationwide Mutual Insurance 69 Columbus, OH
American Electric Power 165 Columbus, OH
L Brands Inc. 234 Columbus, OH
Big Lots 495 Columbus, OH
Company Name Rank City
Dick's Sporting Goods 365 Coraopolis, PA
PPG Industries 182 Pittsburgh, PA
United States Steel 244 Pittsburgh, PA
WESCO International 357 Pittsburgh, PA
PNC Financial 171 Pittsburgh, PA
Kraft Heinz 153 Pittsburgh, PA
Company Name Rank City
Marathon Petroleum 42 Findlay, OH
Company Name Rank City
Zimmer Biomet Holdings 431 Warsaw, IN
Steel Dynamics 356 Ft. Wayne, IN
Appendix II: Major Traffic Generators
Fortune 500 Company Headquarters by Region
Columbus, OH Region
Pittsburgh, PA Region
Lima, OH Region
Fort Wayne, IN Region
36
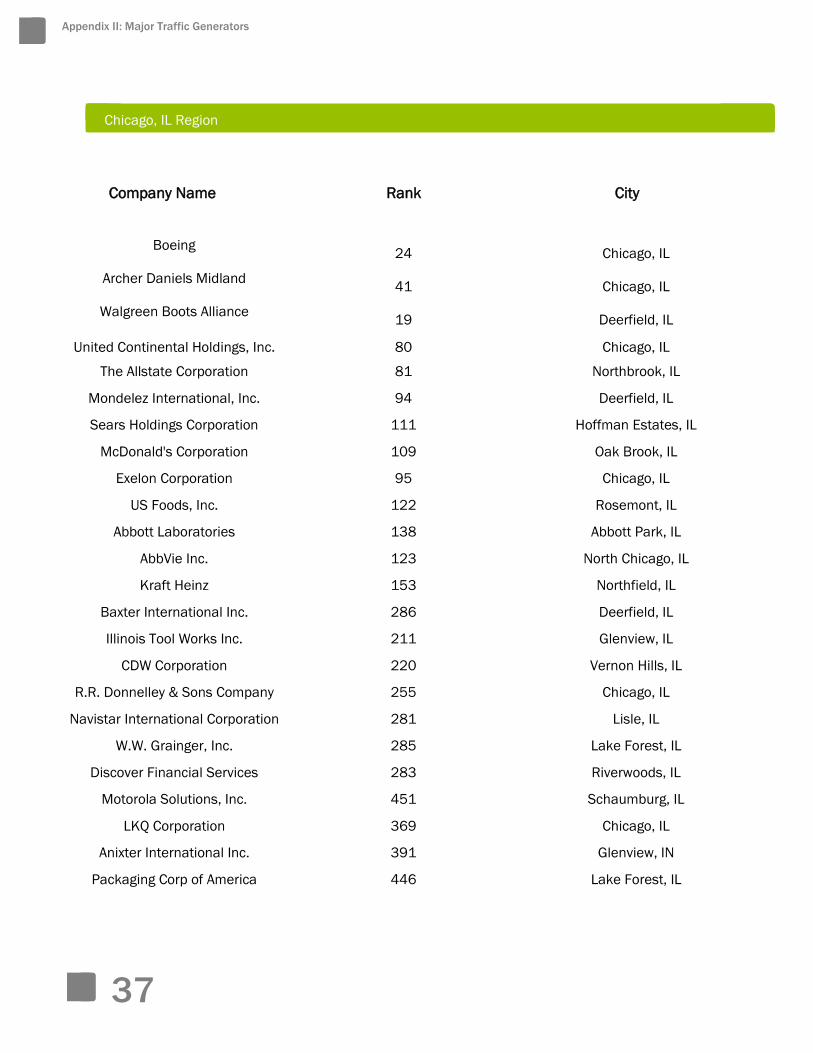
Company Name Rank City
Boeing
24 Chicago, IL
Archer Daniels Midland
41 Chicago, IL
Walgreen Boots Alliance
19 Deerfield, IL
United Continental Holdings, Inc. 80 Chicago, IL
The Allstate Corporation 81 Northbrook, IL
Mondelez International, Inc. 94 Deerfield, IL
Sears Holdings Corporation 111 Hoffman Estates, IL
McDonald's Corporation 109 Oak Brook, IL
Exelon Corporation 95 Chicago, IL
US Foods, Inc. 122 Rosemont, IL
Abbott Laboratories 138 Abbott Park, IL
AbbVie Inc. 123 North Chicago, IL
Kraft Heinz 153 Northfield, IL
Baxter International Inc. 286 Deerfield, IL
Illinois Tool Works Inc. 211 Glenview, IL
CDW Corporation 220 Vernon Hills, IL
R.R. Donnelley & Sons Company 255 Chicago, IL
Navistar International Corporation 281 Lisle, IL
W.W. Grainger, Inc. 285 Lake Forest, IL
Discover Financial Services 283 Riverwoods, IL
Motorola Solutions, Inc. 451 Schaumburg, IL
LKQ Corporation 369 Chicago, IL
Anixter International Inc. 391 Glenview, IN
Packaging Corp of America 446 Lake Forest, IL
Chicago, IL Region
Appendix II: Major Traffic Generators
37
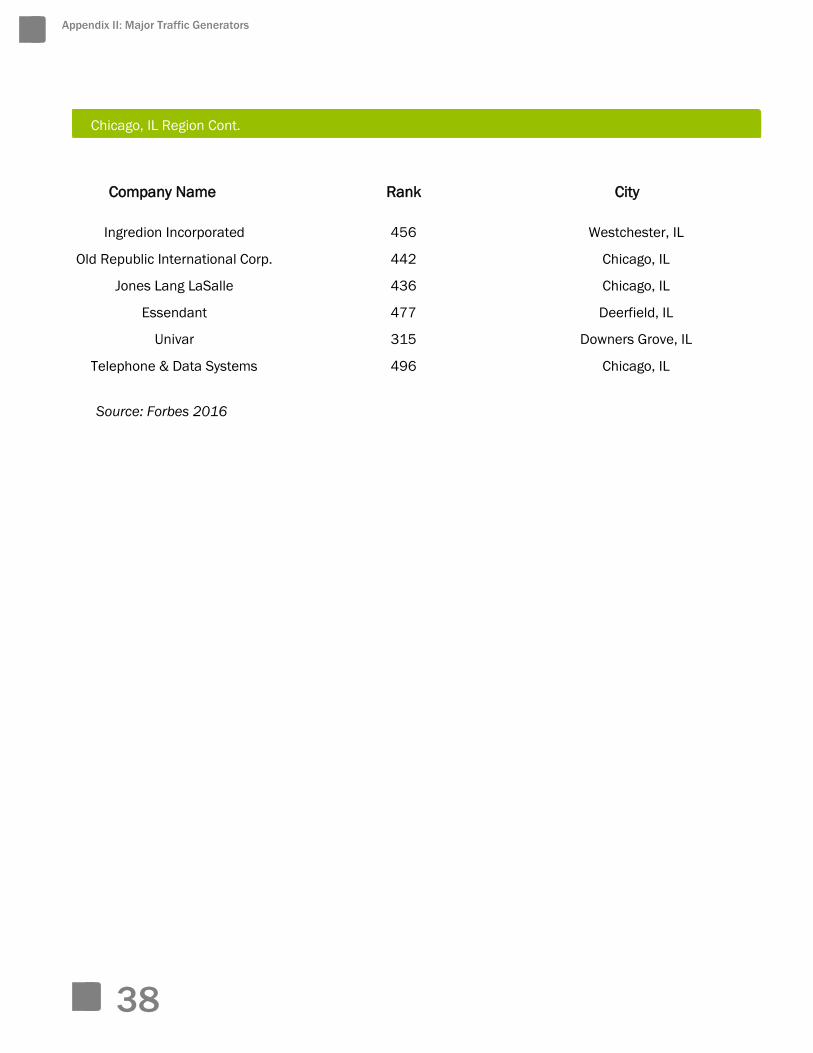
Company Name Rank City
Ingredion Incorporated 456 Westchester, IL
Old Republic International Corp. 442 Chicago, IL
Jones Lang LaSalle 436 Chicago, IL
Essendant 477 Deerfield, IL
Univar 315 Downers Grove, IL
Telephone & Data Systems 496 Chicago, IL
Appendix II: Major Traffic Generators
38
Source: Forbes 2016
Chicago, IL Region Cont.
Appendix III Data Tables
October 28, 2016

NETWORK SUMMARY
Proposed Hyperloop Network Summary Sheet Ref km on Corridor Location Catchment Area Population Employment Avg Household Income Avg Household Car Ownership Other InformationThis is sample data, please replace with actual data for your
corridor
Chicago A 0 http://arcgiswebadp1.morp
c.org/webadaptor/rest/servi
ces/morpc/hyperloop/Map
Server/kml/mapImage.kmz
9,550,108 4,681,500 $63,153 1.62
Columbus B 493 Same as above 2,021,632 1,021,600 $58,192 1.79
Pittsburgh C 785 Same as above 2,353,045 1,156,200 $54,080 1.66
1
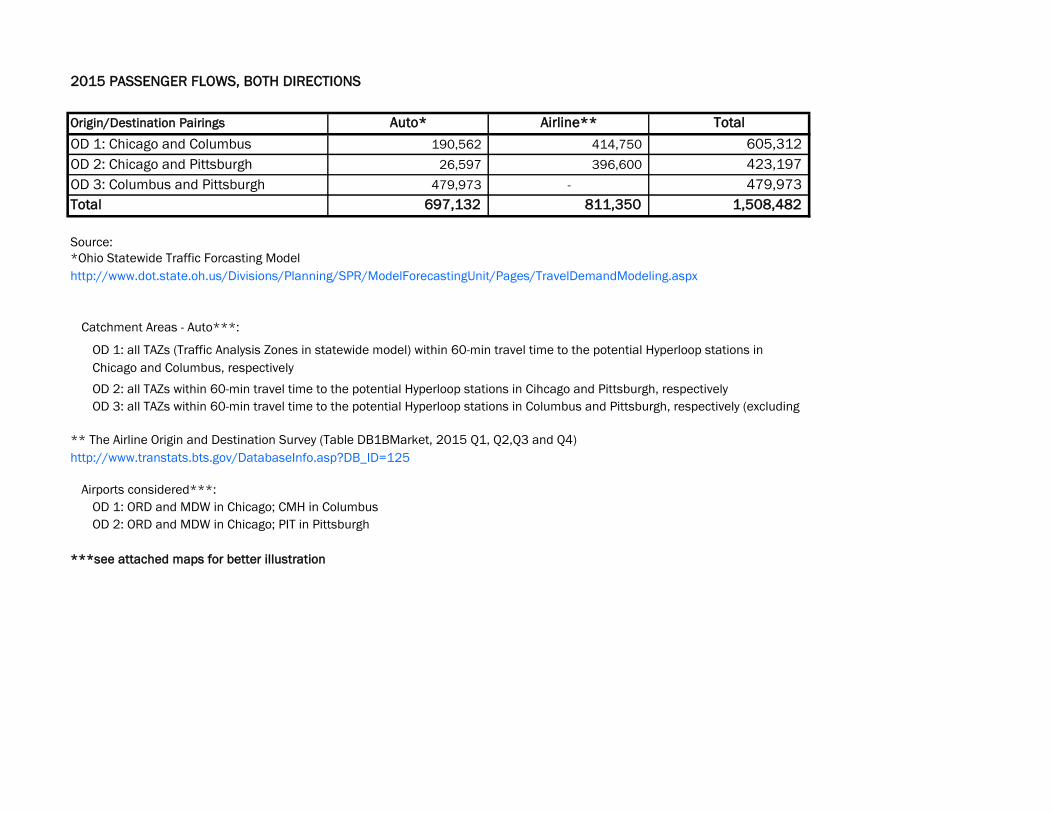
2015 PASSENGER FLOWS, BOTH DIRECTIONS
Origin/Destination Pairings Auto* Airline** Total
OD 1: Chicago and Columbus 190,562 414,750 605,312
OD 2: Chicago and Pittsburgh 26,597 396,600 423,197
OD 3: Columbus and Pittsburgh 479,973 - 479,973
Total 697,132 811,350 1,508,482
Source:
Catchment Areas - Auto***:
Airports considered***:
OD 1: ORD and MDW in Chicago; CMH in Columbus
OD 2: ORD and MDW in Chicago; PIT in Pittsburgh
***see attached maps for better illustration
OD 1: all TAZs (Traffic Analysis Zones in statewide model) within 60-min travel time to the potential Hyperloop stations in
Chicago and Columbus, respectively
OD 2: all TAZs within 60-min travel time to the potential Hyperloop stations in Cihcago and Pittsburgh, respectively
OD 3: all TAZs within 60-min travel time to the potential Hyperloop stations in Columbus and Pittsburgh, respectively (excluding
*Ohio Statewide Traffic Forcasting Model
http://www.dot.state.oh.us/Divisions/Planning/SPR/ModelForecastingUnit/Pages/TravelDemandModeling.aspx
** The Airline Origin and Destination Survey (Table DB1BMarket, 2015 Q1, Q2,Q3 and Q4)
http://www.transtats.bts.gov/DatabaseInfo.asp?DB_ID=125
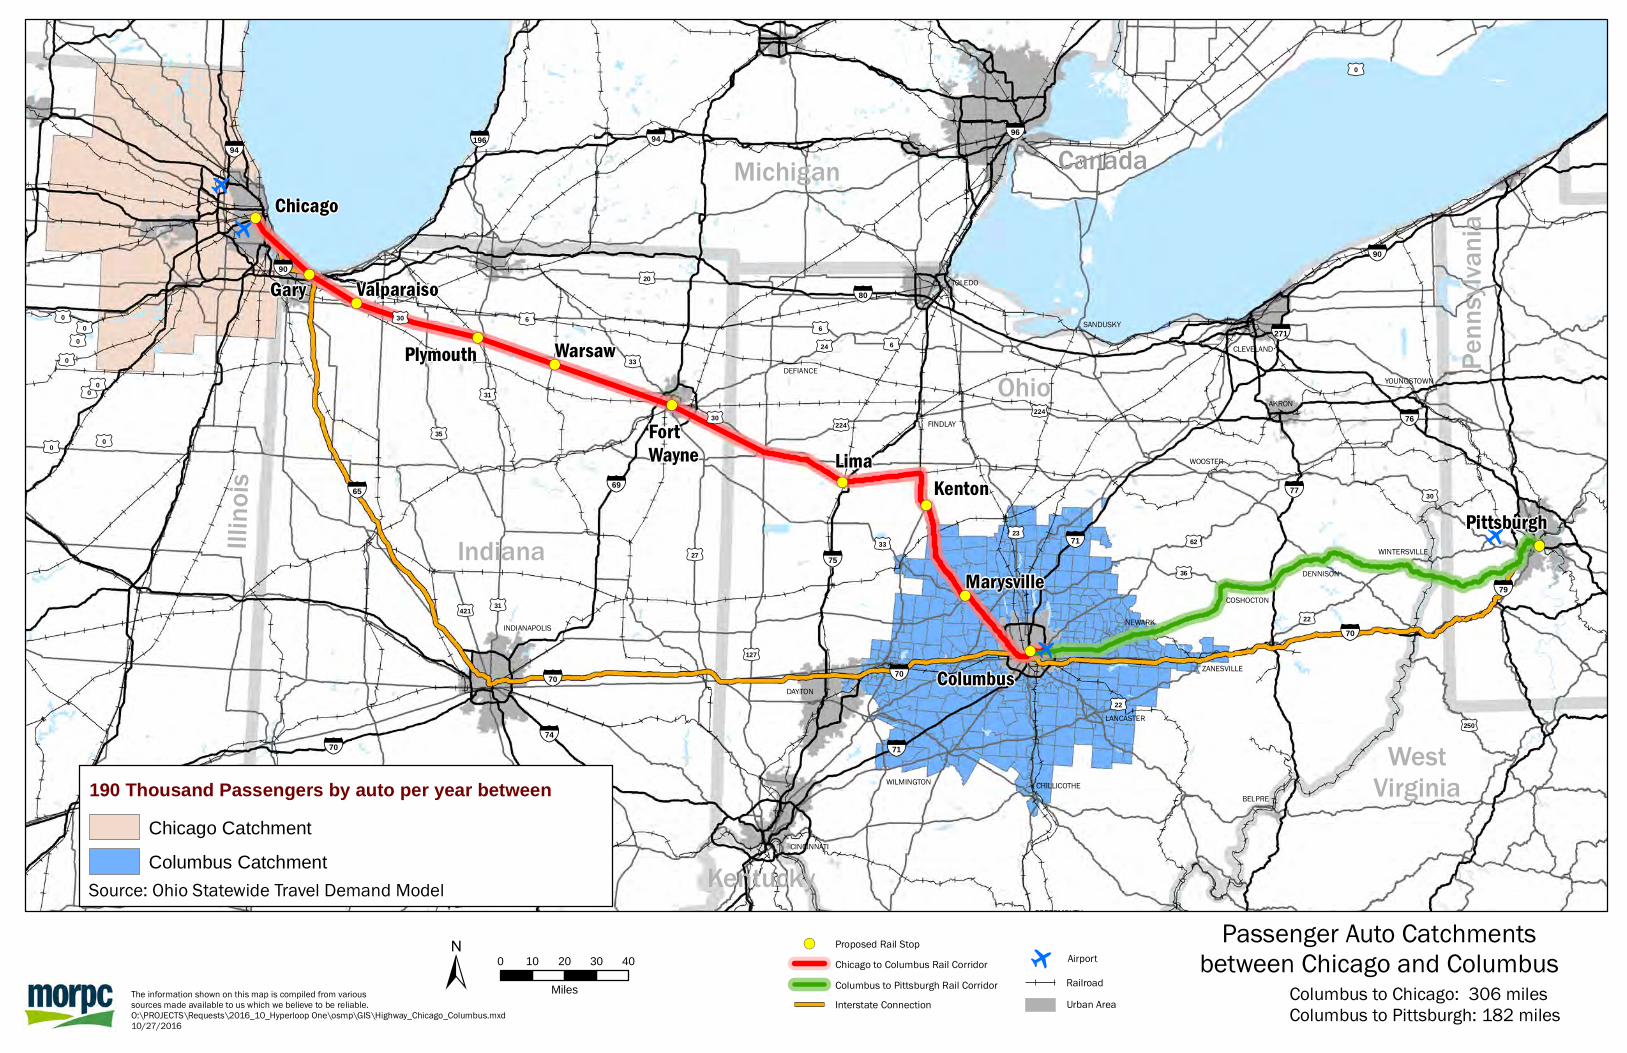
!(
!(
!(
!(
!(
!(
!(
!(
!(
!(
!(
o
o
o
o
Penn
sylva
nia
Indiana
Ohio
Illino
is
WestVirginia
Kentucky
MichiganChicago
FortWayne
Gary
Plymouth
Valparaiso
Warsaw
Columbus
KentonLima
Marysville
Pittsburgh
§̈¦90
§̈¦71
§̈¦294
§̈¦70
§̈¦69
§̈¦96
§̈¦94
§̈¦71
§̈¦70
§̈¦70
§̈¦196
§̈¦77
§̈¦79
§̈¦271
§̈¦80
§̈¦90
§̈¦76
§̈¦75
§̈¦65
§̈¦94
§̈¦70
§̈¦74
DEFIANCE
FINDLAY
TOLEDO
SANDUSKY
INDIANAPOLIS
WOOSTER
AKRON
CLEVELAND
DAYTON
Canada
CINCINNATI
BELPRE
COSHOCTON
DENNISON
PORTSMOUTH
YOUNGSTOWN
ZANESVILLE
WINTERSVILLE
CHILLICOTHE
NEWARK
LANCASTER
WILMINGTON
£¤22
£¤0
£¤27
£¤20
£¤22
£¤0
£¤6
£¤0
£¤250
£¤0
£¤224
£¤30
£¤0
£¤33
£¤0
£¤0
£¤36
£¤224
£¤6
£¤62
£¤0
£¤421 £¤31
£¤30 £¤6
£¤35£¤30
£¤24
£¤127
£¤33£¤23
£¤0
£¤31
The information shown on this map is compiled from varioussources made available to us which we believe to be reliable.O:\PROJECTS\Requests\2016_10_Hyperloop One\osmp\GIS\Highway_Chicago_Columbus.mxd10/27/2016
± 0 10 20 30 40
Miles
Passenger Auto Catchmentsbetween Chicago and Columbus
Columbus to Chicago: 306 milesColumbus to Pittsburgh: 182 miles
Columbus to Pittsburgh Rail CorridorChicago to Columbus Rail Corridor
RailroadUrban AreaInterstate Connection
!( Proposed Rail StopAirport
o
190 Thousand Passengers by auto per year betweenChicago Catchment
Columbus Catchment
Source: Ohio Statewide Travel Demand Model
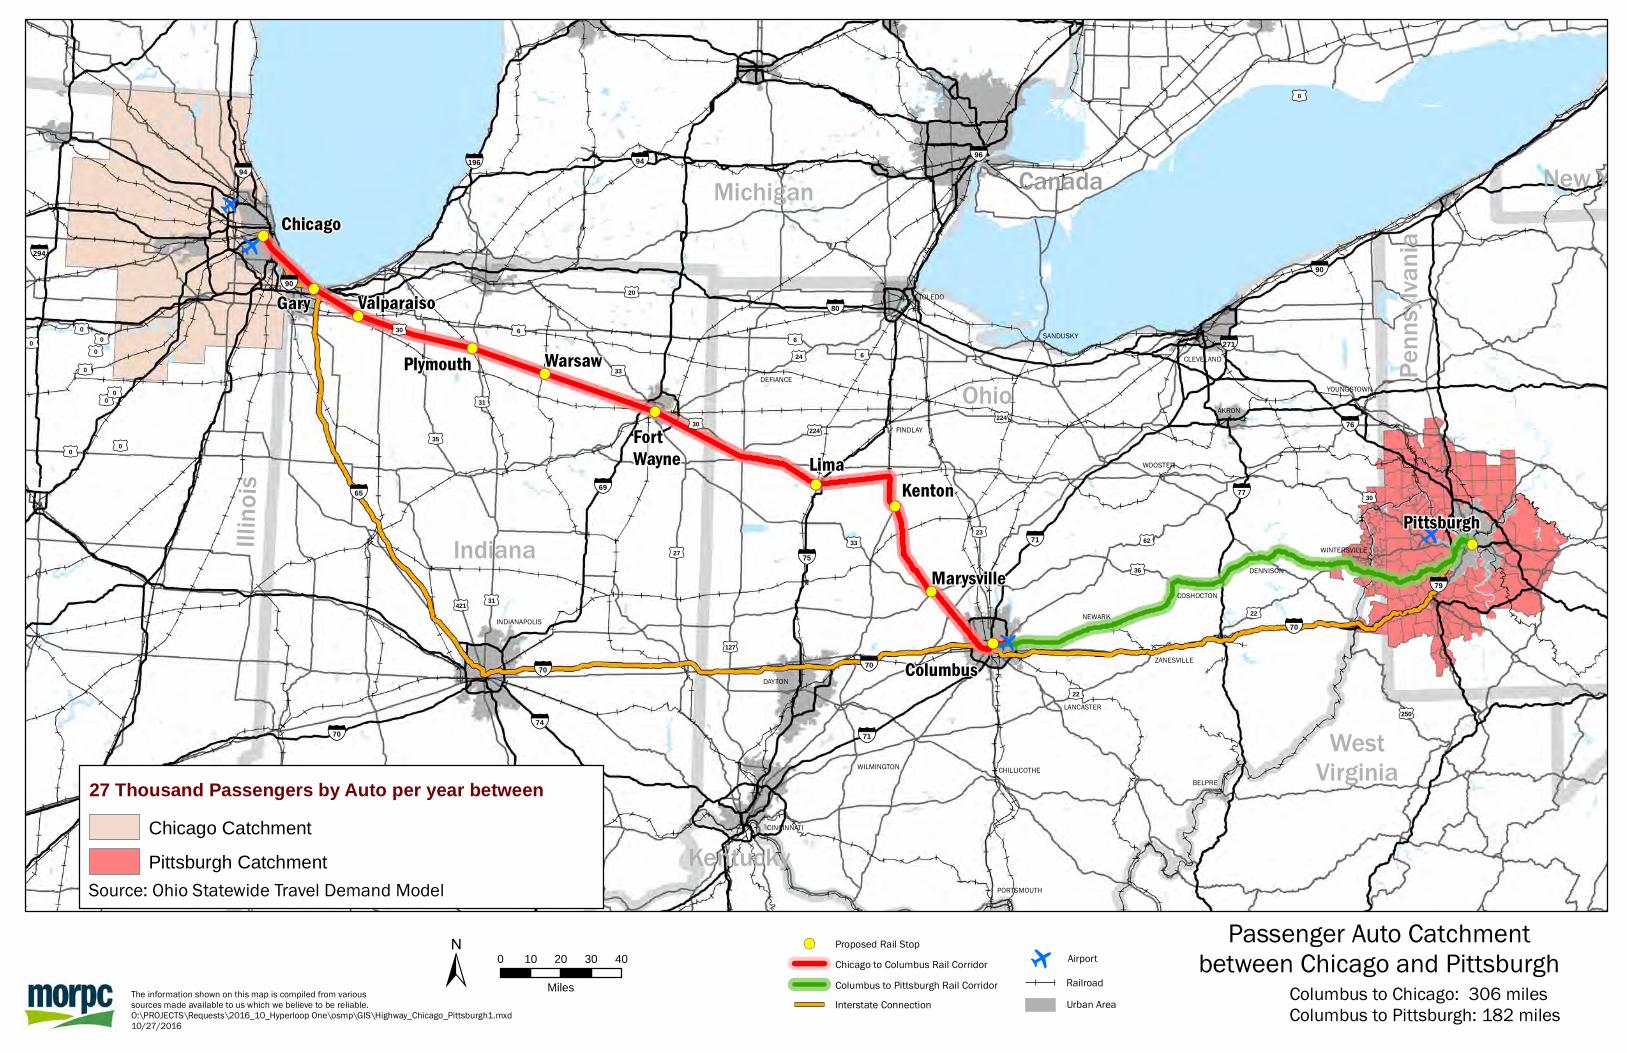
!(
!(
!(
!(
!(
!(
!(
!(
!(
!(
!(
o
o
o
o
New York
Penn
sylva
nia
Indiana
Ohio
Illino
is
WestVirginia
Kentucky
MichiganChicago
FortWayne
Gary
Plymouth
Valparaiso
Warsaw
Columbus
KentonLima
Marysville
Pittsburgh
§̈¦90
§̈¦71
§̈¦294
§̈¦70
§̈¦69
§̈¦96
§̈¦94
§̈¦71
§̈¦70
§̈¦70
§̈¦196
§̈¦77
§̈¦79
§̈¦271
§̈¦80
§̈¦90
§̈¦76
§̈¦75
§̈¦65
§̈¦94
§̈¦70
§̈¦74
DEFIANCE
FINDLAY
TOLEDO
SANDUSKY
INDIANAPOLIS
WOOSTER
AKRON
CLEVELAND
DAYTON
Canada
CINCINNATI
BELPRE
COSHOCTON
DENNISON
PORTSMOUTH
YOUNGSTOWN
ZANESVILLE
WINTERSVILLE
CHILLICOTHE
NEWARK
LANCASTER
WILMINGTON
£¤22
£¤0
£¤27
£¤20
£¤22
£¤0
£¤0 £¤6
£¤0
£¤250
£¤0
£¤224
£¤30
£¤0
£¤33
£¤0
£¤0
£¤0
£¤36
£¤224
£¤6
£¤62
£¤0
£¤421 £¤31
£¤30 £¤6
£¤35£¤30
£¤24
£¤127
£¤33£¤23
£¤0
£¤31
The information shown on this map is compiled from varioussources made available to us which we believe to be reliable.O:\PROJECTS\Requests\2016_10_Hyperloop One\osmp\GIS\Highway_Chicago_Pittsburgh1.mxd10/27/2016
± 0 10 20 30 40
Miles
Passenger Auto Catchmentbetween Chicago and Pittsburgh
Columbus to Chicago: 306 milesColumbus to Pittsburgh: 182 miles
Columbus to Pittsburgh Rail CorridorChicago to Columbus Rail Corridor
RailroadUrban AreaInterstate Connection
!( Proposed Rail StopAirport
o
27 Thousand Passengers by Auto per year betweenChicago Catchment
Pittsburgh Catchment
Source: Ohio Statewide Travel Demand Model
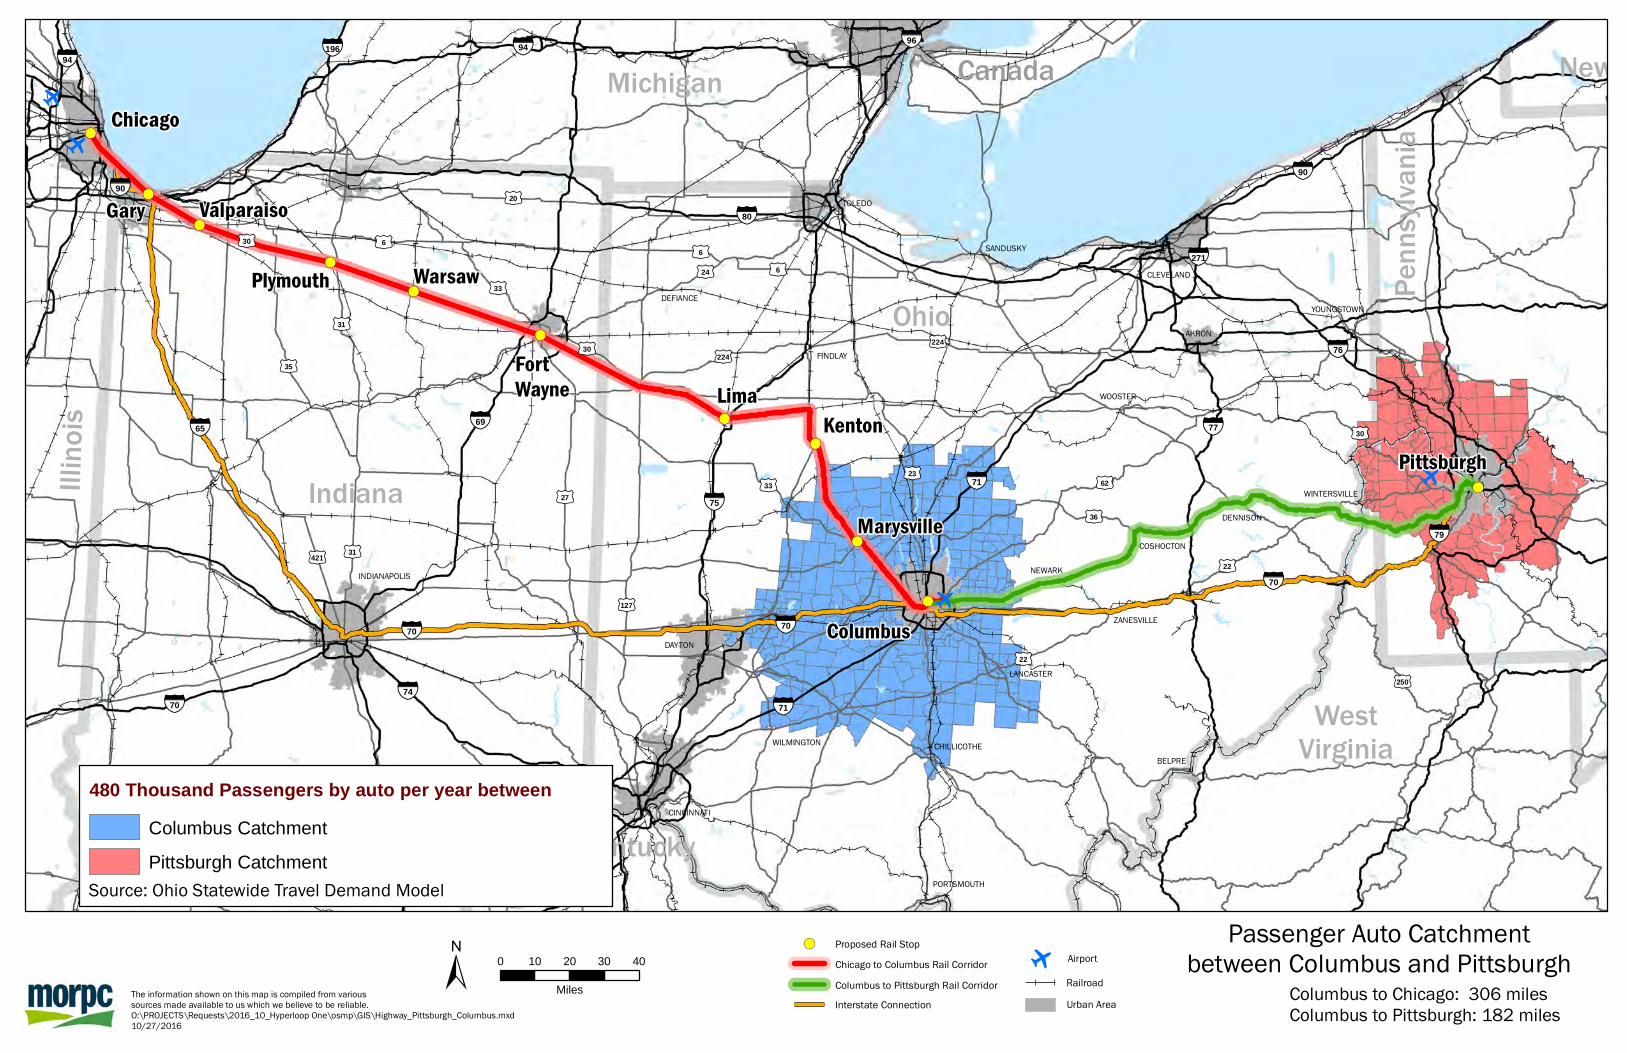
!(
!(
!(
!(
!(
!(
!(
!(
!(
!(
!(
o
o
o
o
New York
Penn
sylva
nia
Indiana
Ohio
Illino
is
WestVirginia
Kentucky
MichiganChicago
FortWayne
Gary
Plymouth
Valparaiso
Warsaw
Columbus
KentonLima
Marysville
Pittsburgh
§̈¦90
§̈¦71
§̈¦70
§̈¦69
§̈¦96
§̈¦94
§̈¦71
§̈¦70
§̈¦70
§̈¦196
§̈¦77
§̈¦79
§̈¦271
§̈¦80
§̈¦90
§̈¦76
§̈¦75
§̈¦65
§̈¦94
§̈¦70
§̈¦74
DEFIANCE
FINDLAY
TOLEDO
SANDUSKY
INDIANAPOLIS
WOOSTER
AKRON
CLEVELAND
DAYTON
Canada
CINCINNATI
BELPRE
COSHOCTON
DENNISON
PORTSMOUTH
YOUNGSTOWN
ZANESVILLE
WINTERSVILLE
CHILLICOTHE
NEWARK
LANCASTER
WILMINGTON
£¤22
£¤27
£¤20
£¤22
£¤6
£¤250
£¤224
£¤30
£¤33
£¤36
£¤224
£¤6
£¤62
£¤421 £¤31
£¤30 £¤6
£¤35£¤30
£¤24
£¤127
£¤33£¤23
£¤31
The information shown on this map is compiled from varioussources made available to us which we believe to be reliable.O:\PROJECTS\Requests\2016_10_Hyperloop One\osmp\GIS\Highway_Pittsburgh_Columbus.mxd10/27/2016
± 0 10 20 30 40
Miles
Passenger Auto Catchmentbetween Columbus and Pittsburgh
Columbus to Chicago: 306 milesColumbus to Pittsburgh: 182 miles
Columbus to Pittsburgh Rail CorridorChicago to Columbus Rail Corridor
RailroadUrban AreaInterstate Connection
!( Proposed Rail StopAirport
o
480 Thousand Passengers by auto per year betweenColumbus Catchment
Pittsburgh Catchment
Source: Ohio Statewide Travel Demand Model
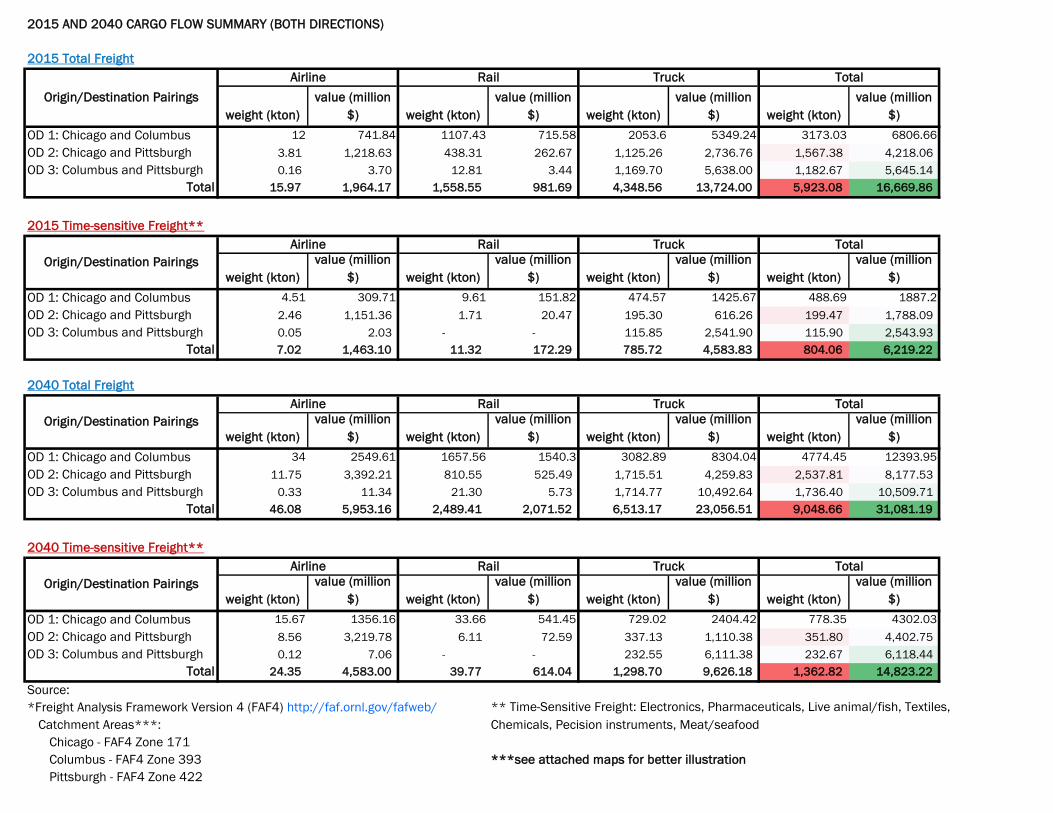
2015 AND 2040 CARGO FLOW SUMMARY (BOTH DIRECTIONS)
2015 Total Freight
weight (kton)
value (million
$) weight (kton)
value (million
$) weight (kton)
value (million
$) weight (kton)
value (million
$)
OD 1: Chicago and Columbus 12 741.84 1107.43 715.58 2053.6 5349.24 3173.03 6806.66
OD 2: Chicago and Pittsburgh 3.81 1,218.63 438.31 262.67 1,125.26 2,736.76 1,567.38 4,218.06
OD 3: Columbus and Pittsburgh 0.16 3.70 12.81 3.44 1,169.70 5,638.00 1,182.67 5,645.14
Total 15.97 1,964.17 1,558.55 981.69 4,348.56 13,724.00 5,923.08 16,669.86
2015 Time-sensitive Freight**
weight (kton)
value (million
$) weight (kton)
value (million
$) weight (kton)
value (million
$) weight (kton)
value (million
$)
OD 1: Chicago and Columbus 4.51 309.71 9.61 151.82 474.57 1425.67 488.69 1887.2
OD 2: Chicago and Pittsburgh 2.46 1,151.36 1.71 20.47 195.30 616.26 199.47 1,788.09
OD 3: Columbus and Pittsburgh 0.05 2.03 - - 115.85 2,541.90 115.90 2,543.93
Total 7.02 1,463.10 11.32 172.29 785.72 4,583.83 804.06 6,219.22
2040 Total Freight
weight (kton)
value (million
$) weight (kton)
value (million
$) weight (kton)
value (million
$) weight (kton)
value (million
$)
OD 1: Chicago and Columbus 34 2549.61 1657.56 1540.3 3082.89 8304.04 4774.45 12393.95
OD 2: Chicago and Pittsburgh 11.75 3,392.21 810.55 525.49 1,715.51 4,259.83 2,537.81 8,177.53
OD 3: Columbus and Pittsburgh 0.33 11.34 21.30 5.73 1,714.77 10,492.64 1,736.40 10,509.71
Total 46.08 5,953.16 2,489.41 2,071.52 6,513.17 23,056.51 9,048.66 31,081.19
2040 Time-sensitive Freight**
weight (kton)
value (million
$) weight (kton)
value (million
$) weight (kton)
value (million
$) weight (kton)
value (million
$)
OD 1: Chicago and Columbus 15.67 1356.16 33.66 541.45 729.02 2404.42 778.35 4302.03
OD 2: Chicago and Pittsburgh 8.56 3,219.78 6.11 72.59 337.13 1,110.38 351.80 4,402.75
OD 3: Columbus and Pittsburgh 0.12 7.06 - - 232.55 6,111.38 232.67 6,118.44
Total 24.35 4,583.00 39.77 614.04 1,298.70 9,626.18 1,362.82 14,823.22
Source:
*Freight Analysis Framework Version 4 (FAF4) http://faf.ornl.gov/fafweb/
Catchment Areas***:
Chicago - FAF4 Zone 171
Columbus - FAF4 Zone 393 ***see attached maps for better illustration
Pittsburgh - FAF4 Zone 422
Origin/Destination Pairings
Origin/Destination Pairings
** Time-Sensitive Freight: Electronics, Pharmaceuticals, Live animal/fish, Textiles,
Chemicals, Pecision instruments, Meat/seafood
Origin/Destination Pairings
Origin/Destination Pairings
Airline Rail Truck Total
Airline Rail Truck Total
Airline Rail Truck Total
Airline Rail Truck Total
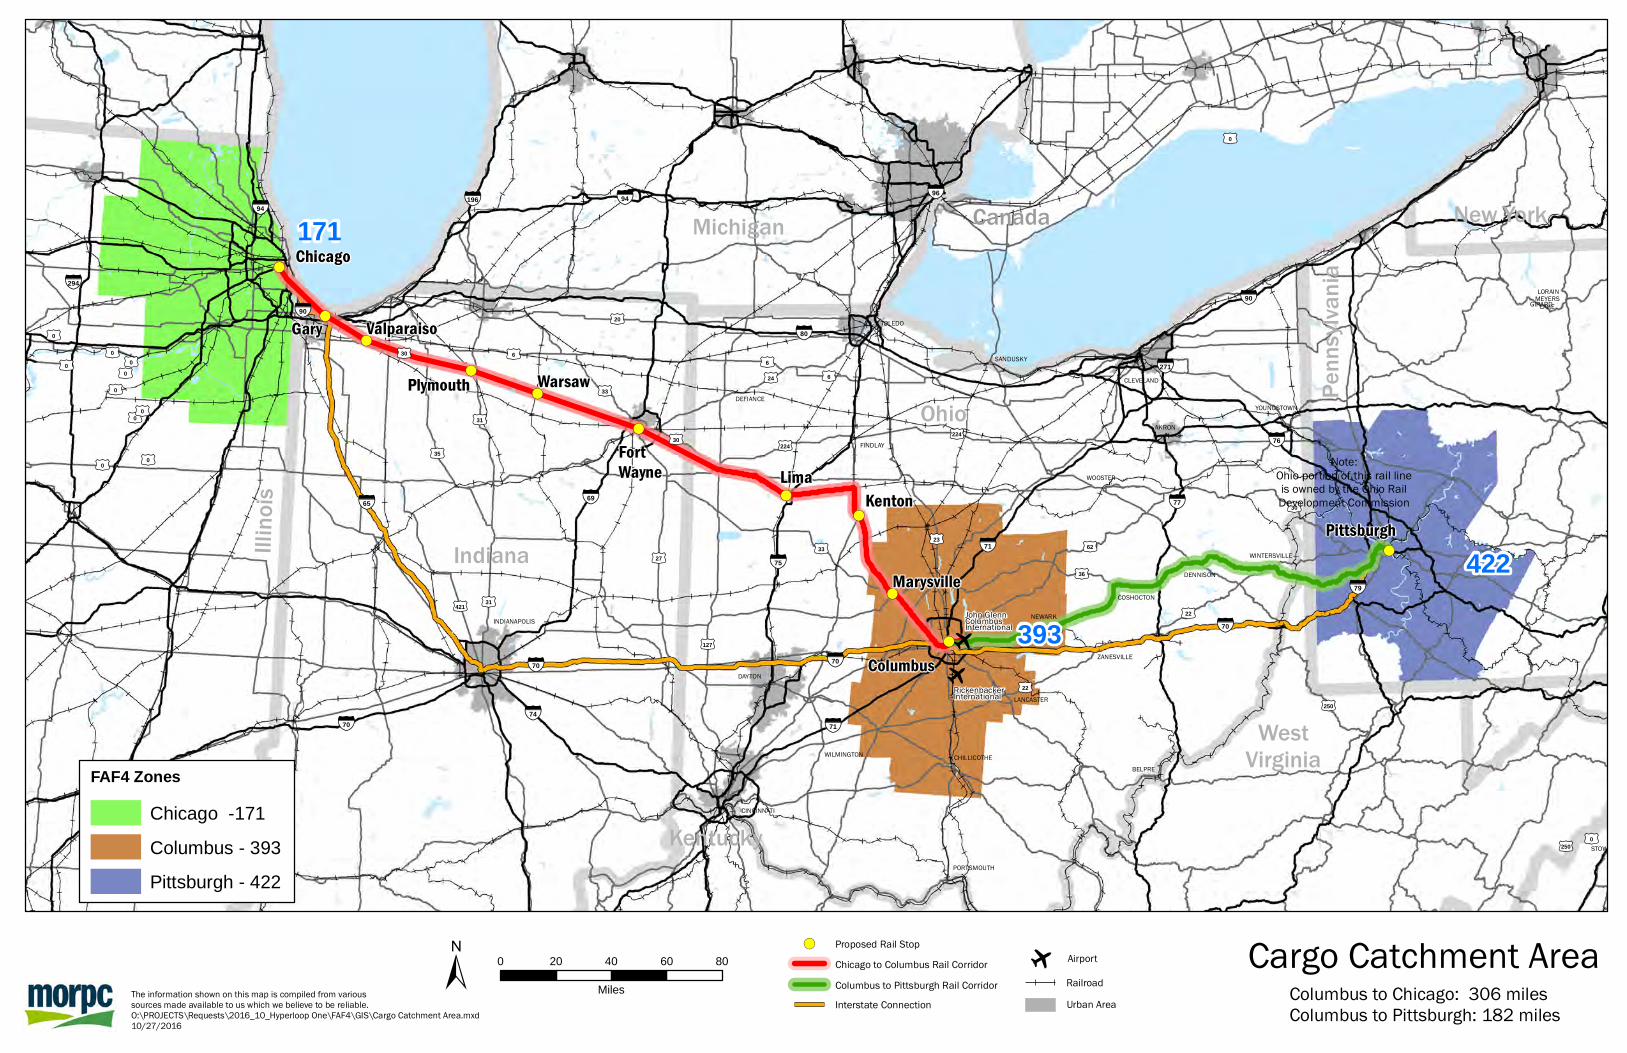
!(
!(
!(
!(
!(
!(
!(
!(
!(
!(
!(
o
o
New York
Penn
sylva
nia
Indiana
Ohio
Illino
is
West Virginia
WestVirginia
Kentucky
MichiganChicago
FortWayne
Gary
Plymouth
Valparaiso
Warsaw
Columbus
KentonLima
Marysville
Pittsburgh
§̈¦90
§̈¦71
§̈¦294
§̈¦70
§̈¦69
§̈¦96
§̈¦94
§̈¦71
§̈¦70
§̈¦70
§̈¦196
§̈¦77
§̈¦79
§̈¦271
§̈¦80
§̈¦90
§̈¦76
§̈¦75
§̈¦65
§̈¦94
§̈¦70
§̈¦74
John GlennColumbus International
RickenbackerInternational
DEFIANCE
FINDLAY
TOLEDO
SANDUSKY
INDIANAPOLIS
WOOSTER
MEYERSLAKE
AKRON
STOW
GIRARD
CLEVELAND
DAYTON
Canada
GOLFMANOR
CINCINNATI
BELPRE
COSHOCTON
DENNISON
PORTSMOUTH
YOUNGSTOWN
ZANESVILLE
WINTERSVILLE
CHILLICOTHE
LORAIN
NEWARK
LANCASTER
WILMINGTON
£¤22
£¤0
£¤27
£¤20
£¤22
£¤0
£¤0 £¤6
£¤0
£¤250
£¤250
£¤0
£¤224
£¤30
£¤0
£¤33
£¤0
£¤0
£¤0
£¤36
£¤224
£¤6
£¤62
£¤0
£¤421
£¤0
£¤31
£¤30 £¤6
£¤35£¤30
£¤24
£¤127
£¤33£¤23
£¤0
£¤31
422
393
171
The information shown on this map is compiled from varioussources made available to us which we believe to be reliable.O:\PROJECTS\Requests\2016_10_Hyperloop One\FAF4\GIS\Cargo Catchment Area.mxd10/27/2016
± 0 20 40 60 80
Miles
Cargo Catchment AreaColumbus to Chicago: 306 milesColumbus to Pittsburgh: 182 miles
Columbus to Pittsburgh Rail CorridorChicago to Columbus Rail Corridor
RailroadUrban AreaInterstate Connection
!( Proposed Rail Stop o
Airport
Note:Ohio portion of this rail lineis owned by the Ohio RailDevelopment Commission
FAF4 ZonesChicago -171
Columbus - 393
Pittsburgh - 422
Appendix IV Memorandums of Agreement
October 28, 2016
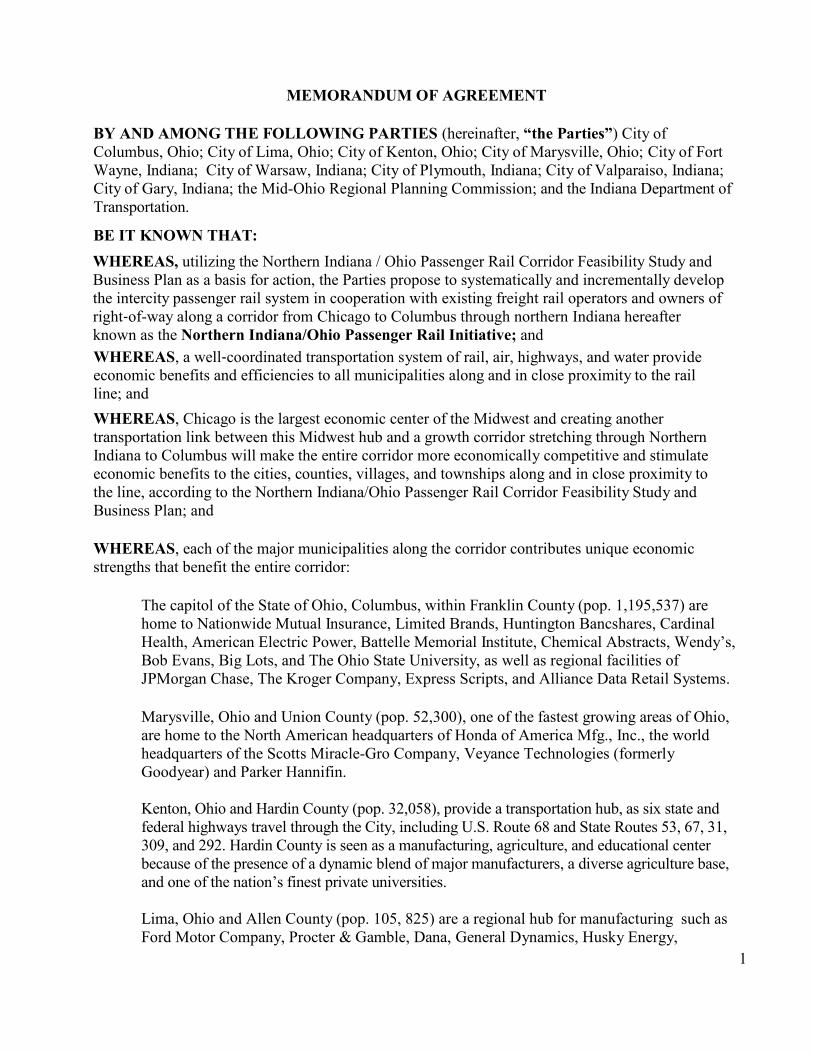
MEMORANDUM OF AGREEMENT
BY AND AMONG THE FOLLOWING PARTIES (hereinafter, “the Parties”) City of Columbus, Ohio; City of Lima, Ohio; City of Kenton, Ohio; City of Marysville, Ohio; City of Fort Wayne, Indiana; City of Warsaw, Indiana; City of Plymouth, Indiana; City of Valparaiso, Indiana; City of Gary, Indiana; the Mid-Ohio Regional Planning Commission; and the Indiana Department of Transportation.
BE IT KNOWN THAT: WHEREAS, utilizing the Northern Indiana / Ohio Passenger Rail Corridor Feasibility Study and Business Plan as a basis for action, the Parties propose to systematically and incrementally develop the intercity passenger rail system in cooperation with existing freight rail operators and owners of right‐of-way along a corridor from Chicago to Columbus through northern Indiana hereafter known as the Northern Indiana/Ohio Passenger Rail Initiative; and WHEREAS, a well‐coordinated transportation system of rail, air, highways, and water provide economic benefits and efficiencies to all municipalities along and in close proximity to the rail line; and WHEREAS, Chicago is the largest economic center of the Midwest and creating another transportation link between this Midwest hub and a growth corridor stretching through Northern Indiana to Columbus will make the entire corridor more economically competitive and stimulate economic benefits to the cities, counties, villages, and townships along and in close proximity to the line, according to the Northern Indiana/Ohio Passenger Rail Corridor Feasibility Study and Business Plan; and
WHEREAS, each of the major municipalities along the corridor contributes unique economic strengths that benefit the entire corridor:
The capitol of the State of Ohio, Columbus, within Franklin County (pop. 1,195,537) are home to Nationwide Mutual Insurance, Limited Brands, Huntington Bancshares, Cardinal Health, American Electric Power, Battelle Memorial Institute, Chemical Abstracts, Wendy’s, Bob Evans, Big Lots, and The Ohio State University, as well as regional facilities of JPMorgan Chase, The Kroger Company, Express Scripts, and Alliance Data Retail Systems.
Marysville, Ohio and Union County (pop. 52,300), one of the fastest growing areas of Ohio, are home to the North American headquarters of Honda of America Mfg., Inc., the world headquarters of the Scotts Miracle-Gro Company, Veyance Technologies (formerly Goodyear) and Parker Hannifin.
Kenton, Ohio and Hardin County (pop. 32,058), provide a transportation hub, as six state and federal highways travel through the City, including U.S. Route 68 and State Routes 53, 67, 31, 309, and 292. Hardin County is seen as a manufacturing, agriculture, and educational center because of the presence of a dynamic blend of major manufacturers, a diverse agriculture base, and one of the nation’s finest private universities.
Lima, Ohio and Allen County (pop. 105, 825) are a regional hub for manufacturing such as Ford Motor Company, Procter & Gamble, Dana, General Dynamics, Husky Energy,
1
Ashland Chemicals, PCS Nitrogen, Ineos, Linde, American Trim and Metokote.
Fort Wayne, Indiana and Allen County (pop. 355,329) offer cultural attractions, arts, and theater that rival those of the United States' larger metropolitan cities. Attractions such as Fort Wayne Children’s Zoo, Science Central, and Tin Caps minor league baseball offer something for everyone. The city is home to Fortune 500 Company Steel Dynamics, Inc. and numerous other manufacturing-related businesses.
Warsaw, Indiana and Kosciusko County (pop. 77,609) are home to many prominent orthopedic companies including DePuy, Zimmer / Biomet, and Medtronic, totaling $11 billion in annual sales, representing 1/3 of the world's orthopedics sales volume, and representing an employment base of 13,000 direct and indirect jobs. Grace College & Seminary in Winona Lake offers its 1,600 students a diverse environment with high academic standards in over 60 majors.
Plymouth, Indiana and Marshall County (pop. 47,024) have the advantage of being centrally located between Chicago, Indianapolis, and Detroit. With its small town feel and big city proximity, it is the perfect location to call home or to locate a business. Internationally- recognized Culver Academies, hosting secondary students from 19 countries and 41 states, is the largest single employer within Marshall County.
Valparaiso, Indiana and Porter County (pop. 165,682) are located in the northwest corner of the state and are considered part of the Chicago Metropolitan area. Valparaiso University, an independent Lutheran, liberal arts institution with 3,000 undergraduates and 1,000 law and graduate students from most U.S. states and 50 countries, calls the city home.
Gary, Indiana and Lake County, Indiana (pop. 80,294) are located in the southeastern portion of the Chicago metropolitan area. Gary, known for its steel-manufacturing legacy, seeks to capitalize on its proximity to the Midwest region's economic core with a major public - private development partnership centered on the Gary - Chicago International Airport.
WHEREAS, there are 141 institutions of higher education located within 25 miles of the railheads designated in the Feasibility Study and Business Plan for the passenger rail corridor, and there are more than 896,000 students enrolled at these 141 institutions; and
WHEREAS, an economically vibrant Midwest will provide a higher quality of life for its residents; and
WHEREAS, the passenger rail corridor, in cooperation with the owners of the existing rail right‐of‐way, would accommodate both future high speed passenger rail and freight rail service within the corridor by utilizing and improving the existing track configuration and rail crossings; and
WHEREAS, it is the intent and purpose of this Agreement to continue to cultivate a working relationship among the parties to facilitate the development and implementation of passenger rail service, and to plan for future integration of the Northern Indiana / Ohio Corridor into a larger regional and national passenger rail network; and
WHEREAS, high speed rail encourages higher‐density, mixed‐use development at or near
2
stations, improves business productivity, expands visitor opportunities, broadens regional labor markets, and helps support the growth of technology clusters, according to the U.S. Conference of Mayors report, “The Economic Impacts of High Speed Rail on Cities and their Metropolitan Areas”; and
WHEREAS, the Parties propose to act in partnership with the Federal Railroad Administration (FRA) in advancing the development of an inter‐city passenger rail corridor on existing right‐of‐way linking several communities in the states of Ohio, Indiana, and Illinois; and
WHEREAS, it is necessary for municipal and county governmental and regional planning jurisdictions in the three States to jointly undertake and coordinate a variety of tasks in order to realize the objective of creating an inter‐city passenger rail corridor mutually benefitting the constituencies served by such governments and planning authorities; and
WHEREAS, significant interstate, regional and inter‐local cooperation will be required to coordinate the planning and predevelopment of high speed passenger rail service within this corridor, including tasks of procuring and administering grants; acquiring allocations from the States or from political subdivisions of the States, or from the Federal government; soliciting assistance from private corporations and from other organizations both public and private; and
WHEREAS, the Parties are or may be involved, individually or collectively, in the planning and funding, of inter‐city passenger rail transportation services within the corridor, including linkages between surface and air transportation modes; and
WHEREAS, one or more of the Parties or a consortium of the Parties may subsequently agree to collaborate to make available such administrative and coordinating support as may be necessary to the successful fulfillment of the purposes of this Agreement;
NOW THEREFORE, BE IT RESOLVED: That the Parties will cooperate with each other in order to enable a Tier One Environmental Impact Study (EIS) and related documents as required by regulations adopted and published by the FRA, and as required by the FRA for their approval of inter‐city passenger rail corridors, and to proceed with the EIS at the earliest opportunity;
AND IN FURTHERANCE OF THAT RESOLUTION, THE PARTIES AGREE:
(1) To cooperate in such joint budgeting, fund‐raising, appropriation and procurement activities as may be necessary to obtain the planning, environmental, engineering, and operational analyses required by the FRA for completion of a Tier One EIS;
(2) To explore the funding needed for the Tier One EIS process and to determine in a fair manner the amount needed from each participating jurisdiction hereafter by the Parties and specified in a separate agreement;
(3) To participate together with representatives of the Parties in such planning, coordinating, and decision‐making activities as may be required from time to time, particularly to guide the bid and contractor selection process, and to manage, evaluate, and complete the EIS;
(4) To furnish such information whether to the Parties in their collective capacity, to the EIS contractor, or to the FRA, as may be necessary for the completion of the various analyses required by the Tier One EIS process;
(5) To endeavor in good faith to secure funding, consistent with and in accordance with the 3
schedule and project expenditure plan as approved by the Parties in their collective capacity; (6) To coordinate the creation and distribution of education and outreach materials to be used to
gain support for the continuation of the project; (7) That the Parties of the Northern Indiana/Ohio Corridor and appropriate partners will
coordinate fundraising using a mutually agreed‐upon strategy. In the event that funding for the program is constrained by statute, rescission of existing law, change in funding requirements or eligibility; or reduction in identified funding levels or availability, the Parties and any partners shall take steps to notify each other as needed in a timely manner;
(8) To explore the establishment of a management structure for the project, governed by a board of directors appointed by the Parties, to serve as the project manager and provide advocacy, branding, fundraising, and project development and execution on behalf of the parties.
(9) This MOA constitutes the entire agreement among the parties, and no changes or modifications to this MOA shall be made unless agreed to by all parties to this MOA in writing; and
(10) Upon consent of the original parties to the MOA, additional parties may become signatories to the MOA.
This Memorandum of Agreement is approved by:
Name Title/Organization Date
4

This page intentionally left blank
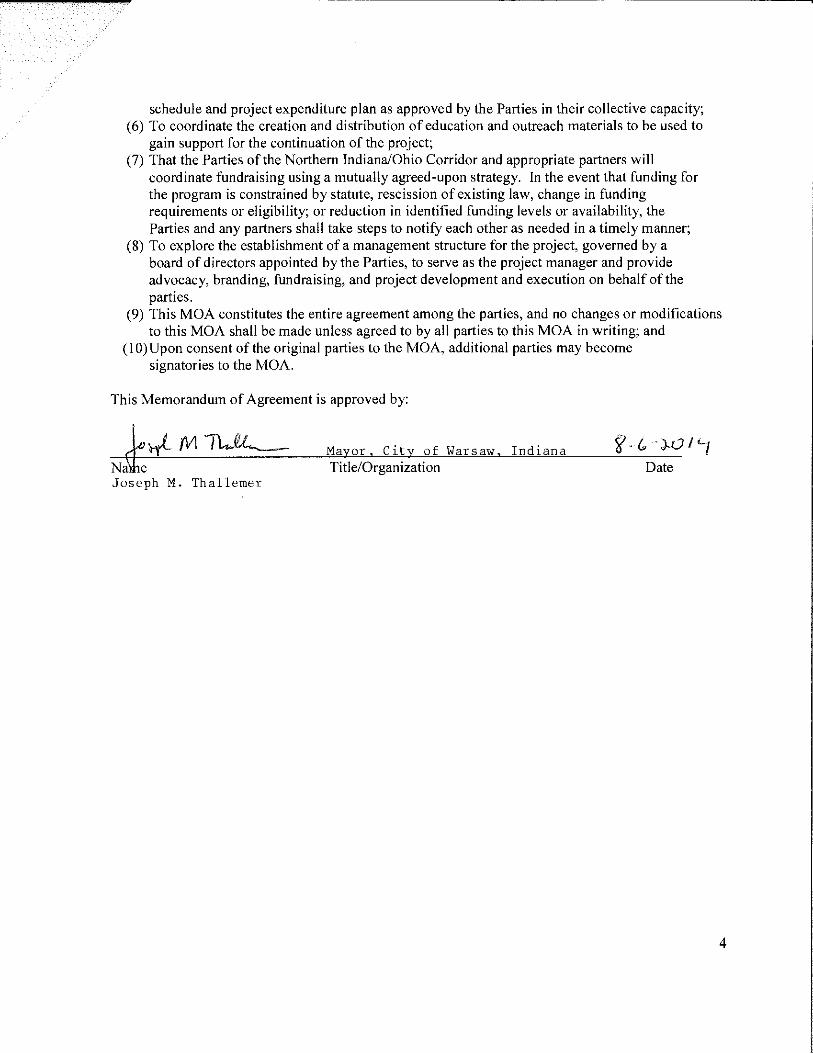
RESOLUTION NO. ILI-oIOt A RESOLUTION AUTHORIZING THE CITY OF KENTON, OHIO TO ENTER INTO A MEMORANDUM OF AGREEMENT FOR THE PARTICIPATION IN THE NORTHERN INDIANA/OHIO PASSENGER RAIL INITIATIVE AND DECLARING AN EMERGENCY.
WHEREAS, in conjunction with the City of Kenton, Ohio, the City of Columbus, Ohio,
City of Lima, Ohio, City of Marysville, Ohio, City of Fort Wayne, Indiana, City of Warsaw,
Indiana, City of Plymouth, Indiana, City of Valparaiso, Indiana, City of Gary, Indiana, and the
Mid-Ohio Regional Planning Commission have proposed to systematically and incrementally
develop a intercity passenger rail system in cooperation with existing fright rail operators and
owners of right-of-way along a corridor from Chicago to Columbus through northern Indiana
(the "Northern Indiana/Ohio Passenger Rail Initiative");
WHEREAS, a passenger rail corridor established by the Northern Indiana/Ohio
Passenger Rail Initiative would, in cooperation with the owners of the existing rail right-of-way,
accommodate both future high speed passenger rail and freight rail service within the corridor by
utilizing and improving the existing track configuration and rail crossings;
WHEREAS, the above-mentioned parties desire to enter into a Memorandum of
Agreement to continue to cultivate a working relationship among the parties and the Federal
Railroad Administration to facilitate the development and implementation of passenger rail
service and to plan for future integration of the Northern Indiana/Ohio Corridor into a larger
regional and national rail network; and
WHEREAS, the Council of the City of Kenton now desires to enter into this Resolution
to approve the Memorandum of Agreement and authorize the Mayor to execute the
Memorandum ofAgreement.
NOW, THEREFORE, BE IT RESOLVED by the Council ofthe City ofKenton, Ohio:
SECTION 1. That the Council hereby authorizes the City of Kenton to enter into a
Memorandum of Agreement in substantially the form attached hereto as Exhibit A and the
Mayor be and is hereby authorized and directed to execute the above described agreement.
SECTION II. This Resolution shall be an emergency measure for the immediate and
best protection of the public peace, health, safety, and welfare, the particular emergency being
the need to timely coordinate and participate in the Northern Indiana/Ohio Passenger Rail
Initiative. Therefore, if passed by the requisite two-thirds of all members elected to Council, this
Resolution shall be in force and effect from and after its approval by the Mayor; otherwise, from
and after the earliest period allowed by law.
,2014.
Pre
Clerk
~ka:-\:-,--H<.=~"t-"ffa~sL-=---__---" 2014.
~ Editor's Note Randy Mann, Mayor
Editor's Note, Thomas Henry, Mayor, City of Fort Wayne
4
schedule and project expenditure plan as approved by the Parties in their collective capacity;
(6) To coordinate the creation and distribution of education and outreach materials to be used to
gain support for the continuation of the project;
(7) That the Parties of the Northern Indiana/Ohio Corridor and appropriate partners will
coordinate fundraising using a mutually agreed‐upon strategy. In the event that funding for
the program is constrained by statute, rescission of existing law, change in funding
requirements or eligibility; or reduction in identified funding levels or availability, the
Parties and any partners shall take steps to notify each other as needed in a timely manner;
(8) To explore the establishment of a management structure for the project, governed by a
board of directors appointed by the Parties, to serve as the project manager and provide
advocacy, branding, fundraising, and project development and execution on behalf of the
parties.
(9) This MOA constitutes the entire agreement among the parties, and no changes or modifications
to this MOA shall be made unless agreed to by all parties to this MOA in writing; and
(10) Upon consent of the original parties to the MOA, additional parties may become
signatories to the MOA.
This Memorandum of Agreement is approved by:
Mayor, City of Columbus 9/5/2014
Name Title/Organization Date
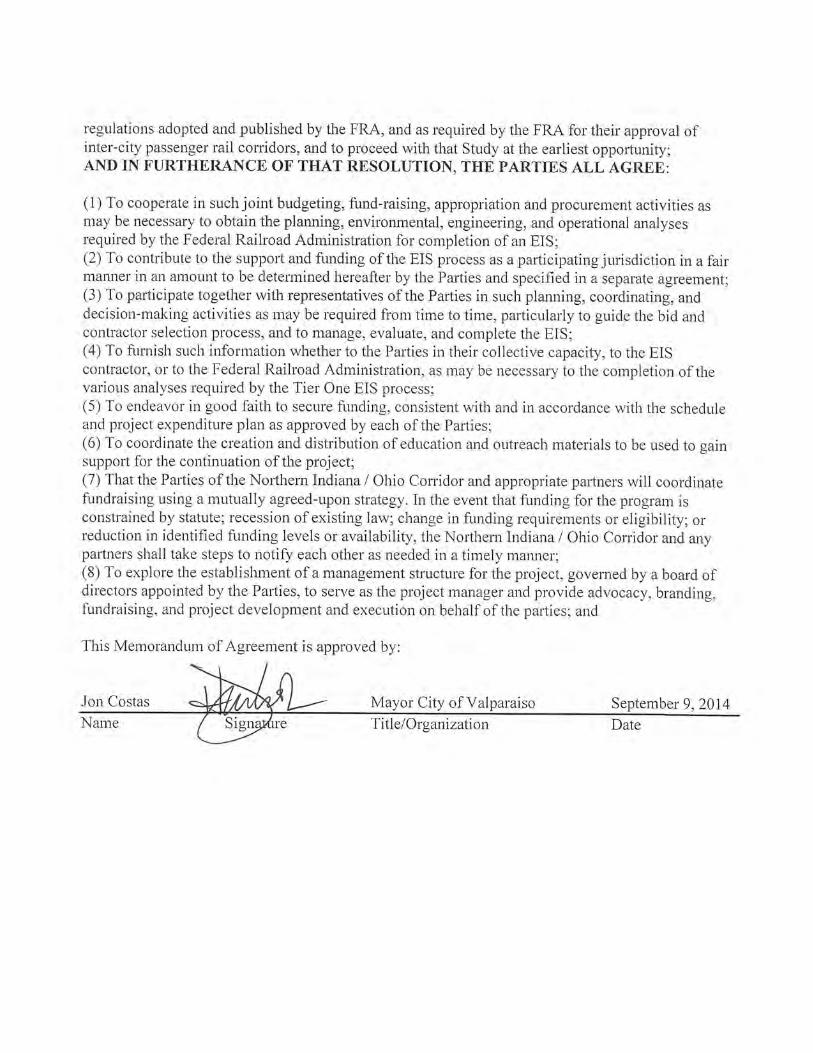
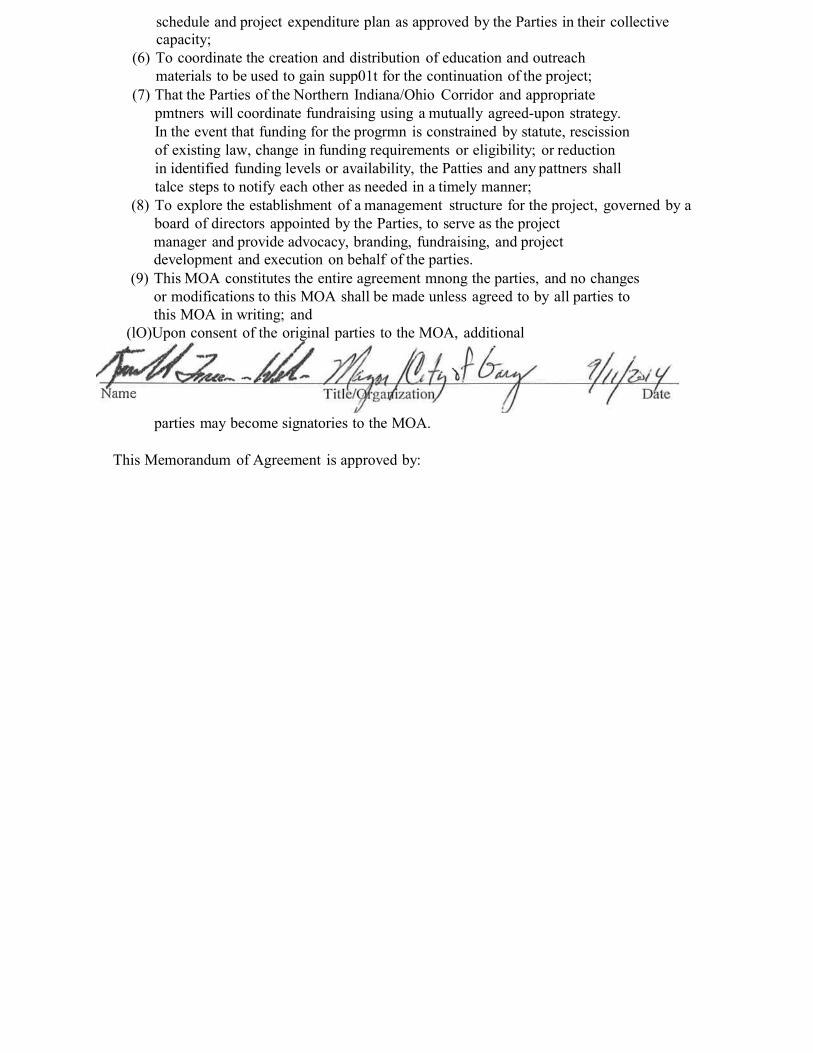
schedule and project expenditure plan as approved by the Parties in their collective capacity;
(6) To coordinate the creation and distribution of education and outreach materials to be used to gain supp01t for the continuation of the project;
(7) That the Parties of the Northern Indiana/Ohio Corridor and appropriate pmtners will coordinate fundraising using a mutually agreed-upon strategy. In the event that funding for the progrmn is constrained by statute, rescission of existing law, change in funding requirements or eligibility; or reduction in identified funding levels or availability, the Patties and any pattners shall talce steps to notify each other as needed in a timely manner;
(8) To explore the establishment of a management structure for the project, governed by a board of directors appointed by the Parties, to serve as the project manager and provide advocacy, branding, fundraising, and project development and execution on behalf of the parties.
(9) This MOA constitutes the entire agreement mnong the parties, and no changes or modifications to this MOA shall be made unless agreed to by all parties to this MOA in writing; and
(lO)Upon consent of the original parties to the MOA, additional
parties may become signatories to the MOA.
This Memorandum of Agreement is approved by:
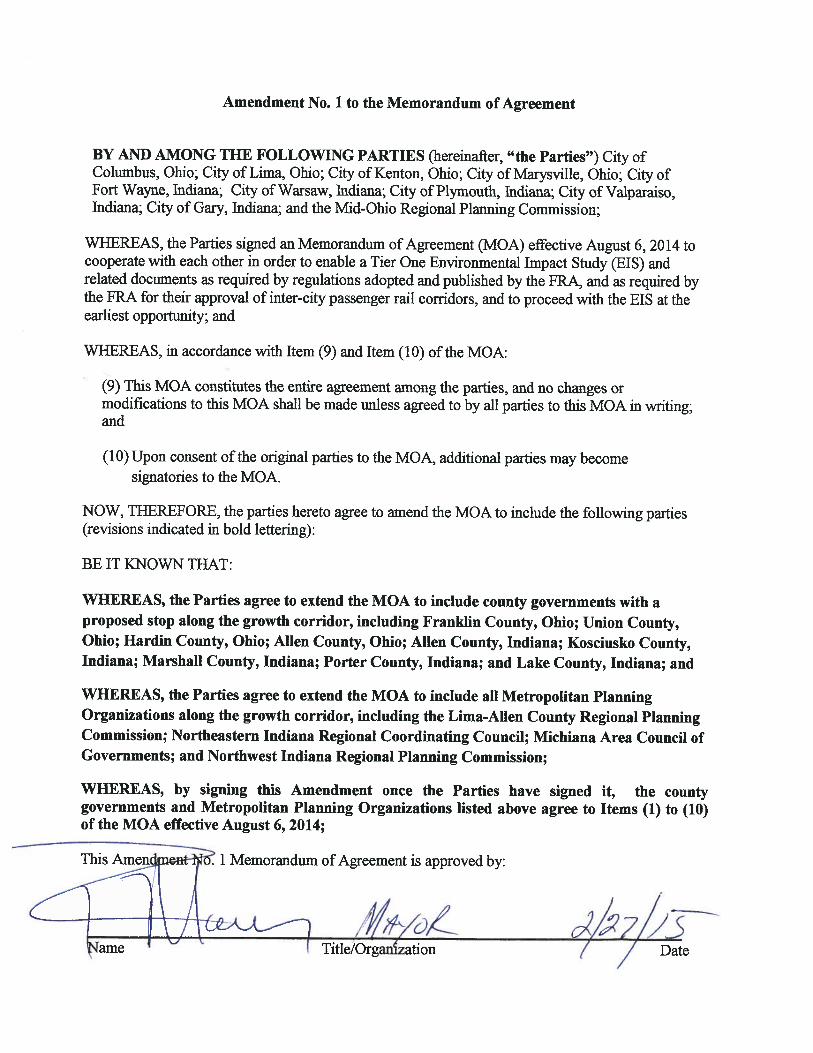
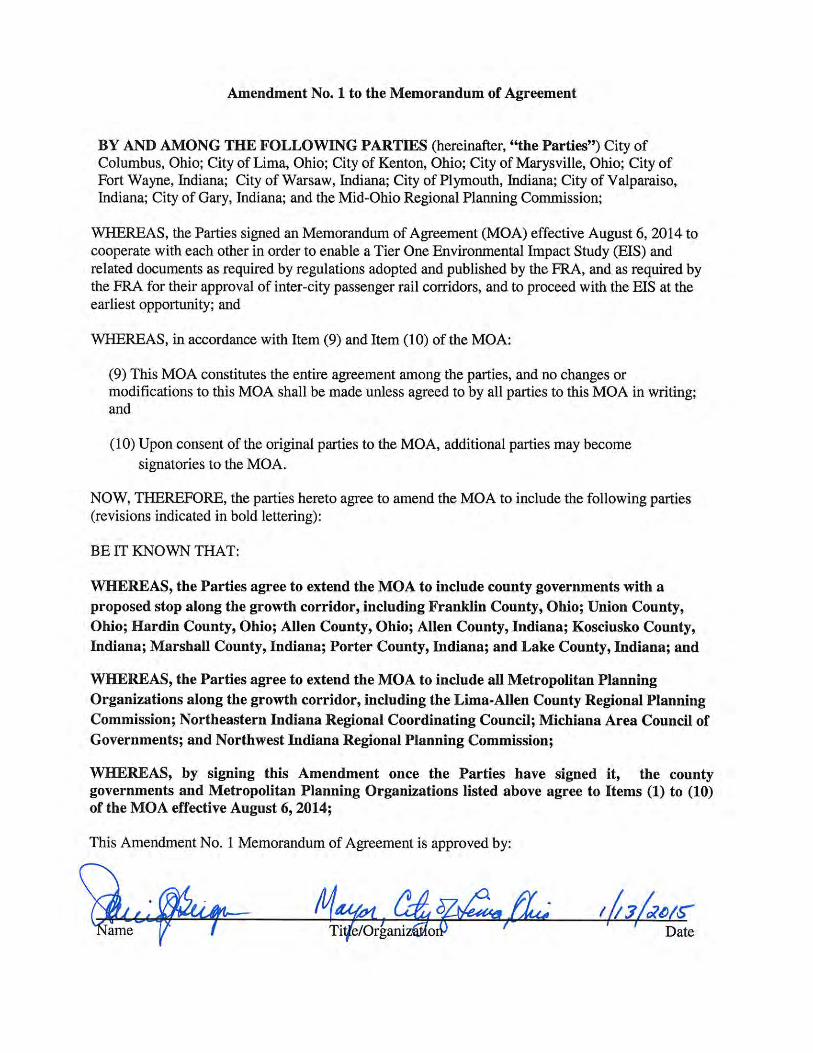
Top Related