


Languages
Pages
Legal


MERCER ASIA PACIFIC CONSUMER GOODS TOTAL REMUNERATION AND BENEFITS SURVEYS
2
MERCER CONSUMER GOODS TOTAL REMUNERATION
CONSIDER THESE QUESTIONS Do you have an easy-to-use source for comparing your company’s compensation and benefits against that of
your competitors?
Are you able to evaluate the competitive position of each of your total remuneration elements?
Is your compensation mix for sales employees competitive?
Is your pay strategy consistent, ensuring external competitiveness whilst maintaining internal equity?
Are you able to generate instant, automated and fully customized comparisons of your organization against the market?
OBTAIN THE RIGHT SOLUTIONBe part of Mercer Consumer Goods Total Remuneration Survey (TRS) and get access to reliable, up-to-date
competitive in the marketplace.
Mercer Consumer Goods Total Remuneration Survey (TRS) database provides you with consistent, accurate and high quality market data with a coverage of over 480,000 data points, more than 1400 Consumer Goods entities providing a database of over 3,000 benchmark jobs across more than 50 job families.
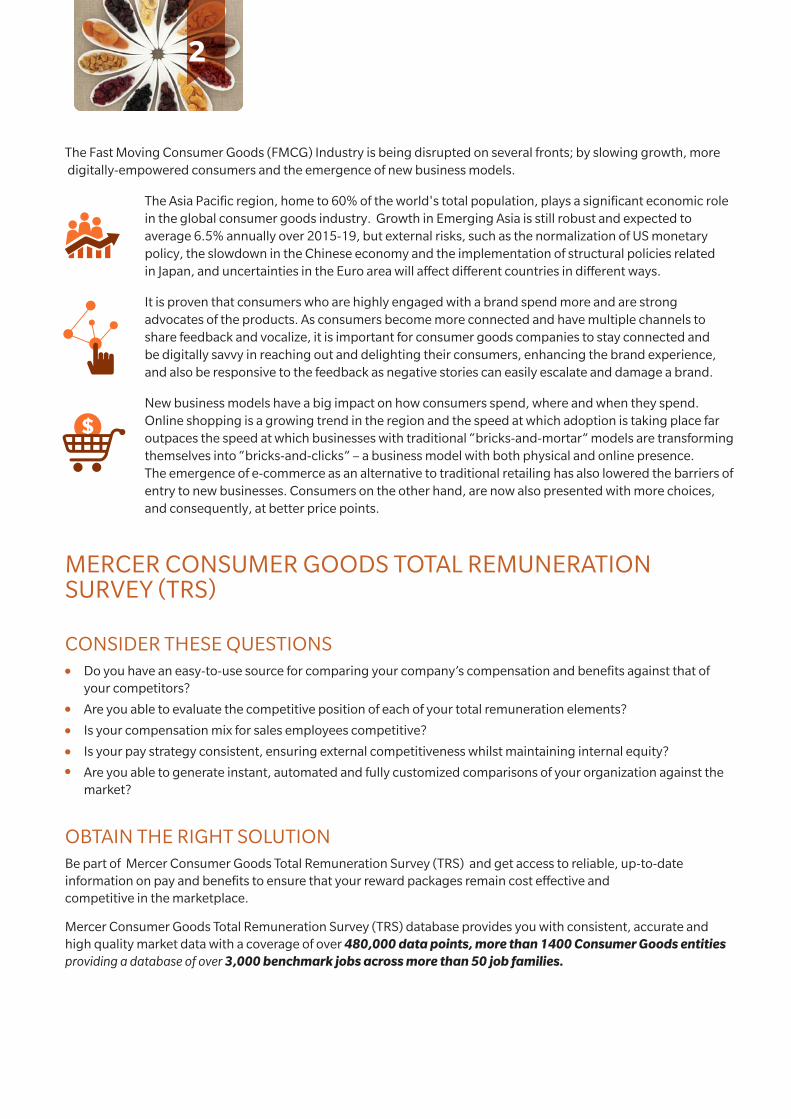
The Fast Moving Consumer Goods (FMCG) Industry is being disrupted on several fronts; by slowing growth, more digitally-empowered consumers and the emergence of new business models.
The Asia Pacific region, home to 60% of the world's total population, plays a significant economic role in the global consumer goods industry. Growth in Emerging Asia is still robust and expected to average 6.5% annually over 2015-19, but external risks, such as the normalization of US monetary policy, the slowdown in the Chinese economy and the implementation of structural policies related
It is proven that consumers who are highly engaged with a brand spend more and are strong advocates of the products. As consumers become more connected and have multiple channels to share feedback and vocalize, it is important for consumer goods companies to stay connected and be digitally savvy in reaching out and delighting their consumers, enhancing the brand experience, and also be responsive to the feedback as negative stories can easily escalate and damage a brand.
New business models have a big impact on how consumers spend, where and when they spend. Online shopping is a growing trend in the region and the speed at which adoption is taking place far outpaces the speed at which businesses with traditional “bricks-and-mortar” models are transforming themselves into “bricks-and-clicks” – a business model with both physical and online presence. The emergence of e-commerce as an alternative to traditional retailing has also lowered the barriers of entry to new businesses. Consumers on the other hand, are now also presented with more choices, and consequently, at better price points.

3
KEY POSITIONS AND FUNCTIONS SURVEYED INCLUDE:
TOP EXECUTIVE
Head of Organization
SALES
Account Management Corporate Sales Channel Sales
Sales Administration Sales Planning Telesales
MARKETING
Advertising & Promotion Category Management Market Research
Marketing Analysis Merchandising Product/Brand Management
MANUFACTURING
Operations Machining Packaging
Production Production & Process Control Assembly
Business Process
SUPPLY & LOGISTICS
Quality Assurance Purchasing Capacity Planning
Inventory Logistics Planning Material Management
Procurement Warehousing
RETAIL
Operations Merchandising Retail Sales
CORPORATE AFFAIRS
Strategic Planning Corporate Planning Government Relations
Public Relations
HUMAN RESOURCES
Recruitment Compensation & Benefits Employee Relations
HR Administration Training & Development
RESEARCH & DEVELOPMENT
Applied Research Product Development Manufacturing/Process/Design Engineering

4
THE TABLE BELOW DEPICTS THE SCOPE BY CAREER STREAMS AND LEVELS IN MERCER TRS FRAMEWORK.
DEFINITION OF LEVEL DESCRIPTORS
PARTICIPATION IN MERCER CONSUMER GOODS TRS ENTITLES YOU TO: y Base pay, allowances, incentives and benefits information for all jobs
y Exclusive online data mining capabilities using Mercer's online tools
y Premium subscribers also have the capability to conduct peer group comparisons and to create customized reports
y Conduct analysis using various filters such as revenue, headcount, geographic responsibility and industry segment
SURVEY OVERVIEW
The survey consists of executive and non-executive compensation data for the consumer goods industry from organizations in the Food, Beverage & Tobacco, Durable, Retail and Personal Care sectors.
THE SURVEY IS CONDUCTED IN THE FOLLOWING ASIA PACIFIC LOCATIONS:
y Australia
y *Bangladesh
y China
y *Hong Kong
y India
y Indonesia
y Japan
y Malaysia
y *New Zealand
y *Pakistan
y Philippines
y Singapore
y South Korea
y *Taiwan
y Thailand
y *Vietnam
* For these countries consumer goods database is part of Mercer TRS All Industry survey.
CAREER STREAMS
CA
RE
ER
LE
VE
LS
1. Head ofOrganization
1. Executive 2. Management 3. Individual Professional 4. Para-Professional
2. Function Head
1. Senior Manager 1. Pre-eminent
2. Expert
3. Specialist
4. Senior0. Specialist
1. Senior
2. Experienced
3. Entry
5. Experienced
6. Entry
2. Manager
3. Team Leader (Professional)
3. Team Leader (Para-Professional)
3. Sub-functionHead

5
TOTAL REMUNERATION COMPONENTSThe Mercer Consumer Goods TRS provides a quantitative study that covers various cash components such as base salary, other guaranteed cash payments, short-term incentives as well as valuation of long-term incentives and benefits.
BASE SALARY (Monthly base salary times the number of months paid)
TOTAL GUARANTEED CASH COMPENSATION (Base Salary plus guaranteed allowances)
TOTAL CASH COMPENSATION (Total Guaranteed Cash Compensation plus short-term incentive, sales incentive, profit sharing, or other incentive awards)
TOTAL DIRECT COMPENSATION (Total Cash Compensation plus long-term incentive awards, valued using Black-Scholes methodology for appreciation-based awards)
TOTAL REMUNERATION (Total Direct Compensation plus benefits and perquisites)

6
MERCER WINTM
MERCER WORKFORCE INTELLIGENCE NETWORKTM
6
MERCER WORKFORCE INTELLIGENCE NETWORK®Data is delivered through Mercer Workforce Intelligence Network®
The Mercer Workforce Intelligence Network® (Mercer WIN®) is a single-point access to Mercer’s unparalleled survey data and analytics. With Mercer WIN®, you can easily retrieve and synthesize vast amounts of data into usable packets of information relating to compensation and other HR issues. To make key decisions, you no longer need to sift through reams of information stored in dozens of locations and formats. Instead, you can access the data and tools you need from a single location.
MERCER WIN® HAS POWERFUL, FLEXIBLE FEATURES THAT ENABLE YOU TO:
y Access information readily and quickly via its easy-to-use, simple and clear navigation functions
y Retrieve and compare data within and across industries, regions and countries simultaneously
y Produce multi-market refinements in one view
y Analyze and compare structure to market by job, family, career level and position class
y Generate customized charts, graphs and reports at the click of a button
y Share reports and analysis in real-time over the network
www.imercer.com/win
MERCER WIN®
SCREENSHOTS
7
MERCER BENEFITS SURVEYSCost-effective, yet market-competitive management of Benefits has never been more important to attract, retain and motivate key talent.
WHY MERCER?Mercer’s comprehensive survey data provides coverage across 17 Asia Pacific countries which allows HR practitioners to optimize their budgets while remaining market competitive - offering you the best returns for your investment.
Our revolutionary online Mercer BenefitsMonitorTM tool gives you the freedom to run and customize your own reports whenever and wherever you need them, sav-ing you valuable time.
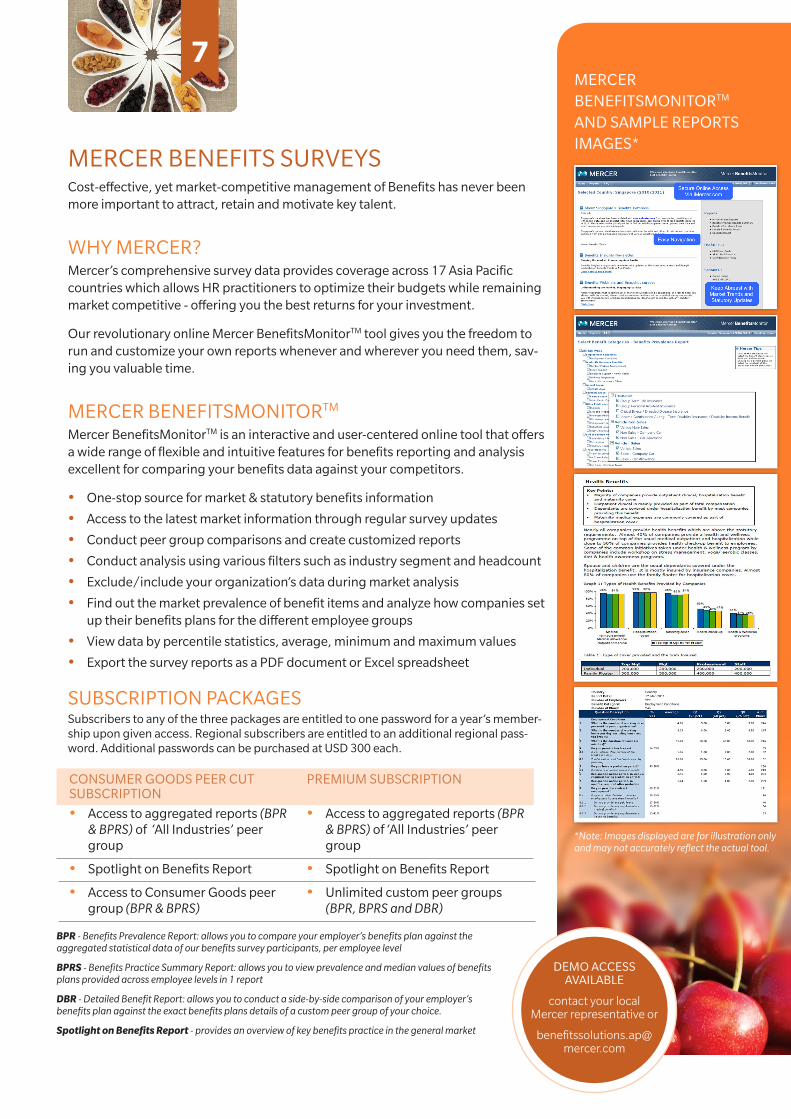
MERCER BENEFITSMONITORTM
Mercer BenefitsMonitorTM is an interactive and user-centered online tool that offers a wide range of flexible and intuitive features for benefits reporting and analysis excellent for comparing your benefits data against your competitors.
y One-stop source for market & statutory benefits information
y Access to the latest market information through regular survey updates
y Conduct peer group comparisons and create customized reports
y Conduct analysis using various filters such as industry segment and headcount
y Exclude/include your organization’s data during market analysis
y Find out the market prevalence of benefit items and analyze how companies set up their benefits plans for the different employee groups
y View data by percentile statistics, average, minimum and maximum values
y Export the survey reports as a PDF document or Excel spreadsheet
SUBSCRIPTION PACKAGESSubscribers to any of the three packages are entitled to one password for a year’s member-ship upon given access. Regional subscribers are entitled to an additional regional pass-word. Additional passwords can be purchased at USD 300 each.
BPR - Benefits Prevalence Report: allows you to compare your employer’s benefits plan against the aggregated statistical data of our benefits survey participants, per employee level
BPRS - Benefits Practice Summary Report: allows you to view prevalence and median values of benefits plans provided across employee levels in 1 report
DBR - Detailed Benefit Report: allows you to conduct a side-by-side comparison of your employer’s benefits plan against the exact benefits plans details of a custom peer group of your choice.
Spotlight on Benefits Report - provides an overview of key benefits practice in the general market
CONSUMER GOODS PEER CUT SUBSCRIPTION
y Access to aggregated reports (BPR & BPRS) of ‘All Industries’ peer group
y Spotlight on Benefits Report
y Access to Consumer Goods peer group (BPR & BPRS)
PREMIUM SUBSCRIPTION
y Access to aggregated reports (BPR & BPRS) of ‘All Industries’ peer group
y Spotlight on Benefits Report
y Unlimited custom peer groups (BPR, BPRS and DBR)
MERCER BENEFITSMONITORTM AND SAMPLE REPORTS IMAGES*
*Note: Images displayed are for illustration only and may not accurately reflect the actual tool.
DEMO ACCESS AVAILABLE
contact your local Mercer representative or

Copyright 2015 Mercer LLC. All rights reserved.
Argentina
Australia
Austria
Belgium
Brazil
Canada
Chile
China
Colombia
Czech Republic
Denmark
Finland
France
Germany
Hong Kong
India
Indonesia
Ireland
Italy
Japan
Malaysia
Mexico
Netherlands
New Zealand
Norway
Peru
Philippines
Poland
Portugal
Saudi Arabia
Singapore
South Korea
Spain
Sweden
Switzerland
Taiwan
Thailand
Turkey
United Arab Emirates
United Kingdom
United States
Venezuela
For further information, please contact your local Mercer office
Mercer (Singapore) Pte. Ltd.
8 Marina View #09-08
Asia Square Tower 1
Singapore 018960
Tel: +65 6398 2800
Fax: +65 6534 9682
or visit our web site at:
www.imercer.com
Top Related