


Languages
Pages
Legal

Measures of collaboration in CSCW:Usability and collective measures in remote and co-located
problem-solving
Master of Science Thesis in Intelligent System Design
SANDRA MATTSSON
The Author grants to Chalmers University of Technology and University of Gothenburg the
non-exclusive right to publish the Work electronically and in a non-commercial purpose make
it accessible on the Internet.
The Author warrants that he/she is the author to the Work, and warrants that the Work does
not contain text, pictures or other material that violates copyright law.
The Author shall, when transferring the rights of the Work to a third party (for example a
publisher or a company), acknowledge the third party about this agreement. If the Author has
signed a copyright agreement with a third party regarding the Work, the Author warrants
hereby that he/she has obtained any necessary permission from this third party to let Chalmers
University of Technology and University of Gothenburg store the Work electronically and
make it accessible on the Internet.
Measures of collaboration in CSCW:
Usability and collective measures in remote and co-located problem-solving
SANDRA MATTSSON,
© SANDRA MATTSSON, January 2011
Advisor and examiner: MORTEN FJELD
Chalmers University of Technology
University of Gothenburg
Department of Interaction Design
SE-412 96 Göteborg
Sweden
Telephone + 46 (0)31-772 1000
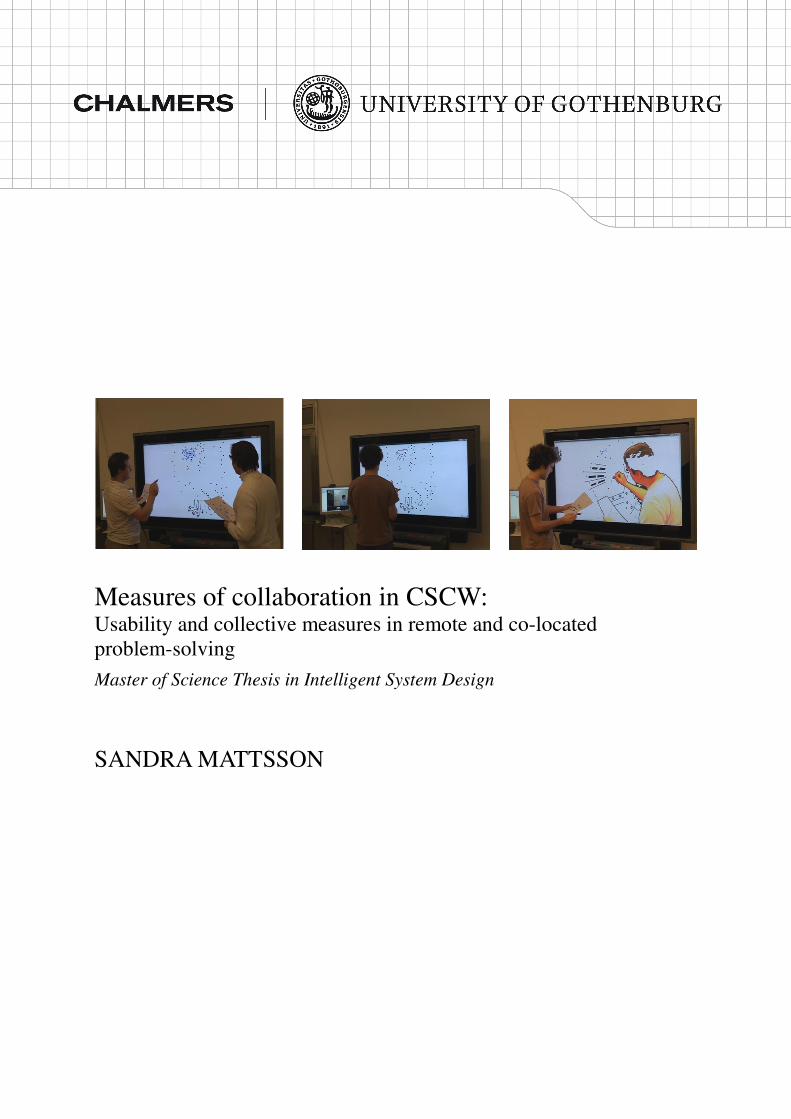
Cover:
The set-up from the experiment with two remote and one co-located collaborative problem-
solving tasks. From the left: the Co-located, Skype-video and CollaBoard condition with
participants from a study made in Zürich ETH.
Department of Interaction Design
Göteborg, Sweden December 2010
Acknowledgements
I would like to thank my supervisor Prof. Dr. Morten Fjeld for his support and supervision on
this thesis. He gave good advice during the process and hints about good literature on the
topic.
I would also like to thank Sakib Sistek, who helped with the installation of the CollaBoard in
the Visualisation studio at the department of Interaction Design, Lindholmen.
My family has given me endless support through the process of writing and editing. I would
especially like to thank my mum for helping me with the read through, helpful cheers and for
helping me with the outline of the thesis. Also, I would like to thank Alex for making a lot of
food and for cheering me up. Thanks also to my cats, Starbuck and Hebbe, for keeping me
company.
Abstract
Since computers first came to be used in the society the role of the user has changed as has
the research connected to it. Computer Supported Collaborative Work (CSCW) has focused
on several users and to evaluate existing collaborative systems. However, no full method is
yet proposed. Authors state that there is a lack in usability and social studies. The aim of this
thesis has first been to find new measures for collaboration and second to test the validity of
these measures on a set of experimental data. A literature review showed that good candidates
for new measures were usability an collective measures. A careful observation of the
experimental data set helped to find seven candidate measures: Speaking, Monitoring,
Looking at task description, Sketching, Erasing, Laughing and Task process that were applied
on an existing body of experimental data. The collection of experimental data stemmed from
video taped observations on a within-group design experiment involving eighteen
participants. Nine pairs of subjects solved dot-to-dot puzzle problems under three conditions
(first independent variable), two of these conditions were remote (SkypeVideo and
CollaBoard); one condition was co-located (Co-located). There were three tasks with varying
difficulty (second independent variable). Monitoring and Speaking were examined in
statistical tests and the five other measures in descriptive analysis. Statistical significant
difference in means were found for tasks in Monitoring and Speaking. In Monitoring the
difference was due to the difference in task time. No significance was seen for conditions
which could be due to a high variation as seen in the box-plots or that the conditions were too
similar when solving the specific dot-to-dot puzzle problem. The descriptive data showed
similar results. The Task process measure showed that in the Co-located condition most focus
was put on task-solving, in Skype Video the most focus was put on the whiteboard. In the
CollaBoard condition Looking at task description had the most focus and the most
conversation and Laughing was seen. Most Laughing was also seen in the simple and hard
task. Also the most focus on the whiteboard was seen with the simple task. Most task-solving
was done in the average task which implies that in an average task more focus can be put on
solving the task than on other things. The measures found in this study should be investigated
further as well as measures of CSCW usability and collectivity in general. A more usable
CSCW system may save time, money, and our environment.
Keywords: Computer Supported Collaborative Work (CSCW), collaboration, usability,
evaluation and collective behaviour.

Contents
1 Introduction.......................................................................................................1
1.1 Collaboration and evaluation in CSCW …..................................................1
1.2 Aim of study and driving question...............................................................2
1.3 Central concepts: Collaboration and usability............................................ 2
1.4 Thesis outline............................................................................................... 3
2 Literature review.............................................................................................. 4
2.1 Collaborative aspects in previous research.................................................. 5
2.2 Frame of paper............................................................................................ 5
2.3 Study in paper............................................................................................. 9
2.4 Usability and collective measures................................................................11
3 Method...............................................................................................................12
3.1 Experimental design.....................................................................................13
3.1.1 Video observation............................................................................... 13
3.1.2 Conditions............................................................................................14
3.1.3 Tasks....................................................................................................17
3.1.4 Measures..............................................................................................19
3.1.5 Gathering of the data...........................................................................21
3.1.6 Reflections of the methods chosen ….................................................22
3.2 Analysing the data........................................................................................ 22
3.2.1 Quantitative analysis............................................................................22
3.2.2 Qualitative analysis..............................................................................25
4 Results of the experimental data set...............................................................27
4.1 User study.....................................................................................................27
4.1.1 Experiment.......................................................................................... 27
4.1.2 Measures............................................................................................. 27
4.2 Quantitative data.......................................................................................... 28
4.2.1 Primary measure – Speaking (RQ1)................................................... 28
4.2.2 Secondary measure – Monitoring (RQ2)............................................ 31
4.2.3 Descriptive measures (RQ3-RQ6)...................................................... 35
4.3 Qualitative data – Task process (RQ7).........................................................50
4.3.1 Frequency analysis..............................................................................51
4.3.2 Trend analysis..................................................................................... 53
5 Analysis and discussion of results....................................................................59
5.1 Quantitative results...................................................................................... 59
5.2 Qualitative results........................................................................................ 59
6 Conclusions and implications...........................................................................62
6.1 Conclusions..................................................................................................62
6.2 Implications..................................................................................................63
6.3 Future studies............................................................................................... 64
References
Appendix
References from literature review............................................................................Appendix I
Data from literature study.........................................................................................Appendix II
Order of watching videos.........................................................................................Appendix III
Quantitative data......................................... ............................................................ Appendix IV
Qualitative data: action-over-time-graphs............................................................... Appendix V
Action-block changes and descriptive data..............................................................Appendix VI

Tables
Literature study
Table 1: Parameters in literature study............................................................................... 5
Table 2: Methods found in the 41 papers reviewed............................................................ 6
Table 3: Kind of collaboration found in the 41 papers reviewed........................................ 6
Table 4: Most studied measures found in the 41 papers reviewed..................................... 6
Table 5: Three categories of measures in the 41 papers reviewed..................................... 7
Table 6: Human measures found in the 41 papers reviewed.............................................. 7
Table 7: Use of measures counted in the 41 papers reviewed............................................ 8
Table 8: Use of Individual and Collective measures counted in the 41 papers reviewed... 9
Table 9: Method in study counted in the 41 papers reviewed............................................ 10
Table 10: Number of participants observed in the 41 papers reviewed............................ 10
Table 11: Results found in 9 of the 41 papers reviewed..................................................... 11
Table 12: The least studied parameters from the literature study, based on the 41 papers
reviewed............................................................................................................................. 12
Table 13: Measures that can be studied.............................................................................. 12
Method
Table 14: Method.................................................................................................................13
Table 15: Conditions............................................................................................................15
Table 16: Tasks.................................................................................................................... 18
Table 17: Research questions (RQ1-RQ7) and corresponding measures.......................... 20
Table 18: Operationalization of measures........................................................................... 21
Table 19: Marking the measures..........................................................................................22
Table 20: The independent and experimental values for the study..................................... 23
Table 21: The dependent variables/measures for the experimental data analysis............. 23
Table 22: Correction of p-values......................................................................................... 24
Table 23: Assumptions for ANOVA.................................................................................... 24
Table 24: The qualitative analysis....................................................................................... 25
Table 25: Assumptions for frequency analysis.................................................................... 26
Table 26: Action changes.................................................................................................... 26
Empiri
Table 27: Time and rate of finished tasks in task sessions.................................................. 27
Table 28: Parameter estimators for Speaking...................................................................... 28
Table 29: Parameter estimators for Monitoring...................................................................33
Table 30: Parameter estimators for Looking at task description........................................ 36
Table 31: Parameter estimators for Sketching..................................................................... 40
Table 32: Parameter estimators for Erasing.........................................................................44
Table 33: Poison Regression coefficients for Laughing...................................................... 47
Table 34: Parameter estimators for Laughing ….................................................................47
Table 35: Number of action changes for Condition.............................................................51
Table 36: Number of action changes for Task......................................................................52
Table 37: Number of action changes per time unit..............................................................52
Table 38: Number of action changes per Group..................................................................53
Table 39: Total number of action changes........................................................................... 53
Table 40: Action-block changes...........................................................................................54
Table 41: Number of action-block changes for Condition and Task................................... 56
Table 42: Number of action-block changes for Group........................................................ 56
Table 43: Total number of action-block changes.................................................................57
Table 44: Additional descriptive information from action-over-time-graphs......................57
Table 45: Participant behaviour for Condition and Task..................................................... 58
Table 46: Size of action-blocks in clusters and cluster orders for Condition and Task....... 58
Discussion
Table 47: Summary of quantitative results.......................................................................... 59
Table 48: A summary of the most action-block changes..................................................... 60
Table 49: A summary of the action-block clusters...............................................................60
Conclusion
Table 50: Characteristics of the conditions and tasks.......................................................... 63
Figures
Method
Figure 1: Co-located condition............................................................................................ 15
Figure 2: Skype Video condition....................................................................................... 16
Figure 3: CollaBoard condition............................................................................................17
Figure 4: Dot-to-dot puzzle................................................................................................. 18
Figure 5: Manual for dot-to-dot puzzle............................................................................... 19
Empiri
Figure 6: Box-plot for Speaking and Condition................................................................. 29
Figure 7: Box-plot for Speaking and Task.......................................................................... 30
Figure 8: Graph for Speaking.............................................................................................. 31
Figure 9: Graph for means of Monitoring and Task.......................................................... 32
Figure 10: Box-plot for Monitoring and Condition.............................................................33
Figure 11: Box-plot for Monitoring and Task..................................................................... 34
Figure 12: Graph for Monitoring.........................................................................................35
Figure 13: Box-plot for Looking at task description and Condition................................. 37
Figure 14: Box-plot for Looking at task description and Task.......................................... 38
Figure 15: Graph for Looking at task description............................................................. 39
Figure 16: Box-plot for Sketching and Condition............................................................... 41
Figure 17: Box-plot for Sketching and Task........................................................................42
Figure 18: Graph for Sketching........................................................................................... 43
Figure 19: Box-plot for Erasing and Condition...................................................................44
Figure 20: Box-plot for Erasing and Task........................................................................... 45
Figure 22: Graph for Erasing...............................................................................................46
Figure 22: Box-plot for Laughing and Condition................................................................48
Figure 23: Box-plot for Laughing and Task........................................................................ 49
Figure 24: Graph for Laughing............................................................................................50
Figure 25: Action-over-time-graph......................................................................................51
Figure 26: Cluster of action-block changes – Initiation..................................................... 54
Figure 27: Cluster of action-block changes - Task solving................................................ 54
Figure 28: Cluster of action-block changes – Near solution.............................................. 54

Figure 29: Cluster of action-block changes – Fault fixing................................................. 55
Figure 30: Clusters of action-block changes – Conversation............................................. 55
Figure 31: An example of additional descriptive information in the action-over-time-
graphs: A Talker and a Monitorer........................................................................................ 57
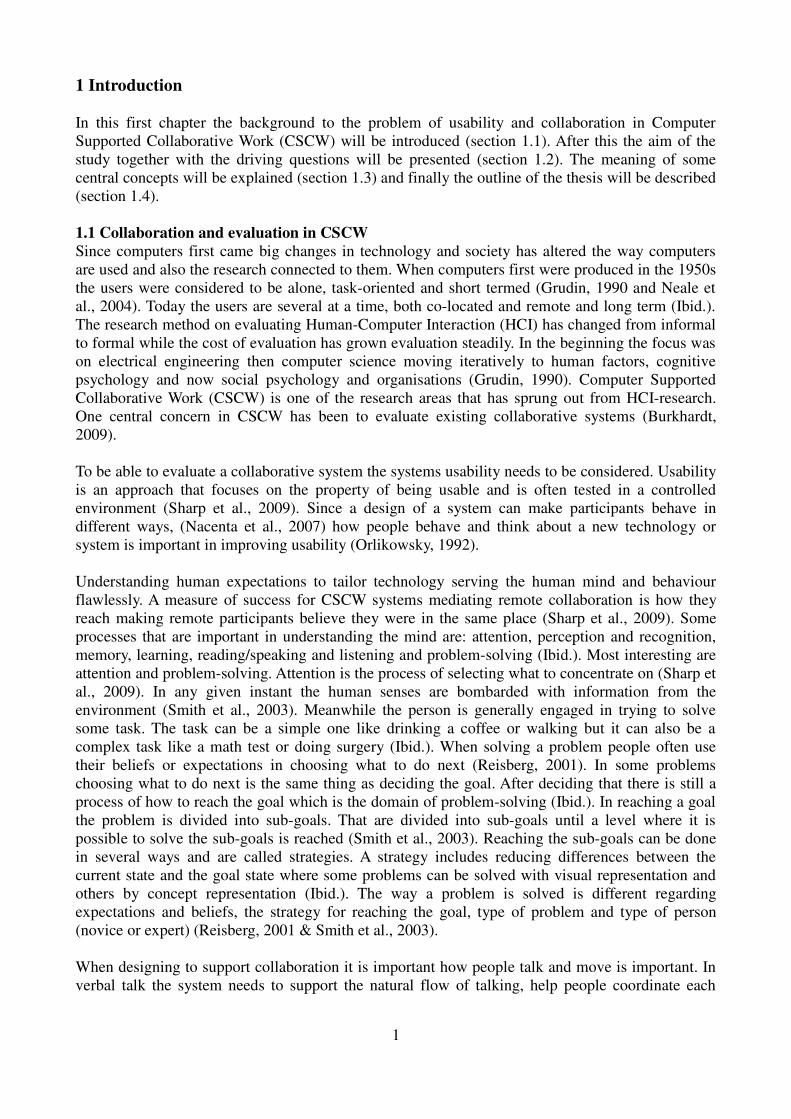
1 Introduction
In this first chapter the background to the problem of usability and collaboration in Computer
Supported Collaborative Work (CSCW) will be introduced (section 1.1). After this the aim of the
study together with the driving questions will be presented (section 1.2). The meaning of some
central concepts will be explained (section 1.3) and finally the outline of the thesis will be described
(section 1.4).
1.1 Collaboration and evaluation in CSCW
Since computers first came big changes in technology and society has altered the way computers
are used and also the research connected to them. When computers first were produced in the 1950s
the users were considered to be alone, task-oriented and short termed (Grudin, 1990 and Neale et
al., 2004). Today the users are several at a time, both co-located and remote and long term (Ibid.).
The research method on evaluating Human-Computer Interaction (HCI) has changed from informal
to formal while the cost of evaluation has grown evaluation steadily. In the beginning the focus was
on electrical engineering then computer science moving iteratively to human factors, cognitive
psychology and now social psychology and organisations (Grudin, 1990). Computer Supported
Collaborative Work (CSCW) is one of the research areas that has sprung out from HCI-research.
One central concern in CSCW has been to evaluate existing collaborative systems (Burkhardt,
2009).
To be able to evaluate a collaborative system the systems usability needs to be considered. Usability
is an approach that focuses on the property of being usable and is often tested in a controlled
environment (Sharp et al., 2009). Since a design of a system can make participants behave in
different ways, (Nacenta et al., 2007) how people behave and think about a new technology or
system is important in improving usability (Orlikowsky, 1992).
Understanding human expectations to tailor technology serving the human mind and behaviour
flawlessly. A measure of success for CSCW systems mediating remote collaboration is how they
reach making remote participants believe they were in the same place (Sharp et al., 2009). Some
processes that are important in understanding the mind are: attention, perception and recognition,
memory, learning, reading/speaking and listening and problem-solving (Ibid.). Most interesting are
attention and problem-solving. Attention is the process of selecting what to concentrate on (Sharp et
al., 2009). In any given instant the human senses are bombarded with information from the
environment (Smith et al., 2003). Meanwhile the person is generally engaged in trying to solve
some task. The task can be a simple one like drinking a coffee or walking but it can also be a
complex task like a math test or doing surgery (Ibid.). When solving a problem people often use
their beliefs or expectations in choosing what to do next (Reisberg, 2001). In some problems
choosing what to do next is the same thing as deciding the goal. After deciding that there is still a
process of how to reach the goal which is the domain of problem-solving (Ibid.). In reaching a goal
the problem is divided into sub-goals. That are divided into sub-goals until a level where it is
possible to solve the sub-goals is reached (Smith et al., 2003). Reaching the sub-goals can be done
in several ways and are called strategies. A strategy includes reducing differences between the
current state and the goal state where some problems can be solved with visual representation and
others by concept representation (Ibid.). The way a problem is solved is different regarding
expectations and beliefs, the strategy for reaching the goal, type of problem and type of person
(novice or expert) (Reisberg, 2001 & Smith et al., 2003).
When designing to support collaboration it is important how people talk and move is important. In
verbal talk the system needs to support the natural flow of talking, help people coordinate each
1
other and the shared work and awareness to be able to find out what is happening, what others are
doing and to help others know what you are doing (Sharp et al., 2009). The physical body plays an
important role in co-located collaboration because the consequence of our actions is important to
get feedback about our next move (Tang et al., 2007). Only seeing the other person does not add the
support in collaboration (Gaver et al., 1993).
Collaboration is affected by social processes and the work environment. Collaboration in both good
and bad ways since the presence of others can enhances or impairs another persons performance
(Sharp et al., 2009). What kind of people and how the group works is important in understanding
collaboration and the work environment (Axelsson et al., 2005). For instance; have they worked
together before, is there a clear explicit leader and what are the individuals main goal of the group
work? Are the individual goals the same as the group goal then there will be less conflict (Ibid.). For
the work environment to be successful a person needs to be able to be part of and manage the
environment as well as the work (Rubenowitz, 2004).
Many collaborate systems exists today but there are often problems of usability and lack of social
studies connected to them and until now no full evaluation method has been proposed (Baker et al,
2001). Neale et al. (2004) stated that evaluation in CSCW often has been vague defined, hard to
implement and time consuming and states further that new strategies are needed to find out what is
central in groupware success and failure. In doing this more measures need to be considered (Ibid.).
Saeki (1995) mean that recent studies have focused on the characteristics of human behaviour
instead of the artefacts produced by the work. Further, Tang et al. meant (2005) that there is a lack
in long-term and daily studies and much studies has been made on either remote or co-located
collaboration. Grudin showed (1988) that there is a lack in CSCW because it does not focus on
peoples differences and that the support in collaboration has to be on an entire group. “If we are
going to support groups that include any diversity at all, we will have to learn much more about
how different kinds of people work (p.91) ... We need to have a better understanding of how groups
and organizations function and evolve than is reflected in most of the systems that have been
developed" (p. 90).
1.2 Aim of study and driving question
The aim of this thesis is to describe and understand previous research in CSCW research in order to
find what measures has not been studied well before. These measures will be tested as they are
applied on an experimental data set with the aim of seeing if and what contribution they may give to
the research area. With the background of this background and aim, a driving question was formed:
How can the measures be defined in order to contribute to the evaluation of CSCW systems?This
driving question is examined in more detail through a set of seven research questions, presented in
Table 17 in the Method chapter (Chapter 3).
1.3 Central concepts: Collaboration and Usability
The definitions existing for collaboration and usability will be investigated in the section and a
definition for this thesis will be found and discussed. Firstly, collaboration has been defined by
Sharp et al. (2009) as when people work together sharing a mutual goal while sharing information.
Collaboration is defined in Wikipedia as a recursive process were two or more organisations or
people work together on a shared goal by sharing knowledge, information and building consensus
(Wikipedia 1). It is stated further that collaboration requires leadership but that it can be social in a
decentralized or an egalitarian group. Some classical examples of collaboration are: trade,
community organisations, game theory, military-industrial complex, project management and
academia (Ibid.). Other definitions of collaborations are: to cooperative with someone for a shared
goal (SAOL, 1997), the interaction among two or more individuals that encompasses a variety of
2
actions such as: communication, information sharing, coordination, cooperation, problem solving
and negotiation (TechTarget, 2010). And in another definition collaboration is said to work together
especially with a joint intellectual effort (The free dictionary, 2010). All these definitions have in
common that they include two or more people or groups were some action is performed sharing a
mutual goal. Some talk about leadership and that the action can be intellectual which will not be
discussed further in this thesis. In this thesis collaboration is defined as two or more people that
work together sharing a mutual goal.
Secondly, usability is defined in Sharp et al. (2009) as an approach that focuses on the property of
being usable and is often tested in a controlled environment to see if the system or product is usable
for the participants and the kind of task it was designed for. Usability is defined in Wikipedia as the
property for something human-made to ease to use and to learn (Wikipedia 2). It is stated further
that usability includes measuring usability, studying an objects efficiency or beauty. Further,
usability can be measured with five components: learn ability, efficiency, memo ability, errors and
satisfaction (Ibid.). In Sharp et al. (2009), the components are seen as usability goals: efficiency,
effectiveness, safety, utility, learn ability and memo ability. Usability is also defined as the state of
something being usable and second as the degree to which an object or product is easy to use
without training (Wiktionary). Researchers at the University of Texas in Austin (2010) stated that
usability is the simplicity to use, efficiency, learneability and error tolerability a product has.
Another definition is that usability is the art and science to design products or systems that are easy
to learn, efficient, effective, engaging and error tolerant (University of Minnesota Duluth, 2010). In
this thesis usability is defined, in line with Sharp et al. (2009), as an approach that focuses on the
property of being usable regarding ease of use, efficiency and satisfaction. These words are chosen
because they are easy to understand and seem to be in line with the above definitions.
1.4 Thesis outline
In the following chapter the framework with the literature review will be presented (Chapter 2).
After this the method for the literature study and the empirical study including the data collection,
the data analysis and the evaluation method will be discussed (Chapter 3). Thereafter the empirical
study containing the user study will be presented (Chapter 4). The results of this user study will be
discussed (Chapter 5) and finally conclusions with implications for both practitioners and
researchers will be presented (Chapter 6).
3
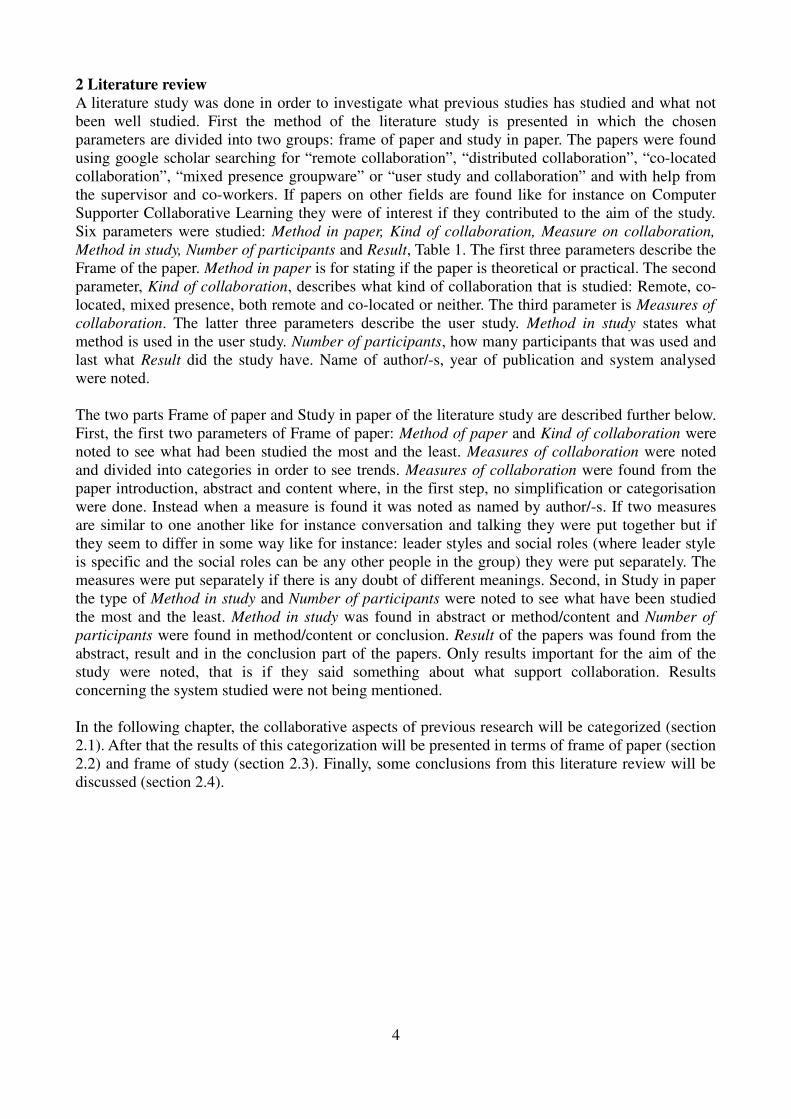
2 Literature review
A literature study was done in order to investigate what previous studies has studied and what not
been well studied. First the method of the literature study is presented in which the chosen
parameters are divided into two groups: frame of paper and study in paper. The papers were found
using google scholar searching for “remote collaboration”, “distributed collaboration”, “co-located
collaboration”, “mixed presence groupware” or “user study and collaboration” and with help from
the supervisor and co-workers. If papers on other fields are found like for instance on Computer
Supporter Collaborative Learning they were of interest if they contributed to the aim of the study.
Six parameters were studied: Method in paper, Kind of collaboration, Measure on collaboration,
Method in study, Number of participants and Result, Table 1. The first three parameters describe the
Frame of the paper. Method in paper is for stating if the paper is theoretical or practical. The second
parameter, Kind of collaboration, describes what kind of collaboration that is studied: Remote, co-
located, mixed presence, both remote and co-located or neither. The third parameter is Measures of
collaboration. The latter three parameters describe the user study. Method in study states what
method is used in the user study. Number of participants, how many participants that was used and
last what Result did the study have. Name of author/-s, year of publication and system analysed
were noted.
The two parts Frame of paper and Study in paper of the literature study are described further below.
First, the first two parameters of Frame of paper: Method of paper and Kind of collaboration were
noted to see what had been studied the most and the least. Measures of collaboration were noted
and divided into categories in order to see trends. Measures of collaboration were found from the
paper introduction, abstract and content where, in the first step, no simplification or categorisation
were done. Instead when a measure is found it was noted as named by author/-s. If two measures
are similar to one another like for instance conversation and talking they were put together but if
they seem to differ in some way like for instance: leader styles and social roles (where leader style
is specific and the social roles can be any other people in the group) they were put separately. The
measures were put separately if there is any doubt of different meanings. Second, in Study in paper
the type of Method in study and Number of participants were noted to see what have been studied
the most and the least. Method in study was found in abstract or method/content and Number of
participants were found in method/content or conclusion. Result of the papers was found from the
abstract, result and in the conclusion part of the papers. Only results important for the aim of the
study were noted, that is if they said something about what support collaboration. Results
concerning the system studied were not being mentioned.
In the following chapter, the collaborative aspects of previous research will be categorized (section
2.1). After that the results of this categorization will be presented in terms of frame of paper (section
2.2) and frame of study (section 2.3). Finally, some conclusions from this literature review will be
discussed (section 2.4).
4

Table 1: Parameters in literature study
Parameters Definition Why
interesting
How measured Location in
papers
Method in paper Is the paper
theoretical or not?
Statistical purposes As noted by author Introduction, abstract
or content
Kind of collaboration What kind of
collaboration is
studied in the paper?
Remote/distributed,
co-located, mixed
presence groupware,
both remote and co-
located or neither
If result is found on
what does improve
collaboration it is
important to know
what kind of
collaboration was
studied in the paper
Words as noted by
author
Introduction, abstract
or content
Measures of
collaboration
What measures was
used and what were
the author focusing on
when they talked
about collaboration?
Since collaboration is
a hard word that is
defined in different
ways it is crucial to
see what words are
used to describe and
measure it
Words as noted by
author except for
words that are similar
which are considered
to be the same words.
For example
conversation and
talking.
Introduction, abstract
and content
Method in study What method is used
in the paper?
If one type of method
is used more often this
will have an
implication on why
the evaluation
methods have failed
Words as noted by
author
Abstract or
method/content
Number of
participants
How many were the
participants in the user
studies?
Interesting to see what
has been well studied
and what has not
Numbers as noted by
author
Method/content or
conclusion
Result What results about
collaboration did
papers have?
If something is
already investigated
and stated as true it is
not interesting to
investigate further
Only results important
for the aim of the
study were used
Abstract, result and
conclusion
The Table (Table 1) describes what is studied in the literature study. The parameters are for Frame
of paper: Method in paper, Kind of collaboration and Measures of collaboration and for Study in
paper: Method in study, Number of participants and Result. There are description on how the
parameters are defined, why they are interesting, how they are measured and where they were found
in the papers.
2.1 Collaborative aspects in previous research
A literature review was done in order to investigate how collaborative aspects in CSCW has been
studied in previous research. The studies are categorized in terms of Frame of paper and Study in
paper. Frame of paper includes the parameters connected to the frame of the paper: (i) Method in
paper, (ii) Kind of collaboration and (iii) Measure of collaboration. Study in paper includes
parameters connected to the study in the paper: (i) Method in study, (ii) Number of participants and
(iii) Result. The parameter Result includes conclusions of the paper. A full data table is seen in
Appendix II.
The papers were found searching on google.scholar for “remote collaboration”, “distributed
5
collaboration”, “co-located collaboration”, “mixed presence groupware”, “user study and
collaboration”and “CSCW and user study”. Some papers were found with help from the supervisor
and colleges.
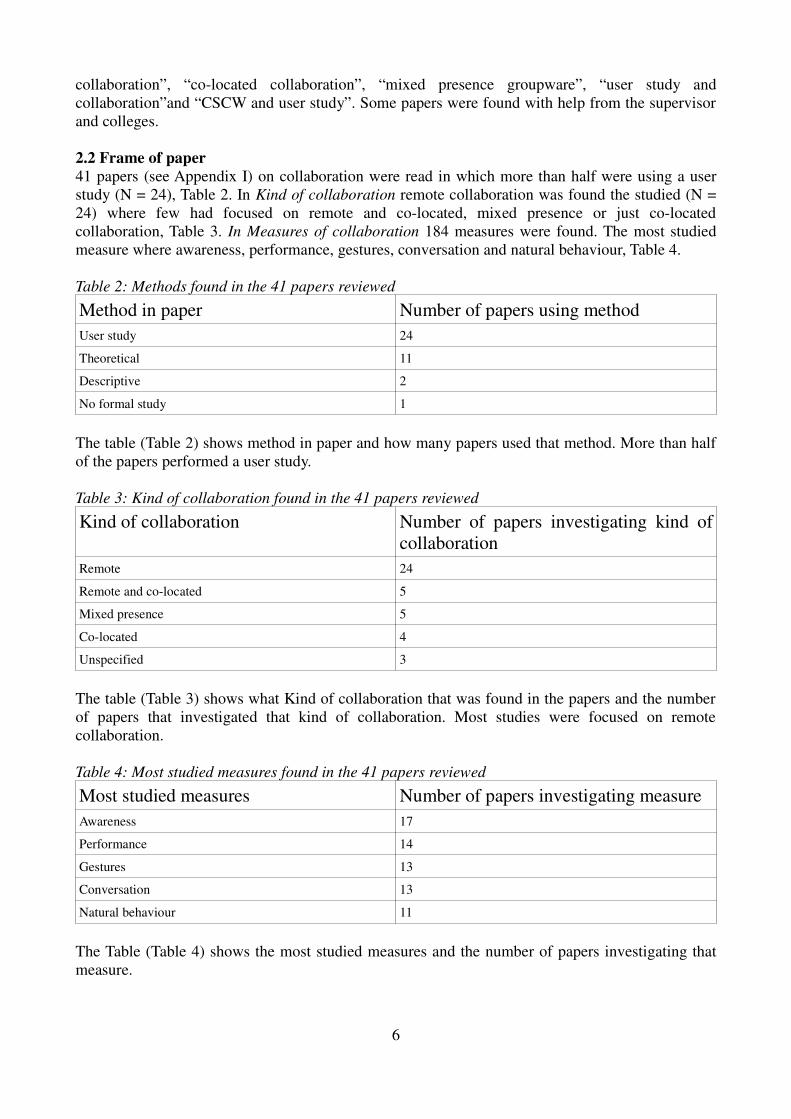
2.2 Frame of paper
41 papers (see Appendix I) on collaboration were read in which more than half were using a user
study (N = 24), Table 2. In Kind of collaboration remote collaboration was found the studied (N =
24) where few had focused on remote and co-located, mixed presence or just co-located
collaboration, Table 3. In Measures of collaboration 184 measures were found. The most studied
measure where awareness, performance, gestures, conversation and natural behaviour, Table 4.
Table 2: Methods found in the 41 papers reviewed
Method in paper Number of papers using method
User study 24
Theoretical 11
Descriptive 2
No formal study 1
The table (Table 2) shows method in paper and how many papers used that method. More than half
of the papers performed a user study.
Table 3: Kind of collaboration found in the 41 papers reviewed
Kind of collaboration Number of papers investigating kind of
collaboration
Remote 24
Remote and co-located 5
Mixed presence 5
Co-located 4
Unspecified 3
The table (Table 3) shows what Kind of collaboration that was found in the papers and the number
of papers that investigated that kind of collaboration. Most studies were focused on remote
collaboration.
Table 4: Most studied measures found in the 41 papers reviewed
Most studied measures Number of papers investigating measure
Awareness 17
Performance 14
Gestures 13
Conversation 13
Natural behaviour 11
The Table (Table 4) shows the most studied measures and the number of papers investigating that
measure.
6

Measures of collaboration were divided into three categories: Human measures, Task measures and
Usability measures, see Table 5. The Human category includes measures that are connected to the
human emotion or activity for instance number of participants, roles, awareness etcetera. The Task
category includes measures that are connected to the task or environment of the task or technology
like for instance quality, interface, environment, shared artefacts etcetera and the Usability category
includes measures connected to usability like for instance ergonomics and interaction. The most
studied category was Human measures, 51.63 percent, Table 5. Human measures were divided into
two subcategories: Individual measures and Collective measures were the Individual measures
were the most studied, 68.42% of the Human measures, Table 6. The Individual category is
connected to how one person feels or acts while the Collective category includes more than one
person or object at the same time. An example of a Collective measure is presence disparity and
ecology. The full table is presented in Table 7.
The least studied categories were Usability and Collective measures, see Table 8. The least studied
Individual measures were: Eye gaze, grounding, author styles, learning, motivation, ergonomics,
immersion, culture and need. The least studied Collective measures were: Casual interaction and
monitoring. The least studied Task measures were: environment/place, physical objects, design,
interface, technology, transition between activities, tool, information and feed through. The least
studied Usability measures were: support for casual interaction, learning and ergonomics.
Table 5: Three categories of measures in the 41 papers reviewed
Measures Number of papers
investigating measures
Percent of measures
Human 95 51.63%
Task 58 31.52%
Usability 31 16.85%
The Table(Table 5) shows the three categories found in Measures of collaboration: Human, Task
and Usability measures. The columns state the number of papers investigated by the measures and
the percent of measures.
Table 6: Human measures found in the 41 papers reviewed
Human measures Number of papers
investigating measures
Percent of human measures
Individual 65 68.42%
Collective 30 31.58%
In Table 6 the Human measures are divided into two sub measures: Individual and collective
measures and collective measures have been studied the least. The columns state the number of
papers investigated by the measures and the percent of human measures.
7

Table 7: Use of measures counted in the 41 papers reviewed
Human
measure
Count of
papers using
measure
Task
measure
Count of
papers using
measure
Usability
measure
Count of
papers using
measure
Awareness 17 Performance 14 Natural behaviour 11
Gestures 13 Coordination/man
agement
9 Interaction 9
Conversation 13 Task process 6 Satisfaction 7
Embodiment 9 Feedback 5 Usability 3
Role 6 Sketching 5 Ergonomics 1
Presence disparity 6 Shared artefacts 4
Individual versus
shared
5 Work coupling 3
Social
organisation
4 Environment/
place
2
Privacy
3 Physical objects 2
Ecology 3 Design 1
Perception/cogniti
on
3 Technology 1
Eye gaze 2 Transition
between activities
1
Casual interaction 2 Tool 1
Grounding 2 Information 1
Monitoring 2 Feed through 1
Learning 1
Motivation 1
Immersion 1
Culture 1
Need 1
Author style 1
Total count of
human measures
95 Total count of
task measures
58 Total count of
usability
measures
31
The Table (Table 7) shows the Measures of collaboration found in the papers divided into three
categories: Human, Task and Usability measures. The number of papers using the measure is also
seen. The total number of measures are 184 and the total number for each of the measures can be
seen in the end of the Number of papers using measure column were Human is the most studied and
Usability is the least.
8
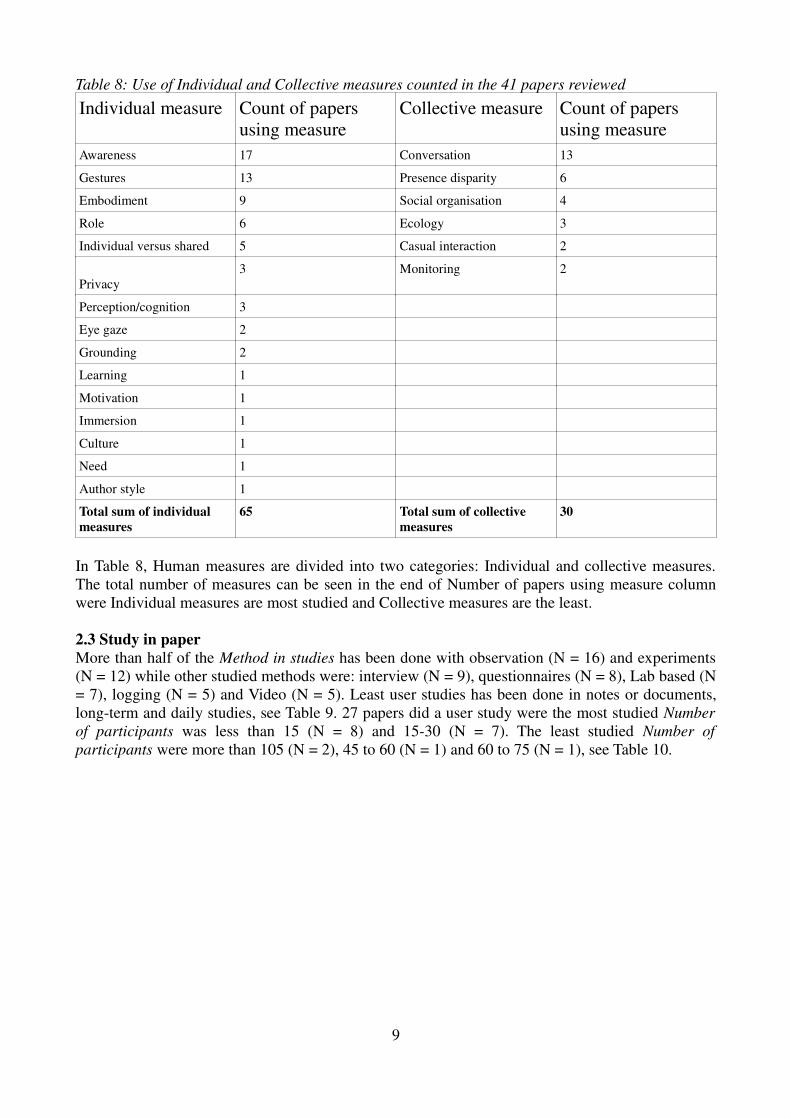
Table 8: Use of Individual and Collective measures counted in the 41 papers reviewed
Individual measure Count of papers
using measure
Collective measure Count of papers
using measure
Awareness 17 Conversation 13
Gestures 13 Presence disparity 6
Embodiment 9 Social organisation 4
Role 6 Ecology 3
Individual versus shared 5 Casual interaction 2
Privacy
3 Monitoring 2
Perception/cognition 3
Eye gaze 2
Grounding 2
Learning 1
Motivation 1
Immersion 1
Culture 1
Need 1
Author style 1
Total sum of individual
measures
65 Total sum of collective
measures
30
In Table 8, Human measures are divided into two categories: Individual and collective measures.
The total number of measures can be seen in the end of Number of papers using measure column
were Individual measures are most studied and Collective measures are the least.
2.3 Study in paper
More than half of the Method in studies has been done with observation (N = 16) and experiments
(N = 12) while other studied methods were: interview (N = 9), questionnaires (N = 8), Lab based (N
= 7), logging (N = 5) and Video (N = 5). Least user studies has been done in notes or documents,
long-term and daily studies, see Table 9. 27 papers did a user study were the most studied Number
of participants was less than 15 (N = 8) and 15-30 (N = 7). The least studied Number of
participants were more than 105 (N = 2), 45 to 60 (N = 1) and 60 to 75 (N = 1), see Table 10.
9

Table 9: Method in study counted in the 41 papers reviewed
Method in study Count of papers using method
Observation (structured and unstructured) 16
Experiment 12
Interview (structured and unstructured) 9
Questionnaires (One or several) 8
Lab based 7
With logs 5
Video 5
Notes or documents 3
Long-term 3
Daily 2
In Table 9, the methods in the study is seen in the first column and the second show number of
papers using method. The most used method were observation and experiment and least were notes
or documents, long-term and daily user studies.
Table 10: Number of participants observed in the 41 papers reviewed
Number of participants Count of papers using number of
participant
Less than 15 8
15 to 30 7
30 to 45 4
90 to 105 4
More than 105 2
45 to 60 1
60 to 75 1
The Table (Table 10) shows what Number of participants were studied in the papers and how many
papers used that number of participants. Most studied were less than 15 and 15 to 30 and least
studied were more than 105, 45 to 60 and 60 to 75.
From the Results, measures that supported collaboration were divided into human, task and
usability measures and summarised in Table 11. From the human measures awareness (Tang et al.,
1991 and Gutwin et al., 2004), gestures (Heiser et al., 2004; Kirk and Fraser, 2005; Tang et al., 200t
and Kirk et al., 2006) and casual interaction (Tee et al., 2009) were seen to support collaboration.
Awareness was seen to enhance the sense of fellowship for co-workers (Tang et al., 1991) and was
needed for remote developers to know more in detail who they were working with (Gutwin et al.,
2004). Gestures were seen to help focus attention and to communicate solutions (Heiser et al., 2004)
and were seen to be part of the collaborate process (Tang et al., 2007). Remote gestures were seen
to significantly improve the performance but to reduce the rapport of communication (Kirk, 2005)
and gestures with unmediated representation of the hands were seen to improve performance
without loss of accuracy (Kirk et al., 2006). No significant difference was found in presenting them
on external monitors or as projections (Ibid.). Presence disparity was seen important for MPG (Tang
et al., 2004) but was in another study proposed not to be a problem (Epps et al., 2007). In another
10

study presence disparity was seen to have no significance for mixed presence groupware (MPG)
and instead the opposite was seen (Bezerianos et al., 2008). Casual interaction was seen to support
collaboration in Tee et al. (2009).
Task measures that were seen to support collaboration were shared sketch (Heiser et al., 2004 and
Ju et al., 2006), sharing partial results (Neuwirth et al., 1994), having an automatic erasing tool
(Fussell et al., 2004) and cursor pointing (Fussell et al., 2003). Collaboration was seen to be more
efficient, showed better result and was more enjoyable with a shared sketch (Heiser et al., 2004) and
it was showed that sketches in co-located collaboration support real time discussion but does
seldom contain much information (Ju et al., 2006). Sharing partial results and managing the task is
important for collaborative interaction (Neuwirth et al., 1994). An automatic erasing tool was
reported to support collaboration (Fussell et al., 2004). Other task related results were that in
collaboration with a physical task using multiple cameras task views was preferred over face views
(Gaver et al., 1993). In a study by Scott et al. (2003) it was showed that small changes in a product
design can lead to a large change in the systems ability to support collaboration.
Supporting natural behaviour (usability measure) was seen to support not only the collaboration but
also the transition between a shared and a personal workspace, use of physical artefacts and user
interactions (Saeki, 2003).
Table 11: Results found in 9 of the 41 papers reviewed
Measures Supports collaboration Author
Human measures -
Individual measure
Awareness Tang et al., 1991
Gutwin et al., 2004
Collective measure Gestures Heiser et al., 2004
Kirk and Fraser, 2005
Kirk et al., 2006
Tang et al., 2007
Collective measure Casual Interaction Tee et al, 2009
Task measures Shared sketch Heiser et al., 2004
Ju et al., 2006
The Table (Table 11) shows the Results that supports collaboration found in the 41 papers reviewed.
Only results that supported collaboration were noted together with authors and year of publication.
2.4 Usability and collective measures
A literature study was done in order to find the most and least studied parameters in previous
CSCW research. The least studied parameters are used to form an evaluation method for the user
study. In Table 12 the least studied parameters and measures from the literature study is
summarised. Last, the measures chosen for the thesis is presented.
11

Table 12: The least studied parameters from the literature study, based on the 41 papers reviewed
Parameter Least studied in previous research
Kind of collaboration Co-located, mixed presence and remote and co-located
collaboration
Measure of collaboration Usability and collective measures
Method in study Long-term or daily studies using notes/documents, videos
and logs
Number of participants 45-90 participants and more than 105 participants
Table 12, shows the least studied parameters and measures found in the literature study.
Due to delimitations some parameters could not be studied and a suggestion of measures was done.
The evaluation method was used to make a basic setup and to choose measures for the user study. In
Kind of collaboration it was seen that the least studied collaboration was Co-located, mixed
presence and co-located and remote collaboration which can be done in the scope of the thesis. The
least studied Method in study long-term and daily studies is delimited and therefore the next least
studied measure is of interest. Notes and documents does not fit with evaluating a collaborate
system and therefore Videos were used. As for Number of participants it is not possible to study
more than 20 people although this is not the least studied. A summary of what can be studied in the
scope of the study can be seen in Table 13. In Measures of collaboration it was seen that the least
studied are Usability and collective measures. The Table for all the measures were used as an
inspiration for finding measures in the study.
Table 13: Measures that can be studied
Measures that can be studied
Co-located, mixed presence and remote and co-located collaboration
Collective and Usability measures
Notes and documents, videos and logs
Table 13 shows which CSCW measures that have not been well studied and may therefore act as
guidance towards novel research in the scope of the thesis.
The measures chosen for this study were remote and co-located and collaboration, usability and
collective measures using video observations.
12

3 Method
The method is divided into three parts; literature study (chapter 2), evaluation method and analysis
of experimental data set, see Table 14. In this chapter the method for evaluating the result from the
literature study and the set-up for analysing the experimental data set is described. First the
experimental design is explained (section 3.1). Methods for analysing the data is presented (section
3.2) and are divided into quantitative data (section 3.2.1) and qualitative data (section 3.2.2).
Table 14: Method
Method Description
Literature study, 41 papers studied Previous research on collaboration, shared whiteboards
and related areas were read in order to see what has and
has not been well studied before
Evaluation method With help from the literature study and the theoretical
frame an evaluation method was developed
Analysis of experimental data set A user study was done in order to test the evaluation
method
The method is seen in Table 14 and is divided into three steps: A literature study, an evaluation
method and an analysis of experimental data set which is each described on how it was performed
and why.
In the literature study measures was found that had not been well studied in previous research of
CSCW. The evaluation method was used for finding measures for the user study and the set-up for
the study. The least studied parameters from the literature study were used together with the
delimitations in order to find measures usable for the user study. Background and theoretical
information was also used. The results of the evaluation method are seen in section 2.4. The
delimitations in the user study were that the study will not be able to include more than 20
participants during a short term study. Long-term or daily studies are not possible to do in the scope
of this thesis. In order to test the measures found the data from a previous study was used. The
design of that study and what data was used from it is explained in the next chapter.
3.1 Experimental design
This section explains the methods chosen for the analysis of the experimental data set. First the set-
up (section 3.1.1, Video Observation) for the user study is explained. This section is divided into
CollaBoard, Experiment and Participants. Then the Conditions (section 3.1.2), Tasks (section 3.1.3)
and Measures (section 3.1.4) is explained. The data from the experiment were collected from videos
and were analysed trough observation. The data gathering is explained further (section 3.1.5) and
reflections of the chosen methods is seen in section 3.1.6.
3.1.1 Video observation
The user study originates from a study made by Tommaso Piazza in a licentiate thesis for
Interaction Design, Chalmers University of Technology. Piazza's goal of the study was to see how
CollaBoard, a new prototype, was perceived by the participants both trough questionnaires and
through objective measures like for instance number of strokes performed, erasing done and
interrupts from the remote participant (Piazza, 2010). The video material from the Piazza study was
used and analysed with observation.
CollaBoard
A prototype called CollaBoard was developed at the Swiss Federal Institute if Technology in Zurich
13
(ETH) in order to make the HCI more seamless than before. The CollaBoard is a shared electronic
whiteboard that allows a remote partner to work as they were side by side in front of it (t2i Lab,
2010). The difference from other existing shared whiteboards is that each participant is filmed with
a camera from behind and that video in put in as an overlay on the remote participants’ whiteboard.
This makes pointing gestures visible directly in the whiteboard resulting in an intuitive collaborate
teamwork (Ibid. and ETH, 2010). In a study on VideoArms, which is a system that captures arms
and presents them as an overlay on the shared workspace, it was seen that the awareness support
was improved (Andersson & Ehrensvärd, 2009). In another study using overlays participants
though it was simpler to explain using overlays (Ibid.). Since the CollaBoard system supports
gestures, awareness and a shared sketch it should be a more usable system than for instance
VideoArms. This is possible since the characteristics described in turn supports collaboration, see
literature study and Table 10. CollaBoard has new technology and many features that should
support collaboration which makes it interesting to test in a user study.
Experiment
Two participants formed a group that tested three different tasks with three different conditions.
Each subject in the pair (Participant 1 and Participant 2) was given a manual of the task. Participant
1 and 2 was given different manuals in order to stimulate collaboration (See manual in Table Z).The
pairs were formed so that there was minimum chance that they had worked together before. The
experiment was based on a problem solving task that should be solved as fast as possible with as
few mistakes as possible. For each task a pair was given a maximum of 15 minutes to complete the
task. When a task was completed the pair could move on to the next condition and task. Conditions
and tasks were varied so that every group tested all conditions and tasks once. The order of the
conditions and tasks were randomly varied so that the order of the conditions of tasks could not bias
the experiment.
Participants
18 participants, 2 women, from the ETH University in Zürich were included in the user study
(Piazza, 2009). Most of them was in their forties and between 24 and 61 years old were all of them
work with computers for a daily basis. The most of them came from the same department (Ibid.).
3.1.2 Conditions
The conditions used in the study are Co-located, Skype Video and CollaBoard, see Table 15 (Piazza,
2009). Co-located means that the participants work side by side, in the same room, solving a task.
In this setting two participants can not write at the same time which means that more monitoring
was done, Figure 1. In the Skype video and CollaBoard condition two participants are situated in
different rooms, sharing an electronic whiteboard. In the Skype Video condition a web cam is
filming the participant while working on the whiteboard. An additional screen is put on the side of
the shared screen so that each participant sees the remote partner in that screen, Figure 2 (Ibid.). In
the CollaBoard condition the video conference prototype CollaBoard was used. The torso of the
partner is seen as an overlay to the whiteboard (Figure 3). The conditions were ordered in order of
evolution, Co-located came first, then Skype Video and latest the prototype CollaBoard.
14
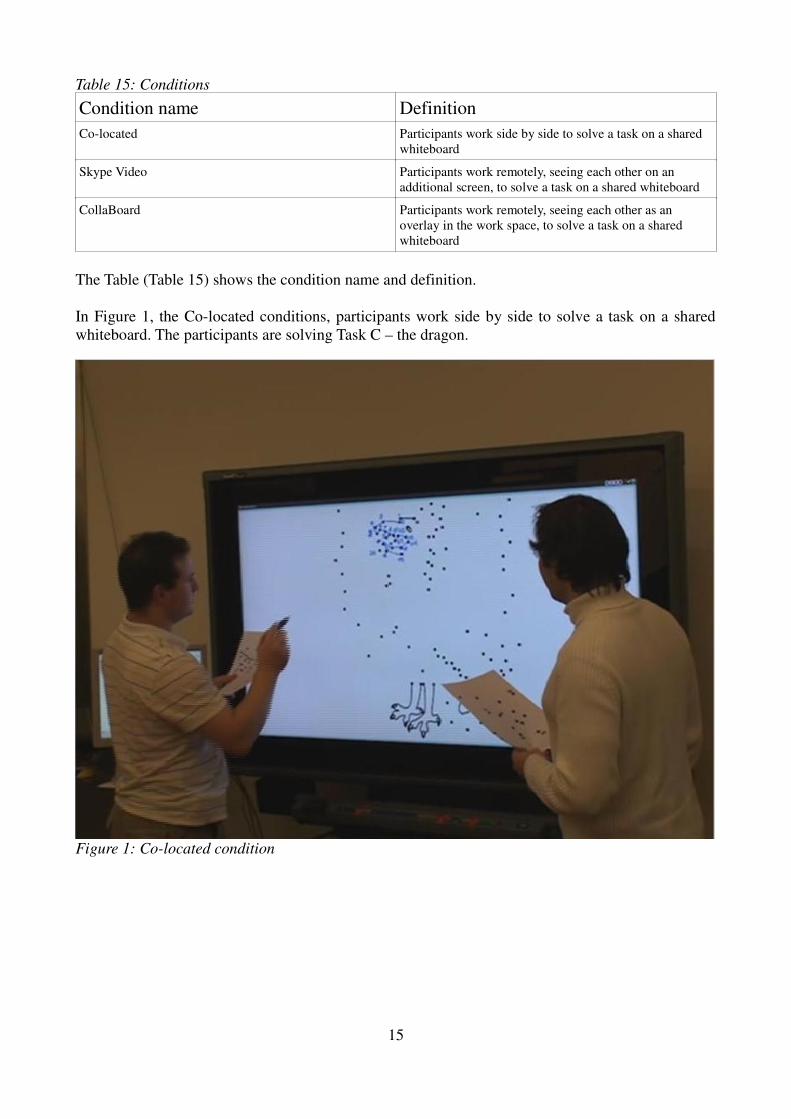
Table 15: Conditions
Condition name Definition
Co-located Participants work side by side to solve a task on a shared
whiteboard
Skype Video Participants work remotely, seeing each other on an
additional screen, to solve a task on a shared whiteboard
CollaBoard Participants work remotely, seeing each other as an
overlay in the work space, to solve a task on a shared
whiteboard
The Table (Table 15) shows the condition name and definition.
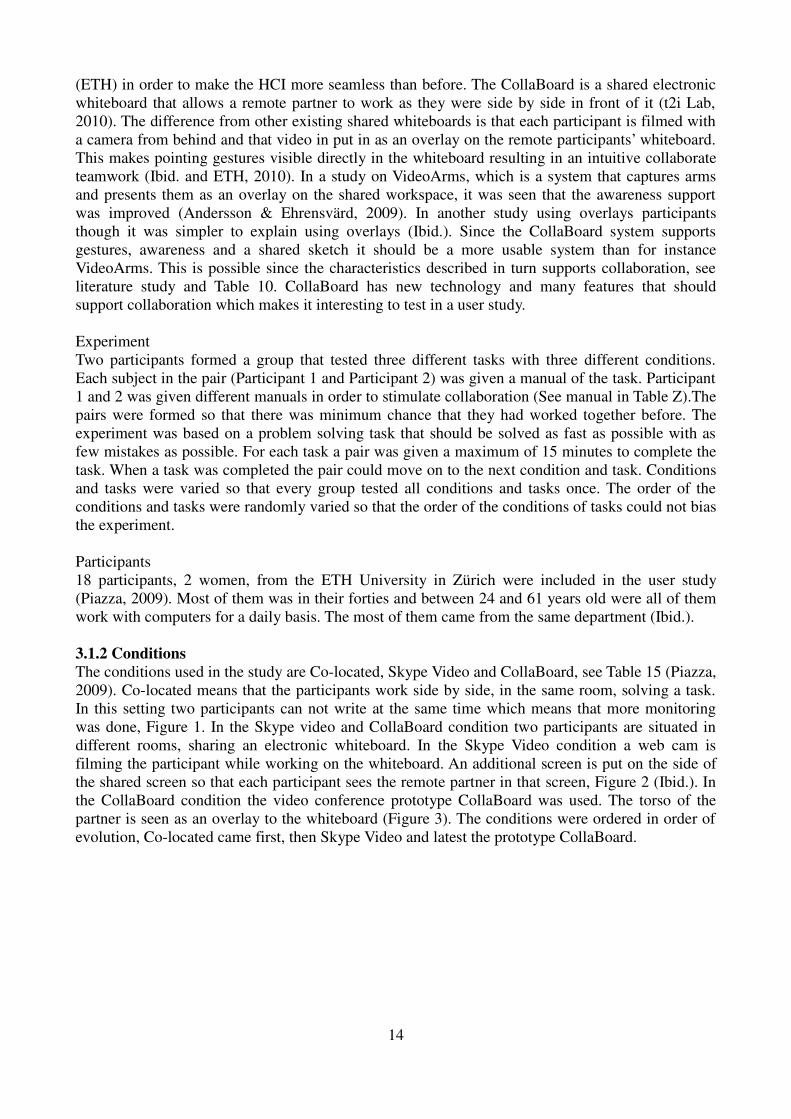
In Figure 1, the Co-located conditions, participants work side by side to solve a task on a shared
whiteboard. The participants are solving Task C – the dragon.
Figure 1: Co-located condition
15

In Figure 2, The Skype Video condition, participants work remotely, seeing each other on an
additional screen, to solve a task on a shared whiteboard. The additional screen is seen on the left
hand side of the whiteboard. The participants are solving Task C – the dragon.
Figure 2: Skype Video condition
16
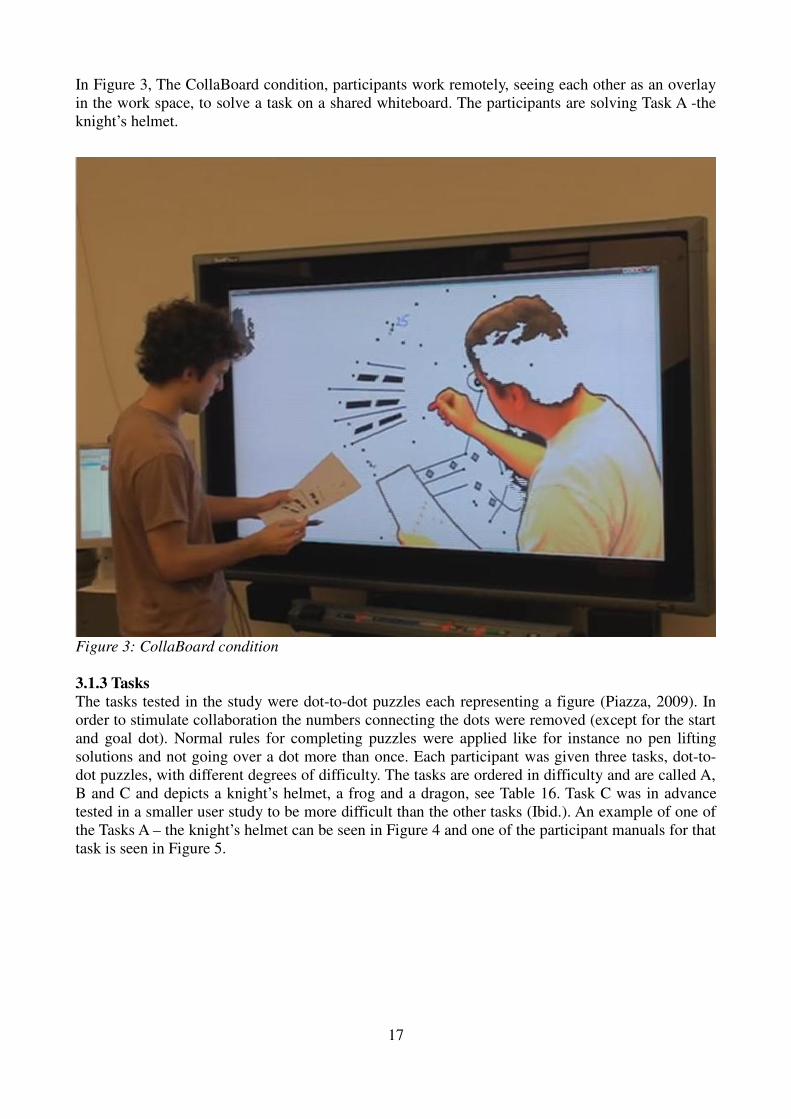
In Figure 3, The CollaBoard condition, participants work remotely, seeing each other as an overlay
in the work space, to solve a task on a shared whiteboard. The participants are solving Task A -the
knight’s helmet.
Figure 3: CollaBoard condition
3.1.3 Tasks
The tasks tested in the study were dot-to-dot puzzles each representing a figure (Piazza, 2009). In
order to stimulate collaboration the numbers connecting the dots were removed (except for the start
and goal dot). Normal rules for completing puzzles were applied like for instance no pen lifting
solutions and not going over a dot more than once. Each participant was given three tasks, dot-to-
dot puzzles, with different degrees of difficulty. The tasks are ordered in difficulty and are called A,
B and C and depicts a knight’s helmet, a frog and a dragon, see Table 16. Task C was in advance
tested in a smaller user study to be more difficult than the other tasks (Ibid.). An example of one of
the Tasks A – the knight’s helmet can be seen in Figure 4 and one of the participant manuals for that
task is seen in Figure 5.
17
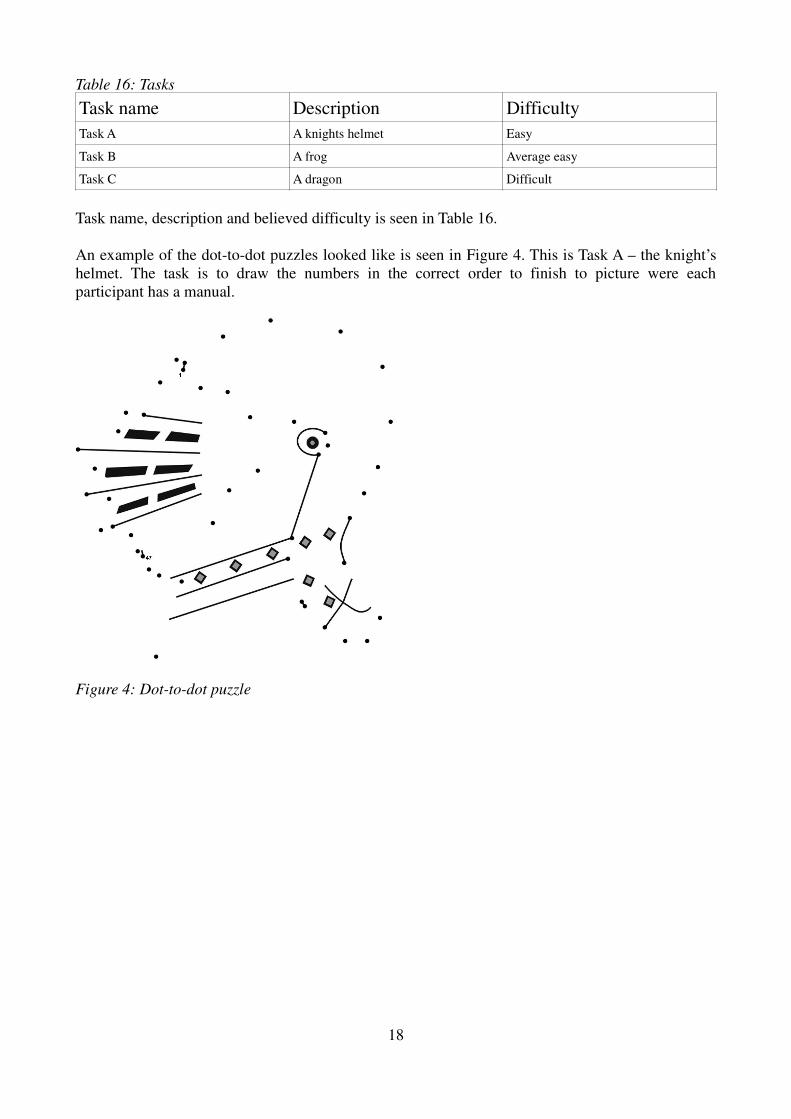
Table 16: Tasks
Task name Description Difficulty
Task A A knights helmet Easy
Task B A frog Average easy
Task C A dragon Difficult
Task name, description and believed difficulty is seen in Table 16.
An example of the dot-to-dot puzzles looked like is seen in Figure 4. This is Task A – the knight’s
helmet. The task is to draw the numbers in the correct order to finish to picture were each
participant has a manual.
Figure 4: Dot-to-dot puzzle
18
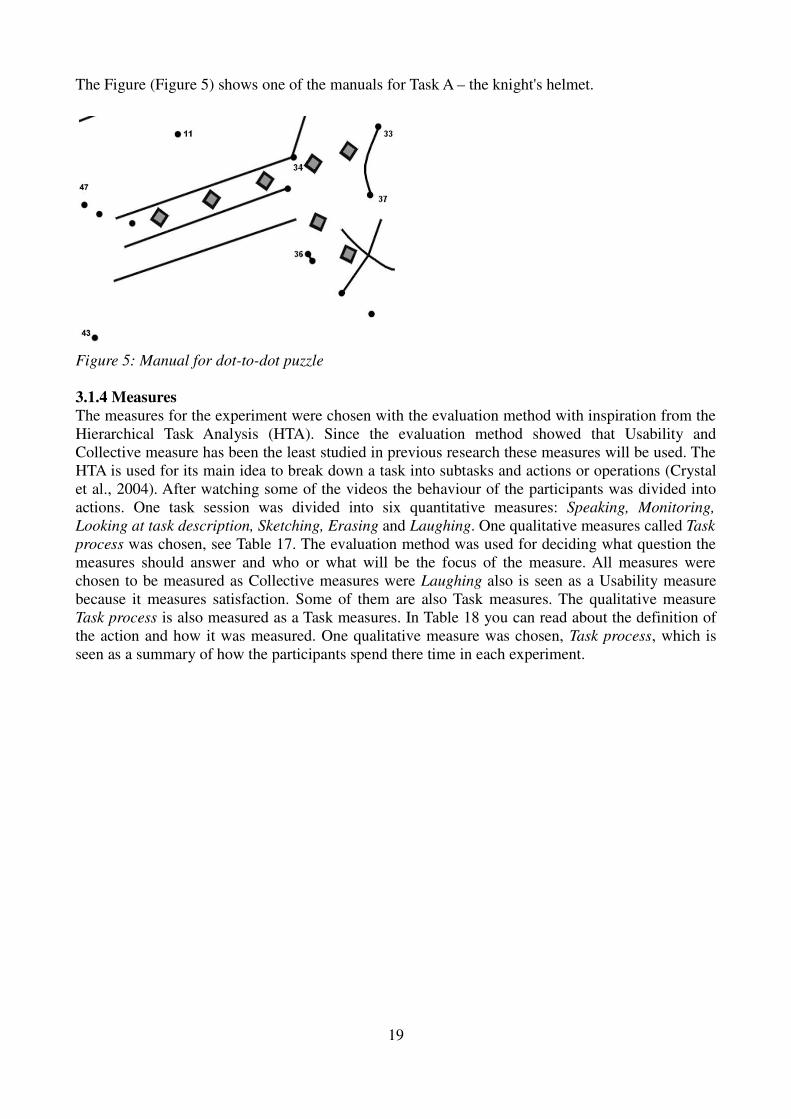
The Figure (Figure 5) shows one of the manuals for Task A – the knight's helmet.
Figure 5: Manual for dot-to-dot puzzle
3.1.4 Measures
The measures for the experiment were chosen with the evaluation method with inspiration from the
Hierarchical Task Analysis (HTA). Since the evaluation method showed that Usability and
Collective measure has been the least studied in previous research these measures will be used. The
HTA is used for its main idea to break down a task into subtasks and actions or operations (Crystal
et al., 2004). After watching some of the videos the behaviour of the participants was divided into
actions. One task session was divided into six quantitative measures: Speaking, Monitoring,
Looking at task description, Sketching, Erasing and Laughing. One qualitative measures called Task
process was chosen, see Table 17. The evaluation method was used for deciding what question the
measures should answer and who or what will be the focus of the measure. All measures were
chosen to be measured as Collective measures were Laughing also is seen as a Usability measure
because it measures satisfaction. Some of them are also Task measures. The qualitative measure
Task process is also measured as a Task measures. In Table 18 you can read about the definition of
the action and how it was measured. One qualitative measure was chosen, Task process, which is
seen as a summary of how the participants spend there time in each experiment.
19

Table 17: Research questions (RQ1-RQ7) and corresponding measures
Measure Research question (RQ1-
RQ7)
Type of measures
Speaking RQ1: How does a participant interact
with another participant in speaking or
mumbling when solving a task?
Collective measure
Monitoring RQ2: How does a participant look
at/interact with the other participant
(passive interaction) or watch the task
progression when the other participant
is doing something else?
Collective measure
Looking at task description RQ3: How does a participant look
at/interact with the given task to solve
it?
Collective and Task measure
Sketching RQ4: How does a participant interact
with the shared whiteboard?
Collective and Task measure
Erasing RQ5: How does a participant interact
with the erasing tool when there is a
problem with something that is
written on the whiteboard?
Collective and Task measure
Laughing RQ6: How does a participant interact
with another participant showing
enjoyability or confusion?
Collective measure and Usability
measure
Task process RQ7: How does the actions in a task
solving process interact?
Task measure
Table 17 shows (left to right) seven research question, each question’s corresponding measure as
derived from HTA and intended to answer the research question, and type of measure.
20
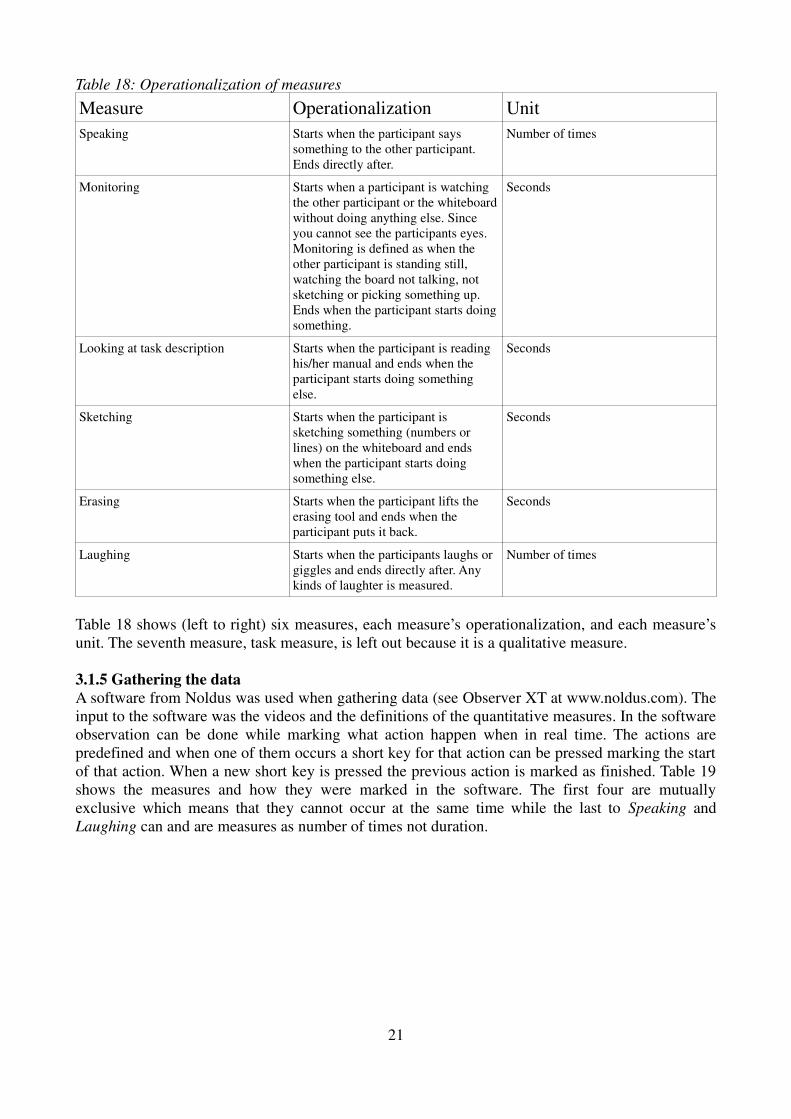
Table 18: Operationalization of measures
Measure Operationalization Unit
Speaking Starts when the participant says
something to the other participant.
Ends directly after.
Number of times
Monitoring Starts when a participant is watching
the other participant or the whiteboard
without doing anything else. Since
you cannot see the participants eyes.
Monitoring is defined as when the
other participant is standing still,
watching the board not talking, not
sketching or picking something up.
Ends when the participant starts doing
something.
Seconds
Looking at task description Starts when the participant is reading
his/her manual and ends when the
participant starts doing something
else.
Seconds
Sketching Starts when the participant is
sketching something (numbers or
lines) on the whiteboard and ends
when the participant starts doing
something else.
Seconds
Erasing Starts when the participant lifts the
erasing tool and ends when the
participant puts it back.
Seconds
Laughing Starts when the participants laughs or
giggles and ends directly after. Any
kinds of laughter is measured.
Number of times
Table 18 shows (left to right) six measures, each measure’s operationalization, and each measure’s
unit. The seventh measure, task measure, is left out because it is a qualitative measure.
3.1.5 Gathering the data
A software from Noldus was used when gathering data (see Observer XT at www.noldus.com). The
input to the software was the videos and the definitions of the quantitative measures. In the software
observation can be done while marking what action happen when in real time. The actions are
predefined and when one of them occurs a short key for that action can be pressed marking the start
of that action. When a new short key is pressed the previous action is marked as finished. Table 19
shows the measures and how they were marked in the software. The first four are mutually
exclusive which means that they cannot occur at the same time while the last to Speaking and
Laughing can and are measures as number of times not duration.
21

Table 19: Marking the measures
Measure Marked as
Speaking Non exclusive
Monitoring Mutually exclusive
Looking at task description Mutually exclusive
Sketching Mutually exclusive
Erasing Mutually exclusive
Laughing Non exclusive
This Table (Table 19) shows the measures and how they are marked in the software. The first four
are mutually exclusive which means that they cannot happen at the same time. When a new short
key is pressed the action is marked as finished. Speaking and Laughing are measured as number of
times and are non exclusive which means that when they are pressed the action starts and stops
marking just the number of occurrences not the duration.
3.1.6 Reflections on the measures chosen
The pros of user studies and observation are that they are easy to perform, give insights about the
social processes, have a high ecological validity, are holistic and give the observed point of view.
Ecological validity means that they are context dependent and holistic means that they give
explanations that includes a correlation of many measures. The cons of an observation are limits to
what can be observed, reliability and that it can be hard to generalise the results. Since the
researcher is subjective and the data comes directly from him or her it is hard to duplicate the study
and measure the measures in the way that the researcher did. Watching a video and clicking on a
button is subjective since it depends on one participant’s reaction time. However since one
participant makes the same mistakes and the same thing right at all times difference in two
participants mistakes were not bias the study. Since many videos were watched, the response time
for pressing the short keys could have changed over time. For example in the beginning the
participant pressing the short keys may be extra reactive to changes and in the end the participant
could have developed a skill for seeing when things are going to happen which means that the same
occurrence would have different start and stop time if they happened in the beginning or in the end
of the user study.
3.2 Analysing the data
Data from the experiment were collected in the Noldus software and were transferred to Excel
sheets. Statistical consultants were hired from Chalmers in order to make a statistical setup of the
analysis and to be able to give statistical advice. The analysis of the data was done in two steps:
quantitative data (section 3.2.1) and qualitative data (section 3.2.2). The quantitative data were
analysed with ANOVA and Poison regression and the qualitative data were analysed in a frequency-
and a trend analysis.
3.2.1 Quantitative analysis
The difference of the mean scores of each of the measures was investigated in a two-way ANOVA
or a Poison Regression. ANOVA was used for the measures producing duration values (Monitoring,
Looking at task description, Sketching and Erasing) since Poison Regression was used for the
measures that does not produce normal distributed values (the measures: Speaking and Laughing).
Task and conditions are independent variables and Speaking, Monitoring, Looking at task
description, Sketching, Erasing and Laughing are dependent. The variables and set-up for the
analysis is seen in Table 20 and 21.
22

Table 20: The independent and experimental values for the study
Independent variables Experimental values
Condition Co-located, Skype-video and CollaBoard
Task A, B and C
In the Table 20, the independent and experimental values for the experimental data analysis are
seen.
Table 21: The dependent variables/measures for the experimental data analysis
Dependent
variables/measures
Model assumed Unit
Monitoring Normal, 2-way ANOVA Duration; seconds
Looking at task description Normal, 2-way ANOVA Duration; seconds
Sketching Normal, 2-way ANOVA Duration; seconds
Erasing Normal, 2-way ANOVA Duration; seconds
Speaking Poision Frequency; 1/seconds
Laughing Poision Frequency; 1/seconds
Table 21 shows (from left to right) the dependent variables also called measures, the model assumed
and their units.
In order to perform these calculations SPSS was used. In order to see significance in the data a
primary and secondary measure were chosen. According to a Bonferroni correction the p-values has
to be lower than 0.025 instead of 0.05 If all measures were evenly chosen for a significance test
each of the tests would have to have a p-value lower than 0.0083 in order to be significant. Two
variables were chosen as a primary and secondary measure sharing the 5 percent. Since the 5
percent also can be chosen so that the sum of the percent is 5 the two measures were divided into 3
and 2 percent, Table 22. The primary measure was chosen to be Speaking and the second measure
was chosen to be Monitoring. The hypothesis is that Speaking and Monitoring will have greater
differences for Condition and Task than the other measures since they are more required for
collaboration than the others. Speaking is thought to be more interesting than Monitoring since it
was seen in the videos that there were a bigger difference in Speaking than for Monitoring. The
other measures were analysed descriptively (Sketching, Looking at paper, Erasing and Laughing)
which means that they were analysed in the same way as the primary and secondary measure but
that the significance was not be considered. Since there were some zeroes in the data and since the
data from two participants are dependent they were put together forming a pair wise data.
23
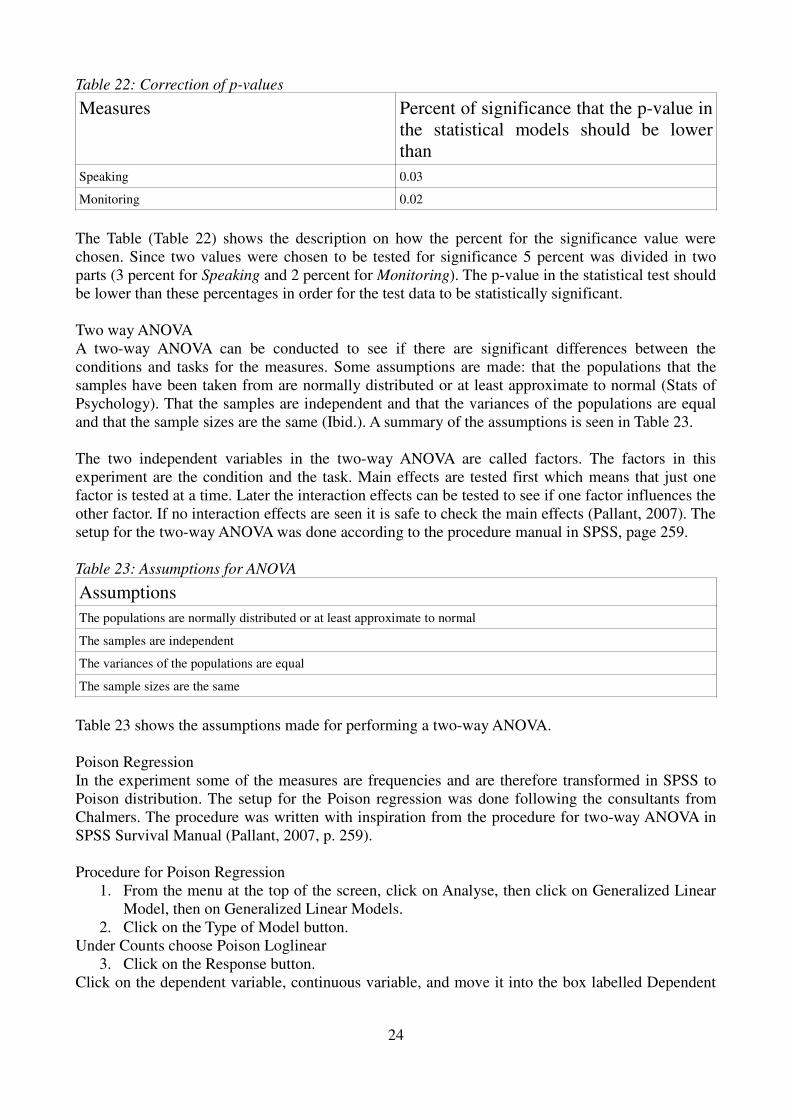
Table 22: Correction of p-values
Measures Percent of significance that the p-value in
the statistical models should be lower
than
Speaking 0.03
Monitoring 0.02
The Table (Table 22) shows the description on how the percent for the significance value were
chosen. Since two values were chosen to be tested for significance 5 percent was divided in two
parts (3 percent for Speaking and 2 percent for Monitoring). The p-value in the statistical test should
be lower than these percentages in order for the test data to be statistically significant.
Two way ANOVA
A two-way ANOVA can be conducted to see if there are significant differences between the
conditions and tasks for the measures. Some assumptions are made: that the populations that the
samples have been taken from are normally distributed or at least approximate to normal (Stats of
Psychology). That the samples are independent and that the variances of the populations are equal
and that the sample sizes are the same (Ibid.). A summary of the assumptions is seen in Table 23.
The two independent variables in the two-way ANOVA are called factors. The factors in this
experiment are the condition and the task. Main effects are tested first which means that just one
factor is tested at a time. Later the interaction effects can be tested to see if one factor influences the
other factor. If no interaction effects are seen it is safe to check the main effects (Pallant, 2007). The
setup for the two-way ANOVA was done according to the procedure manual in SPSS, page 259.
Table 23: Assumptions for ANOVA
Assumptions
The populations are normally distributed or at least approximate to normal
The samples are independent
The variances of the populations are equal
The sample sizes are the same
Table 23 shows the assumptions made for performing a two-way ANOVA.
Poison Regression
In the experiment some of the measures are frequencies and are therefore transformed in SPSS to
Poison distribution. The setup for the Poison regression was done following the consultants from
Chalmers. The procedure was written with inspiration from the procedure for two-way ANOVA in
SPSS Survival Manual (Pallant, 2007, p. 259).
Procedure for Poison Regression
1. From the menu at the top of the screen, click on Analyse, then click on Generalized Linear
Model, then on Generalized Linear Models.
2. Click on the Type of Model button.
Under Counts choose Poison Loglinear
3. Click on the Response button.
Click on the dependent variable, continuous variable, and move it into the box labelled Dependent
24
variable.
4. Click on the Predictors button.
From the factors listed on the right hand side, choose the independent variables (in this case
Condition and Task). Click on them and move them to the box labelled Factors.
5. Click on the Model button.
Click on the factors and scroll down in the Build types to find Main effect and move them to the
box labelled Model. If you are interested in Interaction effects. Mark the factors and choose
Interaction in the Build types scrolling list and move them to the box labelled Model.
6. Click on the Statistics button
Click on Include exponential parameter estimates.
7. Click on OK
3.6.2 Qualitative analysis
The qualitative data are action-over-time-graphs that come from the Noldus software. These graphs
were created when the user study was performed, when the short keys for every action are pressed it
formed a graph were all actions are seen in order of appearances. Each action forms a block that
shows the duration of the action and the start and stop time. These graphs were analysed qualitative
by comparing the graphs to each other and quantitative by calculating and comparing number of
action changes. With this graph a deeper investigation of the Task process was made.
The analysis was done in two steps, see Table 24. First a frequency analysis over the action changes
was calculated to see if there are any changes of action-blocks in conditions or tasks. An action
change consists of two action-blocks which are counted to see how many of every change there
exists. This way the qualitative data can be analysed in a quantitative way. The differences between
groups were also investigated. The second step is to analyse each graph overall in order to
investigate trends, this is called the qualitative analysis. In the qualitative analysis the order of the
action changes were analysed to see if there are differences in conditions, tasks or groups. Also the
behaviour of the participants and the size of the action-blocks were observed.
Table 24: The qualitative analysis
Qualitative analysis Difference in Condition, Task and Group
Frequency analysis Number of action-block changes
Trend analysis Trends in action-block changes, participant behaviour and
size of action-blocks
The Table (Table 24) states how the qualitative analysis was performed. The Task process were
analysed with a frequency analysis that looked at the number of action-block changes and a trend
analysis that focuses on the trends of the changes, participant behaviour and the size of the action-
blocks.
Frequency analysis
The action-over-time-graphs were analysed in a frequency analysis in order to see if there are
changes in number of action changes in Condition, Tasks or Groups. Some assumptions are made to
simplify the calculations, Table 25. First an action-block is counted only once because it is assumed
that a participant goes from one action to another and later back again. This means that the order of
the action-blocks in the action change is not noted. The second assumption is that if the actions are
uneven the last action-block was not counted, however if an action-block is started but not finished
in one task session it is counted since duration of the action is not considered. The action changes
are given shorter names in order to simplify Table-writing and understanding, Table 26.
25

Table 25: Assumptions for frequency analysis
Assumptions Calculation simplification
The number of changes going from action 1 to 2 is the
same for going from 2 to 1
An action-block is counted once and for example
Monitoring to Sketching is the same as Sketching to
Monitoring
If there are an uneven number of actions the last one was
not be counted
Since the action changes are counted in pairs the last
action-block was not be counted if the actions are in an
uneven number
Since the duration of a block is not considered an action-
block that is not within the time-limit of a task is counted
as a whole block
An action-block counts even though it is not a whole
block
The assumptions for the frequency analysis and what calculation simplifications they give are seen
in Table 25.
Table 26: Action changes
Action changes Notation
Monitoring - Looking at task description or
Looking at task description - Monitoring
Looking at task description and Monitoring
Monitoring - Sketching or
Sketching – Monitoring
Monitoring and Sketching
Looking at task description - Sketching or
Sketching - Looking at task description
Looking at task description and Sketching
Monitoring - Erasing or
Erasing - Monitoring
Erasing and Monitoring
Sketching - Erasing or
Erasing - Sketching
Erasing and Sketching
Looking at task description - Erasing or
Erasing - Looking at task description
Erasing and Looking at task description
Table 26 shows the names and notations for the action changes.
Trend analysis
The action-over-time-graphs were analysed in a qualitative analysis in order to see if there are
trends in the overall graph in conditions, tasks or groups. The trend analysis was done on the order
of action changes, the participant behaviour and the sizes of action-blocks.
26
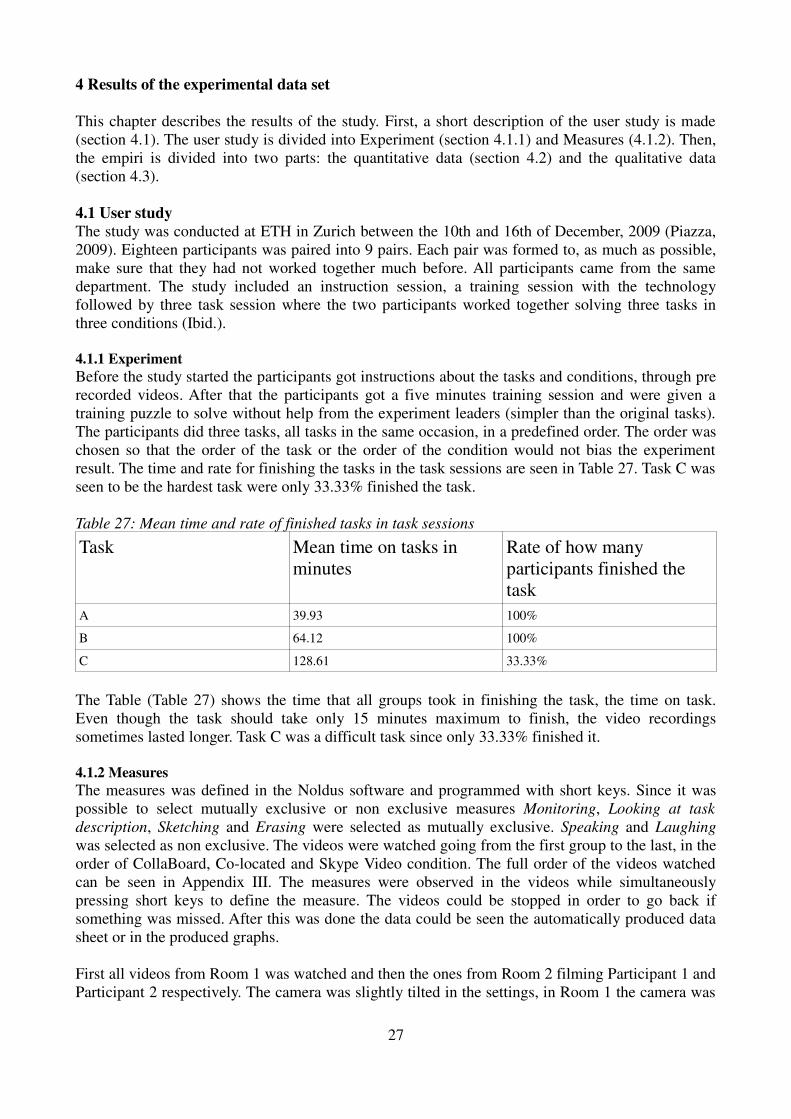
4 Results of the experimental data set
This chapter describes the results of the study. First, a short description of the user study is made
(section 4.1). The user study is divided into Experiment (section 4.1.1) and Measures (4.1.2). Then,
the empiri is divided into two parts: the quantitative data (section 4.2) and the qualitative data
(section 4.3).
4.1 User study
The study was conducted at ETH in Zurich between the 10th and 16th of December, 2009 (Piazza,
2009). Eighteen participants was paired into 9 pairs. Each pair was formed to, as much as possible,
make sure that they had not worked together much before. All participants came from the same
department. The study included an instruction session, a training session with the technology
followed by three task session where the two participants worked together solving three tasks in
three conditions (Ibid.).
4.1.1 Experiment
Before the study started the participants got instructions about the tasks and conditions, through pre
recorded videos. After that the participants got a five minutes training session and were given a
training puzzle to solve without help from the experiment leaders (simpler than the original tasks).
The participants did three tasks, all tasks in the same occasion, in a predefined order. The order was
chosen so that the order of the task or the order of the condition would not bias the experiment
result. The time and rate for finishing the tasks in the task sessions are seen in Table 27. Task C was
seen to be the hardest task were only 33.33% finished the task.
Table 27: Mean time and rate of finished tasks in task sessions
Task Mean time on tasks in
minutes
Rate of how many
participants finished the
task
A 39.93 100%
B 64.12 100%
C 128.61 33.33%
The Table (Table 27) shows the time that all groups took in finishing the task, the time on task.
Even though the task should take only 15 minutes maximum to finish, the video recordings
sometimes lasted longer. Task C was a difficult task since only 33.33% finished it.
4.1.2 Measures
The measures was defined in the Noldus software and programmed with short keys. Since it was
possible to select mutually exclusive or non exclusive measures Monitoring, Looking at task
description, Sketching and Erasing were selected as mutually exclusive. Speaking and Laughing
was selected as non exclusive. The videos were watched going from the first group to the last, in the
order of CollaBoard, Co-located and Skype Video condition. The full order of the videos watched
can be seen in Appendix III. The measures were observed in the videos while simultaneously
pressing short keys to define the measure. The videos could be stopped in order to go back if
something was missed. After this was done the data could be seen the automatically produced data
sheet or in the produced graphs.
First all videos from Room 1 was watched and then the ones from Room 2 filming Participant 1 and
Participant 2 respectively. The camera was slightly tilted in the settings, in Room 1 the camera was
27

placed almost straight behind the participants and in Room 2 it was placed filming the participant
from the left.
4.2 Quantitative data
The quantitative data from the primary and secondary measures will first be presented, Speaking
(section 4.2.1) and Monitoring (section 4.2.2), followed by the descriptive data from the rest of the
measures (section 4.2.3), Looking at task description, Sketching, Erasing and Laughing.
4.2.1 Primary measure - Speaking (RQ1)
A linear regression was first done on Speaking and Condition and then on Task in order to see if
there is significant correlation. Remember that in order for the primary measure to be significant the
p-value needs to be smaller than 0.03. The linear regression showed no significance for Condition, p
= 0.54, and statistical significance for Task, p < 0.001. The effect of Task (b = 25.06, p = 0.001) is
significant and its coefficient is positive indicating that the higher difficulty in task the higher
amount of Speaking. However, since the differences between time on task can contribute to the
significance, a multiple regression was done. The multiple regression showed that there was
significant correlation, between Speaking and Time on task (b = 0.054, p = 0.000) and the
coefficient B = 0.897 is positive and that no significant correlation could be seen for Speaking and
Task (b = -1.354, p = 0.82, B = -0.03) (the calculations for Speaking are seen in Appendix IV).
Parameter Estimators can be seen in Table 28 and in the box-plots, Figure 6 and 7. It is seen that the
means of conditions are similar to one another but that the means for tasks differ. In the graph for
means Task C differs from Task A and B, see Figure 8. The same is seen in the table and the box-
plot.
Table 28: Parameter estimators for Speaking
Condition Mean Standard
Deviation
Median Number of data
Co-located 56.44 18.97 54.00 9
Skype Video 64.00 32.66 71.00 9
CollaBoard 67.11 44.45 50.00 9
Task Mean Standard
Deviation
Median Number of data
A 52.11 27.23 49.00 9
B 42.67 24.78 42.00 9
C 92.78 29.99 87.00 9
The Table (Table 28), shows the parameter estimators for Speaking. The means for conditions are
similar to one another while the means for task differ.
28
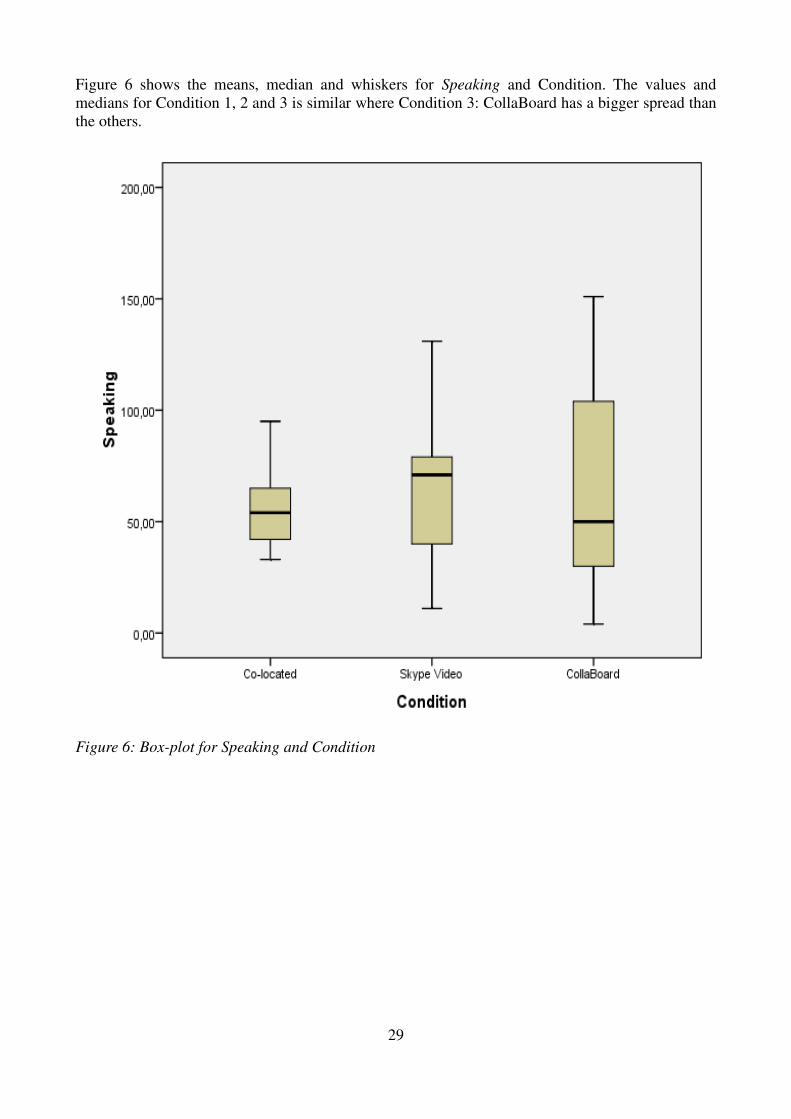
Figure 6 shows the means, median and whiskers for Speaking and Condition. The values and
medians for Condition 1, 2 and 3 is similar where Condition 3: CollaBoard has a bigger spread than
the others.
Figure 6: Box-plot for Speaking and Condition
29

In Figure 7, the means, median, whiskers and outliers for Speaking and Task is seen. The medians
for Task A and B are similar, while Task B has outliers. Task C has a higher median and values than
Task A and B. Task C also has a big spread.
Figure 7: Box-plot for Speaking and Task
30
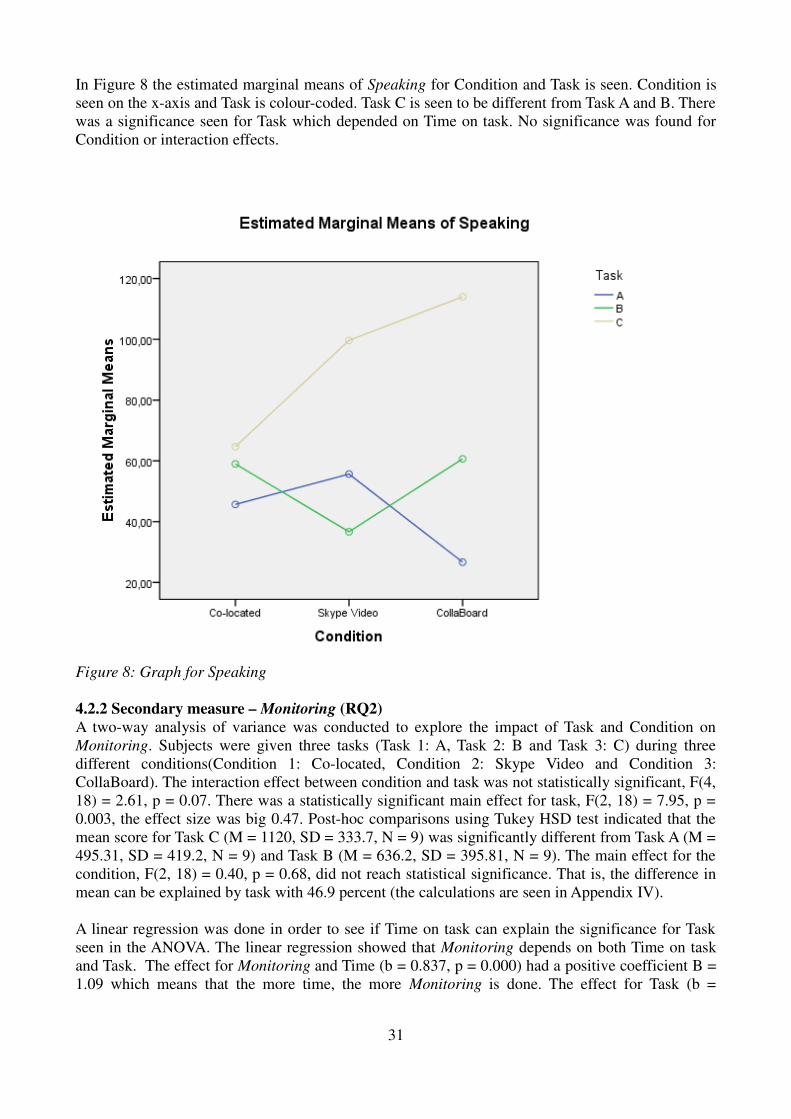
In Figure 8 the estimated marginal means of Speaking for Condition and Task is seen. Condition is
seen on the x-axis and Task is colour-coded. Task C is seen to be different from Task A and B. There
was a significance seen for Task which depended on Time on task. No significance was found for
Condition or interaction effects.
Figure 8: Graph for Speaking
4.2.2 Secondary measure – Monitoring (RQ2)
A two-way analysis of variance was conducted to explore the impact of Task and Condition on
Monitoring. Subjects were given three tasks (Task 1: A, Task 2: B and Task 3: C) during three
different conditions(Condition 1: Co-located, Condition 2: Skype Video and Condition 3:
CollaBoard). The interaction effect between condition and task was not statistically significant, F(4,
18) = 2.61, p = 0.07. There was a statistically significant main effect for task, F(2, 18) = 7.95, p =
0.003, the effect size was big 0.47. Post-hoc comparisons using Tukey HSD test indicated that the
mean score for Task C (M = 1120, SD = 333.7, N = 9) was significantly different from Task A (M =
495.31, SD = 419.2, N = 9) and Task B (M = 636.2, SD = 395.81, N = 9). The main effect for the
condition, F(2, 18) = 0.40, p = 0.68, did not reach statistical significance. That is, the difference in
mean can be explained by task with 46.9 percent (the calculations are seen in Appendix IV).
A linear regression was done in order to see if Time on task can explain the significance for Task
seen in the ANOVA. The linear regression showed that Monitoring depends on both Time on task
and Task. The effect for Monitoring and Time (b = 0.837, p = 0.000) had a positive coefficient B =
1.09 which means that the more time, the more Monitoring is done. The effect for Task (b =
31
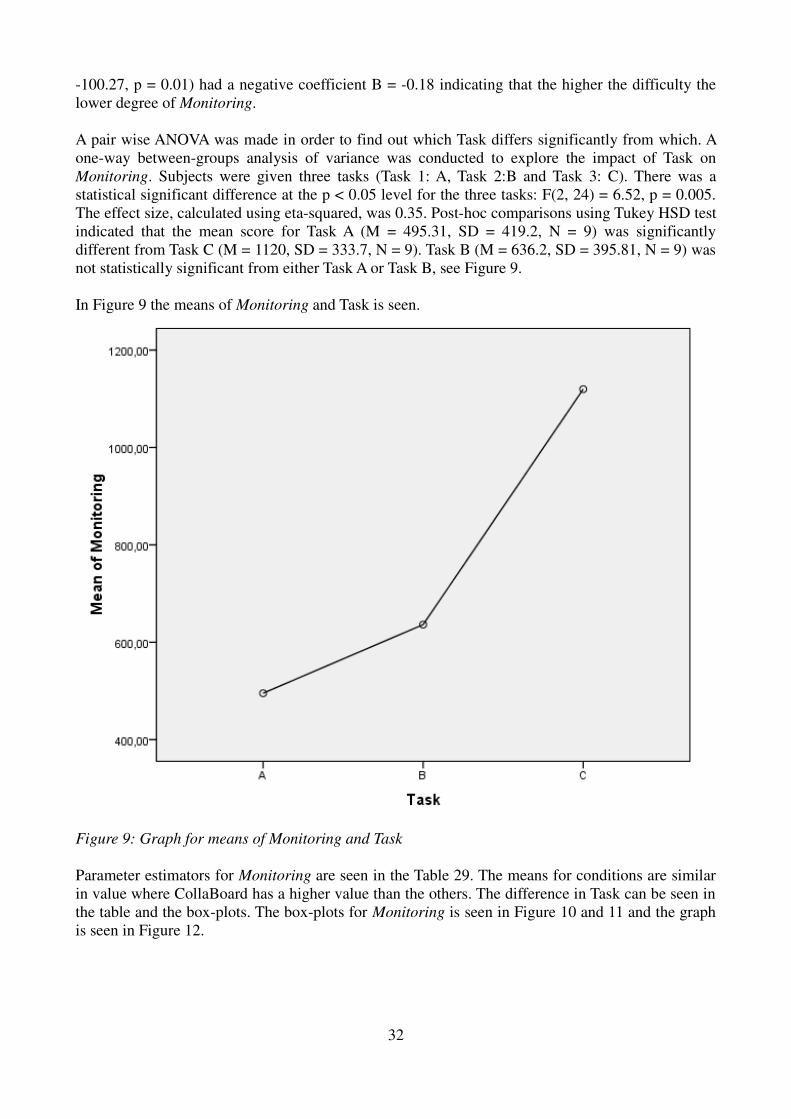
-100.27, p = 0.01) had a negative coefficient B = -0.18 indicating that the higher the difficulty the
lower degree of Monitoring.
A pair wise ANOVA was made in order to find out which Task differs significantly from which. A
one-way between-groups analysis of variance was conducted to explore the impact of Task on
Monitoring. Subjects were given three tasks (Task 1: A, Task 2:B and Task 3: C). There was a
statistical significant difference at the p < 0.05 level for the three tasks: F(2, 24) = 6.52, p = 0.005.
The effect size, calculated using eta-squared, was 0.35. Post-hoc comparisons using Tukey HSD test
indicated that the mean score for Task A (M = 495.31, SD = 419.2, N = 9) was significantly
different from Task C (M = 1120, SD = 333.7, N = 9). Task B (M = 636.2, SD = 395.81, N = 9) was
not statistically significant from either Task A or Task B, see Figure 9.
In Figure 9 the means of Monitoring and Task is seen.
Figure 9: Graph for means of Monitoring and Task
Parameter estimators for Monitoring are seen in the Table 29. The means for conditions are similar
in value where CollaBoard has a higher value than the others. The difference in Task can be seen in
the table and the box-plots. The box-plots for Monitoring is seen in Figure 10 and 11 and the graph
is seen in Figure 12.
32

Table 29: Parameter estimators for Monitoring
Condition Mean Standard
Deviation
Median Number of data
Co-located 669.82 338.92 558.57 9
Skype Video 767.73 506.77 579.14 9
CollaBoard 813.93 549.02 822.41 9
Task Mean Standard
Deviation
Median Number of data
A 495.31 419.20 347.65 9
B 636.20 395.81 459.34 9
C 1119.97 333.73 1199.32 9
In the Table (Table 29) the means of Monitoring for conditions are similar to one another but the
mean for tasks differ. The mean of Task C is higher than of Task A and B which are similar in value.
Figure 10 shows the means, median and whiskers for Speaking and Condition. The means, medians
and spread are similar for the three conditions.
Figure 10: Box-plot for Monitoring and Condition
33
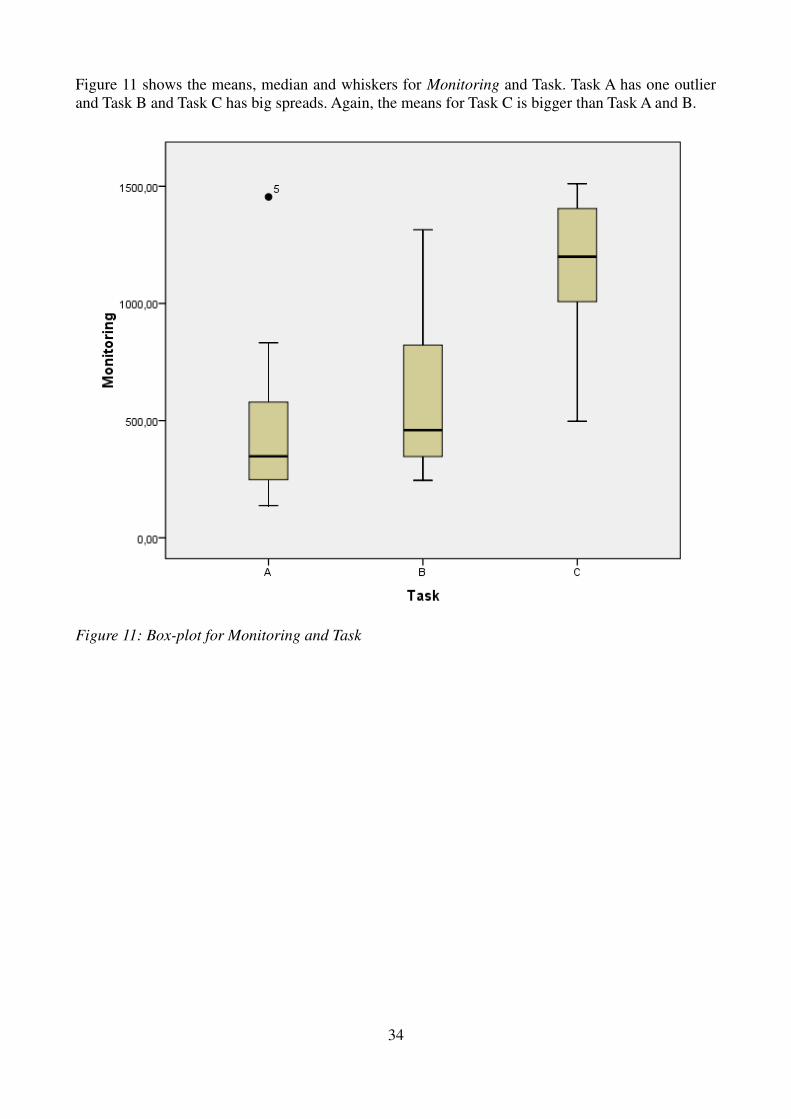
Figure 11 shows the means, median and whiskers for Monitoring and Task. Task A has one outlier
and Task B and Task C has big spreads. Again, the means for Task C is bigger than Task A and B.
Figure 11: Box-plot for Monitoring and Task
34
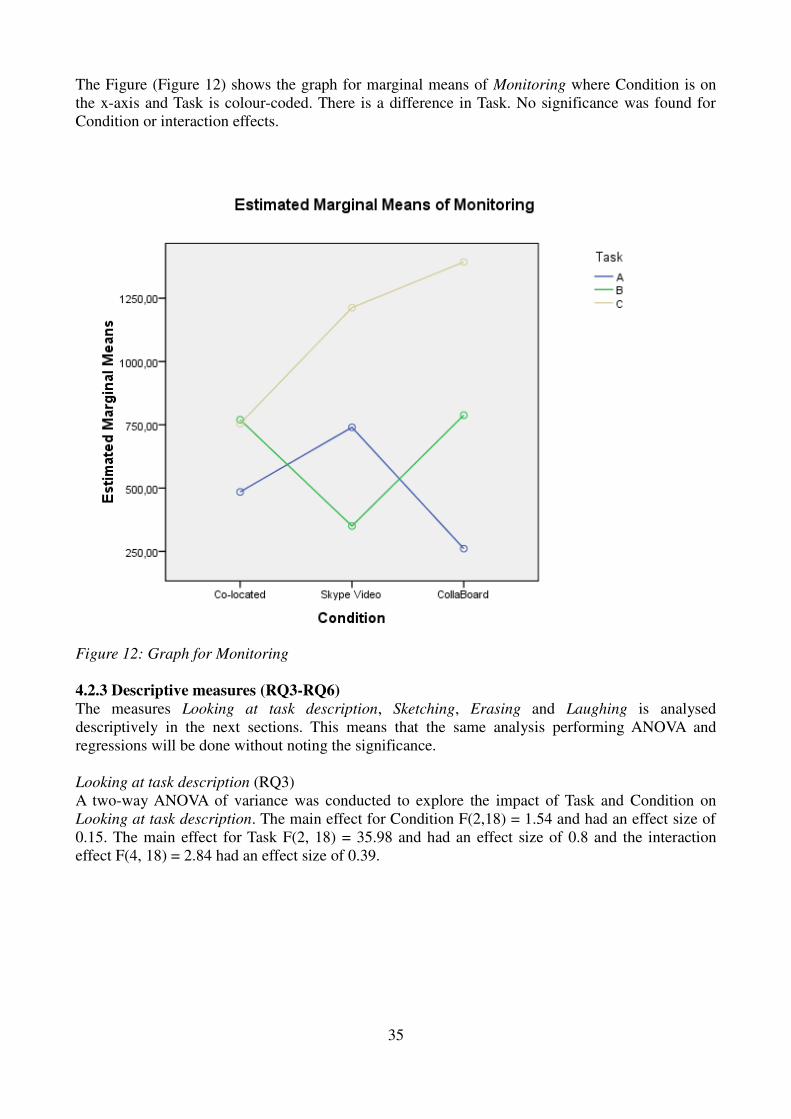
The Figure (Figure 12) shows the graph for marginal means of Monitoring where Condition is on
the x-axis and Task is colour-coded. There is a difference in Task. No significance was found for
Condition or interaction effects.
Figure 12: Graph for Monitoring
4.2.3 Descriptive measures (RQ3-RQ6)
The measures Looking at task description, Sketching, Erasing and Laughing is analysed
descriptively in the next sections. This means that the same analysis performing ANOVA and
regressions will be done without noting the significance.
Looking at task description (RQ3)
A two-way ANOVA of variance was conducted to explore the impact of Task and Condition on
Looking at task description. The main effect for Condition F(2,18) = 1.54 and had an effect size of
0.15. The main effect for Task F(2, 18) = 35.98 and had an effect size of 0.8 and the interaction
effect F(4, 18) = 2.84 had an effect size of 0.39.
35

The parameter estimator table, Table 30 and the box-plots, Figure 13 and 14 shows similar values
seen in both the primary and the secondary measures. The means for conditions are similar to one
another and the means for tasks differs. The same trend is seen in the graph for Looking at task
description means, Figure 15.
Table 30: Parameter estimators for Looking at task description
Condition Mean Standard
Deviation
Median Number of data
Co-located 94.42 81.30 46.09 9
Skype Video 68.48 38.18 65.53 9
CollaBoard 86.86 71.28 66.67 9
Task Mean Standard
Deviation
Median Number of data
A 55.17 18.61 54.32 9
B 37.64 9.11 37.59 9
C 156.95 61.49 158.68 9
The Table (Table 30) shows that the means of Looking at task description for condition are similar
to one another where the Co-located and CollaBoard has a higher mean than Skype Video. The
means for the tasks differ more. The mean of Task C is higher than of Task A and B where Task A
has a lower mean than Task B.
36

In Figure 13, the same is seen. The means for the conditions are similar where the spread is bigger
for the Co-located Condition than the others. Outliers are seen for Condition 2 and 3.
Figure 13: Box-plot for Looking at task description and Condition
37

In Figure 14, the box-plot for Looking at task description and Task is seen. Again, the means for
Task A and B are similar but the means for Task C are higher. The spread for Task B is smaller and
the spread for Task C is bigger.
Figure 14: Box-plot for Looking at task description and Task
38
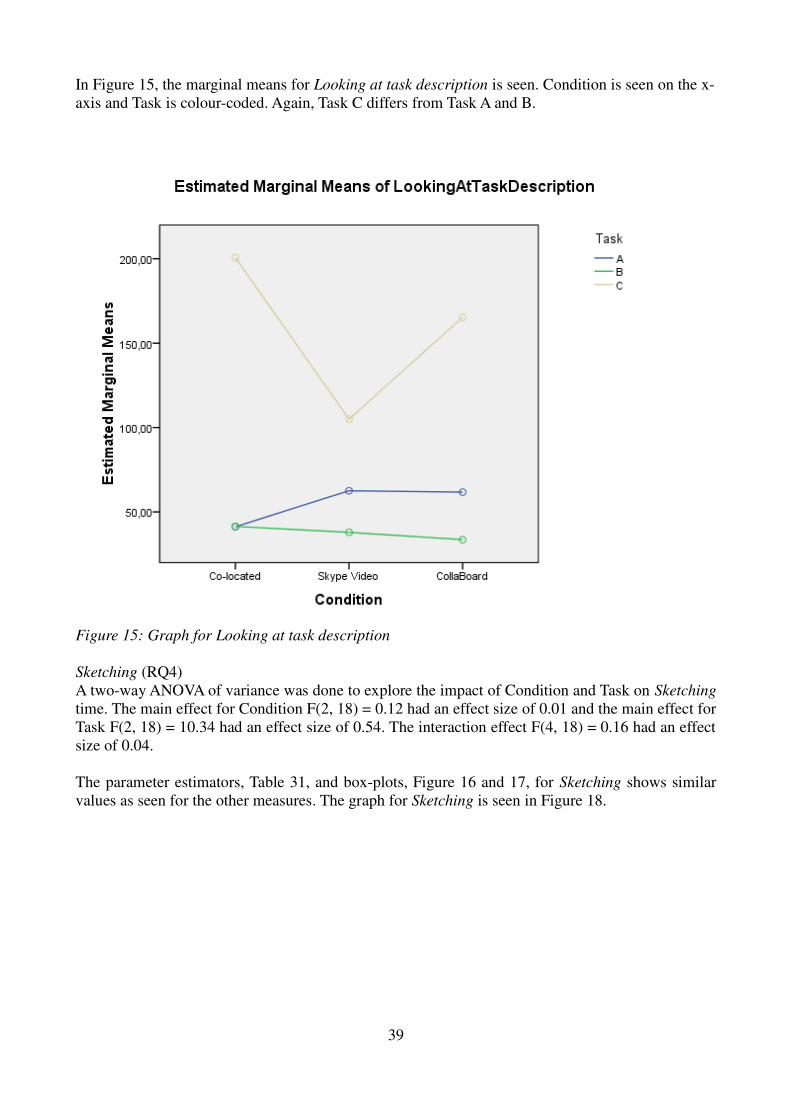
In Figure 15, the marginal means for Looking at task description is seen. Condition is seen on the x-
axis and Task is colour-coded. Again, Task C differs from Task A and B.
Figure 15: Graph for Looking at task description
Sketching (RQ4)
A two-way ANOVA of variance was done to explore the impact of Condition and Task on Sketching
time. The main effect for Condition F(2, 18) = 0.12 had an effect size of 0.01 and the main effect for
Task F(2, 18) = 10.34 had an effect size of 0.54. The interaction effect F(4, 18) = 0.16 had an effect
size of 0.04.
The parameter estimators, Table 31, and box-plots, Figure 16 and 17, for Sketching shows similar
values as seen for the other measures. The graph for Sketching is seen in Figure 18.
39
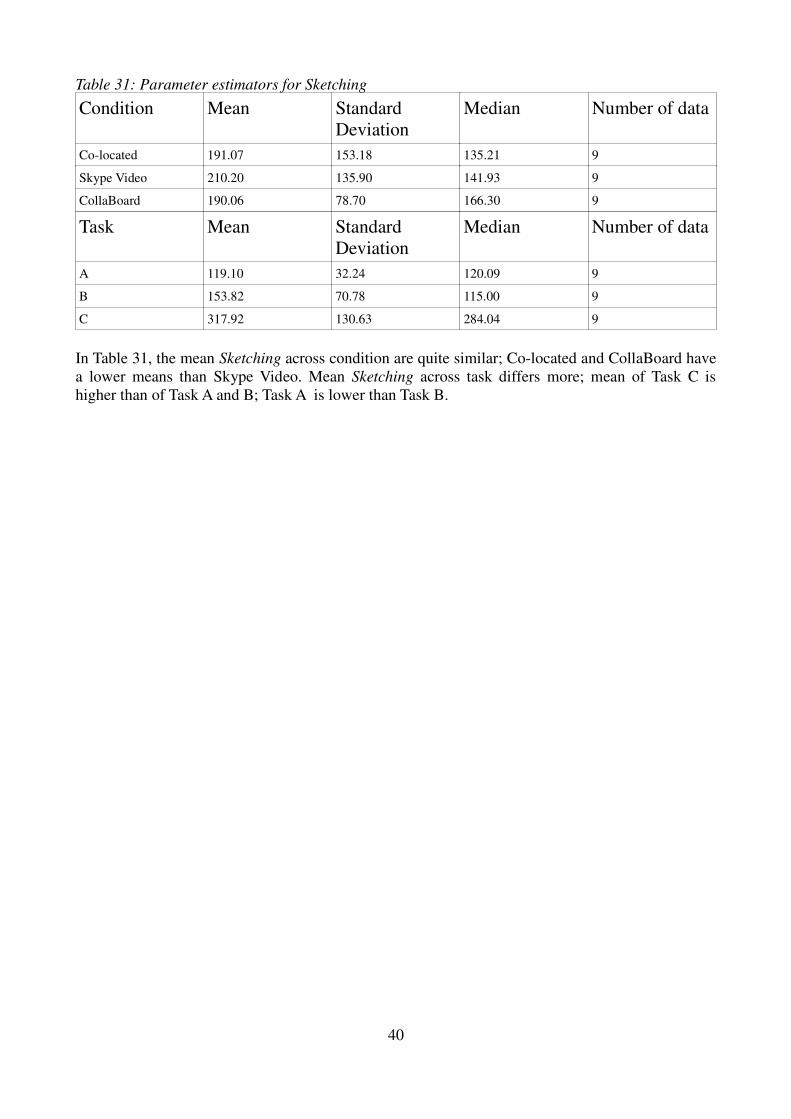
Table 31: Parameter estimators for Sketching
Condition Mean Standard
Deviation
Median Number of data
Co-located 191.07 153.18 135.21 9
Skype Video 210.20 135.90 141.93 9
CollaBoard 190.06 78.70 166.30 9
Task Mean Standard
Deviation
Median Number of data
A 119.10 32.24 120.09 9
B 153.82 70.78 115.00 9
C 317.92 130.63 284.04 9
In Table 31, the mean Sketching across condition are quite similar; Co-located and CollaBoard have
a lower means than Skype Video. Mean Sketching across task differs more; mean of Task C is
higher than of Task A and B; Task A is lower than Task B.
40

Figure 16 shows the box-plot for Sketching and Condition. The means are similar to one another as
well as the spread. The whisker for Skype Video is bigger than for the Co-located and CollaBoard
Condition. The Co-located Condition has one outlier.
Figure 16: Box-plot for Sketching and Condition
41
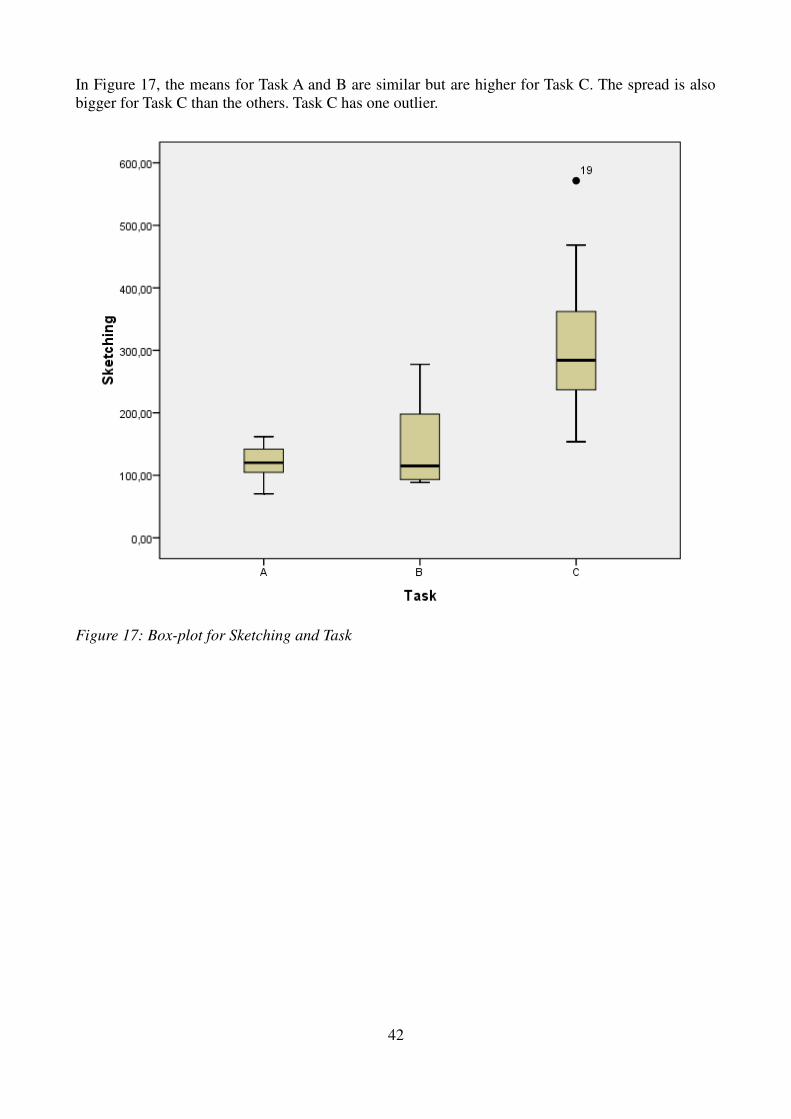
In Figure 17, the means for Task A and B are similar but are higher for Task C. The spread is also
bigger for Task C than the others. Task C has one outlier.
Figure 17: Box-plot for Sketching and Task
42
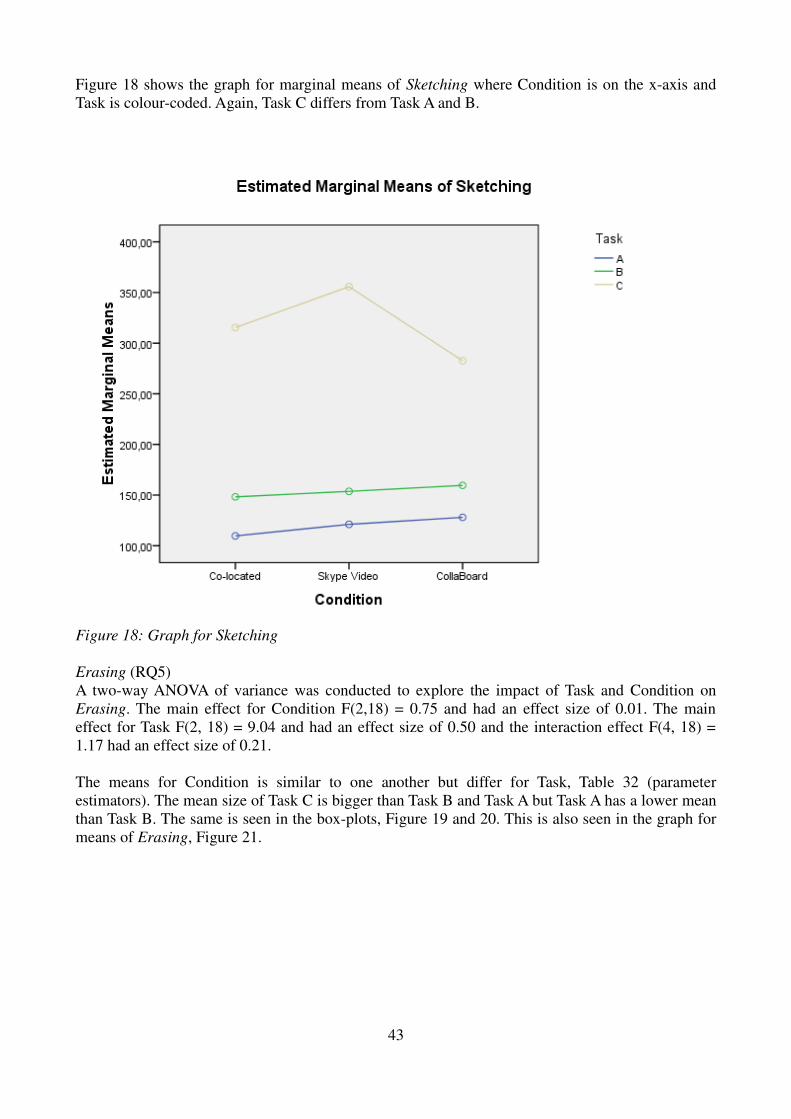
Figure 18 shows the graph for marginal means of Sketching where Condition is on the x-axis and
Task is colour-coded. Again, Task C differs from Task A and B.
Figure 18: Graph for Sketching
Erasing (RQ5)
A two-way ANOVA of variance was conducted to explore the impact of Task and Condition on
Erasing. The main effect for Condition F(2,18) = 0.75 and had an effect size of 0.01. The main
effect for Task F(2, 18) = 9.04 and had an effect size of 0.50 and the interaction effect F(4, 18) =
1.17 had an effect size of 0.21.
The means for Condition is similar to one another but differ for Task, Table 32 (parameter
estimators). The mean size of Task C is bigger than Task B and Task A but Task A has a lower mean
than Task B. The same is seen in the box-plots, Figure 19 and 20. This is also seen in the graph for
means of Erasing, Figure 21.
43
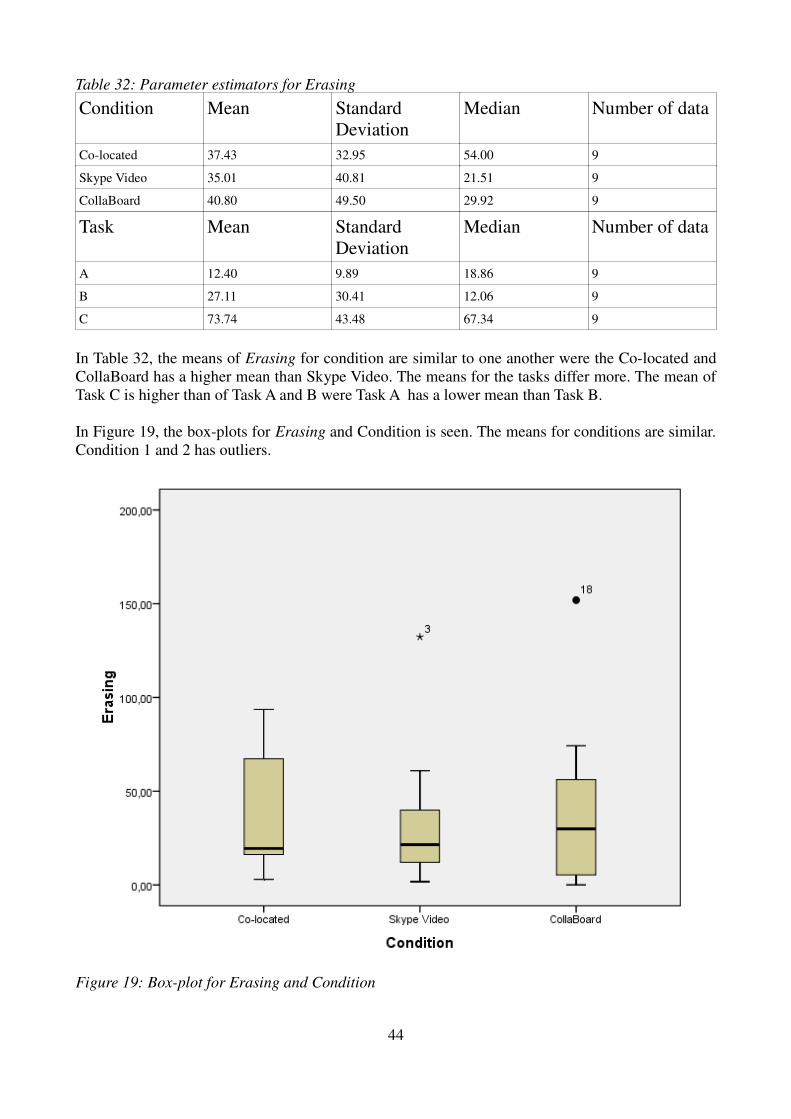
Table 32: Parameter estimators for Erasing
Condition Mean Standard
Deviation
Median Number of data
Co-located 37.43 32.95 54.00 9
Skype Video 35.01 40.81 21.51 9
CollaBoard 40.80 49.50 29.92 9
Task Mean Standard
Deviation
Median Number of data
A 12.40 9.89 18.86 9
B 27.11 30.41 12.06 9
C 73.74 43.48 67.34 9
In Table 32, the means of Erasing for condition are similar to one another were the Co-located and
CollaBoard has a higher mean than Skype Video. The means for the tasks differ more. The mean of
Task C is higher than of Task A and B were Task A has a lower mean than Task B.
In Figure 19, the box-plots for Erasing and Condition is seen. The means for conditions are similar.
Condition 1 and 2 has outliers.
Figure 19: Box-plot for Erasing and Condition
44
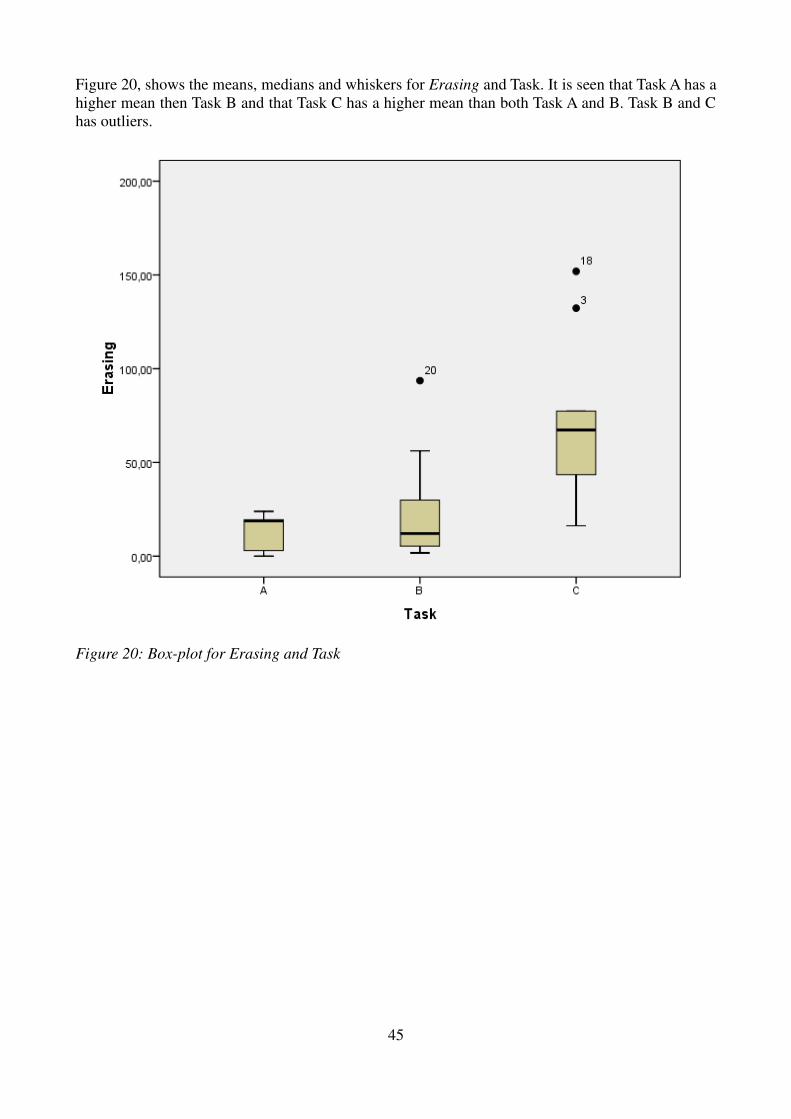
Figure 20, shows the means, medians and whiskers for Erasing and Task. It is seen that Task A has a
higher mean then Task B and that Task C has a higher mean than both Task A and B. Task B and C
has outliers.
Figure 20: Box-plot for Erasing and Task
45

The graph for marginal means of Erasing is seen in Figure 21, Condition is on the x-axis and Task
is colour-coded. Again, Task C differs from Task A and B.
Figure 21: Graph for Erasing
Laughing (RQ6)
The Co-located condition has a higher Poison Regression coefficient (B = 0.10, see Table 33) on
Laughing than CollaBoard (reference) and lower than for the Skype Video condition (B = -0.11).
Task A which has a lower coefficient (B = -1.60) on Laughing than Task B (B = -0.42) compared to
Task C. Table 32 shows the means for Laughing were for Condition the values are similar but differ
for Task. Here Task C has a higher mean (12.67) than Task B and A were Task B (6.11) has a higher
mean than Task A (2.67).
The same is seen in the parameter estimators, Table 34, the box-plots, Figure 22 and 23 and the
graph, Figure 24.
46
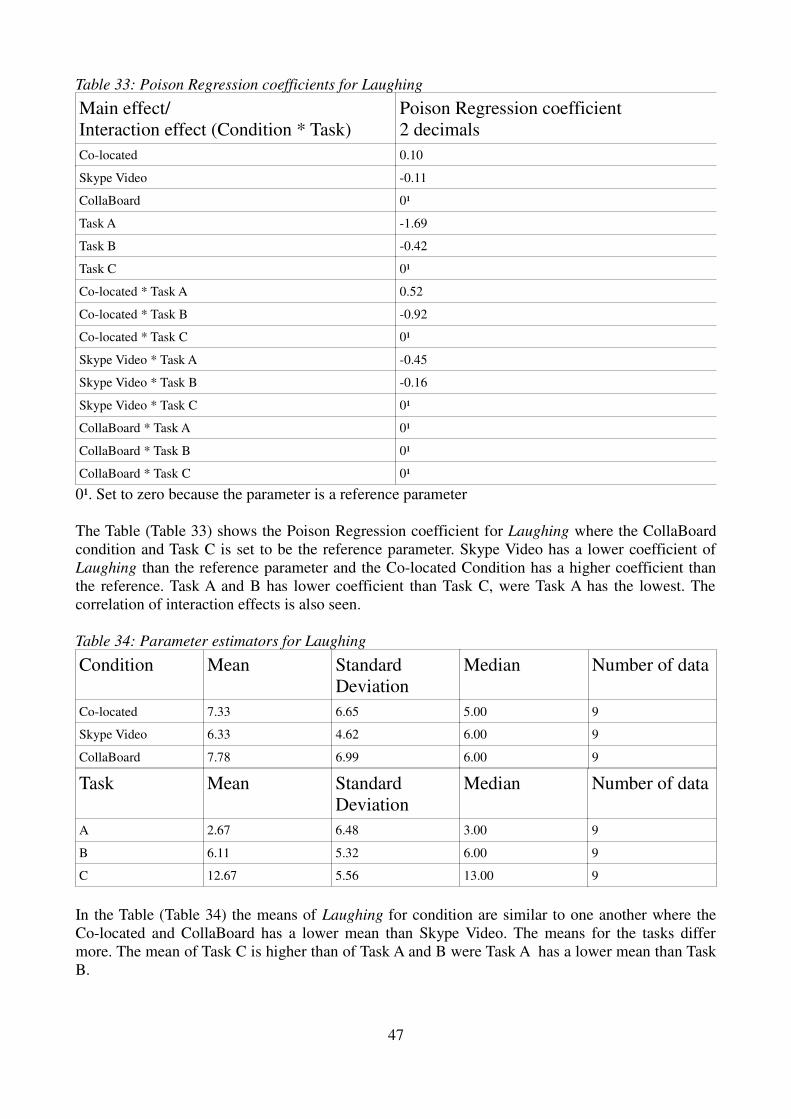
Table 33: Poison Regression coefficients for Laughing
Main effect/
Interaction effect (Condition * Task)
Poison Regression coefficient
2 decimals
Co-located 0.10
Skype Video -0.11
CollaBoard 0¹
Task A -1.69
Task B -0.42
Task C 0¹
Co-located * Task A 0.52
Co-located * Task B -0.92
Co-located * Task C 0¹
Skype Video * Task A -0.45
Skype Video * Task B -0.16
Skype Video * Task C 0¹
CollaBoard * Task A 0¹
CollaBoard * Task B 0¹
CollaBoard * Task C 0¹
0¹. Set to zero because the parameter is a reference parameter
The Table (Table 33) shows the Poison Regression coefficient for Laughing where the CollaBoard
condition and Task C is set to be the reference parameter. Skype Video has a lower coefficient of
Laughing than the reference parameter and the Co-located Condition has a higher coefficient than
the reference. Task A and B has lower coefficient than Task C, were Task A has the lowest. The
correlation of interaction effects is also seen.
Table 34: Parameter estimators for Laughing
Condition Mean Standard
Deviation
Median Number of data
Co-located 7.33 6.65 5.00 9
Skype Video 6.33 4.62 6.00 9
CollaBoard 7.78 6.99 6.00 9
Task Mean Standard
Deviation
Median Number of data
A 2.67 6.48 3.00 9
B 6.11 5.32 6.00 9
C 12.67 5.56 13.00 9
In the Table (Table 34) the means of Laughing for condition are similar to one another where the
Co-located and CollaBoard has a lower mean than Skype Video. The means for the tasks differ
more. The mean of Task C is higher than of Task A and B were Task A has a lower mean than Task
B.
47
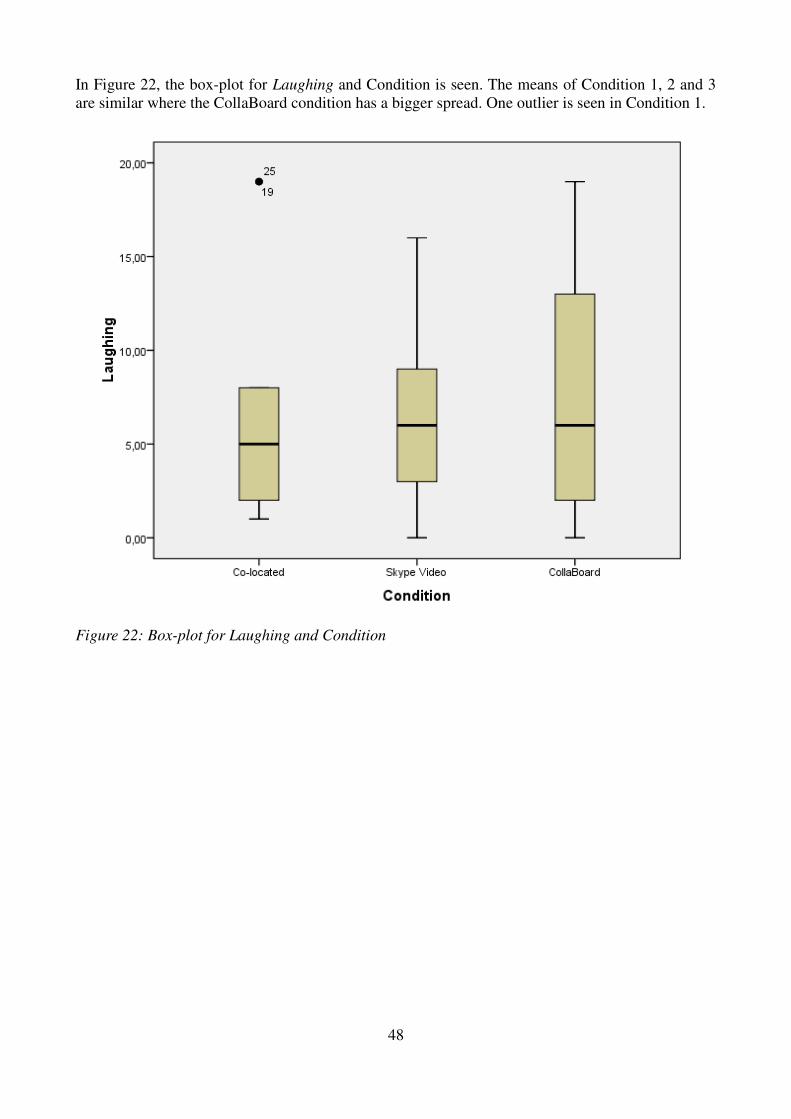
In Figure 22, the box-plot for Laughing and Condition is seen. The means of Condition 1, 2 and 3
are similar where the CollaBoard condition has a bigger spread. One outlier is seen in Condition 1.
Figure 22: Box-plot for Laughing and Condition
48

In Figure 23, the box-plot for Laughing and Task is seen. The medians, means and whiskers are
seen. Task C differs from Task A and B, where the means for Task B are bigger than Task A. The
spread of Task C is bigger than for Task A and B. There is one outlier for Task B.
Figure 23: Box-plot for Laughing and Task
49
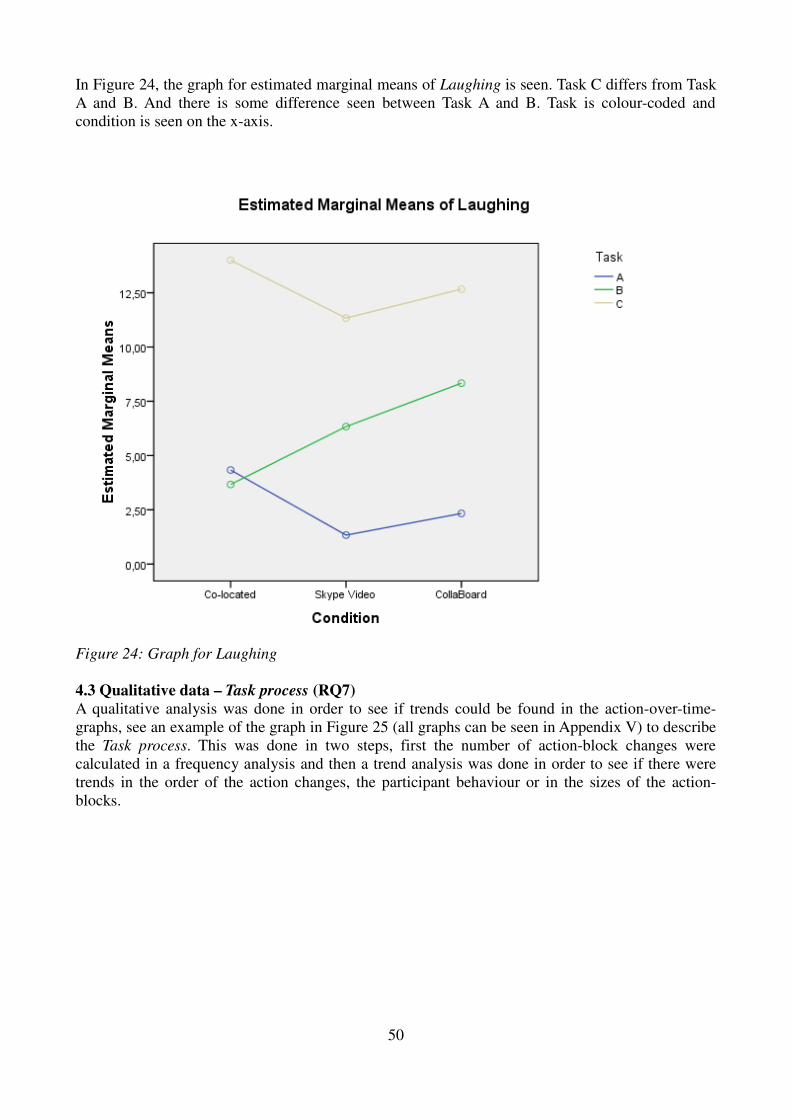
In Figure 24, the graph for estimated marginal means of Laughing is seen. Task C differs from Task
A and B. And there is some difference seen between Task A and B. Task is colour-coded and
condition is seen on the x-axis.
Figure 24: Graph for Laughing
4.3 Qualitative data – Task process (RQ7)
A qualitative analysis was done in order to see if trends could be found in the action-over-time-
graphs, see an example of the graph in Figure 25 (all graphs can be seen in Appendix V) to describe
the Task process. This was done in two steps, first the number of action-block changes were
calculated in a frequency analysis and then a trend analysis was done in order to see if there were
trends in the order of the action changes, the participant behaviour or in the sizes of the action-
blocks.
50
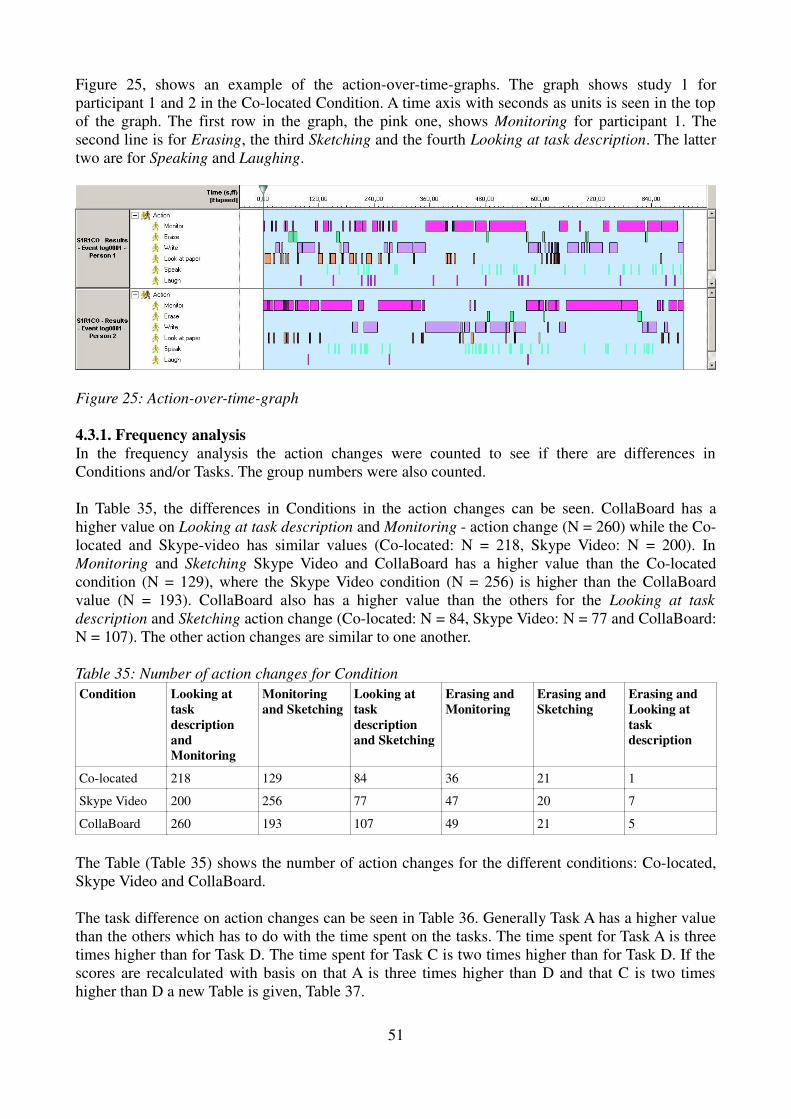
Figure 25, shows an example of the action-over-time-graphs. The graph shows study 1 for
participant 1 and 2 in the Co-located Condition. A time axis with seconds as units is seen in the top
of the graph. The first row in the graph, the pink one, shows Monitoring for participant 1. The
second line is for Erasing, the third Sketching and the fourth Looking at task description. The latter
two are for Speaking and Laughing.
Figure 25: Action-over-time-graph
4.3.1. Frequency analysis
In the frequency analysis the action changes were counted to see if there are differences in
Conditions and/or Tasks. The group numbers were also counted.
In Table 35, the differences in Conditions in the action changes can be seen. CollaBoard has a
higher value on Looking at task description and Monitoring - action change (N = 260) while the Co-
located and Skype-video has similar values (Co-located: N = 218, Skype Video: N = 200). In
Monitoring and Sketching Skype Video and CollaBoard has a higher value than the Co-located
condition (N = 129), where the Skype Video condition (N = 256) is higher than the CollaBoard
value (N = 193). CollaBoard also has a higher value than the others for the Looking at task
description and Sketching action change (Co-located: N = 84, Skype Video: N = 77 and CollaBoard:
N = 107). The other action changes are similar to one another.
Table 35: Number of action changes for Condition
Condition Looking at
task
description
and
Monitoring
Monitoring
and Sketching
Looking at
task
description
and Sketching
Erasing and
Monitoring
Erasing and
Sketching
Erasing and
Looking at
task
description
Co-located 218 129 84 36 21 1
Skype Video 200 256 77 47 20 7
CollaBoard 260 193 107 49 21 5
The Table (Table 35) shows the number of action changes for the different conditions: Co-located,
Skype Video and CollaBoard.
The task difference on action changes can be seen in Table 36. Generally Task A has a higher value
than the others which has to do with the time spent on the tasks. The time spent for Task A is three
times higher than for Task D. The time spent for Task C is two times higher than for Task D. If the
scores are recalculated with basis on that A is three times higher than D and that C is two times
higher than D a new Table is given, Table 37.
51
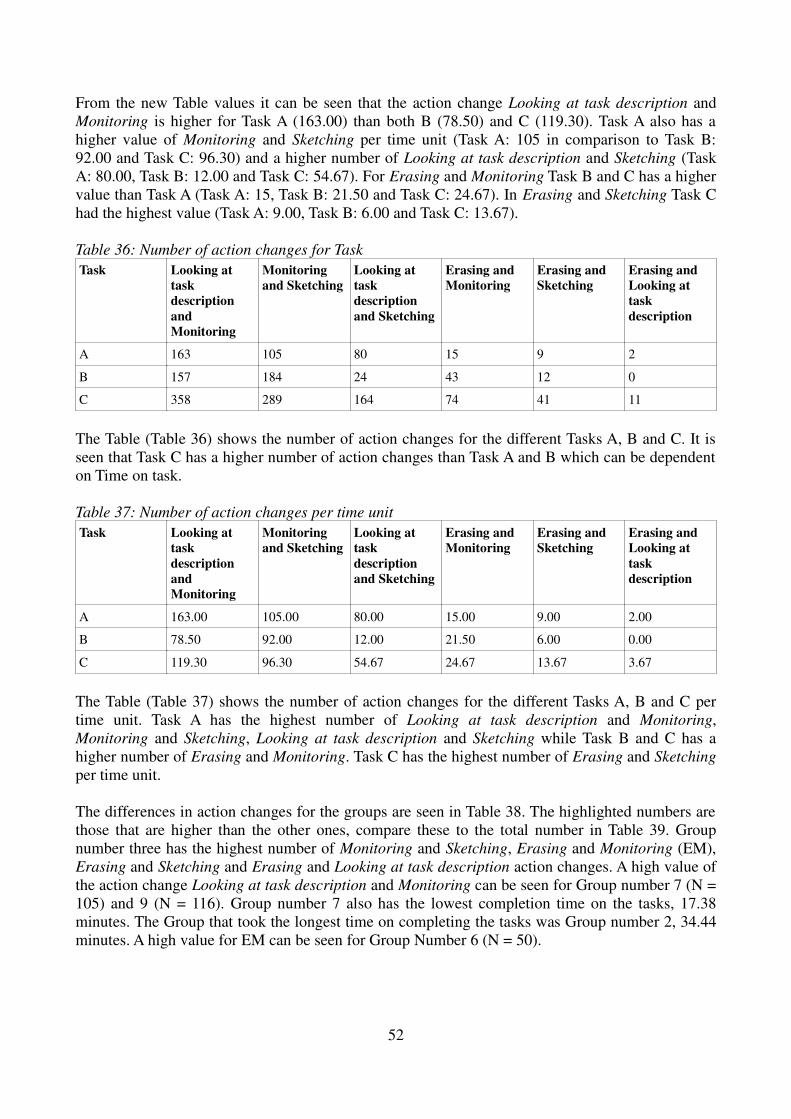
From the new Table values it can be seen that the action change Looking at task description and
Monitoring is higher for Task A (163.00) than both B (78.50) and C (119.30). Task A also has a
higher value of Monitoring and Sketching per time unit (Task A: 105 in comparison to Task B:
92.00 and Task C: 96.30) and a higher number of Looking at task description and Sketching (Task
A: 80.00, Task B: 12.00 and Task C: 54.67). For Erasing and Monitoring Task B and C has a higher
value than Task A (Task A: 15, Task B: 21.50 and Task C: 24.67). In Erasing and Sketching Task C
had the highest value (Task A: 9.00, Task B: 6.00 and Task C: 13.67).
Table 36: Number of action changes for Task
Task Looking at
task
description
and
Monitoring
Monitoring
and Sketching
Looking at
task
description
and Sketching
Erasing and
Monitoring
Erasing and
Sketching
Erasing and
Looking at
task
description
A 163 105 80 15 9 2
B 157 184 24 43 12 0
C 358 289 164 74 41 11
The Table (Table 36) shows the number of action changes for the different Tasks A, B and C. It is
seen that Task C has a higher number of action changes than Task A and B which can be dependent
on Time on task.
Table 37: Number of action changes per time unit
Task Looking at
task
description
and
Monitoring
Monitoring
and Sketching
Looking at
task
description
and Sketching
Erasing and
Monitoring
Erasing and
Sketching
Erasing and
Looking at
task
description
A 163.00 105.00 80.00 15.00 9.00 2.00
B 78.50 92.00 12.00 21.50 6.00 0.00
C 119.30 96.30 54.67 24.67 13.67 3.67
The Table (Table 37) shows the number of action changes for the different Tasks A, B and C per
time unit. Task A has the highest number of Looking at task description and Monitoring,
Monitoring and Sketching, Looking at task description and Sketching while Task B and C has a
higher number of Erasing and Monitoring. Task C has the highest number of Erasing and Sketching
per time unit.
The differences in action changes for the groups are seen in Table 38. The highlighted numbers are
those that are higher than the other ones, compare these to the total number in Table 39. Group
number three has the highest number of Monitoring and Sketching, Erasing and Monitoring (EM),
Erasing and Sketching and Erasing and Looking at task description action changes. A high value of
the action change Looking at task description and Monitoring can be seen for Group number 7 (N =
105) and 9 (N = 116). Group number 7 also has the lowest completion time on the tasks, 17.38
minutes. The Group that took the longest time on completing the tasks was Group number 2, 34.44
minutes. A high value for EM can be seen for Group Number 6 (N = 50).
52
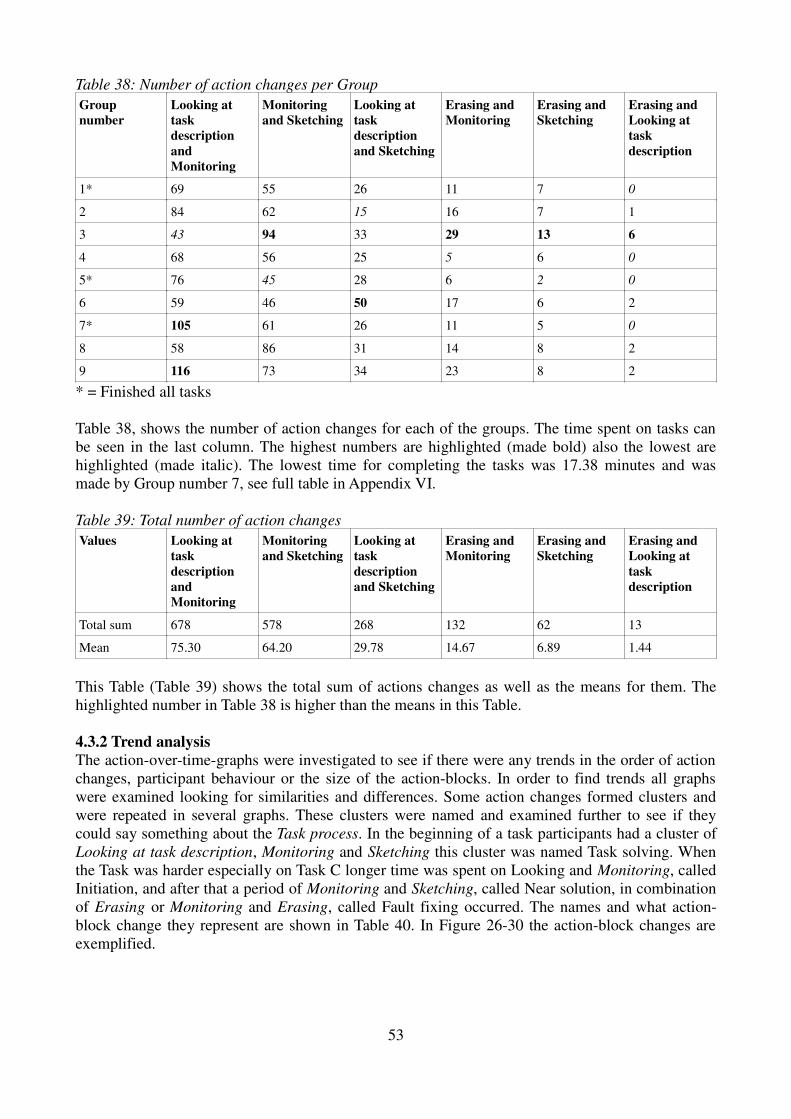
Table 38: Number of action changes per Group
Group
number
Looking at
task
description
and
Monitoring
Monitoring
and Sketching
Looking at
task
description
and Sketching
Erasing and
Monitoring
Erasing and
Sketching
Erasing and
Looking at
task
description
1* 69 55 26 11 7 0
2 84 62 15 16 7 1
3 43 94 33 29 13 6
4 68 56 25 5 6 0
5* 76 45 28 6 2 0
6 59 46 50 17 6 2
7* 105 61 26 11 5 0
8 58 86 31 14 8 2
9 116 73 34 23 8 2
* = Finished all tasks
Table 38, shows the number of action changes for each of the groups. The time spent on tasks can
be seen in the last column. The highest numbers are highlighted (made bold) also the lowest are
highlighted (made italic). The lowest time for completing the tasks was 17.38 minutes and was
made by Group number 7, see full table in Appendix VI.
Table 39: Total number of action changes
Values Looking at
task
description
and
Monitoring
Monitoring
and Sketching
Looking at
task
description
and Sketching
Erasing and
Monitoring
Erasing and
Sketching
Erasing and
Looking at
task
description
Total sum 678 578 268 132 62 13
Mean 75.30 64.20 29.78 14.67 6.89 1.44
This Table (Table 39) shows the total sum of actions changes as well as the means for them. The
highlighted number in Table 38 is higher than the means in this Table.
4.3.2 Trend analysis
The action-over-time-graphs were investigated to see if there were any trends in the order of action
changes, participant behaviour or the size of the action-blocks. In order to find trends all graphs
were examined looking for similarities and differences. Some action changes formed clusters and
were repeated in several graphs. These clusters were named and examined further to see if they
could say something about the Task process. In the beginning of a task participants had a cluster of
Looking at task description, Monitoring and Sketching this cluster was named Task solving. When
the Task was harder especially on Task C longer time was spent on Looking and Monitoring, called
Initiation, and after that a period of Monitoring and Sketching, called Near solution, in combination
of Erasing or Monitoring and Erasing, called Fault fixing occurred. The names and what action-
block change they represent are shown in Table 40. In Figure 26-30 the action-block changes are
exemplified.
53

Table 40: Action-block changes
Name Cluster of action-block changes
Initiation Looking at task description and Monitoring
Task solving Looking at task description, Monitoring and Sketching
Near solution Monitoring and Sketching
Fault fixing Monitoring and Erasing
Conversation Speaking and Laughing
Table 40 stated the names of the action-block changes and what changes they represent.
In Figure 26 the Initiation is exemplified. It is defined as the action-block changes: Looking at task
description and Monitoring.
Figure 26: Cluster of action-block changes - Initiation
In Figure 27 three Task solving clusters are seen. Task solving is defined as action-blocks of
Looking at task description, Monitoring and Sketching.
Figure 27: Cluster of action-block changes - Task solving
Figure 28 shows three clusters of Near solution. Near solution is defined as an action-block changes
including Monitoring and Sketching.
Figure 28: Cluster of action-block changes – Near solution
54

The Figure (Figure 29) exemplifies the action-block changes called Fault fixing which is defined as
action-blocks of Monitoring and Erasing.
Figure 29: Cluster of action-block changes – Fault fixing
The Figure (Figure 30) shows the action-block changes called Conversation which is defined as the
action-blocks of Speaking and Laughing. The clusters are marked with a circle. In the top graph
four conversational clusters are seen and in the bottom there are three.
Figure 30: Clusters of action-block changes – Conversation
Task solving and conversation were the most frequent clusters and it was interesting to count them
to see if any differences in condition,task or groups could be found. Table 41 shows that the Task
Solving was similar in number for the conditions as well as for the tasks. The number of task
solving are similar for Task even though the time for the tasks are different. Laughing was more
frequent in the CollaBoard condition as well as for Task C.
55
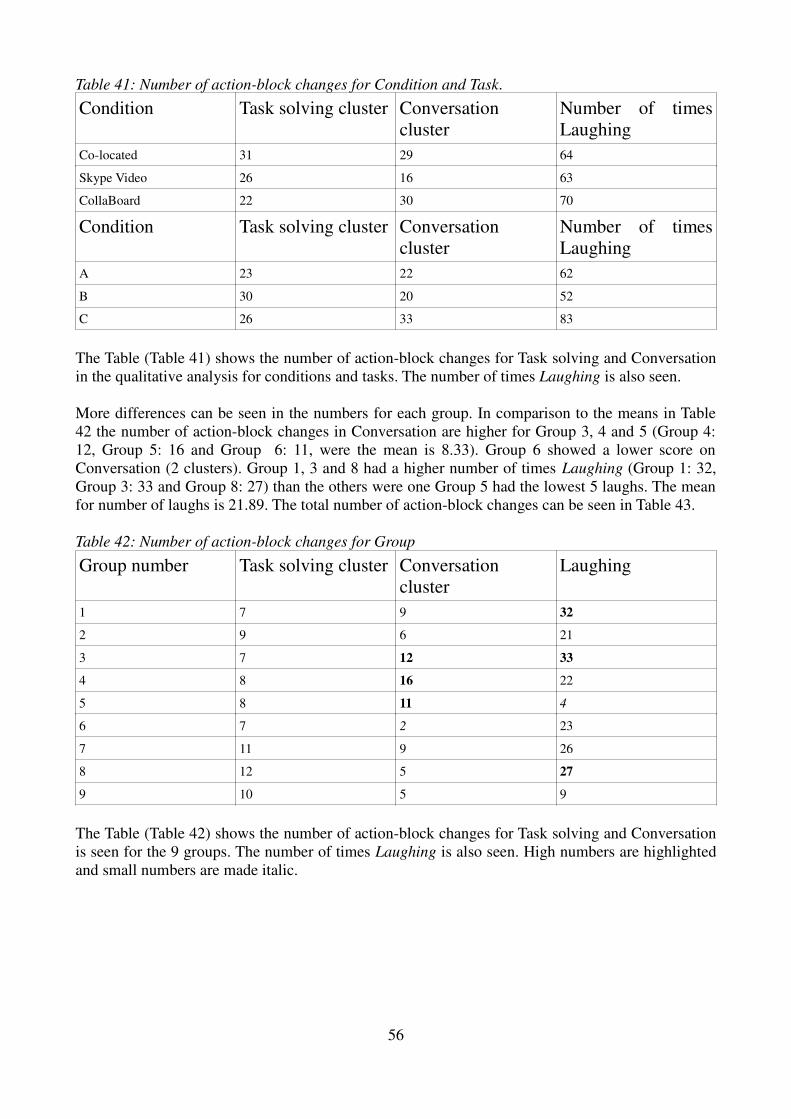
Table 41: Number of action-block changes for Condition and Task.
Condition Task solving cluster Conversation
cluster
Number of times
Laughing
Co-located 31 29 64
Skype Video 26 16 63
CollaBoard 22 30 70
Condition Task solving cluster Conversation
cluster
Number of times
Laughing
A 23 22 62
B 30 20 52
C 26 33 83
The Table (Table 41) shows the number of action-block changes for Task solving and Conversation
in the qualitative analysis for conditions and tasks. The number of times Laughing is also seen.
More differences can be seen in the numbers for each group. In comparison to the means in Table
42 the number of action-block changes in Conversation are higher for Group 3, 4 and 5 (Group 4:
12, Group 5: 16 and Group 6: 11, were the mean is 8.33). Group 6 showed a lower score on
Conversation (2 clusters). Group 1, 3 and 8 had a higher number of times Laughing (Group 1: 32,
Group 3: 33 and Group 8: 27) than the others were one Group 5 had the lowest 5 laughs. The mean
for number of laughs is 21.89. The total number of action-block changes can be seen in Table 43.
Table 42: Number of action-block changes for Group
Group number Task solving cluster Conversation
cluster
Laughing
1 7 9 32
2 9 6 21
3 7 12 33
4 8 16 22
5 8 11 4
6 7 2 23
7 11 9 26
8 12 5 27
9 10 5 9
The Table (Table 42) shows the number of action-block changes for Task solving and Conversation
is seen for the 9 groups. The number of times Laughing is also seen. High numbers are highlighted
and small numbers are made italic.
56

Table 43: Total number of action-block changes
Variable Task solving cluster Conversation
cluster
Laughing
Total sum 79 75 197
Mean 8.78 8.33 21.89
Table 43 shows the total sum and the mean of the number of action-black changes and Laughing
divided over nine groups.
Also an descriptive analysis were made from additional information about the Task process that was
seen in the graphs. The full tables are seen in Appendix VI. The descriptives were divided into
occurrences and is seen in Tables 44-46. High number for participants that talked frequently can be
seen in Skype Video (N = 11, were the total number of people talking are 20, Table 45). Exemples
of a frequent Talker and Monitorer is seen in Figure 31. Skype Video also has the highest value of
specific order of clusters (N = 15, were the total is 27). For CollaBoard the specific order of clusters
are 7 (For Co-located N = 5). A slightly higher number of specific order of clusters is seen for Task
C, Table 46 (Task C: N = 12, Task A: N = 9 and Task B: N = 6). Task A and B has double the
amount of participants that talk frequently than Task C (Task A and B: N = 8 and Task C: N = 4).
Table 44: Additional descriptive information from action-over-time-graphs
Additional descriptive information from
action-over-time-graphs
How measured
Participant behaviour Some participant talked, wrote, looked at task description
or monitored frequently
Size of action-blocks in clusters The time spent on action-blocks was seen to be were short
in some clusters
Cluster orders Some participants had a specific order of clusters followed
by another than going back to the first etcetera.
Additional descriptive information found in action-over-time-graphs and how it was measured is
offered in the Table (Table 44).
Figure 31 shows an example of the additional descriptive information found in the action-over-
time-graphs. In the top graph a square is formed over the talking blocks in the graph, called a Talker
since they are frequent. The bottom graph shows a Monitorer which is marked by a circle.
Figure 31: An example of additional descriptive information in the action-over-time-graphs: A
Talker and a Monitorer
57
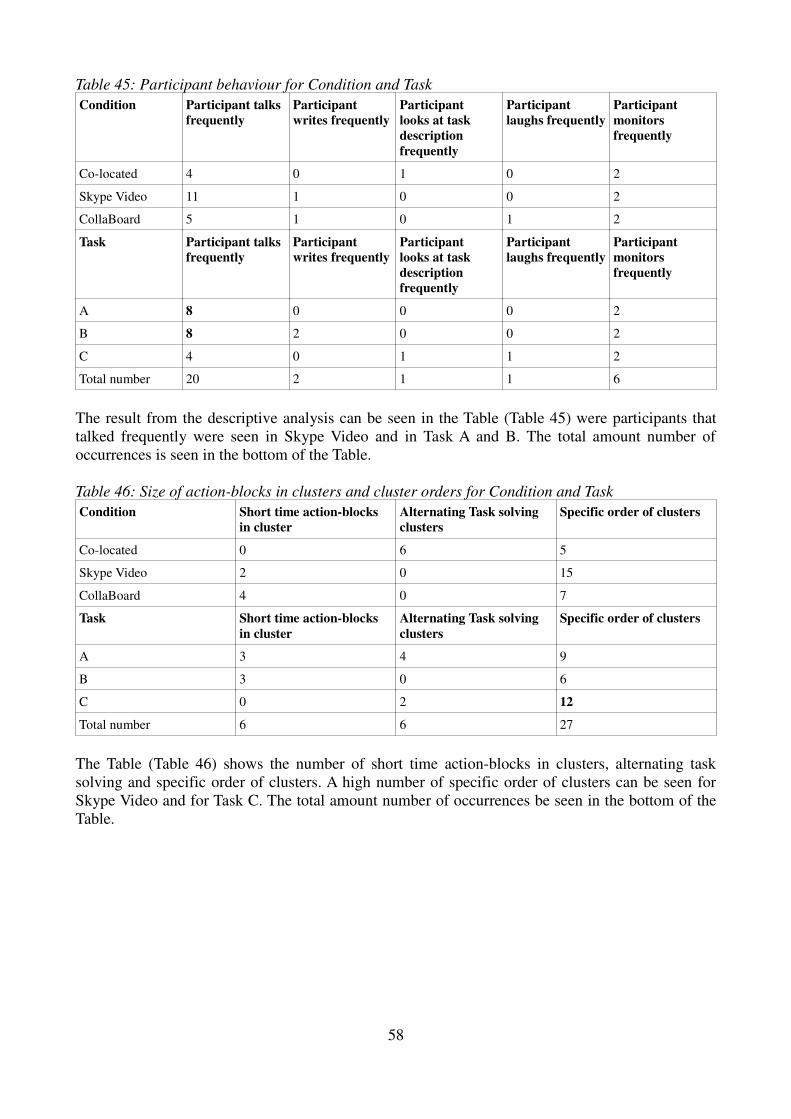
Table 45: Participant behaviour for Condition and Task
Condition Participant talks
frequently
Participant
writes frequently
Participant
looks at task
description
frequently
Participant
laughs frequently
Participant
monitors
frequently
Co-located 4 0 1 0 2
Skype Video 11 1 0 0 2
CollaBoard 5 1 0 1 2
Task Participant talks
frequently
Participant
writes frequently
Participant
looks at task
description
frequently
Participant
laughs frequently
Participant
monitors
frequently
A 8 0 0 0 2
B 8 2 0 0 2
C 4 0 1 1 2
Total number 20 2 1 1 6
The result from the descriptive analysis can be seen in the Table (Table 45) were participants that
talked frequently were seen in Skype Video and in Task A and B. The total amount number of
occurrences is seen in the bottom of the Table.
Table 46: Size of action-blocks in clusters and cluster orders for Condition and Task
Condition Short time action-blocks
in cluster
Alternating Task solving
clusters
Specific order of clusters
Co-located 0 6 5
Skype Video 2 0 15
CollaBoard 4 0 7
Task Short time action-blocks
in cluster
Alternating Task solving
clusters
Specific order of clusters
A 3 4 9
B 3 0 6
C 0 2 12
Total number 6 6 27
The Table (Table 46) shows the number of short time action-blocks in clusters, alternating task
solving and specific order of clusters. A high number of specific order of clusters can be seen for
Skype Video and for Task C. The total amount number of occurrences be seen in the bottom of the
Table.
58
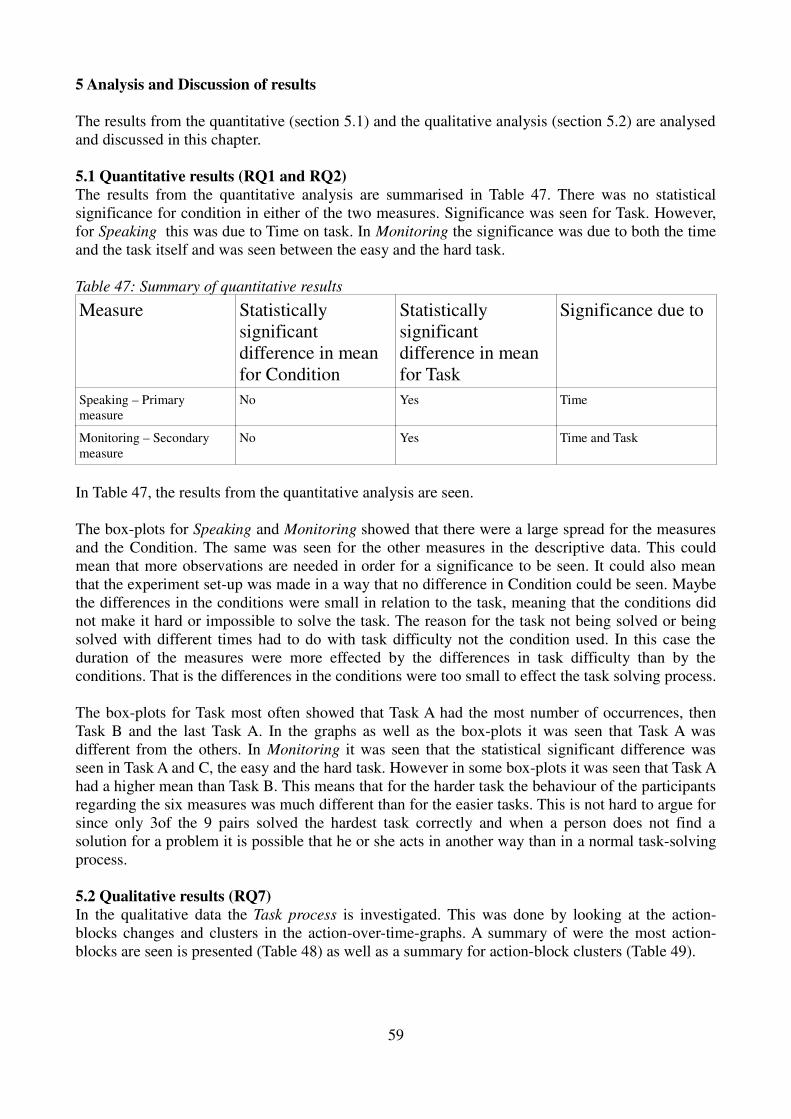
5 Analysis and Discussion of results
The results from the quantitative (section 5.1) and the qualitative analysis (section 5.2) are analysed
and discussed in this chapter.
5.1 Quantitative results (RQ1 and RQ2)
The results from the quantitative analysis are summarised in Table 47. There was no statistical
significance for condition in either of the two measures. Significance was seen for Task. However,
for Speaking this was due to Time on task. In Monitoring the significance was due to both the time
and the task itself and was seen between the easy and the hard task.
Table 47: Summary of quantitative results
Measure Statistically
significant
difference in mean
for Condition
Statistically
significant
difference in mean
for Task
Significance due to
Speaking – Primary
measure
No Yes Time
Monitoring – Secondary
measure
No Yes Time and Task
In Table 47, the results from the quantitative analysis are seen.
The box-plots for Speaking and Monitoring showed that there were a large spread for the measures
and the Condition. The same was seen for the other measures in the descriptive data. This could
mean that more observations are needed in order for a significance to be seen. It could also mean
that the experiment set-up was made in a way that no difference in Condition could be seen. Maybe
the differences in the conditions were small in relation to the task, meaning that the conditions did
not make it hard or impossible to solve the task. The reason for the task not being solved or being
solved with different times had to do with task difficulty not the condition used. In this case the
duration of the measures were more effected by the differences in task difficulty than by the
conditions. That is the differences in the conditions were too small to effect the task solving process.
The box-plots for Task most often showed that Task A had the most number of occurrences, then
Task B and the last Task A. In the graphs as well as the box-plots it was seen that Task A was
different from the others. In Monitoring it was seen that the statistical significant difference was
seen in Task A and C, the easy and the hard task. However in some box-plots it was seen that Task A
had a higher mean than Task B. This means that for the harder task the behaviour of the participants
regarding the six measures was much different than for the easier tasks. This is not hard to argue for
since only 3of the 9 pairs solved the hardest task correctly and when a person does not find a
solution for a problem it is possible that he or she acts in another way than in a normal task-solving
process.
5.2 Qualitative results (RQ7)
In the qualitative data the Task process is investigated. This was done by looking at the action-
blocks changes and clusters in the action-over-time-graphs. A summary of were the most action-
blocks are seen is presented (Table 48) as well as a summary for action-block clusters (Table 49).
59

Table 48: A summary of the most action-block changes
The most action-block
changes
Condition Implication
Involving Looking at task description CollaBoard More focus is put on Task Description
Monitoring – Sketching Skype Video More interactions with the whiteboard
are done
The most action-block
changes
Task Implication
Involving Looking at task description,
Monitoring and Sketching
Easy task More focus on the task and solving it
with easier task
Involving erasing Harder tasks More errors with harder tasks
In the Table (Table 48) the most action-block changes as stated followed by what condition or task
connected to it. The implications of that is also seen.
Table 49: A summary of the action-block clusters
Action-block cluster Condition Implication
Task-solving Co-located More task-solving focus with support
on natural behaviour
Laughing CollaBoard Most satisfaction and fun errors
happens with CollaBoard
Conversational CollaBoard and Co-located Participants focus more on the screen
than on talking in Skype Video
Specific clusters Skype Video Most structured behaviour
Talking frequently Skype Video Talking is part of solving an average
task
Action-block cluster Task Implication
Task-solving Average task Most focus is put on task-solving in
the average task
Laughing Easy and hard task More fun with easy and hard task
Conversational clusters Hard task More talking with the hard task
Special clusters Hard task More structured behaviour is needed
to solve the hard task
In Table 49, the action-block clusters that had the most number of occurrences in the qualitative
analysis is presented. The condition or task connected to it is also presented as well as the
implications.
Combining the two tables it is possible to say something about the Task process in each of the
conditions and tasks in the experiment. Starting with the conditions the Co-located condition had
the most task-solving and conversation clusters which means that a natural flow of talking can be
used and that task-solving is in focus.
In the Skype Video condition more Monitoring and corrections on the board were done. Also it had
the most specific clusters. This means that in Skype Video the most focus is put on the whiteboard
which is likely since there is no natural way to follow what happens where in the whiteboard. That
60

is, the most specific clusters are seen for Skype Video which mean that the participants can work in
a structured way without natural interruptions and that task solving in Skype Video needs a
structured clustering behaviour. Also the most frequent talking was seen in Skype Video which
means that talking frequently is needed or is part of the task solving with Skype Video.
For CollaBoard the most focus is put on the task description. Since in the other conditions focus has
been on something else like the whiteboard or the task-solving it is possible to draw the conclusion
that focusing on the task description is a characteristic for CollaBoard. Also much Conversational
clusters and the most Laughing was seen with CollaBoard, which implies that task-solving with
CollaBoard gives satisfaction to the users and that much conversational clusters is needed. For the
easy task it was seen that most focus was put on Looking at task description and the whiteboard
which can mean that the easy task is characterised by looking focusing on the whiteboard and the
task description. Also much Laughing was seen in the easy task which means that an easy task is
fun to solve. In the average task the most task-solving was seen. Also the least Laughing and
conversations was seen for the average task which means that the most focus when solving an
average task is on the actual task-solving. The hardest task was characterised by specific clustering,
Erasing, conversational clusters and Laughing which means that for a harder task more focus has to
be on structured behaviour and that with a really hard task as this one much Erasing is needed. The
most Laughing was seen here which can be due to that the participants laugh at their mistakes or
that they have more fun solving a hard task. Also the most conversational clusters were seen for the
hard task.
61
6 Conclusions and implications
In this last chapter, conclusions from the results are drawn (section 6.1), implications of the study
are presented (section 6.2), and future studies are suggested (section 6.3).
6.1 Conclusions
Since computers first came into our society the technology has grown fast as has the research
connected to it. However since evaluation naturally comes after making technology, and the
technology has been fast growing, some research has been left behind. Computer Supported
Collaborate Work has focused on evaluating complex systems in order to improve them. However
no universal evaluation method has been found. The literature study, presented in the first part of
this thesis, indicates that CSCW research could benefit from a stronger focus on usability and social
aspects of complex systems.
The first of this thesis has been to describe and understand previous CSCW research in order to find
what measures has not been studied well before. In the literature study it was seen that little
research had been done in usability and collective measures and that the most studies had been done
in individual measures. This may be surprising, since the focus of CSCW is the study of computer-
mediated collaboration and co-operation. A small amount of studies were also seen in remote and
co-located systems as well as in using video data. Hence, the second aim of this thesis has been to
single out and investigate less-studied measures of CSCW. Usability and collective measures were
chosen to be further investigated. To validate this validity of these measures, we applied them on an
existing body of experimental data. While the existing data set also included subjective data, the
chosen measures were applied on an objective data set, namely video taped observations. The
collection of experimental data stemmed from a within-group design experiment involving a
eighteen participants. Nine pairs of subjects solved dot-to-dot puzzle problems under three
conditions, two of these conditions were remote; one condition was co-located. One of the remote
systems tested in the user study was CollaBoard, a new prototype built in Zurich. CollaBoard has a
new technology enabling the remote participant to be visible in the working space which makes it
interesting to evaluate it in comparison to other conditions. Together with theory of usability and
psychology an evaluation method was made making it possible to find measures for the set-up of
the user study. The measures found in the evaluation method were tested in the user study in order
to answer the driving question:
How can the measures be defined in order to contribute to the evaluation of CSCW systems?
From this driving questions, seven research questions (RQ1-RQ7) was derived, presented in Table
17. In the quantitative as well as in the qualitative data, it was seen that the defined usability and
collective measures can be used for evaluating computer supported collaborative systems. This
thesis may also serve as an eye-opener for future collective measures. Some significant results were
found in the ANOVA tests and linear regression which gives strength to our results. In fact, the
qualitative analysis supported the quantitative analysis by offering more insight into the collective
Task process and the related user behaviour.
The influence of condition did not reach a significant level which indicated that either i) more
observations could be needed to reach significance or ii) equipped with the given task the
conditions were too similar. That is, the condition did not significantly influence the way the
participants solved the specific task given to them. However, difference in Task did significantly
influence the measure Monitoring.
62
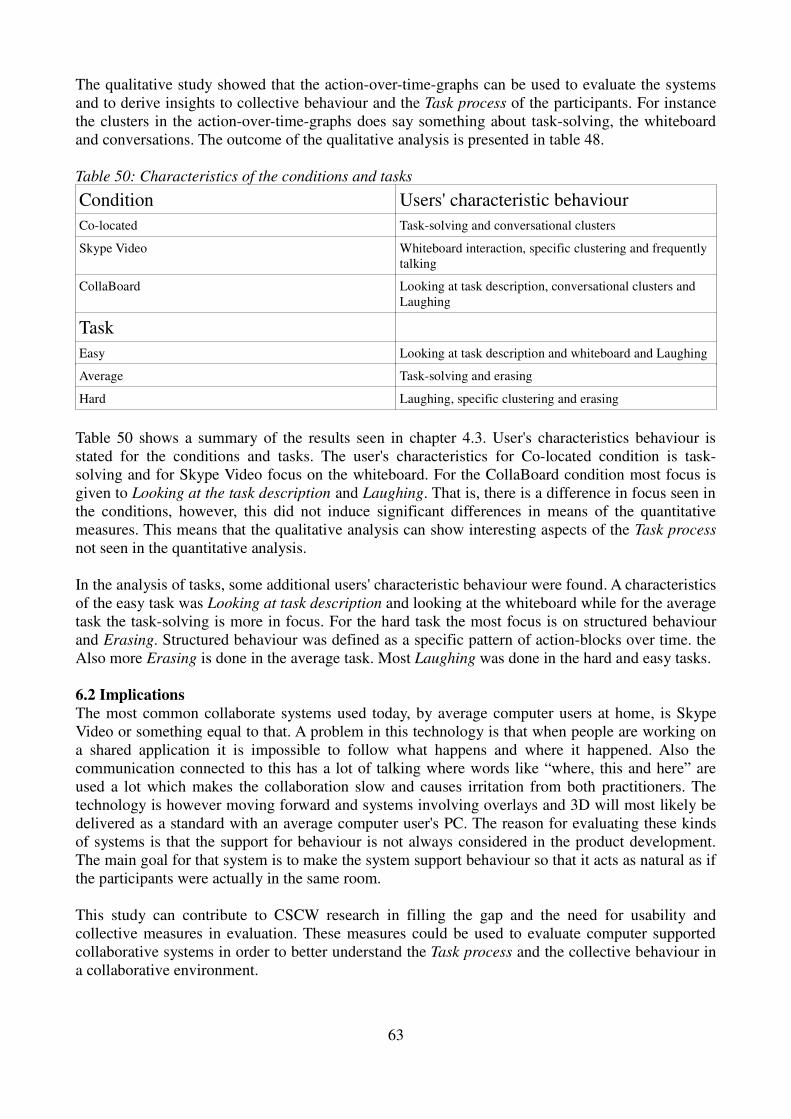
The qualitative study showed that the action-over-time-graphs can be used to evaluate the systems
and to derive insights to collective behaviour and the Task process of the participants. For instance
the clusters in the action-over-time-graphs does say something about task-solving, the whiteboard
and conversations. The outcome of the qualitative analysis is presented in table 48.
Table 50: Characteristics of the conditions and tasks
Condition Users' characteristic behaviour
Co-located Task-solving and conversational clusters
Skype Video Whiteboard interaction, specific clustering and frequently
talking
CollaBoard Looking at task description, conversational clusters and
Laughing
Task
Easy Looking at task description and whiteboard and Laughing
Average Task-solving and erasing
Hard Laughing, specific clustering and erasing
Table 50 shows a summary of the results seen in chapter 4.3. User's characteristics behaviour is
stated for the conditions and tasks. The user's characteristics for Co-located condition is task-
solving and for Skype Video focus on the whiteboard. For the CollaBoard condition most focus is
given to Looking at the task description and Laughing. That is, there is a difference in focus seen in
the conditions, however, this did not induce significant differences in means of the quantitative
measures. This means that the qualitative analysis can show interesting aspects of the Task process
not seen in the quantitative analysis.
In the analysis of tasks, some additional users' characteristic behaviour were found. A characteristics
of the easy task was Looking at task description and looking at the whiteboard while for the average
task the task-solving is more in focus. For the hard task the most focus is on structured behaviour
and Erasing. Structured behaviour was defined as a specific pattern of action-blocks over time. the
Also more Erasing is done in the average task. Most Laughing was done in the hard and easy tasks.
6.2 Implications
The most common collaborate systems used today, by average computer users at home, is Skype
Video or something equal to that. A problem in this technology is that when people are working on
a shared application it is impossible to follow what happens and where it happened. Also the
communication connected to this has a lot of talking where words like “where, this and here” are
used a lot which makes the collaboration slow and causes irritation from both practitioners. The
technology is however moving forward and systems involving overlays and 3D will most likely be
delivered as a standard with an average computer user's PC. The reason for evaluating these kinds
of systems is that the support for behaviour is not always considered in the product development.
The main goal for that system is to make the system support behaviour so that it acts as natural as if
the participants were actually in the same room.
This study can contribute to CSCW research in filling the gap and the need for usability and
collective measures in evaluation. These measures could be used to evaluate computer supported
collaborative systems in order to better understand the Task process and the collective behaviour in
a collaborative environment.
63

In this study, however, the results can not be generalized to all tasks or collective behaviour since it
was done with a specific task and conditions. Also, dot-to-dot puzzles are not likely to be part of
everyday use for a collaborate system. However, with some care, the results can be generalized to
other kinds of problem-solving and to understand how users collaborate in such settings. We have
learned that usability and collective measures can be used both in a quantitative and a qualitative
analysis. This means that usability and collective measures like the ones used here can and should
be used by researchers in future studies. This is important since it can help to solve the problems
with usability connected to many systems today.
Today CSCW systems are not used by everyone, but since interactive technology is growing this
may change in a near future. Also there is a need for the systems to solve harder tasks in for
instance engineering or construction. There are other suitable areas for video conference systems
with new technology like CollaBoard in teaching, business meetings, introducing new products, for
training etcetera which can help to save time, environment and money.
6.3 Future studies
In evaluating a system there needs to be more work on the how the users think. Understanding how
users interact with each other in a computer-mediated setting is of importance. In the study
presented, usability and collective measures were explored. Still, more detailed research is needed.
Three main areas of future research are shown next:
First, the descriptive measures should be investigated further. This will be done in order to see if
statistical significant difference can be seen for Condition or Task. Also there is a need to
investigate other collective measures. Second, since the condition in the ANOVA did not reach
significance more research is needed. More observations could result in a significance but also
another task or additional conditions could be tested. Third, in order to fully fill the gap seen in the
literature study more research in diversity, organisations and long term studies is needed. It is
important to study what kind of task it is, what kind of participants there are in the study regarding
what kind of strategies they choose for solving a problem and what kind of relations they have in
order to draw conclusions about what is really happening in a collaborate session.
64
References
Andersson, R. and Ehrensvärd, A. (2009) Mixed presence groupware: requirements and taxonomy
for collaboration and sketching. masters thesis. t2i Lab.
http://www.t2i.se/pub/papers/MIXED_PRESENCE_GROUPWARE.pdf (2010-12-05).
Axelson, B. L. and Thylefors, I. (2005) Arbetsgruppens psykologi. Stockholm: Natur och Kultur.
Bezerianos, A. and McEwan, G. (2008) Presence disparity in mixed presence collaboration.
Proceedings of CHI conference on extended abstracts on Human factors in computing systems
(CHI'08). April 5-10 2008, Florence, Italy. p. 1-6.
TechTarget (2010) Search word: Collaboration. http://www.bitpipe.com/tlist/Collaboration.html
(2010-12-05)
Burkhardt, J-M., Détienne, F., Hébert, A-M. and Perron, L. (2009) Assessing the “Quality of
collaboration” in technology-mediated design situations with several dimensions. Journal of
Human-Computer Interaction – Interact 2009. vol. 5727. p. 157-160.
Crystal, A., Ellington, B. (2004) Task analysis and human-computer interaction: approaches,
techniques, and level of analysis. Proceedings of the Tenth Americas Conference on Information
Systems, August 2004, New York, New York. p. 1-9.
Epps, J. and Close, B. S. (2007) A study of co-worker awareness in remote collaboration over a
shared application. Proceedings of CHI '07 extended abstracts on Human factors in computing
systems (CHI'07). 30th April – 3 May 2007, San Jose, CA, USA. p. 2363-2368.
ETH – Swiss Federal Institute of Technology Zurich (2010)
http://www.icvr.ethz.ch/research/projects/closed/collaboard/index_EN (2010-12-05).
Fussell, S. R, Setlock, L. D, Parker, E. M. and Yang, J. (2003) Assessing the value of a cursor
pointing device for remote collaboration on physical tasks. Proceedings of CHI'03 extended
abstracts on Human factors in computing systems (CHI'03). 5-10 April 2003, Ft. Lauderdale, FL,
USA. p. 788-789.
Fussell, S. R, Setlock, L. D, Parker, E. M., Yang, J., Ou, J., Mauer, E. and Kramer, A. D. I. (2004)
Gestures over video streams to support remote collaboration on physical tasks. Journal of Human-
Computer Interaction. vol 19, p. 273–309
Gaver, W., Sellen, A., Heath, C. and Luff, P. (1993) One is not enough: multiple views in media
space. Proceedings of the INTERACT '93 and CHI '93 conference on Human factors in computing
systems. 24-29 April 1993, Amsterdam, Netherlands. p. 335 – 341.
Grudin, J. (1988) Why CSCW applications fail: Problems in the design and evaluation of
organizational interfaces. Proceedings of the 1988 ACM conference on Computer-supported
cooperative work (CSCW '88 ). 26 - 28 September 1988, Portland, USA. p. 85-93.
Grudin, J. (1990) The Computer Reaches Out: The Historical Continuity of Interface Design.
Proceedings of the SIGCHI conference on Human factors in computing systems: Empowering
people (CHI'90). 1-5 April 1990, Seattle, WA, USA. p. 261-268.
Gutwin, C., Penner, R. and Schneider, K. (2004) Group awareness in distributed software

development. Proceedings of the 2004 ACM conference on Computer supported cooperative work
(CSCW'04). 6-10 November 2004, Chicago, IL, USA. p. 72-81.
Heiser, J., Tversky, B. and Silverman, M. (2004) Sketches for and from collaboration. scholar.
google.com. http://psychology.stanford.edu/~bt/gesture/papers/vr04.pdf (2010-11-21).
Ju, W., Neeley, WL, Winograd, T and Leifer, L. (2006) Thinking with Erasable Ink: Ad-hoc
Whiteboard Use in Collaborative Design. CDR Technical Report #20060928
http://wendyju.com/publications/thinking_erasable_DISTRO.doc.pdf (2010-12-05).
Kirk, D. S. and Fraser, D. S. (2005) The effects of remote gesturing on distance instruction.
Proceedings of the 2005 conference on Computer support for collaborative learning: learning
2005: the next 10 years! (CSCL'05). 30 May–4 June 2005, Taipei, Taiwan. p. 301-310.
Kirk, D. S. and Fraser, D. S. (2006) Comparing remote gesture technologies for supporting
collaborative physical tasks. Proceedings of the SIGCHI conference on Human Factors in
computing systems (CHI'06). 22-27 April 2006, Montreal, Canada. p. 1191-1200.
Nacenta, M. A., Pinelle, D., Stuckel, D. and Gutwin, C. (2007) The effects of Interaction in
Tabletop Groupware. Proceedings of Graphics Interface 2007 (GI '07). 28-30 May 2007, Montreal,
Canada. p. 191-198.
Neale, D. C, Carroll, J. M. and Rosson, M. B. (2004) Evaluating computer-supported cooperative
work: Models and frameworks. Proceedings of the 2004 ACM conference on Computer supported
cooperative work (CSCW'04). 6-10 November 2004, Chicago, IL, USA. p. 112-121.
Orlikowski, W. J. (1992) Learning from notes: Organizational issues in groupware implementation.
Proceedings of the 1992 ACM conference on Computer-supported cooperative work (CSCW '92 ).
1-4 November 1992, Toronto, ON, Canada. p. 362-369.
Pallant, J. (2007) SPSS Surviving manual. Third edition. England: McGraw Hill.
Piazza, T. (2010) CollaBoard User Study: A Short Report. Chalmers Publication Library.
://cpl.lib.chalmers.se/cpl/record/index.xsql?pubid=131450 (2011-01-17).
Reisberg, D. (2001) Cognition – exploring the science of the mind. 2nd edition. London: W. W.
Norton & Company Ltd.
Rubenowitz, S. (2004) Organisations-psykologi och ledarskap. 3:e upplagan. Lund:
Studentlitteratur.
SAOL - Svenska akademins ordlista över svenska språket (1997) Search word: samarbete.
Stockholm: Norstedts tryckeri.
Saeki, M. (1995) Communication, collaboration and cooperation in software development – How
should we support group work in software development?. Proceedings of the 1995 Asia Pacific
Software Engineering Conference (APSEC'95). 6-9 December 1995, Brisbane, Qld. , Australia. p.
12-20.
Sharp, H., Rogers, Y. and Preece, J. (2009) Interaction design – beyond human-computer
interaction. 2nd edition. West sussex: John Wiley & Sons Ltd.
Smith, E. E., Nolen-Hoeksema, S., Fredrickson, B. and Loftus, G. R. (2003) Atkinsons & Hilgard's
Introduction to psychology. 14th edition. Belmont, CA, USA: Thomson Wadsworth.
t2i Lab (2010) TableTop Interaction Laboratory ID|C, CSE, Chalmers TH.
http://www.t2i.se/projects.php (2010-12-05).
Tang, A. and Greenberg, S. (2005) Supporting awareness in mixed presence groupware. From
awareness to HCI education: The CHI'2005 workshop papers suite. ACM CHI Workshop on
awareness systems: Known results, theory, concepts and future challenges. April 2005. p. 1-4.
Tang, A. and Greenberg, S. (2007) VideoArms: Embodiments for mixed presence groupware.
Proceedings of HCI 2006 Peopl and computers XX – Engage. 2007, Part 3. p. 85-102.
Tang, J. C. and Minneman, S. L. (1991) VideoDraw: A video interace for collaborative drawing.
Journal of ACM Transactions on Information Systems (TOIS) – Special issue on computer-human
interaction. vol. 9, nr 2, p. 170-184.
Tee, K., Greenberg, S. and Gutwin, C. (2009) Artifacts awareness through screen sharing for
distributed groups. Interational Journal of Human-Computer studies. vol.67, nr 9. p. 677-702.
The free dictionary (2009) The American Heritage Dictionary of the English Language. Fourth
edition. Published by Houghton Mifflin Company. http://www.thefreedictionary.com/collaboration
(2010-12-05).
The University of Texas at Austin (2010) The Instructional Assessment Resources. Search word:
Usability. http://www.utexas.edu/academic/ctl/assessment/iar/glossary.php#u (2010-12-05).
University of Minnesota Duluth (2010) Information Technology Systems and services. Search word:
Usability. http://www.d.umn.edu/itss/support/Training/Online/webdesign/glossary/u.html (2010-12-
05).
Wikipedia 1 (2010) Search word: collaboration. http://www.wikipedia.se (2010-12-05).
Wikipedia 2 (2010) Search word: usability. http://www.wikipedia.se (2010-12-05).
Wiktionary (2010) Search word: usability. http://en.wiktionary.org/wiki/usability (2010-12-05).
References for literature review Appendix I
1. Baker, K., Greenberg, S. and Gutwin, C. (2001) Heuristic evaluation of groupware based on
the mechanics of collaboration. Journal of engineering for human-computer interaction. vol.
2254/2001, p. 123-139.
2. Bezerianos, A. and McEwan, G. (2008) Presence disparity in mixed presence collaboration.
Proceedings of CHI conference on extended abstracts on Human factors in computing
systems (CHI'08). April 5-10 2008, Florence, Italy. p. 1-6.
3. Bly, S. A. (1988) A use of drawing surfaces in different collaborative settings. Proceedings
of the 1988 ACM conference on Computer-supported cooperative work (CSCW '88).
September 26 - 28 1988, Portland, USA. p. 250-256.
4. Bullen, C. V. and Bennett, J. L. (1990) Learning from user experience with groupware.
Proceedings of the 1990 ACM conference on Computer-supported cooperative work
(CSCW '90). October 7-10 1990, Los Angeles, CA, USA. p. 291-302.
5. Burkhardt, J-M., Détienne, F., Hébert, A-M. and Perron, L. (2009) Assessing the “Quality of
collaboration” in technology-mediated design situations with several dimensions. Journal of
Human-Computer Interaction – Interact 2009. vol. 5727. p. 157-160.
6. Cherubini, M., Oliviera, R. d., Oliver, N. and Ferran, C. (2010) Gaze and gestures in
telepresence: Multimodality, embodiment, and roles of collaboration. Proceedings from the
International Workshop New Frontiers in Telepresence 2010. 7th February 2010, Savannah,
GA, USA. p. 1-4.
7. Dourish, P. and Bly, S. (1992) Portholes: Supporting awareness in a distributed work group.
Proceedings of the SIGCHI conference on Human factors in computing systems (CHI '92).
3-7 May 1992, Monterey, CA, USA. p. 541-547
8. DiMicco, J. M., Hollenbach, K. J., Pandolfo, A. and Bender, W. (2007) The impact of
increased awareness while face-to-face. Journal of Human-Computer Interaction, vol. 22,
pp. 47-96.
9. Epps, J. and Close, B. S. (2007) A study of co-worker awareness in remote collaboration
over a shared application. Proceedings of CHI '07 extended abstracts on Human factors in
computing systems (CHI'07). 30th April – 3 May 2007, San Jose, CA, USA. p. 2363-2368.
10. Fussell, S. R, Setlock, L. D, Parker, E. M. and Yang, J. (2003) Assessing the value of a
cursor pointing device for remote collaboration on physical tasks. Proceedings of CHI'03
extended abstracts on Human factors in computing systems (CHI'03). 5-10 April 2003, Ft.
Lauderdale, FL, USA. p. 788-789.
11. Fussell, S. R, Setlock, L. D, Parker, E. M., Yang, J., Ou, J., Mauer, E. and Kramer, A. D. I.
(2004) Gestures over video streams to support remote collaboration on physical tasks.
Journal of Human-Computer Interaction. vol 19, p. 273–309
12. Gaver, W., Sellen, A., Heath, C. and Luff, P. (1993) One is not enough: multiple views in
media space. Proceedings of the INTERACT '93 and CHI '93 conference on Human factors
in computing systems. 24-29 April 1993, Amsterdam, Netherlands. p. 335 – 341.
13. Grudin, J. (1988) Why CSCW applications fail: Problems in the design and evaluation of

organizational interfaces. Proceedings of the 1988 ACM conference on Computer-supported
cooperative work (CSCW '88 ). 26 - 28 September 1988, Portland, USA. p. 85-93.
14. Gutwin, C. and Greenberg, S. (2000) The mechanics of collaboration: developing low cost
usability evaluation methods for shared workspaces. IEEE 9th International Workshops on
Enabling Technologies: Infrastructure for Collaborative Enterprises (WET ICE'00). 14-16
March 2000, Gaithersburg, Maryland. p. 98-103.
15. Gutwin, C. and Greenberg, S. (2002) A descriptive framework of workspace awareness for
real-time groupware. Journal of Computer supported collaborative work (CSCW). vol. 11,
nr 3-4, p. 411-446.
16. Gutwin, C., Penner, R. and Schneider, K. (2004) Group awareness in distributed software
development. Proceedings of the 2004 ACM conference on Computer supported cooperative
work (CSCW'04). 6-10 November 2004, Chicago, IL, USA. p. 72-81.
17. Heiser, J., Tversky, B. and Silverman, M. (2004) Sketches for and from collaboration.
scholar. google.com. http://psychology.stanford.edu/~bt/gesture/papers/vr04.pdf (2010-11-
21).
18. Ju, W., Neeley, WL, Winograd, T, Leifer, L. (2006) Thinking with Erasable Ink: Ad-hoc
Whiteboard Use in Collaborative Design. CDR Technical Report #20060928
http://wendyju.com/publications/thinking_erasable_DISTRO.doc.pdf (2010-12-05).
19. Kaplan, S. M., Tolone, W. J., Bogia, D. P. and Bignoli, C. (1992) Flexible, active support for
collaborative work with Conversationbuilder. Proceedings of the 1992 ACM conference on
Computer-supported cooperative work (CSCW '92). 1-4 November 1992, Toronto, ON,
Canada. p. 378-385.
20. Kirk, D. S., Crabtree, A. and Rodden, T. (2005) Ways of the hands. Proceedings of the ninth
European Conference on Computer Supported Collaborative Work (ECSCW 2005). 18–22
September 2005, Paris, France. p. 1-21.
21. Kirk, D. S. and Fraser, D. S. (2005) The effects of remote gesturing on distance instruction.
Proceedings of the 2005 conference on Computer support for collaborative learning:
learning 2005: the next 10 years! (CSCL'05). 30 May–4 June 2005, Taipei, Taiwan. p. 301-
310.
22. Kirk, D. S. and Fraser, D. S. (2006) Comparing remote gesture technologies for supporting
collaborative physical tasks. Proceedings of the SIGCHI conference on Human Factors in
computing systems (CHI'06). 22-27 April 2006, Montreal, Canada. p. 1191-1200.
23. McCarthy, J. F. and Anagnost, T. D. (1998) MusicFX: An arbiter of group preferences for
computer supported collaborative workouts. Proceedings of the 1998 ACM conference on
Computer supported cooperative work (CSCW'98 ). 14-18 November 1998, Seattle, WA,
USA. p. 363-372.
24. Nam, T-J. And Sakong, K. (2009) Collaborative 3D workspace and interaction techniques
for synchronous distributed product design reviews. International Journal of Design. vol. 3,
no 1. p. 43-55.
25. Narayan, M., Waugh, L., Zhang, X., Bafna, P. and Bowman, D. (2005) Quantifying the
benefits of immersion for collaboration in virtual environments. Proceedings of the ACM
symposium on Virtual reality software and technology (VRST'05). 7-9 November 2005,
Monterey, CA, USA. p. 78-81.
26. Neale, D. C, Carroll, J. M. and Rosson, M. B. (2004) Evaluating computer-supported
cooperative work: Models and frameworks. Proceedings of the 2004 ACM conference on
Computer supported cooperative work (CSCW'04). 6-10 November 2004, Chicago, IL,
USA. p. 112-121.
27. Neuwirth, C. M., Kaufer, D. S, Chandhouk, R. and Morris, J. H. (1994) Computer support
for distributed collaborative writing: defining parameters of interaction. Proceedings of the
1994 ACM conference on Computer supported cooperative work (CSCW '94). 22-26
October 1994, Chapel Hill, North Carolina, USA. p. 145-152.
28. Ocker, R. and Yaverbaum, G. (1999) Asynchronous computer-mediated communication
versus face-to-face collaboration: Results on student learning, quality and satisfaction.
Journal of Group decision and Negotiation. vol. 8, nr 5, p. 427-440.
29. Orlikowski, W. J. (1992) Learning from notes: Organizational issues in groupware
implementation. Proceedings of the 1992 ACM conference on Computer-supported
cooperative work (CSCW '92 ). 1-4 November 1992, Toronto, ON, Canada. p. 362-369.
30. Peng, C. (1993) Survey of collaborative drawing support tools, design perspectives and
prototypes. Journal of Computer supported collaborative work (CSCW). vol. 1, nr 3, p. 197-
228.
31. Prakash, A. and Shim, H. S. (1994) DistView: Support for building efficient collaborative
applications using replicated objects. Proceedings of the 1994 ACM conference on
Computer supported cooperative work (CSCW '94). 22-26 October 1994, Chapel Hill, North
Carolina, USA. p. 153-164.
32. Saeki, M. (1995) Communication, collaboration and cooperation in software development –
How should we support group work in software development?. Proceedings of the 1995
Asia Pacific Software Engineering Conference (APSEC'95). 6-9 December 1995, Brisbane,
Qld. , Australia. p. 12-20.
33. Scott, S. D., Grant, K. D. and Mandryk, R. L. (2003) System guidelines for co-located,
collaborative work on a tabletop display. Proceedings of the Eight European Conference on
Computer-Supported Cooperative Work. 14-18 September 2003, Helsinki, Finland. p. 159-
178.
34. Sugimoto, M., Hosoi, K. and Hashizume, H. (2004) Caretta: A system for supporting face-
to-face collaboration by integrating personal and shared spaces. Proceedings of the SIGCHI
conference on Human factors in computing systems (CHI'04). 24-29 April 2004, Vienna,
Austria. p. 41-48.
35. Tang, J. C., Boyle, M. and Greenberg, S. (2004) Display and presence awareness in mixed
presence groupware. Proceedings of the fifth conference on Australasian user interface
(AUIC '04). 18-22 January 2004, vol. 28, Dunedin, New Zealand. p. 73-82.
36. Tang, A. and Greenberg, S. (2005) Supporting awareness in mixed presence groupware.
From awareness to HCI education: The CHI'2005 workshop papers suite. ACM CHI
Workshop on awareness systems: Known results, theory, concepts and future challenges.
April 2005. p. 1-4.
37. Tang, A. and Greenberg, S. (2007) VideoArms: Embodiments for mixed presence
groupware. Proceedings of HCI 2006 Peopl and computers XX – Engage. 2007, Part 3. p.
85-102.
38. Tang, J. C. and Minneman, S. L. (1991) VideoDraw: A video interace for collaborative
drawing. Journal of ACM Transactions on Information Systems (TOIS) – Special issue on
computer-human interaction. vol. 9, nr 2, p. 170-184.
39. Tee, K., Greenberg, S. and Gutwin, C. (2009) Artifacts awareness through screen sharing for
distributed groups. Interational Journal of Human-Computer studies. vol.67, nr 9. p. 677-
702.
40. Vyas, D., Heylen, D., Nijholt, A. and Veer, d. G. (2009) Collaborative practises that support
creativity in design. Proceedings of the 11th conference on Computer Supported
Collaborative Work. 7-11 September 2009, Vienna, Austria. p. 151-170.
41. Wickey, A. and Alem, L. (2007) Analysis of hand gestures in remote collaboration: Some
design recommendations. Proceedings of the 19th Australasian conference on Computer-
Human Interaction: Entertaining User Interfaces (OZCHI '07 ). 28-30 November 2007,
Adelaide, Australia. p. 87-93.

Data from literature study Appendix II
All data presented in Chapter 2 are summarised in Table 1. In authors, all surnames of the authors
are stated in order to see what authors that co-operate their initials is not included due to space and
is seen in the reference list or in Appendix I were the titles of the papers also are found. The papers
are ordered by year of publication ranging from 1988 to 2010. Frame of paper and study in paper
are stated.
Table 1: Full data from literature study, 41 papers reviewedFrame of
paper
Study in paper
Author/-s Year of
publication
Method in
paper
Kind of colla-
boration
Measures studied Method in studies Number of
participants
Conclusions
Bly 1988 User study Remote and
co-located
Interaction, performance,
feedback and sketching
Observation, video
recording and
experiment (self
observation)
2
Grudin 1988 Theoretical
with case
studies
Neither Natural behaviour, performance
and presence disparity
4
Bullen and
Bennett
1990 User study Remote Social organization, usability and
design
Observation and
interview
223
Tang and
Minneman
1991 User study Remote Gestures, natural behaviour,
conversation, embodiment and
sketching
Observation 28 Awareness
supports
collaboration
Dourish and
Bly
1992 User study Remote Awareness Questionnaire 15
Kaplan,
Tolone, Bogia
and Bignoli
1992 Remote Awareness, coordination and task
process
No formal study,
used No formal
study, used daily
development and
maintenance,
observation
Orlikowsky 1992 User study Remote Interaction, social organization,
work coupling,
perception/cognitive aspects and
culture
Observation,
interview,
notes/documents,
long-term, daily
91
Gaver, Sellen,
Heath and
Luff,
1993 User study Remote Task process and casual
interaction
Observation 12
Peng 1993 Theoretical
with case
studies
Remote Ownership, tool, information
given and sketching
Case studies 9
Neuwirth,
Kaufer,
Chandhouk
and Morris
1994 Theoretical Remote Interaction, coordination, roles
and need
Prakash and
Shim
1994 Theoretical Remote Natural behaviour, satisfaction
and individual versus shared
workspace
Saeki 1995 Theoretical Co-located Conversation, task process and
author styles
McCarthy and
Anagnost
1998 User study Neither Awareness, performance,
satisfaction, perception/cognitive
aspects and environment
Observation and
logs
71
Ocker and
Yaverbaum
1999 User study Remote and
co-located
Conversation, performance,
roles, satisfaction and learning
Experiment 43
Gutwin and
Greenberg
2000 Descriptive Co-located Conversation, performance,
coordination, satisfaction, work
coupling, privacy and monitoring
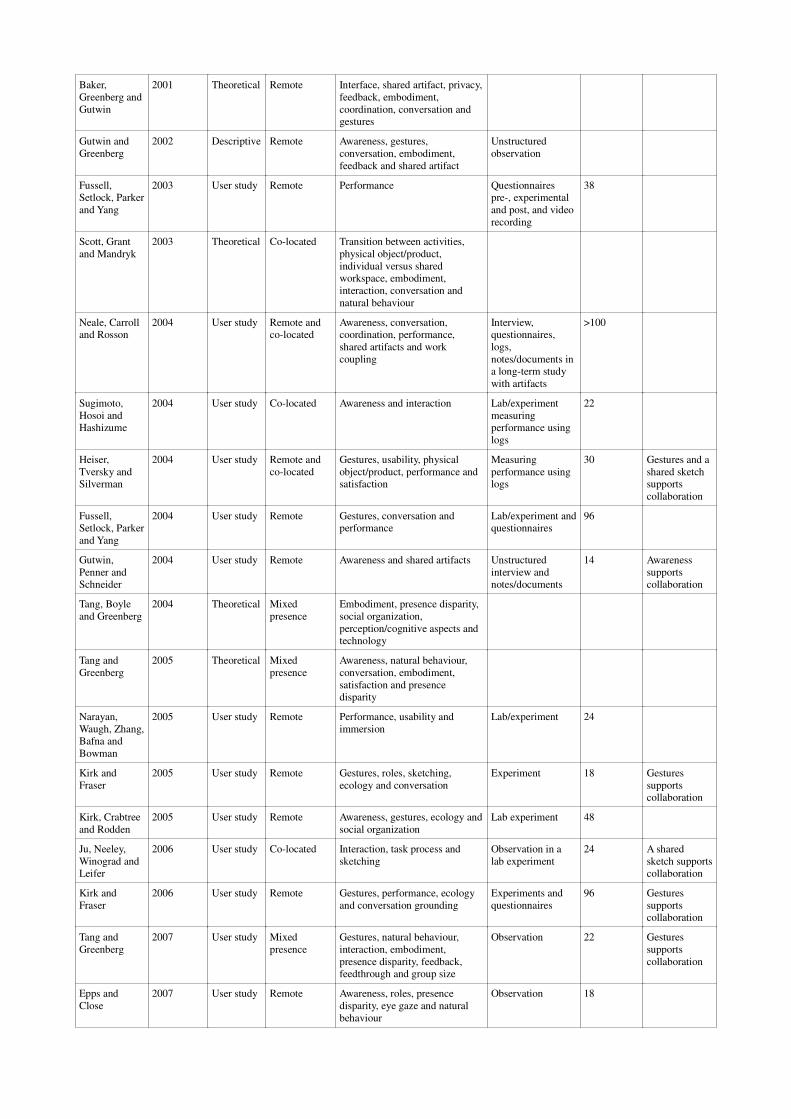
Baker,
Greenberg and
Gutwin
2001 Theoretical Remote Interface, shared artifact, privacy,
feedback, embodiment,
coordination, conversation and
gestures
Gutwin and
Greenberg
2002 Descriptive Remote Awareness, gestures,
conversation, embodiment,
feedback and shared artifact
Unstructured
observation
Fussell,
Setlock, Parker
and Yang
2003 User study Remote Performance Questionnaires
pre-, experimental
and post, and video
recording
38
Scott, Grant
and Mandryk
2003 Theoretical Co-located Transition between activities,
physical object/product,
individual versus shared
workspace, embodiment,
interaction, conversation and
natural behaviour
Neale, Carroll
and Rosson
2004 User study Remote and
co-located
Awareness, conversation,
coordination, performance,
shared artifacts and work
coupling
Interview,
questionnaires,
logs,
notes/documents in
a long-term study
with artifacts
>100
Sugimoto,
Hosoi and
Hashizume
2004 User study Co-located Awareness and interaction Lab/experiment
measuring
performance using
logs
22
Heiser,
Tversky and
Silverman
2004 User study Remote and
co-located
Gestures, usability, physical
object/product, performance and
satisfaction
Measuring
performance using
logs
30 Gestures and a
shared sketch
supports
collaboration
Fussell,
Setlock, Parker
and Yang
2004 User study Remote Gestures, conversation and
performance
Lab/experiment and
questionnaires
96
Gutwin,
Penner and
Schneider
2004 User study Remote Awareness and shared artifacts Unstructured
interview and
notes/documents
14 Awareness
supports
collaboration
Tang, Boyle
and Greenberg
2004 Theoretical Mixed
presence
Embodiment, presence disparity,
social organization,
perception/cognitive aspects and
technology
Tang and
Greenberg
2005 Theoretical Mixed
presence
Awareness, natural behaviour,
conversation, embodiment,
satisfaction and presence
disparity
Narayan,
Waugh, Zhang,
Bafna and
Bowman
2005 User study Remote Performance, usability and
immersion
Lab/experiment 24
Kirk and
Fraser
2005 User study Remote Gestures, roles, sketching,
ecology and conversation
Experiment 18 Gestures
supports
collaboration
Kirk, Crabtree
and Rodden
2005 User study Remote Awareness, gestures, ecology and
social organization
Lab experiment 48
Ju, Neeley,
Winograd and
Leifer
2006 User study Co-located Interaction, task process and
sketching
Observation in a
lab experiment
24 A shared
sketch supports
collaboration
Kirk and
Fraser
2006 User study Remote Gestures, performance, ecology
and conversation grounding
Experiments and
questionnaires
96 Gestures
supports
collaboration
Tang and
Greenberg
2007 User study Mixed
presence
Gestures, natural behaviour,
interaction, embodiment,
presence disparity, feedback,
feedthrough and group size
Observation 22 Gestures
supports
collaboration
Epps and
Close
2007 User study Remote Awareness, roles, presence
disparity, eye gaze and natural
behaviour
Observation 18
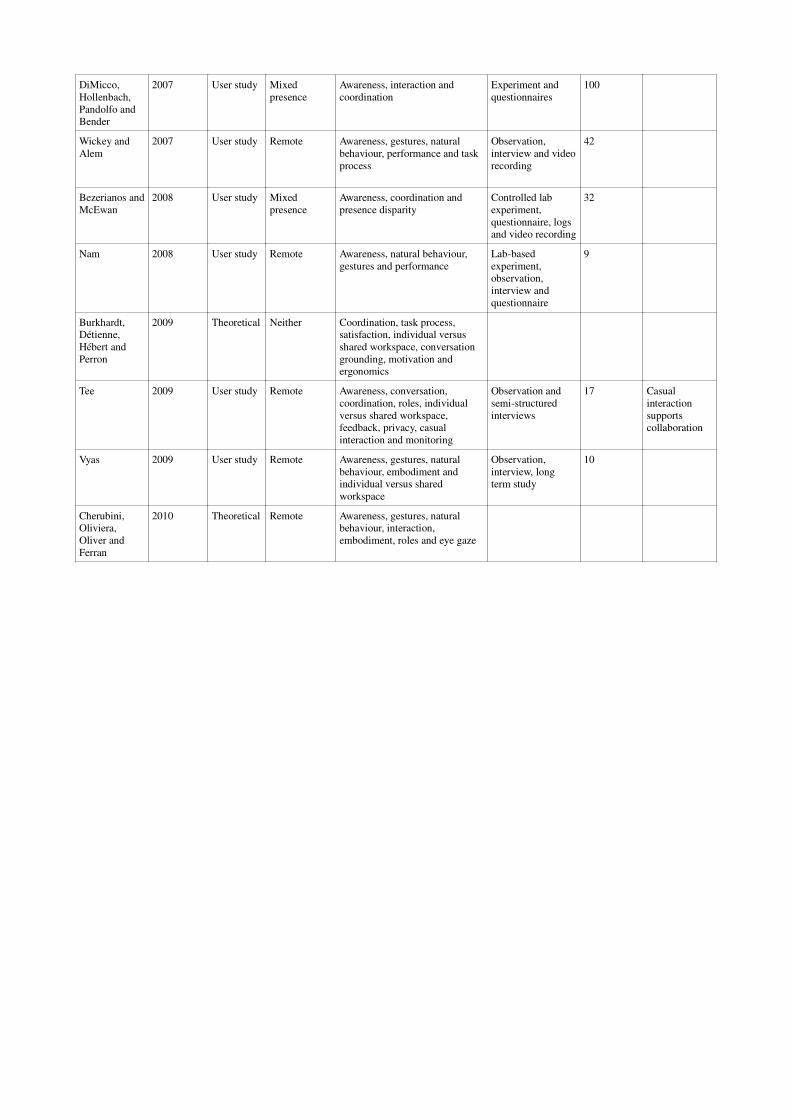
DiMicco,
Hollenbach,
Pandolfo and
Bender
2007 User study Mixed
presence
Awareness, interaction and
coordination
Experiment and
questionnaires
100
Wickey and
Alem
2007 User study Remote Awareness, gestures, natural
behaviour, performance and task
process
Observation,
interview and video
recording
42
Bezerianos and
McEwan
2008 User study Mixed
presence
Awareness, coordination and
presence disparity
Controlled lab
experiment,
questionnaire, logs
and video recording
32
Nam 2008 User study Remote Awareness, natural behaviour,
gestures and performance
Lab-based
experiment,
observation,
interview and
questionnaire
9
Burkhardt,
Détienne,
Hébert and
Perron
2009 Theoretical Neither Coordination, task process,
satisfaction, individual versus
shared workspace, conversation
grounding, motivation and
ergonomics
Tee 2009 User study Remote Awareness, conversation,
coordination, roles, individual
versus shared workspace,
feedback, privacy, casual
interaction and monitoring
Observation and
semi-structured
interviews
17 Casual
interaction
supports
collaboration
Vyas 2009 User study Remote Awareness, gestures, natural
behaviour, embodiment and
individual versus shared
workspace
Observation,
interview, long
term study
10
Cherubini,
Oliviera,
Oliver and
Ferran
2010 Theoretical Remote Awareness, gestures, natural
behaviour, interaction,
embodiment, roles and eye gaze

Order of watching videos Appendix III
The order of how the videos was watched is seen in Table 1.
Table 2: Order of the videos
Room number Condition
1 CollaBoard
1 Co-located
2 Co-located
1 Skype Video
2 CollaBoard
2 Skype Video
The Table (Table 1) shows the order of watching the videos. The same order was seen in the nine
studies.

Quantitative data Appendix IV
Speaking
Calculations for Speaking for single linear regression and multiple linear regression.
Table 3: Model summary
Model Summaryb
Model R R Square
Adjusted R
Square
Std. Error of the
Estimate
1 ,585a ,342 ,315 29,50165
a. Predictors: (Constant), Task
b. Dependent Variable: Speaking
Table 4: ANOVA values
ANOVAb
Model Sum of Squares df Mean Square F Sig.
1 Regression 11300,056 1 11300,056 12,983 ,001a
Residual 21758,685 25 870,347
Total 33058,741 26
a. Predictors: (Constant), Task
b. Dependent Variable: Speaking
Table 5: Coefficients for Linear Regression for Task
Coefficientsa
Model Unstandardized Coefficients
Standardized
Coefficients t Sig.
B Std. Error Beta
1 (Constant) 12,407 15,022 ,826 ,417
Task 25,056 6,954 ,585 3,603 ,001
a. Dependent Variable: Speaking
Table 6: Model summary for Linear Regression for Task and Task time
Model Summaryb
Model R R Square
Adjusted R
Square
Std. Error of the
Estimate
1 ,876a ,767 ,748 17,90339
a. Predictors: (Constant), Time, Task
b. Dependent Variable: Speaking
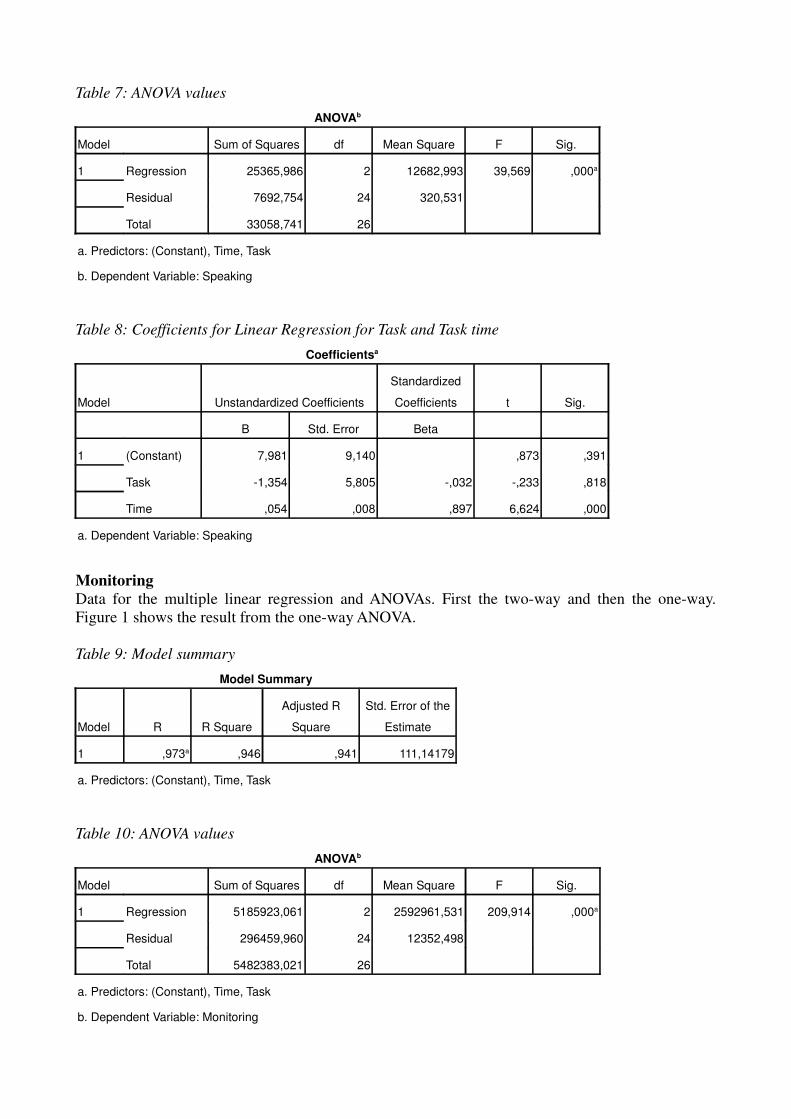
Table 7: ANOVA values
ANOVAb
Model Sum of Squares df Mean Square F Sig.
1 Regression 25365,986 2 12682,993 39,569 ,000a
Residual 7692,754 24 320,531
Total 33058,741 26
a. Predictors: (Constant), Time, Task
b. Dependent Variable: Speaking
Table 8: Coefficients for Linear Regression for Task and Task time
Coefficientsa
Model Unstandardized Coefficients
Standardized
Coefficients t Sig.
B Std. Error Beta
1 (Constant) 7,981 9,140 ,873 ,391
Task -1,354 5,805 -,032 -,233 ,818
Time ,054 ,008 ,897 6,624 ,000
a. Dependent Variable: Speaking
Monitoring
Data for the multiple linear regression and ANOVAs. First the two-way and then the one-way.
Figure 1 shows the result from the one-way ANOVA.
Table 9: Model summary
Model Summary
Model R R Square
Adjusted R
Square
Std. Error of the
Estimate
1 ,973a ,946 ,941 111,14179
a. Predictors: (Constant), Time, Task
Table 10: ANOVA values
ANOVAb
Model Sum of Squares df Mean Square F Sig.
1 Regression 5185923,061 2 2592961,531 209,914 ,000a
Residual 296459,960 24 12352,498
Total 5482383,021 26
a. Predictors: (Constant), Time, Task
b. Dependent Variable: Monitoring

Table 11: Coefficients for Linear Regression for Task and Task time
Coefficientsa
Model Unstandardized Coefficients
Standardized
Coefficients t Sig.
B Std. Error Beta
1 (Constant) 56,846 56,742 1,002 ,326
Task -100,271 36,038 -,182 -2,782 ,010
Time ,837 ,050 1,088 16,667 ,000
a. Dependent Variable: Monitoring
Data for the two-way ANOVA
Table 12: Between-Subjects Factors
Between-Subjects Factors
Value Label N
Condition 1,00 Co-located 9
2,00 Skype Video 9
3,00 CollaBoard 9
Task 1,00 A 9
2,00 B 9
3,00 C 9
Table 13: Descriptive Statistics
Descriptive Statistics
Dependent Variable:Monitoring
Condition Task Mean Std. Deviation N
Co-located A 484,8833 302,96416 3
B 770,2733 474,88385 3
C 753,6400 254,99142 3
Total 669,5989 338,85827 9
Skype Video A 740,1533 649,36814 3
B 350,3167 107,19438 3
C 1212,7200 186,00236 3
Total 767,7300 506,77465 9
CollaBoard A 260,9067 130,12871 3

B 788,0067 453,36506 3
C 1392,8900 143,83326 3
Total 813,9344 549,02496 9
Total A 495,3144 419,19643 9
B 636,1989 395,81261 9
C 1119,7500 334,00361 9
Total 750,4211 459,19591 27
Table 14: Levene's test
Levene's Test of Equality of Error Variancesa
Dependent Variable:Monitoring
F df1 df2 Sig.
2,382 8 18 ,060
Tests the null hypothesis that the error variance of the
dependent variable is equal across groups.
a. Design: Intercept + Condition + Task + Condition *
Task
Table 15: Test of between-subjects effects
Tests of Between-Subjects Effects
Dependent Variable:Monitoring
Source
Type III Sum of
Squares df Mean Square F Sig. Partial Eta Squared
Corrected Model 3,296E6 8 411985,267 3,392 ,015 ,601
Intercept 1,520E7 1 1,520E7 125,169 ,000 ,874
Condition 97791,955 2 48895,977 ,403 ,674 ,043
Task 1930769,600 2 965384,800 7,947 ,003 ,469
Condition * Task 1267320,580 4 316830,145 2,608 ,070 ,367
Error 2186500,886 18 121472,271
Total 2,069E7 27
Corrected Total 5482383,021 26
a. R Squared = ,601 (Adjusted R Squared = ,424)
Table 16: Estimated marginal means
Grand Mean
Dependent Variable:Monitoring
Mean Std. Error 95% Confidence Interval
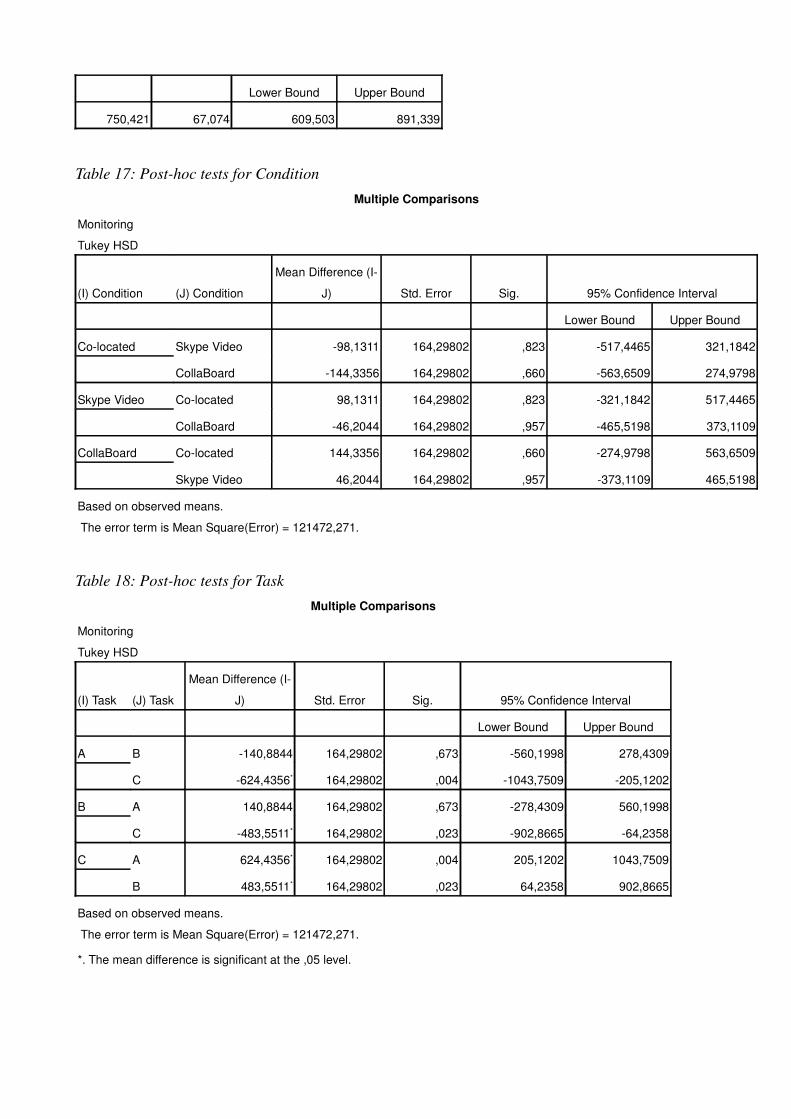
Lower Bound Upper Bound
750,421 67,074 609,503 891,339
Table 17: Post-hoc tests for Condition
Multiple Comparisons
Monitoring
Tukey HSD
(I) Condition (J) Condition
Mean Difference (I-
J) Std. Error Sig. 95% Confidence Interval
Lower Bound Upper Bound
Co-located Skype Video -98,1311 164,29802 ,823 -517,4465 321,1842
CollaBoard -144,3356 164,29802 ,660 -563,6509 274,9798
Skype Video Co-located 98,1311 164,29802 ,823 -321,1842 517,4465
CollaBoard -46,2044 164,29802 ,957 -465,5198 373,1109
CollaBoard Co-located 144,3356 164,29802 ,660 -274,9798 563,6509
Skype Video 46,2044 164,29802 ,957 -373,1109 465,5198
Based on observed means.
The error term is Mean Square(Error) = 121472,271.
Table 18: Post-hoc tests for Task
Multiple Comparisons
Monitoring
Tukey HSD
(I) Task (J) Task
Mean Difference (I-
J) Std. Error Sig. 95% Confidence Interval
Lower Bound Upper Bound
A B -140,8844 164,29802 ,673 -560,1998 278,4309
C -624,4356* 164,29802 ,004 -1043,7509 -205,1202
B A 140,8844 164,29802 ,673 -278,4309 560,1998
C -483,5511* 164,29802 ,023 -902,8665 -64,2358
C A 624,4356* 164,29802 ,004 205,1202 1043,7509
B 483,5511* 164,29802 ,023 64,2358 902,8665
Based on observed means.
The error term is Mean Square(Error) = 121472,271.
*. The mean difference is significant at the ,05 level.

Data for the one-way ANOVA
Table 19: Descriptives for the one-way ANOVA for Monitoring and Task
Descriptives
Monitoring
N Mean Std. Deviation Std. Error 95% Confidence Interval for Mean Minimum
Lower Bound Upper Bound
A 9 495,3144 419,19643 139,73214 173,0915 817,5373 137,50
B 9 636,1989 395,81261 131,93754 331,9504 940,4474 245,05
C 9 1119,7500 334,00361 111,33454 863,0121 1376,4879 497,61
Total 27 750,4211 459,19591 88,37229 568,7693 932,0730 137,50
Table 20: Test om homogenity for Task
Test of Homogeneity of Variances
Monitoring
Levene Statistic df1 df2 Sig.
,178 2 24 ,838
Table 21: ANOVA values
ANOVA
Monitoring
Sum of Squares df Mean Square F Sig.
Between Groups 1930769,600 2 965384,800 6,524 ,005
Within Groups 3551613,421 24 147983,893
Total 5482383,021 26
Table 22: Robust test
Robust Tests of Equality of Means
Monitoring
Statistica df1 df2 Sig.
Welch 6,977 2 15,840 ,007
Brown-Forsythe 6,524 2 23,232 ,006
a. Asymptotically F distributed.

Table 23: Post-hoc test for Task
Multiple Comparisons
Monitoring
Tukey HSD
(I) Task (J) Task
Mean Difference (I-
J) Std. Error Sig. 95% Confidence Interval
Lower Bound Upper Bound
A B -140,88444 181,34307 ,721 -593,7502 311,9813
C -624,43556* 181,34307 ,006 -1077,3013 -171,5698
B A 140,88444 181,34307 ,721 -311,9813 593,7502
C -483,55111* 181,34307 ,035 -936,4168 -30,6854
C A 624,43556* 181,34307 ,006 171,5698 1077,3013
B 483,55111* 181,34307 ,035 30,6854 936,4168
*. The mean difference is significant at the 0.05 level.
Figure 1: Means of Monitoring for Task
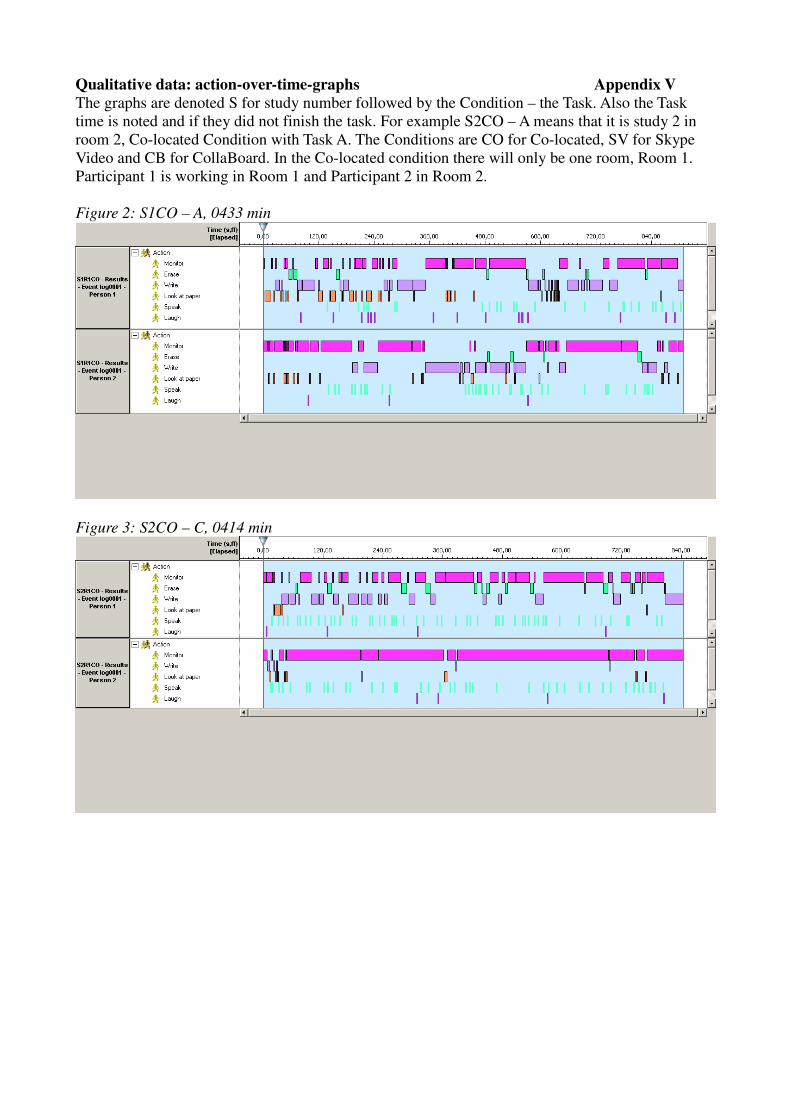
Qualitative data: action-over-time-graphs Appendix V
The graphs are denoted S for study number followed by the Condition – the Task. Also the Task
time is noted and if they did not finish the task. For example S2CO – A means that it is study 2 in
room 2, Co-located Condition with Task A. The Conditions are CO for Co-located, SV for Skype
Video and CB for CollaBoard. In the Co-located condition there will only be one room, Room 1.
Participant 1 is working in Room 1 and Participant 2 in Room 2.
Figure 2: S1CO – A, 0433 min
Figure 3: S2CO – C, 0414 min

Figure 4: S3CO – D, 0120 min
Figure 5: S4CO – D, 0100 min
Figure 6: S5CO – A, 0223 min
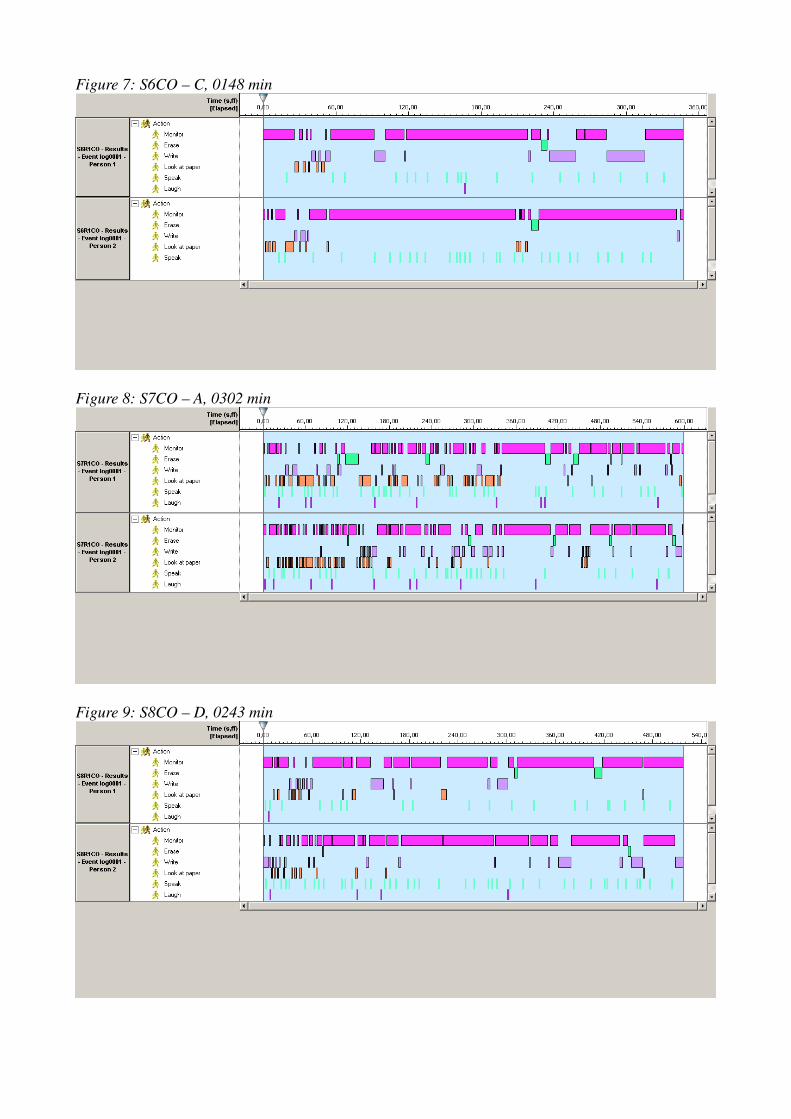
Figure 7: S6CO – C, 0148 min
Figure 8: S7CO – A, 0302 min
Figure 9: S8CO – D, 0243 min

Figure 10: S9CO – C, 0130 min
Figure 11: S1SV – C, 0139 min
Figure 12: S2SV – A, did not finish
Figure 13: S3SV – A, did not finish
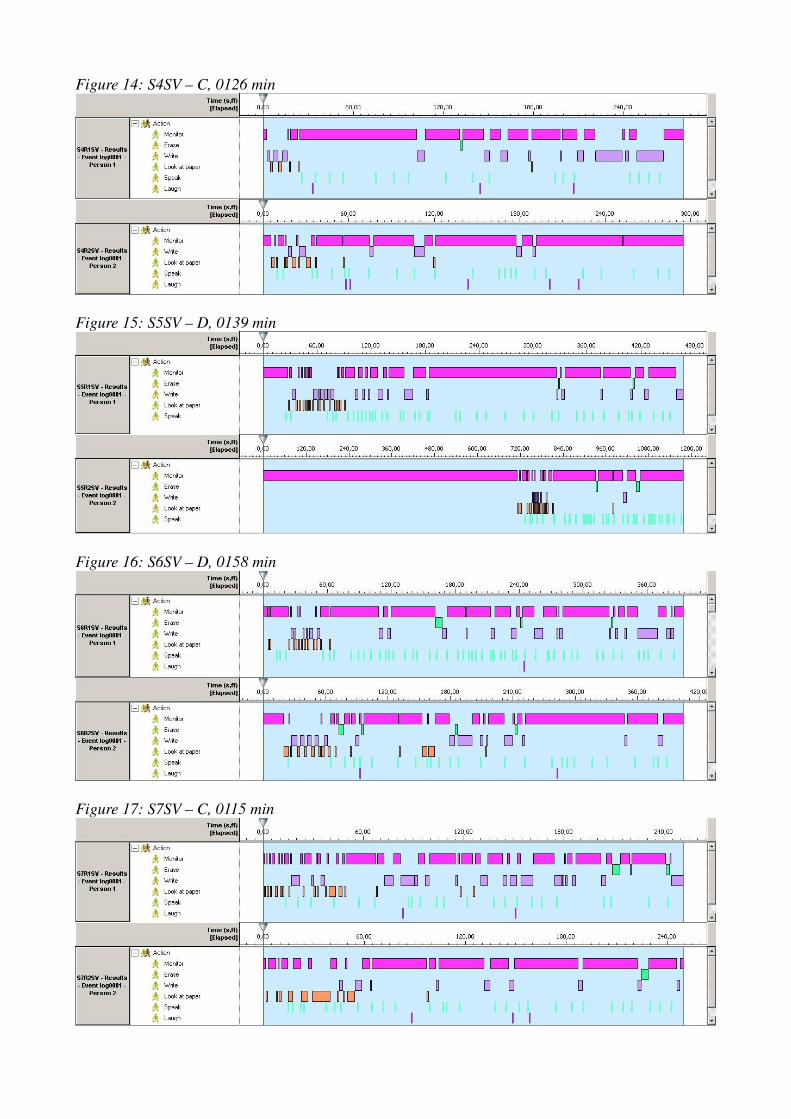
Figure 14: S4SV – C, 0126 min
Figure 15: S5SV – D, 0139 min
Figure 16: S6SV – D, 0158 min
Figure 17: S7SV – C, 0115 min

Figure 18: S8SV – A, did not finish
Figure 19: S9SV – D, 0104
Figure 20: S1CB – D, 0052 min
Figure 21: S2CB – D, 0138 min

Figure 22: S3CB – C, 0350 min
Figure 23: S4CB – A, did not finish
Figure 24: S5CB – C, 0158 min
Figure 25: S6CB – A, did not finish
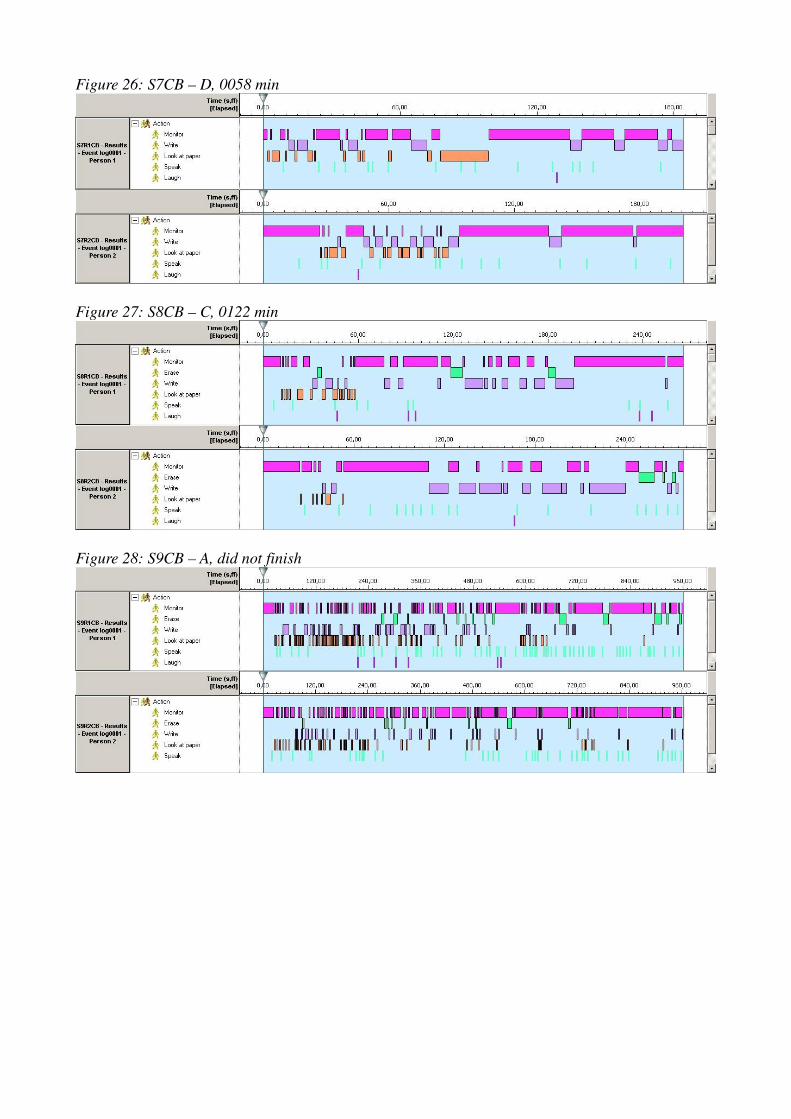
Figure 26: S7CB – D, 0058 min
Figure 27: S8CB – C, 0122 min
Figure 28: S9CB – A, did not finish
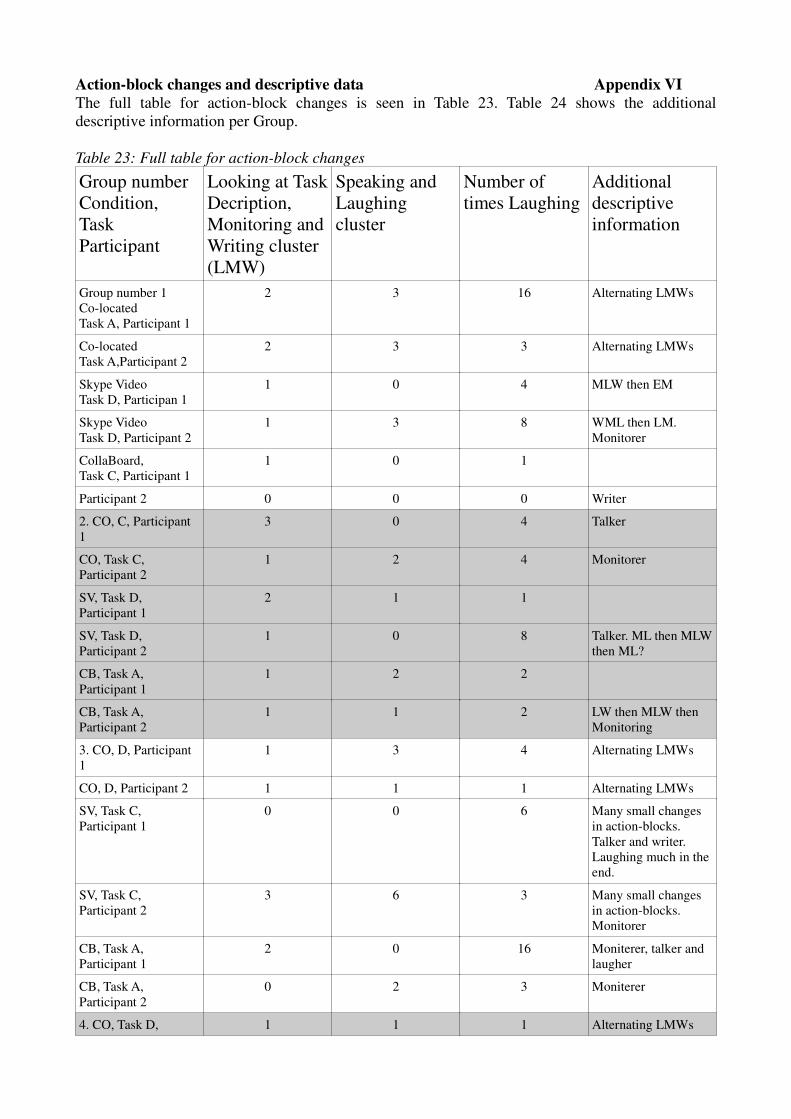
Action-block changes and descriptive data Appendix VI
The full table for action-block changes is seen in Table 23. Table 24 shows the additional
descriptive information per Group.
Table 23: Full table for action-block changes
Group number
Condition,
Task
Participant
Looking at Task
Decription,
Monitoring and
Writing cluster
(LMW)
Speaking and
Laughing
cluster
Number of
times Laughing
Additional
descriptive
information
Group number 1
Co-located
Task A, Participant 1
2 3 16 Alternating LMWs
Co-located
Task A,Participant 2
2 3 3 Alternating LMWs
Skype Video
Task D, Participan 1
1 0 4 MLW then EM
Skype Video
Task D, Participant 2
1 3 8 WML then LM.
Monitorer
CollaBoard,
Task C, Participant 1
1 0 1
Participant 2 0 0 0 Writer
2. CO, C, Participant
1
3 0 4 Talker
CO, Task C,
Participant 2
1 2 4 Monitorer
SV, Task D,
Participant 1
2 1 1
SV, Task D,
Participant 2
1 0 8 Talker. ML then MLW
then ML?
CB, Task A,
Participant 1
1 2 2
CB, Task A,
Participant 2
1 1 2 LW then MLW then
Monitoring
3. CO, D, Participant
1
1 3 4 Alternating LMWs
CO, D, Participant 2 1 1 1 Alternating LMWs
SV, Task C,
Participant 1
0 0 6 Many small changes
in action-blocks.
Talker and writer.
Laughing much in the
end.
SV, Task C,
Participant 2
3 6 3 Many small changes
in action-blocks.
Monitorer
CB, Task A,
Participant 1
2 0 16 Moniterer, talker and
laugher
CB, Task A,
Participant 2
0 2 3 Moniterer
4. CO, Task D, 1 1 1 Alternating LMWs

Participant 1
CO, Task D,
Participant 2
2 3 0 Alternating LMWs
SV, Task A,
Participant 1
1 5 3 MLW then MW until
the end
Participant 2 1 0 5 Talker. MLW then
MW until the end
CB, Task C,
Participant 1
2 3 7
Participant 2 1 4 6 Talker after MLW.
Many small action-
blocks for Writing.
5. CO, Task A
Participant 1
1 2 1 LW then MLW then
MW
Participant 2 3 3 3 Looker in the
beginning
SV, Task C,
Participant 1
1 0 0 Talker after MLW.
MLW then MW
Participant 2 1 0 0 Talker. LMW then M
until the end
CB, Task D,
Participant 1
1 4 0
CB, Task D,
Participant 2
1 2 0 MLW then MW
6. Co, Task C,
Participant 1
1 2 1
Participant 2 2 0 0 Talker
Skype Video, Task A
Participant 1
1 0 1 Talker after MLW.
MLW then EMW
Participant 2 1 0 2 Talker after MLW.
MLW then EMW then
EM
CB, Task D,
Participant 1
1 0 6 LM then LMW then
MW until the end.
Talker
Participant 2 1 0 13 Talker. LM then
LMW then small
action-blocks of
LMW until the end
7. CO, Task A,
Participant 1
3 3 9 LW then LMW then
LW then MW
Participant 2 2 3 10 LW long time then
LMW until the end
SV, Task D,
Participant 1
1 0 2 LMW then EM.
Talker
Participant 2 1 0 3 LM then LMW then
EM. Talker
CB, Task C,
Participant 1
3 3 1
Participant 2 1 0 1
8. CO, Task D, 2 0 1 Talker
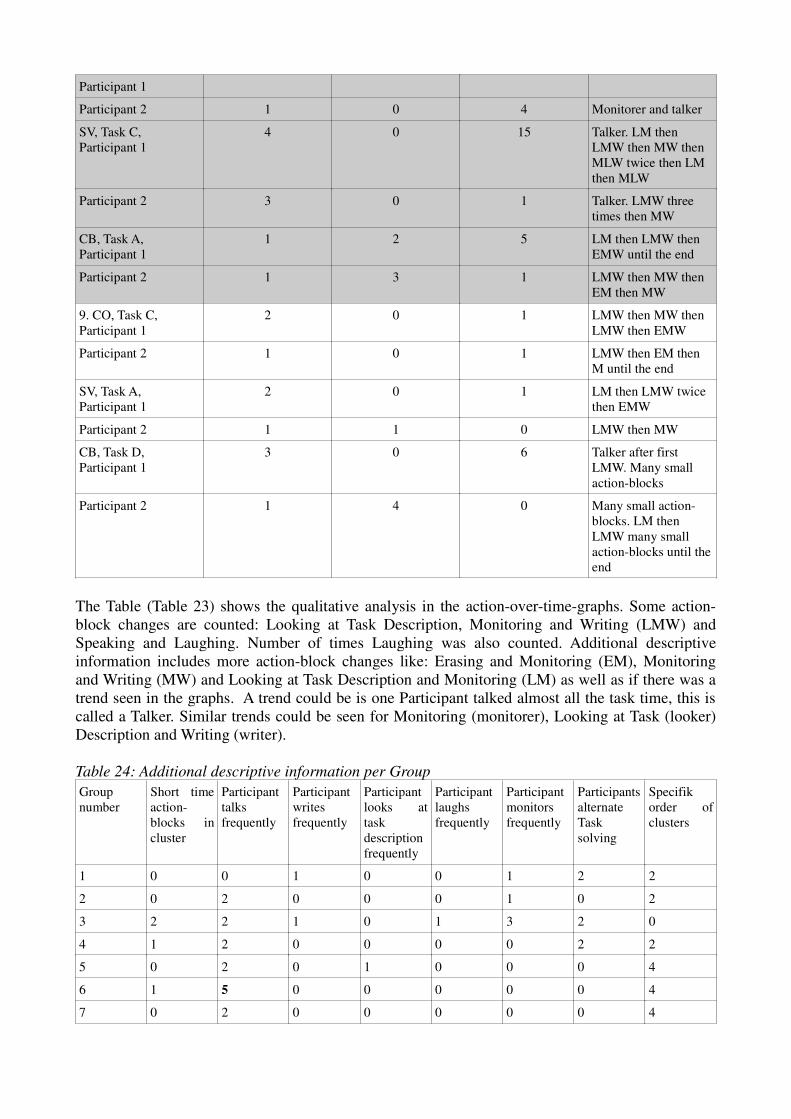
Participant 1
Participant 2 1 0 4 Monitorer and talker
SV, Task C,
Participant 1
4 0 15 Talker. LM then
LMW then MW then
MLW twice then LM
then MLW
Participant 2 3 0 1 Talker. LMW three
times then MW
CB, Task A,
Participant 1
1 2 5 LM then LMW then
EMW until the end
Participant 2 1 3 1 LMW then MW then
EM then MW
9. CO, Task C,
Participant 1
2 0 1 LMW then MW then
LMW then EMW
Participant 2 1 0 1 LMW then EM then
M until the end
SV, Task A,
Participant 1
2 0 1 LM then LMW twice
then EMW
Participant 2 1 1 0 LMW then MW
CB, Task D,
Participant 1
3 0 6 Talker after first
LMW. Many small
action-blocks
Participant 2 1 4 0 Many small action-
blocks. LM then
LMW many small
action-blocks until the
end
The Table (Table 23) shows the qualitative analysis in the action-over-time-graphs. Some action-
block changes are counted: Looking at Task Description, Monitoring and Writing (LMW) and
Speaking and Laughing. Number of times Laughing was also counted. Additional descriptive
information includes more action-block changes like: Erasing and Monitoring (EM), Monitoring
and Writing (MW) and Looking at Task Description and Monitoring (LM) as well as if there was a
trend seen in the graphs. A trend could be is one Participant talked almost all the task time, this is
called a Talker. Similar trends could be seen for Monitoring (monitorer), Looking at Task (looker)
Description and Writing (writer).
Table 24: Additional descriptive information per Group
Group
number
Short time
action-
blocks in
cluster
Participant
talks
frequently
Participant
writes
frequently
Participant
looks at
task
description
frequently
Participant
laughs
frequently
Participant
monitors
frequently
Participants
alternate
Task
solving
Specifik
order of
clusters
1 0 0 1 0 0 1 2 2
2 0 2 0 0 0 1 0 2
3 2 2 1 0 1 3 2 0
4 1 2 0 0 0 0 2 2
5 0 2 0 1 0 0 0 4
6 1 5 0 0 0 0 0 4
7 0 2 0 0 0 0 0 4
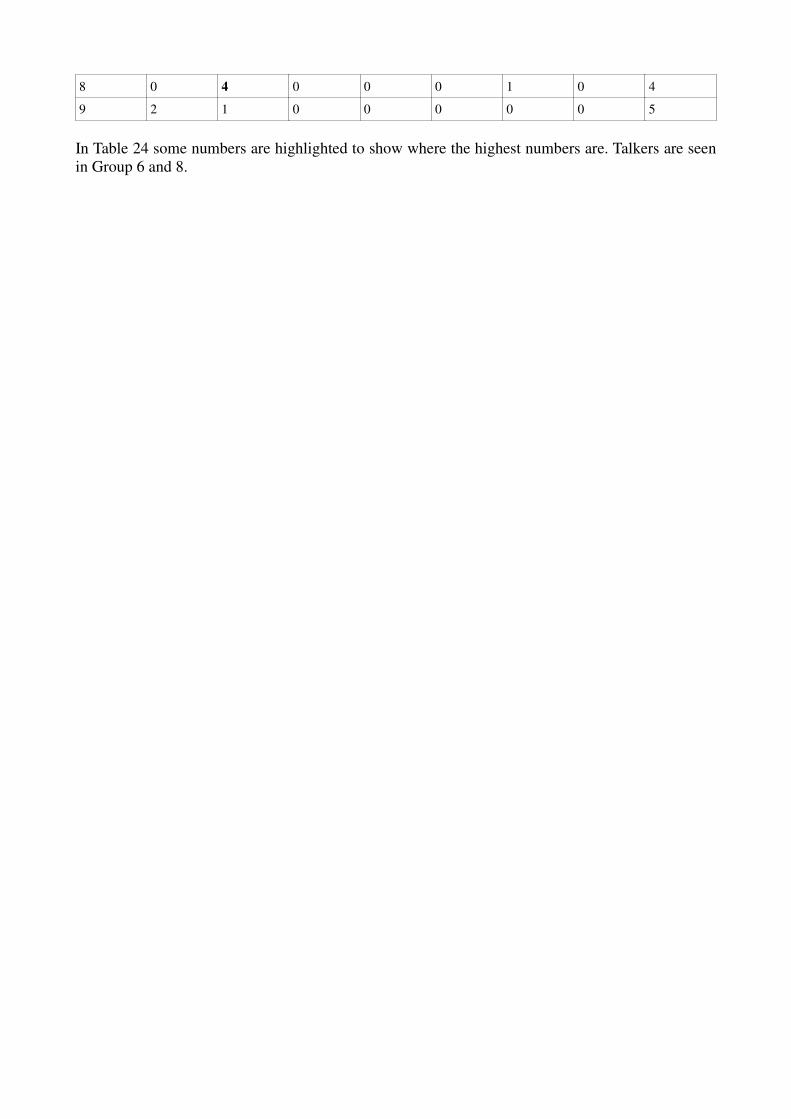
8 0 4 0 0 0 1 0 4
9 2 1 0 0 0 0 0 5
In Table 24 some numbers are highlighted to show where the highest numbers are. Talkers are seen
in Group 6 and 8.
Top Related