


Languages
Pages
Legal


University of Arkansas, FayettevilleScholarWorks@UARKChemical Engineering Undergraduate HonorsTheses Chemical Engineering
12-2017
Measurement of Peptoid Concentration Using UVSpectroscopyKatie Holland
Follow this and additional works at: http://scholarworks.uark.edu/cheguht
Part of the Chemical Engineering Commons
This Thesis is brought to you for free and open access by the Chemical Engineering at ScholarWorks@UARK. It has been accepted for inclusion inChemical Engineering Undergraduate Honors Theses by an authorized administrator of ScholarWorks@UARK. For more information, please [email protected], [email protected].
Recommended CitationHolland, Katie, "Measurement of Peptoid Concentration Using UV Spectroscopy" (2017). Chemical Engineering Undergraduate HonorsTheses. 109.http://scholarworks.uark.edu/cheguht/109

ii
Abstract
The goal of this research is to establish a relationship between ultraviolet adsorption and
peptiod concentration to be used to determine the concentration of an unknown peptoid sample.
This will allow for the measurement of concentration differences of peptoid samples before and
after incubation with membrane surfaces. Samples were prepared nine know concentrations and
diluted 50-fold. The UV absorbances of each sample was measured using a UV
spectrophotometer at wavelengths from 200 to 450 nanometers. This process was repeated, and
the maximum absorbance of each replicate was averaged to yield an absorbance value for each
concentration of peptoid. A linear calibration was obtained, allowing for the prediction of an
unknown peptoid concentration. The calibration curve established a linear relationship between
peptoid concentration of an original sample diluted 50 times and absorbance with an r-squared
value of 0.9595. The application of this curve could replace inaccurate techniques such as
weighing solutions.

iii
Table of Contents
Abstract………………………………………………………………...………...……………….iii
Introduction…………………………………………..……….…….……………………….…….1
Materials and Methods……………………………………………...……..………………....……2
Results and Discussion………………………………………………...…………...……………..4
Conclusions………………………………………………………………..…………………....…7
Acknowledgements………………………………………………………………………..………8
References…………………………………………………………………...………….…………9
Appendix A: Graphs and Figures ….……………………………………….…………...………10
Appendix B: Tables………………………………………………………..………..……...……17

1
Introduction
Biofouling is a widespread problem plaguing membrane applications in many fields.
Biofouling includes the accumulation of proteins, microorganisms, cells or other biological
molecules on the surface of synthetic membranes when exposed to blood or other biological
fluids [1]. Especially in medical applications, the phenomenon of biofouling can prevent
membranes from preforming their desired function. In many situations biofouling is irreversible;
removal of the foulant would cause unacceptable process disruption. In membranes used for
applications like an artificial lung, biofouling would decrease the efficiency, membrane lifespan
and increase costs [1]. One viable solution to prevent biofouling involves adhering a small layer
of polymer layer to membrane surfaces [2].
Biological polymers, including peptoids, consist of a sequence of monomers that dictate
both the structure and function of the molecule. Polypeptoids are a classification of synthetic
peptidomimetics derived from a N-substituted glycine backbone, whose functionality can be
manipulated by slightly altering the backbonestructure, in turn changing the chain shape and
properties of the polymer [3]. Several factors that tend to increase a surface’s propensity to foul
include: a charged surface, hydrophobicity, and chemicals that act as hydrogen bond donors or
acceptors [4,5]. Structurally, peptoids have no hydrogen bond donors in their flexible backbone,
fundamentally contributing to their ability to prevent biofouling [6]. One 5-mer NMEG peptoid
(NMEG5) has shown to be effective at preventing fouling up to 66% on an unmodified surface
after 2 hours [2].
To increase the ability of NMEG5 to prevent fouling, better methods must be developed
to measure how much of the peptoid is being attached membrane surface. With greater
attachment the antifouling affects of NMEG5 could potentially increase [2]. Ultraviolet
spectrophotometry has been shown to be an effective and fast method of measuring the
attachment incurring very few measurement errors in work with single walled nanotubes [7]. The
use of UV spectrophotometry to measure peptoid concentration has the potential allow
researchers to calculate exactly how much peptoid is being bonded to the surface of membranes,
and give more insight into the mechanisms behind the anti-fouling properties of NMEG5.

2
Materials and Methods
Due to the peptoid having a peak absorbance at approximately 214 nanometers, an ultra
violet (UV) spectrophotometer was used to measure the absorbance at wavelengths around this
value. Quartz cuvettes, shown in Figure 1, were used to
incur minimal disruption at the small wavelengths required
to measure the absorbance of the sample. The peak
absorbance was utilized to ensure that the maximum
sensitivity was captured in the resulting data. This
sensitivity ensures that the calibration curve produced will
be capable of detecting small peptoid concentration
changes in unknown samples.
The construction of the calibration curve began by
considering the absorbance of undiluted versus diluted
samples of peptoid at known concentrations. Nine undiluted samples were mixed starting at 4
micromolar and cutting each sample’s concentration in half until a concentration of 0.01
micromolar was reached. The second set of samples was comprised of the same concentrations
of the first set, but this time the concentration of each sample was diluted 50 times. The diluted
set of samples showed the most linear relationship, as discussed in the results section of this
report, and was decided to be the best course of action for continuing the research.
The calibration curve was constructed using peptoid concentrated in phosphate buffered
saline (PBS) at 0.08, 0.04, 0.02, 0.01, 0.005, 0.0025, 0.00125, 0.000625, and 0.0003125
micromolar. These samples were mixed immediately before
the absorbance was measured to ensure no evaporation or
peptoid settling in the solvent would alter the results. Each
sample set was created by diluting the preceding sample to
half of its concentration before the absorbance data was
measured. Using the same parent sample ensured that even if
the initial sample was not held to the exact labeled
concentration, changes in concentrations could still be
Figure 1. Quartz Cuvette [8].
Figure 2. UV Spectrophotometer [9].

3
accurately detected using the calibration curve. Each sample was measured three times, and the
maximum absorbance of these three replications was taken as the data point corresponding to
each concentration. Running the UV spectrophotometer, similar to the one in Figure 2, three
separate times eliminated any measurement error the machine could incur. The process explained
above was repeated three times for a freshly mixed parent sample to ensure the accuracy of the
calibration cure despite fluctuations in concentration that could have been present in one parent
sample.
4
Results and Discussion
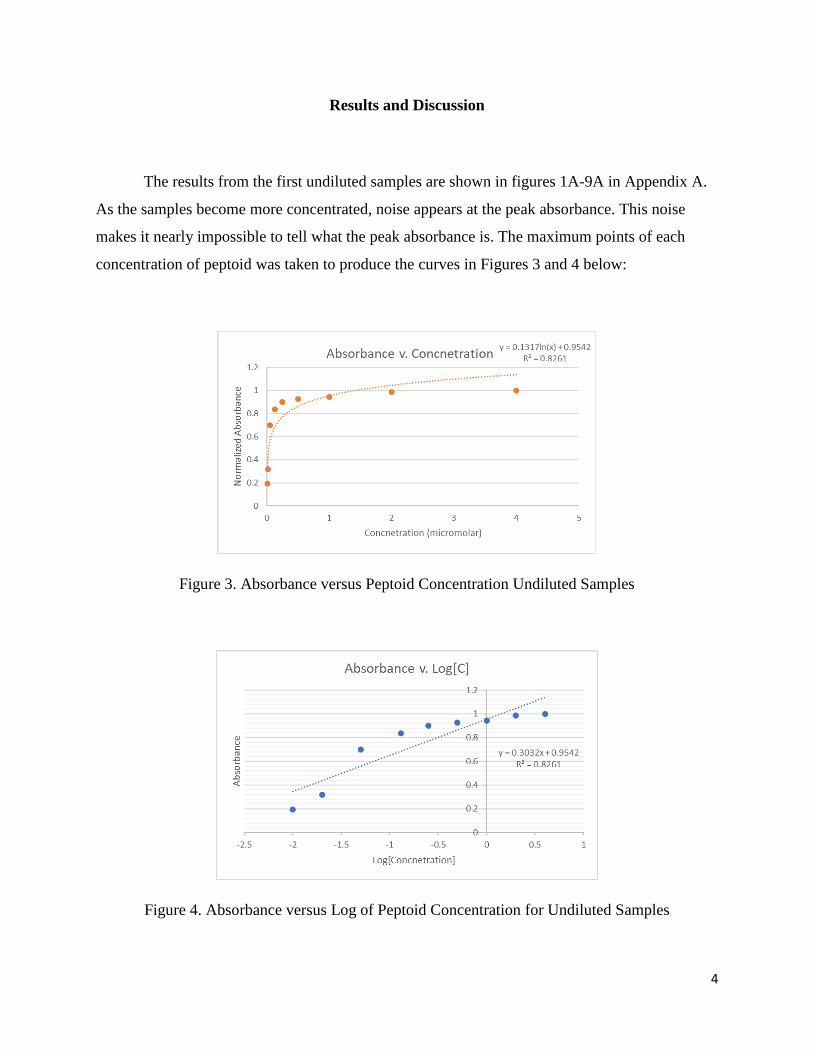
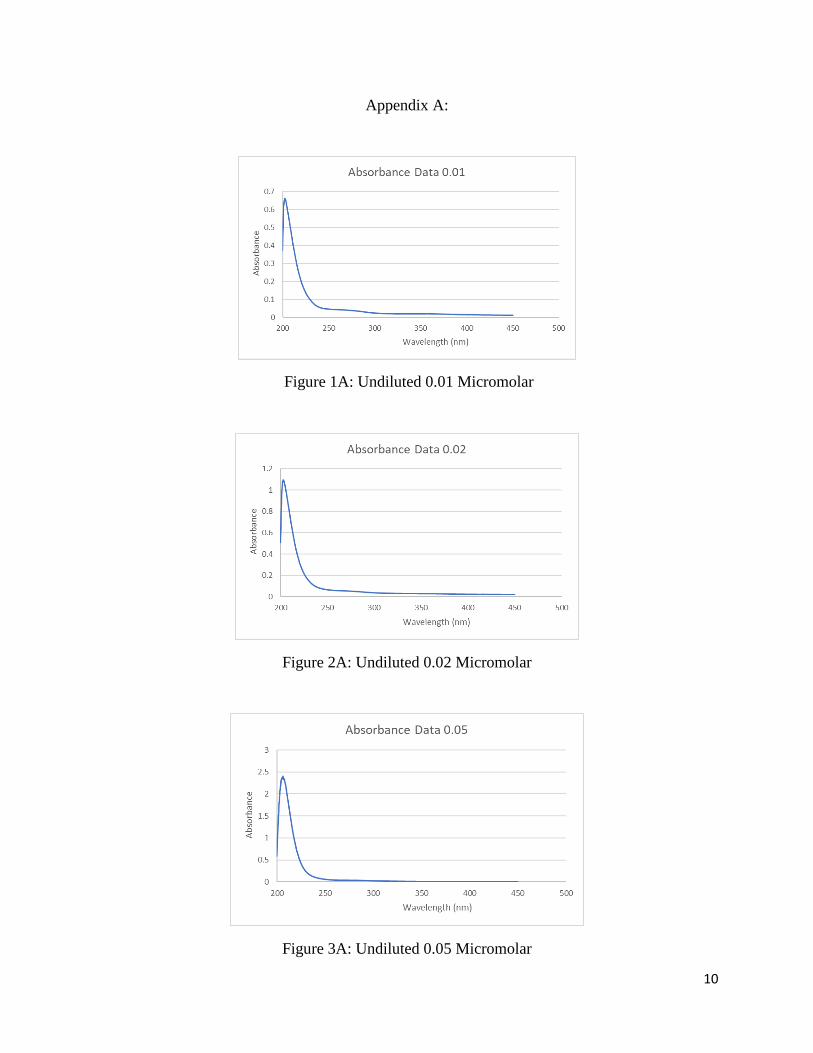
The results from the first undiluted samples are shown in figures 1A-9A in Appendix A.
As the samples become more concentrated, noise appears at the peak absorbance. This noise
makes it nearly impossible to tell what the peak absorbance is. The maximum points of each
concentration of peptoid was taken to produce the curves in Figures 3 and 4 below:
Figure 3. Absorbance versus Peptoid Concentration Undiluted Samples
Figure 4. Absorbance versus Log of Peptoid Concentration for Undiluted Samples

5
The relationship between absorbance and concentration seems to hold has a lose logarithmic, but
with an r-squared value of 0.8261 this relationship would not be useful for predicting
concentrations of peptoid.
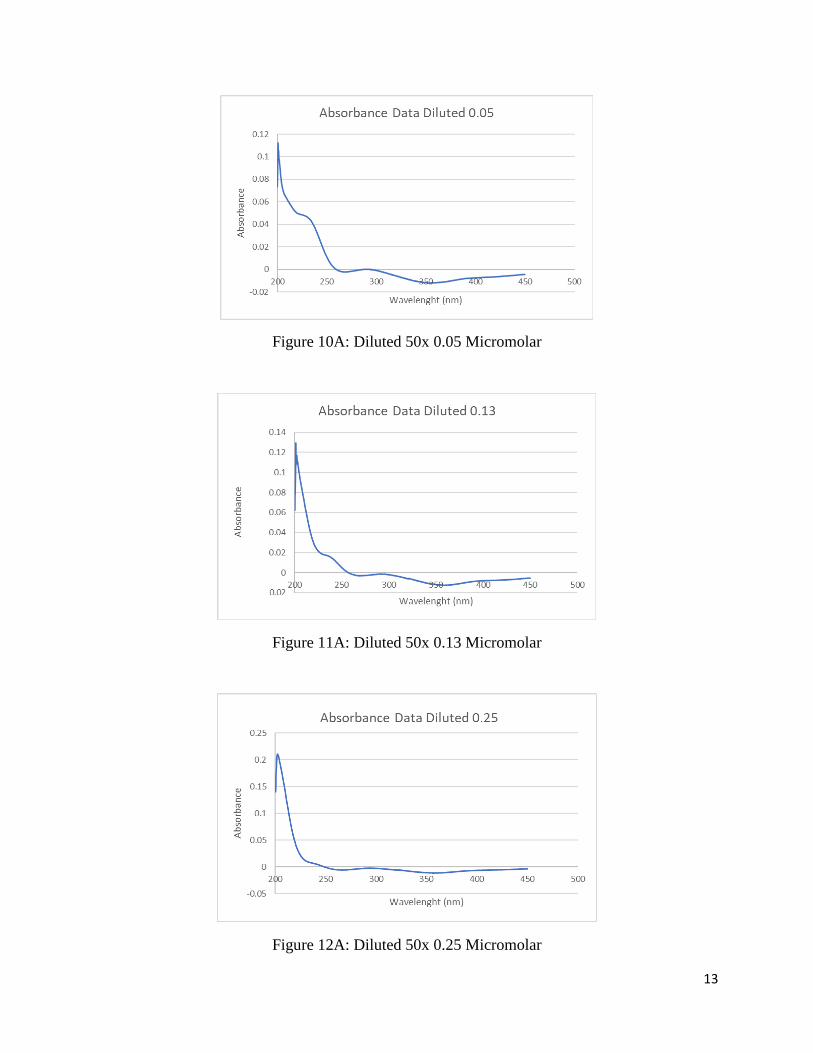
The results of the diluted samples are shownin figures 10A-16A in appendix A. Despite
the 0.05 and 0.13 micromolar samples not being concentrated enough to yield desirable results,
the diluted samples produced a better relationship between absorbance and concentration as
shown in Figure 5 below:
Figure 5. Diluted Absorbance
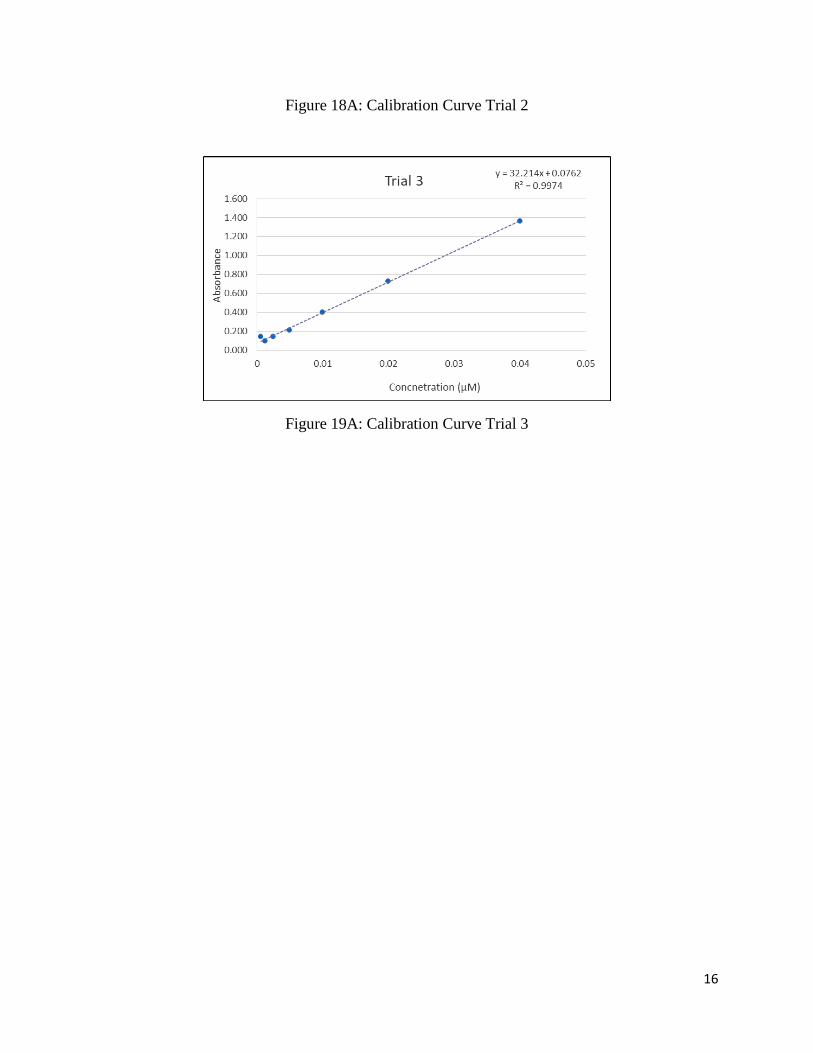
Once the linear relationship between absorbance and peptiod was established. The process was
repeated for three different samples. The results are shown in Appendix B Tables 1B-4B. The
resulting relationships from the three trials are included in Appendix A figures 17A-19A. Figure
6 shows the final relationship using the averaged data is shown with the standard error bars
included:

6
Figure 6: Standard Curve
As can be seen this curve looks very similar to figure 6. The repetitions eliminate error that could
have been present in the initial trial.

7
Conclusion
The strong linear relationship ( r-squared= 0.9595) between absorbance and
concentration of peptoid indicates using UV absorbance as a method of measuring peptoid
concentrations will be effective in research. Using this relationship will allow researchers to
abandon other tedious and inaccurate procedures used to account for peptoid being attached to
membrane surfaces. One concern with the relationship is the relatively large standard deviations
associated with each data point. For measuring larger concentration differences, the curve is
useful, but if the concentration difference being measured is very small further trials are
recommended.
8
Acknowledgements
I would like to thank Dr. Servoss and Neda Mahmoudi for allowing me the opportunity to
work on this research and instructing me along the way. I would like to thank Dr. Beitle for
allowing us to use his UV Spectrophotometer and making room for our research in his lab. I
would also like to thank the University of Arkansas Department of Chemical Engineering for
supporting me as I am working to attain my Bachelor’s of Science in Chemical Engineering with
Honors.

9
References
1. Ham, Hyun Ok, Sung Hyun Park, Josh W. Kurutz, Igal G. Szleifer, and Phillip B.
Messersmith. 2013. Antifouling glycocalyx-mimetic peptoids. Journal of the American
Chemical Society 135 (35): 13015.
2. Mahmoudi, N., Reed, L., Moix, A., Alshammari, N., Hestekin, J., Servoss, S. (2016).
PEG-Mimetic Peptoid Reduces Protein Fouling of Polysulfone Hollow Fibers. Colloids
and Surfaces B: Biointerfaces. 149. 10.1016/j.colsurfb.2016.09.038.
3. van Zoelen, W., Zuckermann, R. N., Segalman, R. A. Tunable Surface Properties from
Sequence-Specific Polypeptoid–Polystyrene Block Copolymer Thin Films
Macromolecules. 2012, 45, 7072– 7082, DOI: 10.1021/ma3009806
4. Jeffrey L. Dalsin, Phillip B. Messersmith, Bioinspired antifouling polymers, In Materials
Today, Volume 8, Issue 9, 2005, Pages 38-46, ISSN 1369-7021
5. Holmlin, R., Xiaoxi Chen, R.,Chapman, S., Whitesides, G., Zwitterionic, SAMs that
Resist Nonspecific Adsorption of Protein from Aqueous Buffer Langmuir, 2001, 17 (9),
2841-2850, DOI: 10.1021/la0015258
6. Kirshenbaum, Kent, B., Goldsmith, R., Armand, P., Bradley, E., Truong, K., Dill, K.,
Cohen, F., Zuckermann, R., "Sequence-specific polypeptoids: A diverse family of
heteropolymers with stable secondary structure." 1998. Proceedings of the National
Academy of Sciences 95 (8):4303-4308.
7. Attal, S.; Thiruvengadathan, R.; Regev, O. Determination of the Concentration of Single-
Walled Carbon Nanotubes in Aqueous Dispersions Using UV−Visible Absorption
Spectroscopy. Analytical Chemistry 2006 78 (23), 8098-8104. DOI: 10.1021/ac060990s
8. “Cuvettes.” Cole-Parmer, Cole-Parmer, www.coleparmer.com/c/cuvettes.
9. “BECKMAN DU 530 SPECTROPHOTOMETER.” Beckman DU 530
Spectrophotometer, www.thelabworldgroup.com/beckman-DU-530-spectrophotometer.
10
Appendix A:
Figure 1A: Undiluted 0.01 Micromolar
Figure 2A: Undiluted 0.02 Micromolar
Figure 3A: Undiluted 0.05 Micromolar

11
Figure 4A: Undiluted 0.13 Micromolar
Figure 5A: Undiluted 0.25 Micromolar
Figure 6A: Undiluted 0.5 Micromolar

12
Figure 7A: Undiluted 1.0 Micromolar
Figure 8A: Undiluted 2.0 Micromolar
Figure 9A: Undiluted 4.0 Micromolar
13
Figure 10A: Diluted 50x 0.05 Micromolar
Figure 11A: Diluted 50x 0.13 Micromolar
Figure 12A: Diluted 50x 0.25 Micromolar

14
Figure 13A: Diluted 50x 0.5 Micromolar
Figure 14A: Diluted 50x 1.0 Micromolar
Figure 15A: Diluted 50x 2.0 Micromolar

15
Figure 16A: Diluted 50x 4.0 Micromolar
Figure 17A: Calibration Curve Trial 1
16
Figure 18A: Calibration Curve Trial 2
Figure 19A: Calibration Curve Trial 3

17
Appendix B
Table 1B: Trial 1 Results
Trial 1 Max Absorbance
Concnetration (μM) Replication 1 Replication 2 Replication 3 Average
0.0003125 0.127 0.162 0.181 0.156
0.000625 0.162 0.208 0.234 0.201
0.00125 0.174 0.202 0.222 0.199
0.0025 0.180 0.201 0.211 0.197
0.005 0.325 0.340 0.349 0.338
0.01 0.461 0.473 0.486 0.473
0.02 0.848 0.858 0.875 0.860
0.04 1.446 1.450 1.450 1.449
0.08 2.305 2.320 2.312 2.312
Table 2B: Trial 2 Results
Trial 2 Max Absorbance
Concentration (μM) Replication 1 Replication 2 Replication 3 Average
0.0003125 0.096 0.105 0.114 0.105
0.000625 0.119 0.127 0.135 0.127
0.00125 0.170 0.179 0.185 0.178
0.0025 0.164 0.176 0.184 0.175
0.005 0.265 0.302 0.324 0.297
0.01 0.491 0.517 0.525 0.511
0.02 0.784 0.801 0.806 0.797
0.04 1.374 1.382 1.394 1.383
0.08 2.298 2.275 2.294 2.289
Table 3B: Trial 3 Results

18
Trial 3 Max Absorbance
Concentration (μM) Replication 1 Replication2 Replication3 Average
0.000625 0.138 0.128 0.142 0.142
0.00125 0.067 0.067 0.098 0.098
0.0025 0.138 0.128 0.142 0.142
0.005 0.216 0.208 0.213 0.213
0.01 0.400 0.401 0.404 0.404
0.02 0.728 0.726 0.728 0.728
0.04 1.368 1.372 1.364 1.364
0.08 2.321 2.321 2.321 2.321
Table 4B: Overall Results
Overall Reuslts Max Absorbance
Concentration (μM) Replication 1 Replication 2 Replication 3 Average Standard Deviation
0.0003125 0.105 0.156 0.131 0.026
0.000625 0.142 0.127 0.201 0.157 0.032
0.00125 0.098 0.178 0.199 0.158 0.044
0.0025 0.142 0.175 0.197 0.171 0.023
0.005 0.213 0.297 0.338 0.283 0.052
0.01 0.404 0.511 0.473 0.463 0.044
0.02 0.728 0.797 0.860 0.795 0.054
0.04 1.364 1.383 1.449 1.399 0.037
0.08 2.321 2.289 2.312 2.307 0.014
Top Related