


Languages
Pages
Legal

Means-‐end value assessment An important step towards value communication of a product related
service
Jonathan Hilborn & Jonatan Westergren
Master’s Thesis LIU-‐IEI-‐TEK-‐A—14/01973—SE
Department of Management and Engineering
Industrial Marketing

Värdebedömning ur ett kundperspektiv Ett viktigt steg mot att kommunicera värdet av en produktrelaterad
tjänst
Jonathan Hilborn & Jonatan Westergren
Handledare: Per Carlborg
Examinator vid LiU: Daniel Kindström
Handledare på företaget: Håkan Wahlgren & Sören Josefsson
Examensarbete LIU-‐IEI-‐TEK-‐A—14/01973—SE
Institutionen för ekonomisk och industriell utveckling
Industriell marknadsföring

Abstract Services are intangible in their nature. When product oriented companies seeks to expand their industrial offerings with services they encounter many problems, one of which is the challenge of selling these intangible services. The sales team needs to be able to show the value of the service in order to successfully reach out to the customers.
Embracing “service logic” has proven successful for this type of company. Its perspective on value creation is very different from the perspective traditionally employed by product companies i.e. through “product logic”. One must turn to customer day-‐to-‐day activities and look at their value creating processes in order to understand what value can be created from a service. This is because customers will not be interested in complex, intangible aspects of an offering. They want to know how a supplier can improve their business.
The purpose of this study is to develop a framework for value communication through value assessment (and segmentation) of a product related service in a B2B business relation.
A qualitative single case study was employed involving the multinational Swedish garden and forestry company Husqvarna (i.e. the supplier) and their soon-‐to-‐be-‐released IT-‐based fleet management service called Husqvarna Fleet Services (i.e. the service). Seven customer interviews were held in France, one in Sweden. The value hierarchy is used as an approach to value creation and the laddering technique is consequently employed in order to assess the potential customer value deriving from use of the service. On an attribute level, the elements are approximated to the categories of information represented in the user interface.
Primary ladders are comprised of 4 end-‐states and 22 consequences that should be seen as potential benefits from use of the service. Screening them for low frequencies, 11 consequences and 2 end-‐states (‘Productivity & Efficiency’ and ‘Cost Reduction/Control’) remain. Preliminary cost savings are given (as examples) in four cases although these lack significant information to be considered as important findings.
Attempting value based segmentation, a basic non-‐statistical segmentation gives rise to seven variables by which the identified benefits are thought to vary.
Employing the idea of communicating through a resonating focus, the findings suggest that depending on customer characteristics the 11 identified benefits, each of which will have varying degrees of importance. Due to the fact that no realized value is found, these benefits are still regarded intangible.
Finally, the complexity, novelty and intangibility of the offering point toward an increasing need for a communication strategy that serve the purpose of providing solutions to customers’ major issues. The results from our study suggest that the supplier rigorously attempts more pilot studies on a few selected targets in order to realize substantial value and develop business cases.

Acknowledgements We have conducted this case study as our Master Thesis, the final part of our studies at the program of M.Sc. Industrial Engineering and Management -‐ International at Linköping University. Many people have contributed in order to make this project successful and we would therefore take the opportunity to thank them all.
We would like to thank our tutors at the University, Daniel Kindström and Per Carlborg, who have help us during this whole process and we can honestly say that we could not have dreamed of having better tutors, thank you.
Second, we would like to thank Håkan Wahlgren and Sören Josefsson at Husqvarna for their help, guidance and challenging during this project. Furthermore we would like to give a special thanks to Fabrice Pinel and the French CLG team including Jerôme Lepotier and Philippe Blanc, who helped us with our field study in France. Thanks also to all other employees at Husqvarna who have help us during this project. We have had a great time and we are very grateful for having had the opportunity to work so closely to a real project in the industry.
Finally we would like to thank Erika Sager and Frida Hanson, our opponents, for having contributed with insightful comments and ideas on how to structure our report.
______________________________________ ______________________________________
Jonathan Hilborn Jonatan Westergren
Linköping, 1st of June, 2014

Table of Content
1 Introduction ................................................................................................................................................................. 1
1.1 Background ........................................................................................................................................................ 1
1.2 Aim of the study ................................................................................................................................................ 2
1.3 Context of the study ........................................................................................................................................ 2
1.4 Limitations .......................................................................................................................................................... 3
1.5 Structure of the report ................................................................................................................................... 4
2 Theoretical framework ........................................................................................................................................... 5
2.1 What is value? -‐ In search of a definition. .............................................................................................. 5
2.2 The customer value assessment process ............................................................................................ 10
2.3 Value based market segmentation – Who to address and with what? .................................. 15
2.4 Communicating Value -‐ delivering the message ............................................................................. 18
3 Husqvarna .................................................................................................................................................................. 22
3.1 Husqvarna -‐ the company ......................................................................................................................... 22
3.2 Fleet Services -‐ What is it and how does it work? .......................................................................... 23
3.3 Pre-‐study -‐ Workshop with customers, dealers and retailers ................................................... 28
4 Analysis Model and Research Questions ...................................................................................................... 30
5 Methodology ............................................................................................................................................................. 34
5.1 Work process .................................................................................................................................................. 34
5.2 Justification of the case study approach ............................................................................................. 38
5.3 Motivation of selection of cases .............................................................................................................. 38
5.4 Data collection methods -‐ interviews ................................................................................................... 40
5.5 Laddering ......................................................................................................................................................... 42
5.6 van Westendorp ............................................................................................................................................ 44
5.7 Quality measurements ................................................................................................................................ 45
6 Analysis ....................................................................................................................................................................... 48
6.1 Value Assessment – analysis from a value hierarchy perspective .......................................... 49
6.2 Value Assessment – analysis from a benefit and sacrifice perspective ................................. 66
6.3 Summarizing the value assessment. ..................................................................................................... 70
6.4 Value Segmentation ..................................................................................................................................... 72
7 Conclusion – a framework for value communication ............................................................................. 78
7.1 A conceptual step towards developing a value proposition – what benefits to emphasize ....................................................................................................................................................................... 78
7.2 Tailoring the value proposition to fit customer segments – what benefits to emphasize… ................................................................................................................................................................... 79

7.3 Need for tangibilizing the value proposition – how to communicate the benefits .......... 81
8 Managerial implications ...................................................................................................................................... 82
9 Discussion and theoretical implications ....................................................................................................... 84
References ........................................................................................................................................................................... 86
Appendix I -‐ Deliverables .................................................................................................................................................. i
Appendix II -‐ Consequences to value drivers (explanations/hypothetical cost savings) ................... iii
Appendix III -‐ 8 interviews with 8 different customers ..................................................................................... x
Appendix IV – Iterative steps of analysis process/model ............................................................................. xxii
Appendix V – Customers’ desired features, consequences and end-‐states/goal ................................. xxv
Appendix VI – Question to Pilot users .................................................................................................................. xxvi
Appendix VII – Raw data & Implication matrix ................................................................................................ xxxi
Appendix VIII -‐ Value Based Pricing ................................................................................................................... xxxiv
Appendix IX – van Westendorp ............................................................................................................................. xxxvi

Table of figures
Figure 1. Four-‐stage NSD framework ......................................................................................................................... 3
Figure 2. The Value Hierarchy (Woodruff, 1997) .................................................................................................. 7
Figure 3. Key points from value theory ..................................................................................................................... 9
Figure 4. Customer Value Audit ................................................................................................................................. 13
Figure 5. Key points from the value assessment theory .................................................................................. 14
Figure 6. Overview of the six step process of value based segmentation ................................................ 15
Figure 7. Illustration of input and output in step 1 of the six step market segmentation ................ 16
Figure 8. Illustration of which values to emphasise .......................................................................................... 21
Figure 9. Net sales by product category 2012 ..................................................................................................... 23
Figure 10. Overview of the technical components of the Fleet Services .................................................. 24
Figure 11. System overview Husqvarnas Fleet Services ................................................................................. 24
Figure 12. Web portal subscriptions ........................................................................................................................ 25
Figure 13. Analysis process .......................................................................................................................................... 30
Figure 14. Analysis model for value assessment ................................................................................................ 32
Figure 15. Illustration of the remodelled U-‐model ............................................................................................ 34
Figure 16. Illustration of the sales process network ......................................................................................... 39
Figure 17. An association network or “ladder” from one respondent in a salty-‐snack study ........ 42
Figure 18. Value Hierarchy ........................................................................................................................................... 49
Figure 19. Value map developed from the eight customers’ responses ................................................... 55
Figure 20. Summarizing value assessment ........................................................................................................... 71
Figure 21. The customers of the study explained by the segmentation variables ............................... 76
Figure 22. Value Map – highlighted parts to fit customer needs – a conceptual picture ................. 78
Figure 23. Value Map – right side highlighted ..................................................................................................... 79
Figure 24. Benefits as function of the identified segmentation variables ............................................... 80
Figure 25. Four-‐stage NSD framework ................................................................................................................... 82
Figure 26. Obstacles to the implementation of value-‐based pricing strategies .................................... 83

Table of tables
Table 1. Service logic vs goods logic ............................................................................................................................ 6
Table 2. Overview of four authors’ benefits ............................................................................................................. 8
Table 3. Overview of the three authors sacrifices ................................................................................................. 8
Table 4. Tangibilization strategies ............................................................................................................................ 19
Table 5. Reworked from Kowalkowski and Kindström (2012) ................................................................... 20
Table 6. Price per subscriptions of the Fleet Service ........................................................................................ 26
Table 7. Price per hardware of the Fleet Service ................................................................................................ 26
Table 8. Pre-‐study of customers’ main business issues and thoughts about the Fleet Services .... 28
Table 9. Summary of the planned interviews ...................................................................................................... 40
Table 10. Customers’ desired service features .................................................................................................... 50
Table 11. Customers’ desired consequences in use in relation to HFS ..................................................... 51
Table 12. Customers’ Goals in relation to HFS ..................................................................................................... 52
Table 13. Desired consequences in use VS Husqvarna Business Values .................................................. 54
Table 14. Frequency of Business Values from desired consequences in use. ........................................ 55
Table 15. Lapierre’s (2000) value drivers ............................................................................................................. 66
Table 16. Consequence to value driver ................................................................................................................... 67
Table 17. Theoretical value drivers encountered – benefits ......................................................................... 68
Table 18. Categorisation of sacrifices ...................................................................................................................... 69
Table 19. Theoretical value drivers encountered -‐ sacrifices. ...................................................................... 69
Table 20. Reworked from Kowalkowski and Kindström (2012) with the customers’ wishes and needs ............................................................................................................................................................................ 81

Means-‐end value assessment
1
1 Introduction This first chapter introduces the reader to the problem and the area of interest of this study. This is followed by the aim of the study, delimitations and their effects. Finally, a structure of the report is presented.
1.1 Background More and more manufacturing companies expand their offer with services. One explanation would be because the market forces them to do so (Brown, Gustafsson & Witell, 2009). However, as found out by companies that have made the journey successfully, there are evident benefits that can be obtained from moving into services. Oliva and Kallenberg (2003) suggest that these benefits can be categorised into economic, competitiveness and customer demand. First, adding services to the offer can bring about higher margins (Oliva & Kallenberg, 2003; Brown, Gustafsson & Witell, 2009) given the fact that services often require a smaller capital investment than products. Moreover, growth can be stimulated by expanding the service offer as the product business decreases (Kowalkowski & Kindström, 2012:24-‐25). This is especially prominent on the North American and European markets where the installed base is already extensive. Second, services are abstract and therefore hard to copy (Raddats & Easingwood, 2010) which explains why increasing the relative share of services in the offer also increases competitiveness (Oliva & Kallenberg, 2003). Third, from a pure customer perspective, the need for services is increasingly large due to attempts to reduce activities and to become more flexible (Raddats & Easingwood, 2010). In this respect, services are outsourced and suppliers that have already provided a company with products are well placed to win this new business.
If companies want to become true service providers they must focus on what Kowalkowski (2011) calls value-‐in-‐use and not on the more traditional value-‐in-‐exchange which is the negotiated evaluation between buyers and sellers. Although there are many interpretations of the term “customer value”, scholars have come to a consensus which concludes that it is through the eyes of the customers that value is created. It is not, as earlier proposed, intrinsic product features whose values add up to a determined sum of value that is ultimately passed on to customers. Hinterhuber (2004) has a similar view and notes that a fundamental aspect of “creating customer value” is to being able to quantify and communicate the value of a given product through pricing and marketing activities. The example below (Nagle & Hogan, 2006) highlights this critical factor of understanding the customers’ needs and what their value-‐in-‐use of the service is.
“IH had for many years grouped farmers according to benefit perceptions, especially equipment reliability, of theirs tractors compared to their competitor’s, John Deer. Although IH’s tractors broke down less often than John Deer’s, customers still reported John Deer equipment to be more reliable. In-‐depth interviews with customers gave the explanation to this, which was that John Deer had better network for repairs once a machine had broken down. The main issue for the customers was not really the breakdown but rather the downtime a breakdown caused due to repair time. John Deer’s service oriented network of dealers had better stocks of spare parts and offered loaned tractors when a machine had broken down which reduced the customers’ non-‐working time and therefore made John Deer the preferred supplier.”

Means-‐end value assessment
2
Nagle and Hogan (2006) argues that a value-‐based segmentation would have revealed that the customers were driven by the value of a total solution and not only product quality.
Value-‐based segmentation is closely related to estimating the value of the service from a customer perspective, something many authors(Anderson & Narus, 1998; Hinterhuber, 2004; Nagle & Hogan, 2006; Ulaga & Chacour, 2001) refers to as value assessment or measurement. When the supplier has the knowledge of what value the service could bring to the customer, he can adjust the selling arguments to a specific customer and might be able to conduct a value-‐based segmentation in order to find the appropriate arguments or solutions for different segments of customers. Those steps lay the groundwork for the phase of communicating the value to the customer. As exemplified in the business case below this is as important and difficult as the value assessment, especially for product-‐oriented companies who often have focused on value-‐in-‐exchange.
“When German Heidelberg, a world leader in the printing industry, launched their new B2B service they failed to recognize the issue of using the right arguments towards the right people (Reinartz & Ulaga, 2008). The service involved a self-‐monitoring system that could save the customer a substantial amount of downtime. Although priced well below the equivalent monetary worth of this downtime, customers were not interested. It was proved that the sales force did not have the right selling arguments when pitching the idea to customers. Instead, they used the same old arguments as for normal product procurement situations.”
Put together, it seems that when companies expand their offering with services (and they do) they should invest a fair share in understanding the customers’ needs. By assessing the values that come from a particular service or offering and effectively communicating those values, companies seem to have better odds when moving into services. Traditionally, in the manufacturing industry, hard facts and product-‐focused arguments have laid the foundation. Now, with emerging theory originating from service development and real-‐life examples, companies should look beyond this and come closer to where and how the actual value is created. Assessing and communicating value-‐in-‐use before a customer has used the product or service can seem contradictory with the meaning of value-‐in-‐use. The idea is however to try and come as close to the in-‐use situation as possible in order to communicate the true value the customer would experience in the “in use situations”.
1.2 Aim of the study “Lay a foundation for value based communication through means-‐end value assessment of a
product related service in a B2B business relation”
1.3 Context of the study Husqvarna AB serves as a perfect case company in order to conduct this thesis. Coming from a long and rich tradition in the manufacturing industry it is now looking to expand its commercial offerings with Husqvarna Fleet Services (HFS). The Fleet Services would serve as a technological solution that would allow their customers to reduce cost through maintenance plans, optimized machine handling and overviews of fleet productivity. A key concern for the company is how to come about the problem of launching the service in an effective way. They lack the knowledge of what/where/how/when value is created, how customers differ in terms of needs and how to
Means-‐end value assessment
3
effectively communicate those values. This may cause a misperception of customers in sale situation which in the long run may harm the profitability of this much-‐called-‐for service expansion.
1.4 Limitations [Husqvarna specific] The thesis investigates customer value regarding Husqvarna’s product related service, Husqvarna Fleet Services, and does thus not reflect the value of the total Husqvarna offering which means that the results should not be interpreted as customers’ perceived value of the whole supplier’s offer. It may provide a false picture of how the customers evaluate Husqvarna as a supplier. The customer is defined as the end-‐users or purchaser of the services, i.e. landscapers and municipalities.
[Organizational] Even though the service eventually will be sold through dealers they are not considered in this study. The thesis will also not consider any organisational issues when it comes to selling services. This might affect our conclusions on how to communicate the value since it is finally the dealers who will be responsible for selling the services. We however stress the importance to take the customers’ point of view since they are the final users of the service. This affects the degree to which the results can be applied throughout the internal organisation.
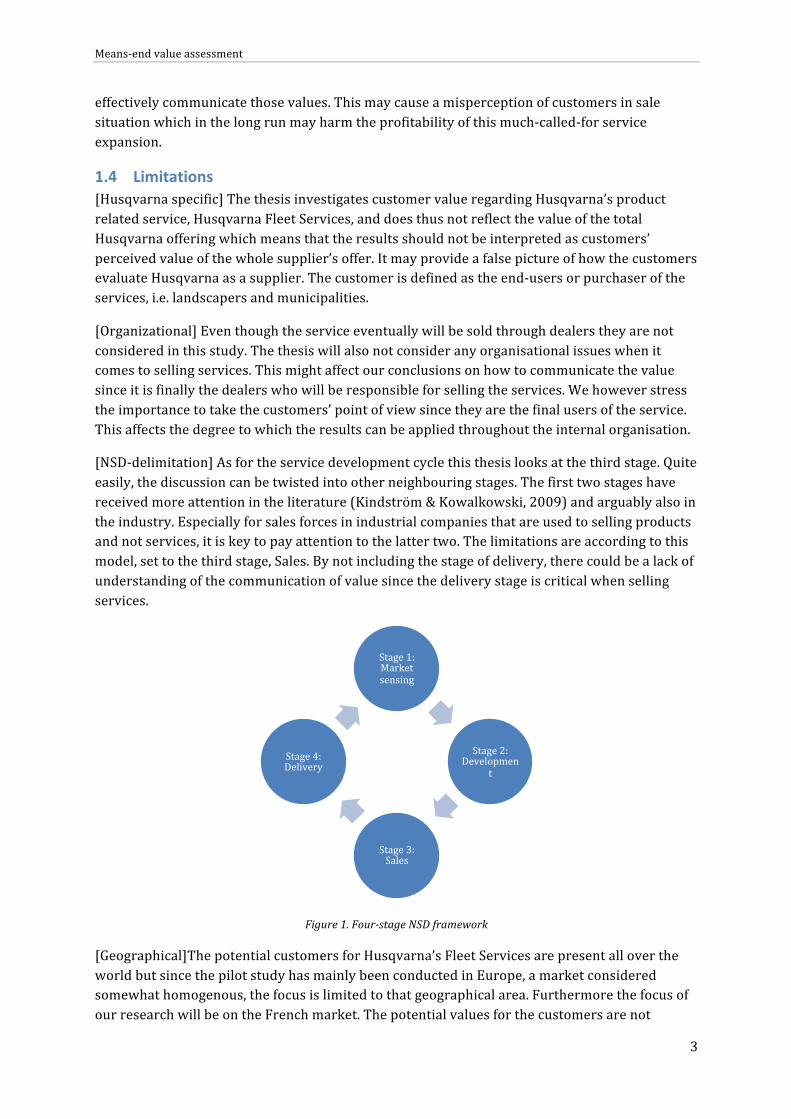
[NSD-‐delimitation] As for the service development cycle this thesis looks at the third stage. Quite easily, the discussion can be twisted into other neighbouring stages. The first two stages have received more attention in the literature (Kindström & Kowalkowski, 2009) and arguably also in the industry. Especially for sales forces in industrial companies that are used to selling products and not services, it is key to pay attention to the latter two. The limitations are according to this model, set to the third stage, Sales. By not including the stage of delivery, there could be a lack of understanding of the communication of value since the delivery stage is critical when selling services.
Figure 1. Four-‐stage NSD framework
[Geographical]The potential customers for Husqvarna’s Fleet Services are present all over the world but since the pilot study has mainly been conducted in Europe, a market considered somewhat homogenous, the focus is limited to that geographical area. Furthermore the focus of our research will be on the French market. The potential values for the customers are not
Stage 1: Market sensing
Stage 2: Developmen
t
Stage 3: Sales
Stage 4: Delivery

Means-‐end value assessment
4
transferable to the entire European market but the work process of assessing, segmenting and communicating the value is thought to be applicable globally throughout all customer segments.
[Temporal] This thesis provides a momentary picture of what customer value looks like for a given service in a specific context. Although valuable, it is important to recognize that any context is due to change and so is customer value. It is subjective and changes over time. We emphasize the need to work continuously with these questions and not see the results as finite.
The results of this study are intended for salespeople and managers of the products related to the Fleet Services. Future recommendations that are discovered could nonetheless be useful throughout the entire organization.
1.5 Structure of the report 1. Introduction – introduces the reader to the problem on an aggregated level before presenting it from Husqvarna’s point of view. The aim of study is stated. 2. Theoretical framework –presents all the relevant academic literature including customer value, value assessment and much more, that is used in the research. 3. Husqvarna–introduces the company of Husqvarna, its environment, the Fleet Services and puts the reader into context. 4. Analysis model and research questions – discusses which and how the presented theories will be employed for the analysis process, analysis model and research questions. 5. Methodology – gives an explanation of how the literature search has been carried out, the structure and process of the thesis as well as a presentation of the methods to gather empirical data for the analysis. 6. Analysis – presents the results of the study and answers the research questions by relating to the analysis model, relevant theories and empirical data. 7. Conclusions –provides answers to the aim of the study. 8. Managerial implications – discussion about how our study can help the case company. 9. Discussion and theoretical implications – accounts for further areas of interest that been touched in some way during the study.

Means-‐end value assessment
5
2 Theoretical framework This chapter begins with a discussion of the concept of value in order to make it clear to the reader what our standpoint is. The reader is then shortly introduced to the main theoretical areas that are employed in this stud, namely the value assessment process, the values based market segmentation and value communication.
2.1 What is value? -‐ In search of a definition.
2.1.1 A first definition First of all, a distinct and unambiguous definition of “value” can be ruled out. The literature presents several perspectives on and approaches to the concept (Ramsay, 2005). However, it is important in this particular thesis to establish some clarity in the notion; we will use the term value a lot. The definitions used and discussed are the ones found most aligned with the intentions of this work, which is to identify and categorize different types of customer values in order for the sales force to understand what it is that they actually offer. First, we make an early statement of what value is:
Value is created when a customer is better off after he/she has been assisted by a service than before (Grönroos, 2008)
This is an easy description but it captures the essence of the value concept from a service oriented perspective. Yet, to be able to understand and illustrate the concrete value we have to break it down into measurable components. The next section will briefly describe the alternative perspectives that exist in order to motivate our choice of perspective.
In his criticizing paper, (Ramsay, 2005) goes through the fields of economics, marketing, strategy and operations in order to straighten out the value concept. Although these fields present some slight differences in detail, he argues that they share the restriction of talking about value from the eyes of customers. In order to generalize the value concept he argues that one must see beyond the “customer value” (the benefits enjoyed by the recipient of an offering) and include what he refers to as “supplier value” (the benefits enjoyed by the providers of an offering). This attention, he further argues, is called for since the concept of value chain was initially presented and demanded a broader approach to business. Though, he acknowledges the fact that the domain of marketing has little to gain from looking at value from this latter perspective, its objective being to understand customer needs and to communicate them to the internal organization. This seems fair, and thus an early distinction for our thesis is made; whenever the term value is used we refer to customer value and not supplier value.
2.1.2 A second definition One definition of value that many authors (Flint et al., 1997; Ravald & Grönroos, 1996; Ulaga & Chacour, 2001; Walter et al., 2001) take as their starting point is:
A trade-‐off between benefits and sacrifices perceived by customers
Some define value monetarily whereas others include non-‐monetary measures (Walter et al., 2001) . Lapierre (2000) proposes that customer sacrifices are the overall monetary and non-‐monetary costs the customer invests to complete a transaction or maintain a relationship.

Means-‐end value assessment
6
Anderson and Narus (1998) on the other hand, propose that value in business markets is the monetary worth of the technical, economic, service and social benefits a customer company receives in exchange for the price it pays for a market offering. They argue that value is to be seen strictly in monetary measures since they have never “met a manager who cared about utiles” (i.e. non-‐monetary value). The benefits include the customer’s incurred costs except the purchase price. Adding their idea that there is always a competitive alternative, the next best alternative (a), to a supplier (s), all this boils down to their equation:
𝑉𝑎𝑙𝑢𝑒! − 𝑃𝑟𝑖𝑐𝑒! > (𝑉𝑎𝑙𝑢𝑒! − 𝑃𝑟𝑖𝑐𝑒!)
representing a customer’s incentive to purchase. Although somewhat confusing (they use the terms benefits and value synonymously), this represents a narrower, strictly monetary perspective of the value concept. Replacing value by benefits and price by sacrifices in the equation, the same relationship is seen again.
Despite this latter definition, we suggest that in the marketing and business literature a sort of “consensus” has been reached; the benefits and sacrifices are perceived by the customer, rather than pre-‐determined and embedded in a company’s offering. It therefore seems important to see the individual customer’s needs.
2.1.3 Service logic vs goods logic Another way to discuss the value concept is from a business logic point of view. Vargo and Lusch (2004) noted that a fundamentally different view on how economic exchange took place was emerging in marketing. Thus they coined the terms service logic and goods logic. Table 1 shows some key points of difference.
Table 1. Service logic vs goods logic
Goods logic Service logic Goods are primary resources of exchange. Knowledge, skills or services are. Value is determined by producers Value is perceived and co-‐produced by the
customers Customers are recipients of value Customers are co-‐producers of value Kowalkowski and Kindström (2012:39-‐41) elaborates on the same theme. From a traditional industrial perspective the value is looked upon as pre-‐defined and it is simply passed on from the supplier to the customer. A fundamental idea that has to be embraced in order to understand the meaning of value from a service logic is that value is co-‐created (between suppliers and customers), rather than something delivered and built-‐in in an offering.
2.1.4 Value-‐in-‐exchange vs value-‐in-‐use In order to succeed with the service business moving into the value-‐in-‐use perspective is key (Kowalkowski & Kindström, 2012:36). The traditional manufacturing perspective on value creation revolves around value-‐in-‐exchange i.e. the price negotiated between a buyer and a seller as opposed to value-‐in-‐use which is the perceived value of the customer in an in-‐use situation. The latter implies that not only will different customers perceive value differently but the same customer will perceive the value differently depending on time.

Means-‐end value assessment
7
For this study, although important, it is not enough to define value broadly. In order to assess and ultimately propose a basis for value communication we need to narrow down the value concept and try to operationalize it. We now move to finding lower-‐level components of value.
2.1.5 Breaking down the value concept – value hierarchy Flint et al (1997) criticize the existing literature by stating that it lacks an understanding of how value change takes place. Building on customer satisfaction literature, their categorization of value drivers, or trigger events, is based on this change perspective. They define a trigger event as following: a stimulus in the customer's environment that is perceived by the customer to be relevant to his/her goals, which results in some form of change in values (personal and/or organizational), desired value, and/or value judgments. A trigger event can initiate change e.g. the awareness of issues that previously were unrecognized. For example, a supplier’s competitor may offer a new service leading the customer to re-‐evaluate the current supplier. Value can thus be classified into three forms; values, desired value and value judgments. This is important because the supplier needs to understand how value change takes place in order to act upon the right forces.
Woodruff (1997) suggests a definition of value that would consolidate different views of value to that date. He thus proposes that:
Customer value is a customer’s perceived preference for and evaluation of those product attributes, attribute performances and consequences arising from use that facilitate (or block) achieving the
customer’s goals and purposes in use situations.
This is illustrated in his “value hierarchy model”.
Figure 2. The Value Hierarchy (Woodruff, 1997)
It essentially says that customers think about products and services as bundles of specific attributes and attribute performances which in turn forms desires about the attributes that facilitate the desired consequences that customers have. Further, the desired consequences are formed through their ability to achieve the firm’s goals. This works the other way around as well. The value created in the purchasing and use “phase” is divided into value-‐in-‐use, reflecting the use of the product/service to achieve a certain goal and value-‐in-‐possession, reflecting the inherent meaning of the product/service to the customer (Flint et al., 1997).

Means-‐end value assessment
8
Sellers should be aware of the consequences in use situations and their related goals because it is how customers see value that will determine what they will do in e.g. a procurement situation (Woodruff, 1997). The author argues that an operational concept, such as the value hierarchy, helps to specify what managers should learn about their customers. It is a means-‐end perspective of value creation.
2.1.6 Breaking down the value concept -‐ value drivers By studying authors that present drivers (or elements) affecting value in some way, we hope this will add useful knowledge in order to get to the core of the individual customer’s key concerns regarding value creation. Without discussing context aspects or categorization, we have identified value drivers that four authors have described as benefits.
Table 2. Overview of four authors’ benefits
Lapierre (2000) Blocker (2011) (Ulaga & Eggert, 2006)
Ravald & Grönroos (1996)
Alternative solutions Offer quality Product quality Physical attributes Product quality Personal interactions Delivery
performance Service attributes
Product customization Service support Service support Technical support (in-‐use)
Responsiveness Know-‐how Personal interactions
Purchase price
Flexibility Supplier know-‐how Indicators of perceived quality
Reliability Time to market Technical competence Supplier’s image Trust Supplier solidarity with customer
First we conclude that Blocker (2011) presents a revised version of Ulaga (2006), hence the similarity between the two. Blocker chose to exclude the goods-‐based factors since his study targeted the B2B service industry. Lapierre (2000) on the other hand, building on empirical findings from the IT industry, considers the whole scope taking into account the service, product and relationship related benefits. The same summary is made for sacrifices.
Table 3. Overview of the three authors sacrifices
Lapierre (2000) Blocker (2011) Ulaga & Eggert (2006) Ravald & Grönroos (1996) Price Direct costs Direct costs Purchase price Time Acquisition costs Acquisition costs Acquisition costs Effort Operation costs Operation costs Transportation Energy Installation Conflict Order handling Repairs and maintenance Risk of failure or poor
performance

Means-‐end value assessment
9
Lapierre (2000) is the only one who explicitly uses non-‐monetary measures. Ravald and Grönroos (1996) is the only one who describes a value driver (Purchase price) as both a benefit and a sacrifice.
The literature presents several ways of segmenting value drivers. Lapierre (2000) chooses to do so by connecting them to either the product, service or relationship that the offering includes. He argues that, in addition to product and service related value drivers, one should look at relational drivers. Ravald and Grönroos (1996) also put great emphasis on relational aspects in their study on value creation. So do Sharma and Sheth (1997) who further suggest that value can be created within three types of partnerships/relationships: supplier, alliance and customer. A categorization similar to Lapierre (2000) is Ulaga and Chacour’s (2001), although they use the word “components” instead of “driver”. They state that customer perceived value is a function of price (sacrifice) and quality (benefit). This latter is in turn composed of product, service and promotion related components. The promotion part reminds a lot of what the other authors name relational drivers. Ulaga and Eggert (2006) relate the drivers to what they call “value source”. They too have a relational approach to value creation and further categorize the drivers into three dimensions where they are said to operate. These are the following: core offering, sourcing process and customer operations.
Measuring the value of customer relationships and how customers perceive the total value proposition (products, service, channels, ideas) were two top priorities at The Market Science Institute for three years (Lapierre, 2000).
2.1.7 Key points from the value theory Since the value concept is multifaceted and open for discussion we argue it is important to make it clear to the reader what our standpoint is when moving on with the study. The next figure presents the main ideas that will be employed.
Figure 3. Key points from value theory
Value ...is subjective and changes over time
...is created in use situations
...is perceived by the customers
Value drivers
...can be used to explain what drives value
...can be further categorised as beneuits and sacriuices
The value hierarchy
...is an operational concept
...is a means-‐end approach to value creation

Means-‐end value assessment
10
2.2 The customer value assessment process Several scholars (Anderson & Narus, 1998; Hinterhuber, 2004; Nagle & Hogan, 2006; Ulaga & Chacour, 2001) have proposed models or processes of how to assess customer value but with some different objectives for it. Hinterhuber (2004) and Nagle & Hogan (2006) develops a framework for value based pricing (Appendix VIII) in contrast to Ulaga & Chacour (2001) who focuses on a strategic perspective when trying to assess customer value. Finally Anderson & Narus’ (1998) final objective in the assessment of customer value is to develop a sales tool that enables the supplier to communicate the potential value of the offering to a particular customer, which is very similar to the aim of this thesis.
Although these models or processes have somewhat different objectives and differ on some steps or order of the steps in the process they are overall very similar. There are four main steps that the mentioned authors brings up in their value assessment (also called measurement) process: Identification of a reference product or the second best alternative; Identification of benefits and sacrifices of the offering; Collect data to obtain initial estimates of each value driver; Summarizing the total value of the offer. The next section summarizes the authors’ different value assessment processes and brings up a two steps that not all authors argue is needed; Putting together the right kind of value team and Segmentation. The purpose of this section is to illustrate the points of difference and the similarities of the authors’ models to later on develop a framework for the value assessment being conducted in the research of the paper.
Step 1. Putting together the right kind of value team Since B2B selling and purchasing process often involves members from different parts of both the selling and buying organisation and that the value perception across members in the supplier organisation can differ it is critical to set up the right team to investigate the value offering (Ulaga & Chacour, 2001). Also Anderson & Narus (1998) points out the importance of choosing the right team from the supplier’s organisation, which should include product and field engineers, marketing people and salespeople. They especially emphasize the importance of the salespeople since they have knowledge about the customer, which customer would be willing to cooperate and how the offering is used. In this study it is obvious that the value team constitutes of the authors of the paper but this step will serve as a guideline when choosing informants from Husqvarna, the dealers and customers for the gathering of empirical data.
Step 2. Identification of a reference product Comparing performance measurements of the offering with the second best alternative on the market is critical and distinguishes customer value assessment from customer satisfaction measurement (Ulaga & Chacour, 2001). This alternative supplier’s offer does not have to be a physically similar product but rather any product, process or service that the customer could use to reach the same goal (Hinterhuber, 2004). This is also the case in this study, since the service is radically new to the market. The reference product could for example be a solution that the customers have developed themselves to reach certain goals (Nagle & Hogan, 2006). Both Hinterhuber (2008) and Nagle & Hogan (2006) use the following definition for a product’s economic value in their economic value analysis: “the price of the customer’s best alternative-‐reference value-‐plus the value of whatever differentiates the offering from the alternative-‐differentiation value”. One realizes that in order to evaluate the economic value of a product it is necessary to first of all identify the reference value, that is, the alternative supplier’s offer.

Means-‐end value assessment
11
Step 3. Segmentation Anderson & Narus (1998) and Hinterhuber (2004) both include market segmentation as a step or part of a step in the value assessment but for different reasons. The former argues that a segmentation is important because the supplier will have to conduct a dozen of interviews with customers to develop an initial value model and that this should be done in well established customer relationships where the supplier has a great knowledge of the customers’ use of the offering. The latter, on the other hand, argues that segmentation is important since the perceived value of both the reference product and the offering varies among customers depending on customer characteristics, usage of the product and environmental factors. Also Ulaga & Chacour (2001) use segmentation as a part of their customer value assessment process.
Step 4. Identification of benefits and sacrifices of the offering The identification of the positive and negative aspects of the offering is a central step in each of the value assessment models presented by the scholars even if these aspects are named differently. Nagle & Hogan (2006) uses the term value drivers and distinguishes monetary value drivers from psychological value drivers. The former being tangible and related to the financial outcome of the offer for the customer and should be quantified as cost reduction or revenue increase. The latter, intangible drivers, are not easily quantifiable and require a more elaborate way to do it. Ulaga & Chacour (2001) takes a similar approach by grouping benefits as quality related aspects and sacrifices as price related. Anderson & Narus (1998) denominates this step as “generating a list of value elements” where these elements are anything that affects the costs and benefits of the offering from a customer perspective. They also stress that the elements can vary in tangibility and be technical, economical, service or social related. They point out an interesting thought when discussing the fact that the value team has to make trade-‐offs between trusting the customer on what these elements are and evaluating in which way the supplier’s offer actually affects the customer since the customer might not understand all elements or drivers associated with the offer. Hinterhuber (2004) on the other hand stresses that it is not the supplier but the customer who must judge whether, what he calls, the differentiating factor, which is another interpretation of value drivers, are relevant to the customer’s business or not.
Step 5. Collect data to obtain initial estimates of each value driver The next step according to the scholars (Anderson & Narus, 1998; Hinterhuber, 2004; Nagle & Hogan, 2006; Ulaga & Chacour, 2001) is to collect data from the customer to estimate the value, often in monetary terms, of each value element, driver or differentiating factor. Hinterhuber (2008) argues that this is a straightforward but complex process when assessing the tangible values. Ulaga & Chacour (2001) uses a method of measuring value based on the difference between the customer’s expectations and perception of a performance. A more thorough discussion of which method should be used when assessing customer value will be conducted later on. Nagle & Hogan (2006) argues similarly and adds that the goal of this process is to develop value driver algorithm in order to calculate revenue increases or cost reduction. Anderson & Narus (1998) have the same approach but stresses that all value drivers cannot be expressed in monetary terms but are still included in the analysis as “value placeholders”. They also add that is critical that the customer really understand all assumptions that the value teams makes during the value assessment. Their final step also includes developing some kind of sales tool for salespeople to use to show the value of the offering to the customer.

Means-‐end value assessment
12
Step 6. Summarizing the total value of the offer The final step according to Nagle & Hogan (2006) is to sum the differentiation values to determine a total monetary value of the offering, the differentiation value being the value of the difference between the supplier’s offering and the reference offering according to the customer. Hinterhuber (2008) also uses a reference value plus the differentiation value to assess the total value of the offer but adds a step where estimation of future sales at different price points can be made. Anderson & Narus (1998) have a slightly different step when first summarizing the values to a value model and then validating it by conducting value assessment with other customers.
2.2.1 How to collect data and quantify it in the value assessment The last section discusses different scholars’ view of all the steps in the customer value assessment process. The aim of this section is to dig further into how the interaction with customers can be carried out to get relevant information in order to assess the customer value. Assessing and quantifying tangible and intangible values during a value assessment in a B2B context is a complex process that can be carried out uses different methods (Anderson & Narus, 1998; Hinterhuber, 2008). Hinterhuber (2008) proposes five methodologies or tools to do this.
1. Expert Interviews 2. Focus group assessment of value 3. Conjoint analysis 4. Assessment of value-‐in-‐use 5. Importance ratings
The purpose of this section is to highlight different methods proposed by scholars to both identify value drivers, step 4 of the value assessment, and collect data to estimate the value of them, step 5 of the value assessment. A combination of these methods to assess customer value will also be presented. A further discussion and a more detailed description of the methods used in this study will be carried out the chapter Methodology.
How to identify value drivers -‐ step 4 of the value assessment Anderson & Narus (1998), Ulaga (2001) and Hinterhuber (2008) suggests to first conduct an internal customer value audit with what the later calls experts interviews to gain an understand of the supplier’s view of customer value. This means conducting individual or group interviews with company experts from different areas such as sales, marketing, controlling, finance, product management etc. Anderson & Narus (1998) adds to this step interviews or focus group with the customer and, as mentioned, stresses the importance that it must be the customer not the supplier that has the final saying of what they value. They also mention the possibility to interview independent consultants when needed.
How to collect data to estimate tangible drivers – step 5 of the value assessment Nagle & Hogan (2006) argues that in-‐depth interviews to understand the customers’ business and how the offering affects it is the best way to collect data and develop value algorithm to estimate the value of it. Hinterhuber (2008) also presents this method called Expert Interviews and should not be confused with focus group assessment of value. The latter is another method discussed by Hinterhuber (2008) where customers in groups of 5-‐15 discuss the importance and impact of a new product. Anderson & Narus (1998) adds another way to do this, namely by placing a person or team from the supplier in the customer’s business operation to observe and understand how the offer is used and what effects it has on the customer’s business, a method Hinterhuber (2008) names as Assessment of value-‐in-‐use. He brings up a third method called

Means-‐end value assessment
13
Importance ratings where customers are asked to respond to a questionnaire with the purpose to estimate customer value of existing and future product offerings. Value is considered created if the perceived customer importance for a future offer is high and that, at the same time, the satisfaction of a current offering is low.
How to collect data to estimate intangible drivers – step 5 of the value assessment A way of quantifying intangible values is conducting a conjoint analysis (Anderson & Narus, 1998; Nagle & Hogan, 2006) where customer rank their purchase preferences on different offerings with attributes that varies for each offering (Hinterhuber, 2008). With statistical analysis, the value can then be identified for each attribute of the offering. Anderson & Narus (1998) proposes interviews, focus groups and other discussions with the customer to assess intangibles
In reality can and should all or at least a few of the presented methodologies be used in the customer value assessment in order to obtain a valid result. In-‐depth-‐interviews might be more adequate at the start of the process and conjoint analysis used to validate to model (Hinterhuber, 2008). According to Anderson et al. (1992) are focus group value assessment and importance ratings the most frequently used but the conjoint analysis seems to have the best practical impact. Furthermore is the value assessment to determine a present or potential augmenting service, which this thesis investigates, reported to be the second most successful business decision that this method is used for.
Ulaga & Chacour (2001) presents a framework consisting of three steps to measure customer value where they, as mentioned, use several of the presented methodologies, see figure 4.
Figure 4. Customer Value Audit
The first step identifying purchasing criteria is done through a group session with the supplier’s sales personal. The criteria are then rank according to relative importance. They then develop a customer questionnaire, segment the market and choose a customer sample.
The second step constitutes of interviews with relevant customer employees who are involved in the purchasing process where they first assess their purchasing criteria as in step one. They then add a scale where the customers rank the performances of the supplier and competing suppliers against their expectations. The final step is to compute a value map where the supplier can position themselves against competitors.
2.2.2 Key points from value assessment theory The following ideas will be emphasised throughout the rest of the report.
Phase 1: Start-‐Up
• Internal CVA • Questionnaire preparation • Segmentation • Sampling
Phase 2: Survey
• Face-‐to-‐face interviews • Analyses and maps • Presentation of results
Phase 3: Strategy formulation • Strategic options • Simulation and mapping • Action plan

Means-‐end value assessment
14
Figure 5. Key points from the value assessment theory
The reference product ...makes the difference between customer satisfaction studies and
customer value studies.
Identiuication of value drivers
...is important to understand what the elements that affect positive and negative aspects of the offering are.
Estimating the value drivers
...is a straightforward but complex process
...aims at calculating revenue increases or cost reduction
...is best done through in-‐depth interviews initially
...can employ conjoint analysis in case of intagibility

Means-‐end value assessment
15
2.3 Value based market segmentation – Who to address and with what? An adequate market segmentation and description of subgroups is crucial to make the right marketing and sales decision. The point is to find criteria that differentiate buying behaviour (Echeverri & Edvardsson, 2002:386-‐387; Nagle & Hogan, 2006:38-‐39). The potential need for market segmentation in this study is the same as Echeverri and Edvardsson (2002:387) presents, namely that customer needs, perceived value and customer expectations are thought to vary between segments. In order to find a basis for value communication to support the sales team, an identification and description of these potential segments is thought to be needed. The same problem in B2C contexts has been received a lot of attention (Verhallen et al., 1998) where individuals’ personal behavioural patterns and characteristics have been the main variables for segmentation (van Raaij & Verhallen, 1994). Hinterhuber (2008) proposes market segmentation for value based pricing assessments, based on the needs of the customer. The reason is because need as a main variable enables the supplier not to restrict themselves to market segments that are presumed to only care about price. Nagle & Hogan (2006:39) oppose to this idea since the supplier’s benefits are not taken into account. Instead they propose a value-‐based market segmentation where the idea is to find out why customers prefer certain offers over others. Verhallen et al. (1998) argue in the same way but use the term “strategic market segmentation”, where a firm’s strategy is equivalent to an individual’s buying behaviour and characteristics. The firm has a certain objective in terms of strategy and limitation in terms of means when purchasing a product or service. There is a trade-‐off between which customers’ needs to satisfy and the profitability of meeting them (Grönroos et al., 2008; Nagle & Hogan, 2006).
The next section will deal with the six-‐step process for conducting a value-‐based market segmentation, presented by Nagle & Hogan (2006:38-‐44).
Figure 6. Overview of the six step process of value based segmentation
1. Determine Basic Segmentation Criteria
Basic enterprise firmographics are not enough to segment a market since the buying behaviour can for example differ even among same sized companies within the same industry, but it is a good start to a more complex segmentation. The authors propose input and output according to the figure below.
Basic segmentation
Cluster depending on value drivers
Identify where the supplier has potential
Create primary and secondary segments
Description of each segment
Metrics & Fences

Means-‐end value assessment
16
Figure 7. Illustration of input and output in step 1 of the six step market segmentation
This information should enable a preliminary segmentation map that should be discussed and validated with salespeople since this segmentation probably will play a major role in the communication and sales strategies.
2. Identify Discriminating Value Drivers
The second step is to identify the value drivers that differ among segment but are homogeneous within the segments. Those are most likely not the same as the preliminary segments from step 1. Additional in-‐depth interviews with customers are useful to understand why they choose a specific offer; this can also be double checked with industry experts and salespeople. The output of this step should be a list of value drivers ranked by their discrimination factor among customers with an explanation of why customers value them, if every customer values each driver and if their needs are met. The authors recommend a statistical discrimination analysis to cluster the drivers.
3. Determine Your Operational Constraints and Advantages
The supplier must now identify where he has operational advantage and is able to deliver his offer better than competitors. The authors propose an activity based costing to build a customer behaviour spectrum. This is thought not to be interesting in the scope of this study and will therefore not be discussed further. The relevant part of this step is to identify customers where the supplier has the best conditions to meet their needs.
4. Create Primary and Secondary Segments
This step should result in a segmentation based on the value drivers that differentiate the groups of customers. It can either be done in stages, one value driver at the time or using a multivariable statistical analysis tool. The authors propose to first divide the customers into two groups where the most important value driver is the differentiator and then continue with the second most important driver and so on. The first segmentation should also include the ability of the supplier meeting the customer’s needs and the profitability of them meeting it. They however stress the fact that this process should not be done too many times since too many subgroups of customers are too difficult to handle in practice.
5. Create Detailed Segment Descriptions
A description in “ordinary business language” of each segment is now to be done in order to give salespeople and marketing communication a clear view of the subgroups of customers.
INPUT Existing segmentation studies
Industry databases Government statistics
other sources
OUTPUT Buying patterns
Customer descriptions Preliminary customer needs
Preliminary unmet customer needs

Means-‐end value assessment
17
6. Develop Segment Metrics and Fences
This step of developing metrics to understand the value the customers receive and how they pay for it and fences as guidelines customers must follow to receive discounts or rewards, is according to the authors critical. The results should enable the supplier to take premium price from high value segments and allow for example unbundling for low-‐value customers. Fences can be time-‐based membership requirements, minimum volume or bundled purchase requirements etc. This step is less relevant in this study since the Fleet Service that Husqvarna is about to launch will at this first stage be very standardized with a fixed price, which means that these fences and metrics are somehow already developed. It could however be interesting to investigate how metrics and fences can be used for the most important customers when customization can be in question.
As stated earlier, this thesis focuses on customer needs and perceived value and not the supplier’s benefits of selling the service, but the great similarities between the six step process and the concept of value adopted in the thesis makes this model very interesting. Echeverri & Edvardsson (2002) proposes a similar model but with four steps including:
1. Identification of market 2. Identification of differentiating variables 3. Analysis and choice of variables 4. Identification of individual market segments, analysis of their attractiveness and choices
of specific segments.
They propose two groups of differentiating variables, one being customer characteristics (Demographic & socioeconomic, psychographic, geographic), a set of variables that Nagle & Hogan (2006) and Hinterhuber (2008) argue is insufficient and inaccurate. The second group of variables, called customer response, includes benefit, usage, advertising response and loyalty. The variable benefit is the one closest to both Hinterhuber’s (2008) and Nagle & Hogan’s (2006) choices of variables that are customer needs and value. By benefits the authors refers to the potential value the customer expects when purchasing the service. As mentioned before, value is something dynamic that varies among individuals, customers and market segment but Blocker (2002) argues that customer value assessment actually can be standardized across cultural business-‐to-‐business context, which also is the case of this study.

Means-‐end value assessment
18
2.4 Communicating Value -‐ delivering the message “The effective quantification and communication of the value our offering provide to our customers
is the single most critical capability for our commercial team”
(ISBM, Marketing Trends 2010 in Kindström et al., 2009:71)
Nagle and Hogan (2006:72) found that the majority of business managers held communicating value and price as the most important capability to enable their pricing strategies. At the same time, it was found that this skill also was the weakest in the sales force and marketing departments. Hinterhuber (2008) found the communication part the second biggest obstacle for implementing value based pricing strategies. As elaborated upon in earlier sections, one can guess why this is so. It is a daunting task that requires deep understanding of customer value and of how and why customers purchase (Nagle & Hogan, 2006:72). They continue by stressing that value communication can have a great impact on sales and price realization when a product/service creates value that is not obvious to a potential buyer. Additionally, a customer is less likely to appreciate the value of a product if the customer has little experience in a market or in innovative product benefits.
2.4.1 Services demand more sophisticated methods Now that industrial companies are shifting towards including service and relationship based values (i.e. “new values”) in their offerings, being able to communicating them to the customers is becoming a key activity for many companies (Kindström et al., 2009). The traditional values (e.g. cost and price) have been the main focus in the past years. Now a strategy for visualization and communication of these new values, that are less tangible, more dynamic and harder to monetize, is needed.
Nagle and Hogan (2006:79) argues that when the important value drivers are psychological rather than monetary, one should avoid incorporating quantified measures into market communications due to the subjective nature of psychological values. Kindström et al. (2009:74) however states that it is, although not enough, often necessary to monetize the value of a service and mention calculations of cost savings, increases in revenue and value of enhanced productivity as examples of this. Nagle and Hogan (2006:79-‐81) still agrees to some extent by recognizing that you may need to communicate both economic and psychological benefits to customers.
2.4.2 Tangibilization strategies The purpose of a tangibilization strategy is to communicate intangible benefits that don’t have anything to do with the tangible aspects of a service offering (Hill et al., 2004). This is necessary because, as most authors propose, marketers are required to overcome the intangibility of an abstract service offering and to present it in a tangible way. What strategies are there? Many authors (Hill et al, 2004; Kowalkowski & Kindström, 2012; Mittal 2002) refer back to Berry and Clark (1986) and their four tangibilization strategies. The following table explains the main features of these strategies:

Means-‐end value assessment
19
Table 4. Tangibilization strategies
Strategy aims to Visualization convey a vivid mental picture of the offering Documentation provide the customer with hard facts
demonstrating the benefits of the offering Association relate a person, object, event or place to the
offering Physical representation focus on core attributes of the offering. It
relates to a focal or peripheral part of the offering, thus reminding of the association strategy
Hill et al. (2004) acknowledge the logic and practical opportunities of these strategies although they criticize the research of lacking empirical facts that would systematically test the effectiveness of such strategies. However, in Kowalkowski and Kindström’s (2012) later exploratory study, they observe that the five companies studied make use of all of these strategies in the sales and delivery stage of the service life cycle. Important to notice, they conclude that using of one single, product-‐based tangibilization strategy (typically and traditionally documentation) is not enough when introducing and market new service-‐based offerings. Rather, one should attempt the use of several (Kowalkowski and Kindström, 2012:124). Moreover, the need for internal communication is highlighted (Kowalkowski and Kindström, 2012). By internal communication, they mean inside the same company. Not only is it important to get the support and understanding of top management, although this may be an organizational issue at its core (Kindström, Kowalkowski and Nordin, 2009:85), it is also important to include other parties in the extended network e.g. dealers and service partners (Kowalkowski and Kindström, 2012:124) since they are important participants in the total value creation process. Tangibilization again, becomes a potentially powerful way of getting the message across.
It is argued that different tangibilization strategies are required depending upon where in the offering’s life cycle the marketers are acting (Kowalkowski and Kindström, 2012), since the related stakeholders differ. In the sales/delivery stage of the product life cycle, the key stakeholders are the customer purchasing organisation and the customer operational organization, accordingly. Thus, the internal communication is put aside although not completely neglected (Kindström, Kowalkowski and Nordin, 2009:84). Furthermore, some offering specifics have been proposed to influence the need for communication and the tangibilization strategy employed and to what extent (Kindström, Kowalkowski and Nordin, 2009:87). These are:
-‐ The complexity of the offering -‐ Whether the offering is radically new to the market or an incremental change -‐ The degree to which the offering matches the customer’s business and process -‐ The degree of intangibility of the offering
Exactly at what stages and by which tangibilization strategy one should act towards third parties (e.g. service dealers) is not clearly investigated to our knowledge. As of this moment, we recognize this constraint.

Means-‐end value assessment
20
2.4.3 What concrete tools can be used? The literature suggests usage of several different tools in order to come across with the value message. Depending on the stage in the life cycle of the offering (Kindström & Kowalkowski, 2009) different tools will be more appropriate (Kowalkowski & Kindström, 2012:125). For this study, the two later stages, Sales and Delivery will be of particular interest, although we acknowledge that companies continuously have to go through all stages and not be complacent after completing one iteration (Kindström & Kowalkowski, 2009). The tools or techniques presented below are examples from the industry and can be considered when presenting a value proposition in the sales/delivery stage.
Table 5. Reworked from Kowalkowski and Kindström (2012)
Stage Technique/tool ...Sales pre-‐sales pre-‐contractual negotiation and contract
Customer case studies, reference sites/customers (i.e. “the good example”), business case, value calculators (spreadsheets), movies, role play
Delivery delivery post-‐delivery
Reports, follow-‐up meetings, statistics, news letters, stickers
In brief, the methods used are most often rather traditional with a focus on the monetary reasons through efficiency focused parameters (Kowalkowski & Kindström, 2012). They can be more or less complex although the more complex ones (e.g. spreadsheets) tend to be difficult to grasp. Contrarily, findings point towards the using of simplified visualizations and “dashboard”-‐like presentations where the data amount is kept low (see “Resonating focus” in the next chapter). One company exemplifies the simplicity of how a post-‐delivery visualization can take place, using stickers to remind customers of the value that they deliver.
Documented Solutions, a sales tool developed and used globally by SKF, helps their salespeople to identify and explain to customers how much they can save using the company’s service (Reinhartz and Ulaga, 2008). This tool allows for comparisons between SKF best practice customers and it gives the customers the opportunity of calculating their ROI. This is one example of a tool that enables documentation and communication of service derived value. Reinhartz and Ulaga (2008) also mention case studies and white papers as examples of communication tools.
2.4.4 Value propositions -‐ what values to emphasize Vargo and Lusch (2004) proposed in the most cited article within the field of marketing during the last decade that companies can only make value propositions. Extending the works of Gummesson and Grönroos who stated that value can only be created through the customer’s value creating processes, they argue that it is indeed the customer who determines value.
Anderson et al (2006) have identified three ways in which managers use the term value proposition. This is very much in accordance with the three levels of sophistication that Hinterhuber (2008) mentions. First, the “all benefits” customer value proposition (Anderson et al., 2006). This simply means listing all the benefits that a customer would get from a supplier’s offering without making any distinction between what is unique for their company and what is common ground when comparing with competitors. Hinterhuber (2008) calls this

Means-‐end value assessment
21
communicating product features and highlights the issue that customers often don’t care about product features.
Second, the “favourable points of difference” proposition that recognizes that the customer has alternative suppliers and focus its presentation on informing the customer on what are the points of differences compared to the next best alternative on the market (Anderson et al., 2006). The supplier must in this case be well informed about the next best alternative. Hinterhuber (2008) refers to this more sophisticated level of abstraction as ‘customer benefits’. The problem is that suppliers often don’t know which benefits that matter.
Third, the most preferable according to the authors (Anderson et al., 2006) is called “resonating focus”. In this proposition one must have good insight into the customers’ activities because it picks out the one or two points of difference that has the greatest impact on the customer’s value creating processes. It acknowledges the fact that purchasers have limited time and great responsibility. A “point of parity”, an element matching the next best alternative, may be added to the proposition in case the customer has requirements that have to be satisfied for the supplier to be even considered. Hinterhuber (2008) calls this “communicating benefits in accordance with customer needs”.
Figure 8. Illustration of which values to emphasise

Means-‐end value assessment
22
3 Husqvarna The aim of this chapter is to give the reader general overview of Husqvarna as a company, its history, market, competitors and more. The second part of the chapter gives a detailed description of the Fleet Services, both the technical and business aspects of it. Remarque: All of the information in this chapter comes from annual reports, Husqvarna Group’s website and employees at Husqvarna.
3.1 Husqvarna -‐ the company Husqvarna Group is the world’s largest producer of outdoor power products with a net sale of 31 billion SEK in 2012. The group has more than 15 000 employees in over 40 countries and their products are sold via dealers and retailers to both consumers and professional user (businesses, municipalities) in more than 100 countries. The company has a long history starting with the first plant being established in 1689 as a weapon foundry. Through the years Husqvarna has produced and sold a large range of different products including sewing machines, bicycles, motorcycles and kitchen equipment. The product and service offering today is delimitated to outdoor products and divided in six categories: Wheeled, Electric, Handheld, Watering & Hand tools, Accessories and Construction. The Fleet Service program is lead by Håkan Wahlgren who operates under the category Handheld.
The Group’s strategy is based on four strategic pillars including Strong global brands, Competitive product offering, Efficient distribution network and Flexible supply chain.
Vision “We envision a world where people can enjoy well maintained gardens, parks and forests and experience refined buildings and roads.”
Mission ”We provide innovative quality products and solutions to make garden, park and forest care as well as construction easier for professionals and consumers around the world.”
3.1.1 Market & Business The global market on which Husqvarna operates is estimated to approximately 150 billion SEK where Europe and North America represents around 90 % of it. The annual growth rate is 2-‐3 percent per year. There is a strong seasonal variation on the market since park and garden products are mainly used during spring and summer. Because of the seasonal variations and the impact of weather on demand are lead times from order to production short.
This study focuses as stated earlier on the European market, which in 2012 accounted for about 50 % of total Group sales, and more precisely on the French and Swedish market, which accounted for 9 % respectively 7 % of net sales 2012. The Fleet Service is to a start aimed for the handheld products, which also contributes the most to the total net sales on the European market with 30 %.
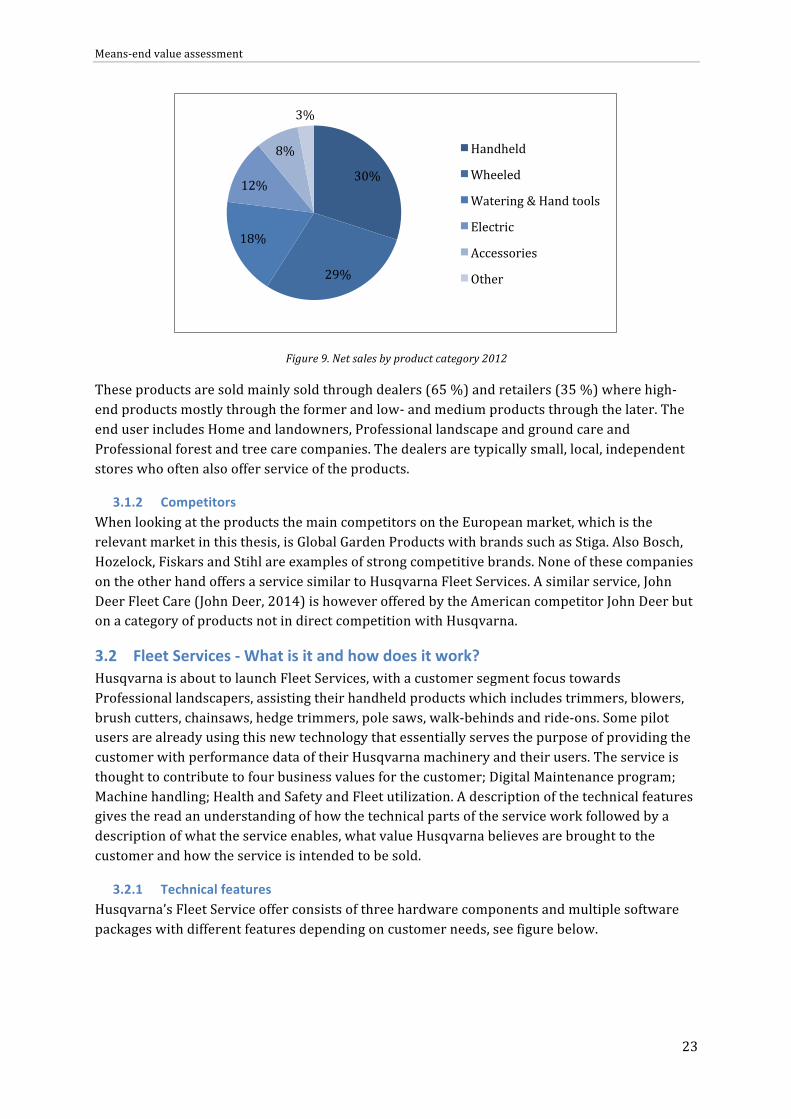
Means-‐end value assessment
23
Figure 9. Net sales by product category 2012
These products are sold mainly sold through dealers (65 %) and retailers (35 %) where high-‐end products mostly through the former and low-‐ and medium products through the later. The end user includes Home and landowners, Professional landscape and ground care and Professional forest and tree care companies. The dealers are typically small, local, independent stores who often also offer service of the products.
3.1.2 Competitors When looking at the products the main competitors on the European market, which is the relevant market in this thesis, is Global Garden Products with brands such as Stiga. Also Bosch, Hozelock, Fiskars and Stihl are examples of strong competitive brands. None of these companies on the other hand offers a service similar to Husqvarna Fleet Services. A similar service, John Deer Fleet Care (John Deer, 2014) is however offered by the American competitor John Deer but on a category of products not in direct competition with Husqvarna.
3.2 Fleet Services -‐ What is it and how does it work? Husqvarna is about to launch Fleet Services, with a customer segment focus towards Professional landscapers, assisting their handheld products which includes trimmers, blowers, brush cutters, chainsaws, hedge trimmers, pole saws, walk-‐behinds and ride-‐ons. Some pilot users are already using this new technology that essentially serves the purpose of providing the customer with performance data of their Husqvarna machinery and their users. The service is thought to contribute to four business values for the customer; Digital Maintenance program; Machine handling; Health and Safety and Fleet utilization. A description of the technical features gives the read an understanding of how the technical parts of the service work followed by a description of what the service enables, what value Husqvarna believes are brought to the customer and how the service is intended to be sold.
3.2.1 Technical features Husqvarna’s Fleet Service offer consists of three hardware components and multiple software packages with different features depending on customer needs, see figure below.
30%
29%
18%
12%
8%
3%
Handheld
Wheeled
Watering & Hand tools
Electric
Accessories
Other

Means-‐end value assessment
24
Figure 10. Overview of the technical components of the Fleet Services
The hardware needed for the system to function includes a machine sensor, an operator tag and one base station. The sensor is mounted to the engine after production and has a battery lifetime of several years. It can store information from several weeks of utilization. The operator tag has to be carried by the operator and is not specific to a certain sensor and can therefore be used by the same operator using different machines. There is a wireless connection between the sensor and the operator tag which enables recording of information such as when, where, how and who uses the machine. The information recorded by the tag and sensor is then transferred to the base station when being within a radius of 20-‐30 meters to the station. The transfer speed is high which means that the transfer of information from a single day work from the sensor to the base station is almost instant. All information transferred to the base station is then transferred via internet through a data service which sorts and analyses the data and make it accessible for the customer on the Fleet management system portal. Before seeing the data on the web portal the first time the customer have to subscribe a license on Husqvarnas website.
Figure 11. System overview Husqvarnas Fleet Services

Means-‐end value assessment
25
3.2.2 The actual beneficial features There are two optional packages of software, one machine specific and one operator specific, available for the customer to buy apart from the Digital Maintenance Book that is included with the hardware. The machine specific software includes Workday log and Machine Handling (see figure below, Remarque: Machine Handling is here called Work technique), which are enabled by the machine sensor. The operator specific software enabled by the operator tag includes Workday log, Machine Handling and Vibration reports.
Figure 12. Web portal subscriptions
All the information retrieved by the sensors can be found on the Fleet Services Web Portal, which consists of the five tabs: Dashboard, Machines, Operators, Library and Subscriptions. The tabs library and subscriptions are available no matter what package the customer chooses and gives access to instructional videos, part lists, owners manual and workshop manual of their products and an overview of their subscriptions with the possibility to ad or remove a service at any time.
The two packages Machine Data and Operator Data can seem similar but gives the customer information of their fleet from a different point of view.
3.2.2.1 Machine Data Subscription The Machine Data Subscription gives the customer an overview of their Fleet from a machine perspective. They can see the productivity and handling of each machine under the tab Machines and of the Fleet as a whole on the Dashboard. It gives access to detailed information about when, for how long and how every machine has been used and when a specific machine has been used. For several machines a comparison between engine time and cutting time is made which shows how efficiently the machine have been used. There is also an interactive service system, which sends an automatic notification 25 hours before the next service should be done on a specific machine.
This and more information can be found for every machine and is presented on the Web Portal as: Summary -‐ overview of the use of the machine; Workday log -‐ when the machine has been used (working and idling); Machine Handling -‐ engine speed over a certain time interval; Maintenance plan and Maintenance history.

Means-‐end value assessment
26
3.2.2.2 Operator Data Subscription The Operator Data Subscription adds several features to the ones listed above. First it gives information about how, when and who used a machine. This can help the customer to make sure that every employee knows how to use the machines correctly, that the engines runs at appropriate speed and that there is a minimizing of the idling time. By making sure that the fleet is used properly the customer can make the work more comfortable and efficient as well as reducing fuel consumption and extend the lifetime of their machines. Another feature that is enabled with this subscription is the Vibration report. This gives the customer information of how much vibration their employees endure due to the handling of the machines. This is according to Husqvarna an important question since many countries have a certain vibration exposure limit and can prevent employees getting injuries. With this subscription the customer has access to a tab called Operators under which the information above can be found under: Summary -‐ overview of the employee; Work day log -‐ the productivity of the operator over a certain time interval; Vibration -‐ the operator’s exposure to vibration and Machine handling -‐ how the operator have used different machines.
3.2.3 What values does it add to the customers? Husqvarna has identified four business values that they think the service provides the customer with.
1. Digital Maintenance program – up-‐time on the equipment 2. Machine handling – Less strain on operator, machine, environment and economy 3. Health and Safety -‐ automated vibration reports 4. Fleet utilization – increase overall fleet efficiency and work planning
These values are thought to be important in the customer’s business and are today the base for the selling arguments for the Fleet Services.
3.2.4 Pricing, sales channel & distribution network As of today the pricing model is not determined but the idea is to sell each Hardware component with a specific fixed market price.
Table 6. Price per subscriptions of the Fleet Service
Subscriptions Price/year Machine data subscription free Worday log + Machine Handling
19,99 €
Worday log + Worktechnique + vibrations resports
19,99 €
Table 7. Price per hardware of the Fleet Service
Component Price Base-‐station 549,00 € Operator tag 59,99 € Sensor tag 89,99 €

Means-‐end value assessment
27
The customers can then choose how many of each sensor they want for their fleet and what subscription they want. As mentioned earlier there are two different subscriptions possible, the Machine Data and the Operator Data, since the Digital Maintenance Book is included with the Hardware.
The distribution channels for the service are going to be mainly through dealers and from Husqvarna Sales. To get started with the service after purchase, the dealer adds the customers’ machines to their management website and provides them with a login. The customer then adds operators and connects the base station to the Internet.

Means-‐end value assessment
28
3.3 Pre-‐study -‐ Workshop with customers, dealers and retailers A pre-‐study of what Husqvarna's customers, some as pilot-‐users of the Fleet Service, thought about the Fleet Services and what impact it has or could have on their business was made during a two day (February 2014) workshop at Husqvarna. The aim of the workshop from the organiser’s, Husqvarna’s, perspective was to strengthen the relation between Husqvarna, the dealers, the retailers and the end customers and to identify unmet needs the customer had today and from there starting to work on the second version of the fleet service. The methodology of interviewing the informants, gathering and analysing the data had not been elaborated before the workshop and the results can hence not be validated, but seems nonetheless relevant to present and take into account when developing the analysis model and the methodology.
Table 8. Pre-‐study of customers’ main business issues and thoughts about the Fleet Services
Nb. of employees
Country Product & Service related business issues/goals
Positive aspects of FS Negative aspects of FS
80 Netherlands Relationship with supplier Improve efficiency
Surveillance of employees -‐ integrity and trust issues A lot of information but is all necessary?
250 US People not working Down-‐time
Monitoring employees Data on up-‐time
A great mix of brands in the fleet
10 Sweden Seasonal variance Down-‐time Goals: Happy employees & customers, smooth operations
A good step towards helping the customer in his working process
The size of the fleet is small and does not require this type of monitoring Price
5 France Seasonal variance
Down-‐time Machine maintenance
Maintenance program Monitoring of machines
Price Too bureaucratic for a small company
? Sweden Down-‐time Safety & ergonomics
Preventive maintenance
This first value assessment screening did give some support to Husqvarna’s proposed model of business values that the Fleet Services gives. As seen in table 8 were all four business values (Health & Safety, Machine Handling, Fleet Utilization and Maintenance program) mentioned by at least one customer. Another interesting observation is that the smaller companies (up to 10 employees) were positive to the FS but that there was no need for that kind of monitoring of the fleet because of the small size of their business. The smaller companies also mentioned the price to be too high, something the two bigger customers did not. There seemed to be great

Means-‐end value assessment
29
differences of especially the feature of monitoring the operator depending on the customers’ personal values and country of origin. The overall issue or goal was nonetheless the same for almost every customer and that was to reduce downtime in order to be more productive and efficient.
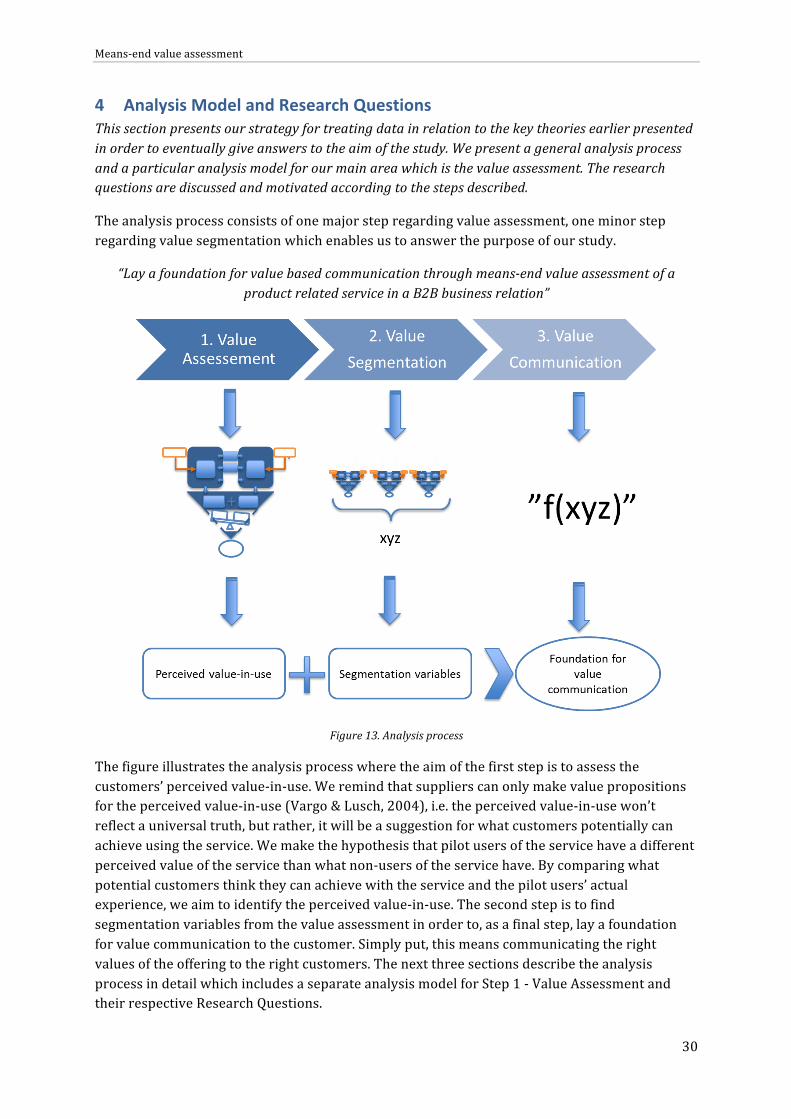
Means-‐end value assessment
30
4 Analysis Model and Research Questions This section presents our strategy for treating data in relation to the key theories earlier presented in order to eventually give answers to the aim of the study. We present a general analysis process and a particular analysis model for our main area which is the value assessment. The research questions are discussed and motivated according to the steps described.
The analysis process consists of one major step regarding value assessment, one minor step regarding value segmentation which enables us to answer the purpose of our study.
“Lay a foundation for value based communication through means-‐end value assessment of a product related service in a B2B business relation”
Figure 13. Analysis process
The figure illustrates the analysis process where the aim of the first step is to assess the customers’ perceived value-‐in-‐use. We remind that suppliers can only make value propositions for the perceived value-‐in-‐use (Vargo & Lusch, 2004), i.e. the perceived value-‐in-‐use won’t reflect a universal truth, but rather, it will be a suggestion for what customers potentially can achieve using the service. We make the hypothesis that pilot users of the service have a different perceived value of the service than what non-‐users of the service have. By comparing what potential customers think they can achieve with the service and the pilot users’ actual experience, we aim to identify the perceived value-‐in-‐use. The second step is to find segmentation variables from the value assessment in order to, as a final step, lay a foundation for value communication to the customer. Simply put, this means communicating the right values of the offering to the right customers. The next three sections describe the analysis process in detail which includes a separate analysis model for Step 1 -‐ Value Assessment and their respective Research Questions.

Means-‐end value assessment
31
1. Value Assessment -‐ How do the customers perceive the value of the service?
The analysis model is found at the end of this sub-‐chapter.
We assume Woodruff’s (1998) value hierarchy in order to obtain a deeper understanding of how the customer business is affected by the service. This motivates our main question regarding value assessment seen above. Reminding the reader that this operational model states that value is created when service attributes form desired consequences in use that help companies realize their goals, we start by applying these levels on customer business. We argue that this will reflect the actual value, i.e. the value-‐in-‐use. Quite naturally, this becomes a first research question for our value assessment part. The wording as compared to the value hierarchy will be discussed in 5.5 Methodology.
RQ1 -‐ How is value-‐in-‐use of the service enabled in the customers’ business? Op1) What are the desired service features? Op2) What are the desired consequences in use? Op3) What are the desired goals? In order to distinguish customer satisfaction from customer value there is a need to identify a reference product (Hinterhuber 2004; Nagle & Hogan 1998; Ulaga & Chacour, 2001). This means there is a need to fully understand what the service has enabled (A) as compared to how the customers solve their problems today, without the service (B). By comparing the perception of value-‐in-‐use between pilot users and non-‐users, the aim is both to identify the reference product and to find needs that potentially can be resolved using the service which will be validated or not by pilot-‐users. Moreover, this will potentially give rise to new elements that only have been recognized by pilot users. The model therefore starts by distinguishing customers who today use the service and customers who today use other processes/services (reference product or next best alternative) to achieving the same goals. In theory, the net difference between these will be the differentiation value. Given that this service is radically new to the market, we recognize that the explicit identification of a reference product will be difficult, although this is a critical step in the value assessment process according to the authors mentioned above. There is thus no explicit research question related to this.
Again, we take on an “in-‐use view of value” to try to give answer to the aim of the thesis. Value-‐in-‐use is something that logically cannot be communicated, but must be experienced. We however aim to develop a foundation for a value communication as tangible as possible. Many authors (Anderson & Narus, 1998; Hinterhuber, 2004; Nagle & Hogan, 2006; Ulaga & Chacour, 2001) argue for an estimate in monetary terms of the product or service that is studied. The objective of the fourth question is therefore to investigate whether it is possible or not to quantify the value of the service, something that could potentially make the communication easier:
Op4) Can the value-‐in-‐use of the service be quantified in economic and non-‐economic terms? which is illustrated in the bottom of the funnel. We see this as a step towards estimating the potentials of the service in a way to make the communication of the value-‐in-‐use more tangible.
We argue that we will be able to relate to value drivers seen in literature by analysing the findings from customers’ (pilot-‐users and non-‐users) value hierarchies. As many authors state

Means-‐end value assessment
32
(e.g. Ravald and Grönroos, 1996; Ulaga & Chacour, 2001) the drivers can be categorised as benefits and sacrifices which is highlighted in the analysis model. This provides us with a second research question:
RQ2 -‐ How can the customer perceived value of the service be expressed in terms of benefits and sacrifices (value drivers)? Op5) How are the benefits perceived? Op6) How are the sacrifices perceived?
We will try to relate all identified benefits and sacrifices to Lapierre’s (2000) categories of value, i.e. product, service and relationship and to Ulaga & Eggert’s (2006) value sources, i.e. customer operations, core offering and sourcing process. Moreover, we choose to compare with Lapierre’s (2000) value drivers because they derive from the IT industry, in which HFS in part can be said to operate.
Figure 14. Analysis model for value assessment
The value assessment is critical for the next step in the analysis process, which is to identify possible segments of customers that perceive the service in different ways and have different needs that correspond to different service features.
2. Value Segmentation -‐ Why, if so, do customers value the service in different ways?
Possible segmentation variables, “xyz”, are going to be identified among the value drivers and customer characteristics found in the value assessment. The process to find these drivers or characteristics is going to be a slim downed and remodelled process of Nagle and Hogan’s (2006)

Means-‐end value assessment
33
value based segmentation where the idea is to understand what drives the customers and thus finding segments with the same needs. If such variables exist, segments of customer who are most likely to embrace the value proposition can be identified. An understanding of what type of customer to address with what value proposition is the aim of this part of the analysis. This second area of concern in the analysis process is addressed by one major research question.
RQ3) -‐ Are there any variables that could help to segment customers when communicating a value proposition?
3. Value Communication
Customers with different value drivers and characteristics have to, according to the resonating focus, be addressed in different ways when communicating the potential value of the service. This leads to the final and most critical step (Hinterhuber, 2003) of communicating the value proposition to the customer. In our case, it means developing a foundation for value communication for different customer segments, based on their needs and situation. The foundation will be a function of the value-‐in-‐use from the assessment and the segmentation variables xyz and demographic variables regarding the customer’s business. Since it refers directly to the aim of the study, this process step has no research questions. It will be handled separately when concluding on the study.

Means-‐end value assessment
34
5 Methodology This chapter will present the methods used to find the relevant information and how our work process has been. This includes the relevant theories presented earlier as well as the procedure of extracting the correct empirical data to analyse in order to respond to the research question and thereby the overall purpose of the study.
5.1 Work process First of all a general structure for how to conduct the marketing research, from the problem background to final conclusions and recommendation, was needed. Because of its clarity and the authors’ previous experience working with it, Lekvall & Wahlbin’s (2001) U-‐model was used as a starting point and was remodelled to fit the work process of the study. Also Merkel’s et al (2011) and Grundström’s (2013) guides on how to write a report were used as guidelines.
Figure 15. Illustration of the remodelled U-‐model
The illustration of the remodelled U-‐model seen above gives a clear view and understanding of each step of the study. The left side illustrates the preliminary tasks to be done before the field study, which is represented as the “middle/bottom” of the U-‐model. The process of our study did however not follow the linear process of the traditional U-‐model but was rather an iterative process where each step was reconsidered during the whole study, as illustrated by the transparent arrow going from “presentation” to “identifying the case company and a first problem description”. We however used the model as a guideline and a tool to visualise what needed to be done in order to reach our conclusions. The next sections explain, following the process in a chronological order, how the study was done and what iterations of steps were made.

Means-‐end value assessment
35
Identifying the case company and a first problem description The very first step of our study began with the contact with examiner Daniel Kindström who already was in collaboration with the case company. The problem background, general description, the context and aim of the study were discussed. This was followed by a few Skype/telephone calls and meetings with representatives from Husqvarna (Håkan Wahlgren & Sören Josefsson) and the Linköping University (Per Carlborg & Daniel Kindström) to plan the study to come.
Breakdown of the problem and aim of the study A first meeting with the representatives at Husqvarna in Husqvarna gave the authors a deeper understanding of the problem. The expectations from the case company chosen, Husqvarna, were set and a discussion of what areas of concerns were to address was conducted. After this first description of the problem, an attempt to break it down in order to formulate the aim of the study was made. This description and aim of the thesis was discussed back and forth with both the supervisors from the university and from Husqvarna before agreeing on a relevant and feasible scope. The aim of the thesis was however changed several times after the field study due to unexpected findings.
A first review of literature was conducted in parallel to this initial step to frame the objective of the study.
Pre study A pre study in form of a two-‐day workshop was carried out at Husqvarna about two weeks after the start of the project. Because of the authors’ little knowledge of the problem at the time, no formal interviews were conducted but notes were taken and the workshop gave a valuable insight to the context. There were about 30-‐40 people representing Husqvarna Sales, Husqvarna Fleet Service, customers from all over the world, dealers and many more.
Theoretical framework The next big step in the study was to find relevant literature for the theoretical framework that was going to help approach the problem and analyze the data to come.
Starting from the problem background, discussions with tutors and employees at Husqvarna, were conducted in order to get a better picture of what knowledge was needed to fulfil the aim of the study. This was combined with preliminary screening of literature regarding customer value; value-‐based pricing, service management and industrial sales management founded the base of the literature search for the theoretical framework. The articles were read and reviewed in case they seemed relevant were those articles also reviewed. It was clear that a definition of customer value in the right context was needed in order to find coherent theories. After defining the concept of value, the deliverables set by Husqvarna helped to identify three major areas of concerns: Customer Value Assessment; Value Communication and Customer Segmentation. In order to gather the right information of these topics discussions with tutors took place regarding relevant literature to read. Furthermore were other recent published Master Thesis on a similar topic reviewed and article and books were read to find relevant information and references. The literature search was conducted mainly through Linköpings University’s database portal UniSearch including Emerald and ScienceDirect, Linköpings University's library, Google Scholars and the course websites of Linköping University’s courses Service Development Management and Industrial Sales Management. The main words for searching for relevant literature was

Means-‐end value assessment
36
Customer Value, Value based pricing, Value Assessment, Value Communication, Value Segmentation, Value driver, Selling services and Product related services. The major problem when searching for relevant literature was to find theories that have been tried out in practice since the aim of the thesis is relatively “hands-‐on”. Many studies have been done on customer value regarding products whereas customer value studies on services have been done to a smaller extent. However, this field of study has grown in interest in the past years but a lot of the literature is on an aggregated level. To withhold a high level of the framework, a focus on known and well-‐cited authors with recently published work was made. As stated in the theoretical framework there are many different views and interpretations of this field of study but despite this, many similarities between them can be found, which enabled a good theoretical understanding and background to construct our own analysis model.
The theoretical framework was adjusted and supplemented throughout the rest of the study process since the aim of the study and the research question were slightly changed.
Analysis Model and research questions The analysis model and research questions were elaborated with the pre study and theoretical framework in mind. The first model was approved by the university tutors but not by the Husqvarna tutors. Several iterations of the analysis process and model (Appendix IV) were needed before reaching an agreement. The research questions were preliminarily set before our choice of approach but continuously reconsidered and rewritten during the entire process.
Choice of approach Our approach to the concept of customer value was that it cannot be measured or quantified to 100%. The concept of value is a philosophical question and we agreed on approaching the problem from the point of view that value is subjective and not perceived the same by every part. We also believed that the same person depending on the circumstances could interpret value in different ways. This mind-‐set was probably due to our personal experiences and knowledge but a difficult thing to accept since we as engineers like to be able to quantify things. We recognized our approach to be similar to what Arbnor & Bjerke (2009) refers to as a system view approach. The system view is a methodological view of addressing an area of research. It is characterized by the fact that the sum of individual components of the system can be inferior to the value of the entire system. When having a system approach the researcher looks at reality as both objective facts and as subjective structures. The idea of it is that the studied area, here customer value, only can be understood in its context. The prerequisites of the system view were met since there were existing theories on the subject. The aim was to understand and explain customer value regarding the Fleet Service, a goal that is coherent with Arbnor & Bjerke’s (2009) system view. The result of the system view approach should be some typical cases in the studied area, in this case typical customers, with general classification mechanisms for different kind of cases, which is coherent with the result of this study.
Our view of the approach differed somewhat with the representatives from Husqvarna who had an analytical view of the problem and wanted to measure and quantify the information. After a meeting in Husqvarna where we discussed the deliverable with the tutors from Husqvarna, we finally agreed on how to look at the problem. We went through an excel sheet with preliminary profit and loss statements regarding the potential value the service could bring and agreed on including those statements in our field study.
Means-‐end value assessment
37
Tactics for gathering and analyzing data After discussions with the Husqvarna tutors we agreed on focusing the field study on the French market. The tactics for gathering and analyzing data through in-‐depth interviews and the laddering method (see 5.5 Laddering) were then set. A contact with Husqvarna representatives in France was made and after some discussion back and forth we agreed on the interviews to be done. The interview guideline was then elaborated with the analysis model, theoretical framework and Husqvarna deliverables in mind.
Test interview A first interview with a customer and a dealer was conducted in Sweden in order to test our tactics for gathering and analyzing data. The results were positive and only minor changes in the interview guide were made.
Field study The field study with all interviews was conducted during one week in France. In total were seven customers interviewed. The methods of collecting data, interview and analysis technique and the quality measurement are described in later sections of this chapter.
Treating the data and obtaining results All interviews were recorded and the analysis of the data followed our tactics of data interpretation.
Analysis and quality evaluation of raw data All recorded interviews were listened to between 2-‐5 times in order to increase the reliability of the interpretations of the customers’ answers. The authors listened to each interview alone, wrote done the answers to the questions and then compared the answers. If the authors’ interpretation of the customers’ answers were not coherent, the interview was re-‐listened too, one or several times.
Analysing and interpreting the results The findings from the field study put the aim of the study and the research questions under considerations. After some minor changes, the analysis process followed our tactics of analysis. By relating the results to theory and with our knowledge of the problem and context, we were able to structure the analysis in accordance with our analysis model. The theoretical framework was adjusted to cover the relevant information needed to conduct the analysis.
Conclusion & Discussion The conclusions and discussions of the study were difficult to structure and some work had to be done regarding what actually had been done and discovered throughout the study. We also attended an unplanned workshop in Amsterdam with the topic “value realisation process”. The participants came from all over the world and included dealers, customers (pilot and non-‐pilot users of the service), Husqvarna sales and more. During the workshop we presented are findings so far and were able to ventilate our ideas and validate some of our findings. This was of great help in order to structure the conclusions and discussions of our study.

Means-‐end value assessment
38
5.2 Justification of the case study approach With the purpose of laying a foundation for value communication in the specific context of the thesis in mind, we choose, as recommended by Arbnor & Bjerke (2009), a technique of case studies to address the problem. An approach Lekvall & Wahlbin (2001) refers to as a qualitative case study approach and furthermore argues is a good approach when assessing the buying process of a small number of customers. They also argue that this type of approach is adequate when explaining and understanding a problem. Eisenhardt & Graebner (2007) stresses the importance to not confuse qualitative study with qualitative data and we therefore follow their advice and rather explain the research strategy then using the term qualitative study or data. Also they propose a case study when there is a need to build theory on the problem studied. Case studies have been questioned mainly because of their lack of generalizability (Dubois & Gadde, 2002). Early authors (e.g. Cronbach and Campbell) rather saw the potential; since many psychological findings are unstable over time one should try to make interpretations more situations specific (Weick, 1979). This, of course, will affect the degree to which we can generalize the results. A generalization of the results is however not the focus, it is rather finding the relevant strategy for value communication, something that can be thought to be more generalizable then the actual results (the perceive value-‐in-‐use). Dubois and Gadde (2002) conclude that “the interaction between a phenomenon and its context is best understood through in-‐depth case studies” and thus learning from a particular case should be considered as a strength. Yin (2009) argues that a case study research is appropriate when the research questions are posed as “why” or “how” questions. Moreover, two conditions that need to be supported are that (1) the research questions concern a contemporary set of events (2) the investigators have little or no control over the research questions. In this study, we appreciated that the research questions concern contemporary events over which we little control, which motivates our choice of research approach.
To summarize, since the core of the study was the complex task of assessing customer perceived value-‐in-‐use in relation to Husqvarna Fleet Service (which ultimately affects Husqvarna’s selling strategies), an explanatory multiple case study approach was adopted.
5.3 Motivation of selection of cases As Eisenhardt & Graebner (2007) propose when having the need of developing theories and in the same time generalising the results to some extent we took a multiple case study approach. It is important to clarify that the purpose was to lay a foundation for communication and not test and validate communication frameworks, in which case a more quantitative approach with random samplings would have been appropriate (Eisenhardt & Graebner 2007). Instead we did, as Eisenhardt & Graebner (2007) argues for, take a theoretical sampling of cases with the aim of finding similarities, replication logic, and points of difference between cases and hence be able to some extent generalize the theory to a larger population (Yin, 2009). Eisenhardt & Graebner (2007) refers to an extreme version of this as “Polar types”, where the aim is to clearly identify contrasting patterns in the findings.
First, a supplier matching our interest of the problem background description had to be found. We came across Husqvarna thanks to Daniel Kindström and the case was fit perfectly into the problematic of a product-‐oriented company that was about to commercialise a product related service to expand their offer. It is however not the case company that should be in focus but rather its customer since it is their perceived value that has to be communicated. The company

Means-‐end value assessment
39
chosen as supplier of a service is Husqvarna Group, one of the world’s largest producers of outdoor power products (Husqvarna 2014). They are about to launch a new fleet service program comprising a set of services to their commercial customers (B2B). A key factor for the success of the launching will, according to Husqvarna and as earlier discussed, be the degree to which the sales force can present the values created from these services in an accurate way. These values are thought to be tangible and intangible, the latter harder to quantify. Historically Husqvarna has used more traditional selling arguments but now wants to move towards a value-‐based model in order to sell the Fleet Services.
As discussed in the chapter regarding Husqvarna, the sales process of the Fleet Services includes several parties, see figure below. The focus of the thesis is the customers.
Figure 16. Illustration of the sales process network
We studied 4 pilot-‐users of the Fleet Service and 4 non-‐pilot users of different sizes (Appendix III) since the pre-‐study indicated that the customer’s size could affect the perceived value of the service. The pre-‐study revealed that larger companies seemed to have a greater focus on control of their fleet and employees and an overall more sophisticated approach to their business and therefore also more willing to adopt the service. The smaller companies on the other hand demanded more practical solutions and were more price-‐sensitive than the larger ones and were overall sceptic to the service as it is priced and formed today. Because of the authors’ language skills, Husqvarna requested a focus on the French customers.
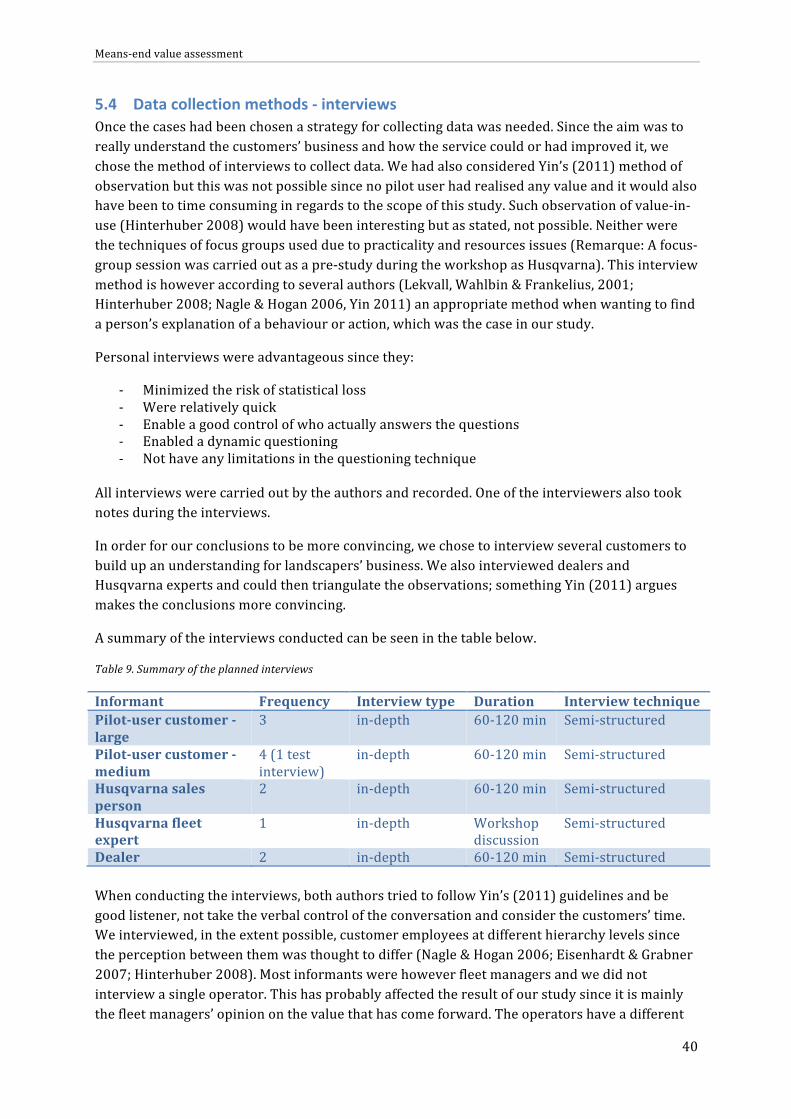
Means-‐end value assessment
40
5.4 Data collection methods -‐ interviews Once the cases had been chosen a strategy for collecting data was needed. Since the aim was to really understand the customers’ business and how the service could or had improved it, we chose the method of interviews to collect data. We had also considered Yin’s (2011) method of observation but this was not possible since no pilot user had realised any value and it would also have been to time consuming in regards to the scope of this study. Such observation of value-‐in-‐use (Hinterhuber 2008) would have been interesting but as stated, not possible. Neither were the techniques of focus groups used due to practicality and resources issues (Remarque: A focus-‐group session was carried out as a pre-‐study during the workshop as Husqvarna). This interview method is however according to several authors (Lekvall, Wahlbin & Frankelius, 2001; Hinterhuber 2008; Nagle & Hogan 2006, Yin 2011) an appropriate method when wanting to find a person’s explanation of a behaviour or action, which was the case in our study.
Personal interviews were advantageous since they:
-‐ Minimized the risk of statistical loss -‐ Were relatively quick -‐ Enable a good control of who actually answers the questions -‐ Enabled a dynamic questioning -‐ Not have any limitations in the questioning technique
All interviews were carried out by the authors and recorded. One of the interviewers also took notes during the interviews.
In order for our conclusions to be more convincing, we chose to interview several customers to build up an understanding for landscapers’ business. We also interviewed dealers and Husqvarna experts and could then triangulate the observations; something Yin (2011) argues makes the conclusions more convincing.
A summary of the interviews conducted can be seen in the table below.
Table 9. Summary of the planned interviews
Informant Frequency Interview type Duration Interview technique Pilot-‐user customer -‐ large
3 in-‐depth 60-‐120 min Semi-‐structured
Pilot-‐user customer -‐ medium
4 (1 test interview)
in-‐depth 60-‐120 min Semi-‐structured
Husqvarna sales person
2 in-‐depth 60-‐120 min Semi-‐structured
Husqvarna fleet expert
1
in-‐depth Workshop discussion
Semi-‐structured
Dealer 2 in-‐depth 60-‐120 min Semi-‐structured When conducting the interviews, both authors tried to follow Yin’s (2011) guidelines and be good listener, not take the verbal control of the conversation and consider the customers’ time. We interviewed, in the extent possible, customer employees at different hierarchy levels since the perception between them was thought to differ (Nagle & Hogan 2006; Eisenhardt & Grabner 2007; Hinterhuber 2008). Most informants were however fleet managers and we did not interview a single operator. This has probably affected the result of our study since it is mainly the fleet managers’ opinion on the value that has come forward. The operators have a different

Means-‐end value assessment
41
role and thus are thought to have a different view of the value-‐in-‐use of the service, something that would be interesting to investigate in future research. The interviews with the customers however showed that the operators rarely had any saying in the purchasing decisions, which diminish the impact on the aim of this study.
5.4.1 Structure of the interviews The interviews all followed the same structure but differed depending on the customer’s time availability and knowledge of the service. Here follows the normal procedure for all interviews with customers and dealers:
1. Presentation of ourselves and of the Husqvarna Sales person accompanying us. 2. Introduction to the aim of our visit and some discussion between the Husqvarna sales
representative and the customer. 3. General questions about the customer (30 min) 4. Power Point presentation of the aim of our study and the Fleet Service. (10 min) 5. Specific questions about the fleet services according to the laddering technique (see
Appendix VI). (30-‐ 60 min) 6. Overall discussion and answering of questions. 7. Ending words and goodbye.
5.4.2 Interviews conducted to gain knowledge of the business context Before conducting the interviews with the customers, interviews with Husqvarna employees and dealers were carried out during the workshop in Husqvarna to assess their perception of what customers values in relation to the Fleet Service, something many scholars argue for is relevant (Hinterhuber 2008; Nagle & Hogan 2006; Anderson & Narus 1998). These interviews helped to prepare for the more important interviews with the customers.
Fleet Service expert During the entire project we had a close dialogue with Håkan Wahlgren and Sören Josefsson, the first being responsible for the Fleet Service project at Husqvarna. Their thoughts on what value the service could bring to the customers did affect our perception and hypothesis but these were reconsidered after having conducted the interviews with the customers. We then saw that there was a gap between the customers’ and Husqvarna’s perception of the value of the service.
Husqvarna sales 2 Husqvarna sales representatives were interviewed during the field work in France. Even though the main focus was to develop a foundation for value communication for the retailers and dealers it is important that this knowledge can be transferred from the sales team at Husqvarna since they will probably have a key role in the business model. The interviews with Husqvarna sales were therefore important in order gain knowledge of the business context. The sales team is especially interesting from an organizational perspective; an area the study is not focusing on, but those interviews seemed relevant to put the authors in understanding of Husqvarna business.
Dealers 2 interviews with two dealers were conducted. These interviews with dealers seemed to be appropriate to gain a better understanding of the selling process. The interaction between the dealer and customer is critical when it comes to the study’s aim on how to communicate the

Means-‐end value assessment
42
value of the offer. It is therefore important to know under which circumstances this selling-‐buying process takes place, how the dealer works, what relationship there normally is between dealer and end customer etc. Since the dealer is closest to the customer, he/she probably has a great knowledge about what the customers’ value drivers are when it comes to the purchasing process.
5.5 Laddering This section deals with an interview technique referred to as “laddering”, described by Reynolds and Gutman (1988), which has been employed during all customer interviews. The idea is to find linkages between key perceptual elements that exist in three different levels of abstraction; (A) attributes, (C) consequences and (V) values. A combination of elements that span over the three levels is called a “ladder”. One easy example will help illustrate this:
Figure 17. An association network or “ladder” from one respondent in a salty-‐snack study
The example shows just one part of the data collection from a single respondent. We argue that thanks to the laddering technique we could make the respondents think critically about the service.
5.5.1 Building the individual ladders – an interview technique We put the service’s various information components, “service features”, at the lowest level of abstraction and asked the customers how they thought they could be used in their business, i.e. what benefits or consequences in use they saw. More precisely, the service features correspond to the various information parts that the service offers. They are further categorised into the different types of subscriptions that Husqvarna has set up. Some proposed consequences had been developed during the pre-‐study which were either confirmed or denied by the customers. If a consequence was mentioned, we continued by asking if this could stimulate a goal in the customer’s business. If so, a complete ladder, from feature to goal was subsequently made. In some cases, we could not make a complete ladder in which case the ladder stopped on a consequence level.
Means-‐end value assessment
43
In order to get to a more aggregated level, the next step was to summarize key elements from many respondents. This was done with standard content-‐analysis procedures. Then the connections between elements were assigned a number corresponding to the frequencies at which they were mentioned. Eventually, a hierarchical value map (HVM) was formed. The next section will describe this process more in detail.
5.5.2 Analysing the ladders Elaborating on the laddering interview technique, Reynold and Gutman (1988) present an analysis technique that serves the ultimate purpose of being able to draw an HVM. This was done in three major steps (ABC).
A. Content analysis
1. Record the entire set of ladders across respondents on a separate coding form. Taking all the ladders and screening them for completeness was followed by developing a set of content codes that enabled to code “everything” that was said. Initially this was done by categorizing the responses into the three levels of abstraction mentioned earlier (features/consequences/goals). The highest level was changed into “goals” because of the possible mix-‐up with the term “value”. Responses that looked similar would thus sometimes have to be merged into one category. Emphasis was put on the purpose of the study and the research questions as well as on the linkages between the elements rather than on the elements themselves. This left us with a manageable amount of content codes.
2. Produce a matrix with raw data. The next step was to summarize all responses into one single matrix. Each row represents one single subject’s ladder and is composed by a sequence of content codes. Each column represents a ladder position at which the respondents have given a certain element (A/C/V) and is thus composed by all the possible content codes that have been mentioned at that particular level.
This is in line with Kvale et al. (2009) who suggest content analysis as a means to systematically quantify the manifest content of communication. Through categorization, which is also seen in Reynold and Gutman’s (1988) technique, we could reduce large interview texts into a few tables and figures. Kvale (2009) argues that if the codes and categories are to be developed in retrospect of the interview it is important to obtain rich description of the phenomena seeked.
B. Implication matrix
3. Constructing a matrix displaying the number of times each element precede all others. The idea here was to get an aggregate visualization of the relations between the elements. Some considerations were made. There were direct (A-‐>B-‐>C) as well as indirect relations (A-‐>C) between elements. The indirect relations might be as meaningful as the direct because if neglected, one risk to lose significant paths. It is thus useful to take them into account. Another decision we as researchers should make is whether to count one individual’s repeated implications as just one or as many. Since the significance of an element in part is a function of numbers of connections to other element, this vouches for a separate handling of repetition. On the other hand, it distorts the HVM because seemingly there are few connections between elements in the overall matrix (Kvale and Brinkemann, 1988). We chose to count both direct and indirect relations and to include repetition if and only if the subsequent relation differed from

Means-‐end value assessment
44
the other. For example, we counted A-‐>B twice if there was a respondent claiming both A-‐>B-‐>C and A-‐>B-‐>D.
C. Constructing the hierarchical value map
4. Building chains by linking adjacent elements to each other. Example: If A-‐>B and B-‐>C, then A-‐>B-‐>C even if there is no such relation seen in an individual’s ladder. There were some considerations to make before finalizing the HVM. In order to avoid crossing links, we had to use cut-‐off levels. We set the first cut-‐off level at 3 (represented by solid lines, see 6.1.5) leaving us with a number of consequences connecting either to a lower abstraction level or a higher one. We then set a second cut-‐off level at 2 (represented by dotted lines) allowing for a better completeness of the map. Still, we were left off with two consequences (‘Individualized machine training’ and ‘Know-‐how of machine handling’) that did not complete a full chain.
5.5.3 Criticism towards the laddering method Although the paper is discussing from a consumer perspective (i.e. B2C industry) and our study concerns the commercial branch of Husqvarna, we find this method appealing since it seems consistent with the value hierarchy model (Woodruff, 1997). Moreover, the technique proposed by Reynold and Gutman (1988) focuses on product attributes, even if they don’t entirely exclude services, at the lowest level of abstraction while our study focus mainly on services. The consequence may be that we have to twist the language a bit in order to deliver the message. Product attributes are, as mentioned earlier, more tangible than service attributes, which gives rise to this issue.
5.6 van Westendorp In order to quantify the value driver sacrifice Price in monetary terms we used the van Westendorp Price Sensitivity Model. There are according to Lipovetsky et al. (2011) several methods including Gabor-‐Grange, Discrete Choice analysis and Advanced Choice Models to evaluate the customers’ willingness to pay or pricing strategy. We chose the van Westendorp method because of its ease of use in practical marketing research. Hintherhuber (2008) also presents Conjoint Analysis as a good Discrete Choice analysis to evaluate the customers’ perception of value of a service or product. This method was however not chosen because of its complexity and time requirement. The van Westendorp Price Sensivity Model seemed adequate since the focus of the thesis is not to find out the customers’ willingness to pay, this was only a way of getting an idea of the customers’ view of price as a sacrifice.
Four questions were asked to each customer:
1. Too Cheap―at what price does this product become so cheap that you would question its quality?
2. Cheap―at what price does this product start to seem like a bargain? 3. Expensive―at what price does this product start to seem expensive? 4. Too Expensive―at what price does this product become too expensive, so that you would
not consider buying it?
For each of the questions the cumulative frequencies were plotted against the current price on the same graph with the graphs Too expensive and Too cheap plotted in the reversed direction.
A range of criticism can be address to this method:

Means-‐end value assessment
45
• Potential customers have never tried the HFS and therefore not know what value it would actually bring to them which probably affected their answers to the van Westendorp questions.
• The question of how low the price of the service can be without being too cheap was sometimes not understood by the customers (some wanted it for free).
• There is no statistical proof of the range the customers are willing to pay for the service since the small number of respondents.
5.7 Quality measurements
5.7.1 Validity The validity will be discussed using Joseph Mawell’s seven strategies (Yin, 2013:84-‐87) to avoid losing validity in qualitative studies.
The interviews were conducted over a limited time in France and there was no possibility to go back and make repeated interviews which is not ideal if comparing with Yin (2013) who suggests intense long term relation to the field in order to obtain a deep and complete understanding of field situations including the possibility to make repeated observations and interviews,
The richness of data suffered from the fact that half of the interviews were conducted with non-‐pilot users. This meant that we had to spend time informing about the service before to get relevant answers. The initial idea of interviewing pilot-‐users only would have enriched our data, we believe, but due to practical reasons this was not possible.
During the interviews control questions were posed to make sure that we had understood what the respondents wanted to say. If their answers seemed illogic, we made sure that they had understood the question correctly by providing necessary information (e.g. if a technical detail had been misunderstood). In this respect, the interviews turned out to be more of discussing character.
Prior to the field study, discussions with Husqvarna employees took place in order to understand what value could be created from using the service, which was highly relevant to the purpose of this study. During a workshop, we developed an excel sheet with potential benefits that were thought to be relevant to customer business. During the interviews these were either validated or denied by customers. This was a way to question our own assumptions and in several cases we had to discard ideas that seemed strange to the customers even though they would have added quantifiable benefits, which in part, were important to this study. We argue that when competing explanations existed, we always chose the one that was more likely to reflect the reality in which customers exist.
Especially in the theory development phase, triangulation has been applied. Different researchers have been compared, first to get a better picture of the concept of value, which was critical for this study. Second, different authors’ take on value assessment and segmentation were compared in order for us to make appropriate choices for this study. The value communication part has a slightly lower degree of triangulation, due to lack of literature on the specific topic.
Means-‐end value assessment
46
In the data collection phase, the validity could have been better by asking the same questions to different sources within the same customer organisation -‐ the tactics of including different role players was not included in this study. Our focus was rather to cover different customer types than different role players. As such, appointments were made with municipalities and private landscapers (and dealers) We mainly talked to purchase managers, team leaders etc i.e. people higher up in the organisation.. We argue that they were more relevant to the purpose of the study because the service, at the end of the day, primarily is a decision making tool. But we here acknowledge an ambiguity, because some of the identified benefits suggest that value would be created through the very actions of mechanics and operators. Their statement would therefore improve the validity. Or even, maybe other value drivers would have been mentioned. However, two dealers were interviewed which gave us a wider perspective on the field of research, although this was a bit out of scope of the topic.
During the content analysis (see previous chapter) we compared all answers of the respondents in order to develop categories. The laddering interview technique accounted for in the previous chapter, was employed which allowed us to compare the answers over the two levels of abstraction that were untouched prior to the fieldwork (i.e. consequences and end-‐states).
We have undisputedly compared what was said at the supplier side, during meetings, workshops and various types of documentation with what was said during the customer interviews. We believe that without the words of the customers, this study would have had a much smaller degree of validity because many ideas that were accounted for by the supplier proved wrong during the major field work in France.
5.7.2 Reliability We carefully developed an interview protocol prior to the data collection in order to establish a structure and fairness towards to respondents (everybody was asked the same questions which we made clear before starting the interview). In this sense, the reliability of this case study has been increased according to Yin’s (2009) procedure to increase reliability. We have also tried to operationalize the interview structure, questions, analysis technique and research question in order to increase the degree of reliability.
By recording the interviews and having a structured analysis technique that required to set up a kind of response data base (Appendix VI), we enhanced the reliability of the study in accordance to Yin’s (2011) argumentation of increased reliability with a data base. We have however interpreted the answers of the informants when putting up the response in the response formula (Appendix VI), which diminish the reliability. By maintain a chain of evidence i.e. there is a clear link between the research questions and final evidence, the reliability is enhanced. The observers, in our case the opponents and tutors, are able to follow the entire chain from initial research questions to the case study conclusions. This is also something Yin (2011) argues increases the reliability.
Things that have weakened the reliability:
• Husqvarna sales reps were in most cases present during the interview. This might have obstructed the respondents to give rich and honest answers.
• The nature of value itself, from a service logic perspective, is subjective and varies over time. It is thus likely that no matter how clear the protocol, the later researcher would experience deviation in answers.

Means-‐end value assessment
47
• The customers had different knowledge of the fleet service and that we, as interviewers, did have slightly different approach with the different customers, the results can have been affected.
The overall reliability of the study is therefore not very high but this does not affect the validity of our results. The results are our interpretation of the interview with the customers and are based on our knowledge about the industry, academic literature and more. It is therefore not probable that the exact same results would be obtained if the study was to be carried out in the same way again.

Means-‐end value assessment
48
6 Analysis The analysis relates the empirical findings to the analysis model and theoretical framework. The research questions are answered.
The analysis follows the analysis process and consists of four sections with a focus on the findings from the value assessment and then the value segmentation. The conclusions then make the point regarding the value communication and thus answering the aim of the study.
The first three sections are related to the first step in the analysis process and deals with the research question related to the value assessment, “How do the customer perceive the value of the service?”, which is summarized in the section 6.3. This question is as mentioned decomposed into two sub-‐questions and thus two sections in the analysis, each with several question to operationalize these sub-‐questions. The steps described in 2.2 Value Assessment have laid the foundation for our work. Some early comments and assumptions are made regarding the value assessment.
Again, emphasized by many authors (Hinterhuber, 2004; Nagle & Hogan, 1998; Ulaga & Chacour, 2001) the reference product is critical in order to assess the value. Although beforehand considered difficult, our analysis model takes this into account by assessing customers’ current business without the service as compared to customers’ business with the service. This idea, however, was disturbed by the fact that the actual usage of the service was close to zero which means that our focus will be in potential value. How this affects our results has been discussed in 5. Methodology. Now, we argue that, for the purpose of this study, there is no interest in identifying the reference product per se. The interview technique allowed for the respondents to think critically and we noticed that during the interviews, the customers continuously compared the potential outcome of using the service with how they work today. There will thus not be a distinct description of a reference product. It should rather be seen as intertwined in the results that will be accounted for in the value ladders and value map.
The last section (6.4) of the analysis treats the second step of the analysis process, which is value segmentation.

Means-‐end value assessment
49
6.1 Value Assessment – analysis from a value hierarchy perspective We start the analysis by looking at the customers’ value hierarchy (Woodruff, 1988) in relation to the service in order to answer our first research question:
RQ1: How is value-‐in-‐use of the service enabled in the customers’ business?
The building up of customers’ value hierarchies is consistent with the operationalised questions:
Op1) What are the desired service features? Op2) What are the desired consequences in use? Op3) What are the desired goals?
We then take the analysis a step further and with the results of the laddering technique related to the value hierarchy and look at the most desired features, consequences and goals as well as treating the question of Op4) Can the value-‐in-‐use of the service be quantified in economic and non-‐economic terms?. A deeper explanation of how value-‐in-‐use is created is presented. We again emphasize the need of understanding customers’ day-‐to-‐day activities in order to assess the value, which is emphasized by Kowalkowski & Kindström (2012:84) and Nagle and Hogan (2006) among others. In this stage, we take a narrow approach to the service, isolating it as much as possible, to assess the potential value arising in customers operations and the core offering (Ulaga and Eggert, 2006) that comes from the particular features of the fleet service itself. We introduce the reader to a comparison between the customers’ desired consequences and Lapierre’s (2000) theoretical value drivers. We do so to make a smoother transition to the second part of the value assessment analysis that treats the question of “How can the customer perceived value of the service be expressed in terms of benefits and sacrifices (value drivers)?”.
6.1.1 What are the desired service features? In order to assess the value of a service it is critical to start by understanding the lowest level of the value hierarchy (Woodruff, 1997). Since neither the pilot users nor the potential customers that were interviewed had any reference product (= a similar service) and furthermore had very little knowledge of using the service, the desired attributes are of little interest when assessing the value-‐in-‐use in this specific case. The analysis focuses on how the service could stimulate value drivers in customer operations (Ulaga & Eggert 2006) and the importance rather lies in which of the service features the customers perceive a potential value-‐in-‐use, i.e. desired consequence. The interpretation of desired service attribute as presented in this section is therefore not exactly coherent with the value hierarchy. The aim is instead to present and explain the desired features of the service and not the desired service attributes.
The most appreciated features, both in terms of importance and frequency, of HFS are the ones related to the machines. If divided into the two types of subscriptions, Machine Data Subscription and Operator Data Subscription, it is, as shown in the table below, the machine statistics that are more frequently desired.
Figure 18. Value Hierarchy
Customers’ goals and purposes
Desired consequences in use situations
Desired product attributes and attribute performance

Means-‐end value assessment
50
Table 10. Customers’ desired service features
HFS specific features
Important for (number of customers)
MS 8 WLM 7 LB 7 MHM 6 VR 4 WLO 3 MHO 3
This result is explained by the fact that customers’ perception of the sacrifices, when it comes to the operator side, is greater than the potential benefits associated with those service features. A more thorough discussion of all benefits and sacrifices in terms of value drivers is going to be carried out in the later section 6.2. (Perceived benefits and sacrifices), including both sacrifices in use of the service and sacrifices that prevent a purchase of the service. A short explanation to understand why the customers prefer the machine specific subscription is however necessary at this stage since the most desired consequences in use are built up from these features.
The reason that machine subscriptions are more desired is that some customers see a trust or legal issue when it comes to monitoring their employees. The public organisation stated that monitoring employees would be difficult because of pressure from the unions. In cases the private companies, who have a greater freedom of choosing, do not want to monitor their employees, it is rather a personal choice from their side. There seems to be a strong belief in the value of freedom and liberty in the industry, which does not fit the idea of monitoring human beings. Although all customers do see advantages of doing it, they clearly think the disadvantages outweigh the advantages.
“Of course there are benefits that comes from using the operator tag but the disadvantages are just too important in this specific case”
(Jaroussi. Espaces Verts Ets Jaroussi)
Some customers not in favour of the Operator Subscription acknowledge the advantages of these features but argue that these can almost all be obtained through the Machine specific data by having individualized machines.
There is another more rational explanation to the customers’ contrariness to monitoring their employees which is well summarized in the following quote:
“...we talk to our employees. Our machines on the other hand cannot speak and statistics of their utilization is therefore very interesting.”
(Vrignaud. Parc du Puy du Fou)
It is the simple fact that managers have an easy option when it comes to evaluating the work of an operator and that is talking to them. Obtaining feedback from the machines is on the contrary not as easy. This feedback is enabled by the Fleet Service, which is why the customers value it.
Machine subscription
Operator subscription

Means-‐end value assessment
51
6.1.2 What are the desired consequences in use? According to the value hierarchy (Woodruff, 1997) or laddering method (Reynolds & Gutman, 1988) the next step is to see what consequences in use the customers want and could achieve when using the service. We also refer back to the notion of value-‐in-‐use (Kowalkowski & Kindström, 2012:36), which emphasise that it is through in use situations that value creation takes place. Even though the interviewed customers hadn’t really used the service, and it therefore may seem odd to look at value-‐in-‐use, we still argue that this is the most preferable way to go in order to understand how the service can enable value creation. The customers’ desired consequences in use derive from one or several desired service feature(s). A summary of these is presented below:
Table 11. Customers’ desired consequences in use in relation to HFS
Desired consequences in use Important for… (Numbers of customers)
Reduced amount of breakdowns 6 Planning investment in time 5 Individualised machine handling training 5 Optimize the fleet size 4 Know-‐how of machines handling 4 Easier access to information 4 Optimize the fleet characteristics/variety 3 Correct machine selection for the job 3 Homogeneous utilization of the fleet 3 Fuel reduction 3 Downtime 3 Improve team productivity 2 Reduced repair time 2 Knowledge of actual job cost 2 Improve employer-‐employee relation 2 Less process time at dealer 2 Less outsourcing 2 Work rotation 1 Increase machine value 1 Control over working conditions 1 Planning investments of spare parts 1 Monitor inappropriate use of machine 1
In total, 22 desired consequences in use were identified, including those related to Operator Subscription. The relative importance of the consequences and from which service features they derive will be presented later on in the Value Map. We will see that the Operator side then is cleared away taking into account the disadvantages discussed in the previous section.
6.1.3 What are the desired goals? The highest level of the value hierarchy is denominated Customer’s goals and purposes (Woodruff, 1997), or Values (Reynolds & Gutman, 1988) but we will simply refer to this level as Goals. According to the hierarchy the goals or purposes are stimulated thanks to the desired consequences in use. The label has been changed into Goals because we found it easier to talk to the customers in terms of goals instead of Purposes, which is a bit fuzzy, or Values, which is a term

Means-‐end value assessment
52
we use a lot in other contexts. The effect may be that we find ourselves slightly outside the level of abstraction that the authors talk about but this is not considered a problem since we fulfil the main objective, which is to find higher levels of abstraction correlating with HFS.
Going through the interview material, we identified a total of four goals that the service could stimulate according to the customers. These are all goals that affect customers’ decisions in the management of their business. If a goal did not affect the customer’s decision making it was not considered an important goal and is thus not accounted for here.
Table 12. Customers’ Goals in relation to HFS
Goals Important for (no of customers)
Productivity & efficiency
7
Cost reduction/control 5 Minimized ecological and social impact
3
Quality on job and staff 1
Whether the goals are mutually exclusive cannot be accounted for. All combinations but Quality on job and staff – Cost reduction/control have been seen in the set of ladders representing each customer (see Appendix III or V).
6.1.3.1 Productivity & Efficiency Improved Productivity & Efficiency was the most mentioned by the customers (7/8). Although somewhat unspecific, this goal shows that doing the right things in the right way is highly valued among the customers. This goal can be seen as two sided.
1. Productivity. The first and most important goal is to become more productive which is a very broad goal that is stimulated by several consequences. It can mean minimizing downtime, or as stated by Husqvarna “Maximizing up-‐time on the equipment”. The cause for downtime is machine breakdowns and depending on the customer’s fleet and resources, the problem can be of different magnitude. The main problem that affects the customer economically is not that a machine breaks down but rather having an employee not working because there are no machines available. The objective is therefore more of an uptime on the employees character. Productivity can however come from several consequences and the opportunities and sources for improved productivity vary among customers.
2. Efficiency. The second aspect of this goal is to become more efficient on the field. This means doing the job in as little time as possible without losing quality. This is important to customers since almost all jobs have a pre-‐negotiated fixed cost.
6.1.3.2 Minimized ecological and social impact This goal refers to the environmental aspects in the customers’ business, which can be reduction of noise, pollution, energy consumption etc., and the social impact which is human-‐related and includes both internal relations with employees but also external relations with customers and others.

Means-‐end value assessment
53
“Invest in efficient electrical machines in order to reduce the noise our work causes”
(Remont. Mairie de Lyon)
6.1.3.3 Cost Control and/or Reduction The goal of Cost Control/Reduction is very broad and could be included in all the other goals as well but the customers however were very keen on pointing out the importance of this goal. This goal is also two sided:
1. Cost Control. The customers mentioned control of their cost as one major goal that the service could help them with. The control over costs is not the exactly same as cost reduction but an important step towards it. By managing their costs at a machine level on a specific job, knowing the maintenance and repair costs of the machines and more, they would be in a better position to put up strategies for their business.
”The economic crisis forces us to look over our costs and fight to keep our profitability”
(Jaroussi, Espaces Verts Ets Jaroussi)
2. Cost Reduction. The cost reduction part of this goal is perhaps obvious but the customers claimed that the economic situation in France after the economic crises is very difficult. All players on their market therefore have to be very careful and the strategy for most of the interviewed customers was rather reorganisation, consolidating their market share and reducing costs than expansion. Cost reduction was also, as stated by the customers, always interesting in order to increase the company’s profit.
”We want to keep the company alive and at the same size. The times are tough in France right now, which already makes that goal difficult.”
(Paysage Assisstance)
”Our strategy in the nearest future is to reduce all costs…”
(Marie de Lyon)
6.1.3.4 Quality on jobs and staff There was only one customer who managed his business with the goal of having an excellent quality on jobs and staff. This does not mean the other customers did not care about this kind of goal but this particular customer stood out in the sense that he managed the operations under the influence of this goal, which cannot reasonably be said for any of the others.
“Our goal is to have excellent quality and efficiency in our daily operations and to keep the noise down to a maximum in order to not disturb out guests”
(Vrignaud. Parc du Puy du Fou)
6.1.4 Summary and relating to Husqvarna’s ideas The goals mentioned by the customers have similarities to what Kowalkowski and Kindström (2012:31-‐32) argue are customers’ incentives to buy services. They state that flexibility, cost reduction, risk reduction, knowledge and value-‐in-‐use are the main reason to why a customer would by a service. These arguments can all be found at either the desired consequence in use

Means-‐end value assessment
54
level or at the goal level. A discussion about which of these are the most important and feasible will be conducted in the next chapter.
The table below shows a comparison between Husqvarna Business Values and the customers’ desired consequences in use. The Business Values are not as specific as the desired consequences, neither are they as broad as the customers’ goals. The Business Values are therefore somehow a step between desired consequences in use and customer’s goals if looking at the value hierarchy presented by Woodruff (1997). The table below shows what Business Value corresponds to what desired consequence in use of the service.
Table 13. Desired consequences in use VS Husqvarna Business Values
Desired consequences in use Important for (no of customers)
Husqvarna Business Values
Reduced amount of breakdowns 6 Machine Handling Planning investment in time 5 -‐ Individualised machine handling training 5 Machine Handling Optimize the fleet size 4 Fleet Utilization Know-‐how of machines handling 4 Machine Handling Easier access to information 4 -‐ Optimize the fleet characteristics/variety 3 Fleet Utilization Correct machine selection for the job 3 Fleet Utilization Homogeneous utilization of the fleet 3 Fleet Utilization Fuel reduction 3 Machine Handling Downtime 3 Up-‐time Improve team productivity 2 Fleet Utilization Reduced repair time 2 Up-‐time Knowledge of actual job cost 2 Fleet Utilization Improve employer-‐employee relation 2 -‐ Less process time at dealer 2 -‐ Less outsourcing 2 -‐ Work rotation 1 -‐ Increase machine value 1 Machine Handling Control over working conditions 1 Health & Safety Planning investments of spare parts 1 -‐ Monitor inappropriate use of machine 1 Fleet Utilization
Although not theoretical, it seems relevant to point out the fact that the case company’s Business Values do not cover all the desired consequences in use of the service and thus, not the entire perceived value of it. The interpretation of the Business Values’ relation to the consequences is of course subjective but questions however Husqvarna’s value proposition.
If looking at the frequency of the different Business Values in relation to the consequences there seems to be a coherency with the customer goals presented earlier. The most frequently desired Business Values are the ones related to the management and utilisation of the fleet, which have a direct link to the goals Cost reduction/control and Productivity/efficiency. The Business Value Health & Safety is concluded as less important. The Up-‐time however is important to the customer but as we will discuss later on, it is such a critical issue that the customers already have found a solution for it and is therefore not a main goal.

Means-‐end value assessment
55
Table 14. Frequency of Business Values from desired consequences in use.
Husqvarna Business Values
No of corresponding consequences in use
Machine Handling 5 Up-‐time 2 Health & Safety 1 Fleet Utilization 7
6.1.5 What are the most important features, consequences and goals? With respect to the laddering analysis technique, described in chapter 5.5, figure 19 has been developed. This is our interpretation of a Hierarchical Value Map taking aim at linkages between elements rather than at the elements themselves, as opposed to the previous chapter where the elements were presented independently. The goal is to have complete chains from the feature level to the goal level. This chart thus illustrates the most represented interdependencies of features/consequences/goals. The number of interdependencies comes either from a variety of respondents or from within the same respondent meaning that s/he has emphasized the same connection multiple times, typically 2-‐3.
Figure 19. Value map developed from the eight customers’ responses
The solid lines represent stronger connections than the dotted lines. Given the numbers of respondents, the value map is in no way statistically proved. Here we simply conclude that the given connections are the ones with the highest frequencies. For a deeper understanding of how

Means-‐end value assessment
56
the chart was developed, we refer to chapter 5.5 analysing the ladders. We identify seven chains, each assigned a number in the value map, out of which two are incomplete (no 5 and no 7) i.e. they do not make it to the goal level which normally is not the case when making a hierarchical value map (Reynolds & Gutman, 1988). Despite this, we choose to include them here to show that there can be important consequences in use that lack a natural goal connection.
As suspected, we recognize that the features related to the Operator subscription of the service have received less attention. Therefore the three corresponding service features are not present in the value map. Half of the initial 22 consequences are represented and quite naturally only Cost reduction/control and Productivity & Efficiency are represented as goals. Furthermore, this chart depicts what consequences, and ultimately service features, constitute the goals. Reminding ourselves that the first step in the analysis process ends in getting a better understanding of customer perceived value, this value map serves the purpose of showing what customer issues that HFS can help resolve and thus what value will be more likely to be created. Therefore the service features and goals are of little interest; we argue that focus must be on the consequence level to provide an as authentic picture as possible of the value-‐in-‐use.
We now take a closer look at the chains in order to more thoroughly explain how value creation might take place in customers’ business. This will provide better answers to research question 1a-‐c and furthermore propose an answer to research question 1d.

Means-‐end value assessment
57
6.1.6 Chains affecting customer business: the most desired features/consequences/goals Building on the chains presented in the value map we aim to further explain the value perception of the customers. Each chain starts from one or more service feature(s), which leads to one or more desired consequence(s) in use which helps the customer to reach a certain goal. We argue that the desired consequences in use of the service can be interpreted as benefits since they are elements that can help achieving certain goals. Therefore we will here try and match these with theoretical value drivers regarded as benefits (Lapierre, 2000) and their respective value source (Ulaga & Eggert, 2006) . At this stage we also include the monetary aspect of value by analysing the potential for quantification of the respective chains. Although looking at value-‐in-‐use whose definition goes beyond hard facts, we include this perspective because many authors (e.g. Anderson & Narus, 1998), especially in the value assessment literature (e.g. Hinterhuber, 2004; Nagle & Hogan, 2006, Ulaga & Chacour, 2001) stress the importance of getting estimates of value drivers or even calculate cost savings and revenue increases as a major part of the value assessment. Also Kindström et al. (2009:74) argues that it is often necessary, although not enough, to monetize the value of a service.
6.1.6.1 Chain 1: Cost reduction/control 1
’Knowledge of actual job cost’
Three customers were interested in the feature Workday Log Machine as a tool to help them plan, evaluate and perhaps reconsider the actual cost of a job. By keeping track of the machine time at different work fields, the customers think that they can get a better understanding of the work time required for different jobs. This would help them to evaluate the cost of a future job, which would help them in their pricing strategy. It could for example be:
• Minimizing the risk of loss of income due to miscalculation of job cost (price set too low). • Improve competitiveness by reducing their price with the knowledge that the job should
not take more time than estimated
The value driver in this case is can be interpreted as the supplier’s technical competence (Lapierre, 2000) and the way Husqvarna uses new technology to generate solutions or understand the customer’s business which relates it to Ulaga and Eggert’s (2006) value source customer operations. In this specific case the solution has not come that far but the supplier, Husqvarna, is on the way of helping the their customer to really manage an important part of their cost issues.
Economic benefits
The economic benefit of such consequence is difficult to assess, especially since no pilot users have experienced such a value-‐in-‐use. The concept of the economic value of risk minimization can however be exemplified. Should a customer succeed of keeping statistics of the average workload and machine time required for a job of type X, he could then calculate the cost of that job and set an accurate price on it. A price set wrong has big consequences on the customer’s cost and the critical aspects according to the customers are, as stated earlier, the labour costs.
WLM Knowledge of actual job cost
Cost reduction/control

Means-‐end value assessment
58
The cost of the machine on the field is minor in comparison with the cost of having employees working inefficiently. This directly affects the customer’s profit of the actual job and could have devastating consequences if occurred repeatedly and on bigger jobs.
Non-‐economic benefits
• Better work planning • Peace of mind
6.1.6.2 Chain 2: Cost reduction/control 2
‘Planning investments in time’
An investment related problem that the customers experienced in their business is the planning of when to invest. The customers, who also were among the bigger enterprises in the study, saw a great potential of planning their investments with the Fleet Service feature Workday Log Machine, a feature that shows them the actual running time of each machine.
“Large municipalities like us often have a great problems regarding when to invest in new machines…”
(Mairie de Lyon)
This information would give them an idea of which machines are coming to the end of their life cycle and must be replaced. This knowledge would give them a control over their future cost and hence be very valuable for the managers and company owners. Some customers also mentioned that it would probably save them time when planning which machines to invest in. This can be seen as the product related value driver of technical competence of how the supplier uses new technology to provide solutions for the customer according to Lapierre (2000). The benefit takes place during the customer’s working process and is thus identified as coming from customer operations (Ulaga & Eggert, 2006).
Economic Benefits
The potential time saving when planning investment with the help from the Fleet Service could not be quantified during the interviews. This because no pilot users have realised the actual consequences and that potential time and cost saving prediction is too uncertain to estimate.
Non-‐economic benefits
The non-‐economic benefit of this consequence is: • Control of the investments to come (cost), which gives the managers peace of mind.
WLM & MS Planning investment in time & Reduced
amount of breakdowns
Optimize uleet size Cost reduction/control

Means-‐end value assessment
59
‘Reduced amount of breakdowns’
None of the interviewed customers did have a maintenance plan for the smaller machines in their fleet although they acknowledge the fact that a good preventive maintenance could minimize the breakdowns of the machines and thus the downtime. They warmly welcomed the HFS feature Maintenance System and believed that a preventive maintenance could reduce the number of breakdowns and help them to anticipate future potential breakdowns. The consequence of reduced amount of breakdowns in this specific ladder is a prerequisite to the customers’ willingness of reducing their number of machines as will be discussed in the next section. With more reliable machines come the possibility and a certain willingness of reducing the size of the fleet. This concept of more reliable machines is what Lapierre (2000) refers to as product quality and the reliability and durability of the products. The product here is not the service itself but the total offer of the supplier Husqvarna and includes all machines and services that the supplier offers, a benefit hence coming from the source of the core offering (Ulaga & Eggert, 2006)
Economic Benefits
The direct economic benefits of fewer repairs are less labour cost and less spare part costs. The customers could not quantify the cost of their spare parts regarding their handheld machines and they also had troubles knowing how much time they actually spent on repairing machines.
Non-‐economic benefits
The most important non-‐economic benefit of this consequence is that it creates the possibility of optimizing the fleet size.
‘Optimize fleet size’
The informants were interested in the feature Workday Log Machine in order to have a general overlook over their fleet. This overlook would give them a clear view of all their machines and their utilization which they thought could help them deciding whether to invest new machines or not. By combining this feature with a good preventive maintenance, some customers saw a potential of reducing their fleet size. They did not believe in not having any extra machines at all but rather having a good balance of machines in their fleet. Most customers did not have an organized system of their machines or even knew the exact number of machines they had, which gave them problems with machines disappearing and investment related questions. What value driver the service stimulates in this situation is a sort of product customization (Lapierre, 2000) or rather a product-‐offer customization because the consequence is closely related to the entire offer from Husqvarna since it helps the customer to know their actual needs in terms of fleet size. Thus, we relate this to the core offering (Ulaga & Eggert, 2006). The customer saw a link between optimizing their fleet size and a cost control/reduction.
Economic Benefits
The related economic potential lies in a decrease of the total amount of machines; this was however not something the customers were striving for. A possible decrease in machines would be 1 out of 10 according to one customer, which would mean a cost reduction of a machine

Means-‐end value assessment
60
equivalent every time the customer renews his/her fleet. Given the willingness of the customer to reduce his fleet, the total reduction of cost with this consequence would be a function of following parameters:
• Number of Husqvarna Machines • Cost of acquisition of the machines • Number of “extra machines” (or approximate as above – reduction of 1 out of 10 machines) • Average lifetime of the machines
Non-‐economic benefits
Having an optimized size of fleet was very much related to the goal of cost reduction and cost control. The customers did not see any important potential savings related to this consequence, which is rather non-‐economic in its character; it is more about having an overview over the fleet and thus a control over all inventory and its related costs.
6.1.6.3 Chain 3: Productivity & Efficiency 1
‘Reduced amount of breakdowns’
The consequence of reduced breakdown in this ladder is related to the reduction of downtime and not to the monetary savings of fewer repairs, something already discussed in previous section. In this situation the reduction is more of a prerequisite for reduced downtime.
“Yes, even if cost reduction is not in focus it is always good if we can save time and be more productive”
(Parc du Puy du Fou)
‘Reduced Downtime ‘
7 out of 8 customers already deal with the issue of downtime by having extra machines in reserve. Having extra machines is for most customers not seen as a problem since the purchasing cost of a machine is small in comparison to the cost of an employee not working. For an average customer, the cost of an employee is approximately 30 € per hour, thus 240€ per day. A handheld machine costs between 500 € to 1000 € which is equivalent to between 2 to 4 working days of an employee.
One could argue that this is an expensive way of minimizing downtime but as the customers say, a breakdown of a handheld machine is going to happen sooner or later since they are used extensively; the question is rather what happens when the machine breaks down. This is a very similar problem to the case study presented earlier with IH and John Deer. Although the customers have solved the problem with downtime due to breakdowns, it still causes problems and having too many machines in reserve is not optimal.
“The number of machines is not important since they do not cost that much”
MS Reduced amount of breakdowns Reduced downtime Productivity &
Efuiciency

Means-‐end value assessment
61
(Jaroussi)
“...having some extra machines does not affect us economically...it is more worth having an extra machine than to have an employee not having a functioning machine” -‐ Parc du Puy du Fou
Even if downtime is not a big problem, the cost of downtime when it happens is according to the customers very important. By having more reliable machines thanks to a preventive maintenance with the Fleet Service this downtime could be reduced. This would be directly linked to the customers’ goal of becoming more productive. The underlying value driver to reach the goal of productivity, in relation to the supplier’s offer, is what Lapierre (2000) calls product quality and more specifically, the reliability and durability of the product. Once again, what the service does in the customer’s business is to affect the supplier’s, Husqvarna’s, core offering (Ulaga & Eggert, 2006) which are the machines the customer has in his fleet.
Economic Benefits
To calculate the cost saving of this benefit, one would need to put the hours of downtime due to breakdowns without HFS in comparison with the number of hours lost due to breakdowns with HFS.
Non-‐economic benefits
• Less stress • Easier to plan the work
6.1.6.4 Chain 4: Productivity & Efficiency 2
‘Correct machine selection for the job’
Several customers mentioned the problem of planning which machines should be used at which work fields. By monitoring the handling of the machines with the feature Machine Handling Machine or Machine Handling Operator they saw the possibility of managing their fleet in a better way. This could improve their overall work planning by first of all knowing which machines should be used where and after time also planning the use of the machines on different work fields. A better work planning would according to the customers improve their productivity and efficiency of the field.
“...I know that sometimes are machines that are too big and powerful used for work that could be done with smaller machines, which then prevents us from doing another work where the bigger
machines is needed”
(Sapeurs Forêstiers)
There is here a gap in Lapierre’s (2000) theory of value drivers in the way that none of the presented value drivers takes the correct usage of the product under consideration. It could perhaps fall under Lapierre’s (2000) category of alternative solution, supplier’s helpfulness in
MS & MHM Correct machine selection for the job
Productivity & Efuiciency

Means-‐end value assessment
62
solving your problems, but this is such a broad value driver that is does not describe the situation in this context in an accurate way. We have called this underlying value driver product usage, which really is the supplier’s ability to help the customer to use his product, which in this case refers to the core offering of Husqvarna machines.
Economic Benefits
The potential time saving when improving the work planning with the help from the Fleet Service could not be quantified during the interviews. Since no pilot users have realised the actual consequences and the non-‐pilot users did not have any idea of the time or cost that this could save, the economic side is left empty.
Non-‐economic benefits
• Peace of mind when allocating machines and planning the work
6.1.6.5 Chain 5: Individualized machine training (no end-‐state)
‘Individualized machine training’
By either using the operator tag and the feature Machine Handling Operator or the feature of Machine Handling Machine on individual machines the customers saw a valuable possibility of individualizing the machine handling training. This can be done thanks to a warning of incorrect machine handling on the dashboard of the Fleet Service, which gives the manager an incentive to investigate the handling of a specific machine.
“...very interesting to be able to identify incorrect machine handling. Especially since we have a lot of seasonal workers who do not know how to handle the machines correctly.”
(Parc du Puy du Fou)
“...identify team that do not handle the machine correctly...we can then train them better…” (Sapeurs Forêstier)
As stated earlier, most customers were more interested in monitoring the work through a machine perspective but the consequences are the same. Training the employees on how to handle the machine correctly could:
• Decrease the amount of breakdowns due to incorrect machine handling • Making sure every employee knows which machine to take for which job
Those two consequences leads to the end-‐state of productivity and efficiency since the work is done more efficiently if done correctly (according to some but not all customers) and thanks to less breakdowns this could decrease the amount of downtime. This part of the service stimulate
MHM Individualized machine training

Means-‐end value assessment
63
Lapierre’s (2000) value driver of technical competence of the supplier where in this case, the supplier Husqvarna demonstrates knowledge of the customer’s operations and how to improve them. Again is the value-‐in-‐use generated in the customer’s operations (Ulaga & Egget, 2006) where it is critical that the service shows an accurate and correct description of the reality.
Economic Benefits
The pilot-‐users have not made any economical savings but the two potential savings are:
1. Reduced amount of breakdowns due to human errors (see section of reduced amount of breakdowns).
2. ‘Correct machine selection’ and handling leads to increased efficiency on the field. This however was never measured in this study and was furthermore not the opinion of all pilot users. According to one pilot user, a correct machine handling could prolong the machine lifetime but to the cost of efficiency on the field. This saving would be inferior to the labour cost of the loss of work and is therefore not useful. There were overall different opinions whether a correct theoretical machine handling could improve productivity and efficiency or if the Fleet Service simply was too unrealistic.
Non-‐economic benefits
• Knowledge spreading in the company -‐ ensure that everybody knows how to handle every machine which can improve work planning for the managers.
6.1.6.6 Chain 6: Productivity & Efficiency 3
‘Easier access to information’
This consequence comes from the feature Library and is perhaps the simplest of all desired consequence in use since it is just an access to the spare part list of every machine. All four customers that valorised this feature were however very interested in this simple solution that they had waited for since a long time. This consequence is quantifiable if and when it leads to either the consequence of less outsourcing or less process time at dealer. Since not all customers who valorised this feature saw a direct consequence except from being useful, the quantification of the consequence will be done later on when discussing the reduced repair time that this can lead to. The quick access to information, which in this case refers to information regarding Husqvarna’s core offering (machines) is very similar to the value driver of responsiveness identified by Lapierre (2000). Just as Lapierre (2000) finds in his study, the customers’ in this industrial context valorise a quick answer to their problem, which is exactly what this consequence is. The customers saw a value of this consequence since it could improve their overall efficiency.
Economic Benefits
See consequence of reduced repair time.
Non-‐economic benefits
LB Easier access
to information
Less Outsourcing
Reduced repair time
Productivity & Efuiciency
Means-‐end value assessment
64
• A small time saving (not quantifiable in €) • Peace of mind by having an organized system for machine information accessible at all
time.
(‘Less outsourcing’) & ‘Reduced repair time’
A first consequence of easier access to information was, according to some customers, the possibility of less outsourcing of maintenance or repairs of their machines. The actual benefits of this consequence are difficult to quantify since is only a hypothetical scenario that no pilot user had realised. If however this is a consequence that is possible, it could mean less work for the distributors, which could decrease the distributors incentives to sell the service. That is an interesting hypothesis to investigate but something we leave to future research.
The potential reduction of repair time comes from the Library of the Fleet Service, which leads to a first consequence of easy access to the technical drawings of each machine. This is something many customers value since they today can put in a lot of time searching for these lists of spare parts. There are two possibilities of cost reduction that follows this consequence depending on if the customer does the repairs in-‐house or outsource them.
1. In-‐house: The customer has easier access to the information of spare parts and can in combination with the maintenance plan see which parts should possibly be changed or be the cause of the breakdown.
2. Outsourcing: If the customer outsources all their repairs would the consequence be that they could have a better communication with the dealer regarding when the repairs of their machines needs to be done and/or which parts that should be replaced. This could mean less queue time at the dealer at thus less downtime or “loss of income”.
An overall reduction of repair time improves the overall productivity and efficiency of the customers’ business. As for the underlying value driver, it can be seen as what Lapierre (2000) calls responsiveness since it regards reactivity when a problem occurs.
Economic benefits
The potential time saving when reducing the repair time with the help from the Fleet Service could not be quantified during the interviews. Since no pilot users have realised the actual consequences it cannot be quantified at this stage of the study. The economic benefit of reduced repair time could be of important size if it comes from less outsourcing according to the customers, if not the economic benefits are supposed to be very small.

Means-‐end value assessment
65
6.1.6.7 Chain 7: no end-‐state
‘Know-‐How of machine handling’
Several customers saw a value of having instruction videos and documents over the machines accessible for all employees. This could potentially lead to an increased knowledge about the machines. It could also be of help when training new employees, which would help the customer to improve his overall productivity and efficiency. Once again is it difficult to find an appropriate underlying benefit value driver in the theory for explaining what the customer wants in this situation. It could be described as Lapierre’s (2000) time or effort value driver but those are sacrifices and not benefit according the author. This situation is more an in-‐use support and could thus qualify as the value driver of technical support (in-‐use) mentioned by Ravald & Grönroos. This however does not describe the customers’ underlying wishes, which is why we propose the already previously mentioned value driver of product usage to describe this ladder.
Economic Benefits
Not quantifiable in this study.
Non-‐economic benefits
• Improve the training for new and current employees • Knowledge spreading
LB Know-‐how of machine handling
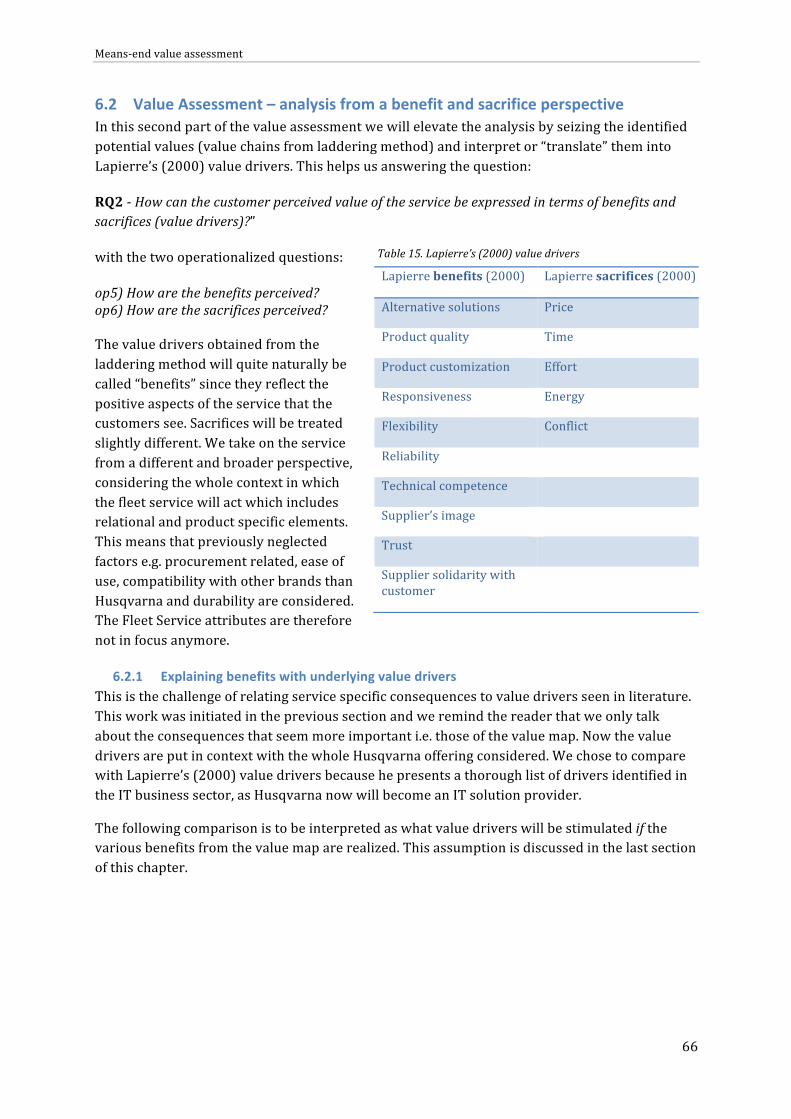
Means-‐end value assessment
66
6.2 Value Assessment – analysis from a benefit and sacrifice perspective In this second part of the value assessment we will elevate the analysis by seizing the identified potential values (value chains from laddering method) and interpret or “translate” them into Lapierre’s (2000) value drivers. This helps us answering the question:
RQ2 -‐ How can the customer perceived value of the service be expressed in terms of benefits and sacrifices (value drivers)?”
with the two operationalized questions:
op5) How are the benefits perceived? op6) How are the sacrifices perceived? The value drivers obtained from the laddering method will quite naturally be called “benefits” since they reflect the positive aspects of the service that the customers see. Sacrifices will be treated slightly different. We take on the service from a different and broader perspective, considering the whole context in which the fleet service will act which includes relational and product specific elements. This means that previously neglected factors e.g. procurement related, ease of use, compatibility with other brands than Husqvarna and durability are considered. The Fleet Service attributes are therefore not in focus anymore.
6.2.1 Explaining benefits with underlying value drivers This is the challenge of relating service specific consequences to value drivers seen in literature. This work was initiated in the previous section and we remind the reader that we only talk about the consequences that seem more important i.e. those of the value map. Now the value drivers are put in context with the whole Husqvarna offering considered. We chose to compare with Lapierre’s (2000) value drivers because he presents a thorough list of drivers identified in the IT business sector, as Husqvarna now will become an IT solution provider.
The following comparison is to be interpreted as what value drivers will be stimulated if the various benefits from the value map are realized. This assumption is discussed in the last section of this chapter.
Lapierre benefits (2000) Lapierre sacrifices (2000)
Alternative solutions Price
Product quality Time
Product customization Effort
Responsiveness Energy
Flexibility Conflict
Reliability
Technical competence
Supplier’s image
Trust
Supplier solidarity with customer
Table 15. Lapierre’s (2000) value drivers
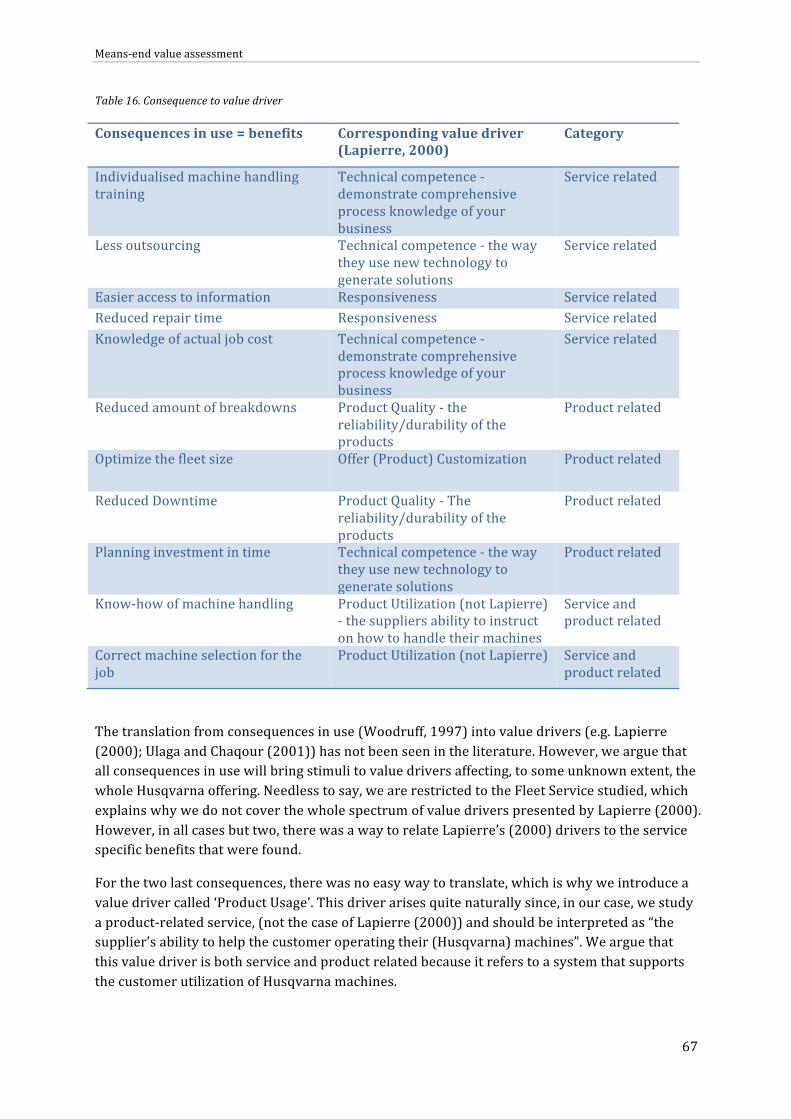
Means-‐end value assessment
67
Table 16. Consequence to value driver
Consequences in use = benefits Corresponding value driver (Lapierre, 2000)
Category
Individualised machine handling training
Technical competence -‐ demonstrate comprehensive process knowledge of your business
Service related
Less outsourcing Technical competence -‐ the way they use new technology to generate solutions
Service related
Easier access to information Responsiveness Service related Reduced repair time Responsiveness Service related Knowledge of actual job cost Technical competence -‐
demonstrate comprehensive process knowledge of your business
Service related
Reduced amount of breakdowns Product Quality -‐ the reliability/durability of the products
Product related
Optimize the fleet size Offer (Product) Customization Product related
Reduced Downtime Product Quality -‐ The reliability/durability of the products
Product related
Planning investment in time Technical competence -‐ the way they use new technology to generate solutions
Product related
Know-‐how of machine handling Product Utilization (not Lapierre) -‐ the suppliers ability to instruct on how to handle their machines
Service and product related
Correct machine selection for the job
Product Utilization (not Lapierre) Service and product related
The translation from consequences in use (Woodruff, 1997) into value drivers (e.g. Lapierre (2000); Ulaga and Chaqour (2001)) has not been seen in the literature. However, we argue that all consequences in use will bring stimuli to value drivers affecting, to some unknown extent, the whole Husqvarna offering. Needless to say, we are restricted to the Fleet Service studied, which explains why we do not cover the whole spectrum of value drivers presented by Lapierre (2000). However, in all cases but two, there was a way to relate Lapierre’s (2000) drivers to the service specific benefits that were found.
For the two last consequences, there was no easy way to translate, which is why we introduce a value driver called ‘Product Usage’. This driver arises quite naturally since, in our case, we study a product-‐related service, (not the case of Lapierre (2000)) and should be interpreted as “the supplier’s ability to help the customer operating their (Husqvarna) machines”. We argue that this value driver is both service and product related because it refers to a system that supports the customer utilization of Husqvarna machines.

Means-‐end value assessment
68
By switching the columns, we now check whether all of the theoretical value drivers have been identified (yes or no) in relation to the benefits seen in Husqvarna Fleet Service.
Table 17. Theoretical value drivers encountered – benefits
Other
First of all we recognize that no relational drivers exist among ours, simply because we have focused on the products and services. Although, fragments of relational dimensions have been identified through talking generally about the Fleet Service. One of the pilot customers says that:
“I’m surprised, in a good way, that Husqvarna takes responsibility for our issues and proposes
solutions fit to resolve some of them”
(Svensk Markservice, 2014)
which can be categorized as ‘solidarity’ seen in Lapierre (2000).
6.2.1 Explaining sacrifices with underlying value drivers Again, starting from the value map, there are sacrifices that the customers have to make in order to realize those desired consequences in use. In one way, the laddering method has already taken important sacrifices into account, which has led to the elimination of the operator side of HFS. All of the remaining elements are most likely related to some kind of investment in time/effort/energy and have yet to be identified more properly. The value map focuses on the most represented benefits, which, as of this stage of the development of a value proposition, are the most crucial. We will later discuss and motivate why it will be of outermost importance to also include sacrifices on the same detailed level on which the value map is operating. However, sacrifices have been identified at a more aggregate level. We refer back to Woodruff’s (1998) definition of customer value:
Customer value is a customer’s perceived preference for and evaluation of those product attributes, attribute performances and consequences arising from use that facilitate (or block) achieving the
customer’s goals and purposes in use situations.
Without discussing exactly how they connect to service specific features we have identified attributes that, as of now, rather block than help achieving the goals. We argue that it is too early
Theoretical value drivers -‐ benefits Value driver encountered as potential benefit
Alternative solutions No Product quality Yes Product (offer) customization Yes Responsiveness Yes Flexibility No Reliability No Technical Competence Yes Supplier’s image No Trust No Solidarity No Product utilization Yes

Means-‐end value assessment
69
to decompose these elements anymore. The following table presents the in use attributes customers believe will block them from achieving their goals, i.e. the same goals that were previously connected to benefits.
Table 18. Categorisation of sacrifices
With the same logic as before, we argue that these elements are to be regarded as sacrifices directly related to the in use situation of the service studied.
Switching the columns, we investigate whether all value drivers described as sacrifices by Lapierre (2000) have been mentioned as attributes negatively affecting customer goals. We emphasize that these are still elements related to our value map.
Table 19. Theoretical value drivers encountered -‐ sacrifices.
‘
6.2.2 Other value drivers – aggregate attributes that should be regarded as sacrifices There are other sacrifices mentioned by the customers but that are not directly related to the in use situation of the service and were thus previously ignored, one of which is the price. This value driver is obvious, mentioned by all authors, and deserves a further discussion. Take e.g. Anderson and Narus (1998) who have a pure monetary approach to value and argue that customers will evaluate the offering according to 𝑉𝑎𝑙𝑢𝑒! − 𝑃𝑟𝑖𝑐𝑒!, and thus even treats the purchase price separately from the value.
van Westendorp pricing model allowed us to see where the customers drew the line in terms of pricing. The customers were asked at what price they found it {‘too cheap’, ‘cheap’,
In use attributes that block – sacrifices
Theoretical value driver (Lapierre, 2000)
Category
Compatibility with other brands Product customization-‐the ability to meet unique specifications for products not offered by your (IT-‐)supplier
Service related
Accurate reality reflection Trust –the accuracy of the information provided by your supplier
Service related
Proactive training Proactivity-‐ The supplier’s ability to teach you on how to use their offer
Service related
Ease of use Time/effort/energy – the effort spent for training a number of your employees
Service related
Theoretical value drivers Value driver encountered as sacrifice
Price No Time/effort/energy Yes (but needs further research)
Conflict No Trust (benefit) Yes Product customization (benefit) Yes Proactivity Yes
Means-‐end value assessment
70
‘expensive’, ’too expensive’} to invest in the full Fleet Service for a machine at 500euro (e.g. a small trimmer). The results are presented in Appendix IX.
As for the procurement situation, another important factor has been identified; whether the service should be sold separately or bundled with Husqvarna machinery. Collectively governed organizations make it clear that the budget model allows for little flexibility in terms of purchase of this kind of services which implies that Husqvarna needs to get the timing right; it is when municipalities do machine procurement that they are susceptible for purchasing the service. Otherwise, the sacrifice is too important. This sacrifice has no clear parallel to Lapierre’s (2000) drivers but can be related to Ravald and Grönroos’s (1996) acquisition costs, their sacrifice that take aim on the cost that buyers face when making a purchase.
Thirdly, the installation of the fleet service has proven more complicated than expected. Ravald and Grönroos (1996) categorize this driver as a perceived sacrifice, which is consistent with our experience of the pilot users. It leads to the trivial conclusion that if any value is to be created, the installation has to be in place.
6.3 Summarizing the value assessment. How do the customers perceive the value of the service?
The value assessment has given us the following:
• We have seen where the major value potential is found for this product related service by looking at the desired in use consequences related to the service specific features. Woodruff’s (1998) value hierarchy has been operationalized through the laddering method (Reynolds & Gutman, 1988) and the value map presents the most important findings. As of this stage, focus has been on benefits and quantifications have been discussed rather than calculated due to the many assumptions that would have to be made.
• A translation of the industry specific consequences in use to the more general theoretical value drivers (particularly Lapierre (2000)) has been done, starting off with the benefits, in order to understand at a more aggregate level how the service will affect the relationship with the supplier (Husqvarna).
• Though not in focus, service attributes (i.e. not features) that directly will affect the
degree to which the potential value can be realised have been discussed, referring to theoretical value drivers (Lapierre, 2000; Ravald and Grönroos, 1996). These sacrifices cannot be ignored by the supplier, because they are likely to block the realisation of customer goals. We refer back to Woodruff’s (1998) definition of customer value where consequences also may block achieving the goals.
Put together, this has provided an improved understanding of customer perceived value for this product related service that is set for launch. The purpose of the following schematic picture is to convey a vivid understanding of how the interviewed customers perceive value-‐in-‐use, today from both perspectives that have been employed.

Means-‐end value assessment
71
Figure 20. Summarizing value assessment
Value drivers encountered as benefits are defined as those elements that may affect customer value positively whereas the value drivers encountered as sacrifices are elements that may affect customer value negatively. These latter primarily derive from pilot-‐users who have experienced these elements blocking them from realising the desired consequences in use seen in the value map. As opposed to the consequences in use, they are not related to any service specific feature. Rather, they are overall elements that have a negative effect on the value potential seen in the value map. Should a customer invest in HFS, the sacrifices are likely to be elements that block customers from realising value-‐in-‐use. Of course, the nature of value implies that these elements are due to change; a sacrifice may turn into a benefit and vice versa.
Figure 20 depictures the value assessment part. According to Nagle and Hogan (2006) the summary should give a monetary total of the differentiation value. For this study, this is not possible so instead we refer to what Anderson and Narus (1998) calls a value model. Our value model sets the framework for what we argue will be important parameters to investigate in future value assessments. These will have to be carried out in order to get e.g. the monetary estimates of the actual value. The findings however points towards Kindström et al’s (2009:74) argument that monetizing the value is important but not sufficient. The ultimate goals the customers have are in many ways monetary benefits but not all of the consequence that leads to them can be monetized, which means there are several important non quantifiable benefits of the service.
Moreover, looking at the potential monetary benefits seen in the value map, we notice that some parameters (e.g. the number of machines) will have direct effects on what value can be created. It is therefore necessary to distinguish customers by segmentation variables, here called value-‐based because they derive from what the customers think will be the source of value creation. The next chapter will handle just this matter.
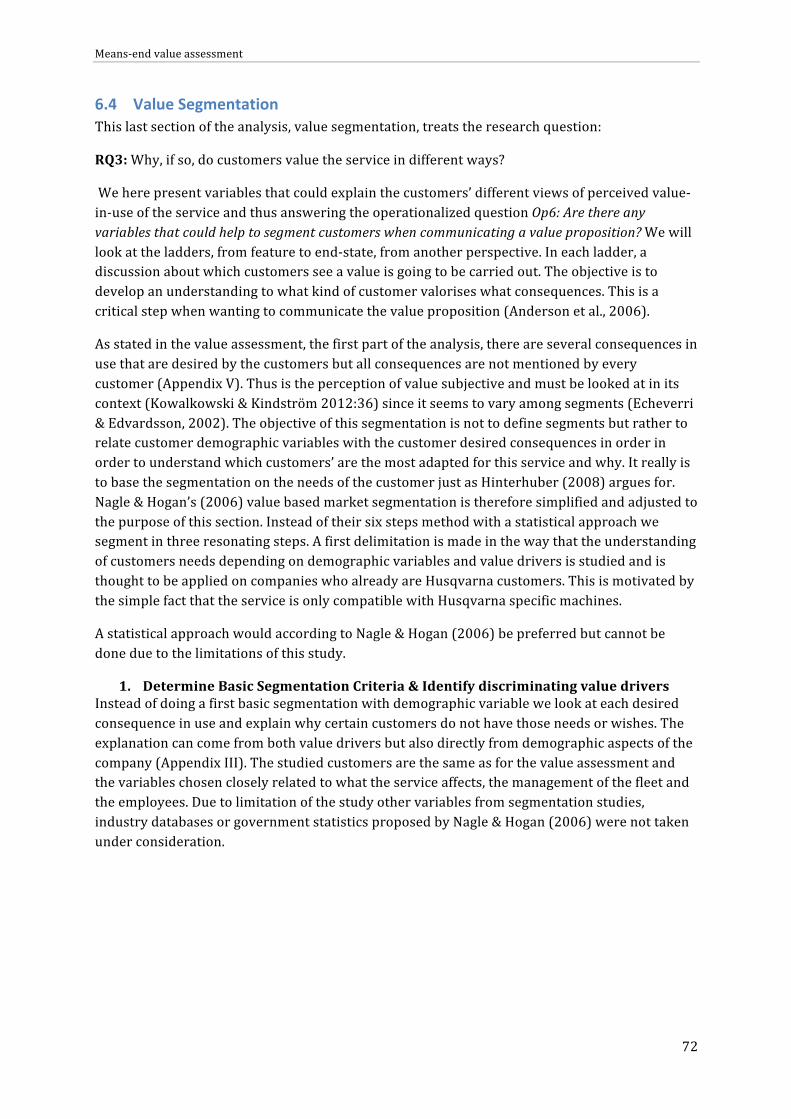
Means-‐end value assessment
72
6.4 Value Segmentation This last section of the analysis, value segmentation, treats the research question:
RQ3: Why, if so, do customers value the service in different ways?
We here present variables that could explain the customers’ different views of perceived value-‐in-‐use of the service and thus answering the operationalized question Op6: Are there any variables that could help to segment customers when communicating a value proposition? We will look at the ladders, from feature to end-‐state, from another perspective. In each ladder, a discussion about which customers see a value is going to be carried out. The objective is to develop an understanding to what kind of customer valorises what consequences. This is a critical step when wanting to communicate the value proposition (Anderson et al., 2006).
As stated in the value assessment, the first part of the analysis, there are several consequences in use that are desired by the customers but all consequences are not mentioned by every customer (Appendix V). Thus is the perception of value subjective and must be looked at in its context (Kowalkowski & Kindström 2012:36) since it seems to vary among segments (Echeverri & Edvardsson, 2002). The objective of this segmentation is not to define segments but rather to relate customer demographic variables with the customer desired consequences in order in order to understand which customers’ are the most adapted for this service and why. It really is to base the segmentation on the needs of the customer just as Hinterhuber (2008) argues for. Nagle & Hogan’s (2006) value based market segmentation is therefore simplified and adjusted to the purpose of this section. Instead of their six steps method with a statistical approach we segment in three resonating steps. A first delimitation is made in the way that the understanding of customers needs depending on demographic variables and value drivers is studied and is thought to be applied on companies who already are Husqvarna customers. This is motivated by the simple fact that the service is only compatible with Husqvarna specific machines.
A statistical approach would according to Nagle & Hogan (2006) be preferred but cannot be done due to the limitations of this study.
1. Determine Basic Segmentation Criteria & Identify discriminating value drivers Instead of doing a first basic segmentation with demographic variable we look at each desired consequence in use and explain why certain customers do not have those needs or wishes. The explanation can come from both value drivers but also directly from demographic aspects of the company (Appendix III). The studied customers are the same as for the value assessment and the variables chosen closely related to what the service affects, the management of the fleet and the employees. Due to limitation of the study other variables from segmentation studies, industry databases or government statistics proposed by Nagle & Hogan (2006) were not taken under consideration.
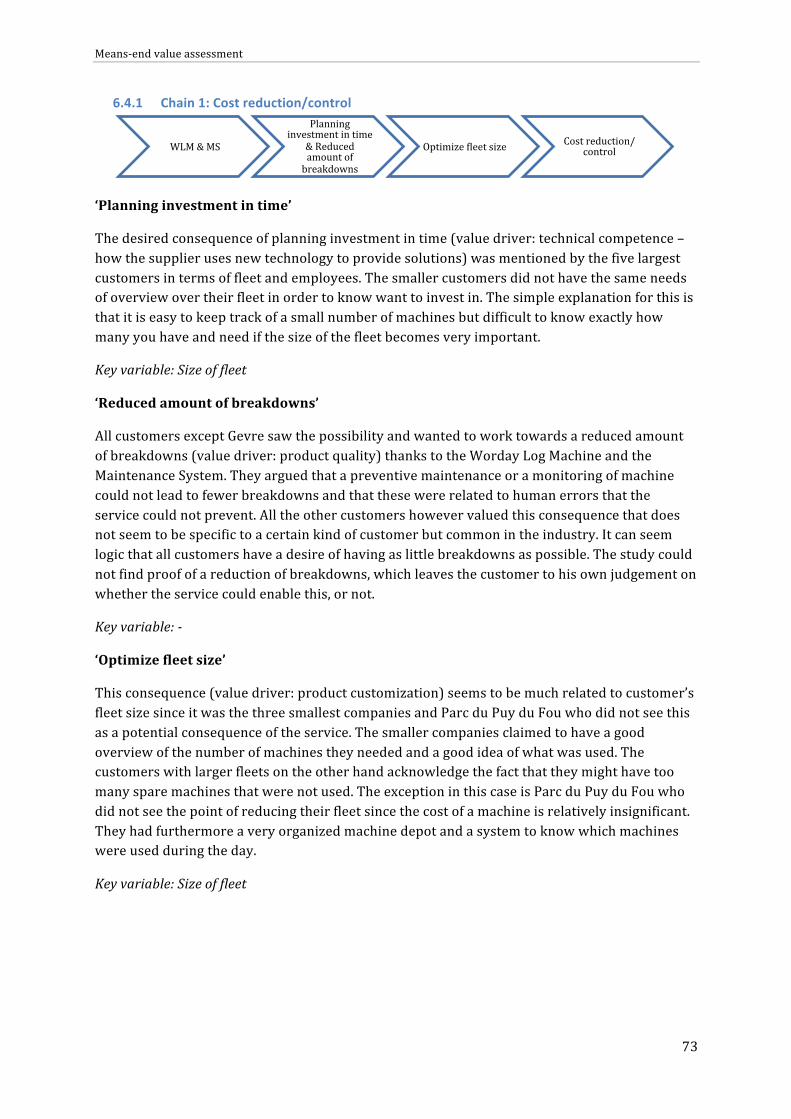
Means-‐end value assessment
73
6.4.1 Chain 1: Cost reduction/control
‘Planning investment in time’
The desired consequence of planning investment in time (value driver: technical competence – how the supplier uses new technology to provide solutions) was mentioned by the five largest customers in terms of fleet and employees. The smaller customers did not have the same needs of overview over their fleet in order to know want to invest in. The simple explanation for this is that it is easy to keep track of a small number of machines but difficult to know exactly how many you have and need if the size of the fleet becomes very important.
Key variable: Size of fleet
‘Reduced amount of breakdowns’
All customers except Gevre saw the possibility and wanted to work towards a reduced amount of breakdowns (value driver: product quality) thanks to the Worday Log Machine and the Maintenance System. They argued that a preventive maintenance or a monitoring of machine could not lead to fewer breakdowns and that these were related to human errors that the service could not prevent. All the other customers however valued this consequence that does not seem to be specific to a certain kind of customer but common in the industry. It can seem logic that all customers have a desire of having as little breakdowns as possible. The study could not find proof of a reduction of breakdowns, which leaves the customer to his own judgement on whether the service could enable this, or not.
Key variable: -‐
‘Optimize fleet size’
This consequence (value driver: product customization) seems to be much related to customer’s fleet size since it was the three smallest companies and Parc du Puy du Fou who did not see this as a potential consequence of the service. The smaller companies claimed to have a good overview of the number of machines they needed and a good idea of what was used. The customers with larger fleets on the other hand acknowledge the fact that they might have too many spare machines that were not used. The exception in this case is Parc du Puy du Fou who did not see the point of reducing their fleet since the cost of a machine is relatively insignificant. They had furthermore a very organized machine depot and a system to know which machines were used during the day.
Key variable: Size of fleet
WLM & MS
Planning investment in time
& Reduced amount of breakdowns
Optimize uleet size Cost reduction/control

Means-‐end value assessment
74
6.4.2 Chain 2: Individualized machine training (no end-‐state)
‘Individualized machine training’
This consequence with the underlying value driver of technical competence of the supplier is appreciated by customers of different size, organizational level and end-‐states. The customers who saw this possibility as a benefit were Sapeurs forêstier, Jaroussi, Parc du Puy du Fou and Svensk Markservice AB. Those are all fairly large companies but not the largest in terms of fleet and employees. Their size prevented the possibility, in contrast to the smaller customers, to supervise or talk to all their employees on how they handled the machines. Parc du Puy du Fou and Svensk Markservice have a great difference in their number of employees during high season and low season and the first of these two customers expressed an issue of their seasonal workers knowledge and experience in machine handling. Jaroussi and Sapeurs Forêstiers did not have the same variation of numbers of employees but experienced that some employees did lack of knowledge of machine handling.
Key variable: Employee experience/knowledge
6.4.3 Chain 3: Productivity & Efficiency 1
‘Reduced amount of breakdowns ‘
(See earlier section)
‘Reduced Downtime’
As discussed earlier is downtime on employees a lot more costly than downtime on machines and that is why most customers have extra machines in case of a machine failure. The pilot user Paysage Assistance was the only customer who saw a possibility and actually had on a couple of occasion prevented downtime thanks to the service. The other customers did not believe in this solution for their downtime related problems and the key variable here seems to be the trust and belief in new technology.
Key variable: Adaptability to new technology
6.4.4 Chain 4: Productivity & Efficiency
MHM Individualized machine training
MS Reduced amount of breakdowns
Reduced downtime
Productivity & Efuiciency
MS & MHM Correct machine selection for the job Productivity & Efuiciency

Means-‐end value assessment
75
‘Correct machine selection for the job’
The customers in favour of using the service as a tool for work planning and knowing which machine should be used where were; Sapeurs Forêstiers, Paysage Assistance, Gevre and Svensk Markservice AB. For the customer Sapeur Forêstier was the reason more of a lack of knowledge of the employees. The three other customers are of varied size but have a relatively high level of organization where taking the wrong machine to the field can be time very time consuming and thus costly. A common aspect for all these customers was willingness to have a strong top management.
Key variable: Level of top management.
6.4.5 Chain 5: no end-‐state
Know-‐How of machine handling’
Mountain Gardening Company, Sapeurs Forêstiers, Jaroussi and Parc du Puy du Fou were the ones who valorised this possible consequence. It is however only related to the instruction videos and thus difficult to find an explanation to why the other customers did not find the idea appealing. One aspect is however the adaptability to new technology and the need of training the employees which is especially important when having a lot of seasonal employees.
Key variable: Adaptability to new technology/ Employee experience/knowledge
6.4.6 Chain 6: Productivity & Efficiency 3
‘Easier access to information’
Three customers with high or medium level of organization strangely as it seems desired an easier access to information about the machines through the library. This might be explained by their wish to be as well organized as possible, which the service help them with. One could also argue that customers with a low organizational level should benefit more of this type of service.
Key variable: Organization level (how structure is the work planning, machine depot, office etc)
(‘Less outsourcing’) & ‘Reduced repair time’
Depending on the customer’s level of outsourcing of their repairs is this consequence more or less important and easy to achieve. Customers that do all their maintenance and repairs in house have an easier obtainable benefit than the customer who let the dealer do everything. This because the later scenario requires a good communication between the customer and the dealer, something that includes more levels of uncertainty.
Key variable: Level of in house repairs/maintenance
LB Know-‐how of machine handling
LB Easier access
to information
Less Outsourcing
Reduced repair time
Productivity & Efuiciency

Means-‐end value assessment
76
6.4.7 Chain 7: Cost reduction/control 2
‘Knowledge of actual job cost ‘
This possible consequence was valorised by two of the smallest but well organized companies in the study. Mountain Gardening Company are relatively new in the industry and have little experience from it which is why they wanted to have a tool that help them to understand and predict the costs of specific jobs. Customers with more experience seem to not have the same problem thanks to their long experience in the industry. Gevre, the other customer who saw this possibility, is a very well organised company. Both customers have a different approach to the management of their business where they emphasize the importance of cost control and breakdown.
Key variable: (Experience in the landscaping industry)/view of costs
2. Description of an adequate customer for the service The hypothesis from Husqvarna sales people, experts and the pre-‐study in this research was that larger companies (expressed in terms of fleet and employees) would be more suited for this type of service. This hypothesis seemed to be correct but added to that are six other parameters that seem critical for the customer to want and succeed in using the service in a good way. If a customer fulfils these requirements and is hence more to the right than to the left in the figure below, should both the economic and non-‐economic benefits be larger and the implementation of the service in the customer’s business be more successful. Those parameters have not been obtained nor tested statistically but can serve as first approach when deciding to whom and how communicate the value proposition of the service. They require a good knowledge and relation to the customer.
Figure 21. The customers of the study explained by the segmentation variables
The service does not directly solve the customers’ problems but they have to actively use it to solve their own problems. This puts a lot of responsibility on the customer and the success of the service in his business, which is why this segmentation or explanation has been done. We
WLM Knowledge of actual job cost
Cost reduction/control
View%of%costs%%
Organiza1on%level%
Adaptability%to%new%technology%
Level%of%in%house%repairs/maintenance%
Level%of%top%management%
Need%of%employee%knowledge%improvement%
Holis1c% Reduc1onism%
Outsource% InChouse%
Low% High%
Slow% Fast%
Low% High%
Low% High%
Size%of%fleet% Small% Large%
11%
11%
11%
11%
11%
11%
11%
11"Mairie"de"Lyon"
Mountain"Gardening"Company"
Paysage"Assisstance"
Sapeurs"Forês;ers"
Jaroussi"
Parc"du"Puy"du"Fou"
Svensk"Markservice"AB"
Gevre"

Means-‐end value assessment
77
conclude it to be critical to address customers who are in need but also ready, having the will and resources, to work with the service in order to reach their goals through their desired in use consequences from the service.

Means-‐end value assessment
78
7 Conclusion – a framework for value communication The objective of this chapter is to give answers to the purpose of the study. It puts the findings presented in the previous chapter in relation to the theoretical framework regarding value communication and ultimately discusses how to construct the value proposition when selling a product related service.
7.1 A conceptual step towards developing a value proposition – what benefits to emphasize
Bearing in mind the points made by Anderson et al., (2006) and Hinterhuber (2008), that the communication of customer value should address customer needs, we argue that the basis for an efficient value communication could be something like the very value map developed in the analysis phase. We again present this figure in order to cast new light on it, this time from a value communication perspective. We start off with a basic scenario; say a customer is in need of ‘Cost Reduction and Control’.
Figure 22. Value Map – highlighted parts to fit customer needs – a conceptual picture
The in use consequences that would be interesting are the four highlighted in the figure and the remaining service features are only two(!) as opposed to eight in the core offering. This idea of keeping the amount of data to a minimum is backed up not only by literature (e.g. Kindström et al., 2012) but by our own empirical findings.
“I want a simple tool where I press a button that gives me an answer on how to improve my business. […] If I am to buy this service I have to be able to see, black on white, what savings can be
done!”
Mountain Gardening Company, Chamonix, 2014
Starting from the top, the customer gets an idea of what could be done with the product related service in order to achieve his/her goal. The service feature (at the bottom) will be less interesting (Anderson et al., 2006; Hinterhuber, 2008) but of course it has to be presented in such a way so that the above stated benefits are credible.

Means-‐end value assessment
79
Another customer says ‘Productivity and Efficiency’, then the right side of the value map is highlighted. This end-‐state driven approach to value potential visualization has been identified as beneficial (Kindström et al., 2012). Wherever there will be quantifiable measures, of course this should be incorporated. In this study, there was little basis for quantification of value-‐in-‐use and such elements can therefore not be presented here.
Figure 23. Value Map – right side highlighted
This is one way to approach the “resonating focus” described by many (Anderson et al., 2006; Hinterhuber, 2008; Kindström et al., 2012). The weakness of this model is that it still presents benefits that may not be appropriate for the particular customer. ‘Optimize fleet size’ for example, is most probably only interesting for customers with an important size of their fleet. The next section will deal with this issue.
7.2 Tailoring the value proposition to fit customer segments – what benefits to emphasize
The findings from the previous chapter (6.4) of the analysis tells us, very much in accordance with literature (e.g. Vargo & Lusch, 2004), that the perceived value of the service differs among customers and that some possible in use consequences might not be interesting at all for some customers. Communication through a “resonating focus” (Anderson et al., 2006) is preferable and thus these different perceptions have to be considered. All findings from the value assessment points towards the direction of resonating focus or as Hinterhuber (2008) calls it, communicating benefits in accordance with customer needs.
In the previous example, customer needs were respected in the sense that the service’s potential performance that could help realising the goals of interest was highlighted. Even better would be to include customer segment variables that modify the outcome of this tree-‐look value visualisation. We present a conceptual idea of how key segmentation variables will influence the emphasis on certain benefits. This is not to be regarded as a definitive truth; rather it tells us that depending on customer characteristics, certain benefits will be more probable to apply to customer needs.
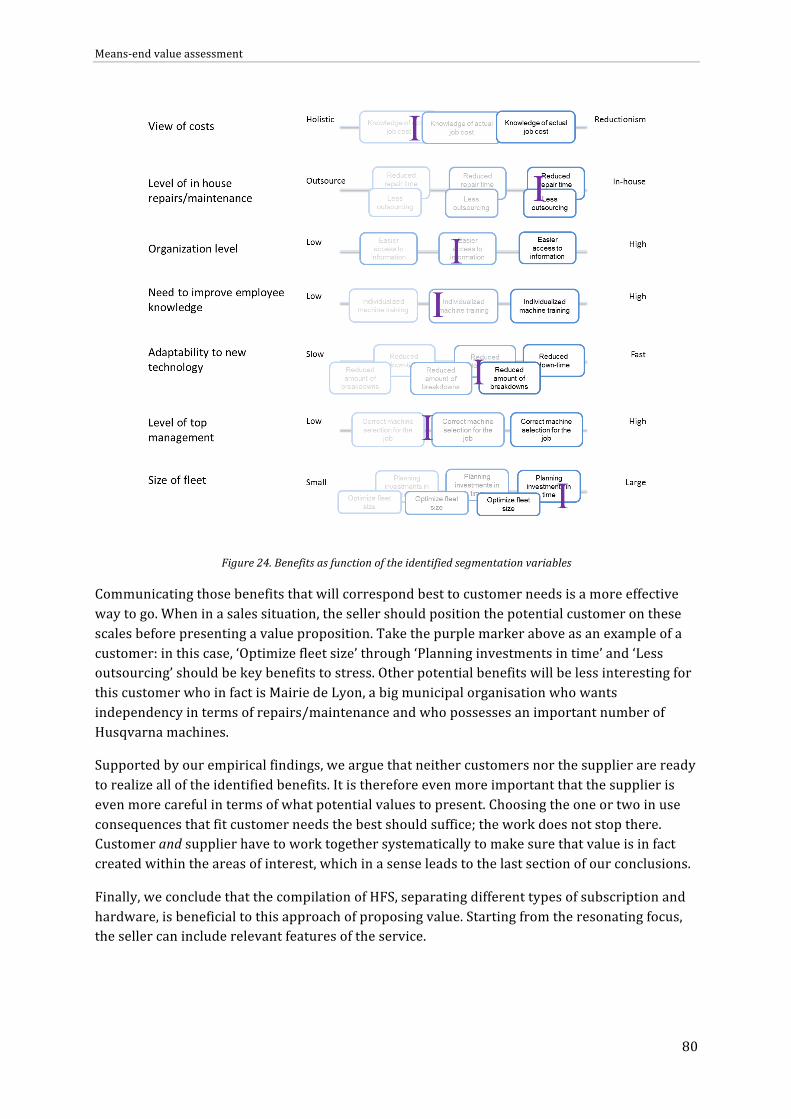
Means-‐end value assessment
80
Figure 24. Benefits as function of the identified segmentation variables
Communicating those benefits that will correspond best to customer needs is a more effective way to go. When in a sales situation, the seller should position the potential customer on these scales before presenting a value proposition. Take the purple marker above as an example of a customer: in this case, ‘Optimize fleet size’ through ‘Planning investments in time’ and ‘Less outsourcing’ should be key benefits to stress. Other potential benefits will be less interesting for this customer who in fact is Mairie de Lyon, a big municipal organisation who wants independency in terms of repairs/maintenance and who possesses an important number of Husqvarna machines.
Supported by our empirical findings, we argue that neither customers nor the supplier are ready to realize all of the identified benefits. It is therefore even more important that the supplier is even more careful in terms of what potential values to present. Choosing the one or two in use consequences that fit customer needs the best should suffice; the work does not stop there. Customer and supplier have to work together systematically to make sure that value is in fact created within the areas of interest, which in a sense leads to the last section of our conclusions.
Finally, we conclude that the compilation of HFS, separating different types of subscription and hardware, is beneficial to this approach of proposing value. Starting from the resonating focus, the seller can include relevant features of the service.

Means-‐end value assessment
81
7.3 Need for tangibilizing the value proposition – how to communicate the benefits
If the previous sections emphasized what values to communicate, this section will introduce the question of how to communicate them.
Finding the relevant benefits does not mean that they are easy to communicate. Literature tells us that managers don’t care about utiles (Anderson and Narus, 1998), that marketers are required to overcome the intangibility of service offerings (Hill et al., 2004) and that the quantification and communication of value is one of the most critical capabilities of sales teams (Kindstöm, Kowalkowski & Nordin, 2009:85). Husqvarna experts, customers and dealers emphasised the need of some sort of visualisation of the potential value of the service in monetary terms. The customers however saw many non-‐quantifiable benefits with the service but wanted proof to how the service could improve their business. Pilot users have not created any substantial value from using the service. Having this said, we conclude that there is a great need of tangibilization in the communication of the service since. This study has not compared any tangibilization strategies, but it has found what the most relevant benefits are. Depending on the nature of the benefit, it will be easier or more difficult to quantify. As of this moment, one could say that all identified benefits are intangible because there are no real-‐life examples yet. Some seem easier to attach to hard facts e.g. ‘Reduced downtime’, some seem harder e.g. ‘Correct machine selection for the job’. We take a look on what Kindström et al (2009:84) found most successful during the sales and delivery stage of the NSD cycle.
Table 20. Reworked from Kowalkowski and Kindström (2012) with the customers’ wishes and needs
The appropriate way of communicating in this context cannot be validated since no comparison between the effectiveness of different tools has been made. We can however make the conclusion that there is a need to both elaborate a communication strategy for the sales phase, which this study lays a framework for, and one for the delivery phase.
Stage “Best practice” method Wanted by customer in this study
Sales
Simulations (revenue, costs), virtual reality demonstrators, case histories
Yes
Delivery
Reports, productivity statistics, comparisons, service plans/booklets
Yes

Means-‐end value assessment
82
8 Managerial implications In this chapter we conduct a discussion about the managerial implication of our conclusions for the case company. We give some recommendations and raise a few questions that we think are critical for their transition towards becoming service providers.
Because of the complexity of the service and that only it’s related potential value has been identified as of today, a sales tool like a value calculator with realistic measures is something very difficult to obtain. In order to develop an accurate value calculator there is a clear need of doing a thorough value assessment of at least one customer to validate what consequence in use of the service actually are possible. This step of validating the value pool is also the last step of Anderson’s and Narus’ (1998) value assessment process. When it is done, the supplier’s sales force has a business case to present to the potential customers, which could persuade them of the benefits of the service. Furthermore, realised economic benefits can then be quantified and validated in order to build up a framework for a value calculator. Because of the great number of desired in use consequences and their close relation to the specific customer’s context it is difficult to develop a generic model that includes every possible benefit. We therefore recommend to build up the value calculator using the most desired consequences in use found in this study and relate them to the segmentation variables and customer specific parameters needed for the quantification of the economic benefits. This will adjust the offer to the specific customers. A great understanding of the customer’s business, problems and goals is going to be needed in order to successfully communicate the correct values to the customer. In the meantime it is suggested that the value map is used as a basis for value communication
We remind that this study has focused on the third stage, Sales, according to Kindström and Kowalkowski’s (2009) NSD framework. In this sales stage the objective is to be able to communicate the value of the offering to the customer. However, although having looked at the perceived value-‐in-‐use of the service, we are well understood that the value we have investigated is value potentially created in the delivery phase, or even after. The pilot-‐users made it clear that even though there is potential value-‐in-‐use, the delivery will be as important (if not more important). They told us that actually realising those benefits is much more difficult. All pilot users expressed a great lack of training, follow-‐up and evaluation after the installation of the service. In other words, communicating potential value will not be enough to gain the customer’s trust and increase competitiveness. This first version of the fleet service has not yet been proven to realise any substantial value in the customers’ business and we therefore see the NSD framework to be an iterative process when selling services. The supplier, in this case Husqvarna, should repetitively go through each step in order to adjust their offering. This also means, as stated earlier, doing a more thorough value assessment of the service. A close relation must precede this with the customer, where the supplier and customer co-‐create the value together. When done successfully, a quantification of some benefits can then be made and used as help when developing sales tool and arguments to communicate the value of the service to new customers.
Figure 25. Four-‐stage NSD framework
Stage 1: Market sensing
Stage 2: Developm
ent
Stage 3: Sales
Stage 4: Delivery

Means-‐end value assessment
83
Two key points are made before raising some question:
• The potential value communication is difficult to do since it varies a lot among customers. • More importantly is the delivery stage with an on-‐going evaluation and when need,
training, critical for the customers’ ability to get any value-‐in-‐use. This means a close relationship between supplier and customer, something Kowalkowski and Kindström (2012:39-‐41) names co-‐creation of value.
This raises the question of how far Husqvarna, the supplier, are willing to go towards becoming true service providers and what the dealers’ role should be. If wanting to go all the way and helping the customers improving their business, there is an opportunity to, in the future, also take on a value-‐based pricing model (Appendix VIII). Note that helping the customers to achieve their perceived value-‐in-‐use of the service seems critical according to the findings of this study. If wanting to take the step towards value based pricing shows us that there are 5 main obstacles to overcome, see figure below.
Figure 26. Obstacles to the implementation of value-‐based pricing strategies
The study has as stated focused on the value assessment, segmentation and value communication. We can here see that these are critical (Hinterhuber 2008) steps when wanting to move towards value based pricing but they are also critical when just wanting to sell a service. Top management support and sales forces management have not been regarded but there will be a great responsibility on the sales force or dealers (sales force training will most probably be needed) depending on which part is going to communicate and help the customer to realise the value of the service. If adopting a value-‐based pricing strategy, it is, as stated in Appendix VIII, important to keep in mind that even if the potential savings thanks to the service are major, the supplier cannot take an unreasonable price for the service. They must consider what is appropriate in the situation. A guideline in this case would be the actual cost of a machine but also the customers’ willingness to pay (Appendix IX). The view of value-‐based pricing can however be discussed. Our view is that when selling services, the supplier must take on a similar view as when adopting value based pricing, even if the pricing strategy is not coherent with the communication strategy. The point is to understand the customers’ need and how the service can create value-‐in-‐use for the customer.

Means-‐end value assessment
84
9 Discussion and theoretical implications This chapter discusses areas that have not fit within the scope of the study but that the authors want to address.
We recognize in this case study three of four proposed offering specifics (Kindström et al., 2009:87) that influence the need for tangibilization in the value communication. Comments are made to each.
1. The complexity of the offering. The findings of what and how the service can affect the customers’ business leads us to the conclusion that the offering of the product-‐related service is very complex. There are relational, technical, managerial, logistic and many more aspects that have to be in place in order for the service to bring any value to the customer.
2. Whether the offering is new to the market. Since there is nothing similar on the market, the customers have problems to know how to use the service and to some extent they question why they should use it at all.
3. The degree intangibility of the offering. The interviewed customers were very product oriented and wanted to have high quality machines that did not break down. A management tool like the fleet service has in comparison to the customers’ machines a very high level of intangibility.
We have seen that these offering specifics make it difficult to both assess value-‐in-‐use and communicate it as a value proposition. The thesis gives a deeper understanding of the importance but also difficulties of assessing the value of a new service and how to use customer specific variables in order to adjust the value proposition. We also want to emphasize the importance of an iterative usage of the NSD framework when a supplier wants to become a true service provider.
Going through the value literature, we have noticed that there is room for consolidation of the value concepts. One way to go, as tried out in this study, is from an operational concept such as the value hierarchy to the more generic way of describing value; e.g. by value drivers. We present this as an interesting opening for future studies and the following section will give a background to the encountered problem.
Vargo and Lusch (2004) presented their new logic, the “service logic” which emphasises the need to co-‐produce value by understanding customer needs and support the customers in their value creating processes. We argue that this harmonise with the view of Woodruff (1997) who suggest that in addition to product and service attributes, one must understand the in use situation of the offering to capture the essence of customer value. He further compares different definitions of value and states that operationally, when applied in customer research, the value is measured from a narrow point of view, only considering attributes that influence purchase, thus neglecting the in use situation. Taking the in use perspective, or service logic perspective, means that there will naturally be intangible elements that are difficult to measure. Now, in the value assessment literature (e.g. Hinterhuber, 2004), we argue this gives rise to a number of conflicting ideas. The whole point of value assessment is to measure the value. Although it is suggested that value-‐in-‐use can be used in order to estimate the value of an offering (Hinterhuber, 2008) focus seems to be on monetary elements. Conjoint analysis has been

Means-‐end value assessment
85
proposed (e.g. Anderson & Narus, 1998) as a means to quantify intangibles, but it originates in product/service attributes which means that the in use perspective is lost.
We argue that without taking the in use perspective when “assessing” customer value, important elements can be lost. Partially quantifying the value-‐in-‐use might be necessary to develop value propositions, but striving only for quantification is dangerous; it might mean that useful customer perspective is lost. Starting from an operational model, such as the value hierarchy, and then finding corresponding value drivers in terms of benefits and sacrifices, might be a way to get a broader picture. Imagine this: some consequences in use may be very important to the customer but impossible to quantify. These are further identified as being part of the same value driver, say Product Customization (Lapierre, 2000). If we started by assessing the value based on attributes, these value elements would be neglected, and the set of value drivers affecting customer value would be fairly wrong.

Means-‐end value assessment
86
References
Anderson, J. C., Jain, D. C., & Chintagunta, P. K. (1992). Customer value assessment in business markets: Journal of Business-‐to-‐Business Marketing, vol. 1(1), ss. 3-‐29.
Anderson, J. C., & Narus, J. A. (1998). Business marketing: Understand what customers value. Harvard Business Review, vol. 76(6), ss. 53-‐65.
Arbnor, I. & Bjerke, B. (2009). Methodology for creating business knowledge / ingeman arbnor & björn bjerke Thousand Oaks, Calif. : Sage, cop. 2009; 3. ed.
Blocker, C. P. Modeling customer value perceptions in cross-‐cultural business markets. Journal of Business Research, vol. 64, ss. 533-‐540.
Brown, S. W., Gustafsson, A. & Witell, L. (2009). “Beyond products,”.: Wall Street Journal. http://online.wsj.com/article/SB10001424052970204830304574131273123644620.html
Dubois, A., & Gadde, L. -‐. (2002). Systematic combining: An abductive approach to case research. Journal of Business Research, vol. 55(7), ss. 553-‐560.
Echeverri, P. & Edvardsson, B. (2002). Marknadsföring i tjänsteekonomin / per echeverri, bo edvardsson Lund : Studentlitteratur, 2002 (Danmark).
EISENHARDT, K. M., & GRAEBNER, M. E. (2007). Theory building from cases: Opportunities and challenges. Academy of Management Journal, vol. 50(1), ss. 25-‐32.
Flint, D. J., Woodruff, R. B., & Gardial, S. F. (1997). Customer value change in industrial marketing relationships: A call for new strategies and research. Industrial Marketing Management, vol. 26(2), ss. 163-‐175.
Grönroos, C. (2008). Service logic revisited: Who creates value? and who co-‐creates? European Business Review, vol. 20(4), ss. 298-‐314.
Grönroos, C. et al. (2008). Service management och marknadsföring : Kundorienterat ledarskap i servicekonkurrensen / christian grönroos ; [översättning: Anna holmqvist ; fackgranskning: Jan E persson ; illustrationer: Lars gylldorff] Malmö : Liber, 2008 (Slovenien); 2. uppl.
Grundström, C. (2013). Kandidatexamensarbete -‐ en skrivguide<br />. Linköpings Universitet: IEI Industriell Marknadsföring.
Hinterhuber, A. (2008). Customer value-‐based pricing strategies: Why companies resist. Journal of Business Strategy, vol. 29(4), ss. 41-‐50.
Hinterhuber, A. (2004a). Towards value-‐based pricing—An integrative framework for decision making. Industrial Marketing Management, vol. 33(8), ss. 765-‐778.
Hinterhuber, A. (2004b). Towards value-‐based pricing-‐-‐an integrative framework for decision making. Industrial Marketing Management, vol. 33(8), ss. 765-‐778.
Kindström, D. et al. (2009). Creating business out of industrial offerings: Findings from market leading B2B companies

Means-‐end value assessment
87
Kindström, D., & Kowalkowski, C. (2009). Development of industrial service offerings: A process framework. Journal of Service Management, vol. 20(2), ss. 156-‐172.
Kowalkowski, C. (2011). Dynamics of value propositions: Insights from service-‐dominant logic. Emeral Journal of Marketing, vol. 45(1/2), ss. 277-‐278-‐294.
Kowalkowski, C. & Kindström, D. (2012). Tjänster och helhetslösningar : Nya affärsmodeller för konkurrenskraft. 1. uppl. uppl. Malmö: Liber.
Kvale, S. et al. (2009). Den kvalitativa forskningsintervjun / steinar kvale, svend brinkmann ; översättning: Sven-‐erik torhell Lund : Studentlitteratur, 2009 (Ungern); 2. uppl.
Lapierre, J. (2000). Customer-‐perceived value in industrial contexts. Journal of Business and Industrial Marketing, vol. 15(2-‐3), ss. 122-‐140.
Lekvall, P. et al. (2001). Information för marknadsföringsbeslut / per lekvall, clas wahlbin Göteborg : IHM Publ., 2001 ; (Göteborg : Högsbo grafiska); 4., omarb.] uppl. sic] / med bidrag av Per Frankelius.
Lipovetsky, S., Magnan, S., & Andrea, Z. P. (2011). Pricing models in marketing research. Tillgänglig: http://search.ebscohost.com/login.aspx?direct=true&db=edsarl&AN=edsarl.21508194.201109.201210220114.201210220114.167.174&site=eds-‐live.
Merkel, M., Andersson, U., & Önnegren, B. (2011). Lathund för rapportskrivning. Linköping: Linköpings Universitet.
Nagle, T. T. & Hogan, J. E.,Ph.D. (2006). The strategy and tactics of pricing : A guide to growing more profitably / thomas T. nagle, john E. hogan Upper Saddle River, N.J. : Pearson/Prentice Hall, 2006; 4th ed.
Olivia, R., & Kallenberg, R. (2003). Managing the transition from products to services. International Journal of Service, vol. 14(2), ss. 160-‐172.
Raddats, C., & Easingwood, C. (2010). Services growth options for B2B product-‐centric businesses. Industrial Marketing Management, vol. 39(8), ss. 1334-‐1345.
Ramsay, J. (2005). The real meaning of value in trading relationships. International Journal of Operations & Production Management, vol. 25(6), ss. 549-‐565.
Ravald, A., & Grönroos, C. (1996). The value concept and relationship marketing. European Journal of Marketing, vol. 30(2), ss. 19-‐30.
Reinartz, W., & Ulaga, W. (2008). How to sell services MORE profitably. Harvard Business Review, vol. 86(5), ss. 90-‐96.
Reynolds, T. J., & Gutman, J. (1988). Laddering theory, method, analysis, and interpretation. Journal of Advertising Research, vol. 28(1), ss. 11-‐31.
Sharma, A., & Sheth, J. N. (1997). Relationship marketing: An agenda for inquiry. Industrial Marketing Management, vol. 26(2), ss. 87-‐89.

Means-‐end value assessment
88
Ulaga, W., & Chacour, S. (2001). Measuring customer-‐perceived value in business markets: A prerequisite for marketing strategy development and implementation. Industrial Marketing Management, vol. 30(6), ss. 525-‐540.
Ulaga, W., & Eggert, A. (2006). Value-‐based differentiation in business relationships: Gaining and sustaining key supplier status. Journal of Marketing, vol. 70(1), ss. 119-‐136.
van Raaij, W. F., & Verhallen, T. M. M. (1994). Domain-‐specific market segmentation. European Journal of Marketing, vol. 28(10), ss. 49-‐66.
Vargo, S. L., & Lusch, R. F. (2004). Evolving to a new dominant logic for marketing. Journal of Marketing, vol. 68(1), ss. 1-‐17.
Verhallen, T. M. M., Frambach, R. T., & Prabhu, J. (1998). Strategy-‐based segmentation of industrial markets. Industrial Marketing Management, vol. 27(4), ss. 305-‐313.
Walter, A., Ritter, T., & Gemünden, H. G. (2001). Value creation in Buyer–Seller relationships: Theoretical considerations and empirical results from a supplier's perspective. Industrial Marketing Management, vol. 30(4), ss. 365-‐377.
Weick, K. E. (1979). The social psychology of organizing.
Woodruff, R. B. (1997). Customer value: The next source for competitive advantage. Journal of the Academy of Marketing Science, vol. 25(2), ss. 139.
Yin, R. K. (2009). Case study research : Design and methods / robert K. yin London : SAGE, cop. 2009; 4. ed.
Yin, R. K. & Retzlaff, J. (2013). Kvalitativ forskning från start till mål / robert K. yin ; översättning: Joachim retzlaff, svensk bearbetning: Björn östbring Lund : Studentlitteratur, 2013 (Spanien).
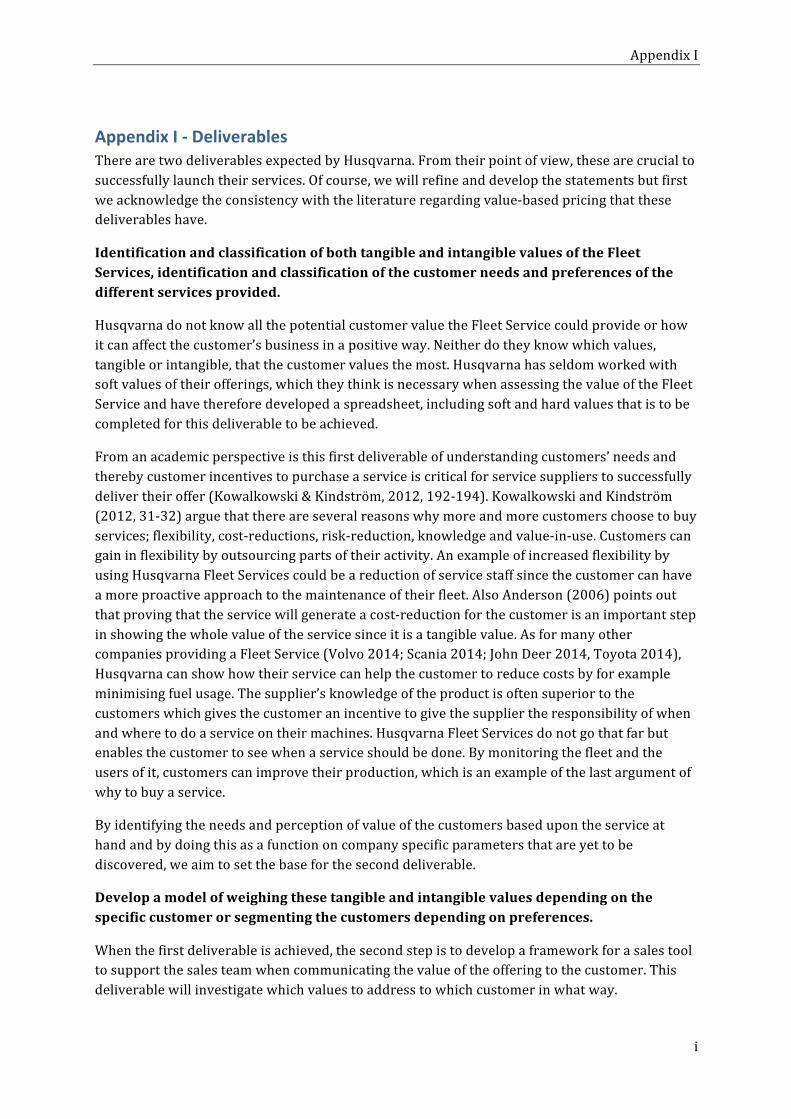
Appendix I
i
Appendix I -‐ Deliverables There are two deliverables expected by Husqvarna. From their point of view, these are crucial to successfully launch their services. Of course, we will refine and develop the statements but first we acknowledge the consistency with the literature regarding value-‐based pricing that these deliverables have.
Identification and classification of both tangible and intangible values of the Fleet Services, identification and classification of the customer needs and preferences of the different services provided.
Husqvarna do not know all the potential customer value the Fleet Service could provide or how it can affect the customer’s business in a positive way. Neither do they know which values, tangible or intangible, that the customer values the most. Husqvarna has seldom worked with soft values of their offerings, which they think is necessary when assessing the value of the Fleet Service and have therefore developed a spreadsheet, including soft and hard values that is to be completed for this deliverable to be achieved.
From an academic perspective is this first deliverable of understanding customers’ needs and thereby customer incentives to purchase a service is critical for service suppliers to successfully deliver their offer (Kowalkowski & Kindström, 2012, 192-‐194). Kowalkowski and Kindström (2012, 31-‐32) argue that there are several reasons why more and more customers choose to buy services; flexibility, cost-‐reductions, risk-‐reduction, knowledge and value-‐in-‐use. Customers can gain in flexibility by outsourcing parts of their activity. An example of increased flexibility by using Husqvarna Fleet Services could be a reduction of service staff since the customer can have a more proactive approach to the maintenance of their fleet. Also Anderson (2006) points out that proving that the service will generate a cost-‐reduction for the customer is an important step in showing the whole value of the service since it is a tangible value. As for many other companies providing a Fleet Service (Volvo 2014; Scania 2014; John Deer 2014, Toyota 2014), Husqvarna can show how their service can help the customer to reduce costs by for example minimising fuel usage. The supplier’s knowledge of the product is often superior to the customers which gives the customer an incentive to give the supplier the responsibility of when and where to do a service on their machines. Husqvarna Fleet Services do not go that far but enables the customer to see when a service should be done. By monitoring the fleet and the users of it, customers can improve their production, which is an example of the last argument of why to buy a service.
By identifying the needs and perception of value of the customers based upon the service at hand and by doing this as a function on company specific parameters that are yet to be discovered, we aim to set the base for the second deliverable.
Develop a model of weighing these tangible and intangible values depending on the specific customer or segmenting the customers depending on preferences.
When the first deliverable is achieved, the second step is to develop a framework for a sales tool to support the sales team when communicating the value of the offering to the customer. This deliverable will investigate which values to address to which customer in what way.

Appendix I
ii
Anderson (2006) gives different examples of how successful companies communicates the value of their specific services and how it is different and better then the second best alternative on the market. Rockwell Automation for example uses Value Word Equations to substantiate customer value. It consists of a simple equation expressed in words with some mathematical operators. The result gives the customer a tangible value, for example cost-‐reduction. Another way of demonstrating how the service will reduce costs or add value for the customer is to use value case histories. The aim of this second deliverable is to provide Husqvarna with the framework for a third alternative, a tool similar to what Anderson (2006) refers to as a Value Calculator which typically is some sort of spread sheet software application. Salespeople of SKF USA when demonstrating the probable value that the customer would receive from the service have successfully used this. The difficulty here lies in whether the sales force when demonstrating the value added should weigh the intangible/tangible values and how they can segment customers with the same needs and preferences since intangible values might be difficult to weigh and incorporate in classical investment calculation such as a Return on Investment (ROI).
Shortly speaking, the challenge is firstly to identify all possible perceived advantages of the service, secondly to see if a segmentation of the customers can be done.

Appendix II
iii
Appendix II -‐ Consequences to value drivers (explanations/hypothetical cost savings)
Desired consequences in use = benefits
Theoretical value driver (Lapierre, 2000)
Category
Individualised machine handling training
Reliability -‐ the overall competence of employees
Service related
Know-‐how of machines handling
Reliability -‐ the overall competence of employees
Service related
Easier access to information
Responsiveness Service related
Correct machine selection for the job
Reliability -‐ the ability to do the things right the first time
Service related
Improve team productivity
Reliability -‐ the overall competence of employees
Service related
Reduced repair time Technical competence -‐ system solutions
Service related
Knowledge of actual job cost
Technical competence -‐ demonstrate comprehensive process knowledge of your products
Service related
Less process time at dealer
Flexibility Service related
Reduced amount of breakdowns
Product Quality -‐ The reliability/durability of the products
Product related
Optimize the fleet size Product Customization -‐ Product related Optimize the fleet characteristics/variety
Alternative solutions -‐ helpfulness in solving problems
Product related
Fuel reduction Product Quality -‐ performance of the products
Product related
Reduced Downtime Product Quality -‐ The reliability/durability of the products
Product related
Increase machine value Product Quality -‐ The reliability/durability of the products
Product related
Planning investments of spare parts
Alternative solutions -‐ helpfulness in solving problems
Product related
Less outsourcing -‐ -‐ Planning investment in time
-‐ -‐
Improve employer-‐employee relation
-‐ -‐
Work rotation -‐ -‐ Control over working conditions
-‐ -‐
Monitor misusage of machine
-‐ -‐
Homogenuous utilization of the fleet
-‐ -‐

Appendix II
iv
Hypothetical cost savings (issued from the ladders in 6.1)
‘Knowledge of actual job cost’
Example: Suppose following:
• Work X takes 5 working days for 3 employees. • Labour cost: 30 euros / hour • 1 working day: 8 hrs
Labour cost: 5*8 hrs*3 employees*30 euros = 3600 euros
The customer does not know this and plans the work to take 4 days of work with 3 employees and sets the price thereafter.
Labour costs: 4*8 hrs*3 employees*30 euros = 2880 euros
The customer endures an unexpected cost of: 3600-‐2880 = 720 euros
‘Reduced amount of breakdowns’
The direct economic benefits of fewer repairs are less labour cost and less spare part costs. The customers could not quantify the cost of their spare parts regarding their handheld machines and they also had troubles knowing how much time they actually spent on repairing machines. Two customers had however an idea of what the cost of their repairs were.
1. Gevres: 12500 € over 3 years (≈ 4166 € per year) a. Includes spare part costs + labour cost
2. Jaroussie: 18 720 € per year a. Only labour costs: one employee working 3 days a week with the handheld
machines during high season
A potential reduction of the breakdowns with 50% would mean a cost reduction of 6 respectively 9 thousands € for the customers in the example. This 50% decrease is hypothetical but based on the respective customer’s estimate of the causes of breakdowns.
0 € 2 000 € 4 000 € 6 000 € 8 000 € 10 000 € 12 000 € 14 000 € 16 000 € 18 000 € 20 000 €
Total cost of repairs Total cost of repairs with Fleet Service
Gevres
Jaroussi
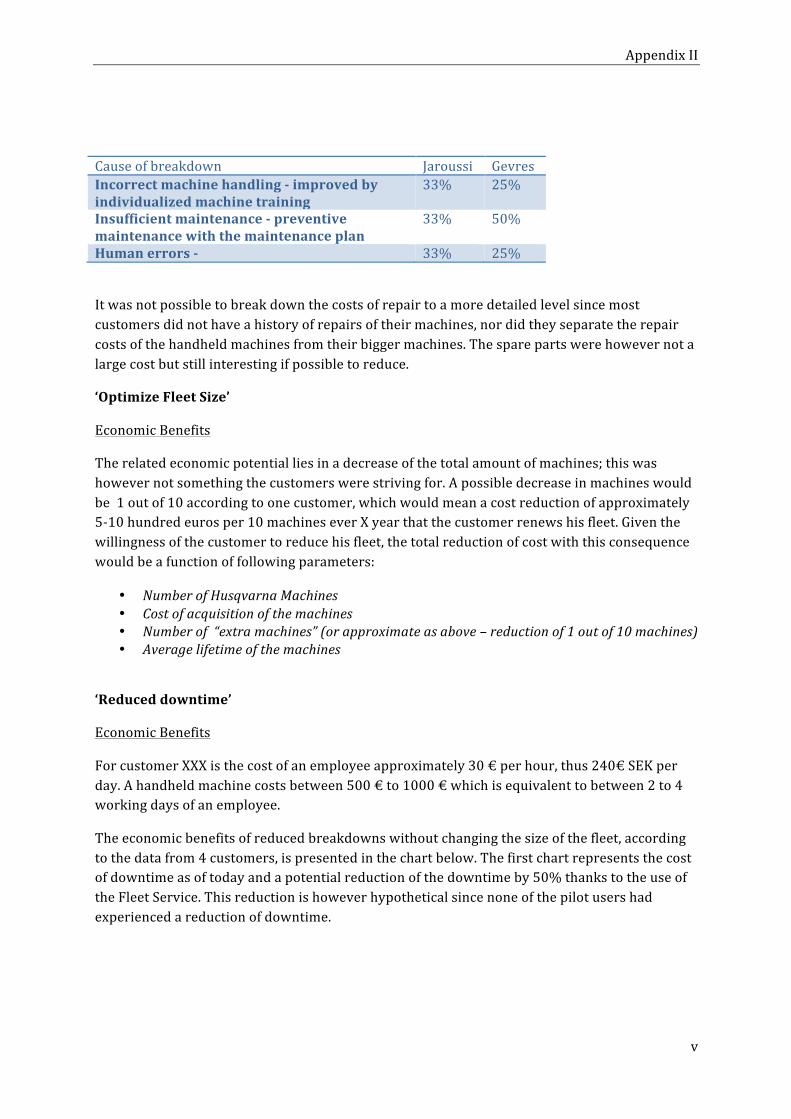
Appendix II
v
Cause of breakdown Jaroussi Gevres Incorrect machine handling -‐ improved by individualized machine training
33% 25%
Insufficient maintenance -‐ preventive maintenance with the maintenance plan
33% 50%
Human errors -‐ 33% 25%
It was not possible to break down the costs of repair to a more detailed level since most customers did not have a history of repairs of their machines, nor did they separate the repair costs of the handheld machines from their bigger machines. The spare parts were however not a large cost but still interesting if possible to reduce.
‘Optimize Fleet Size’
Economic Benefits
The related economic potential lies in a decrease of the total amount of machines; this was however not something the customers were striving for. A possible decrease in machines would be 1 out of 10 according to one customer, which would mean a cost reduction of approximately 5-‐10 hundred euros per 10 machines ever X year that the customer renews his fleet. Given the willingness of the customer to reduce his fleet, the total reduction of cost with this consequence would be a function of following parameters:
• Number of Husqvarna Machines • Cost of acquisition of the machines • Number of “extra machines” (or approximate as above – reduction of 1 out of 10 machines) • Average lifetime of the machines
‘Reduced downtime’
Economic Benefits
For customer XXX is the cost of an employee approximately 30 € per hour, thus 240€ SEK per day. A handheld machine costs between 500 € to 1000 € which is equivalent to between 2 to 4 working days of an employee.
The economic benefits of reduced breakdowns without changing the size of the fleet, according to the data from 4 customers, is presented in the chart below. The first chart represents the cost of downtime as of today and a potential reduction of the downtime by 50% thanks to the use of the Fleet Service. This reduction is however hypothetical since none of the pilot users had experienced a reduction of downtime.
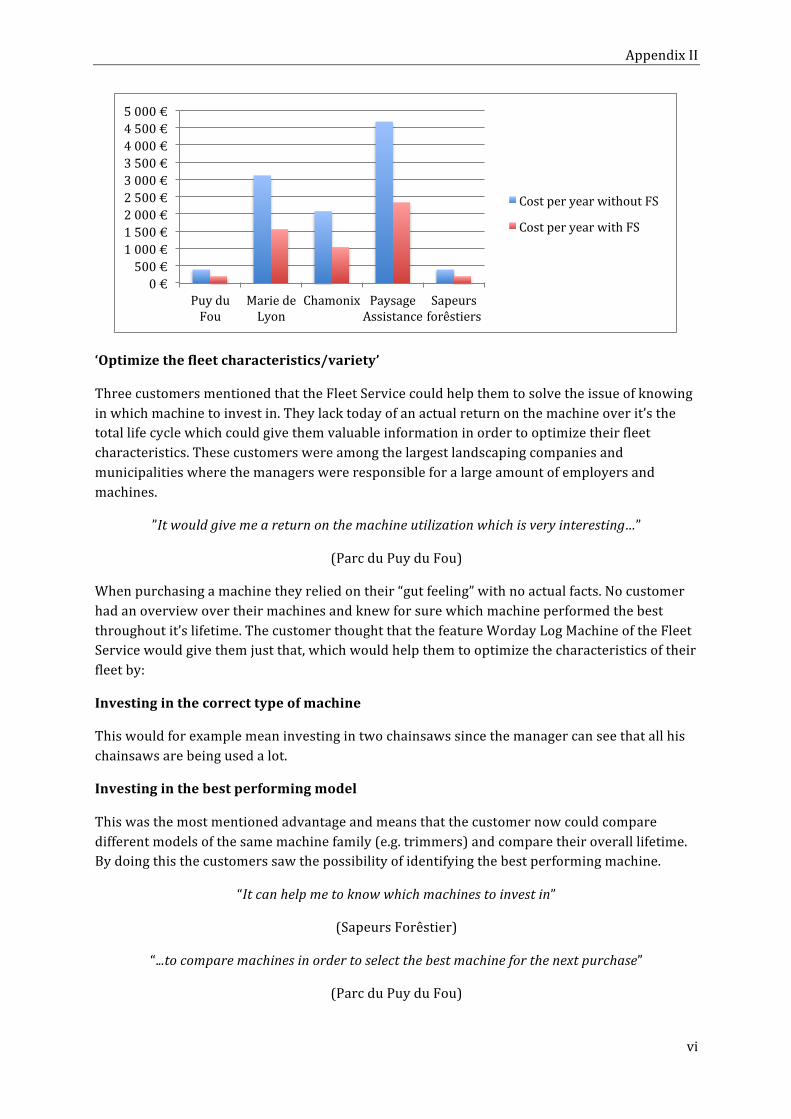
Appendix II
vi
‘Optimize the fleet characteristics/variety’
Three customers mentioned that the Fleet Service could help them to solve the issue of knowing in which machine to invest in. They lack today of an actual return on the machine over it’s the total life cycle which could give them valuable information in order to optimize their fleet characteristics. These customers were among the largest landscaping companies and municipalities where the managers were responsible for a large amount of employers and machines.
”It would give me a return on the machine utilization which is very interesting…”
(Parc du Puy du Fou)
When purchasing a machine they relied on their “gut feeling” with no actual facts. No customer had an overview over their machines and knew for sure which machine performed the best throughout it’s lifetime. The customer thought that the feature Worday Log Machine of the Fleet Service would give them just that, which would help them to optimize the characteristics of their fleet by:
Investing in the correct type of machine
This would for example mean investing in two chainsaws since the manager can see that all his chainsaws are being used a lot.
Investing in the best performing model
This was the most mentioned advantage and means that the customer now could compare different models of the same machine family (e.g. trimmers) and compare their overall lifetime. By doing this the customers saw the possibility of identifying the best performing machine.
“It can help me to know which machines to invest in”
(Sapeurs Forêstier)
“...to compare machines in order to select the best machine for the next purchase”
(Parc du Puy du Fou)
0 € 500 € 1 000 € 1 500 € 2 000 € 2 500 € 3 000 € 3 500 € 4 000 € 4 500 € 5 000 €
Puy du Fou
Marie de Lyon
Chamonix Paysage Assistance
Sapeurs forêstiers
Cost per year without FS
Cost per year with FS

Appendix II
vii
“...knowing which machines to invest in”
(Marie de Lyon)
All customers saw a direct link between having the best machine possible and the productivity and efficiency of the work on the field which also was one of the most mentioned end-‐states the customers had.
Economic Benefits
This potentially improved productivity has however neither been realized by the pilot-‐users nor could the potential customer give an estimated of it. Since the problems related to having the incorrect machine differ a lot among customer, an economical benefit cannot be quantified economically at this stage. A calculation for a potential saving would however need following parameters:
• Time with machine A to do work X = W1 • Time with machine B to do work X =W2 • Labour cost per hour (approximately 30 €/hour)
The saving lies in the difference between W1*30€ and W2*30€.
Non-‐economic benefits
The non-‐economic benefits of this consequence is: • Peace of mind when investing in new machines. The decisions are not made on ”gut
feeling” but on hard facts. Consequences in use not explained in 6.1
'Homogenous fleet utilization ‘
The Workday Log Machine could according to three customers help them plan a homogenous utilization of their fleet. For two of these three customers was this something important and especially for one of them who tried to renew his entire fleet of handheld machines approximately every third year. By monitoring the utilization of the machine he could make sure that every machine of the same type was used the same amount of time, which hopefully would mean that all machines would need to be replaced around the same time. This would help him in his strategy of renewing the fleet every X period of time.
Economic Benefits
Not quantifiable.
Non-‐economic benefits
• Planning investment

Appendix II
viii
‘Fuel Reduction’
Three customers saw a benefit, even if not in focus, of fuel reduction thanks to a correct machine handling that can be obtained through either the feature Machine Handling Machine or Machine Handling Operator. If an incorrect machine handling would be more efficient than a correct machine handling (which pilot users thought it was sometimes) would all customers rather be more efficient with an incorrect machine handling than striving to reduce the fuel consumption as a consequence of correct machine handling. A fuel reduction is not something the customers have as a goal or end-‐state.
Economic Benefits
Since the relative importance of fuel consumption is minor in comparison to the operators efficiency and productivity is a quantification of this consequence not adequate. If such quantification was to be done, following parameters and circumstances must be found and validated:
Correct machine handling must always be more efficient than incorrect machine handling.
• Work X with machine Y with incorrect machine handling leads to a fuel consumption of A €.
• Work X with machine Y with correct machine handling leads to a fuel consumption of B €. • A-‐B = fuel cost savings
Non-‐economic benefits
-‐
‘Improve Team productivity’
Three customers saw a potential benefit of using either the feature Machine Handling Operator or Machine Handling Machine with individualized machines to monitor the productivity and efficiency of their teams. This since they experienced that some teams were, for unknown reason, more productive and efficient than others. The FS could help the Fleet Manager to compare teams with each other and take actions thereafter. It is important, and the customer understood this, to keep in mind that the FS does not necessarily give the answer to why one team is more productive than another but it gives an indication if that is the case. It is then up to the manager to investigate the cause of this anomaly in order to improve the situation.
Economic Benefits
Not quantifiable in this study.
Non-‐economic benefits
Control and proof of Productivity & Efficiency
‘Improve employer-‐employee relation’
By showing the employees they are under the limit of vibration exposure some customers thought the relation with the employees could be improved. A good relation with the employees creates a better working environment and could have impact on the productivity.

Appendix II
ix
Economic Benefits
Not quantifiable in this study.
Non-‐economic benefits
Not quantifiable in this study.
‘Work rotation’
One customer saw a potential possibility of forcing a work rotation with the argument that to much work with the same machine can be harmful due to vibration exposure. This would be possible with the feature Vibration Report enable by the operator tag. The benefits of this consequence are however insignificant and it does not lead to a higher goal the customer has.
‘Increase machine value’
One customer saw a possibility to increase the machine value by a good maintenance thanks to the Maintenance System of the Fleet Service. This could potentially augment the machine value or prolong the product lifetime, which would have some, but small, economic benefits according to the customer.
‘Control over working conditions’
Being within the limitation of acceptable vibration would according to one customer be a minor benefit for him but would only give him some more knowledge about the industry since he did not know about these limitations before. It creates an issue but gives him a peace of mind at the same time.
‘Planning investments of spare parts’
The most autonomous customer when it comes to maintenance and repairs on their handheld machine saw a possibility of planning their investment of spare parts with the help of the feature Maintenance System. This consequence was however not economically important.
‘Monitor unauthorized usage of machines’
By having a monitoring system on the machines, one customer saw the possibility of preventing operators taking home machines for private use. No direct economic or non-‐economic advantages.

Appendix III
x
Appendix III -‐ 8 interviews with 8 different customers
Company /Organisation
Level of organisation
Number of operators
Number of machines (Husqvarna machines)
In House maintenance & repairs
The town of Lyon Medium 220 1300 (approx 200 HQ) Yes Mountain Gardening Company
Medium 6-‐8 10 No
Sapeurs Forêstiers des bouches du Rhône
High 18 100 Yes
Paysage Assistance Medium 10 30 (15) No Jaroussi Low 45 50-‐80 (majority) Yes Parc du Puy du Fou 85 High 8 (35) 100 (90) No ETS Gevres 44 High 27 (50) Yes Svensk markservice AB
Medium 5 (20) 33 (9) Yes
Interview no 1: City of Lyon (np)
Jaques Demont -‐ purchasing manager for green surfaces Manuel Montrol -‐ chief purchasing manager City of Lyon
This municipality organisation holds 220 operators and an important fleet of about 1300 machines (including approximately 200 Husqvarna hand-‐held machines). They had not yet heard of HFS until we came to present it. We therefore focused the interview on understanding their business in order to see the potential value of HFS.
Appendix III
xi
Overall goals and focus
Cost reduction through smaller fleet and fewer employees. Emphasis will be put on making the transition to battery powered machines because the work is mainly done in urban areas and thus the sound level should be kept low.
Interest in Fleet Service They did see potential value of the service, mainly thanks to WLM, LB and Maintenance System MS.
When it comes to the operator based features of the services, they explain that they would have a very hard time explaining this to the unions.
WLM – As of today, they a hard time keeping track of their large fleet. They state that this is the case for any municipality. They agree that this feature would help optimizing the fleet which would cut costs => goal coherent.
MHM – If they can show that their heat engine machines are running at a too low rpm, this would support their strategy of pushing into less powerful battery driven machines (though not supported by HFS today?)
LB – Facilitates the work since they do all repair work themselves. However, the mechanics do not have computers. They however see this as a potential time saver which in turn also helps to reduce costs => goal coherent.
MS – They see this as a way of knowing when to replace which machine which means that MS becomes a purchase planning tool. Moreover, since they sell used machines, this might help them to plan this as well. The ultimate goal, again, is to optimize the size of the fleet through effective purchase and sales planning => goal coherent through cost reduction.

Appendix III
xii
Interview no 2: The Mountain Gardening Company – Chamonix (np)
Julian Heasman – purchase manager, garden maintenance, services, design
This small alpine business employs 8 people at peak season, including himself and his business partner. They handle around 10 handheld machines, they rent whatever else they need. The main competitive strength lies in delivering top-‐end design gardening for private second home owners.
Overall goals and focus
The focus of the company is to grow organically within the same niche, potentially by start serving hotels or by moving the current business format geographically. Nonetheless, cost reduction will be an important matter.
Interest in Fleet Service
Julian’s incentives for a service such as HFS are predominantly economic. Though, he does not see the point in investing in it, given its current format. The main disadvantages are that 1) it’s locked to HQ machines 2) GPS doesn’t exist 3) the information is hard to interpret. He does not find it simple enough; it should be “clicking a button that tells me how to improve my business”. For him to buy the service “it has to show black on white what savings can be done”. But taking him through the separate service features he still expresses some potential benefits.
WLM/WLO – Can help to investigate how much a specific project costs which means getting a better understanding of the actual cost of the project. Ultimately, this can help charging the correct amount of money and getting control of costs. He denies both the potential of this as a tool to optimize the size of the fleet and the potential of motivating his employees to start working at time.
VR – Knowing the vibration exposures of the employees would give peace of mind.

Appendix III
xiii
LB/MS – Julian estimates that he probably could save 2 days per 6 weeks since he could move some service and repairs to his own repair shop, avoiding queues at the dealer’s repair shop. This also means reducing down-‐time at the working sites => improved effectiveness. He also sees the value of increasing the know-‐how within the organization through the library information. Again, some potential benefits proposed by us and HQ e.g. increase second-‐hand value of the machines and optimizing the fleet size were denied on this bullet point
Interview no3: Sapeurs forestiers des Bouches du Rhône (pu)
Material Manager
The objective of this municipality business is to prevent fires in the dry woods of Provence in the south of France. Their work consists of keeping the roadsides clean of grass, maintaining fire streets to facilitate the accessibility for fire fighters and to maintain specific sites that are especially dangerous in terms of fire propagation. Like the previous clients, they do reactive maintenance rather than proactive.
Overall goals and focus
Governed by state, they are dependent on a budget => no financial goals. Still obviously, they appreciate the possibility of cost savings.
Interest in Fleet Service
In this interview it was hard to relate the consequences sought to each and every category of information (service feature). He emphasizes his interest in knowing if the appropriate machine has been used and compare team productivity.
WLM/MHM – interesting to see if the right machine has been used.

Appendix III
xiv
WLO/MHO – Allows for comparison between different teams.
VR – not interesting in its current form. He would be interested in a vibration report that signals if the machine is vibrating too much (malfunctioning).
LB – Very interesting! Could save them a substantial amount of time. He estimates that a couple of hours every month due to information is missing. => independency in terms of repairs/maintenance
MS – useful to predict investments in spare parts, also to prevent unnecessary break-‐downs (although most break-‐downs are due to individual mistakes). He denies advantages such as optimizing the fleet size and second-‐hand value increase.
Interview no4: Paysage Assistance (pu)
Gilles – owner and finance manager Anna – fleet manager
This small privately owned business employs 10 people and serves green surfaces of parks, hotels and private properties. They use their dealer for most repair work except for some smaller maintenance. Competing on many levels -‐ quality, relationship building, price, good material handling and organisation – they feel successful and have a solid financial situation. Their HQ fleet consists of 15 machines spanning over the entire hand-‐held assortment (one ride-‐on) and they have been testing HFS now for one year.
Overall goals and focus
They have no interest of growth; rather stagnation is the goal right now.

Appendix III
xv
Interest in Fleet Service
The spontaneous comment is that this type of service probably is more suitable for larger organisations. They do not have the resources necessary to look and the information and take actions according to e.g. the maintenance plan. Initially, Anna put 15 minutes every day to look at the information given by the FS. Because of a lack of explanation and follow-‐up on how to use this information, Anna soon lost interest in using the service and rarely uses it anymore. Even if some benefits were identified, Anna thought that the information did not reflect the reality and was therefore not useful for their business. ”The value-‐in-‐use for us at the moment is zero, this since nobody has told us what to do with this information…it does not reflect the reality”. As of today she would not purchase such a service.
WLM/MHM – Has looked at the information but did not know how to use it and it is therefore useless.
WLO/MHO – Identified incorrect usage of the machines and communicated that to the employees. This, however, did not help because of the non-‐engagement of the employees (they did not care). The correct utilization of a machine does not reflect an efficient day since an operator who works efficiently may use the machine in an incorrect way. An operator who does the work quickly is worth more than a machine that brakes down less often since the employee costs much more.
VR – From a legal perspective this is not interesting. Anna however cares a lot about here employees and communicated the vibration exposures to them. This was well received by the employees but overall they did not really care. The health and security aspects is very important but the VR does not reflect the real working conditions and is therefore not really useful.
LB – They did not have access to it and saw little or no benefits from it since they hand in their machines for service and do not have the time, resource or competence to use the spare-‐part list to the repair themselves.
MS – interesting but lack of resources and time to follow the maintenance plan or do repairs themselves. Although there is a lack of competence Anna sees the potential value of having less break downs which would mean higher maintenance costs but less repair costs and especially less down-‐time. The most interesting aspect for them would be a closer contact with their distributor with this type of service. She identifies a potential advantage of informing the distributor about when and what repairs or maintenance to do in order to minimize the repair time of the machines (time=money).

Appendix III
xvi
Interview no5: Jaroussi (pu)
Marc Jaroussi – manager Damien Duschamp – manager/administration Daniel – technician
Jaroussi is one of the biggest privately owned landscaping companies in the region of Dordogne with approximately 45 employees including their own technician and a fleet of 50-‐80 machines.. The competitive advantage lies in diversification. They have no knowledge about the actual size of their fleet but have a basic maintenance system. Their technician does all maintenance and repairs of the machines. Because of troubles with internet connection they have not been able to retrieve any information from the FS and thus not used it at all.
Overall goals and focus
Stagnation, reorganisation and restructuring of the business to reduce costs in order to stay competitive.
Interest in Fleet Service
An overall positive perception of the service, however they do not want to monitor their employees and are therefore not interested in the operator tag. From a machine perspective is the service very interesting and could help them to first of all have an overview over their fleet, which for a start would give them the knowledge of the size of their fleet. Second, they see the potential of increasing the productivity of each machine and to do more preventive maintenance in order to reduce repair costs. They also identify a great potential of planning future investments and choosing which machines to purchase depending on their productivity.

Appendix III
xvii
WLM/MHM – The most interesting benefits would be the knowledge of how many machines we have since we have some problems with machines disappearing and to plan future purchases. We could base the purchasing decision on facts about which machines actually has the best performance. A reduction of the number of machines is less important since they are relatively cheap and the cost of down-‐time due to non functioning machines is much higher. By monitoring the usage of the machine we could reduce break downs due to incorrect utilization a the machine, a problem that we have today.
WLO/HO – This is not interesting since we do not want to monitor our employees.
VR – This is not interesting since we do not want to monitor our employees.
LB – We already have the necessary documentation but to have it all in one place would be a good solution.
MS – This would be a good system in order to diminish repairs and thus repair costs. We could keep track of which machines to service and when. As of today we probably spend 3 days a week to repair machines.
Interview no6: Parc du Puy du Fou (np)
Jerôme Vrignaud – Manager of green surfaces
The privately owned company, Parc du Puy du Fou, is the second most visited recreation park in Europe with over 20 thousands visitors per day during high season. The park has a lot of green surfaces, which requires the work of a total of 8 employees year around and 35 on high season with a fleet of approximately 100 machines. The green surface department does not have a cost reduction focus but rather high requirements when it comes to quality and efficiency. The work

Appendix III
xviii
has to be done and done quickly. The employees do basic maintenance and repairs; the closest distributor does the rest.
Overall goals and focus
To give the visitors the best possible experience by having high quality maintenance of the green surfaces with as little noise as possible.
Interest in Fleet Service
Mr Vrignaud has a great interest in a service like the FS. The greatest benefits would be to get feedback from the utilization of the fleet in order to evaluate its performance. This could ensure a correct usage of the machine and thus a high productivity and good working conditions for the employees and machines. Secondly it could help when planning future investments by knowing which machines worked the best and choose these ones instead of other. The greatest disadvantage of the service is that it only functions with Husqvarna machines and since his fleet includes machines from many other brands he would not consider buying the service as it is today.
WLM/MHM – This is very interesting in order to know which machines have been used and how. This can help us to both plan future investments by comparing the performances of different machines and choosing the best ones as well as plan a homogeneous utilization of the fleet. It can also help us to identify the incorrect usage of machines, a frequently occurring problem due to our many seasonal employees. We probably loose ½ hour per week due to incorrect utilization of machines. A reduction of the number of machines (e.g. no machines in reserve) is not that interesting since it is more costly to have an employee not work because of a lack of machines than having some extra machines in reserve that are not constantly used.
WLO/HO – Even if mr. Vrignaud identifies some advantages with the operator tag he does not want to monitor his personnel and would rather get the information through the machines (they could be personal which would almost give the same result).
VR – It is interesting but as of today there is no problem regarding vibrations and since operator tags are not to consider this is not useful.
LB – The library would be very helpful to both do more repairs ourselves and to inform our distributor which spare parts and repairs that are going to be needed in the near future. The instruction videos serve as teaching material and help to save time when an operator does not know how a certain machine works (instead of calling someone he could go and watch the video). The videos are also beneficial during formation of the seasonal employees.
MS – A maintenance plan could reduce downtime and repair costs. The main purpose would be to save time, which would both have economical and non-‐economical benefits. The most important benefits are non economical since the unit does not have a cost reduction focus.
Interview no7: Gevres (pu)
Bruno Guet – Fleet Manager

Appendix III
xix
Gevres is semi-‐large landscaping company with 27 employees and a fleet of 50 machines, who is part of a larger company with in total 125 employees. The company shares administration, technicians and HR with the other companies in the conglomerate. The company has grown 1000% over the last ten years on an employee level and are still in an expansion phase. Their competitive advantage is their good organisation and reactivity. They have used the FS for about 8 month before moving to a new location where they experience some problems with Internet connection. In total were 10 machines and 5 operator part of the FS test.
Overall goals and focus
The goal with the business at the moment is to keep the market shares since there is a certain stagnation of the growth of the business. The crisis affects all businesses and requires that we have a good control of all costs.
Interest in Fleet Service
Mr. Guet was the only one who had access to the information from the FS and dedicated approximately 15 min each day to look at it. He could not say that he has realised any value thanks to the service but sees a lot of potential value in using it. The reaction from the employees was at first a bit negative but after explaining to them why they wanted to keep track of the utilization of the fleet they were fine with being monitored. He has a great interest in this type of service which could help him to plan future work and how much it should cost, reduce repair costs and downtime as well as augment the employee-‐manager relationship.
WLM – Mr Guet explains that it would help them to plan the field work because they’d know how much time it should take for every machine. This way they can allocate the machines more effectively to their sites.
WLO – He was a bit (negatively) surprised by the operators’ running time. This information can also be used to compare individuals’ performances and identify related problems.
MHM/MHO – Potentially knowing if the right machine was used for the job and still, if so, knowing that a certain operator was handling the machine incorrectly.

Appendix III
xx
VR – This information can stimulate the operators to use the machines at better vibration levels (i.e. optimal rpm). We doubt this advantage because the vibrations are measured as function of time and not as function of actual vibration.
LB – Haven’t had access but sees the opportunity of signalling to the dealer what parts will have to be in stock for upcoming maintenance/repairs.
Interview no8: Svensk Markservice AB Borås (pu)
Fredrik Belfrage – Fleet Manager
Svensk Markservice AB is a national landscaping company with a turnover of over 500 millions €. The department in Borås has 5 employees year around and 20 during high season and about 35 machines in their fleet. The company is in expansion and have 80-‐90% municipalities as customers. Because of the majority of the customers are municipalities, the public procurement laws apply, which means they have to differentiate themselves with price. They have tested the HFS one team for about one year.
Overall goals and focus
Expansion in Sweden with a growth in the private customer segment.
Interest in Fleet Service
Mr. Belfrage has not put in that much time and effort in using the service but have nonetheless used both the machine and operator tags on a team with 4-‐5 people. The overall impression is that HFS is a good idea but since he did not get any training or advice from Husqvarna on how to use the information, no benefits were actually realised. The biggest problem with the HFS today is the reality reflection.
WLM – Could help to reduce to fleet size but overall are those incentives not that strong since the machines are relatively cheap.

Appendix III
xxi
WLO – Mr. Belfrage did not see the point and did not want to supervise his employees. He however saw a potential benefits if the HFS was equipped with GPS.
MHM/MHO – There was an interest of ensuring that the correct machines were used and that the employees handled the machines correctly.
VR – Could give them incentives to force a work rotation.
MS – A strong interest in the maintenance system, which gives them a tool to plan the maintenance, something that hopefully would minimize the breakdowns.
LB -‐ Very positive to the Library, the technical drawings of the machines is something Mr. Belfrage has been waiting for a long time.

Appendix IV
xxii
Appendix IV – Iterative steps of analysis process/model

Appendix IV
xxiii

Appendix IV
xxiv

Appendix V
xxv
Appendix V – Customers’ desired features, consequences and end-‐states/goal

Appendix VI
xxvi
Appendix VI – Question to Pilot users
Appendix VI
xxvii

Appendix VI
xxviii
Appendix VI – Question to customers
Vad är din roll i företaget? Är du rätt person att prata om FS med? Är ert bolag privat-‐ eller kommunaltägt? Vad gör ni (affärsidé)? Är ni verksamma lokalt eller nationellt? Är följande områden viktiga eller inte för er?
• Golfbana • Vägunderhållning • Sportfält • Parker • Hotel • Privata fastigheter • Kyrkogårdar • Övrigt
Hur många anställda har ni? • Operatörer? • Operatörer (högsäsong)? • Tekniker? • Fleet Managers? • HR/adminstration?
Vart ligger ert fokus på verksamheten just nu (kostnadsbesparingar eller expansion)? Vad är er konkurrensfördel? Är det ackord eller timmersättning på de flesta uppdragen? Är era kunder huvudsakligen privata eller offentliga aktörer? Vad har ni för övergripande mål i företaget? Finansiella ställning, likviditet/soliditet? Vad är er strategi i den närmaste framtiden Vad är er största svaghet? Vad är största utmaningen/problemet i er verksamhet? (e.g. down-‐time, season variation…) Vart ligger er största kostnad? Kostnadsbild -‐ underhåll/reparation/down-‐time Vad är er totala kostnad i reservdelar när det gäller underhåll? Kan ni kvantifiera tiden ni lägger på underhåll i veckan? Vad är er totala kostnad i reservdelar när det gäller reparation av maskiner? Kan ni kvantifiera tiden ni lägger på reparationer i veckan? Kan ni kvantifiera down time tiden i veckan pga att maskiner gått sönder? (dvs ni kan inte utföra jobbet pga att maskinen är på reparation?) Hur ser marknaden ut just nu? Växande? Konkurrensutsatt? Huvudsakliga konkurrenter? Deras konkurrensfördelar? Hur många maskiner har ni totalt (inkl HQ-‐maskiner)? Vilka andra maskiner (märken) använder ni er av? Hur många av de som inte är HQ maskiner tillhör det sortiment som ni anser att HQ erbjuder? (hur många skulle kunna ersättas med HQ-‐maskiner) Ser ni ett problem med att FS bara fungerar på HQ-‐produkter Hur många reservmaskiner har ni? (räkna ej med eventuella reservmaskiner för säsongsvariationer) Hur många maskiner uppskattar ni att ni kanske egentligen inte behöver?

Appendix VI
xxix
Hur lång tid uppskattar ni att ni förlorar per dag pga att arbetarna kommer igång för sent. (min/vecka) Hanhavandefel Hur många maskiner uppskattar ni går sönder pga inkorretk användande? (st/vecka) Hur mycket down time leder det till? (min/vecka) Vad kostar det i reservdelar per vecka? Har ni upplevt problem med myndigheter gällande Vibration reports? Vad har det kostat? Hur många (hur lång tid) arbetare har fått sjukskriva sig till följd av vibrationsskador Hur lång tid lägger ni på att hitta information om varje produkt vid underhåll/reparation? (tim/vecka) Hur stor andel av tekniska fel i fält beror på bristande underhåll (antal/vecka). Hur många mycket downtime leder detta till? (min/vecka) Hur många HQ-‐maskiner har ni totalt? exakt antal av varje modell…
• Trimmers & Brushcutter • Backpack blowers • Handheld blowers • Hedge trimmers • Walk behinds • Ride ons
Hur lång är säsongen för respektive produktfamilj? • Trimmers & Brushcutter • Backpack blowers • Handheld blowers • Hedge trimmers • Walk behinds • Ride ons
Hur lång är livslängden på dessa produkter ungefär? • Trimmers & Brushcutter • Backpack blowers • Handheld blowers • Hedge trimmers • Walk behinds • Ride ons
Äger ni dem själva? Underhåller och reparerar ni HQ-‐maskiner själva? Har ni serviceavtal på era HQ-‐maskiner? Hur mycket tid per dag lägger ni ner på Fleet Service idag? Vad har krävts av er för att utnyttja tjänsten och åstadkomma de fördelar ni nämnt? Hur många av era HQ-‐maskiner har haft machine sensor? Ser ni ett problem med att FS bara fungerar på HQ-‐produkter Kan FS motivera till att utöka HQ-‐flottan Berätta allmänt om hur arbetet med Fleet Service har gått Har era operatörer synpunkter på att vara övervakade? Hur många av era anställda har använt operator tag? Vem är inköpsansvarig? Hur gåt ni till väga när ni ska köpa en ny maskin? Byter ni ut maskinerna kontinuerligt eller byter ni ut alla vid en viss tidpunkt? Vid vilket pris skulle du anse att tjänsten var ett “klipp”? Vid vilket pris skulle du saga att tjänsten blev dyr men du skulle fortfarande överväga att köpa den? Vid vilket pris skulle du anse att tjänsten blev för dyr?

Appendix VI
xxx
Vid vilket pris skulle du anse att tjänsten var för billig, så pass att du skulle ifrågasätte dess fördelar?

Appendix VII
xxxi
Appendix VII – Raw data & Implication matrix Sifferkodning WLM 1 MHM 2 MS 3 LB 4 WLO 5 MHO 6 VR 7
Control over working conditions 10
Correct machine selection for the job 11
Easier access to information 12
Fuel reduction 13
Homogeneous utilization of the fleet 14
Improve employer-‐employee relation 15
Improve team productivity 16
Individualized machine training 17
Know-‐how of machine handling 18
Knowledge of actual job cost -‐ machine and employee cost 19
Less outsourcing 20
Less process time at dealer 21
Monitor misusage of machines 22
Optimize the fleet characteristics/variety -‐ investing in the appropriate machines 23
Optimize the fleet size -‐ reduce or increase the number of machines in fleet 24
Planning investments in time -‐ when to do investments 25
Planning spare parts investment 26
Prolong product life time 27
Reduced amount of breakdowns 28
Reduced downtime 29
Reduced repair time 30
Work rotation 31
Cost control & reduction 40
Minimized ecological and social impact 41
Productivity & efficiency 42
Quality on job and staff 43 M – Marie de Lyon C – Mountain Gardening Company S – Sapeur Forêstier P – Paysage Assistance J-‐ Jaroussi F-‐ Parc Puy du Fou G-‐ Gèvres B-‐ Svensk Markservice

Appendix VII
xxxii
Level of abstraction
Ladder 1 M1 1 25 24 40 0
2 M2 1 25 23 40 0 3 M3 2 23 13 41 0 4 M4 2 13 41 0 0 5 M5 3 28 42 0 0 6 M6 4 12 30 42 0 7 C1 1 19 40 0 0 8 C2 3 12 28 29 42 9 C3 3 12 20 42 0
10 C4 4 12 20 30 0 11 C5 5 19 40 0 0 12 C6 7 10 41 0 0 13 S1 1 25 23 40 0 14 S2 1 25 24 40 0 15 S3 2 11 42 0 0 16 S4 3 28 0 0 0 17 S5 3 26 0 0 0 18 S6 4 18 0 0 0 19 S7 4 12 30 40 0 20 S8 5 16 42 0 0 21 S9 6 17 11 42 0 22 P1 3 11 29 42 0 23 P2 3 28 29 42 0 24 P3 3 21 42 0 0 25 P4 4 21 42 0 0 26 P5 7 15 42 0 0 27 J1 1 25 0 0 0 28 J2 2 17 28 40 0 29 J3 3 28 24 40 0 30 J4 3 27 40 0 0 31 J5 4 18 0 0 0 32 F1 1 14 0 0 0 33 F2 1 26 24 43 0 34 F3 2 17 42 0 0 35 F4 2 13 41 0 0 36 F5 3 28 29 42 0 37 F6 4 12 0 0 0 38 F7 4 18 0 0 0 39 G1 1 14 0 0 0 40 G2 1 19 11 42 0 41 G3 1 19 40 0 0 42 G4 2 11 0 0 0 43 G5 3 21 0 0 0 44 G6 4 21 0 0 0 45 G7 7 16 0 0 0 46 B1 1 22 0 0 0
47 B2 2 17 0 0 0 48 B3 3 28 0 0 0 49 B4 3 24 0 0 0 50 B5 4 20 30 42 0 51 B6 6 13 0 0 0 52 B7 6 17 0 0 0 53 B8 7 31 0 0 0

Appendix VII
xxxiii
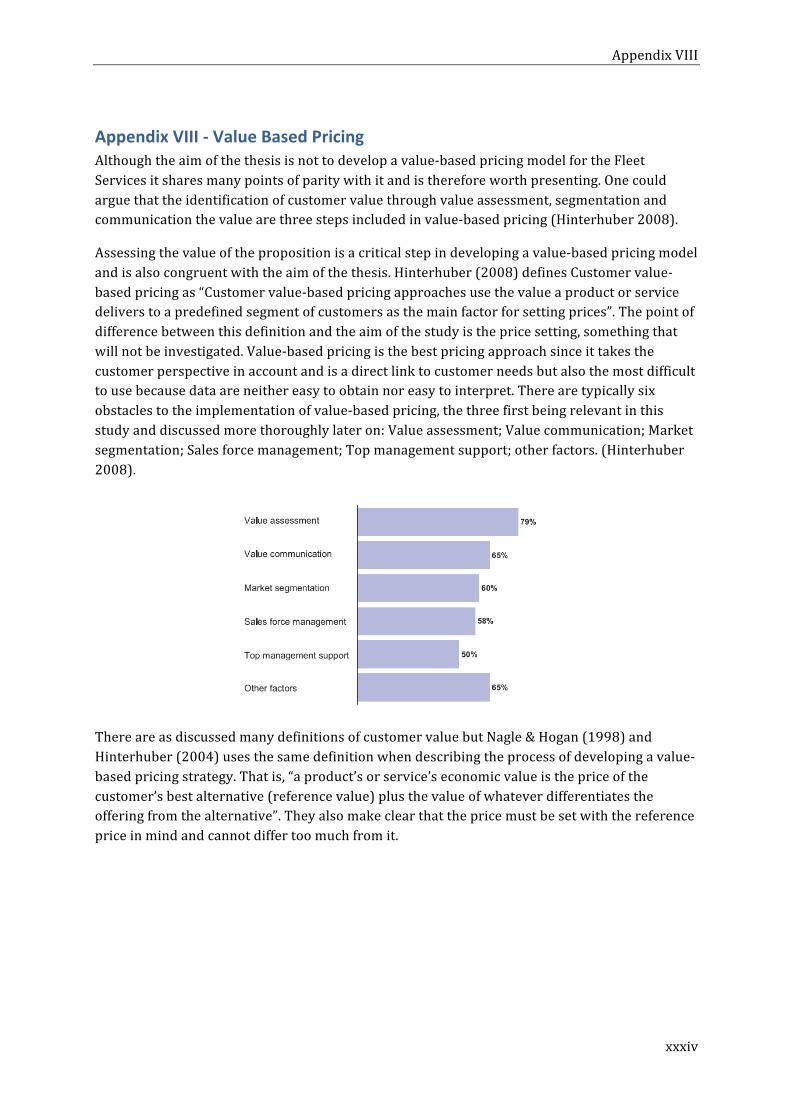
Appendix VIII
xxxiv
Appendix VIII -‐ Value Based Pricing Although the aim of the thesis is not to develop a value-‐based pricing model for the Fleet Services it shares many points of parity with it and is therefore worth presenting. One could argue that the identification of customer value through value assessment, segmentation and communication the value are three steps included in value-‐based pricing (Hinterhuber 2008).
Assessing the value of the proposition is a critical step in developing a value-‐based pricing model and is also congruent with the aim of the thesis. Hinterhuber (2008) defines Customer value-‐based pricing as “Customer value-‐based pricing approaches use the value a product or service delivers to a predefined segment of customers as the main factor for setting prices”. The point of difference between this definition and the aim of the study is the price setting, something that will not be investigated. Value-‐based pricing is the best pricing approach since it takes the customer perspective in account and is a direct link to customer needs but also the most difficult to use because data are neither easy to obtain nor easy to interpret. There are typically six obstacles to the implementation of value-‐based pricing, the three first being relevant in this study and discussed more thoroughly later on: Value assessment; Value communication; Market segmentation; Sales force management; Top management support; other factors. (Hinterhuber 2008).
There are as discussed many definitions of customer value but Nagle & Hogan (1998) and Hinterhuber (2004) uses the same definition when describing the process of developing a value-‐based pricing strategy. That is, “a product’s or service’s economic value is the price of the customer’s best alternative (reference value) plus the value of whatever differentiates the offering from the alternative”. They also make clear that the price must be set with the reference price in mind and cannot differ too much from it.

Appendix VIII
xxxv

Appendix IX
xxxvi
Appendix IX – van Westendorp
The price (p) span that seems acceptable for the scenario presented is thus approximately 8% < 𝑝 < 13% of the purchase price of the machine, or in monetary terms, 40€ < 𝑝 < 65€. This interval can be interpreted as the net present value of the full service (including technical components, subscriptions etc) fixed in one machine at 500€. It does not necessarily mean a one-‐time transaction at the exact time of purchase. Nor is it generalizable to any machine cost. The van Westendorp derived price gives an indication of the willingness to pay for the fleet service, at machine level, in the end of the day. To keep this sacrifice on a minimum level, it should not differ too much from this interval. The price, however, needs further research, and is not to be confused with value-‐based pricing (appendix VIII).
0
0,1
0,2
0,3
0,4
0,5
0,6
0,7
0,8
0,9
1
0,00% 5,00% 10,00% 15,00% 20,00% 25,00% 30,00%
Accumulated percentage of custom
ers
Percentage of purchase price
Too cheap
Cheap
Expensive
Too expensive
Top Related