


Languages
Pages
Legal

Corporate strategy andshareholder value during decline
and turnaroundOlivier Furrer
Nijmegen School of Management, Radboud University,Nijmegen, The Netherlands
J. Rajendran PandianDepartment of Management, University of Wollongong,
Wollongong, Australia, and
Howard ThomasWarwick Business School, University of Warwick, Coventry, UK
Abstract
Purpose – The paper aims to assess the impact of corporate strategy on shareholder value in declineand turnaround situations.
Design/methodology/approach – A sample of 45 turnaround firms was selected and matchedagainst a control sample which did not face continuous decline over the time period studied. Theimpact of corporate strategy on shareholder value was tested using cumulative beta excess returnmeasures to capture the long-term basis of corporate strategy.
Findings – The paper finds that the beta excess return measures captured the hypothesizedrelationships between strategy and shareholder value for the sample firms studied.
Practical implications – Beta excess return measures are superior to case studies or event studiesfor identifying the long-term effects of corporate strategy.
Originality/value – Relatively few studies have compared the strategies of turnaround firms with amatched sample of non-declining firms. The use of cumulative beta excess returns to assess long-termvaluation of corporate strategy is original.
Keywords Corporate strategy, Shareholder value analysis, Turnarounds
Paper type Research paper
The aim of this paper is to assess empirically the impact of corporate strategy onshareholder value. Such an examination is of importance for several reasons: first,shareholders are undoubtedly the dominant stakeholders in a publicly quoted firm.They can affect the future of a firm by changing the management if the majority ofshareholders are not convinced of the effectiveness of their strategies (Barker et al.,2001; Grinyer and Spender, 1979; Hedberg et al., 1976; Hofer, 1980; Nystrom andStarbuck, 1984; Ormerod, 2005; Pajunen, 2006; Slatter, 1984). Despite the increasingpopularity of the shareholder value analysis (Rappaport, 1998; Doyle, 2000; McGeeet al., 2005), there exists little empirical research supporting Rappaport’s conclusions.In fact, Woo (1984) concluded that the empirical findings did not provide support forthe suggestion that basing strategic decisions on these models (e.g., constant growthmodel, two-stage model, etc.) would result in increased shareholder value. Woo felt thatit was necessary to conduct more empirical tests of these models and to assess theirvalidity in order to increase users’ (practicing managers’) confidence.
The current issue and full text archive of this journal is available at
www.emeraldinsight.com/0025-1747.htm
MD45,3
372
Management DecisionVol. 45 No. 3, 2007pp. 372-392q Emerald Group Publishing Limited0025-1747DOI 10.1108/00251740710745025
Rappaport and his colleagues have nevertheless provided a stream of research linkingcorporate strategy and the maximization of shareholder value (e.g., Blyth et al., 1986;Rappaport, 1998; Rappaport, 1981). However, much of this is case study based anddifficult to generalize. Consequently, large sample studies based on multiple firms areessential to build users’ confidence. A further reason for conducting such empiricaltesting is that performance measurement is critical to the conduct of strategy research(Lubatkin and Shrieves, 1986). This has led strategic management researchers toexamine the suitability of shareholder value and other financial market measures inassessing corporate performance. Most of these researchers have used event studymethodology to examine the impact of corporate strategy on shareholder value(Chatterjee, 1986; Lubatkin, 1987; Woolridge, 1988; Woolridge and Snow, 1992;Chatterjee et al., 1992; Kelm et al., 1995). Such a methodology is adequate to studyphenomena that occur in a narrow window (e.g., a few days at the most). However, in thecase of measuring the impact of strategy, where the phenomenon has to be examinedover a long period of time (a year to a few years), event studies are not suitable.
In this study, therefore, we examine the impact of strategy on shareholder valueusing a large sample of firms over a long period of time in decline and turnaroundsituations in order to overcome the problems mentioned above. Two importantelements focus the study: first, beta excess returns (Fama et al., 1969; Van Horne, 2001;Brearley and Myers, 2002; Petkova and Zhang, 2005), which are better suited forlong-term examination of strategy than the abnormal return measures used in eventstudy methodologies, are used to measure changes in shareholder value. Second, firmsin decline situations are compared to non-declining firms over time so that easilydetectable differences in corporate strategy and shareholder value can be identified andmeasured during the period of study.
The paper is organized as follows: first, a brief review of empirical research on theimpact of strategy on shareholder value and relevant literature on decline situations isprovided. In the next section, hypotheses are developed about the link between corporatestrategy and shareholder value. In the methodology section, the measurement issuesrelated to capturing shareholder value over a long period of time and measuring strategyare presented and this is followed by a brief discussion of the sample and data sources.This is followed by an interpretation of the results. The implications of these results arealso discussed, together with a review of the limitations of the present study. Suggestionsof areas for future research are then proposed.
Literature reviewEmpirical examination of the impact of strategy on shareholder valueRappaport (1981) argued for the use of shareholder value to guide strategicinvestments. Rappaport’s objections to the use of efficiency of capital utilizationmeasures (e.g., return on assets (ROA), return on invested capital (ROIC), and return onequity (ROE)) for such strategic decisions stem from the fact that these measures aregenerally based on accounting information which accounts neither for time value ofmoney nor for the investment risks faced by the shareholders. He called his preferreddecision-making framework Shareholder Value Analysis (SVA) (Rappaport, 1998;Doyle, 2000). Rappaport and others (e.g., Blyth et al., 1986; Rappaport, 1983, 1998;Rappaport and Friskey, 1986) presented a number of case studies to demonstrate howto use SVA successfully.
Decline andturnaround
373
However, it is difficult to generalize findings from such case studies. As aconsequence, strategic management researchers directed their efforts to empiricallytest various theoretical hypotheses about the impact of strategy on shareholder value.For instance, Chatterjee (1986), Lubatkin (1987), and Chatterjee et al. (1992) examinedmergers and acquisitions and how they created or destroyed shareholder value. Thisstream of research is an important part of work on diversification strategies wherethere are theoretical arguments that anticipate value creation due to synergy throughmergers and acquisitions.
Another stream of research concerns a firm’s research and development (R&D)expenditures or R&D progress announcements and the impact of such announcementson stock prices (Chan et al., 1990; Kelm et al., 1995; Woolridge, 1988; Woolridge andSnow, 1992). In a similar vein, other researchers have examined announcementsregarding new product developments (Eddy and Saunders, 1980), capital expenditures(McConnell and Muscarella, 1985), marketing activities (Chauvin and Hirschey, 1993),and international joint ventures (Merchant, 2000; Merchant and Schendel, 2000) andassessed the impact on stock price.
All these studies, however, used event study methodology and the measure ofabnormal returns around the event (announcements) to test the relationshipbetween corporate strategy and shareholder value. Findings from most studieswere in a consistent and expected direction and confirmed that abnormal returnswere positive (and statistically significant). This, in turn, suggested that investorstook the actual strategies into account in valuing the firm.
Therefore, one of the major advantages in examining such public announcementsfrom a research viewpoint is that the investors are aware of a strategic change(“intended strategic change” in the case of expenditure announcements and “realizedstrategic change” in the case of progress announcements) and can assess its likelyimpact on the firm. In practice, however, many significant firm level strategic changesare “kept under wraps” in order to gain competitive advantage (i.e. in order to surpriserivals, most strategic changes are kept a secret) and are not captured in publicannouncements.
The other drawback of these studies is that their findings tend to hold only for veryshort windows around the public announcement and when the window of examinationis extended over ten days after the event, the stock price tends to fall (i.e. the abnormalreturn becomes negative) (e.g., Woolridge and Snow, 1992). Such a problem argues forthe inadequacy of event study methodology for research related to longer-termcorporate strategy.
Indeed, to overcome these limitations, new methodologies and approaches areneeded, involving large samples and longitudinal designs. For example, Lubatkin andChatterjee (1991) studied the strategy-shareholder value relationship across marketcycles using MANCOVA and logistic analyses and, in a recent paper, St John et al.(2000) used neural networks to investigate the relationship between corporate strategyand wealth creation.
Firm declineDuring firm decline, shareholder value is destroyed. Research on firm failure andturnaround situations has viewed firm decline as a problem in organizational decisionmaking and resulting adaptation processes (Argenti, 1976; Grinyer and Spender, 1979;
MD45,3
374
Hedberg et al., 1976; Starbuck and Hedberg, 1977; Starbuck et al., 1978; Mellahi andWilkinson, 2004; Sheppard and Chowdhury, 2005). The central thesis is that firmdecline is the result of managers’ failure to maintain the alignment of a firm’s strategy,structure, and objectives with an evolving and changing environment. Such failuremay result from organizational inertia (Hannan and Freeman, 1977, 1984; vanWitteloosstuijn, 1998), which is reflected in behaviors such as the need to be reliable(Hannan and Freeman, 1984), escalating commitment by management (Staw, 1981),blinded perception (Zajac and Bazerman, 1991), strategic paralysis (D’Aveni, 1989,1990), and threat-rigidity (Staw et al., 1981).
Other researchers (e.g., Grinyer et al., 1988; Hofer, 1980; Hofer and Schendel, 1978;Schendel et al., 1976; Schendel and Patton, 1976) have more objectively classified thecauses of decline into either internal (or operational) problems or external (or strategic)problems. Indeed they found that management-related problems (or internal causes)outnumbered external environment-related problems (Bibeault, 1982; Slatter, 1984;Schendel et al. 1976; Grinyer et al. 1988; Lohrke et al., 2004; Filatotchev and Toms,2006). They argue that the internal mechanisms of failing firms imply that theirresponses to environmental change are either too active or too passive: “Both inactionand hyperaction seem to typify firms in their years prior the failure” (Hambrick andD’Aveni, 1988, p. 15). Bankruptcy has been described as a “protracted process ofdecline” and a “downward spiral” (Hambrick and D’Aveni, 1988). Indeed, there is aconsiderable body of empirical evidence that shows significant differences betweenbankrupt and survivor firms as soon as five years prior to the bankruptcy filing itself(e.g., Aziz et al., 1988; Baldwin and Glezen, 1992; D’Aveni, 1990; D’Aveni andMacMillan, 1990; Hambrick and D’Aveni, 1992; Moulton and Thomas, 1993). Thesestudies compared bankrupt firms with non-declining firms (e.g., Daily, 1996; Daily andDalton, 1994a, b; D’Aveni, 1990; D’Aveni and MacMillan, 1990; Gales and Kesner, 1994;Hambrick and D’Aveni, 1988, 1992) with an emphasis on the bankrupt firms.
However, decline is not irreversible and bankruptcy is not the only outcome(Cameron et al., 1988; van Witteloosstuijn, 1998). Successful turnarounds abound andare well documented. Early researchers on turnarounds (Grinyer et al., 1988; Hofer,1980; Hofer and Schendel, 1978; Schendel et al., 1976; Schendel and Patton, 1976)suggested that to reverse a decline due to internal problems, a firm should focus onrectifying the internal causes. For example, if the cause of decline is inefficientoperations, management should attempt to find ways of improving efficiency ratherthan trying to increase sales as long as the external environment has not changed. Suchremedies are called operational remedies, whereas, if the decline is due to change in theexternal environment, then strategies should be changed/adapted. Accordingly, suchremedies are called strategic remedies. That is, if the cause is internal, the solutionshould be operational and if the cause of decline is external, the action should bestrategic.
An important stream of research on the role of strategic change in the turnaroundprocess was principally based on case studies (e.g. Chowdhury, 2002; Grinyer et al.,1988; Hofer, 1980; Hofer and Schendel, 1978; Lamberg and Pajunen, 2005; Schendelet al., 1976; Schendel and Patton, 1976). Further research (Arogyaswamy, 1992;Hambrick and Schecter, 1983; Ramanujam, 1984; Robbins and Pearce, 1992; Schendeland Patton, 1976; Thietart, 1988) based on large samples attempted to test theimportant role of strategic change on turnarounds but, in fact, provided little concrete
Decline andturnaround
375
evidence. This lack of evidence supporting “strategic turnaround” even led someresearchers to question whether turnarounds can be accomplished through strategicreorientations (Pajunen, 2005; Pearce and Robbins, 1993; Robbins and Pearce, 1992).
It should be noted that the greater proportion of previous large-sample studiescompared successful turnaround firms with unsuccessful turnaround firms (e.g.,Hambrick and Schecter, 1983; O’Neill, 1986a, b; Schendel and Patton, 1976; Barker et al.2001). And, the research studies reviewed above compare either bankrupt firms withnon-declining firms, or turnaround firms with bankrupt firms. However, to the best ofour knowledge, relatively few research studies have ever compared turnaround firmswith a matched sample of non-declining firms. Such a comparison is of particularinterest because, as it has been shown, decline may be of different types (D’Aveni, 1989;van Witteloosstuijn, 1998) and may not lead to bankruptcy. For example, during theirdecline, bankrupt firms have been shown to have severe pathologic strategic behaviorsuch as inertia, hyperinitiative, or inconsistency (e.g., Hambrick and D’Aveni, 1988).Since the objective of this study is to investigate the relationship between strategy andshareholder value, not to focus on strategic failures or bankruptcy, these pathologicbehaviors associated with bankruptcy are too extreme to be meaningfully comparedwith the strategies of non-declining firms. Therefore, we chose, in this study, tocompare non-declining firms with declining firms that later successfully turnaroundand avoid bankruptcy (in the rest of the paper, these latter firms are referred asturnaround firms).
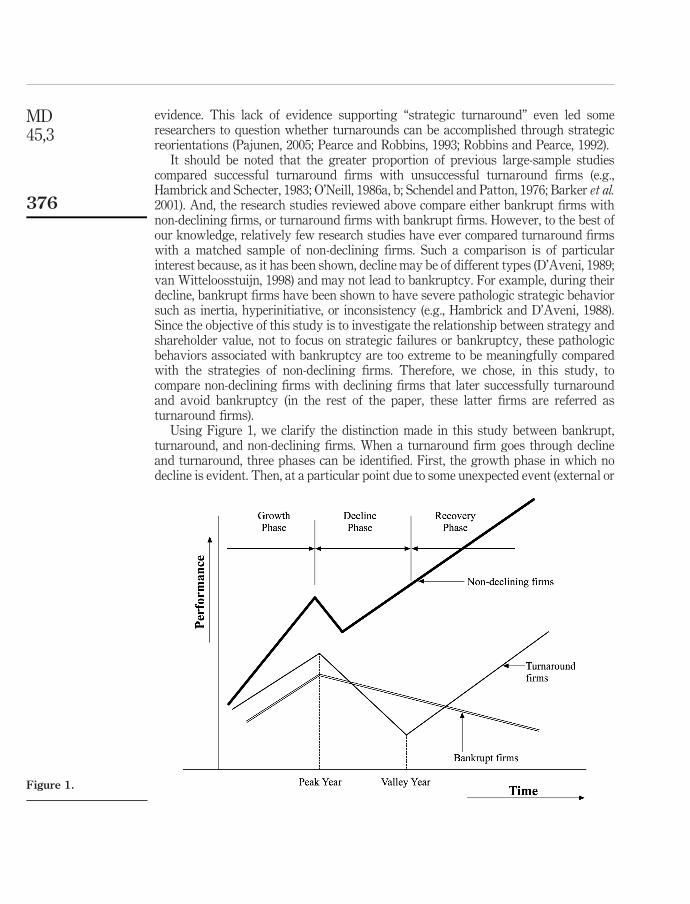
Using Figure 1, we clarify the distinction made in this study between bankrupt,turnaround, and non-declining firms. When a turnaround firm goes through declineand turnaround, three phases can be identified. First, the growth phase in which nodecline is evident. Then, at a particular point due to some unexpected event (external or
Figure 1.
MD45,3
376
internal) performance starts to decline. If the management’s action(s) (strategic oroperational) do not arrest the decline, the firm continues the process of decline (thedecline phase). Eventually, once the firm’s management (old or new) takes some otheraction(s) which are more appropriate, then the decline is arrested and performancestarts to recover (recovery phase). Note that comparable non-declining firms in thesame industry face the identical unexpected event if it is caused by a change in theexternal environment. Although the turnaround firms decline, comparablenon-declining firms do not except in the rare situation of a short-term adverse effectwhen the extent of change is large and unpredictable. Even in such extreme cases,non-declining firms typically face decline just for that particular year, recover thefollowing year and maintain a continued pattern of increase in performance. However,when the unexpected event is an internal matter, the turnaround firms will decline, butthe non-declining firms will not since their internal situations differ and are unique.The three phases are depicted in Figure 1.
HypothesesShareholder value destruction during declineRappaport (1987, 1998) suggested that shareholder value should be measured as aproduct of the stock price and the number of shares outstanding. Since the number ofshares outstanding rarely changes, shareholder value is directly related to the price of astock. Since stock price movement is approximately a random walk, it is difficult evento imagine that there could be a link between strategy and such a measure ofshareholder value. The random movement of stock prices confirms that the financialmarket is efficient. Cootner (1964) suggested that the random movements in stock pricewere around an “intrinsic value” (Graham et al., 1962). Graham et al. (1962) defined the“intrinsic value” of a firm as the net present value of the future stream of income. Thisis called the fundamental analysis model. Financial analysts who value stocks track afirm, its competition, the economy and other related factors which affect the futurestream of income and then estimate its “intrinsic value”. If the price of a stock is beyonda given level above its “intrinsic value”, then the analyst would recommend a “sell”decision and vice versa. According to Cootner (1964), such profit-taking behaviorcombined with intense competition ensured that the random walk observed stayswithin a narrow band around the “intrinsic value”.
In the fundamental analysis model, the “intrinsic value” of a firm depends on manyfactors and a firm’s strategy is only one of them. If we wish to capture the impact ofstrategy on shareholder value, then the measure used to capture shareholder valueshould control for the impact of other extraneous factors. Neither the cumulativereturns to the investor (dividend plus price increase) nor the abnormal return measurecontrol for such extraneous variables. Cumulative returns are the cumulative value ofreturns to shareholders and this does not exclude shareholder gains due to favorableenvironmental changes. Since abnormal returns do not control for the impact of factorsother than an event under study, it can only be used to capture the impact of that eventover a narrow window[1]. Thus, cumulative and abnormal return measures ofshareholder value are not very useful for the purpose of assessing the impact ofstrategy on shareholder value. Lubatkin (1987) recognized this issue and attempted touse prior performance to control for these extraneous variables. However, this is notappropriate for two reasons: First, the extraneous variables could change between the
Decline andturnaround
377
period under study and the control period (when the abnormal returns prior to theevent were estimated). Second, under the assumption of an efficient financial market,the abnormal returns over such long periods should be zero (or at least negligiblysmall) making such corrections useless. Therefore in this study, beta excess returns areused to capture changes in shareholder value attributable to firm specific factors(which could include dividend pay out, unexpected changes in income, retainedearnings, and corporate strategy among many other firm specific factors).
The fundamental analysis model suggests that shareholder value is the net presentvalue of the future stream of income (Rappaport, 1987, 1998). This implies that a dropin income in the near future will be valued, and weighted, higher than similar drops ina more distant future. Hence, firms facing a decline in their income stream will have asharp drop in shareholder value and this in turn will result in negative beta excessreturns. In a perfect financial market, this re-valuation would occur in the first year ofdecline. But, according to previous research findings (e.g., Fama et al., 1969), it appearsthat as new information on the continued decline reaches the market, firm value (i.e. itsstock price) would be adjusted to account for this continued drop in income. Therefore,if one measures beta excess returns every year during decline, it would be negative forturnaround firms. Since, non-declining firms continue to grow and since the corporatestrategy of these firms would normally not be changed, their beta excess returns willbe negligibly small. Hence the following hypotheses:
H1. Cumulative beta excess returns over the decline phase for turnaround firmswill be negative and will be less than those of non-declining firms.
H2. Cumulative beta excess returns over each year during decline for turnaroundfirms will be negative and will be less than those of non-declining firms.
In H1, we examined change in shareholder value over the complete decline phasewhereas in H2, the same phenomenon is examined over each year during the declinephase to evaluate how the stock market adapts to new information.
Link between strategy and shareholder valueShareholder value depends on the future stream of income and is affected byinformation on any factor that may affect the income stream. Such information mayinvolve economic predictions, substitute technologies, movements in currencyexchange rates, legal disputes, competitor’s moves, strategic investments, and so on.However, as long as such information affects all firms with similar risk to the sameextent, the beta excess returns will not change but remain negligible. But, if theinformation affects one firm more adversely than the rest, the beta excess returns ofsuch a firm will become negative. During decline, unanticipated changes coupled withinappropriate strategic conduct result in a decline in performance. Therefore, weexamine the strategic conduct of such firms and compare them to those ofnon-declining firms, we can test the link between strategy and shareholder value,provided we control for changes in retained earnings or changes in income.
In order to specify clearly the direction of impact of each of the conduct variables onshareholder value (on cumulative beta excess returns), it is important to examine eachvariable separately. Following previous researchers in the turnaround literature(Grinyer et al., 1988; Hofer, 1980; Hofer and Schendel, 1978; Schendel et al., 1976;
MD45,3
378
Schendel and Patton, 1976), these variables are grouped into operations related(near-term oriented) or strategic (long-term oriented).
Operations-related variables invariably focus on improving efficiency and shouldhave an immediate effect. Thus, if changes in operations related variables improveefficiency and hence improve profitability, then shareholder value will increase. Thatis, if efficiency improves, beta excess returns will be positive. Strategic variables focuson improving the competitiveness of a firm. They are long-term oriented and theireffect on a firm profitability only accrues in the future. In this case, the improvement ofa strategic variable will be discounted by the financial market and its impact onshareholder value will be smaller than that of operations-related variables.
Manufacturing cost, accounts receivable, and accounts payable are classified to beoperations related whereas capital expenditure is considered strategic. Marketing costsare more difficult to classify as purely efficiency related or strategic since their impactcould improve both short term profitability through increase in volume of sales andlong-term profitability through market development (Harker, 1998; Robbins andPearce, 1992, 1993). If manufacturing expenses are controlled and decrease,manufacturing efficiency increases and shareholder value increases. In the case ofmarketing costs, the relationship is more ambiguous, though reductions in marketingcosts may improve marketing efficiency in the short term, the long-term effect could bereduced sales and reduced brand image. In a similar vein, an increase in marketingcosts may improve sales in the near term up to a point beyond which the sales maystagnate. In the case of a decline, we hypothesize that the short-term effect is moreimportant than the long-term effect and an increase in marketing costs will have anegative impact on shareholder value. Accounts payable should be positively related toshareholder value since they reflect how effectively a firm utilizes trade credit to itsbenefit. Whereas, accounts receivable should have the opposite effect since it increasesthe firm’s cost of capital. As far as strategic (long-term oriented) variables areconcerned, they should have a positive impact on shareholder value. However, in thecase of a turnaround situation, their impact may be more difficult to predict. Accordingto retrenchment theory (Robbins and Pearce, 1992; Pearce and Robbins, 1993),retrenchment, defined as a reduction in firm assets and costs, is strongly associatedwith a successful turnaround. This implies that during the decline phase of aturnaround, strategic variables such as capital expenditures would have a negativeeffect on shareholder value. However, retrenchment theory has been challenged byBarker and Mone (1994) and in some cases a change in strategy is needed toturnaround. Overall, we think that capital expenditures are likely to have a negativeeffect on shareholder value at the beginning of the decline phase and a positive effectlater on. During the beginning of the decline, the stock market may consider that thefirm is spending too much (and hence negative beta excess returns), but later in thedecline phase, it may consider an increase in capital expenditures as a needed attemptto turnaround (and hence lead to positive beta excess returns).
The following hypotheses are based on the above discussions:
H3. The impact of manufacturing cost, marketing expenditures and accountsreceivable on beta excess returns is likely to be negative whereas, the impactof accounts payable is likely to be positive.
Decline andturnaround
379
H4. The impact of capital expenditures on beta excess returns is likely to benegative during the first year of decline and positive in the years there-after.
MethodologySampleTurnaround firms were selected on the basis of a survey of the business press from1975 through 1985. Four business publications (Wall Street Journal, Business Week,Fortune, and Forbes) were searched for mention of decline or turnaround or anyequivalent word. Firms that were covered in the business press as turnaround firmsconstitute the population of interest. This methodology for selecting the turnaroundfirms was selected because shareholder value was the focus of the study, and so it wasimportant that information on turnaround firms was available to investors. From thefirms identified by this phase, those publicly traded in manufacturing industries wereretained in the sample because the nature of strategic change may be somewhatdifferent then in service industries (Barker and Duhaime, 1997; O’Neill, 1981). Of thesemanufacturing firms, only firms that underwent at least three years of decline inoperating cash flows were retained. Some previous studies (Barker and Mone, 1994;Robbins and Pearce, 1992) used a two-year decline as one of the criteria for their sampledesign. However, in this case because we wish to ensure that the need for strategicchange is high (Barker and Duhaime, 1997), we think that a three-year period is moreappropriate. Operating cash flows were used rather than the ROI or ROS measures,used by Barker and Mone (1994) and Robbins and Pearce (1992), because operatingcash flows are directly related to shareholder value. In all, 58 turnaround firmssatisfied all the requirements.
We constructed a control group which consisted of a sample of firms which did notface continuous decline[2]. These firms were selected from the same industry as each ofthe turnaround firms and were of approximately similar size during the peak year (theyear before the first year of decline, see Figure 1). Since industry conditions could havea strong impact on the future stream of income, it is necessary to control for industryconditions (Hambrick and Schecter, 1983; Robbins and Pearce, 1992; Schendel andPatton, 1976). Size could help a firm to sustain its decline; it is also an indicator of theextent of the firm’s resources that are available to reorient its strategy (Barker andDuhaime, 1997). There were industries (Porter, 1980) (e.g., the steel industry, SIC 3312)where every firm had faced decline in operating cash flows for over three years during1975-1985 and hence turnaround firms from these industries could not be included inthe sample. The resultant control sample contains 45 firms.
Variables and data sourcesMeasuring shareholder value. As mentioned earlier, we used beta excess returns toestimate changes in shareholder value. Fama et al. (1969) used beta excess returns intheir examination of stock splits and the process of stock price adjustment to newinformation. Though there have been suggestions that beta excess returns capture theoverreaction of the market, Chopra et al. (1992) have shown that such overreaction issmall for medium and large firms. Chopra et al. (1992) concluded that beta excessreturns could be used to assess the impact of firm specific factors on stock price over along period of time if the estimation controls for changes in beta (the issue ofnonstationarity). This can be achieved by re-estimating beta at appropriate intervals.
MD45,3
380
The daily return data tapes on the security prices maintained by the Center forResearch on Security Prices (CRSP) at the University of Chicago contain theinformation on beta excess returns for each stock that satisfies the minimumrequirements on data availability, trading, etc. These beta excess returns are estimatedevery year by estimating the beta for each stock, using all the daily returns dataavailable and then grouping all the stocks into ten portfolios of the approximatelysame beta level. Beta excess returns for a firm are then calculated as the differencebetween the actual return for the day less the estimated return for a portfolio of similarbeta level. Beta excess returns remain negligibly small and around zero if there are nofirm specific unanticipated events leading to very steep changes in the stock price. Ifthere is a industry-wide or economy-wide unanticipated event, all the stocks in theindustry or the economy will be affected to the same extent and hence the return to theportfolio of similar beta level will reflect it and hence the beta excess return should stillremain very small. But, if the unanticipated event is firm specific, then only this firm’sstock price will be revised and hence the beta excess returns will be different from zero(positive if the event is favorable and negative if the event is unfavorable). Thus, betaexcess returns are better suited for capturing changes in shareholder value that areclosely linked to firm specific events and not due to the impact of events common tomost stocks. To assess changes in shareholder value over any period, daily beta excessreturns are summed over that period. Such a measure is called the cumulative betaexcess return[3].
Measuring corporate strategy. Strategy may be defined as a pattern in a stream ofresource allocation decisions (Hofer and Schendel, 1978; Mintzberg, 1978; Mintzbergand Waters, 1982; Venkatraman and Prescott, 1990). Since there are a large number ofresource allocation decisions, it is important to choose the most appropriate ones tocapture strategy (Arend, 2004). The measures used in this study are based on theresearch by Prescott (1983) who used a set of 16 variables to capture the strategy of afirm. In his study, Prescott examined business units and developed a set of 16 variablesbased on the Profit Impact of Marketing Strategies (PIMS) database. These variableswere subsequently used for several studies using the PIMS database (e.g., Prescott,1986; Prescott et al., 1986; Venkatraman and Prescott, 1990). In this study, we used theCOMPUSTAT database maintained by the Standard & Poors Co. Since data in theCOMPUSTAT database are not available on all the 16 variables, we used a subset offive variables. These strategic conduct variables used are:
(1) manufacturing costs;
(2) marketing costs;
(3) accounts receivable;
(4) accounts payable; and
(5) capital expenditure.
Manufacturing costs, marketing costs, accounts receivable, and accounts payable areoperations related variables (short-term oriented), and capital expenditures is astrategic variable (long-term oriented). Strategic conduct variables were calculated asthe corresponding expenditure value divided by net sales so that all variables will bedimensionless and be within the range 0 and 1. The definition of these variables can befound in Table I.
Decline andturnaround
381
Control variables. There is strong empirical evidence to suggest that shareholdervalue is directly affected by unanticipated changes in income (Ball and Brown, 1968).Moreover, there is a strong feeling that the financial markets react strongly to changes inincome and hence American managers are more concerned about increasing short-termprofits than increasing long-term performance. Since decline is associated with a drop inperformance, which is highly correlated to income, it could be argued that a change inshareholder value can result from a change in income and not from a change in strategy.Hence, it is important to control for changes in income. Following Cootner’s (1964) model,since both income and retained earnings are strongly correlated, we used the change inretained earnings as the control variable in this study.
ResultsFirst, correlation analyses were carried out to assess the correlations between strategyconduct variables for turnaround firms and non-declining firms combined as onegroup. Then, multivariate regression analyses were used to assess the impact ofstrategy conduct variables on shareholder value. Regression analyses were conductedfor every year over the decline period. The control variable used was change inretained earnings, which should capture the change in the “intrinsic value”.
H1 has two parts: the first part related to the absolute value of cumulative betaexcess returns of the turnaround firms whereas the second part related to comparingthe beta excess returns of turnaround firms to those of non-declining firms duringdecline. The first part of H1 is tested by carrying out a t-test, while, the second part isperformed by carrying out an analysis of variance (ANOVA). Both parts of thehypothesis are examined for the first year of decline, the first two years, and first threeyears. The results of the t-tests as well as those of ANOVA are found in panel A ofTable II. Both parts of this hypothesis are strongly supported. The cumulative betaexcess returns over the decline phase for the turnaround firms are negative andsignificantly smaller than those for non-declining firms. This means that, ashypothesized, turnaround firms faced a drop in their shareholder value and thatnon-declining firms did not.
H2 essentially suggests that the valuation mechanisms will adjust shareholdervalue every year rather than during the very first year of decline. If shareholder valuegets adjusted during the first year, cumulative returns during the latter years of declinewill not be different from zero. Just as for testing H1, t-tests were carried out to testwhether or not beta excess returns over every year were negative and ANOVA wasused to test whether beta excess returns for turnaround firms differed from those fornon-declining firms for every year of decline. The results are presented in panel B ofTable II. Cumulative beta excess returns over every year during the decline phase werenegative and significantly different from zero. The results confirm that shareholder
Strategic conduct variables Definitions
1. Manufacturing cost Manufacturing costs/net sales2. Marketing cost Marketing costs/net sales3. Accounts receivable Accounts receivable/net sales4. Accounts payable Accounts payable/net sales5. Capital expenditure Capital expenditure/net sales
Table I.List of strategic conductvariables
MD45,3
382
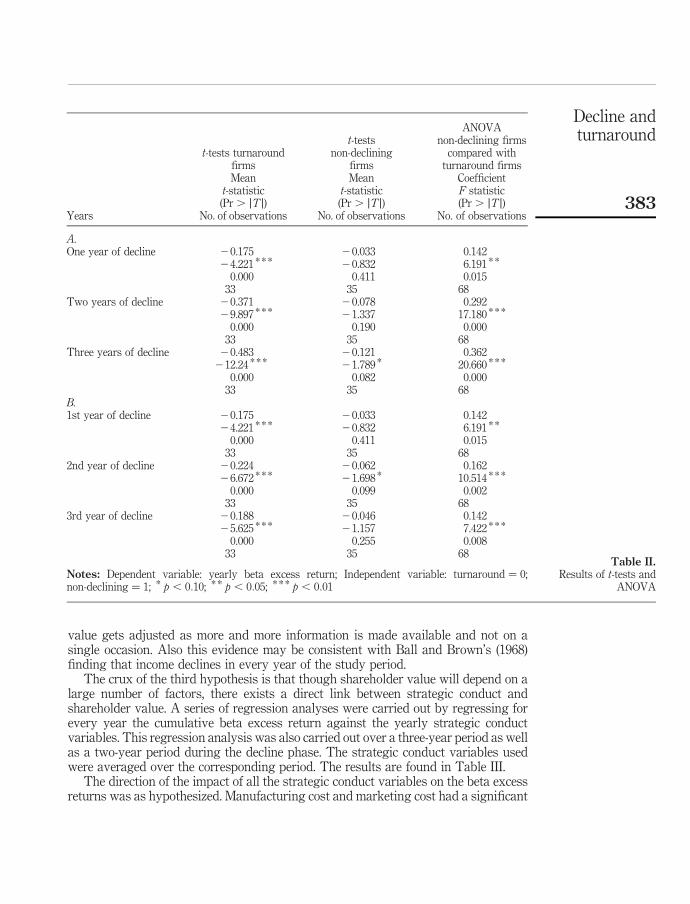
value gets adjusted as more and more information is made available and not on asingle occasion. Also this evidence may be consistent with Ball and Brown’s (1968)finding that income declines in every year of the study period.
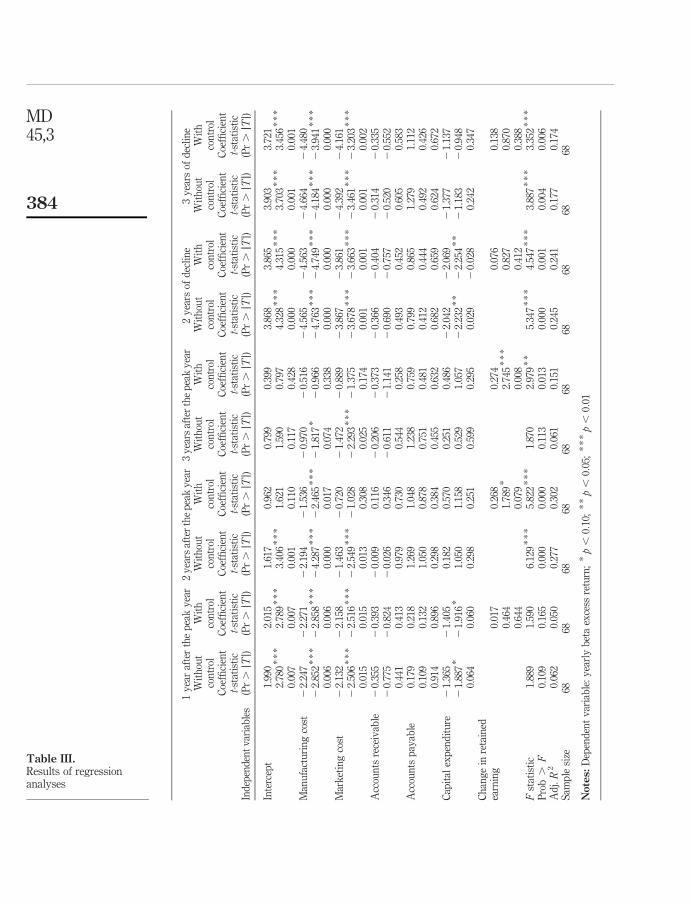
The crux of the third hypothesis is that though shareholder value will depend on alarge number of factors, there exists a direct link between strategic conduct andshareholder value. A series of regression analyses were carried out by regressing forevery year the cumulative beta excess return against the yearly strategic conductvariables. This regression analysis was also carried out over a three-year period as wellas a two-year period during the decline phase. The strategic conduct variables usedwere averaged over the corresponding period. The results are found in Table III.
The direction of the impact of all the strategic conduct variables on the beta excessreturns was as hypothesized. Manufacturing cost and marketing cost had a significant
t-tests turnaroundfirms
t-testsnon-declining
firms
ANOVAnon-declining firms
compared withturnaround firms
Mean Mean Coefficientt-statistic t-statistic F statistic(Pr . jTj) (Pr . jTj) (Pr . jTj)
Years No. of observations No. of observations No. of observations
A.One year of decline 20.175 20.033 0.142
24.221 * * * 20.832 6.191 * *
0.000 0.411 0.01533 35 68
Two years of decline 20.371 20.078 0.29229.897 * * * 21.337 17.180 * * *
0.000 0.190 0.00033 35 68
Three years of decline 20.483 20.121 0.362212.24 * * * 21.789 * 20.660 * * *
0.000 0.082 0.00033 35 68
B.1st year of decline 20.175 20.033 0.142
24.221 * * * 20.832 6.191 * *
0.000 0.411 0.01533 35 68
2nd year of decline 20.224 20.062 0.16226.672 * * * 21.698 * 10.514 * * *
0.000 0.099 0.00233 35 68
3rd year of decline 20.188 20.046 0.14225.625 * * * 21.157 7.422 * * *
0.000 0.255 0.00833 35 68
Notes: Dependent variable: yearly beta excess return; Independent variable: turnaround ¼ 0;non-declining ¼ 1; * p , 0:10; * * p , 0:05; * * * p , 0:01
Table II.Results of t-tests and
ANOVA
Decline andturnaround
383
1y
ear
afte
rth
ep
eak
yea
r2
yea
rsaf
ter
the
pea
ky
ear
3y
ears
afte
rth
ep
eak
yea
r2
yea
rsof
dec
lin
e3
yea
rsof
dec
lin
eW
ith
out
con
trol
Wit
hco
ntr
olW
ith
out
con
trol
Wit
hco
ntr
olW
ith
out
con
trol
Wit
hco
ntr
olW
ith
out
con
trol
Wit
hco
ntr
olW
ith
out
con
trol
Wit
hco
ntr
olC
oeffi
cien
tC
oeffi
cien
tC
oeffi
cien
tC
oeffi
cien
tC
oeffi
cien
tC
oeffi
cien
tC
oeffi
cien
tC
oeffi
cien
tC
oeffi
cien
tC
oeffi
cien
tt-
stat
isti
ct-
stat
isti
ct-
stat
isti
ct-
stat
isti
ct-
stat
isti
ct-
stat
isti
ct-
stat
isti
ct-
stat
isti
ct-
stat
isti
ct-
stat
isti
cIn
dep
end
ent
var
iab
les
(Pr.
jTj)
(Pr.
jTj)
(Pr.
jTj)
(Pr.
jTj)
(Pr.
jTj)
(Pr.
jTj)
(Pr.
jTj)
(Pr.
jTj)
(Pr.
jTj)
(Pr.
jTj)
Inte
rcep
t1.
990
2.01
51.
617
0.96
20.
799
0.39
93.
868
3.86
53.
903
3.72
12.
780
**
*2.
789
**
*3.
406
**
*1.
621
1.59
00.
797
4.32
8*
**
4.31
5*
**
3.70
3*
**
3.45
6*
**
0.00
70.
007
0.00
10.
110
0.11
70.
428
0.00
00.
000
0.00
10.
001
Man
ufa
ctu
rin
gco
st2
2.24
72
2.27
12
2.19
42
1.53
62
0.97
02
0.51
62
4.56
52
4.56
32
4.66
42
4.48
02
2.85
2*
**
22.
858
**
*2
4.28
7*
**
22.
465
**
*2
1.81
7*
20.
966
24.
763
**
*2
4.74
9*
**
24.
184
**
*2
3.94
1*
**
0.00
60.
006
0.00
00.
017
0.07
40.
338
0.00
00.
000
0.00
00.
000
Mar
ket
ing
cost
22.
132
22.
158
21.
463
20.
720
21.
472
20.
889
23.
867
23.
861
24.
392
24.
161
22.
506
**
*2
2.51
6*
**
22.
549
**
*2
1.02
82
2.29
3*
**
21.
375
23.
678
**
*2
3.66
3*
**
23.
461
**
*2
3.20
3*
**
0.01
50.
015
0.01
30.
308
0.02
50.
174
0.00
10.
001
0.00
10.
002
Acc
oun
tsre
ceiv
able
20.
355
20.
393
20.
009
0.11
62
0.20
62
0.37
32
0.36
62
0.40
42
0.31
42
0.33
52
0.77
52
0.82
42
0.02
60.
346
20.
611
21.
141
20.
690
20.
757
20.
520
20.
552
0.44
10.
413
0.97
90.
730
0.54
40.
258
0.49
30.
452
0.60
50.
583
Acc
oun
tsp
ayab
le0.
179
0.21
81.
269
1.04
81.
238
0.75
90.
799
0.86
51.
279
1.11
20.
109
0.13
21.
050
0.87
80.
751
0.48
10.
412
0.44
40.
492
0.42
60.
914
0.89
60.
298
0.38
40.
455
0.63
20.
682
0.65
90.
624
0.67
2C
apit
alex
pen
dit
ure
21.
365
21.
405
0.18
20.
570
0.25
10.
486
22.
042
22.
069
21.
377
21.
137
21.
887
*2
1.91
6*
1.05
01.
158
0.52
91.
057
22.
232
**
22.
254
**
21.
183
20.
948
0.06
40.
060
0.29
80.
251
0.59
90.
295
0.02
92
0.02
80.
242
0.34
7C
han
ge
inre
tain
edea
rnin
g0.
017
0.26
80.
274
0.07
60.
138
0.46
41.
789
*2.
745
**
*0.
827
0.87
00.
644
0.07
90.
008
0.41
20.
388
Fst
atis
tic
1.88
91.
590
6.12
9*
**
5.82
2*
**
1.87
02.
979
**
5.34
7*
**
4.54
7*
**
3.88
7*
**
3.35
2*
**
Pro
b.
F0.
109
0.16
50.
000
0.00
00.
113
0.01
30.
000
0.00
10.
004
0.00
6A
dj.R
20.
062
0.05
00.
277
0.30
20.
061
0.15
10.
245
0.24
10.
177
0.17
4S
amp
lesi
ze68
6868
6868
6868
6868
68
Notes:
Dep
end
ent
var
iab
le:
yea
rly
bet
aex
cess
retu
rn;
*p,
0:10
;*
*p,
0:05
;*
**p,
0:01
Table III.Results of regressionanalyses
MD45,3
384
impact in the hypothesized direction right through the decline phase (i.e. the higher themanufacturing (marketing) cost, lower the beta excess return). Accounts receivableand accounts payable did not have significant impact but their impact was in thepredicted direction (i.e. the higher the accounts receivable (payable), lower (higher) thebeta excess return). The impact of capital expenditures was in the same direction ashypothesized, though its impact was significant in only the first year of decline. Theimpact of capital expenditures was negative (the higher the capital expenditure, lowerthe beta excess return) in the first year of decline, which was statistically significant. Itwas positive (the higher the capital expenditure, higher the beta excess return) in thesecond and third year of decline (but not statistically significant).
Regressions were also separately run using a control for change in retainedearnings. The regression analysis’ explanatory power increased but it did not affect theimpact of strategic conduct variables. The impact change in retained earnings wassignificant and positive (i.e. as expected) in the second and third years of decline.
DiscussionIn this study, our main aim was to empirically test the impact of strategic conduct onshareholder value in decline situations. Results of the hypothesis testing supportedthat value changes occurred incrementally – over the three years of decline understudy. That is, investors adjusted the value of stocks as additional new informationreached them. These findings are similar to those of Fama et al. (1969).
As far as the impacts of strategy conduct variables were concerned, the impact ofthese variables was in the hypothesized direction though not all were statisticallysignificant. Variables that have immediate impact on profits and profitability had animmediate impact on shareholder value as well. On the other hand, the variable, capitalexpenditures (a strategic variable) had a significant impact on shareholder value onlyduring the first year of decline. During this first year of decline, capital expenditureswere negatively and significantly associated with beta excess returns. During the latteryears of decline, capital expenditures were positively associated with beta excess returnsbut not significantly. This means that investors may value retrenchment strategies(which presumably have immediate effect) highly in comparison to long-term strategies.This supports Robbins and Pearce (1992) argument that retrenchment strategies are aprerequisite for successful turnarounds. This is consistent with the argument of Bibeault(1982) and others who consider that arresting the “bleeding” by the required “surgery” isan important first step for a firm to successfully turnaround. As pointed out earlier, aslong as an action taken by the management improves efficiency, such an action shouldhave positive impact on shareholder value. To that extent, the positive link betweenmanufacturing efficiency and marketing efficiency is empirically supported. The resultsalso confirmed that the impact of changes in retained earnings did not affect the impactof these strategy variables.
One interesting aspect of the findings is that the moderating variable included didincrease the explanatory power of the model but did not in any way reduce the impactof the strategic conduct variables. Changes in retained earnings had a consistentpositive impact on the beta excess returns as suggested by Cootner (1964).
The lack of significant impact of some of these variables on shareholder value shouldnot be interpreted to mean that investors were not sensitive to changes in strategyconduct variables. It may be that the impact of some of these variables on the income
Decline andturnaround
385
stream could be marginal and hence might not alter whether or not a firm successfullyturns around. If a firm continued to operate inefficiently in manufacturing andmarketing, it could fail to turnaround and hence investors weigh these strategy variableshighly in comparison to accounts receivable and accounts payable. Also, contributionsfrom savings in accounts receivable and accounts payable could be much lesscomparatively. In fact, it could also be argued that the relationship between these twovariables (accounts receivable and accounts payable) and performance is not simple anddirect. Because accounts receivable may lead to economies of scale, it could be used toincrease sales and result in an improvement in manufacturing efficiency. Therefore,accounts receivable could be positively associated with shareholder value. However, ifaccounts receivable increase too much, it could be because of poor debt collectionpractices and hence, the impact of large accounts receivable could be negative. In the caseof accounts payable, excessive use of trade credit could result in a strained relationshipwith suppliers and hence the transaction costs could increase reducing the efficiency.Also, firms performing poorly tend to fail to meet the credit terms of suppliers and hencemay have higher accounts payable. Therefore, the higher the accounts payable, the lowerthe income stream and, hence, the lower the shareholder value.
Limitations and directions for further researchOne of the major contributions of the results of this research is to empirically supportthe relationship between corporate strategy and shareholder value, as measured bybeta excess returns. Our results also indirectly provide empirical support for Cootner’s(1964) model where stock price’s movements occur around the intrinsic value. Inaddition, the use of beta excess returns to measure shareholder value proved to beeffective, suggesting that cumulative beta excess returns methods capture strategychanges very effectively. In future studies, it is possible that an excess return to anindustry portfolio may prove to be a better measure, because it could highlight evenmore clearly the relationship between strategy and shareholder value.
The measurement of corporate strategy could also be improved in future research.While the measures used were acceptable and consistent in terms of previous researchstudies, they could have been further assessed relative to industry norms. However,this was not possible because of the multi-industry nature of the study. It should benoted that, although this study used only a subset of variables which Prescott (1983)developed, it could perhaps be enhanced through the use of survey or interview datawith top management personnel in the study firms, as suggested by Barker andDuhaime (1997). This, in turn, might lead to a set of “fine-grained” measures ofcorporate strategy. The trade-off is obviously between the depth of survey-type casestudy research and the more quantitative analysis offered here.
It should also be stressed that, while the choice of decline situations as the area ofstudy provided high-quality and easily detectable differences in strategy, it tended tolimit the sample size of available firms and perhaps, to some extent, the quality of data.(This is because firms only report the minimum required information when they facesituations of decline, crisis and constraints in resources.) An alternative sample design,perhaps involving random samples of firms, might have increased the sample size offirms studied but this would have been achieved at the expense of identifying asatisfactory number of changes in strategies and strategic postures taken by thosefirms.
MD45,3
386
Notes
1. That is, it is assumed that the extraneous variables do not change during that narrowwindow.
2. Some firms in this control group may, in some instances, have faced a one-year decline (thefirst year after the peak year) but were on the growth path the next year.
3. In this paper, we have used “beta excess returns” and “cumulative beta excess returns”interchangeably. When shareholder value changes over a period is under consideration, themeasure used is “cumulative beta excess returns” over that period whatever the terminologyused.
References
Arend, R.J. (2004), “The definition of strategic liabilities and their impact on firm performance”,Journal of Management Studies, Vol. 41 No. 6, pp. 1003-27.
Argenti, J. (1976), Corporate Collapse: The Causes and Symptoms, McGraw-Hill, London.
Arogyaswamy, K. (1992), “Organizational turnaround: a two-stage strategy-contingency model”,unpublished doctoral dissertation, University of Wisconsin-Milwaukee, Milwaukee, WI.
Aziz, A., Emanuel, D.C. and Lawson, G.H. (1988), “Bankruptcy prediction: an investigation ofcash flow based models”, Journal of Management Studies, Vol. 25 No. 5, pp. 419-37.
Baldwin, J. and Glezen, G.W. (1992), “Bankruptcy prediction using quarterly financial statementdata”, Journal of Accounting, Auditing & Finance., Vol. 7, Summer, pp. 269-89.
Ball, R. and Brown, P. (1968), “An empirical evaluation of accounting income numbers”, Journalof Accounting Research, Vol. 6 No. 2, pp. 159-78.
Barker, V.L. III and Duhaime, I.M. (1997), “Strategic change in the turnaround process: theoryand empirical evidence”, Strategic Management Journal, Vol. 18 No. 1, pp. 13-38.
Barker, V.L. III and Mone, M.A. (1994), “Retrenchment: cause of turnaround or consequence ofdecline?”, Strategic Management Journal, Vol. 15 No. 5, pp. 395-405.
Barker, V.L. III, Patterson, P.W. Jr and Mueller, G.C. (2001), “Organizational causes and strategicconsequences of the extent of top management team replacement during turnaroundattempts”, Journal of Management Studies, Vol. 38 No. 2, pp. 235-69.
Bibeault, D.B. (1982), Corporate Turnaround: How Managers Turn Losers into Winners,McGraw-Hill, New York, NY.
Blyth, M.L., Friskey, E.A. and Rappaport, A. (1986), “Implementing the shareholder valueapproach”, Journal of Business Strategy, Vol. 6, Winter, pp. 48-58.
Brearley, R.A. and Myers, S.C. (2002), Principles of Corporate Finance, 7th ed., McGraw-Hill, NewYork, NY.
Cameron, K.S., Sutton, R.I. and Whetten, D.A. (1988), Readings in Organizational Decline:Frameworks, Research and Prescriptions, Balinger, Cambridge, MA.
Chan, S.H., Martin, J.D. and Kensinger, J.V. (1990), “Corporate research and developmentexpenditures and share value”, Journal of Financial Economics, Vol. 26 No. 2, pp. 255-76.
Chatterjee, S. (1986), “Types of synergy and economic value: the impact of acquisitions onmerging and rival firms”, Strategic Management Journal, Vol. 7 No. 2, pp. 219-39.
Chatterjee, S., Lubatkin, M.H., Schweiger, D.M. and Weber, Y. (1992), “Cultural differences andshareholder value in related mergers: linking equity and human capital”, StrategicManagement Journal, Vol. 13 No. 5, pp. 319-34.
Chauvin, K.W. and Hirschey, M. (1993), “Advertising: R&D expenditures and the market value ofthe firm”, Financial Management, Vol. 22, Winter, pp. 128-40.
Decline andturnaround
387
Chopra, N., Lakonishok, J. and Ritter, J.R. (1992), “Measuring abnormal performance: do stocksoverreact?”, Journal of Financial Economics, Vol. 31 No. 3, pp. 235-68.
Chowdhury, S.D. (2002), “Turnarounds: a stage theory perspective”, Canadian Journal ofAdministrative Sciences, Vol. 19 No. 3, pp. 249-66.
Cootner, P. (Ed.) (1964), The Random Character of Stock Prices, MIT Press, Cambridge, MA.
D’Aveni, R.A. (1989), “The aftermath of organizational decline: a longitudinal study of thestrategic and managerial characteristics of declining firms”, Academy of ManagementJournal, Vol. 32 No. 3, pp. 577-605.
D’Aveni, R.A. (1990), “Top managerial prestige and organizational bankruptcy”, OrganizationScience, Vol. 1 No. 2, pp. 121-42.
D’Aveni, R.A. and MacMillan, I. (1990), “Crisis and the content of managerial communications:a study of the focus of attention of top managers in surviving and failing firms”,Administrative Science Quarterly, Vol. 35 No. 4, pp. 634-57.
Daily, C.M. (1996), “Governance patterns in bankruptcy reorganizations”, Strategic ManagementJournal, Vol. 17, pp. 355-75.
Daily, C.M. and Dalton, D.R. (1994a), “Corporate governance and the bankrupt firm”, StrategicManagement Journal, Vol. 15 No. 8, pp. 643-54.
Daily, C.M. and Dalton, D.R. (1994b), “Bankruptcy and corporate governance: the impact of boardcomposition and structure”, Academy of Management Journal, Vol. 37 No. 6, pp. 1603-17.
Doyle, P. (2000), Value-based Marketing, John Wiley & Sons, Chichester.
Eddy, A.R. and Saunders, G.B. (1980), “New product announcements and stock prices”, DecisionSciences, Vol. 11 No. 1, pp. 90-7.
Fama, E., Fisher, L., Jensen, M. and Roll, R. (1969), “The adjustment of prices to newinformation”, International Economic Review, Vol. 10, February, pp. 1-21.
Filatotchev, I. and Toms, S. (2006), “Corporate governance and financial constraints on strategicturnarounds”, Journal of Management Studies, Vol. 43 No. 3, pp. 407-33.
Gales, L.M. and Kesner, I.F. (1994), “An analysis of board of director size and composition inbankrupt organizations”, Journal of Business Research, Vol. 30 No. 3, pp. 271-82.
Graham, B., Dodd, D.L. and Cottle, S. (1962), Security Analysis: Principles and Techniques, 4th ed.,McGraw-Hill, New York, NY.
Grinyer, P.H. and Spender, J.C. (1979), “Recipes, crises and adaptation in mature businesses”,International Studies of Management and Organization, Vol. 9 No. 3, pp. 113-33.
Grinyer, P.H., Mayes, D.G. and McKiernan, P. (1988), Sharpbenders: The Secrets of UnleashingCorporate Potential, Basil Blackwell, Oxford.
Hambrick, D.C. and D’Aveni, R.A. (1988), “Large corporate failures as downward spirals”,Administrative Science Quarterly, Vol. 33 No. 1, pp. 1-23.
Hambrick, D.C. and D’Aveni, R.A. (1992), “Top team deterioration as part of the downward spiralof large corporate bankruptcies”, Management Science, Vol. 38 No. 10, pp. 1445-66.
Hambrick, D.C. and Schecter, S. (1983), “Turnaround strategies in mature industrial-productbusiness units”, Academy of Management Journal, Vol. 26 No. 2, pp. 231-48.
Hannan, M.T. and Freeman, J. (1977), “The population ecology of organizations”, AmericanJournal of Sociology, Vol. 82, March, pp. 929-64.
Hannan, M.T. and Freeman, J. (1984), “Structural inertia and organizational change”, AmericanSociological Review, Vol. 49 No. 2, pp. 149-64.
MD45,3
388
Harker, M. (1998), “The role of marketing in the company turnaround process”, IndustrialMarketing Management, Vol. 27, pp. 315-27.
Hedberg, B.L.T., Nystrom, P.C. and Starbuck, W.H. (1976), “Camping on seesaws: prescriptionsfor a self-designing organization”, Administrative Science Quarterly, Vol. 21 No. 1,pp. 41-65.
Hofer, C.W. (1980), “Turnaround strategies”, Journal of Business Strategy, Vol. 1 No. 1, pp. 19-31.
Hofer, C.W. and Schendel, D. (1978), Strategy Formulation: Analytical Concepts, West Publishing,St Paul, MN.
Kelm, K.M., Narayanan, V.K. and Pinches, G.E. (1995), “Shareholder value creation during R&Dinnovation and commercialization stages”, Academy of Management Journal, Vol. 38 No. 3,pp. 770-86.
Lamberg, J.A. and Pajunen, K. (2005), “Beyond the metaphor: the morphology of organizationaldecline and turnaround”, Human Relations, Vol. 58 No. 8, pp. 947-80.
Lohrke, F.T., Bedeian, A.G. and Palmer, T.B. (2004), “The race of top management teams informulating and implementing turnaround strategies: a review and research agenda”,International Journal of Management Reviews, Vol. 5-6 No. 2, pp. 63-90.
Lubatkin, M. (1987), “Merger strategies and stockholder value”, Strategic Management Journal,Vol. 8 No. 1, pp. 39-53.
Lubatkin, M. and Chatterjee, S. (1991), “The strategy-shareholder value relationship: testingtemporal stability across market cycles”, Strategic Management Journal, Vol. 12 No. 4,pp. 251-70.
Lubatkin, M. and Shrieves, R.E. (1986), “Toward reconciliation of market performance measuresto strategic management research”, Academy of Management Review, Vol. 11 No. 3,pp. 497-512.
McConnell, J.J. and Muscarella, C.J. (1985), “Corporate capital expenditures and the market valueof the firm”, Journal of Financial Economics, Vol. 14 No. 3, pp. 399-422.
McGee, J., Thomas, H. and Wilson, D. (2005), Strategy: Analysis and Practice, McGraw-Hill,Maidenhead.
Mellahi, K. and Wilkinson, A. (2004), “Organisational failure: a critique of recent research and aproposed integrative framework”, International Journal of Management Reviews, Vol. 5-6No. 1, pp. 21-41.
Merchant, H. (2000), “Event-studies of joint venture formation announcements: a synthesis andsome possible extensions”, in Dahiya, S.B. (Ed.), The Current State of Business Discipline,Spellbound, Rohtak, pp. 1837-61.
Merchant, H. and Schendel, D. (2000), “How do international joint ventures create shareholdervalue?”, Strategic Management Journal, Vol. 21 No. 7, pp. 723-77.
Mintzberg, H. (1978), “Patterns in strategy formation”, Management Science, Vol. 24 No. 9,pp. 934-48.
Mintzberg, H. and Waters, J.A. (1982), “Tracking strategy in an entrepreneurial firm”, Academyof Management Journal, Vol. 25 No. 3, pp. 465-99.
Moulton, W.N. and Thomas, H. (1993), “Bankruptcy as a deliberate strategy: theoreticalconsiderations and empirical evidence”, Strategic Management Journal, Vol. 14 No. 2,pp. 125-35.
Nystrom, P.C. and Starbuck, W.H. (1984), “To avoid organizational crises, unlearn”,Organizational Dynamics, Vol. 12 No. 4, pp. 53-65.
Decline andturnaround
389
O’Neill, H.M. (1981), Turnaround Strategies in the Commercial Banking Industry, UMI ResearchPress, Ann Arbor, MI.
O’Neill, H.M. (1986a), “Turnaround and recovery: what strategy do you need?”, Long RangePlanning, Vol. 19, pp. 80-8.
O’Neill, H.M. (1986b), “An analysis of the turnaround strategy in commercial banking”, Journalof Management Studies, Vol. 23 No. 2, pp. 165-88.
Ormerod, P. (2005), Why Most Things Fail, Faber & Faber, London.
Pajunen, K. (2005), “Comparative causal analysis in processual strategy research: a study ofcausal mechanisms in organisational decline and turnarounds”, Strategy Process, Vol. 22,pp. 415-56.
Pajunen, K. (2006), “Stakeholder influences in organisational survival”, Journal of ManagementStudies, Vol. 43 No. 6, pp. 1261-88.
Pearce, J.A. II and Robbins, D.K. (1993), “Toward improved theory and research on businessturnaround”, Journal of Management, Vol. 19 No. 3, pp. 613-36.
Petkova, R. and Zhang, L. (2005), “Is value riskier than growth?”, Journal of Financial Economics,Vol. 78 No. 1, pp. 187-212.
Porter, M.E. (1980), Competitive Strategy, Free Press, New York, NY.
Prescott, J.E. (1983), “Competitive environments, strategic types, and business performance:an empirical analysis”, unpublished doctoral dissertation, Pennsylvania State University,University Park, PA.
Prescott, J.E. (1986), “Environments as moderators of the relationship between strategy andperformance”, Academy of Management Journal, Vol. 29 No. 2, pp. 329-46.
Prescott, J.E., Kohli, A.K. and Venkatraman, N. (1986), “The market share-profitabilityrelationship: an empirical assessment of major assertions and contradictions”, StrategicManagement Journal, Vol. 7 No. 4, pp. 377-94.
Ramanujam, V. (1984), “Environmental context, organizational context, strategy and corporateturnaround: an empirical investigation”, unpublished doctoral dissertation, University ofPittsburgh, Pittsburgh, PA.
Rappaport, A. (1981), “Selecting strategies that create shareholder value”, Harvard BusinessReview, Vol. 59 No. 3, pp. 139-49.
Rappaport, A. (1983), “Corporate performance standards and shareholder value”, Journal ofBusiness Strategy, Vol. 4 No. 1, pp. 28-38.
Rappaport, A. (1987), “Linking competitive strategy and shareholder value analysis”, Journal ofBusiness Strategy, Vol. 7, pp. 58-67.
Rappaport, A. (1998), Creating Shareholder Value: A Guide for Managers and Investors, The FreePress, New York, NY (originally published in 1986).
Rappaport, A. and Friskey, E.A. (1986), “Quaker Oats and Stokely-Van Camp: did Quaker addshareholder value by acquiring Stokely?”, Mergers & Acquisitions, Vol. 20, pp. 39-46.
Robbins, D.K. and Pearce, J.A. II (1992), “Turnaround: retrenchment and recovery”, StrategicManagement Journal, Vol. 13 No. 4, pp. 287-309.
Robbins, D.K. and Pearce, J.A. II (1993), “Entrepreneurial retrenchment among smallmanufacturing firms”, Journal of Business Venturing, Vol. 8 No. 4, pp. 301-18.
St John, C.H., Balakrishnan, N. and Fiet, J.O. (2000), “Modeling the relationship between corporatestrategy and wealth creation using neural networks”, Computer & Operations Research,Vol. 27 Nos 11-12, pp. 1077-92.
MD45,3
390
Schendel, D. and Patton, G.R. (1976), “Corporate stagnation and turnaround”, Journal ofEconomics and Business, Vol. 28 No. 3, pp. 236-41.
Schendel, D., Patton, G.R. and Riggs, J. (1976), “Corporate turnaround strategies: a study of profitdecline and recovery”, Journal of General Management, Vol. 3 No. 3, pp. 3-11.
Sheppard, J. and Chowdhury, S. (2005), “Riding the wrong wave: organisational failure as a failedturnaround”, Long Range Planning, Vol. 38 No. 3, pp. 239-61.
Slatter, S. (1984), Corporate Recovery: Successful Turnaround Strategies and TheirImplementation, Penguin Books, Harmondsworth.
Starbuck, W.H. and Hedberg, B.L.T. (1977), “Saving an organization from a stagnatingenvironment”, in Thorelli, H. (Ed.), Strategyþ Structure ¼ Performance, Indiana UniversityPress, Bloomington, IN, pp. 249-58.
Starbuck, W.H., Greve, A. and Hedberg, B.L.T. (1978), “Responding to crisis”, Journal of BusinessAdministration, Vol. 9 No. 2, pp. 111-37.
Staw, B.M. (1981), “The escalation of commitment to a course of action”, Academy ofManagement Review, Vol. 6 No. 4, pp. 577-87.
Staw, B.M., Sandelands, L.E. and Dutton, J.E. (1981), “Threat-rigidity effects in organizationalbehavior: a multilevel analysis”, Administrative Science Quarterly, Vol. 26 No. 4, pp. 501-24.
Thietart, R.A. (1988), “Success strategies for businesses that perform poorly”, Interfaces, Vol. 18No. 3, pp. 32-45.
Van Horne, J.C. (2001), Financial Management and Policy, 13th ed., Prentice-Hall, EnglewoodCliffs, NJ.
van Witteloosstuijn, A. (1998), “Bridging behavioral and economic theories of decline:organizational inertia, strategic competition, and chronic failure”, Management Science,Vol. 44 No. 4, pp. 501-19.
Venkatraman, N. and Prescott, J.E. (1990), “Environment-strategy coalignment: an empirical testof its performance implications”, Strategic Management Journal, Vol. 11, December,pp. 1-23.
Woo, C.Y. (1984), “An empirical test of value-based planning models and implications”,Management Science, Vol. 30, September, pp. 1031-50.
Woolridge, J.R. (1988), “Competitive decline and corporate restructuring: is a myopic stockmarket to blame?”, Journal of Applied Corporate Finance, Vol. 1, Spring, pp. 26-36.
Woolridge, J.R. and Snow, C.W. (1992), “Stock market reaction to strategic investment decisions”,Strategic Management Journal, Vol. 11 No. 5, pp. 353-63.
Zajac, E.J. and Bazerman, M.H. (1991), “Blind spots in industry and competitor analysis:implication of interfirm (mis)perceptions for strategic decisions”, Academy of ManagementReview, Vol. 16 No. 1, pp. 37-56.
Further reading
Brown, S.J. and Warner, J.B. (1985), “Using daily stock returns: the case of event studies”, Journalof Financial Economics, Vol. 14 No. 1, pp. 3-31.
Christopher, M. and Ryals, L. (1999), “Supply chain strategy: its impact on shareholder value”,International Journal of Logistics Management, Vol. 10 No. 1, pp. 1-10.
D’Aveni, R.A. (1989), “Dependability and organizational bankruptcy: an application of agencyand prospect theory”, Management Science, Vol. 35 No. 9, pp. 1120-38.
Foster, G. (1986), Financial Statement Analysis, 2nd ed., Prentice-Hall, Englewood Cliffs, NJ.
Decline andturnaround
391
Ginsberg, A. (1988), “Measuring and modeling changes in strategy: theoretical foundations andempirical directions”, Strategic Management Journal, Vol. 9 No. 6, pp. 559-75.
Jacobson, R. (1987), “The validity of ROI as a measure of business performance”, AmericanEconomic Review, Vol. 77, June, pp. 470-8.
Pandian, J.R. (1995), “Shareholder value and strategic action: a study of turnaround firms”,unpublished doctoral dissertation, University of Illinois at Urbana-Champaign,Urbana-Champaign, IL.
Reiman, B. (1987), Managing for Value, Planning Forum, Oxford, OH.
Seed, A.H. III (1985), “Winning strategies for shareholder value creation”, Journal of BusinessStrategy, Vol. 6 No. 2, pp. 44-51.
Snow, C.C. and Hambrick, D.C. (1980), “Measuring organizational strategies: some theoreticaland methodological problems”, Academy of Management Review, Vol. 5 No. 4, pp. 527-38.
Srivastava, R.K., Shervani, T.A. and Fahey, L. (1998), “Market-based assets and shareholdervalue: a framework for analysis”, Journal of Marketing, Vol. 62 No. 1, pp. 2-18.
Stewart, G.B. (1991), The Quest for Value, HarperCollins, New York, NY.
Varaiya, N., Kerin, R. and Weeks, D. (1987), “The relationship between growth, profitability, andfirm value”, Strategic Management Journal, Vol. 8 No. 5, pp. 487-97.
Corresponding authorOlivier Furrer can be contacted at: [email protected]
MD45,3
392
To purchase reprints of this article please e-mail: [email protected] visit our web site for further details: www.emeraldinsight.com/reprints
Top Related