


Languages
Pages
Legal

Maximizing stoichiometry control in reactive sputter deposition of TiO2
Brian D. Hoskinsa)
Materials Department, University of California Santa Barbara, Santa Barbara, California 93106
Dmitri B. StrukovElectrical and Computer Engineering Department, University of California Santa Barbara,Santa Barbara, California 93106
(Received 25 October 2016; accepted 4 January 2017; published 24 January 2017)
Thin films of amorphous TiO2 are grown by direct current (DC) reactive magnetron sputtering. Using
modern models of DC reactive sputtering, conditions were established to maximize control of the
O:Ti ratio by indirectly monitoring the change in ion-induced secondary electron emission of the Ti
target. The Ti resistivity was continuously varied through over 12 orders of magnitude, and changes
in stoichiometry were observed by Rutherford backscattering. Combining observed changes in stoi-
chiometry with a predictive model of the composition, a percolative transition could be observed
exhibiting universal and nonuniversal scaling parameters. VC 2017 American Vacuum Society.
[http://dx.doi.org/10.1116/1.4974140]
I. INTRODUCTION
Reactive sputter deposition of TiO2 films has been exten-
sively studied over the years with a particular emphasis on
growth rates. Emerging technologies, in particular, resistive
random access memory or memristors based on TiOx, have
no growth rate constraints but require a high degree of control
over the departure from stoichiometry in order to maximize
device performance. Models of reactive sputter deposition
like the Berg Model,1–4 which have historically been used to
maximize growth rates,3 can also be used to establish condi-
tions for maximal control over the stoichiometry and can be
implemented either with or without active feedback systems
to defeat target poisoning.5–7
In the Berg model, maximal correspondence between
theory and experiment will occur during conditions of pertur-
bative oxygen flow, i.e., the reactive gas does not contribute
substantially to the sputtering process other than to oxidize
the target chemically. This can be established at relatively
low powers and high fluxes of sputtering gas. Under these
conditions, in the limiting case where gas absorption through
fully oxidized regions of the film can be neglected, it can be
shown (e.g., see Sec. I of supplementary material)26 that the
departure from stoichiometry will vary quadratically with the
oxidation state of the target at small deviations as well as
inversely with the collector:target ratio. Substantially reduced
targets at great distances, therefore, can generate small devia-
tions from stoichiometry in a controllable manner.
It is been experimentally verified that both the coefficient
of ion-induced secondary electron emission (ISEE)8–10 and
sputter yield from suboxide targets vary linearly with the
oxidation state of the target. Consequently, under conditions
of perturbative oxygen flow, the ISEE can be indirectly mea-
sured in situ by monitoring the discharge voltage of the mag-
netron sputtering target or ex situ by measuring the Ti flux.
Continuous control over both implies continuous control
over the composition due to strong coupling between target
and film oxidation.
II. EXPERIMENT
All growths were carried out at room temperature in a
custom built high vacuum sputter chamber pumped by a
Cryotorr 800 with a 1000 l/s pump rate to a base pressure of
3� 10–8 Torr. To pump out target hysteresis, all growths were
conducted with the pump gate valve fully opened. Growths
were conducted at an operating pressure of 600 lTorr induced
by a flow rate of 190 sccm of 99.99% pure Ar. A 3-in. diame-
ter Ti target (99.99% Kurt J Lesker) was used in a Mighty
Mac sputter gun and operated at a sputtering power of 150 W
for all growths. Continuous control over the discharge voltage
was experimentally confirmed by varying the O2 flow rate
from 0 to 16 sccm (see supplementary material).
To control the oxidation state of the target, the relative
change in the discharge voltage, or oxidation factor, for par-
tial oxidation versus full oxidation was chosen as a state var-
iable such that
V� ¼ DV=DVmax: (1)
For such a state variable, V� ¼ 0 should correspond to pure
Ti in both the film and the target and V� ¼ 1 should corre-
spond to TiO2 in both the film and target, thereby represent-
ing a bounded domain over which to vary the thin film
composition. Since these values are easily measured from
the magnetron power supply, it becomes trivial to use a
dimensionless state variable as a process control parameter
allowing reproducible growth of reduced oxide films. Since
V* should depend only on the oxidation state of the target,
provided the background concentration of oxygen is small
enough, it can be a sensitive measure of the state of the tar-
get. Since the Berg model implies the geometry of the cham-
ber (independent of other values such as the magnetron
power which might vary DV and DVmax) determines the rela-
tionship between the target and the film oxidation, V* can be
a useful dimensionless variable to track the composition of
the film by monitoring the state of the target.
Two growth series were conducted so as to characterize
the control over the sputtering process. The first series was aa)Electronic mail: [email protected]
020606-1 J. Vac. Sci. Technol. A 35(2), Mar/Apr 2017 0734-2101/2017/35(2)/020606/4/$30.00 VC 2017 American Vacuum Society 020606-1
growth rate and resistivity series grown on quartz substrates.
Interpolation was used to predict growth rates such that all
films were grown to a thickness of 25–35 nm. Film thick-
nesses were determined from Fourier transform analysis
used in the GXRR software package on x-ray reflectivity spec-
tra acquired from an X’Pert Panalytical X-ray diffractometer
grazing incidence X-ray diffractometry of these films (not
shown) showed no crystalline structure. Ti/Pt contacts were
deposited on the four corners of the films to for subsequent
van der Pauw measurements at room temperature. The sec-
ond series were precisely calibrated growths by X-ray reflec-
tivity (XRR) of four different 100 nm thick films grown on
CVD diamond substrates (Diamond Materials GmbH) for
use in Rutherford backscattering analysis (RBS). Although
RBS is a standardless technique, propagation of systematic
error (by growing constant thicknesses) can push error down
to counting statistics when calculating dimensionless quanti-
ties between spectra. Dimensionless quantities are indepen-
dent of the values for the cross sections and stopping powers
which are limited to only �1% accuracy and �0.1% accu-
racy, respectively.11
III. RESULTS AND DISCUSSION
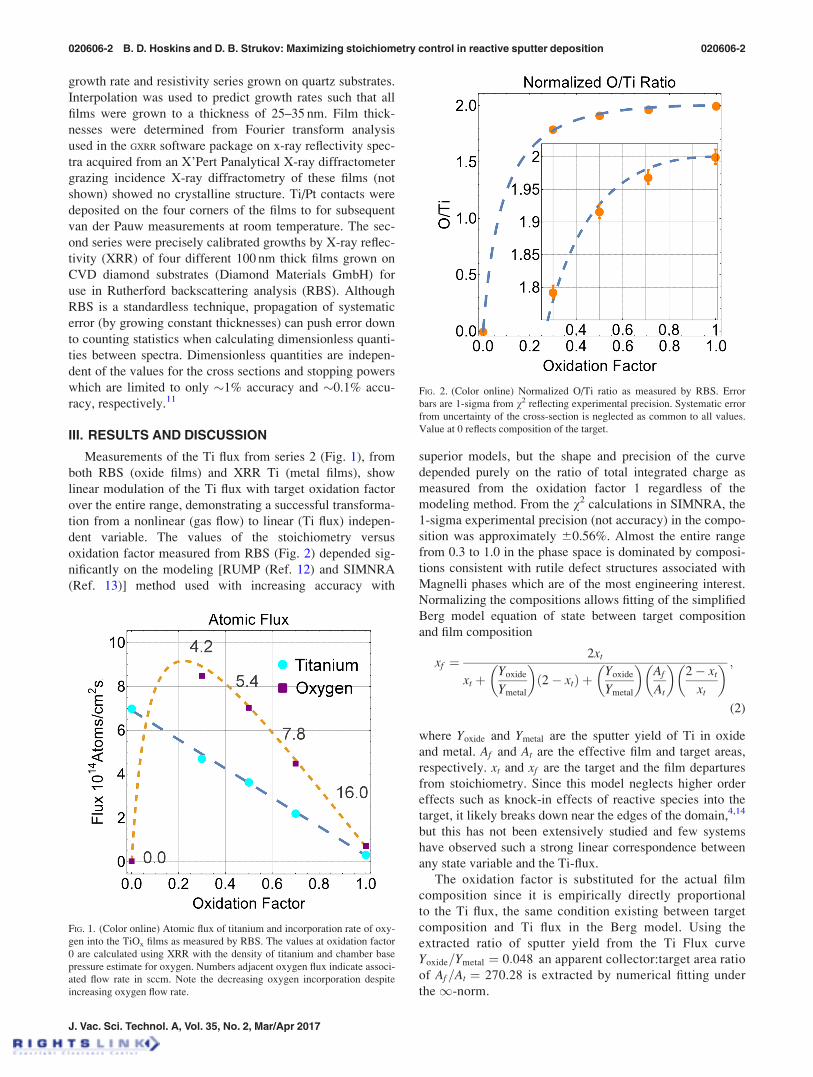
Measurements of the Ti flux from series 2 (Fig. 1), from
both RBS (oxide films) and XRR Ti (metal films), show
linear modulation of the Ti flux with target oxidation factor
over the entire range, demonstrating a successful transforma-
tion from a nonlinear (gas flow) to linear (Ti flux) indepen-
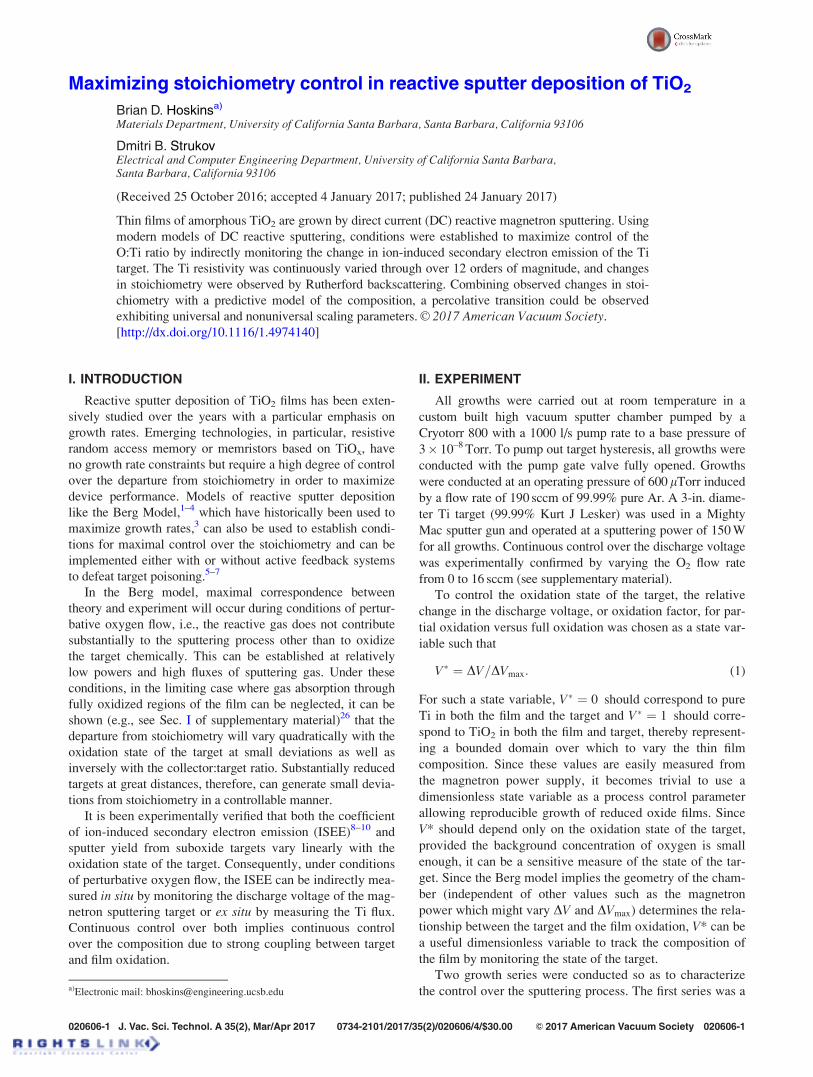
dent variable. The values of the stoichiometry versus
oxidation factor measured from RBS (Fig. 2) depended sig-
nificantly on the modeling [RUMP (Ref. 12) and SIMNRA
(Ref. 13)] method used with increasing accuracy with
superior models, but the shape and precision of the curve
depended purely on the ratio of total integrated charge as
measured from the oxidation factor 1 regardless of the
modeling method. From the v2 calculations in SIMNRA, the
1-sigma experimental precision (not accuracy) in the compo-
sition was approximately 60.56%. Almost the entire range
from 0.3 to 1.0 in the phase space is dominated by composi-
tions consistent with rutile defect structures associated with
Magnelli phases which are of the most engineering interest.
Normalizing the compositions allows fitting of the simplified
Berg model equation of state between target composition
and film composition
xf ¼2xt
xt þYoxide
Ymetal
� �2� xtð Þ þ Yoxide
Ymetal
� �Af
At
� �2� xt
xt
� � ;
(2)
where Yoxide and Ymetal are the sputter yield of Ti in oxide
and metal. Af and At are the effective film and target areas,
respectively. xt and xf are the target and the film departures
from stoichiometry. Since this model neglects higher order
effects such as knock-in effects of reactive species into the
target, it likely breaks down near the edges of the domain,4,14
but this has not been extensively studied and few systems
have observed such a strong linear correspondence between
any state variable and the Ti-flux.
The oxidation factor is substituted for the actual film
composition since it is empirically directly proportional
to the Ti flux, the same condition existing between target
composition and Ti flux in the Berg model. Using the
extracted ratio of sputter yield from the Ti Flux curve
Yoxide=Ymetal ¼ 0:048 an apparent collector:target area ratio
of Af=At ¼ 270.28 is extracted by numerical fitting under
the1-norm.
FIG. 1. (Color online) Atomic flux of titanium and incorporation rate of oxy-
gen into the TiOx films as measured by RBS. The values at oxidation factor
0 are calculated using XRR with the density of titanium and chamber base
pressure estimate for oxygen. Numbers adjacent oxygen flux indicate associ-
ated flow rate in sccm. Note the decreasing oxygen incorporation despite
increasing oxygen flow rate.
FIG. 2. (Color online) Normalized O/Ti ratio as measured by RBS. Error
bars are 1-sigma from v2 reflecting experimental precision. Systematic error
from uncertainty of the cross-section is neglected as common to all values.
Value at 0 reflects composition of the target.
020606-2 B. D. Hoskins and D. B. Strukov: Maximizing stoichiometry control in reactive sputter deposition 020606-2
J. Vac. Sci. Technol. A, Vol. 35, No. 2, Mar/Apr 2017

Four point probe measurements of the same films shows
continuous modulation of the film resistivity and Seebeck coef-
ficient through over 12 orders of magnitude as well as n-type
conductivity (see supplementary material). Unfortunately, the
resistivity values for oxidation factors greater than 0.71 could
not be measured due to the high magnitude of the resistance.
However, by combining the compositional equation of state
with the resistivity data, functional relations between conduc-
tivity and composition can be extracted (Fig. 3). Immediately
apparent from the log –log plot is the existence of two distinct
regimes: a subthreshold and postcritical regime. In percolation
theory, the conductivity is governed by15
rmaterial ¼ r0 ðp� pcÞt; (3)
with t being the critical exponent for percolation as p! pc,
with pc being the critical concentration for percolation below
which the film is insulating. For a metal-insulator transition
driven by a defect band transition, t should be around 1 or
sometimes 1=2.16 However, the simplest power law fit with
pc ¼ 0 yields t¼ 2.5, and the curve can be exceptionally
well fit with the strictly classical t¼ 2 seen in metal-
insulator composites, a prefactor of ro¼ 898 S m�1, and a fit
value of pc¼ 0.0125, which is firmly in the transition region
and half the observed deficiency of 0.023.15 This suggests
that the percolation is driven by bridging oxygen vacancies
as opposed to an extended defect band—a fact not surprising
given the amorphous nature of the films would suppress con-
ductivity from free electrons.
More striking is the incredibly low value of pc for such a
classical transition. Continuum percolation models typically
put the value of pc near 0.5. However, the reduced value of
pc can be resolved taking into account the precise defect
chemistry of aggregates of oxygen vacancies in TiO2.
Vacancies are known to condense in reduced rutile into shear
planes with the thickness of half a lattice parameter and infi-
nite diameter. Taking reduced rutile crystals to elevated tem-
perature and quenching them results in incompletely grown
shear planes randomly distributed with random diameters
ranging from 20 to 30 A to any size larger.17–19 Percolation
in TiO2 is likely driven by the presence of very high aspect
ratio structures which could be described by ellipsoids of
thickness 4 A and arbitrary major (b) and minor (a) axis. In
the limiting case of highly oblate or prolate ellipsoids, the
critical percolative concentration obeys the relation20
pc !0:6
b
a; for prolate
1:27b
a; for oblate:
8>>><>>>:
(4)
Such a model would predict that the effective diameters
of oblate disks is �200 A and the length of prolate needles
is �90 A though there is likely a distribution running the
range of these shapes. The percolative analysis suggests
clusters ranging from ten to a couple thousand vacancies in
the extreme prolate and oblate limits, respectively, deter-
mine the electrical resistivity. This simple analysis cannot
account for the full range of more complex shapes with a
nontrivial fractal dimension, but suggests that sufficiently
high aspect ratio clusters can account for the observed per-
colation with moderate sizes.
The subthreshold and critical region conductivity is not so
easily described, but this is a commonly observed effect.21–23
This behavior is typically fit with an exponential and our
exponential function provides a good fit to the data with pre-
factor 0.124 GSm�1 and dimensionless scaling factor of 624.
The subthreshold conductivity is often attributed to hopping
or tunneling transport between clusters, with increasing den-
sity of clusters leading to continuously enhanced conductivity.
The ability to finely tune the composition has interesting
implications for resistive switching, since the controlled
introduction of defects can likely help to tune the dielectric
strength of the films, making them easier to form. More
interestingly, the ability to tune the composition precisely
enough so as to observe and continuously move through the
percolative transition provides a good range of operation
within which to implement TiOx/TiOy binary structures
commonly used in resistive switches,24,25 since the ideal bar-
rier layer and injection layers would likely have oxygen defi-
ciencies below and above the metal-insulator-transition.
The choice of a dimensionless state variable, in our case
V* the oxidation factor, is also far more useful independent
variable than the typically employed oxygen flow rate. Aging
of the target due to “race track” formation will subtly change
the target area as well as its flux, making it difficult to get
repeatable compositions. Due to the nonlinear relationship
between oxygen flow rate and target oxidation, this can be
FIG. 3. (Color online) Coupled conductivity measurements and composi-
tional fit with the equation of state from the simplified Berg model. Listed
X-axis oxidation factors and oxygen deficiencies are calculated. Below the
percolative threshold, the conductivity is modeled as an exponential. Above
it is modeled as a classic percolative transition. “Oxidized” and “reduced”
delimit corresponding regions in the supplementary material flow rate volt-
age diagram.
020606-3 B. D. Hoskins and D. B. Strukov: Maximizing stoichiometry control in reactive sputter deposition 020606-3
JVST A - Vacuum, Surfaces, and Films
impossible to predict. The oxidation factor, however, being
dimensionless would be more independent of these uninten-
tional variations as well as introduced intentional variations,
such as adjustment of the target power and growth rate.
These effects can be tracked by periodically measuring
DVmax and adjusting to the appropriate value of V*.
IV. SUMMARY AND CONCLUSIONS
We have introduced the simplified Berg model as a reliable
way to predict the composition of TiOx in reactive sputtering.
We showed that a dimensionless, process dependent quantity,
the oxidation factor, can linearize the flux of Ti from the tar-
get. By coupling measured conductivity data to a predictive
model of the composition, a classical percolative transition
was observed. The low value of the critical concentration for
percolation was attributed to the unique defect chemistry of
reduced TiO2. The implications for precise control of O:Ti
ratio were also discussed in the context of resistive switching.
ACKNOWLEDGMENTS
The authors would like to thank Susanne Stemmer for
helpful discussions and use of her sputter facilities. They
would also like to thank Barry Wilkens for performing the
relevant RBS measurements. This work was supported by the
AFOSR MURI Grant No. FA9550-12-1-003. The research
carried out here made use of x-ray facilities from the
Materials Research Laboratory: an NSF MRSEC, supported
by NSF-DMR 1121053. The authors gratefully acknowledge
the use of RBS facilities within the LeRoy Eyring Center for
Solid State Science at Arizona State University.
1S. Berg and T. Nyberg, Thin Solid Films 476, 215 (2005).2S. Berg, T. Larsson, C. Nender, and H. O. Blom, J. Appl. Phys. 63, 887
(1988).
3D. Severin, O. Kappertz, T. Kubart, T. Nyberg, S. Berg, A. Pflug, M.
Siemers, and M. Wuttig, Appl. Phys. Lett. 88, 161504 (2006).4S. Berg, E. S€arhammar, and T. Nyberg, Thin Solid Films 565, 186 (2014).5W. D. Sproul, D. J. Christie, and D. C. Carter, Thin Solid Films 491, 1
(2005).6A. J. Lohn, J. E. Stevens, P. R. Mickel, and M. J. Marinella, Appl. Phys.
Lett. 103, 063502 (2013).7J. E. Stevens, A. J. Lohn, S. A. Decker, B. L. Doyle, P. R. Mickel, and M.
J. Marinella, J. Vac. Sci. Technol., A 32, 021501 (2014).8G. Buyle, D. Depla, K. Eufinger, J. Haemers, W. De Bosscher, and R. De
Gryse, Vacuum 74, 353 (2004).9D. Depla, H. Tomaszewski, G. Buyle, and R. De Gryse, Surf. Coat.
Technol. 201, 848 (2006).10D. Depla, S. Heirwegh, S. Mahieu, J. Haemers, and R. De Gryse, J. Appl.
Phys. 101, 013301 (2007).11C. Jeynes, Z. H. Jafri, R. P. Webb, A. C. Kimber, and M. J. Ashwin, Surf.
Interface Anal. 25, 254 (1997).12L. R. Doolittle, Instrum. Methods B 9, 334 (1985).13M. Mayer, AIP Conf. Proc. 475, 541 (1999).14D. Depla, S. Heirwegh, S. Mahieu, and R. De Gryse, J. Phys. D: Appl.
Phys. 40, 1957 (2007).15D. Stauffer and A. Aharony, Introduction to Percolation Theory (Taylor &
Francis, London and Bristol, PA, 1994).16H. Stupp, M. Hornung, M. Lakner, O. Madel, and H. V. L€ohneysen, Phys.
Rev. Lett. 71, 2634 (1993).17L. A. Bursill and M. G. Blanchin, J. Phys. Lett. 44, 165 (1983).18L. A. Bursill, M. G. Blanchin, and D. J. Smith, Proc. R. Soc. London, Ser. A
391, 373 (1984).19M. G. Blanchin, L. A. Bursill, and D. J. Smith, Proc. R. Soc. London, Ser.
A 391, 351 (1984).20E. J. Garboczi, K. A. Snyder, J. F. Douglas, and M. F. Thorpe, Phys. Rev. E
52, 819 (1995).21G. Ambrosetti, C. Grimaldi, I. Balberg, T. Maeder, A. Danani, and P.
Ryser, Phys. Rev. B 81, 155434 (2010).22I. Balberg, J. Phys. D: Appl. Phys. 42, 064003 (2009).23S. Vionnet-Menot, C. Grimaldi, T. Maeder, S. Str€assler, and P. Ryser,
Phys. Rev. B 71, 064201 (2005).24J. J. Yang, F. Miao, M. D. Pickett, D. A. Ohlberg, D. R. Stewart, C. N.
Lau, and R. S. Williams, Nanotechnology 20, 215201 (2009).25M. J. Lee et al., Nat. Mater. 10, 625 (2011).26See supplementary material at http://dx.doi.org/10.1116/1.4974140 for a
more detailed derivation of the simplified Berg model, more processing
details, and Raman measurements.
020606-4 B. D. Hoskins and D. B. Strukov: Maximizing stoichiometry control in reactive sputter deposition 020606-4
J. Vac. Sci. Technol. A, Vol. 35, No. 2, Mar/Apr 2017
1
Supplement to Maximizing Stoichiometry Control in Reactive Sputter Deposition of TiO2
B.D. Hoskins and D.B. Strukov
Department of Electrical and Computer Engineering, University of California, Santa
Barbara
I. Simplified Berg Model equation of state The Berg model of reactive sputter deposition can be well described by two coupled
equations relating growth rates and the composition[1].
= /( ( ))
( ) (S1)
=( – ( ))
/( ( )) (S2)
Where F is the flux of reactive gas, R is the flux of metal, is the fraction reacted of the target,
is the fraction reacted of the film, is the sticking coefficient of gas to metal, is
the sticking coefficient of gas to compound, At and Af are the effective target and film areas, and
Yoxide and Ymetal are the sputter yields of compound and metal. Equations S1 and S2 are the
governing equation in the Berg model relating the target composition to the film growth, and it
implies that continuous control over the target oxidation leads to continuous control over the film
stoichiometry. This equation can be simplified by making some assumptions, namely that the
sticking coefficient of the metal is always 1, while the sticking coefficient of the reactive species
on the compound is 0 but 1 on the metal. This leads to the simplified Berg model equation of
state:
2
=( )
(S3)
where xt is the departure from stoichiometry of the target and xf is the departure from
stoichiometry of the film. This simplified Berg relation provides the key for understanding
reactive sputter deposition namely, that for small xt:
= 2 ( ) (S4)
This relationship reveals that control of the thin film stoichiometry is principally quadratic, that
is that it’s possible to achieve very precise control over the departure from stoichiometry for
nearly stoichiometric films. In terms of growth rate, it also means that it’s possible to achieve a
large change in the growth rate of the film at the cost of only a small change of the composition
of the film. In the Berg model, maximal correspondence between theory and experiment will
occur during conditions of perturbative oxygen flow. Under these conditions, in the limiting case
where gas absorption through fully oxidized regions of the film can be neglected, the departure
from stoichiometry will vary quadratically with the oxidation state of the target at small
deviations as well as inversely with the collector:target (At/Af) ratio. This latter ratio can be
varied by increasing the effective collector area which can be easily achieved by increasing the
target-sample distance. Substantially reduced targets at great distances, therefore, can generate
small deviations from stoichiometry.
II. Summary of growth behavior
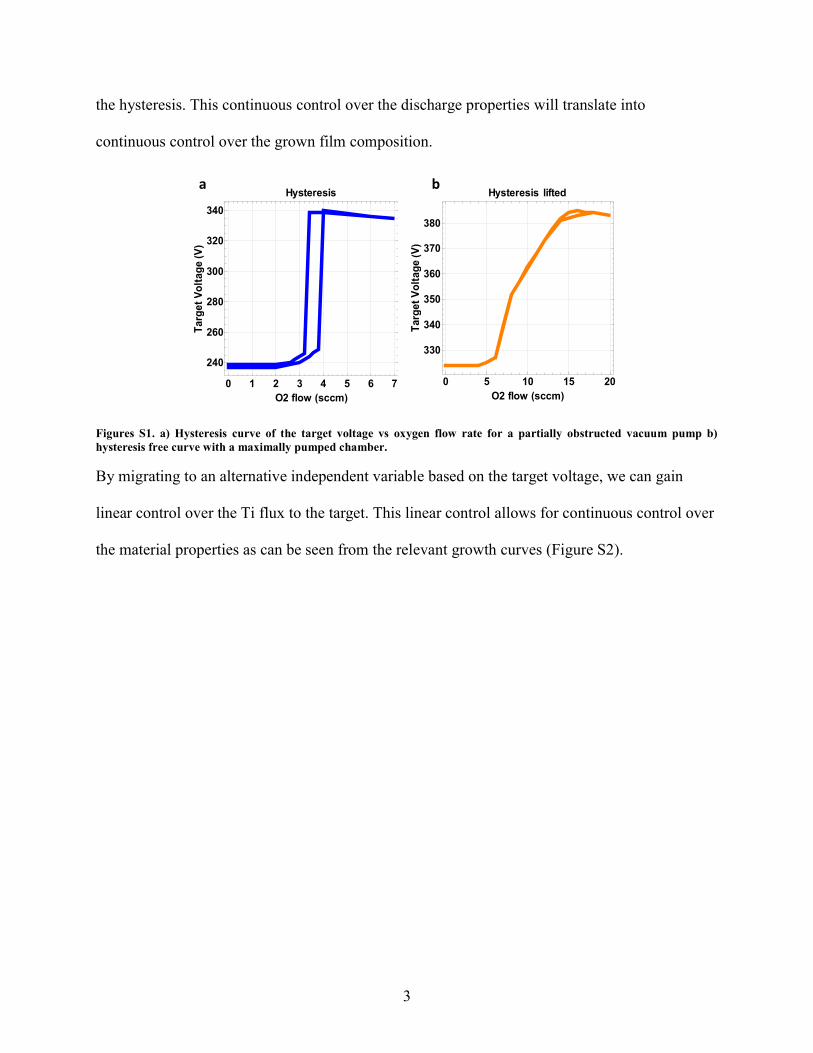
A brief comparison between partial and completely opened pump valves (Figure S1) showed that
the hysteresis typically seen in a reactive sputter process could be eliminated by “pumping out”
3
the hysteresis. This continuous control over the discharge properties will translate into
continuous control over the grown film composition.
Figures S1. a) Hysteresis curve of the target voltage vs oxygen flow rate for a partially obstructed vacuum pump b) hysteresis free curve with a maximally pumped chamber.
By migrating to an alternative independent variable based on the target voltage, we can gain
linear control over the Ti flux to the target. This linear control allows for continuous control over
the material properties as can be seen from the relevant growth curves (Figure S2).
0 1 2 3 4 5 6 7
240
260
280
300
320
340
O2 flow sccm
Tar
get
Vo
ltag
eV
Hysteresis
0 5 10 15 20
330
340
350
360
370
380
O2 flow sccm
Tar
get
Vo
ltag
eV
Hysteresis lifteda b
4
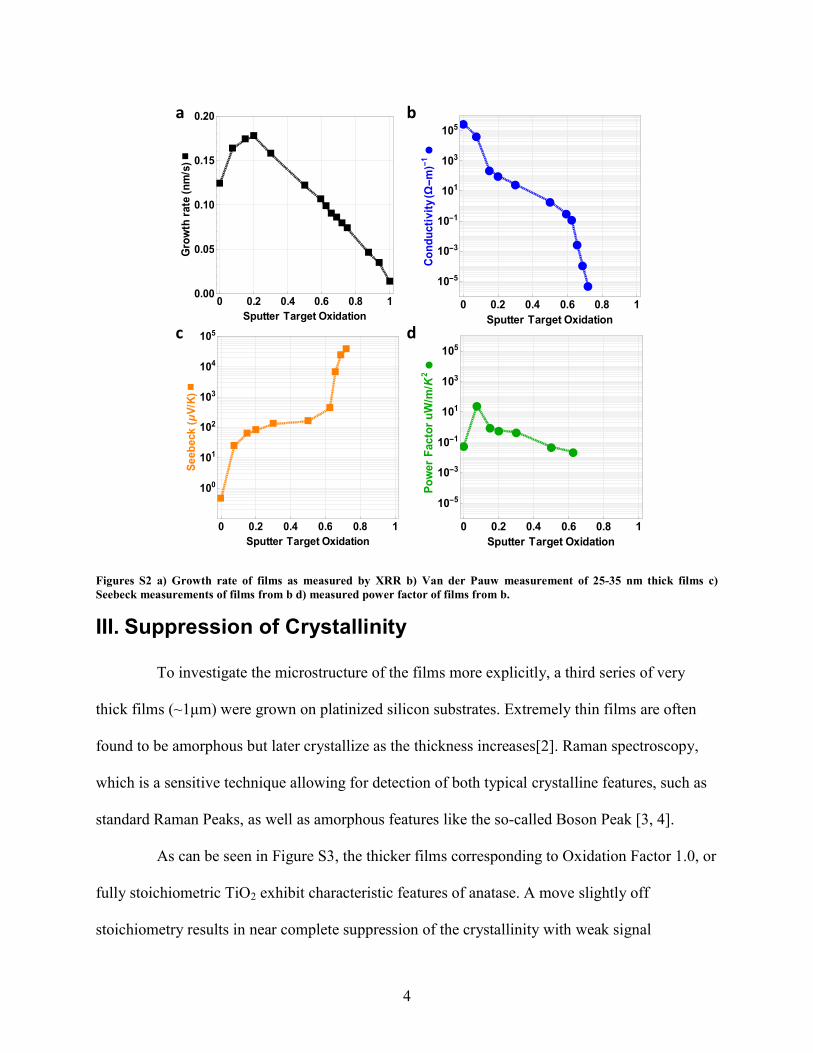
Figures S2 a) Growth rate of films as measured by XRR b) Van der Pauw measurement of 25-35 nm thick films c) Seebeck measurements of films from b d) measured power factor of films from b.
III. Suppression of Crystallinity
To investigate the microstructure of the films more explicitly, a third series of very
thick films (~1μm) were grown on platinized silicon substrates. Extremely thin films are often
found to be amorphous but later crystallize as the thickness increases[2]. Raman spectroscopy,
which is a sensitive technique allowing for detection of both typical crystalline features, such as
standard Raman Peaks, as well as amorphous features like the so-called Boson Peak [3, 4].
As can be seen in Figure S3, the thicker films corresponding to Oxidation Factor 1.0, or
fully stoichiometric TiO2 exhibit characteristic features of anatase. A move slightly off
stoichiometry results in near complete suppression of the crystallinity with weak signal
10.80.60.40.200.00
0.05
0.10
0.15
0.20
Sputter Target Oxidation
Gro
wth
rate
nm
s
10.80.60.40.20
10 5
10 3
10 1
101
103
105
Sputter Target Oxidation
Co
nd
uct
ivit
ym
1
0 0.2 0.4 0.6 0.8 1
100
101
102
103
104
105
Sputter Target Oxidation
See
bec
kV
K
10.80.60.40.20
10 5
10 3
10 1
101
103
105
Sputter Target Oxidation
Po
wer
Fac
tor
uW
mK
2
a b
c d

5
generation corresponding to the second Eg signal at ~600 cm-1. This weak signal is further
suppressed as the film is reduced further at lower oxygen flow. Both factors 0.7 and 0.5 have a
weak local maximum corresponding to the first Eg peak at around 100 cm-1. The mixed valence
state of Ti3+ and Ti4+ with their respective coordination differences is likely leading to the
“confusion” effect often seen in mixed alloys as well as oxide glasses. These results suggest that
crystallinity itself can be an indicator of stoichiometry in reduced TiO2.
Figures S3. Effect of reduction on the crystallinity of 1μm thick films of TiOx for films of oxidation factor 1.0, 0.7, and 0.5. Films grown under reducing conditions show a complete collapse in the film long range order.
1. Berg, S., et al., Predicting thin-film stoichiometry in reactive sputtering. Journal of Applied Physics, 1988. 63(3): p. 887.
2. Ohring, M., Materials Science of Thin Films. 2001: Elsevier Science. 3. Parker, J.C. and R.W. Siegel, Calibration of the Raman spectrum to the oxygen stoichiometry of
nanophase TiO2. Applied Physics Letters, 1990. 57(9): p. 943. 4. Malinovsky, V.K. and A.P. Sokolov, The nature of boson peak in Raman scattering in glasses.
Solid State Communications, 1986. 57(9): p. 757-761.
Eg
EgB1gA1g
Factor: 1.0
Factor: 0.7
Factor: 0.5
Top Related