


Languages
Pages
Legal


Max India Limited
Investor Presentation
November 2017
www.maxindia.com

Max Group Vision“To be the most admired corporate for service excellence”
Sevabhav
Excellence
Credibility
• Positive social impact
• Helpfulness
• Culture of Service
• Mindfulness
• Expertise
• Dependability
• Entrepreneurship
• Business performance
• Transparency
• Integrity
• Respect
• Governance
1

2
Evolution of Max Group—Strong history of entrepreneurship and nurturing successful businesses
Health Insurance,
JV with Bupa Plc
1985 1993 2000
Forays into
Penicillin
bulk pharma
Enters Telecom in JV
with Hutchison
JV with Gist Brocades
(Asia’s largest Drug
manufacturer )
Shift from B2B to
B2C businesses:
●Life insurance
●Healthcare
●Clinical research
Hutchison
Fund raising ~ USD 360 Mn
● QIP- USD 156 Mn in 2007
● Warburg Pincus - 53 Mn in 2005
● IFC- 47 Mn(2007) &23 Mn (2009)
● Goldman Sachs 82 Mn in 2011
2005 20112007 2009 2012 2013 2014 2015 2016
NYL exits and JV with
MSI in 2012
● MSI is world’s 7th largest
general insurance group
● MSI acquired 26% stake for
USD 425 Mn
● Max Life valued at USD 1.6
bn
LHC inducted as JV
Partner in MHC
● LHC is 2nd largest hospital
chain in South Africa
● 2012 - Acquired 26% stake
for USD 81 Mn in MHC
● 2014 - Equalize stake in
MHC invests USD 120 Mn
Enter Senior
Living business,
launch first
community in
Dehradun with
200 units
Max India demerged into
3 listed hold cos
Landmark Acquisitions
by MHC
● Acquired 79% stake for
USD 40 Mn in 340 bedded
Pushpanjali hospital
expandable upto 540 beds
● Acquired 51% stake for
USD 100 Mn in 230
bedded Saket City
hospital, expandable upto
1200 beds
Note: Conversion rate assumed 1 USD = INR 64
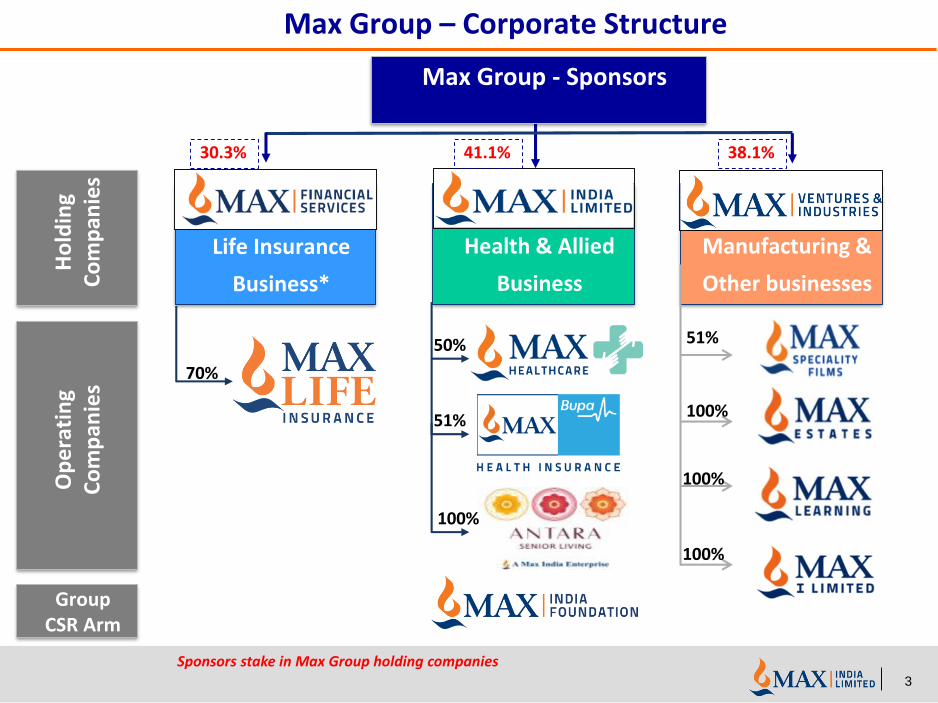
Health & Allied
Business
Life Insurance
Business*
Max Group – Corporate Structure
3
Max Group - Sponsors
Manufacturing &
Other businesses
Ho
ldin
g C
om
pan
ies
Op
era
tin
g C
om
pan
ies
70%
50%
51%
100%
51%
Group CSR Arm
30.3% 41.1% 38.1%
Sponsors stake in Max Group holding companies
100%
100%
100%

Max Group Overview
USD 2.6 billion+… 9 Mn Customers… 23,000 Employees… ~68,000 Agents…
2,850 Doctors…
Strong growth trajectory even in challenging times; a resilient & diversified business model
Steady revenue growth and cost rationalization leads to strong financial performance
Well established board governance….internationally acclaimed domain experts inducted
Diversified ownership…..marquee investor base
Superior brand recall with a proven track record of service excellence
Strong history of entrepreneurship and nurturing successful business partnerships
1
2
3
4
5
6
7
4
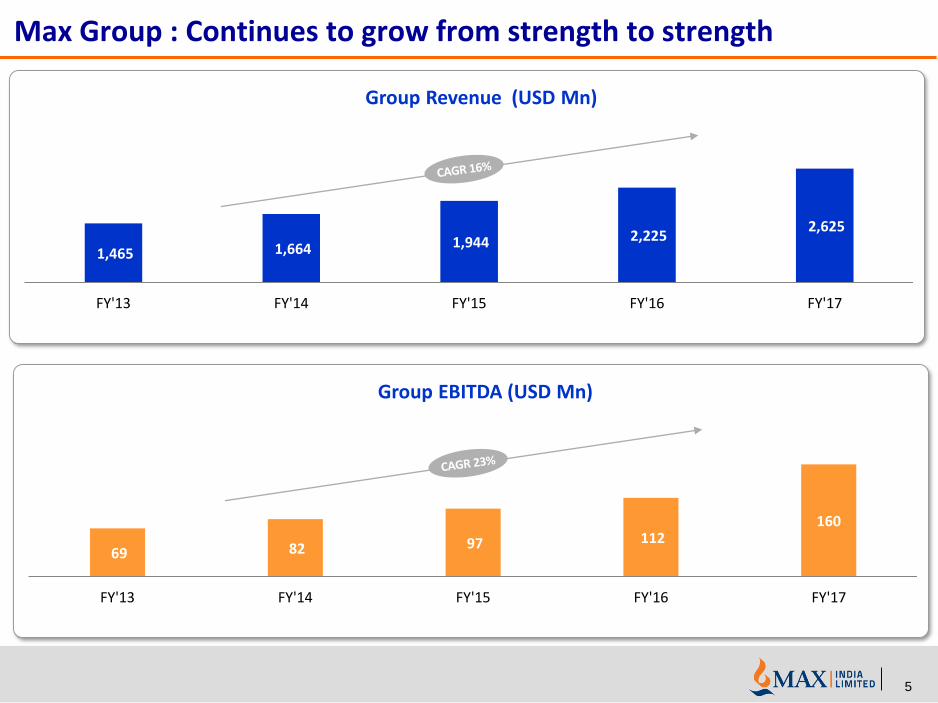
Max Group : Continues to grow from strength to strength
5
Group EBITDA (USD Mn)
69 82 97 112 160
FY'13 FY'14 FY'15 FY'16 FY'17
Group Revenue (USD Mn)
1,465 1,664 1,944 2,225 2,625
FY'13 FY'14 FY'15 FY'16 FY'17

Max India: High pedigree investor base
Number of outstanding shares* : 26.84 Cr.
Promoters41.0%
IFC3.1%
FII/ FPI19.3%
Mutual Funds22.9%
Others13.7%
0.0%0.0%
0.0%
0.0%
Shareholding Patternas on Sep 30, 2017
6
▪ Ward Ferry
▪ International Finance Corporation
▪ Government of Singapore
▪ Target Asset management
▪ New York Life Insurance
▪ Comgest
▪ Nomura Singapore
▪ Goldman Sachs
▪ Reliance Mutual Fund
▪ HDFC Standard Life Insurance
▪ DSP Black Rock Mutual Fund
▪ L&T Mutual Fund
▪ UTI Mutual Fund
▪ Mirae Mutual Fund
Shareholding concentrated with Marquee Investors
* Max Group Sponsors hold warrants convertible into 4% equity stake, post conversion Sponsor’s stake will increase form 41% to 45%, on fully-diluted equity base will increase to 28.7 Cr shares post conversion

www.maxhealthcare.in www.maxindia.com
MAX INDIA LIMITED
MAX HEALTHCARE
7
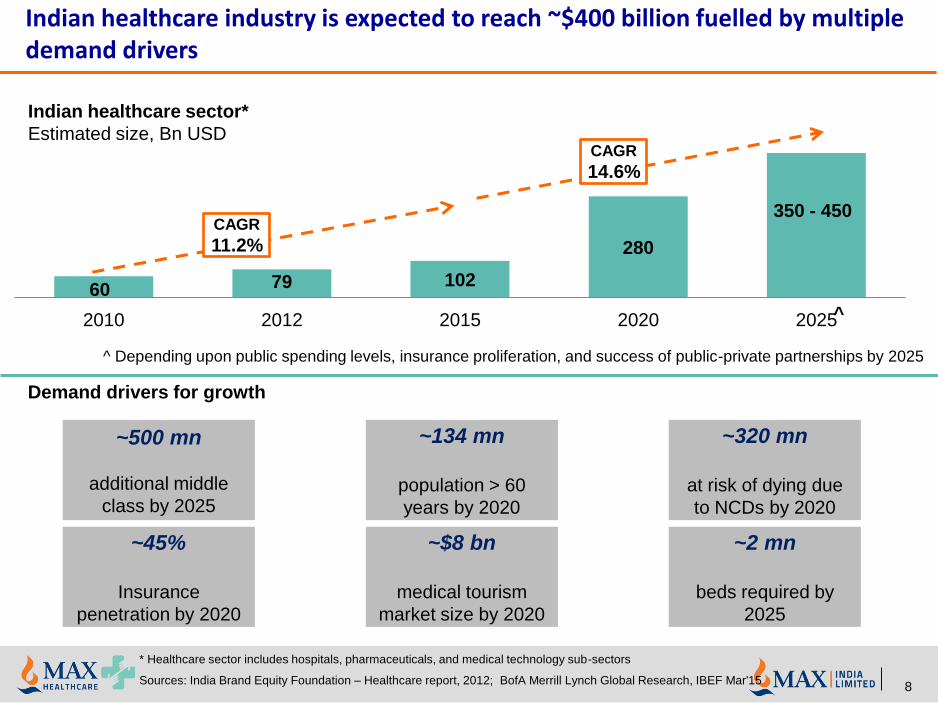
Indian healthcare industry is expected to reach ~$400 billion fuelled by multiple demand drivers
Sources: India Brand Equity Foundation – Healthcare report, 2012; BofA Merrill Lynch Global Research, IBEF Mar'15
60 79 102
280
2010 2012 2015 2020 2025
Indian healthcare sector*
Estimated size, Bn USD
Demand drivers for growth
* Healthcare sector includes hospitals, pharmaceuticals, and medical technology sub-sectors
~500 mn
additional middle
class by 2025
~45%
Insurance
penetration by 2020
~134 mn
population > 60
years by 2020
~$8 bn
medical tourism
market size by 2020
~320 mn
at risk of dying due
to NCDs by 2020
~2 mn
beds required by
2025
CAGR
11.2%
CAGR
14.6%
^
350 - 450
^ Depending upon public spending levels, insurance proliferation, and success of public-private partnerships by 2025
8

Hospitals constitute ~70% of Indian healthcare market with increasinglydominant role of private sector
Sources: BofA Merrill Lynch Global Research, IBEF Mar'15
Private players have established a dominating presence in tertiary /
quaternary care
70% 63% 60%78% 80%
30% 37% 40%22% 20%
Market Share Beds Inpatients Outpatients Doctors
Private sector Public sector
70%
20%
10%
Hospitals
Pharmaceuticals
Medical technology / Others
Indian healthcare sector*
Market share %
Market size of private hospitals is expected to reach ~$ 120 bn by 2020
2236
50
120
2009 2012 2015 2020
Private sector hospitals
Estimated size, Bn USD
CAGR
~14.7%
CAGR
~19.2%
* Includes hospitals, pharmaceuticals & medical technology / other companies
9
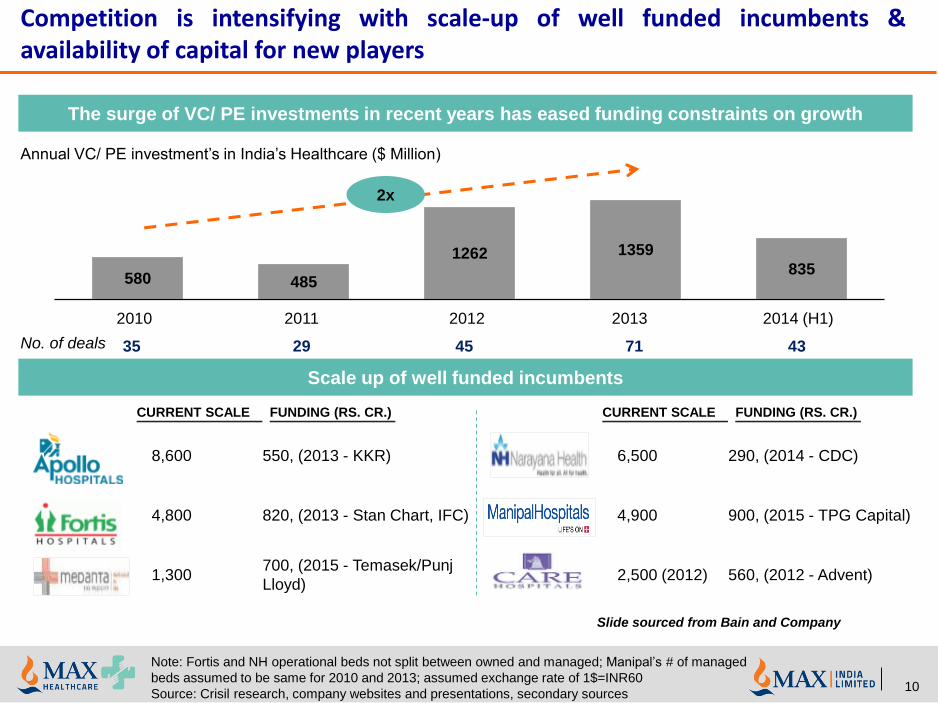
Competition is intensifying with scale-up of well funded incumbents &availability of capital for new players
The surge of VC/ PE investments in recent years has eased funding constraints on growth
Annual VC/ PE investment’s in India’s Healthcare ($ Million)
580 485
1262 1359
835
20112010 20132012 2014 (H1)
No. of deals 35 29 45 71 43
Scale up of well funded incumbents
8,600 550, (2013 - KKR)
4,800 820, (2013 - Stan Chart, IFC)
1,300700, (2015 - Temasek/Punj
Lloyd)
CURRENT SCALE FUNDING (RS. CR.)
6,500 290, (2014 - CDC)
4,900 900, (2015 - TPG Capital)
2,500 (2012) 560, (2012 - Advent)
CURRENT SCALE FUNDING (RS. CR.)
2x
Note: Fortis and NH operational beds not split between owned and managed; Manipal’s # of managed
beds assumed to be same for 2010 and 2013; assumed exchange rate of 1$=INR60
Source: Crisil research, company websites and presentations, secondary sources
Slide sourced from Bain and Company
10
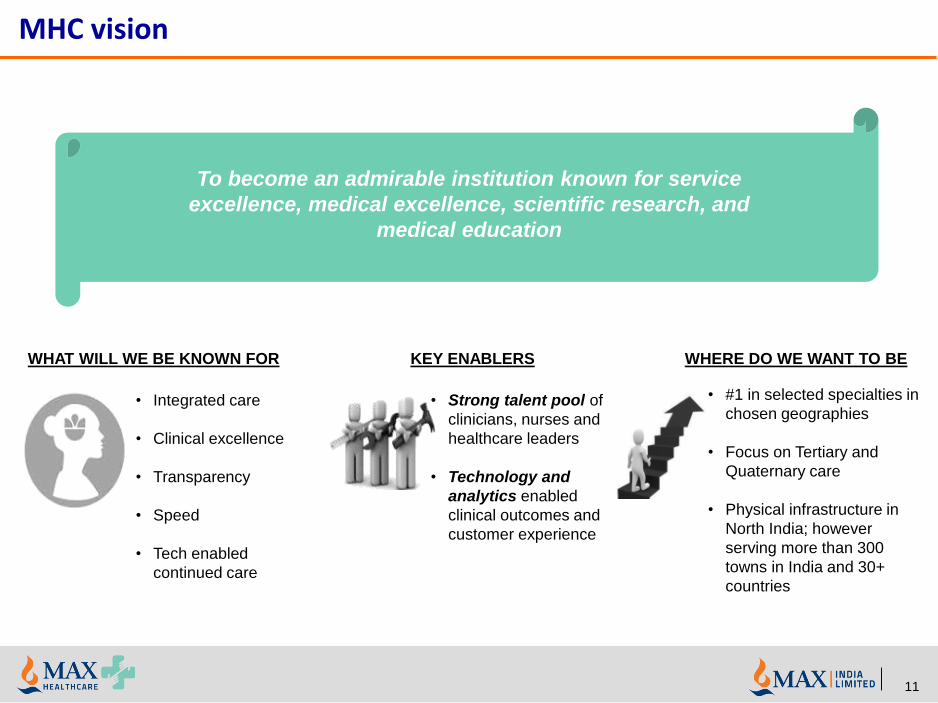
MHC vision
KEY ENABLERS WHERE DO WE WANT TO BEWHAT WILL WE BE KNOWN FOR
• Strong talent pool of
clinicians, nurses and
healthcare leaders
• Technology and
analytics enabled
clinical outcomes and
customer experience
• Integrated care
• Clinical excellence
• Transparency
• Speed
• Tech enabled
continued care
• #1 in selected specialties in
chosen geographies
• Focus on Tertiary and
Quaternary care
• Physical infrastructure in
North India; however
serving more than 300
towns in India and 30+
countries
To become an admirable institution known for service
excellence, medical excellence, scientific research, and
medical education
11

MHC has a strong focus on North India
419
522
SaketNoida
Gurgaon
Vaishali
Shalimar Bagh
Max Smart
41
72
OUTSIDE NCRNCR
Patparganj
222
Mohali
Bathinda
Dehradun
186
172
293224
290
~2500 available
beds across the
network
12
Pitampura*
Panchsheel*Lajpat Nagar*
* Standalone Speciality Clinics with Outpatient and Day care facility
Greater Noida
112
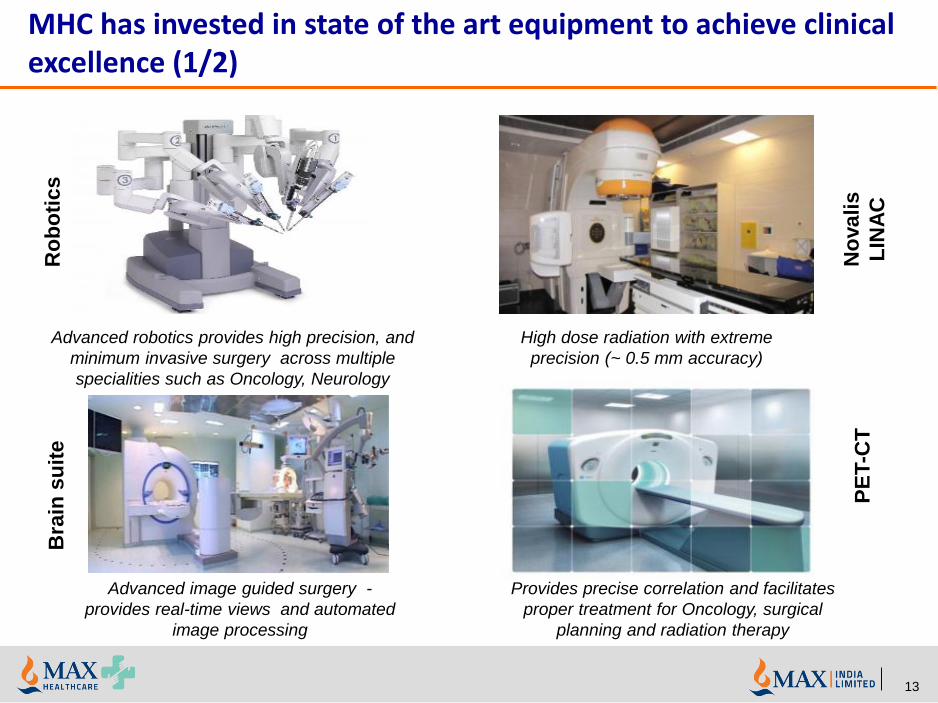
MHC has invested in state of the art equipment to achieve clinical excellence (1/2)
Advanced robotics provides high precision, and
minimum invasive surgery across multiple
specialities such as Oncology, Neurology
High dose radiation with extreme
precision (~ 0.5 mm accuracy)
Advanced image guided surgery -
provides real-time views and automated
image processing
Provides precise correlation and facilitates
proper treatment for Oncology, surgical
planning and radiation therapy
Ro
bo
tics
Bra
in s
uit
e
No
valis
LIN
AC
PE
T-C
T
13
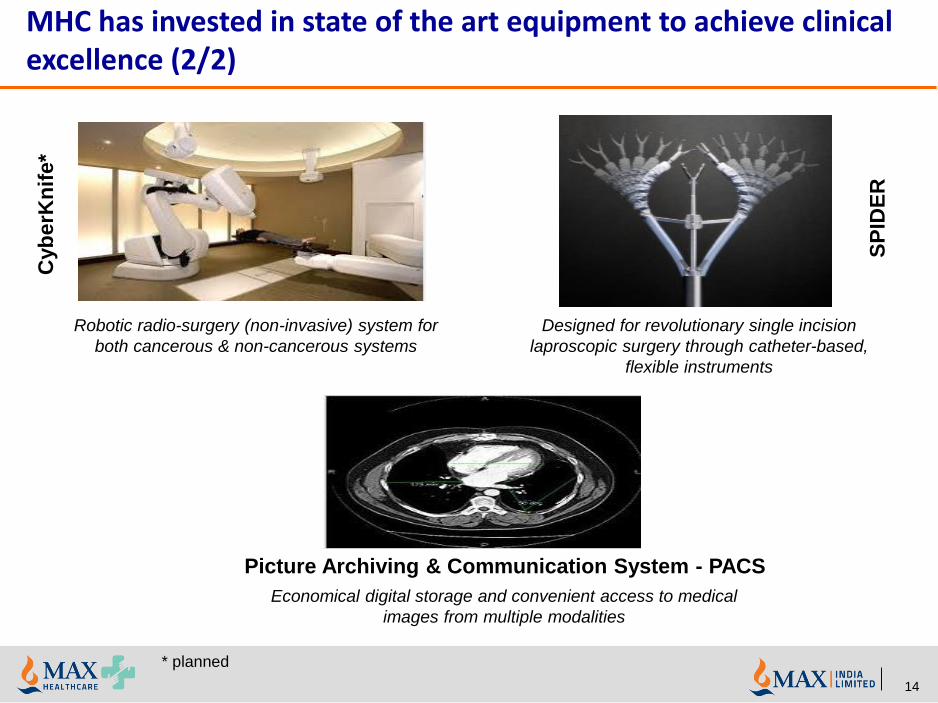
MHC has invested in state of the art equipment to achieve clinical excellence (2/2)
Robotic radio-surgery (non-invasive) system for
both cancerous & non-cancerous systems
Designed for revolutionary single incision
laproscopic surgery through catheter-based,
flexible instruments
Economical digital storage and convenient access to medical
images from multiple modalities
Cyb
erK
nif
e*
Picture Archiving & Communication System - PACS
SP
IDE
R
* planned
14

MHC has a robust service excellence & quality framework which has resulted into enhanced customer experience
• “Sevabhav” trainings and Reward &
Recognition platform has led to
positive shift in mindset
• Structural Interventions through Six
Sigma and other methodologies has
resulted into business impact of over 15
Mn USD
57%69% 73%
FY`15 FY`16 FY`17
13%
Top 2 Box Rating*
* MHC is the only healthcare company who has deployed a third party
(IMRB) to conduct Satisfaction survey 15

MHC strong Governance Model helps us bring alignment and improve accountability
Executive Committee
Unit Heads
Unit Management Committee (MANCO)
Group Medical Advisory Council
(GMAC)
Hospital Medical Executive Council
(HMEC)
Doctor’s council
Managerial Clinical
Administration
Nomination &
remunerationAudit
Investment &
performance
review
Medical
excellence &
compliance
Service
excellence
Scientific
projects &
technology
Corporate
social
responsibility
Board & 7 committees
Governance
16
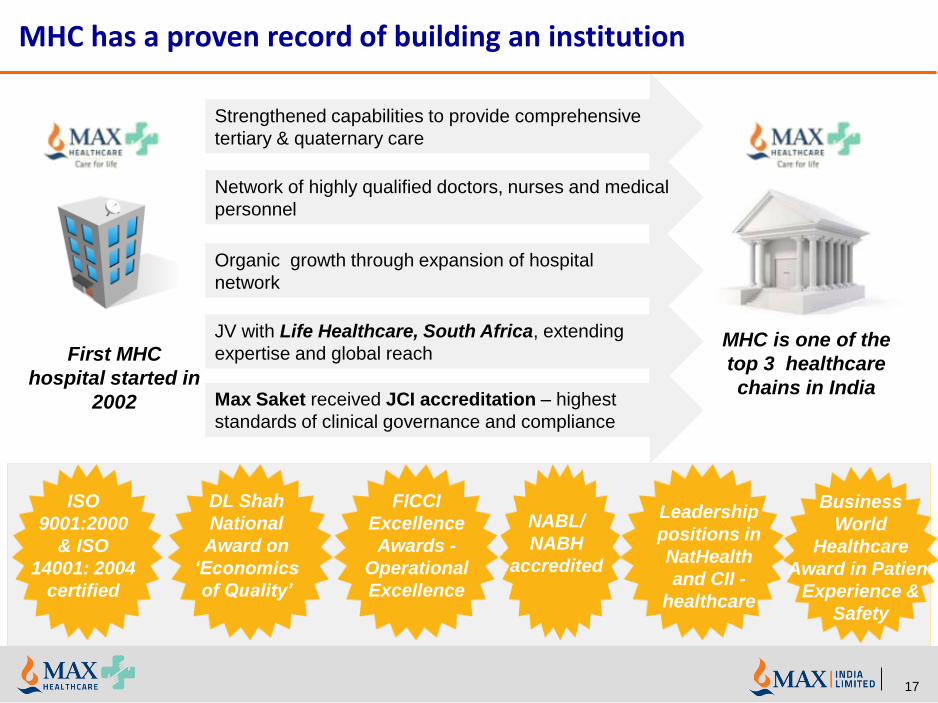
MHC has a proven record of building an institution
NABL/
NABH
accredited
ISO
9001:2000
& ISO
14001: 2004
certified
DL Shah
National
Award on
‘Economics
of Quality’
FICCI
Excellence
Awards -
Operational
Excellence
Leadership
positions in
NatHealth
and CII -
healthcare
First MHC
hospital started in
2002
MHC is one of the
top 3 healthcare
chains in India
Strengthened capabilities to provide comprehensive
tertiary & quaternary care
Network of highly qualified doctors, nurses and medical
personnel
Organic growth through expansion of hospital
network
JV with Life Healthcare, South Africa, extending
expertise and global reach
Business
World
Healthcare
Award in Patient
Experience &
Safety
17
Max Saket received JCI accreditation – highest
standards of clinical governance and compliance

MHC won 31 awards across multiple impact categories from various prestigious institutions in FY17 and FY18
Clinical Safety (7)Operational
Excellence (9)Service Quality (9) Others (6)
•Best customer service in
Healthcare
•3 projects qualified for
‘American Society for
Quality’
•BPM Asia Star 2017 by
CII Institute of Quality
•Best use of six sigma in
Healthcare
•Best green hospital
(reducing carbon foot print
of tertiary care hospital)
•Best patient safety
initiative (prevention of
patient fall)
•Best quality initiative
(BCMA medication
process improvement )
•Times Healthcare
Achievers Award
•ET Best Healthcare
brand
•Excellence in training
and development
18

Healthy revenue growth driven by hospital complexes
19
MHC Annual Gross Revenues by hospital complexes
Rs. Cr.
321505
693843 941
513
260
309
381
560
672
363
568
593
666
779
954
538
FY14
+22%
H1 FY18
2567
1407
FY16
2181
FY15 FY17
1739
1414
FY13
1149
East Delhi complex
Others
Saket complex
Note: Saket Complex includes Saket West Block, Saket East Block (unit of Devki Devi Foundation) and Max Smart (unit of Smart Hospital & Research Centre) hospital; East Delhi Complex includes Max Patparganj (unit of Balaji Medical and Diagnostic Research Centre) and Max Vaishali hospital
+14%
+27%
+31%
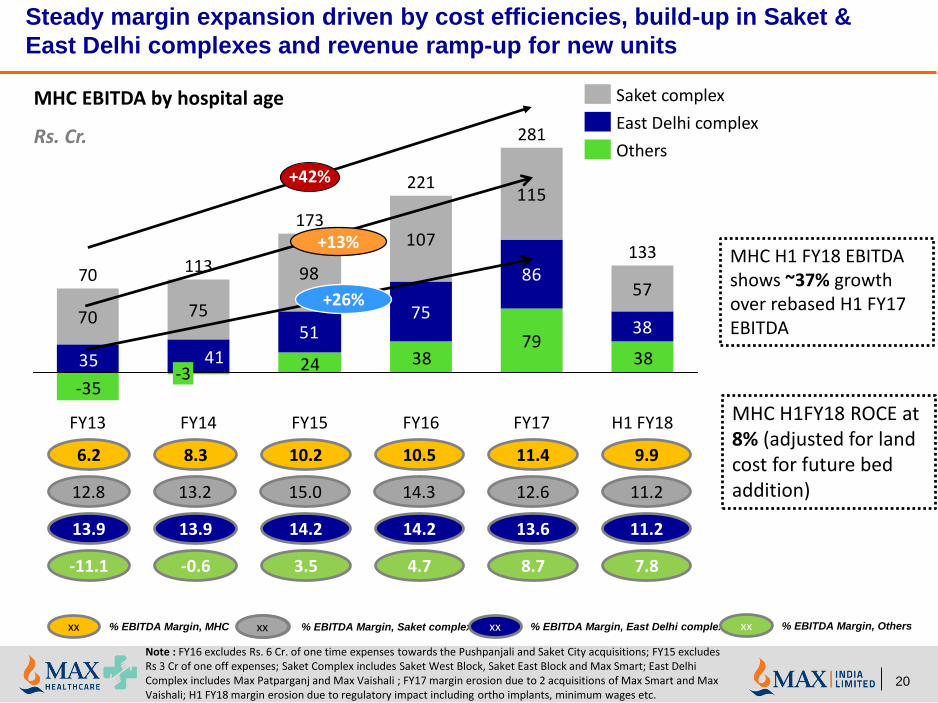
Steady margin expansion driven by cost efficiencies, build-up in Saket &
East Delhi complexes and revenue ramp-up for new units
% EBITDA Margin, East Delhi complexxx% EBITDA Margin, MHCxx % EBITDA Margin, Saket complexxx
20
xx
MHC EBITDA by hospital age
Rs. Cr.
6.2 8.3 10.2 10.5
12.8 13.2 15.0 14.3
13.9 13.9 14.2 14.2
11.4
12.6
13.6
795175
86
3870 75
98
107
115
57
383824
-35
4135
FY17FY16 H1 FY18
221
FY15
133
281
+42%
173
FY14
113
-3
FY13
70
Saket complex
East Delhi complex
Others
9.9
11.2
11.2
-11.1 -0.6 3.5 4.7 8.7 7.8
% EBITDA Margin, Othersxx
MHC H1 FY18 EBITDA shows ~37% growth over rebased H1 FY17 EBITDA
MHC H1FY18 ROCE at 8% (adjusted for land cost for future bed addition)
Note : FY16 excludes Rs. 6 Cr. of one time expenses towards the Pushpanjali and Saket City acquisitions; FY15 excludes Rs 3 Cr of one off expenses; Saket Complex includes Saket West Block, Saket East Block and Max Smart; East Delhi Complex includes Max Patparganj and Max Vaishali ; FY17 margin erosion due to 2 acquisitions of Max Smart and Max Vaishali; H1 FY18 margin erosion due to regulatory impact including ortho implants, minimum wages etc.
+13%
+26%
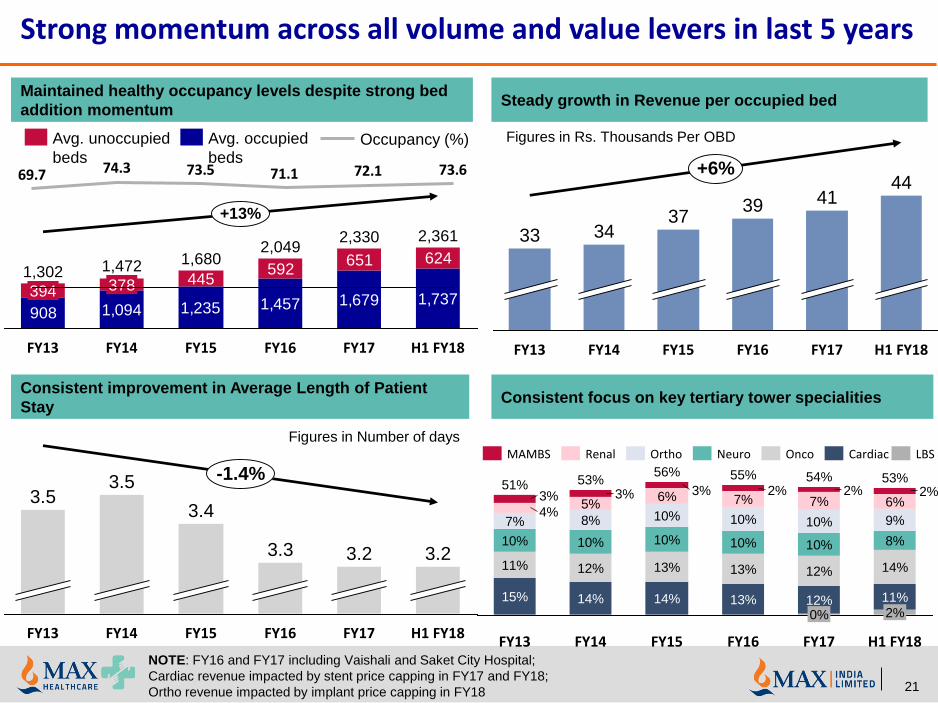
Strong momentum across all volume and value levers in last 5 years
Maintained healthy occupancy levels despite strong bed
addition momentumSteady growth in Revenue per occupied bed
Consistent focus on key tertiary tower specialitiesConsistent improvement in Average Length of Patient
Stay
Figures in Rs. Thousands Per OBD
908 1,094 1,235 1,457 1,679 1,737
445592
651 6241,680
FY14
1,472
378
FY13
1,302
394
FY17
2,330
FY16
2,049
FY15
+13%
H1 FY18
2,361
+6%
41
FY16
39
FY15
37
FY14
34
FY13
33
FY17 H1 FY18
44
3.5
FY13
3.5
3.4
FY14
3.2
-1.4%
H1 FY18
3.2
FY15
3.3
FY17FY16
Figures in Number of days
NOTE: FY16 and FY17 including Vaishali and Saket City Hospital;
Cardiac revenue impacted by stent price capping in FY17 and FY18;
Ortho revenue impacted by implant price capping in FY18
6%
9%
53%
2%11%
8%
14%
H1 FY18FY17
2%
10%
14%
6%51% 53%
3%
11%
FY13
12%
10%10%
10%5%
8%
15%
FY14
3%
4%7%
3%
FY16
10%
7%2%
12%
12%
10%
54%
0%
14%
56%
13%
10%
10%
7%
FY15
2%
55%
13%
13%
RenalMAMBS LBSCardiacOncoOrtho Neuro
73.672.171.173.569.7 74.3
Avg. occupied
beds
Avg. unoccupied
bedsOccupancy (%)
21
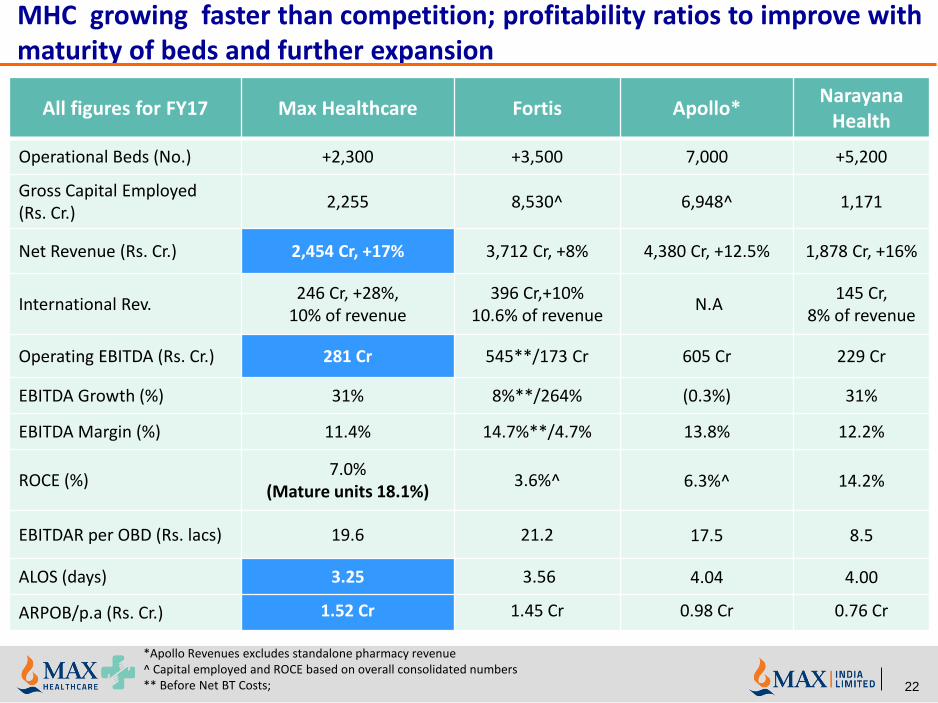
MHC growing faster than competition; profitability ratios to improve with maturity of beds and further expansion
All figures for FY17 Max Healthcare Fortis Apollo*Narayana
Health
Operational Beds (No.) +2,300 +3,500 7,000 +5,200
Gross Capital Employed (Rs. Cr.)
2,255 8,530^ 6,948^ 1,171
Net Revenue (Rs. Cr.) 2,454 Cr, +17% 3,712 Cr, +8% 4,380 Cr, +12.5% 1,878 Cr, +16%
International Rev.246 Cr, +28%,
10% of revenue396 Cr,+10%
10.6% of revenueN.A
145 Cr,8% of revenue
Operating EBITDA (Rs. Cr.) 281 Cr 545**/173 Cr 605 Cr 229 Cr
EBITDA Growth (%) 31% 8%**/264% (0.3%) 31%
EBITDA Margin (%) 11.4% 14.7%**/4.7% 13.8% 12.2%
ROCE (%)7.0%
(Mature units 18.1%)3.6%^ 6.3%^ 14.2%
EBITDAR per OBD (Rs. lacs) 19.6 21.2 17.5 8.5
ALOS (days) 3.25 3.56 4.04 4.00
ARPOB/p.a (Rs. Cr.) 1.52 Cr 1.45 Cr 0.98 Cr 0.76 Cr
*Apollo Revenues excludes standalone pharmacy revenue^ Capital employed and ROCE based on overall consolidated numbers** Before Net BT Costs; 22

Four dimensions to value creation for MHC
23
Existing network optimizat
ion
Hospital network growth
Alternate models
Key enablers
• Focus on identified key specialties
• Channel optimization
• Cost initiatives
• Capacity expansion to 5000+ beds largely through brownfield & select greenfield assets
• M&A• FAR• Greenfield
• Max Lab• Max@Home• Onco daycare• Immigration
Center
• Differentiated positioning
• Service experience• Patient safety• People• Compliance

A Increasing share of preferred channels to improve profitability
As the new units in the network mature, the share of preferred channels will increase in the revenue
mix and tend to mirror the share in current mature units
Action plan in place to further increase the share of preferred channels in the mature units
Preferred
Channels
Non-preferred
ChannelsHealthcare revenue channel share, FY17
Percent
Walk-inInter-
national
• Sustained brand effort / experience
delivery on new positioning
• ATL/BTL campaigns for key specialties
• Strengthen ER capabilities
TPA
• Seek new engagement models in the
prevention/ wellness space
• Assess co-development of product targeted
at new customer segments
• Establish direct presence and
digital footprint in select markets
• Expand in attractive new markets
• JCI Accreditation at flagship units
MAC
Institutional
• Maintain share & improve quality of
business via upcountry channel
• Deprioritize; profitability
improvement through focus on
collections, material cost, and ALOS
24
21.2% 17.5%
34.2% 37.4%
20.9% 22.2%
MAC
10.1%
TPA
International
H1 FY18
100.0%
Institutional/PSU
Walk-In
12.9%
100.0%
9.7%
FY17
14.0%

TRANS-
PLANT
High share of preferred specialties to improve profitability
Share of preferred tertiary/surgical specialties to increase in the revenue mix, in line with the historic
trends
Action plan in place to grow focused specialties
Healthcare revenue specialty share
Percent
• Build distinguished leadership
in all DMGs
• Establish a standalone centre
• Personalized medicineONCOLOGY
• Provide end to end service offering
• Launch specialized clinics
• Invest in high end Neuro equipmentNEURO
SCIENCES
CARDIO
SCIENCES
• Build comprehensive transplant
center in Saket complex; launch LTP
• Establish KTP and BMT programs in
selected locations
• Focus on high-end procedures
• Partnerships with renowned global
institutions – people & best practices
32% 32% 32% 31%
68% 68% 68% 69%
FY-15 FY-16 FY17 H1 FY18
Secondary
Tertiary
A
25
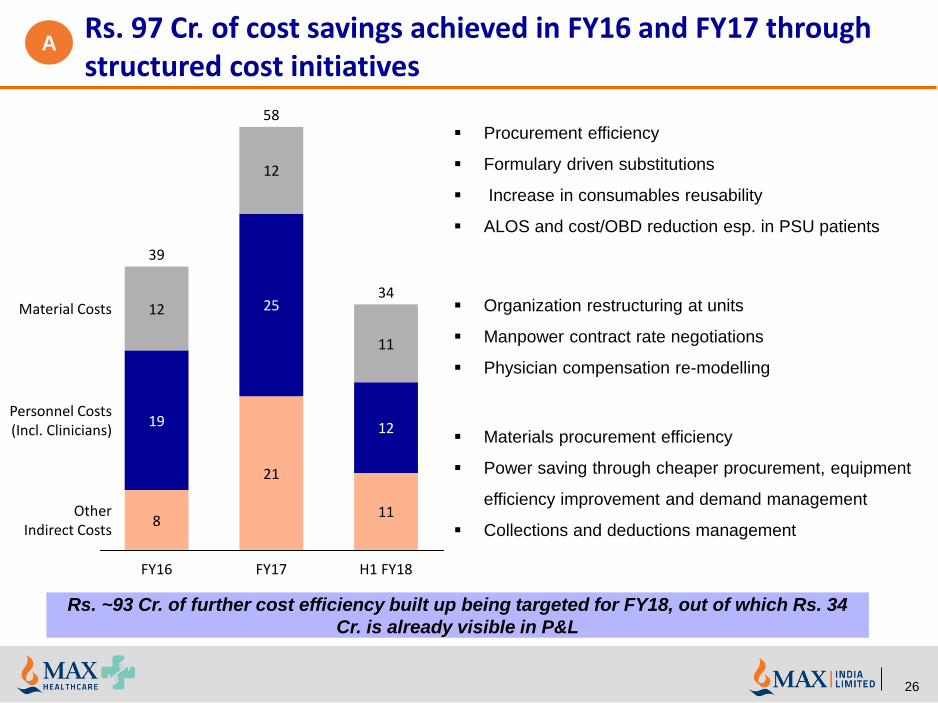
Rs. 97 Cr. of cost savings achieved in FY16 and FY17 through structured cost initiatives
A
26
Rs. ~93 Cr. of further cost efficiency built up being targeted for FY18, out of which Rs. 34
Cr. is already visible in P&L
11
21
8
12
25
19
11
12
12
FY16
Personnel Costs(Incl. Clinicians)
39
OtherIndirect Costs
Material Costs
H1 FY18FY17
34
58▪ Procurement efficiency
▪ Formulary driven substitutions
▪ Increase in consumables reusability
▪ ALOS and cost/OBD reduction esp. in PSU patients
▪ Organization restructuring at units
▪ Manpower contract rate negotiations
▪ Physician compensation re-modelling
▪ Materials procurement efficiency
▪ Power saving through cheaper procurement, equipment
efficiency improvement and demand management
▪ Collections and deductions management

MHC expansion prioritised in hospitals with superior profitability
27
Saket complex: 200
Mohali: 85
Saket complex: 300
S.Bagh: 104
Saket complex: 800
East Delhi complex: 200
Mullanpur: 400
Gr. Noida: 380
East Delhi
Complex:
106
* Bed Capacity as at March 31, 2017
B
102
1,780
404
285
5,061
FY22 & BeyondFY21 TotalFY20FY17 FY19
106
FY18
2,384
Saket complex :45
East Delhi
complex: 35
Gurgaon: 12
Dehradun: 10
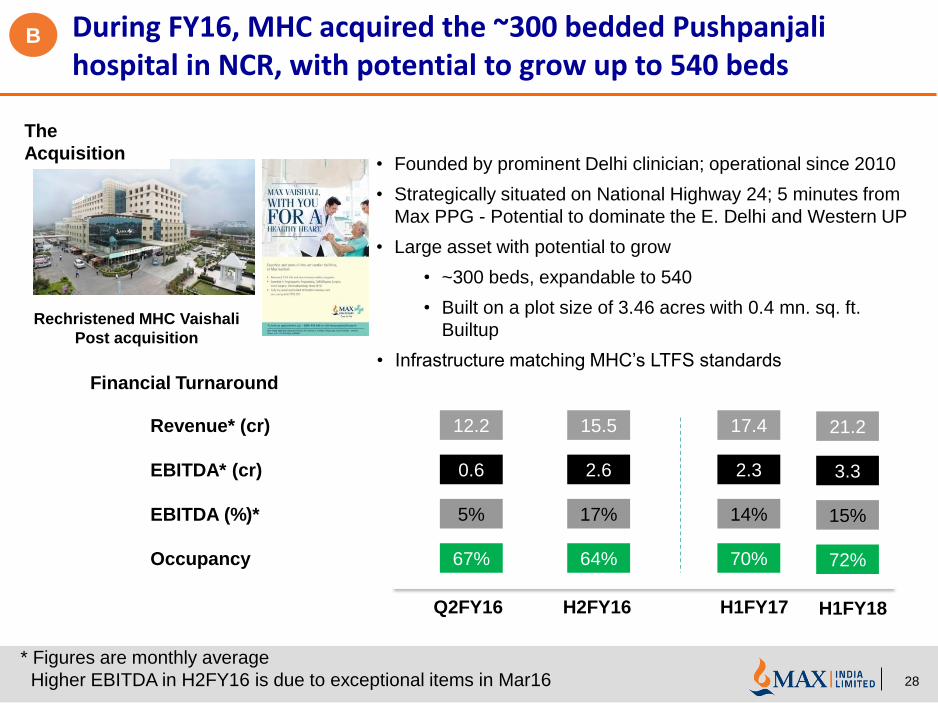
• Founded by prominent Delhi clinician; operational since 2010
• Strategically situated on National Highway 24; 5 minutes from
Max PPG - Potential to dominate the E. Delhi and Western UP
• Large asset with potential to grow
• ~300 beds, expandable to 540
• Built on a plot size of 3.46 acres with 0.4 mn. sq. ft.
Builtup
• Infrastructure matching MHC’s LTFS standards
Rechristened MHC Vaishali
Post acquisition
The
Acquisition
Financial Turnaround
Q2FY16 H2FY16 H1FY17
12.2
0.6
5%
67%
15.5
2.6
17%
64%
17.4
2.3
14%
70%
Revenue* (cr)
EBITDA* (cr)
EBITDA (%)*
Occupancy
* Figures are monthly average
Higher EBITDA in H2FY16 is due to exceptional items in Mar16
During FY16, MHC acquired the ~300 bedded Pushpanjali hospital in NCR, with potential to grow up to 540 beds
B
28
H1FY18
21.2
3.3
15%
72%

State-of-the-art transplant centre – for all
transplants incl. heart, liver, kidney, bone marrow
Asia’s premier quaternary care with 7 centres of
excellence
India's first international patient centre
Largest private facility in India
Dec 15 H1FY17
13.6
-0.8
-7%
69%
16.2
1.45
9%
75%
Revenue* (cr)
EBITDA* (cr)
EBITDA (%)*
Occupancy
▪ ~2000 beds in fully built state
▪ Complex spread across 11.5 acres
▪ 300 – 500 beds to be dedicated to
Cancer
▪ Infrastructure to support all 6 tower
specialties
▪ Adjoining 7.1 acres land to be
developed to offer complementary,
allied healthcare services such as
Rehab, assisted living etc. by GMHRC
Enterprise Value of Rs. 1,025 Cr. (Equity Value Rs. 325 Cr. for 51% stake and debt of Rs. 325 Cr;
Rs. 375 Cr. (+12% p.a.) to be paid within 3 years for the balance 49% stake)
13.8
-0.52
-4%
66%
Q4FY16
29
Saket City Acquisition: Opportunity to create one of Asia’s largest Medicity in the heart of South Delhi
B
* Figures are monthly average
H1FY18
23.8
3.6
15%
85%

Max Lab: Consistent growth over the last one and half years by leveraging our assets
C
30
Network Expansion• Network of 450+ partners• Over 198 active partners in Sept• Started operations in NCR, Punjab, Faridabad, and
Uttarakhand• Added 3 HLMs, over 450+ beds
Technology• CRM platform for Sales Team for Team monitoring, Lead
creation, Partner management• Upgrade of LIS platform – project implementation
underway• Max Lab website under development
Operations• Sales team expanded to 19 from 8 (Mar)• Successful launch of SMH, Rudrapur HLM• Serviced over 54,000 orders in 6 months
Organization• Team size grew to 125 (35 in Mar17)• Critical building blocks in place
Building blocks in place to achieve the growth
aspiration
0.8
1.7
Q2’18Q3’17
2.1
Q4’17
1.1
+329%
1.5
Q2’17Q1’17
3.4
Q1’18
68.0
38.0
Q2’17 A Q3’17 A
13.3
Q1’18 A
+411%
Q2’18 A
15.6
Q4’17 A
26.0
Sample (‘000)*
Revenue (Rs. Cr.)
* Pathology samples from Max@Home are also included

Max@Home: With Rs. 1.5 – 2 Cr. of investment till date, business is likely to end FY18 at ~Rs. 30 Cr. revenue
C
31
Home Sample Collection• 24*7 coverage;
• 9% revenue contribution through out-of-hospital channels in Q2
Medicine home delivery• 144% increase in volumes from 856 (June’17) to 2090 (Sept’17)
• Increased post discharge calling coverage from 5% of discharges
in Jul’17 to 35% in Sep’17
Revamp of long stay services• 26% growth in Sep’17 (vs. Aug’17) in nursing services driven by
a systematic lead management process
New territory- Mohali• Phased launch starting with sample collection, pharmacy and
assistance services
• Total business of 14 lacs in Sept’17
Max@home B2C platform• ~450 tech features ; ~30 processes; 5 service line journeys
• Wireframes for ~20 roles across portal, mobile app & tablet
• Development & UAT planned in Q3FY18
11.6
5.54.14.8
5.6
H1’16 H2’16 H1’17 H1’18H2’17
+179%Revenue (Rs. Cr.)
New services
Existing services
0.26
3.88
6%
94% 4.76
6.80 59%
41%
2.74
2.75
50%
50%
Samples (‘000)
31.3
19.6
13.2
6.94.7
+560%
Q2’18 AQ1’18 AQ4’17 AQ3’17 AQ2’17 A
Steady state EBITDA margin ~25%

Onco Day Care Center: Operationalized in July’16, EBITDAR break even on the 3rd month
C
32
• Standalone specialized facility away from
the hospital to ensure comfort and care
for our patients during chemotherapy
sessions
• Helps patients with their treatment and
disease by providing a non-hospital
environment and a highly efficient and
expert experience
• Key Differentiators:
o Strong clinical protocols
o Staff specially trained in soft/service
skills
o Personalized treatment
21st June’16 Chemo started
Saket doctors OPD started
7th July:X-ray started 1st Sept:
Ultra-sound started
9.2
36.0 51.8
61.8
216.4 218.5
275.3
439.2
14thJune'16
July'16 Aug'16 Sep'16 Q3'17 Q4'17 Q1'18 Q2'18
Rev - Actual
H1 FY18 EBITDAR margin of 17.5% and EBITDA
margin of 8%
0.1
0.4
0.6
0.6
0.7
0.8
June'16
Q2'17
Q3'17
Q4'17
Q1'18
Q2'18
Daycare Chair turnover IMRB Scores
Pan MAX 75%
Oncology 77%
Onco DayCare 91%
Channel Mix (H1’18)
Cash 49%
TPA 20%
Others 31%
Success of this centre has paved the way for opening more such centres; Work on for the 2nd one in Gurgaon
Figures in Rs. Lacs

Immigration Center: Revenue growth at 131% vs. H1’LYMax Bike Responder: Immediate medical care in emergencies
C
33
8.3
6.3
4.8
3.43.6
H1’18
+131%
H2’16H1’16 H1’17 H2’17
58.8
39.438.2
29.932.1
H1’16 H1’17H2’16 H1’18
+83% +49%
H2’17
Revenue (Rs. Cr.)
Volume (‘000)
Immigartion Center
New Center
opened
Figures in Rs. Cr.
120
AVERAGE
MONTHLY
CALLS
15
AVG.
REACH TIME
MINS
58
LIVES SAVED &
COUNTING…
Max Bike Responder
Success of this centre has paved the way for opening
more such centres; Work on for the 2nd one in Mohali

www.maxbupa.com www.maxindia.com
MAX INDIA LIMITED
MAX BUPA HEALTH INSURANCE LIMITED
34

A symbiotic partnership in health insurance
Helping people live longer, healthier, happier lives+
Wh
at w
e d
oH
igh
ligh
ts
Domestic Health
Insurance
Global Health
Insurance
Dental and Travel
insuranceAdvice Primary Care
Clinics
Dental clinics Aged Care
► Leading international healthcare group present across 190+
nations, provides personal and company health insurance,
runs care homes for the elderly and hospitals in addition to a
range of health services
► Founded in 1947 in the UK, Bupa employs over 86,000
people across UK, Australia, Spain, Hong Kong, Poland, New
Zealand, Chile, Brazil, Thailand, Saudi Arabia, India and the
US
► Revenues of over £11 billion, over 70% coming from health
insurance covering over 16.5 million customers
► Diversified group with interests in insurance,
healthcare, manufacturing, real estate, learning
and senior living
► Founded in 1985 with an entry in the bulk
pharma business, Max has evolved into one of
the leading health services organizations in
India
► Over INR 168 billion in revenues, serving over 9
million customer with 23,000 employees and
2800 doctors.
Max Bupa is a 51:49 joint venture between Max Group and Bupa
In the business of Life
35
Our Vision and Mission
36
To be the most admired health
insurance company in
India
To help customers live healthier, more successful lives
Vision Mission

Industry landscapeHealth insurance market (including PA, Travel & contribution by life insurers)
FY 16-17
2,800
Travel &
LI contribution 2
PA
FY10-11
Retail
50,000
1,600
Government
sponsored
9,100
Corporate
FY19-20
(Estimated)
23,600
17,500
4,500
GWP in Rs cr
34,374
Low penetration and coverage▪ HI penetration (premium as % of GDP) is only
~0.2%▪ Only 27% of population has any kind of health
insurance, but significant under insurance
Increasing affluence and awareness▪ Rise in income levels and healthcare spend per
capita▪ Middle class expected to increase to 41% of
population by 2025 (from 5% in 2005)1
Rise in health care costs▪ Medical inflation over 10% ▪ High out-of-pocket expenses (62% v/s ~10% in
US/UK & ~30% in China)
Rise in incidence of chronic diseases(viz. Cancer, heart diseases) & lifestyle related diseases (diabetes)
Regulatory & policy level interventions▪ IRDAI’s consumer-centric approach▪ Higher tax saving incentives on HI
Key drivers of growth
Indian health insurance market is likely to grow by ~15% CAGR in next 3 years
1 Mckinsey report ‘Tracking the growth of India’s middle class’ in 2007
2 Growth rates for Travel & LI contribution of HI not available (Assumed at 16% same as 5 year CAGR of PA) 37
* Numbers are excluding Overseas medical and personal accident, includes only (B2C, B2B, B2G)
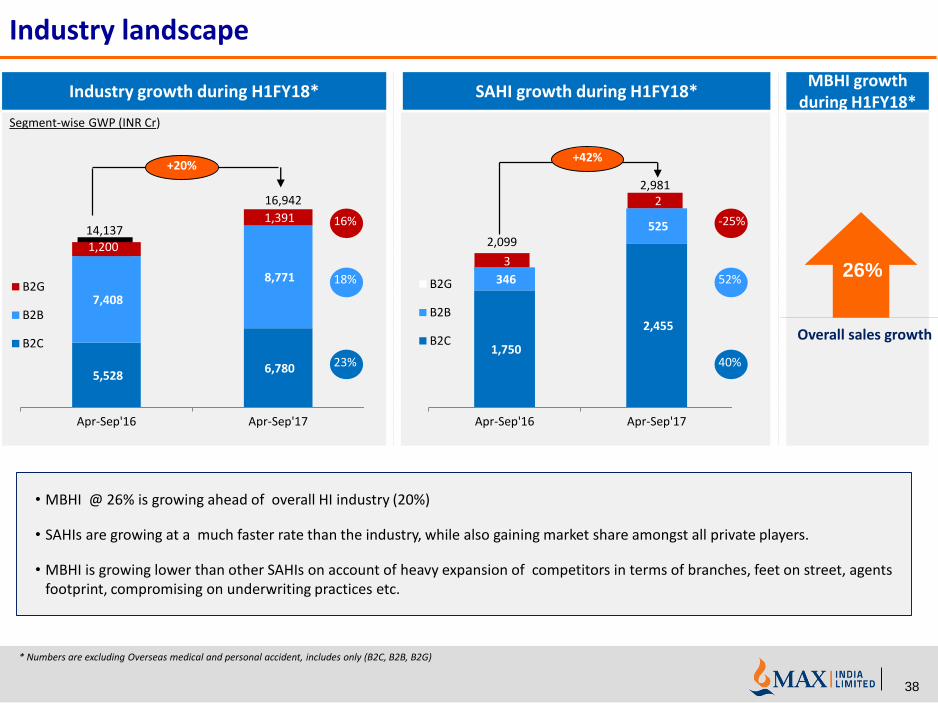
Industry landscape
38
1,750
2,455
346
525
3
2
Apr-Sep'16 Apr-Sep'17
B2G
B2B
B2C
Segment-wise GWP (INR Cr)
Industry growth during H1FY18*
5,528 6,780
7,408
8,771
1,200
1,391
Apr-Sep'16 Apr-Sep'17
B2G
B2B
B2C
+20%
14,137
16,942
+42%
2,099
2,981
SAHI growth during H1FY18*MBHI growth
during H1FY18*
26%
Overall sales growth
23%
18%
16%
40%
52%
-25%
• MBHI @ 26% is growing ahead of overall HI industry (20%)
• SAHIs are growing at a much faster rate than the industry, while also gaining market share amongst all private players.
• MBHI is growing lower than other SAHIs on account of heavy expansion of competitors in terms of branches, feet on street, agents footprint, compromising on underwriting practices etc.

+194%
+94%
Religare
444277151
Star
2,520
1,787
1,299
+62%
+64%
Apollo Munich
848
647522
MBHI
584465
355
+547%
Cigna
122
82
19
* Aditya Birla HI not included as business started in Oct’16
Total Opex2
(INR Cr)
1 FY’16-17 numbers for B2C segment are derived basis past trends and historical data, numbers are excluding Personal accident & Overseas medical (data not available by segment) 2 Overall operating expenses of the company (inclusive of all segments)
Valuation led
approach
Measured approach
New entrants*
SAHI’s divided into 3 categories for a like to like comparison
FY14-15FY15-16FY16-17
Total Capital (INR Cr)
475350
Star
1,030
719
+62%
+50%
Religare
525637
+2%
+17%
616
Apollo
616603
MBHI
926898791
+98%
Cigna
574
435
290
Star
46 56 61
Religare
+33%
+26%
290
366320
MBHI
83
101110
Apollo
+33%
+8%
282726
+46%
Cigna
1916
13
+38%
+177%
Religare
43
2216
Star
100
8173
+15%
14
+41%
Apollo
2624
18
MBHI
1714
+75%
Cigna
98
5
Total Headcount (‘00)
Total BranchesGWP - B2C1
► Focus on increasing topline
► High acquisition cost. Total opex increase over last 2 years:
• Star saw 39% increase in opex
• Religare saw 104% increase in opex
► Star and Religare to sell entire stake
► Underwriting grid relaxed by Star (upto 65 years) and Religare (upto 50 years)
► Focus on balanced long term growth
► MBHI has grown at a higher rate than Apollo over last 2 years in B2C space. MBHI 64% vs Apollo 62%
► MBHI total opex increased by 10% vs Apollo where opex increased by 38%
► 100% of product portfolio of MBHI facing price rise challenge in current year with tighter underwriting rules
► Focus on growing revenue; low GWP base
► Cigna acquiring business at high acquisition cost
► ABHI started business in Oct’16
► Aggressive offers on porting business offered by new entrants
► Aggressive poaching of talent pool from MBHI
Religare
321257
157
Star
636
454
+104%
+39%
457
256
353
+38%
MBHI
+10%
Apollo
286257
221233
+82%
Cigna
222
182
122
Total GWP
Religare
726503276
Star
2,962
2,008
1,473
Apollo Munich
1,302
1,022
785
MBHI
594476
373
Cigna
222
144
22
8.34 2.75
9.34 5.30
2.0
Total incremental GWP per incremental rupee of opex
Industry landscape – MBHI is most Operationally efficient, Product Innovator and have the best underwriting practices amongst SAHI Players
39
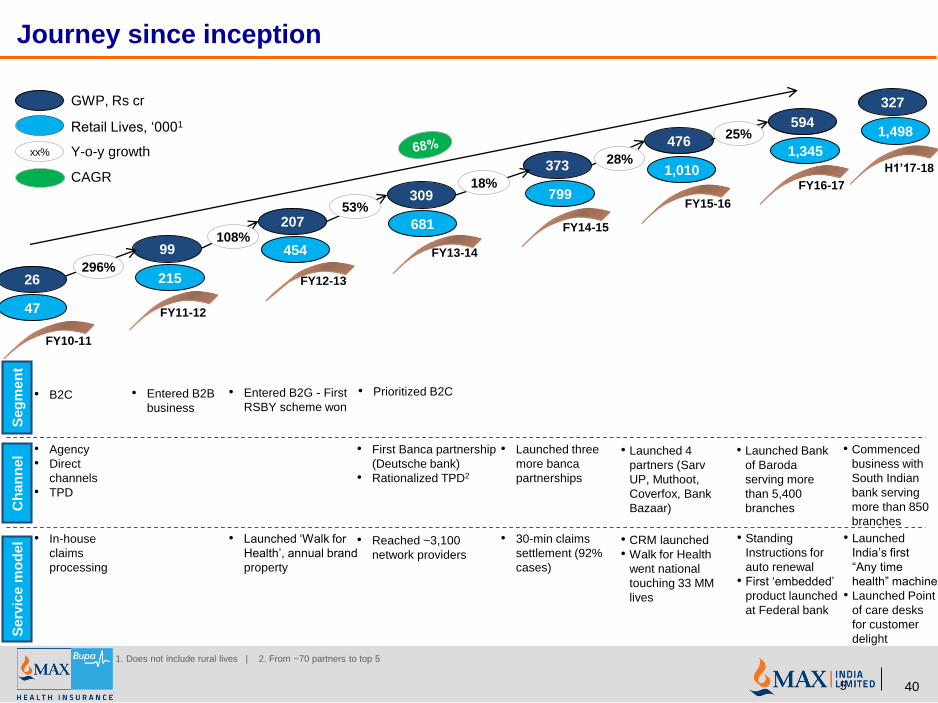
Journey since inception
GWP, Rs cr
Ch
an
ne
lS
erv
ice
mo
de
l
• B2C
• Agency
• Direct
channels
• TPD
• In-house
claims
processing
• Entered B2G - First
RSBY scheme won• Entered B2B
business
• Launched ‘Walk for
Health’, annual brand
property
• First Banca partnership
(Deutsche bank)
• Rationalized TPD2
1. Does not include rural lives | 2. From ~70 partners to top 5
• Reached ~3,100
network providers
• 30-min claims
settlement (92%
cases)
• Launched three
more banca
partnerships
• Prioritized B2C
Retail Lives, ‘0001
xx% Y-o-y growth
CAGR
• CRM launched
• Walk for Health
went national
touching 33 MM
lives
• Launched 4
partners (Sarv
UP, Muthoot,
Coverfox, Bank
Bazaar)
Se
gm
en
t
• Launched Bank
of Baroda
serving more
than 5,400
branches
• Standing
Instructions for
auto renewal
• First ‘embedded’
product launched
at Federal bank
FY10-11
FY11-12
FY12-13
FY14-15
FY15-16
FY13-1499
207
309
373
296%
108%
53%
18%
47
215
454
681
799
476
1,010
26
FY16-17
28%
594
1,345
25%
5
H1’17-18
327
1,498
• Commenced
business with
South Indian
bank serving
more than 850
branches
• Launched
India’s first
“Any time
health” machine
• Launched Point
of care desks
for customer
delight
40
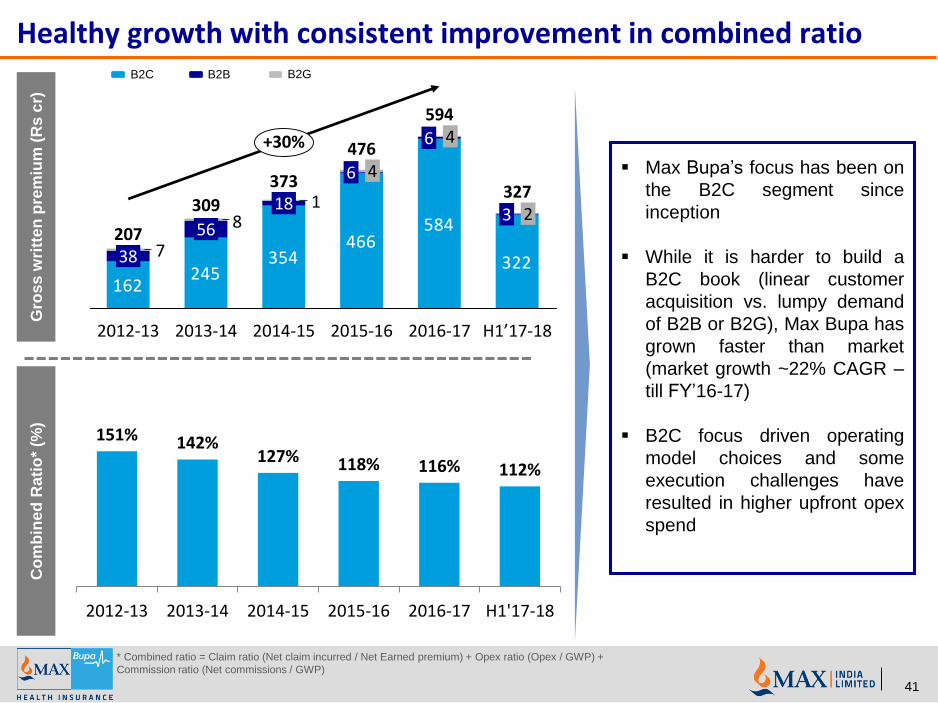
Healthy growth with consistent improvement in combined ratio
▪ Max Bupa’s focus has been on
the B2C segment since
inception
▪ While it is harder to build a
B2C book (linear customer
acquisition vs. lumpy demand
of B2B or B2G), Max Bupa has
grown faster than market
(market growth ~22% CAGR –
till FY’16-17)
▪ B2C focus driven operating
model choices and some
execution challenges have
resulted in higher upfront opex
spend
Co
mb
ine
d R
ati
o*
(%)
Gro
ss
wri
tten
pre
miu
m (
Rs c
r)
* Combined ratio = Claim ratio (Net claim incurred / Net Earned premium) + Opex ratio (Opex / GWP) +
Commission ratio (Net commissions / GWP)
151% 142%127% 118% 116% 112%
2012-13 2013-14 2014-15 2015-16 2016-17 H1'17-18
162245
354466
584
322
18
7
2016-17 H1’17-18
+30%
594
6 4
2015-16
476
6 4
2014-15
37318
2013-14
309
56
2012-13
20738
32723
B2C B2B B2G
41
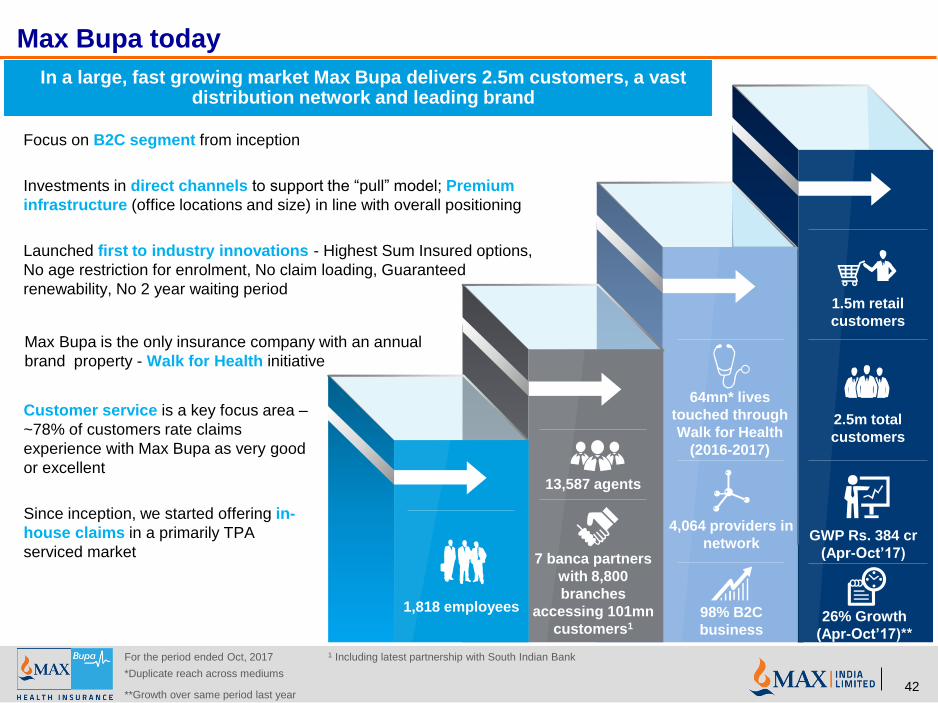
Max Bupa today
In a large, fast growing market Max Bupa delivers 2.5m customers, a vast distribution network and leading brand
1,818 employees
7 banca partners
with 8,800
branches
accessing 101mn
customers1
13,587 agents
98% B2C
business
4,064 providers in
network
64mn* lives
touched through
Walk for Health
(2016-2017)
1.5m retail
customers
2.5m total
customers
GWP Rs. 384 cr
(Apr-Oct’17)
26% Growth
(Apr-Oct’17)**
Focus on B2C segment from inception
Investments in direct channels to support the “pull” model; Premium
infrastructure (office locations and size) in line with overall positioning
Launched first to industry innovations - Highest Sum Insured options,
No age restriction for enrolment, No claim loading, Guaranteed
renewability, No 2 year waiting period
Max Bupa is the only insurance company with an annual
brand property - Walk for Health initiative
Customer service is a key focus area –
~78% of customers rate claims
experience with Max Bupa as very good
or excellent
Since inception, we started offering in-
house claims in a primarily TPA
serviced market
For the period ended Oct, 2017
*Duplicate reach across mediums
1 Including latest partnership with South Indian Bank
**Growth over same period last year42

Comprehensive product suite
Key features include
hospitalization costs including:
► State of art coverage -
Cashless international
coverage (market first)
► Lowest (2 years) pre-existing
disease waiting period
► Out Patient benefits
► AYUSH benefits
► Maternity & New Born benefits
► Coverage from Day 1 for
accidents
► Waiver of 24 months waiting
period for specific conditions
below 45 yrs
► Loyalty benefit at renewal
Our flagship indemnity
product with the most
comprehensive coverage
Heartbeat
Key features include
hospitalization costs including:
► No limit on room rent and pre
and post hospitalization
expenses
► Added protection with Unique
Refill benefit
► All day care procedures
covered
► Unmatched renewal benefits
− No Claim Bonus (No reduction
in case of claims)
− Health check ups to help keep
track of the health condition
► AYUSH in-patient treatment
► Super top up
An indemnity product with
refill benefit, alternative
treatments & Extended Family
First proposition
Health Companion
Accident Care:
► Accidental death benefit
► Accidental Permanent Total
Disability
► Accidental Permanent Partial
Disability benefit
Critical Illness:
► Covers 20 critical illnesses
► 2 options: Lump sum & Lump
sum + staggered pay-out for 5
years
Hospital Cash:
► Daily cash benefit & double
cash benefit for ICU
A fixed benefit product with
unique 3-in-1 combination of
personal accident, critical
illness & hospital cash
Health Assurance
Group Health Insurance
includes:
► Group cover for hospitalization
benefit
Group Personal Accident:
► Accidental Death , Permanent
Total & Partial Disability
Loan linked group critical
illness
► Loan linked cover for 25 critical
illnesses
► Single pay up to 5 years
Group medical cover
► Customizable product for
employer employee groups –
B2B
A group product with
customized propositions by
selecting from over 35
product features and
parameters
Group Platform
43

Distribution architecture
▪ Largest distribution channel for the company
▪ Spanning 29 branches across 19 cities
▪ Over 49% contribution of overall revenue
▪ Frontline sales force of 389 Agency Managers ~14,000 agents
▪ One of the most productive agency force amongst SAHIs (Standalone Health Insurers)
▪ 7 Banca partnerships (2 foreign banks, 4 Indian banks and 1 rural bank), the highest
numbers amongst SAHIs1
• Network of 8,800 bank branches across the country
• 604 FOS (Feet-on-street)
▪ 3 NBFC tie-ups (Capital First, Muthoot, Bajaj Finserv)
▪ Brokers (Bajaj Capital, NJ Brokers, Shriram)
▪ Rural business (RSBY)
▪ One of the largest captive tele-sales set-up in industry
▪ Capacity of 89 out-bound tele-callers
▪ State-of-the-art technology infrastructure (Dialer / CRM) with secure environment
▪ Online sales through MBHI website & web aggregators (6 partners, including Policy
Bazaar – a leading industry player)
▪ Dedicated sales-force
▪ 64 full-time employees to address high-net worth individuals’ needs
▪ Spread across top 4 metros
Agency
Banca &
Alliances
Digital
Direct sales
1 Including latest partnership with South Indian Bank
Distribution updated for Oct 201744
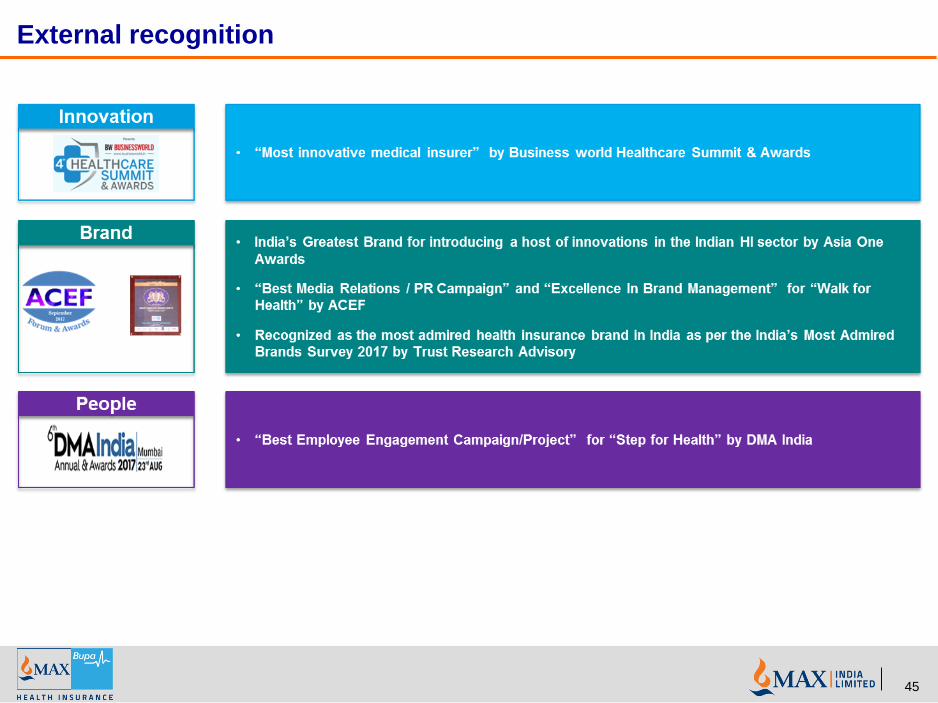
External recognition
45
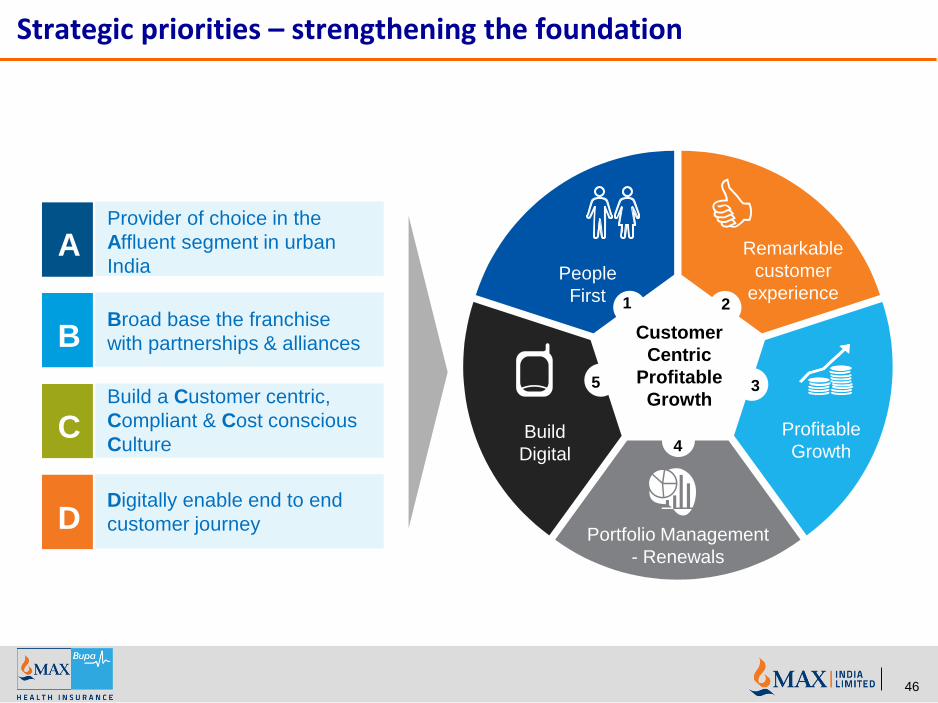
Strategic priorities – strengthening the foundation
Remarkable
customer
experience
Profitable
Growth
Portfolio Management
- Renewals
Build
Digital
People
First
Customer
Centric
Profitable
Growth
1 2
3
4
5
A
B
C
DDigitally enable end to end
customer journey
Build a Customer centric,
Compliant & Cost conscious
Culture
Broad base the franchise
with partnerships & alliances
Provider of choice in the
Affluent segment in urban
India
46
DisclaimerThis presentation has been prepared by Max India Limited (the “Company”). No representation or warranty, express or implied, is made and
no reliance should be placed on the accuracy, fairness or completeness of the information presented or contained in the presentation. The
past performance is not indicative of future results. Neither the Company nor any of its affiliates, advisers or representatives accepts liability
whatsoever for any loss howsoever arising from any information presented or contained in the presentation. The information presented or
contained in these materials is subject to change without notice and its accuracy is not guaranteed.
The presentation may also contain statements that are forward looking. These statements are based on current expectations and
assumptions that are subject to risks and uncertainties. Actual results could differ materially from our expectations and assumptions. We do
not undertake any responsibility to update any forward looking statements nor should this be constituted as a guidance of future
performance.
This presentation does not constitute a prospectus or offering memorandum or an offer to acquire any securities and is not intended to
provide the basis for evaluation of the securities. Neither this presentation nor any other documentation or information (or any part thereof)
delivered or supplied under or in relation to the securities shall be deemed to constitute an offer of or an invitation.
No person is authorised to give any information or to make any representation not contained in and not consistent with this presentation
and, if given or made, such information or representation must not be relied upon as having been authorised by or on behalf of the Company
any of its affiliates, advisers or representatives.
The Company’s Securities have not been and are not intended to be registered under the United States Securities Act of 1993, as amended
(the “Securities Act”), or any State Securities Law and unless so registered may not be offered or sold within the United States or to, or for
the benefit of, U.S. Persons (as defined in Regulations S under the Securities Act) except pursuant to an exemption from, or in a transaction
not subject to, the registration requirements of the Securities Act and the applicable State Securities Laws.
This presentation is highly confidential, and is solely for your information and may not be copied, reproduced or distributed to any other
person in any manner. Unauthorized copying, reproduction, or distribution of any of the presentation into the U.S. or to any “U.S. persons”
(as defined in Regulation S under the Securities Act) or other third parties ( including journalists) could prejudice, any potential future
offering of shares by the Company. You agree to keep the contents of this presentation and these materials confidential.
47

ANNEXURES
48

Mr. Rahul Khosla (Chairman)
President – Max Group
Over 30 years of global experience in Banking and
Financial markets.
Mr. Mohit Talwar
Managing Director at Max India Ltd. & Max Financial
Services Ltd., Over 30 years of experience in Corporate
Finance and Investment Banking.
Dr. Omkar Goswami
Economist and Leading Academic
Serves on Board of many Indian MNCs as Dr Reddy’s,
Infosys, IDFC, Crompton Greaves, Cairn India Ltd. etc
Mr. Kummamuri Murthy Narasimha
Independent Director; Leading Finance professional
associated with the development of Cost &
Management Information Systems for over 150 firms
Mr. Rajit Mehta
Managing Director & CEO- Max Healthcare
Over 20 years of experience in financial services.
Previously Chief Operating Officer at Max Life
Insurance.
Dr. Ajit Singh
Partner at Artiman Ventures, focusing on early-
stage technology & life science investments
PhD in Computer Science from Columbia University
Dr. Pradeep Kumar Chowbey, Padmashri
Director of Max Institute of Minimal Access,
Metabolic and Bariatric Surgery. More than 35 yrs
of experience in Lap Surgery, completed 70,000
major Lap procedures
Mr. Andre Meyer
Chief Executive Officer, Life Healthcare Group
Extensive experience at executive level in employee
benefits and healthcare sectors
MHC - Board of Directors
49
Mr. Adam Pyle
Non Executive Director and Group Executive, Strategy
and Investor relations, Life Healthcare Group
Commerce and Law graduate and currently
responsible at LHC for driving the international (Poland,
India and other territories) strategy, South Africa
strategy and managing Investor relationship
Mr. Pieter Van Der Westhuizen
Non Executive Director and Chief Financial Officer, Life
Healthcare
Part of the LHC group for last 17 years and has fulfilled
various financial roles

Mr. Rajit Mehta
Managing Director & CEO- Max Healthcare
Over 20 years of experience in financial services.
Previously Chief Operating Officer at Max Life
Insurance.
Mr. Yogesh Sareen
Senior Director & Chief Financial Officer
Over 20 years of experience in across all facets of
finance; previously CFO of Fortis Healthcare.
Mr. Rohit Kapoor
Senior Director & Chief Growth Officer
18 years of diverse experience across industry and
management consulting with McKinsey & Company
Mrs. Swati Rustagi
Director- Human Resources & Chief People Officer
Over 17 years of experience in HR across FMCG,
Financial Services and Health Care sectors. Previously
global head of HR at Glenmark Pharmaceuticals
Mr. Anil Vinayak
Director & Zonal Head – NCR 1
Over 23 years of experience in Business Management
and Sales & Marketing; previously with Amex
Mr. Anas Wajid
Director- Sales & Marketing
More than 17 years of experience in diverse fields such
as advertising, retail , healthcare and media. Previously
Head, Sales and Marketing at Fortis Healthcare
Dr. Sandeep Buddhiraja
Director- Clinical Directorate & Institute of Internal Med.
Over 23 years of experience in the field of Internal
Medicine
Mr. Rakesh Prusti
Director - Legal, Compliance and Regulatory Affairs
Over 19 years of experience in diverse sectors such as
Trading, IT, Export and Manufacturing; previously with
Carrefour and NIIT
Mrs. Vinita Bhasin
Senior Vice President & Head of Service Excellence
More than 19 years of in-depth experience across the
Financial Services sector; previously with Max Life
Insurance
Mr. Sumit Puri
Chief Information Officer
Over 21 years of experience in varied industries
such as Health/ Life Insurance, IT/ITES, and
Consulting; previously CIO of Prudential Life
Assurance
MHC – Management Team
50

Key Physicians
51
Dr. Harit Chaturvedi
Chairman – Cancer Care, Director & Chief Consultant -
Surgical Oncology
Over 25 years of experience in Surgical Oncology.
Dr. Sandeep Buddhiraja
Director - Clinical Directorate & Institute of Internal Med.
Over 23 years of experience in the field of Internal
Medicine
Strong consultant bench strength of 350+ across specialities :
▪ Cardiac – 100+
▪ Oncology – 50+
▪ Orthopaedics – 50+
▪ Neurosciences – 50+
▪ Renal – 50+
▪ MAMBS – 25+
Dr. Anurag Krishna
Director- Paediatrics & Paediatrics Surgery
Over 20 years of experience in Paediatric surgery -
complex congenital malformations
Dr. A.K. Singh
Director – Max Institute of Neurosciences, Dehradun
Renowned Neurosurgeon having 40 years experience
Recipient of the BC Roy award
Dr. Pradeep Kumar Chowbey, Padmashri
Director of Max Institute of Minimal Access, Metabolic
and Bariatric Surgery.
More than 35 yrs of experience in Lap Surgery,
completed 70K+ major Lap procedures
Dr. K. K. Talwar
Chairman - Cardiology, Max Healthcare
Clinical experience of more than 39 years
Former Head, Department of Cardiology, AIIMS
Dr. Anant Kumar
Chairman – Urology,Renal Transplant, Robotics(Max
Saket Complex) and Uro-Oncology Max Saket
2200 Kidney Transplantations in the last 25 years
and over 1500 lap donors nephrectomy
Dr. Subhash Gupta
Chairman - Liver Transplant & Biliary Sciences
2,200+ liver transplant surgeries & over 30 year
experience in Liver Transplants
Recipient of the BC Roy award

MHC Network* – Performance Dashboard (Q2 & H1FY18)
*The above results are for MHC Network of hospitals and includes results for Max Super Specialty Hospital, Saket, unit of Devki Devi Foundation, Max Super Speciality Hospital, Patparganj, unit of Balaji Medical and Diagnostic Research Centre ; Saket City Hospital unit of GujarmalModi Hospital & Research Centre & Max Multi Speciality Hospital Greater Noida unit of Four Season Foundation^ on the basis of net revenue
52
Rs Cr
Sep-17 Sep-16 Sep-17 Sep-16
a) Financial Performance
Revenue (Gross) 712 667 7% 1,414 1,300 9%
Revenue (Net) 676 640 6% 1,342 1,248 8%
Direct Costs
Material Cost 169 159 6% 336 319 5%
Clincian Payout 116 109 7% 234 213 10%
Contribution 390 372 5% 773 716 8%
Contribution Margin^ 57.8% 58.1% (26) bps 57.6% 57.4% 17 bps
Indirect Costs
Personnel Cost 170 148 15% 337 294 15%
Other Indirect overheads 117 113 3% 232 222 4%
HO Costs 34 31 9% 70 60 16%
EBITDA 69 80 -13% 133 140 -5%
EBITDA Margin^ 10.3% 12.4% (217) bps 9.9% 11.2% (129) bps
Finance Cost 32 35 -9% 64 70 -8%
Cash Profit 37 44 -16% 69 70 -1%
Depreciation 34 30 15% 67 60 12%
Profit Before tax 3 15 -79% 2 10 80%
Tax 1 - - 2 - 0%
Profit /(loss) after tax 2 15 -83% (0) 10 -102%
b) Financial Position
Net Worth 1,124 1,108 1% 1,124 1,108 1%
Net Debt 1,168 1,078 8% 1,168 1,078 8%
Tangible Fixed Assets - Gross Block 2,056 1,985 4% 2,056 1,985 4%
Key Business Drivers Quarter Ended Y-o-Y
Growth
Half Year Ended Y-o-Y
Growth
53
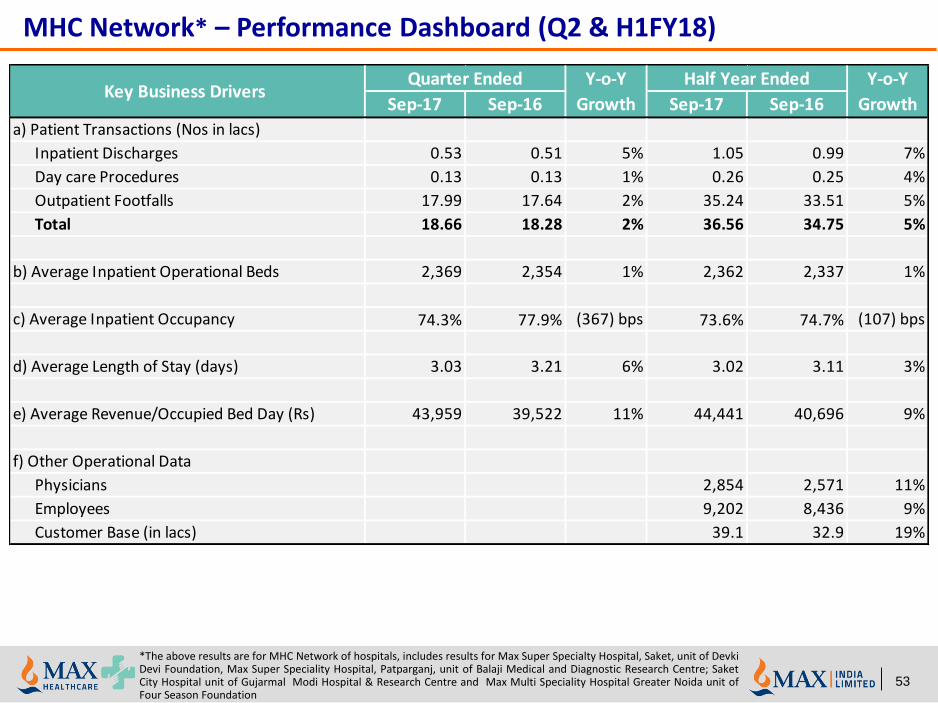
MHC Network* – Performance Dashboard (Q2 & H1FY18)
*The above results are for MHC Network of hospitals, includes results for Max Super Specialty Hospital, Saket, unit of DevkiDevi Foundation, Max Super Speciality Hospital, Patparganj, unit of Balaji Medical and Diagnostic Research Centre; SaketCity Hospital unit of Gujarmal Modi Hospital & Research Centre and Max Multi Speciality Hospital Greater Noida unit ofFour Season Foundation
Sep-17 Sep-16 Sep-17 Sep-16
a) Patient Transactions (Nos in lacs)
Inpatient Discharges 0.53 0.51 5% 1.05 0.99 7%
Day care Procedures 0.13 0.13 1% 0.26 0.25 4%
Outpatient Footfalls 17.99 17.64 2% 35.24 33.51 5%
Total 18.66 18.28 2% 36.56 34.75 5%
b) Average Inpatient Operational Beds 2,369 2,354 1% 2,362 2,337 1%
c) Average Inpatient Occupancy 74.3% 77.9% (367) bps 73.6% 74.7% (107) bps
d) Average Length of Stay (days) 3.03 3.21 6% 3.02 3.11 3%
e) Average Revenue/Occupied Bed Day (Rs) 43,959 39,522 11% 44,441 40,696 9%
f) Other Operational Data
Physicians 2,854 2,571 11%
Employees 9,202 8,436 9%
Customer Base (in lacs) 39.1 32.9 19%
Key Business Drivers Quarter Ended Y-o-Y
Growth
Half Year Ended Y-o-Y
Growth
54
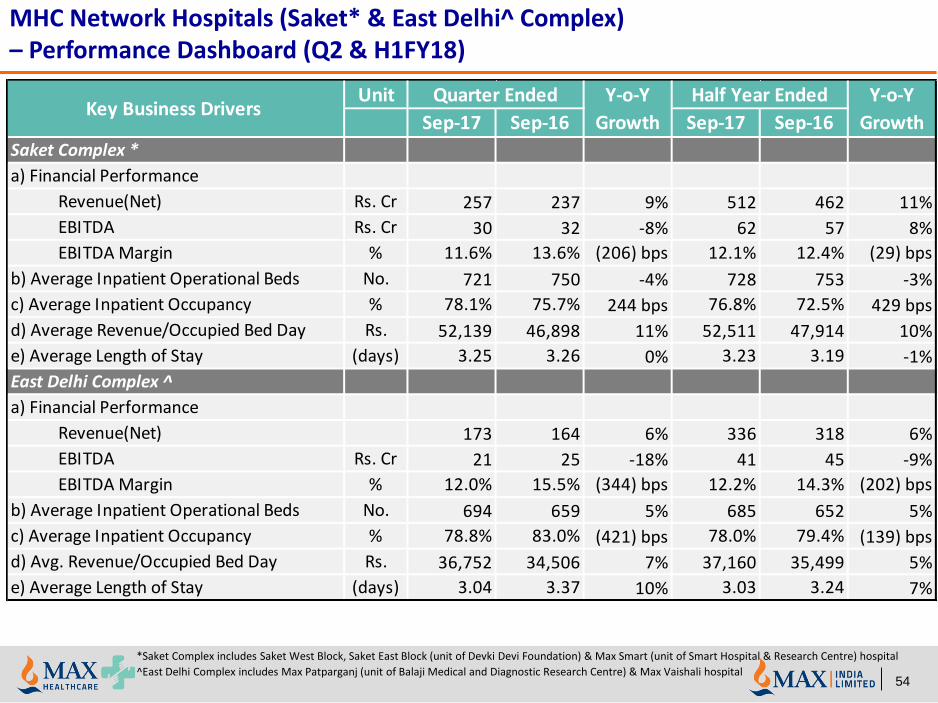
*Saket Complex includes Saket West Block, Saket East Block (unit of Devki Devi Foundation) & Max Smart (unit of Smart Hospital & Research Centre) hospital
^East Delhi Complex includes Max Patparganj (unit of Balaji Medical and Diagnostic Research Centre) & Max Vaishali hospital
MHC Network Hospitals (Saket* & East Delhi^ Complex) – Performance Dashboard (Q2 & H1FY18)
Unit
Sep-17 Sep-16 Sep-17 Sep-16
Saket Complex *
a) Financial Performance
Revenue(Net) Rs. Cr 257 237 9% 512 462 11%
EBITDA Rs. Cr 30 32 -8% 62 57 8%
EBITDA Margin % 11.6% 13.6% (206) bps 12.1% 12.4% (29) bps
b) Average Inpatient Operational Beds No. 721 750 -4% 728 753 -3%
c) Average Inpatient Occupancy % 78.1% 75.7% 244 bps 76.8% 72.5% 429 bps
d) Average Revenue/Occupied Bed Day Rs. 52,139 46,898 11% 52,511 47,914 10%
e) Average Length of Stay (days) 3.25 3.26 0% 3.23 3.19 -1%
East Delhi Complex ^
a) Financial Performance
Revenue(Net) 173 164 6% 336 318 6%
EBITDA Rs. Cr 21 25 -18% 41 45 -9%
EBITDA Margin % 12.0% 15.5% (344) bps 12.2% 14.3% (202) bps
b) Average Inpatient Operational Beds No. 694 659 5% 685 652 5%
c) Average Inpatient Occupancy % 78.8% 83.0% (421) bps 78.0% 79.4% (139) bps
d) Avg. Revenue/Occupied Bed Day Rs. 36,752 34,506 7% 37,160 35,499 5%
e) Average Length of Stay (days) 3.04 3.37 10% 3.03 3.24 7%
Key Business Drivers Quarter Ended Y-o-Y
Growth
Half Year Ended Y-o-Y
Growth
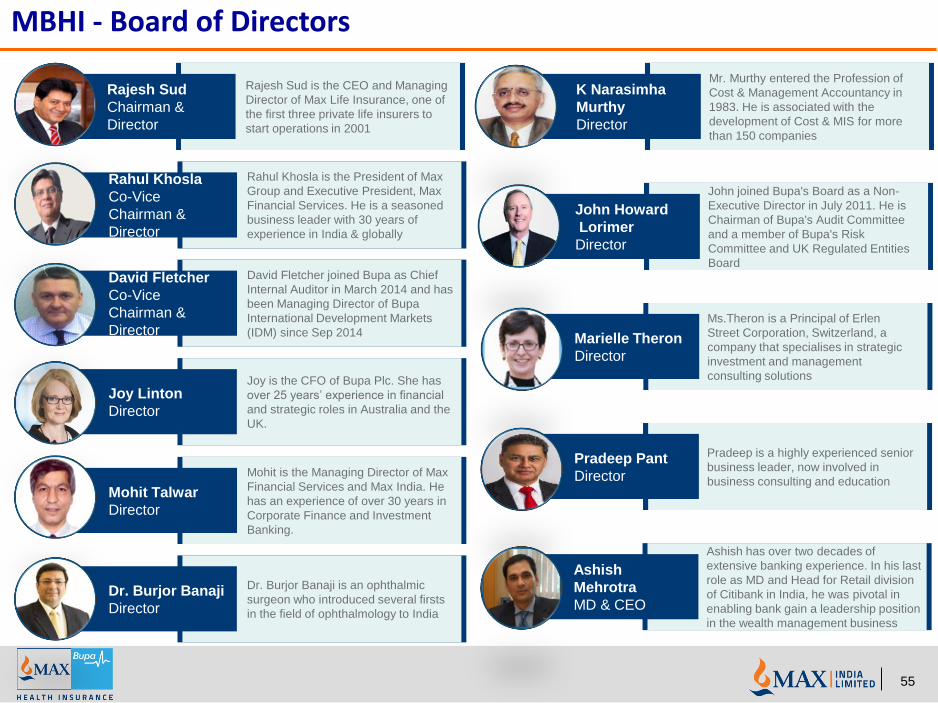
MBHI - Board of Directors
55
K Narasimha
Murthy
Director
Mr. Murthy entered the Profession of
Cost & Management Accountancy in
1983. He is associated with the
development of Cost & MIS for more
than 150 companies
John Howard
Lorimer
Director
John joined Bupa's Board as a Non-
Executive Director in July 2011. He is
Chairman of Bupa's Audit Committee
and a member of Bupa's Risk
Committee and UK Regulated Entities
Board
Marielle Theron
Director
Ms.Theron is a Principal of Erlen
Street Corporation, Switzerland, a
company that specialises in strategic
investment and management
consulting solutions
Pradeep Pant
Director
Pradeep is a highly experienced senior
business leader, now involved in
business consulting and education
Ashish
Mehrotra
MD & CEO
Ashish has over two decades of
extensive banking experience. In his last
role as MD and Head for Retail division
of Citibank in India, he was pivotal in
enabling bank gain a leadership position
in the wealth management business
Rajesh Sud
Chairman &
Director
Rajesh Sud is the CEO and Managing
Director of Max Life Insurance, one of
the first three private life insurers to
start operations in 2001
Rahul Khosla
Co-Vice
Chairman &
Director
Rahul Khosla is the President of Max
Group and Executive President, Max
Financial Services. He is a seasoned
business leader with 30 years of
experience in India & globally
Joy Linton
Director
Joy is the CFO of Bupa Plc. She has
over 25 years’ experience in financial
and strategic roles in Australia and the
UK.
Mohit Talwar
Director
Mohit is the Managing Director of Max
Financial Services and Max India. He
has an experience of over 30 years in
Corporate Finance and Investment
Banking.
Dr. Burjor Banaji
Director
Dr. Burjor Banaji is an ophthalmic
surgeon who introduced several firsts
in the field of ophthalmology to India
David Fletcher
Co-Vice
Chairman &
Director
David Fletcher joined Bupa as Chief
Internal Auditor in March 2014 and has
been Managing Director of Bupa
International Development Markets
(IDM) since Sep 2014
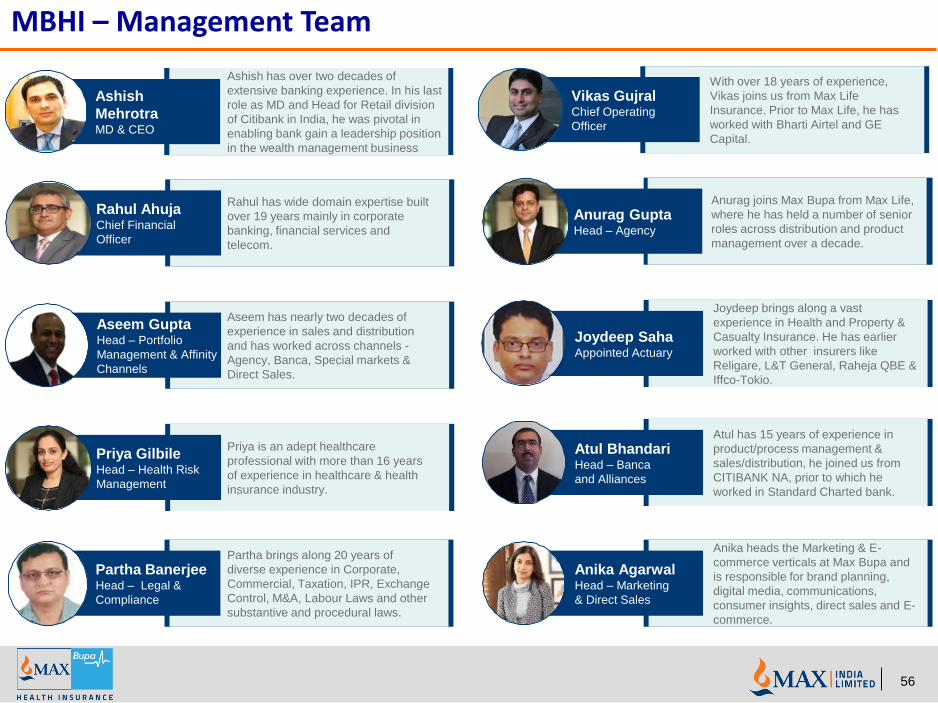
MBHI – Management Team
56
Vikas GujralChief Operating
Officer
With over 18 years of experience,
Vikas joins us from Max Life
Insurance. Prior to Max Life, he has
worked with Bharti Airtel and GE
Capital.
Rahul AhujaChief Financial
Officer
Rahul has wide domain expertise built
over 19 years mainly in corporate
banking, financial services and
telecom.
Anurag GuptaHead – Agency
Anurag joins Max Bupa from Max Life,
where he has held a number of senior
roles across distribution and product
management over a decade.
Aseem has nearly two decades of
experience in sales and distribution
and has worked across channels -
Agency, Banca, Special markets &
Direct Sales.
Aseem GuptaHead – Portfolio
Management & Affinity
Channels
Priya Gilbile Head – Health Risk
Management
Priya is an adept healthcare
professional with more than 16 years
of experience in healthcare & health
insurance industry.
Anika AgarwalHead – Marketing
& Direct Sales
Anika heads the Marketing & E-
commerce verticals at Max Bupa and
is responsible for brand planning,
digital media, communications,
consumer insights, direct sales and E-
commerce.
Joydeep Saha Appointed Actuary
Joydeep brings along a vast
experience in Health and Property &
Casualty Insurance. He has earlier
worked with other insurers like
Religare, L&T General, Raheja QBE &
Iffco-Tokio.
Atul Bhandari Head – Banca
and Alliances
Atul has 15 years of experience in
product/process management &
sales/distribution, he joined us from
CITIBANK NA, prior to which he
worked in Standard Charted bank.
Partha BanerjeeHead – Legal &
Compliance
Partha brings along 20 years of
diverse experience in Corporate,
Commercial, Taxation, IPR, Exchange
Control, M&A, Labour Laws and other
substantive and procedural laws.
Ashish
MehrotraMD & CEO
Ashish has over two decades of
extensive banking experience. In his last
role as MD and Head for Retail division
of Citibank in India, he was pivotal in
enabling bank gain a leadership position
in the wealth management business

Max Bupa – Performance Dashboard (Q2 & H1FY18)
57
* Earned Premium lower by Rs 6 Cr in Q2FY18 & Rs 14 Cr in H1FY18 due to change in Unearned premium accounting from 1/365 method to
50% of net written premium, excludes the impact of reinsurance ceded
^ Normalised profit (excluding one-offs) at Rs 0.1 Cr in Q2 vs net loss of Rs 10 Cr in PY; H1FY18 profit of Rs 9 Cr vs net loss of Rs 16 Cr in PY
Sep-17 Sep-16 Sep-17 Sep-16
a) Gross written premium income
First year premium 54 50 8% 108 92 17%
Renewal premium 115 89 29% 219 168 30%
Total 168 138 22% 327 260 26%
b) Net Earned Premium* 146 148 -2% 279 260 7%
c) Net Profit /(Loss) ^ (6) 23 -124% (5) 18 -129%
d) Claim Ratio(B2C Segment, normalized) 60.3% 60.4% (10) bps 57.9% 57.0% 90 bps
e) Avg. premium realization per life (B2C) 8,057 6,937 16% 7,952 6,937 15%
f) Conservation ratio (B2C Segment) 83% 84% (159) bps 83% 84% (147) bps
g) Lives In force in millions (including RSBY) 2.5 2.2 15%
h) Number of agents 13,357 14,705 -9%
i) Paid up Capital 926 926 -
Key Business Drivers Quarter Ended Y-o-Y
Growth
Half Year Ended Y-o-Y
Growth

MAX INDIA LTD.Max House, Okhla, New Delhi – 110 020
Phone: +91 11 26933601-10 Fax: +91 11 26933619
Website: www.maxindia.com
58
Top Related