


Languages
Pages
Legal

Halmstad University
School of Business and Engineering
Strategic Management and Leadership
Master of Science Degree
Master Thesis
Comparative analysis of emerging markets hedge funds and
emerging markets benchmark indices performance
Report in the course Master thesis 15 ECTS
1 June 2011
Authors
Irina Kotorova 880725-T148
Mattias Sandström 830810-5710
Supervisor: Hans Mörner
Examiner: Mike Danilovic
II
Contents
List of Tables ...................................................................................................................... III
Abstract .............................................................................................................................. IV
Acknowledgements .............................................................................................................. V
Key Definitions ................................................................................................................... VI
1 Introduction ................................................................................................................... 1
1.1 Background ............................................................................................................. 1
1.2 Research Question .................................................................................................. 2
1.3 Delimitations .......................................................................................................... 3
2 Methodology ................................................................................................................. 4
2.1 Scientific approach .................................................................................................. 4
2.2 Research strategy and Data collection ..................................................................... 6
2.2.1 Hedge fund data ............................................................................................... 9
2.2.2 Benchmark data ............................................................................................... 9
3 Theoretical framework ................................................................................................ 11
3.1 Hedge funds and emerging markets as their strategy ............................................. 11
3.2 Emerging Markets Hedge Funds performance analysis.......................................... 12
3.2.1 Correlation/Covariance .................................................................................. 12
3.2.2 Autocorrelation .............................................................................................. 13
3.2.3 Alpha ............................................................................................................. 13
3.2.4 Beta ............................................................................................................... 14
3.2.5 CAPM ........................................................................................................... 15
3.2.6 Sharpe Ratio .................................................................................................. 16
3.2.7 Treynor‟s Ratio .............................................................................................. 18
3.3 Financial Tools of Performance ............................................................................. 18
4 Empirical Findings and Analysis ................................................................................. 24
5 Conclusions and Implications ...................................................................................... 31
6 Recommendations/Suggestions for Further Research ................................................... 33
7 References and Appendices ......................................................................................... 34
7.1 Scientific articles ................................................................................................... 34
7.2 Literature .............................................................................................................. 35
7.3 Web Pages ............................................................................................................ 36
8 Appendices .................................................................................................................. 38

III
List of Tables
Table 1 Descriptive stats for EMHF indices and emerging markets benchmarks .................... 8
Table 2 Estimated Covariance ............................................................................................. 24
Table 3 Estimated Correlation ............................................................................................. 25
Table 4 Autocorrelation Estimations ................................................................................... 25
Table 5 Estimated Beta ....................................................................................................... 26
Table 6 Estimated Alpha ..................................................................................................... 27
Table 7 Estimated CAPM .................................................................................................... 27
Table 8 Treynor‟s ratio ........................................................................................................ 28
Table 9 Sharpe Ratios ......................................................................................................... 29

IV
Abstract
Many hedge funds are believed to yield considerable returns to investors; there is an
assumption that suggests hedge funds seem uncorrelated with market fluctuations and have
relatively low volatility. In recent years, emerging market hedge funds have experienced a
higher capital inflow in periods when the diversification benefits of investing in emerging
markets are higher. However, the strategy‟s share of the hedge fund industry‟s total capital
flows has decreased significantly during the same periods: this might imply that investors
have reallocated capital to other hedge fund strategies. This paper investigates whether
emerging markets hedge funds have been as consistent in performance as the benchmark
indices by presenting results of comparative analysis of two sample emerging markets hedge
fund indices and two standard emerging markets benchmarks performance. The empirical
study ranges from the period of January 2006 to December 2010.

V
Acknowledgements
I would like to thank all professors and tutors for their support and assistance: Hans Mörner,
Ingemar Wictor, Christer Norr, Pia Ulvenblad, Joakim Winborg. Throughout the whole
Master programme, they have influenced and formed my views reflected in this work. I also
wish to extend my gratitude to my family, especially my Grandfather, for his love and faith,
and also all of my friends – in the Czech Republic, Great Britain, Russia and Sweden. Very
special thanks to ELC Harris for his fantastic support and encouragement.
Irina Kotorova
I would like to express my gratitude to my family for being there and giving me support and
advice during my studies. I also wish to thank our supervisor Hans Mörner for his help and
enthusiasm about the thesis and Joakim Tell, my programme director. And last but not least –
big thanks to Christer Norr for his encouragement and flexibility during the whole course of
studies and his witty inspiring lectures.
Mattias Sandström
VI
Key Definitions
Hedge funds
Investment vehicles structured as either private partnerships or offshore companies that aim
to achieve substantial absolute total returns. Such funds seek to generate returns by normally
using short selling, hedging, arbitrage, leveraging, synthetic positions or derivatives. A hedge
fund manager receives an incentive fee on the outcome of these strategies.
Emerging markets
Developing economies of Brazil, Russia, India, China, South Africa (also known as BRICS),
Eastern Europe, Latin America, Middle East, parts of Asia and Africa.
Emerging markets hedge funds (EMHFs)
Funds focussing on emerging markets with less-developed economies and aim to profit from
the market growth or economic conditions which positively affect particular securities in the
emerging markets. Hedge funds which use this strategy will purchase securities in the
emerging market such as sovereign debt or corporate securities in the belief that their value
will appreciate with economic growth.
Volatility The speed and magnitude of price changes in securities over a specific period of time. A price
that often fluctuates is defined to have a high degree of volatility. The standard deviation is
the standard measure of volatility.
1
1 Introduction
This chapter gives an insight of the background of the topic that will be researched followed by a problem discussion, which leads to the purpose of this study along with delimitations.
1.1 Background
Investments into alternative asset classes have grown considerably in recent years: the hedge
fund management industry peaked at $1.93 trillion at the end of June 2008 (Sadka, 2009).
Institutional investors began to roll into an investment product they had largely stayed away
from in the 80s and 90s and today, they represent the major source of alternative investments
funding. Hedge funds provided positive returns in a decade where equities did not. Yet, the
recent financial crisis has brought to light a number of questionable practices which ought to
be eliminated through a combination of regulatory guidelines, pressure from investors and
enlightened industry leadership (Amenc, Martellini&Vaissié, 2002).
Some of the mutual fund managers, who have been consistently successful in performance
using the passive strategies, tend to move into the area of alternative investments and start
running hedge funds, very often becoming co-investors in those funds. In addition, hedge
funds strive to deliver high absolute returns and usually have high incentive fees which help
in a better alignment of the interests of the managers and the investors. This has caused many
investors following active-passive strategies to seriously consider replacing the traditional
active part of their portfolio with alternative investment strategies (Agarwal&Naik, 1998).
Amenc et al. (2002) believe that emerging markets, as a growth sector, represent the most
attractive investment prospects, although imply uncertainty and high risk levels. This
emerging markets investments attractiveness is also enhanced by the stock market situation,
which increases investors' interest in investment services that base their strategy on the
decorrelation with the risks and returns of the financial markets and therefore the search for
an absolute return.
Emerging markets by default imply careful consideration. Emerging market hedge funds have
also experienced a higher capital inflow in periods when the diversification benefits of
investing in emerging markets are higher. However, the strategy‟s share of the hedge fund
industry‟s total capital flows has decreased significantly during the same periods. This shows
that investors have reallocated money to other hedge fund strategies (Strömqvist, 2008).
Getmansky, Lo and Makarov (2004) suggest that many hedge funds, that are often called
high-octane investments, have yielded considerable returns to investors; there is an
assumption that suggests hedge funds seem uncorrelated with market fluctuations and have
relatively low volatility. It is usually accomplished by taking both long and short positions in
securities (“hedge funds”) which, as a rule, gives investors an opportunity to profit from both
positive and negative data whilst, at the same time providing market neutrality to a certain
degree of because of the simultaneous long and short positions.
In this paper, we will focus on emerging markets hedge funds and continue studies started by
following researchers: Fung and Hsieh (1997, 2001), Agarwal and Naik (2004), Capocci and
Hsieh (2004), Strömqvist (2007), Abugri and Dutta (2009), Agarwal and Jorion (2010), Eling
and Faust (2010).
2
Fung and Hsieh (1997, 2001) study dataset on hedge fund strategies that are dramatically
different from mutual funds and support that these strategies are highly dynamic. They
analyse emerging markets hedge funds under one of sub-categories of five dominant
investment styles. In their later study in 2001, they modelled hedge fund returns by focussing
on the „trend-following‟ strategy and show how they can explain such funds‟ returns better
than standard asset indices. Strömqvist (2007) takes the skills of emerging markets hedge
funds managers as a research focus.
Increasing popularity of hedge funds has also inspired researchers to analyse their
performance and compare it to different benchmarks. During their research, several unique
difficulties in assessing hedge fund performance have been identified: the most problematic
issue is that hedge funds are not required to report their results and thus, all existing reports
are based on self-reported data with self-selection biases. More so, the resulting sample has a
bias towards outperforming funds, since funds that have not performed particularly well are
less likely to report their data (Dichev&Yu, 2010). Abugri and Dutta (2009) came to the
conclusion that there is a non-linear relationship between hedge funds that use dynamic
trading strategies in developed markets and the returns of benchmark indices. In this paper,
we will test whether this statement is applicable to hedge funds employing emerging markets
strategy by taking into consideration two sample emerging markets hedge funds indices. We
will then compare them with two benchmark indices S&P/IFCI and MSCI Emerging Markets
and analyse the performance of both over the last five year to see as to what extend emerging
markets hedge funds are consistent in performance comparing to the benchmark indices.
1.2 Research Question
Our research question is formulated as follows: have emerging markets hedge funds,
represented by the sample indices Barclay Emerging Markets Index and InvestHedge
Emerging Markets Index been outperforming the emerging markets equity benchmarks,
S&P/IFCI and MSCI within the sample period of January 2006 to December 2010, and, if so,
to what extent?
Within the course of this study, we will analyse and compare the performance of emerging
markets hedge funds and standard indices using traditional tools of investment analysis.
The study will be based on comparative analysis of performance of emerging markets hedge
funds with the two benchmarks using the previous research and indices‟ performance figures
gathered from publicly available investment/financial databases. We will then compare the
results to the ones that previous researchers have come to by employing similar tools of
performance analysis.
3
1.3 Delimitations
We have strived to only use data publicly available via different index platforms and
databases. Hedge funds operate in unregulated environment and are not required to report
performance data to any regulatory body. In many cases, they do only report data during their
successful periods and/or refrain from reporting when the performance was not as
remarkable. That is why the data obtained might be biased and should be taken as a subject to
criticism. We have also not considered fund liquidation factor during the study period.
As we sought to look into specific hedge fund indices and test how their performance has
generally been correlated to the benchmark indices, we have not gathered data on all the
existing emerging markets hedge funds reporting. Our study only examines a comprehensive
sample of hedge funds collected from two different databases and only a sample of emerging
markets hedge funds as a fund strategy will be analysed. Also, they will only be compared to
standard emerging markets equity benchmark indices. The research is in addition limited to
the period of January 2006 to December 2010. Also, incentive fees and their influence over
the hedge funds performance have not been taken into account.
The research will be limited to the calculations using several financial and statistical models
such as covariance/correlation, autocorrelation, alpha and beta estimations, CAPM, Sharpe
and Treynor‟s ratios.
4
2 Methodology
In this chapter, methodical implications as well as scientific approach of the study and data
collection will be discussed in order to map the formal outlay of scientific method applied in
the study.
2.1 Scientific approach
Scientific approach selection is crucial when starting the research process as it clarifies the
scientific stances concerning research and theory, which includes the definitions of theory
and research and their interlinking, answering how theory and research will be regarded in
the research method. Oxford University Press (OUP) defines theory as “a coherent
explanation or description, reasoned from known facts”. According to OUP, a fact is
anything that is known or proved to be true and cannot be disputed. Wacker‟s (1998)
definition of theory is built up by four components: definitions of terms or variables, domain
where the theory applies, set of relationships of variables, and finally specific predictions and
factual claims answering stated research questions of who, what, when, where, how, why,
should, could and would. Theories carefully map out the definitions in a specific domain to
answer the question of why and how the relationships are logically connected so that the
theory gives predictions (Wacker, 1998, pp. 363-64). This explains how “good” theory gives
the exacting effect on all the key components of a theory. Walker (1998) states that good
theory is as theory that is, by definition a limited and fairly precise picture.
The precision and limitation of theory can be found in the definitions of terms, the domain of
the theory, the explanation of relationships, and the specific predictions. The aim and goal of
good theory is to give a clear explanation of how and why specific relation leads to specific
events (Walker, 1998). This explanation of relationship is critical to good theory building.
There are authors who put more emphasis on the importance of relationship-building in the
context of theory. The role of research is to systematically investigate and study materials and
sources for the creation of facts and reach new conclusions Oxford university press (OUP).
According to Bryman and Bell (2007), the relationship between theory and research is
divided into two approaches of science: deductive and inductive. Although both approaches
will be employed in this study, deductive approach will be used more frequently as we base
our research on the factual data. Deductive theory is the most common perspective of the
relationship between theory and research. Deductive research is based on what is known
about a specific domain and of theoretical considerations in relation to the specific domain,
hypothesis/es is/are deduced which will afterwards be put through thorough empirical
examination (Bryman&Bell, 2007). Concepts that have to be transformed into entities of
research come along with the hypothesis. In social science theory the researcher has to
deduce a hypothesis and translate it to operational terms. Social scientist thereof has to
specify the way of collecting data in regards to the concepts which make up the hypothesis.
Inductive research is based on observations/findings making theory the aim of the research
process unlike deductive approach where theory is the base and observation/findings the
purpose of the research process (Bryman&Bell, 2007, pp 13-14). As the inductive process
means drawing generalised inferences from observations, there is no absolute form of
deductive or inductive research process.
When researchers have decided their inter-relational stance regarding theory and research in
specific deductive or inductive approaches, epistemological and ontological consideration
5
should be taken into consideration (Bryman&Bell 2007, p.16). The reason why these
considerations are important is because they mark the way of research method, the view of
how social science should be performed and regarded (Neuman, pp. 68-70). Epistemological
considerations bring up the issue of what can be acceptable knowledge in a discipline
(Bryman&Bell, 2007, p.16). Central issue is if social science can likewise be studied by the
same principles, procedures, and ethos as the natural sciences. The epistemological concerns
have two positions, positivism and interpretivism, where positivism advocates the possibility
of using the methods from natural science on the reality of social science and beyond
(Bryman&Bell 2007, p.16). According to Bryman and Bell (2007) there are 5 requisites for
positivist research:
1. The principal of phenomalisation
2. The principal of deductivism
3. The principles of inductivism
4. Science must be conducted value free (objective)
5. Distinction between scientific and normative statements and the conviction that the
former are the true domain of the scientist.
There are writers who discard the use of positivism and natural science to study social reality
the appropriateness of which has been extensively discussed; such writers associate
themselves with the creation of interpretivism (Bryman&Bell, 2007, p. 17). Interpretivism is
a contrasting term of positivism critical to the application of natural science on a social
context (Bryman&Bell, 2007, p. 17). The philosophy of interpretivism requires a research
strategy that minds the difference between people and objects of the natural world demanding
the social scientist to understand the subjective meaning of social action (Bryman&Bell 2007,
pp. 17-19).
Ontological considerations concern the nature of entities, the central point here is to whether
it is possible to consider social entities as objective entities that have an external reality to
social actors, or if they can and ought to be considered the social constructs based on
perceptions and actions of social actors. These two philosophical stances are respectively
referred to the positions of objectivism and constructivism (Bryman&Bell, 2007, p. 22). The
authors define objectivism as an ontological position where social phenomena confront us as
external facts that are out of reach or influence. This means that categories and social
phenomena used in every day discourse exists independently from actors (Bryman&Bell
2007, p. 22). Constructionism is an ontological position which asserts that social phenomena
and their meaning are continually being accomplished by social actors (Bryman&Bell 2007,
p. 23). This implies that social phenomenon and categories are not singularly produced
through social interaction but that they are in constant state of change (Bryman&Bell 2007, p.
23).
The basis of this study is founded on the method of social science and the theoretical
framework in social theory. The approach of the study will be deductive concerning the
relation to theory and knowledge. Research is performed with constructionist ontology
regarding the world literally as how humans know it. With the basis in the constructionist
ontology asserting that the only world that can be studied is the semiotic world of meanings
which lie in the signs and symbols that humans use to think and communicate (Potter, 2006
p.79). The research strategy is the general orientation to the conduct of business research. The
elements of both major research strategies, quantitative and qualitative, will be used in this
paper. Quantitative research strategy is characterised by applying deductive emphasis on the
relation between theory and research, whereas quantitative uses the norms of natural science
6
and positivism and views social reality as external, also known as objective reality.
Qualitative research emphasises the inductive approach to the relationship between theory
and research in where the emphasis is made on theories generation. Qualitative method
rejects the norms and practises of natural science and positivism in preference of the ways
that individuals interpret their social world. Qualitative research view social reality as
dynamic and constantly changing emergent property of individuals‟ creation (Bryman&Bell,
2007, p. 28).
2.2 Research strategy and Data collection
This paper is composed of the elements of both qualitative and quantitative research
strategies due to the specifics of chosen topic that comprises not only measurement
procedures to the selected area of the research but also uses words in the presentation of its
analyses. It implies not only analysis of “social world through an examination of the
interpretation of that world by its participants” (Bryman&Bell, 2007, p. 402) and considers
“the perspective of those being studied <...> (that) provides the point of orientation”
(Bryman&Bell, 2007, p. 425) but also “entails a deductive approach to the relationship
between theory and research, in which the accent is placed on the testing of theories”
(Bryman&Bell, 2007, p. 28). One of the features of qualitative research strategy employed in
this paper is the analysis of processes rather than static events and that small-scale aspects
rather than large-scale social trends are considered (Bryman&Bell, 2007, p. 428).
According to Bryman and Bell (2007, p. 107), the literature search relied on reading of
books, journals, articles and financial newspapers in the first instance. After getting a deeper
understanding on the research problem, several key concepts have been identified that helped
to define the boundaries of the chosen research area. The authors have taken into
consideration the four criteria for assessing the quality of documents suggested by Scott (as
cited in Bryman&Bell, 2007, p.555). The official documents used as the source of data are
authentic (the evidence is genuine and verified: only well-known databases accessible online,
main publishers of international research papers have been used. The authors used the papers
from: Oxford Journals (the division of Oxford University Press that publishes “over 230
academic and research journals covering a broad range of subject areas, two-thirds of which
are published in collaboration with learned societies and other international organizations”
(“About Us”, n.d.) and Journal of International Financial Markets, Institutions & Money,
Journal of Financial Economics available at ScienceDirect (“full-text scientific database
offering journal articles and book chapters from more than 2,500 peer-reviewed journals and
more than 11,000 books” (“About ScienceDirect”, n.d.). As a great deal of financial reporting
data on the historic performance of S&P 500 had been needed, the authors used online
database of Financial Times newspaper, which was a rich source of information. Another
important type of source of information is organisational documents, or to be more precise,
hedge funds‟ performance data volunteered by the firms themselves to independent data
provider and research houses or rating agencies as hedge fund management companies
normally do not publish their funds‟ data. It has been difficult to gain direct access to first-
hand data of hedge fund management companies that means the authors had to rely on
publicly available documents alone (Bryman&Bell, 2007, p. 566).
7
Systematic review with elements of narrative review has been adopted in this paper.
Systematic review has been most applicable since it is more evidence-based as it seeks to
understand the effects of a particular variable that have been found in previous research
(Bryman&Bell, 2007, p. 101). The authors have also followed the key stages indicated by
Tranfield and his colleagues (as cited in Bryman&Bell, 2007, p. 101). The first stage was to
get an assigned expert (supervisor) and set up regular meetings, then the review boundaries
were clarified and later the progress was monitored. The second stage was to conduct a
review which involved completing “a comprehensive, unbiased search” (Tranfield et al.,
2003, p. 215 as cited in Bryman&Bell, 2007, p.101) on a basis of key concepts that were put
together with a supervisor. After that, during the information search, a list of all relevant
articles and books which would form the research has been created. Once it had finished, the
analysis began; its aim was to gain an understanding of what research devoted to the subject
exists that includes meta-ethnography, one of the approaches to the systematic review of
qualitative studies. Tranfield et al. (as cited in Bryman and Bell, 2007, p. 101) believe that the
systematic review provides a more reliable foundation which the research is based upon since
it includes a more thorough understanding of what is already known about the subject. The
elements of narrative review approach used include the focus on “enriching human discourse
by generating understanding rather than by accumulating knowledge” (Bryman&Bell, 2007,
p. 105). Literature review carried out before the research acts as a means of getting an initial
impression of the topic that is intended to be understood during the actual research stage.
We study the monthly returns of two sample emerging markets hedge fund indices
constructed by two different data providers and two emerging markets equity benchmark
indices spanning the period January 2006 – December 2010.
The table demonstrating descriptive statistics and giving a general insight on indices‟
performance is shown as follows:
8
Barclay
2006 2007 2008 2009 2010 5 yr period
Mean 1.70% 1.81% -3.96% 3.11% 1.01% 0.73%
StDev 0.0277 0.0243 0.0544 0.0402 0.0289 0.0432
Kurtosis 1.7254 0.4235 0.6273 0.0427 1.1773 3.2459
Skewness -0.9514 -1.3685 -0.8156 0.6407 -0.6966 -1.1061
S&P/IFCI
2006 2007 2008 2009 2010 5 yr period
Mean 1.47% 1.82% -5.09% 5.41% 1.44% 1.01%
StDev 0.0477 0.0680 0.1023 0.0628 0.0483 0.0747
Kurtosis 2.6574 0.7695 1.6404 0.9671 1.1773 3.8136
Skewness -1.0553 -0.8650 -1.0187 1.1436 -1.2654 -1.1517
InvestHedge
2006 2007 2008 2009 2010 5 yr period
Mean 1.21% 1.22% -2.03% 1.06% 0.53% 0.40%
StDev 0.0168 0.0144 0.0303 0.0091 0.0108 0.0214
Kurtosis 0.1650 0.7446 -0.0345 1.5956 0.0819 3.8552
Skewness -0.4272 -1.0953 -0.4620 0.8396 -0.7224 -1.6263
MSCI
2006 2007 2008 2009 2010 5 yr period
Mean 1.19% 1.73% -5.19% 4.99% 1.65% 0.87%
StDev 0.0464 0.0676 0.1051 0.0798 0.0586 0.0791
Kurtosis 3.0192 0.6024 0.4352 -1.4321 -0.6108 1.8301
Skewness -1.2171 -0.5954 -0.5966 0.1618 -0.0410 -0.7565
Table 1 Descriptive stats for EMHF indices and emerging markets benchmarks
Only judging the numbers presented in this table, some preliminary general conclusions can
be drawn. On a five year basis, the mean values of both benchmark indices performance have
been greater than the hedge funds‟ (0.87% and 1.01% against 0.73% and 0.4%, respectively).
However, in 2008, benchmark indices fell more dramatically than the hedge fund indices that
suggests that during the financial downturn the latter were less sensitive to the market
fluctuations. The values also show that MSCI and S&P/IFCI have been more successful
performance-wise during and post-crisis period. Standard deviation estimations that show
historical volatility and acts as the standard measure of investment risk demonstrate that
historically, the benchmark indices have been more volatile than hedge funds (7% against
2%). Again, during the financial crisis, returns of MSCI and S&P/IFCI were more deviated
than hedge funds‟ returns. Also, in the last five years, benchmarks regularly show higher
standard deviation values than hedge funds. So, it might be implied that the benchmarks were
historically, out of accord with the generally accepted assumptions, riskier than the hedge
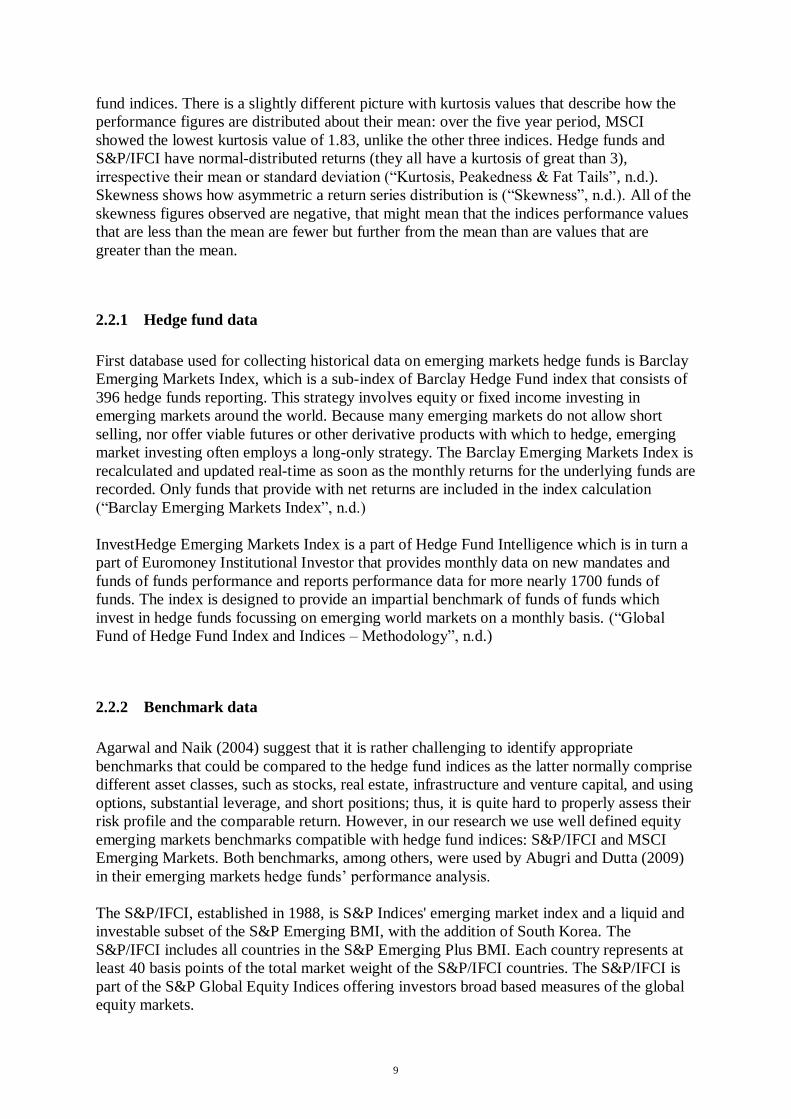
9
fund indices. There is a slightly different picture with kurtosis values that describe how the
performance figures are distributed about their mean: over the five year period, MSCI
showed the lowest kurtosis value of 1.83, unlike the other three indices. Hedge funds and
S&P/IFCI have normal-distributed returns (they all have a kurtosis of great than 3),
irrespective their mean or standard deviation (“Kurtosis, Peakedness & Fat Tails”, n.d.).
Skewness shows how asymmetric a return series distribution is (“Skewness”, n.d.). All of the
skewness figures observed are negative, that might mean that the indices performance values
that are less than the mean are fewer but further from the mean than are values that are
greater than the mean.
2.2.1 Hedge fund data
First database used for collecting historical data on emerging markets hedge funds is Barclay
Emerging Markets Index, which is a sub-index of Barclay Hedge Fund index that consists of
396 hedge funds reporting. This strategy involves equity or fixed income investing in
emerging markets around the world. Because many emerging markets do not allow short
selling, nor offer viable futures or other derivative products with which to hedge, emerging
market investing often employs a long-only strategy. The Barclay Emerging Markets Index is
recalculated and updated real-time as soon as the monthly returns for the underlying funds are
recorded. Only funds that provide with net returns are included in the index calculation
(“Barclay Emerging Markets Index”, n.d.)
InvestHedge Emerging Markets Index is a part of Hedge Fund Intelligence which is in turn a
part of Euromoney Institutional Investor that provides monthly data on new mandates and
funds of funds performance and reports performance data for more nearly 1700 funds of
funds. The index is designed to provide an impartial benchmark of funds of funds which
invest in hedge funds focussing on emerging world markets on a monthly basis. (“Global
Fund of Hedge Fund Index and Indices – Methodology”, n.d.)
2.2.2 Benchmark data
Agarwal and Naik (2004) suggest that it is rather challenging to identify appropriate
benchmarks that could be compared to the hedge fund indices as the latter normally comprise
different asset classes, such as stocks, real estate, infrastructure and venture capital, and using
options, substantial leverage, and short positions; thus, it is quite hard to properly assess their
risk profile and the comparable return. However, in our research we use well defined equity
emerging markets benchmarks compatible with hedge fund indices: S&P/IFCI and MSCI
Emerging Markets. Both benchmarks, among others, were used by Abugri and Dutta (2009)
in their emerging markets hedge funds‟ performance analysis.
The S&P/IFCI, established in 1988, is S&P Indices' emerging market index and a liquid and
investable subset of the S&P Emerging BMI, with the addition of South Korea. The
S&P/IFCI includes all countries in the S&P Emerging Plus BMI. Each country represents at
least 40 basis points of the total market weight of the S&P/IFCI countries. The S&P/IFCI is
part of the S&P Global Equity Indices offering investors broad based measures of the global
equity markets.
10
A company is eligible once it meets the following criteria: a stock must have a float-adjusted
market capitalisation of USD 200 mln or greater; a stock‟s weight is determined by its float-
adjusted market capitalisation; each company must have an annual dollar value traded of at
least USD 100 mln; a stock‟s domicile is determined by a number of criteria including the
headquarters of the company, its registration or incorporation, primary stock listing,
geographic source of revenues, location of fixed assets, operations, and the residence of
senior officers (“S&P/IFCI Factsheet”, n.d.)
The MSCI Emerging Markets Index is a free float-adjusted market capitalisation index that is
designed to measure equity market performance in the global emerging markets. MSCI
Emerging Markets Index covers Americas (Brazil, Chile, Colombia, Mexico, Peru), Europe,
Middle East and Africa (Czech Republic, Egypt, Hungary, Morocco, Poland, Russia, South
Africa, Turkey), Asia (China, India, Indonesia, Korea, Malaysia, Philippines, Taiwan,
Thailand)
As S&P/IFCI, MSCI launched Emerging Markets Index in 1988. Since then the MSCI
Emerging Markets (EM) Indices have evolved considerably over time, moving from about
1% of the global equity opportunity set in 1988 to 14% in 2010.1
Today the MSCI Emerging Markets Indices cover over 2,600 securities in 21 markets that
are currently classified as EM countries. The EM equity universe spans large, mid and small
cap securities and can be segmented across styles and sectors (“MSCI Emerging Markets”,
n.d.).
11
3 Theoretical framework
In this chapter, important concepts are explained and major sources dedicated to emerging
markets hedge funds performance are reviewed.
3.1 Hedge funds and emerging markets as their strategy
According to Brooks and Kat (2001), investment strategies used by hedge funds and those
used by mutual funds tend to be quite different. Besides, every hedge fund manager
essentially follows their own strategy, which means that hedge funds are very heterogeneous.
Nonetheless, there are three main types to be distinguished. Global funds focus on economic
changes on across the globe and at times use leverage and derivatives. Quantum Fund, run by
George Soros, is an example of such hedge funds. Event-Driven funds deal with companies
in special situations, such as corporate restructuring or a merger. Market Neutral funds
represent the largest group. These funds simultaneously use long and short positions, where
some funds use fundamental analysis to make a decision on assets purchase and others use
statistical analysis and complex mathematical models.
In addition, there is a number of subgroups within these three groups
Global: Macro funds look to gain profits from major economic changes, usually significant
currency and interest rate shifts and make extensive use of leverage and derivatives.
Global: International funds select stocks in favoured markets around the world and make less
use of derivatives than macro funds.
Global: Emerging Markets funds focus on emerging markets economies and tend to be long
because in many emerging markets short selling is not allowed and the futures/options market
is not available.
Event Driven: Distressed Securities funds trade the securities of companies (such as senior
secured debt and common stock) going through corporate restructuring, merger and/or
bankruptcy.
Event Driven: Risk Arbitrage funds trade the securities of companies involved in a merger or
acquisition, typically buying the stocks of the company being acquired before the actual
acquisition and gaining profit after its acquirer purchases the stocks.
Market Neutral: Equity funds take simultaneously long and short matched equity positions -
portfolios are designed to have zero market risk. Leverage is often applied to enhance returns.
Market Neutral: Long/Short Equity funds invest on long and short side of the equity market
and unlike equity market neutral funds, the portfolio may not always have zero market risk.
Market Neutral: Convertible arbitrage funds buy undervalued convertible securities while
hedging risks.
Market Neutral: Fixed Income funds use pricing irregularities for interest rate securities and
their derivatives in the global market (Brooks&Kat, 1997).
A slightly different approach to hedge fund strategies is presented by Fung and Hsieh‟s
research (1997), where they differentiated two dimensions of style: location choice and
trading strategy. The actual returns are consequently the products of both location choice and
trading strategy, whereas mutual fund managers put an emphasis on where to invest. Location
choice refers to the asset classes used by the managers to generate returns. Trading strategy
refers to the direction (long/short) and quantity (leverage).
12
After studying the documents provided by hedge fund managers, Fung and Hsieh (1997)
came up with five factors that describe trading strategies: systems/opportunistic,
global/macro, value, systems/trend following, and distressed. Systems/opportunistic
strategies refer to technically driven traders who bet occasionally on market events, whilst
system/trade following refer to traders using technical trading rules. Global/macro strategies
refer to managers trading in the world‟s most liquid markets, betting on macroeconomic
events such as changes in interest rate and currency devaluations and relying mostly on
economic fundamentals. Value refers to traders that buy securities of companies they
perceive as undervalued. Distressed strategies refer to managers who invest in companies
recently emerged from bankruptcy or corporate restructuring.
According to Abugri and Dutta (2009), hedge funds usually use short selling, leverage,
derivatives in order to increase returns or reduce systematic risk as well as move across
various asset categories to time the market. Also, dynamic strategies employed by emerging
markets hedge funds are limited either because of trading restrictions or due to the less
developed nature of markets they operate in. Emerging markets are also often highly illiquid
that requires a fund manager to use long strategies.
Finally, Strömqvist (2008) defines emerging markets hedge funds as funds making
investments, usually long, in securities of companies or the sovereign debt of emerging (less
mature) economies, which tend to have higher inflation and volatile growth. Short selling is
not permitted in many emerging markets, and, therefore, effective hedging is often not
available. Depending on market conditions and manager‟s perspectives, global emerging
market funds shift their weightings among these regions. In addition, expected volatility is
very high and some managers only invest in individual regions.
3.2 Emerging Markets Hedge Funds performance analysis
3.2.1 Correlation/Covariance
Abugri and Dutta (2009) start the analysis by creating a correlation matrix of emerging
markets hedge funds returns and the returns for the different benchmark indices. They
observed correlations between hedge fund indices and different benchmark asset classes and
came to the conclusion that these correlations are in a significant contrast to the traditional
hedge funds results that previous researchers such as Liang (1999); they suggest that
emerging markets hedge funds generally behave like mutual funds. However, they also found
out that a significant change in emerging markets hedge funds sector occurred: they
registered considerable growth over the last years. Samiev and Yaqian (2010) also started
their analysis with covariance and correlation coefficient calculations as it is important to
understand the direction and strength of two variables by measuring whether they are related
to each other linearly or non-linearly. In addition, Elton and Gruber (1995) found out that
although one might expect that emerging markets would weakly correlate with developed
countries, the actual figures of estimated correlation show that emerging markets are highly
correlated with major, implying that there is a strong interdependence link between them:
what happens in developed countries ultimately affects emerging markets.
13
3.2.2 Autocorrelation
Brooks and Kat (2001) have taken into account calculations of autocorrelation. They came to
a conclusion that there is very little evidence of statistically significant autocorrelation for the
stock and bond market indices. They suggest that autocorrelation coefficients not only
insignificant in absolute value, they are also mainly negative (except for those of the bond
index). On the contrary, many hedge fund indices exhibit highly significant positive
autocorrelation. The observed positive autocorrelation is quite a unique property and seems
inconsistent with the notion of efficient markets. One possible explanation is that the nature
of hedge funds‟ strategies leads their returns to be inherently related to those of preceding
months. As this implies lags in the major systematic risk factors, however, this is not the most
plausible explanation. An alternative explanation lies in the difficulty for hedge fund
managers to obtain up-to-date valuations of their positions in illiquid and complex over-the-
counter securities. When confronted with this problem, hedge funds either use the last
reported transaction price or an estimate of the current market price, which may easily create
lags in the evolution of their net asset value.” (Brooks&Kat, 2001, p. 9). Getmansky et al.
(2004) find that although certain empirical properties, such as Sharpe ratios and other
standard methods of assessing funds‟ risks and rewards, that are often considered to be
misleading, could be traced to a single common source of significant serial correlation in
their returns as they have potentially significant implications for assessing the risks and
expected returns of hedge fund investments.
Getmansky et al. (2004) also suggest that autocorrelation might often be mistakenly
associated with market inefficiencies, implying the presence of predictability in returns. This
might contradict the popular assumption that the hedge fund industry attracts the best and the
savviest fund managers in the whole financial services sector. In particular, if a fund
manager‟s returns can be predicted, the implication is that the manager‟s investment strategy
is non-optimal. If the fund‟s returns next month can be forecasted as positive, the fund
manager is most likely to increase positions this month to take advantage of this forecast, and
vice versa for the opposite forecast. By taking advantage of such predictability, the fund
manager will sooner or later eliminate it. “Given the outsize financial incentives of hedge
fund managers to produce profitable investment strategies, the existence of significant
unexploited sources of predictability seems unlikely.” (Getmansky et al., 2004, p. 530). The
authors argue that in most cases, autocorrelation in hedge fund returns is not due to profit
opportunities that have not been taken advantage of, but is more likely the result of illiquid
securities that might be contained in the fund. For example, these illiquid securities can
include securities that are not actively traded or for which market prices are not always
immediately available. In such cases, the reported returns of funds containing illiquid
securities will appear to be smoother than true economic returns (returns that reflect all
available market information about those securities) and this, in turn, will bear a decreasing
bias on the estimated return variance and yield positive return aurocorrelation.
3.2.3 Alpha
To analyse the performance of emerging markets hedge funds, another contributor,
Strömqvist (2008), took into consideration alpha values. The primary goal for hedge fund
strategy is to deliver a risk adjusted return, also defined as return uncorrelated with
systematic risk factors. Prior research data clearly depict the reality that emerging markets
hedge funds on average have not generated any statistical alphas after fees, this specific
14
during the period of January 1994 - December 2004 (Strömqvist, 2008, pp. 15-16). Based on
this data, Strömqvist (2008) concludes that emerging markets hedge funds do not create any
extra value above the factual risk factor even though returns can be reached by a more
economical passive oriented approach. In comparison with the results from factorial
regression of non-emerging markets hedge funds there actually have been positive and
significant α produced during the whole period of 1994-2004. Both net-of-fee returns and
estimated pre-fee returns are used in the analysis of finding alpha for emerging markets hedge
funds. It is only during the period of April 2000 - December 2004, where estimated pre-fee
returns are used in the analysis, significant and positive alpha could be found for emerging
markets hedge funds. Significant and positive alpha are reoccurring when changing MSCI
World Index with S&P/IFCI and the MSCI Emerging Market in the period of April 2000-
December 2004; the same is valid for the emerging market model (Strömqvist, 2008, pp 38-
39).
Bianchi, Drew, Stanley (2008) in line with Strömqvist (2008) provide the conclusion that
hedge funds in general have produced a lower rate of significant and positive alpha. A small
portion of 5-7% of 7355 hedge funds over the 1994-2006 sample period earned statistically
significant alpha, regardless of the hedge fund strategy. Eling and Faust (2010) provide
empirical findings that the alpha during the period of 1996-2008 was low and declining
within the period of 1998-2000, after 2000 alpha increased to a more stable alpha value.
Except in the middle of the period 2003-2008 the value decreases slightly. These empirical
findings correlate with Strömqvist (2008) who also cannot find any regression i alpha during
the last years of her research during the period of 1994-2004. Evidently, the performance of
Emerging markets hedge funds concerning cumulative risk adjusted return has greatly
underperformed other funds during the period of 1994-2004.
Strömqvist (2008) also analysed aggregated capital flow determinants, where the factors
affecting capital in- and outflows in emerging markets hedge funds are investigated at an
aggregated level. There are two factors: first factor is the own strategy return and the second
how emerging markets attracts international investors. The inflows into funds are positively
related to the past performance, for hedge funds the relation is positive and concave, although
hedge funds performance does not grow as much as the rest of the fund market. The benefits
of investing in emerging markets hedge funds increase during time periods when the U.S.
monetary policy is restrictive.
Concluding Strömqvist‟s (2008) findings, it may be suggested that hedge fund do not give
any risk adjusted return then the high hedge fund fees are only redundant to the investor. The
Emerging markets hedge funds can also be placed in portfolio due to the low correlation that
Emerging markets hedge funds exhibit and other hedge funds. Though in Strömqvist (2008)
gives the result in four different allocations models, which all state that emerging markets
hedge funds are still underperforming. Strömqvist (2008) also suggests that they do not
become more valuable when invested in a portfolio: this is valid to both allocation model and
over time.
3.2.4 Beta
To measure the volatility or market risk (unforeseeable variations in the prices of basic assets,
stocks, bonds, etc.) of a stock or an index, researchers usually estimate beta values (Amenc,
Martellini, Vaissié, 2002). They suggest that alternative betas often correspond to risk
15
premiums that are normally arbitrated by the players present in the market and, as a result,
correspond to market prices (volatility). However, it is well known that risk measures such as
the beta or the Sharpe ratio do not allow for adequate evaluation of dynamic and non-linear
risks. Ding, Shawky, Tian (2009) found out that out of their 20 beta estimates for different
strategies, such as Conservative and Aggressive, employed by hedge funds, 17 are
statistically significant. More importantly however, they find that for the Aggressive Manger
Model, the beta coefficient is positive in 8 of the 10 cases, while for the Conservative
Manager Model the beta coefficient is negative in 7 out of the 10 cases. These conclusions
might imply that liquidity shocks may increase risk for conservative managers and enhance
performance for aggressive managers.
Standard and Poor‟s Senior Director Jacqueline Meziani (2007) defines three characteristics
of beta when estimating volatility of equity long/short hedge funds: high, low and negative.
High beta funds generally have high net market exposure and are often concentrated, whilst
moderate beta funds are likely to take more short positions that would decrease net market
exposure. Low beta funds have insignificant net market exposure or high beta variability and
ought to be analysed to ensure that they are not better classified as Equity Market Neutral
fund. Funds with negative beta indicate that they have investment approaches and strategies
that can result in a return stream that runs in the contrast to traditional equity market indices.
3.2.5 CAPM
Eling and Faust (2010) use CAPM based modules like Jensen‟s alpha, as one of their models
of estimating the performance of hedge funds and Mutual funds in emerging markets. The
research is based on a sample of 243 hedge funds and 629 mutual funds and the benchmarks
are indices apprehended from MSCI. CAPM estimates the performance of emerging markets
hedge funds in their study incorporating the time period of 1996-2008; this period is divided
into four sub-periods of January 1996-September 1998, October 1998-March 2000, April
2000-December 2006 and January 2007-August 2008. CAPM estimates the expected return
on investment by the estimated systematic risk taken, although it is not one of the
econometric tools of extracting alpha.
This is not considered in Eling and Faust (2010) where only performance of alpha in terms of
CAPM is analysed. Five additional models of estimating the performance of Emerging
markets hedge funds are practised in the study of Fama and French, Carhart, Fung and Hsieh
(1997), Ext. Fung and Hsieh (2004) and the EM Model (Eling and Faust, 2010, p. 2001).The
equity market proxy, the market portfolio in the CAPM is the value-weighted portfolio of all
NYSE, Amex, and Nasdaq stocks used in Fama and French (1993) and Carhart (1997), the
risk-free interest rate is the one-month US treasury bill rate (Eling and Faust, 2010, p. 1996).
Using the CAPM, 30.45% of all hedge funds outperform the benchmark, in the consecutive
period of January 1996 to August 2008 (Eling and Faust, 2010, p. 2001).
This model of CAPM is a single factor model that has lately been developed to a
multifactorial framework in order to improve the portion of variance explained by the
regression. Some authors, as Eling and Faust (2010) and Capocci and Hübner (2002) take
Jensen‟s alpha as an estimation measure of out- or underperformance relative to the market
proxy used. This is possibly due to the fact that the Jensen‟s alpha is rooted in the CAPM
model. In equilibrium of the CAPM, all assets with the same Beta will offset the same
expected return, any positive deviation from that is an indication of superior performance
16
(Amin&Kat, 2003, p. 254). If the average fund return is significantly higher than expected,
given the fund beta and the average benchmark return, there is superior performance.
After analysing the alpha performance of Eling and Faust (2010) it might be suggested that
the emerging markets hedge funds on individual basis have outperformed the given
benchmark index. Eling and Faust (2010) explain the outperforming hedge funds by active
management of the hedge funds. Overall performance of the period January 1996 – August
2008 estimating performance using CAPM gives an alpha of 0.64 valid at a significance level
of 10%.
During the diversified periods different alpha is produced. The first period January 1996-
September 1998 produces an alpha of -1.27% indicating an underperformance comparing to
the market, the second period of October 1998-March 2000 performing slightly better
(2.14%) but not yet overperforming, the third period of April 2000-December 2006 a lower
performance alpha of estimated 1.07%; whereas the final period indicates the lowest positive
alpha performance of 0.18% (Eling&Faust, 2010, p. 2002).
The first and the fourth sub-periods are not significant but the second sub-period is significant
at 5% level and third period significant at 1% (Eling&Faust, 2010, p. 2002). The values will
be demonstrated in the appendix.
3.2.6 Sharpe Ratio
Abugri and Dutta (2009) conduct the Sharpe ratio as estimation for performance of risk-
adjusted returns for hedge funds in their research article when finding out if the emerging
markets hedge funds perform like regular hedge funds, and if the emerging markets hedge
funds in their research have outperformed the benchmark indices. The four emerging markets
hedge funds‟ data used in their study was gathered from Hedge Funds Research, Inc.:
namely, HFR Asia Index, HFR Eastern Europe & CIS Index, HFR Latin America Index and
HFR Emerging Market Total Return Index. The following benchmark indices have also been
used in that study: S&P/IFCI Emerging Markets Composite Index and MSCI Emerging
Market Total Return Index.
The index performance test of benchmarks is divided in three time periods of January 1997-
August 2008, January 1997-December 2006 and finally January 1997-August 2008.
There have been controversies in scientific literature whether the Sharp ratio is appropriate to
estimate performance of hedge funds. The reason is that the returns of hedge funds are not
normally distributed that makes the Sharpe ratio only appropriate when the return distribution
is considered as normal.
Amenc et al. (2002) also believe that the use of the Sharpe ratio seems to be risk bearing, let
alone its scientific character, which is often criticised. It may induce managers to undertake
"short volatility" strategies based on the sale of "out of the money" put and/or call options.
Such strategies allow the volatility risk to be limited, simultaneously increasing its mean by
cashing in premiums. Of course, the downside of this strategy is the very significant increase
in the risks of extreme loss, which only appear in moments greater than 2 (skewness and
kurtosis) and which are therefore not taken into consideration in the Sharpe ratio.
17
Dybvig (1988a, 1988b), Leland (1999) and Lo (2001) (as cited in Amenc et al., 2002) argue
that risk measures such as Sharpe ratio do not allow to adequately evaluate dynamic and non-
linear risks. Nevertheless, in spite of this inappropriateness, the Sharpe ratio is still the most
widely used measuring tool the risk-adjusted return of alternative investments evaluation. In a
study carried out by Edhec (2002, as cited in Amenc et al., 2002), it is revealed as the
measure that is the most frequently used by distributors of hedge funds (notably funds of
funds) to promote the superiority of alternative class returns.
Even though the model has been criticised it is bean regarded as a valid model of
performance by reference to Eling and Schumacher‟s research from 2007. Eling and
Schumacher (2007) find that even though hedge funds deviate from hedge funds‟ normal
distribution of return, in comparison with other performance measures (like Treynor‟s ratio
and alpha) the yield is the same rank ordering across hedge funds. By the fact that hedge fund
returns are not normally distributed the values of mean and variance describe the return
distribution good enough. Eling and Schumacher (2007) even argue that the Sharpe ratio may
be “superior to other measures”.
Abugri and Dutta (2007) support their reasoning of choosing the Sharp ratio as an
econometric model of emerging markets hedge funds performance by referring to Modigliani
and Modigliani (1997) and Lo (2002) who documented arguments that the Sharpe ratio is the
best known and understood performance measure. It is also recognised in literature that the
Sharpe ratios are hard to interpret when the excess return is negative, e.g. during bear
markets. Negative excess return gives negative Sharpe ratios, turning rank funds with lower
returns and higher standard deviations above the ones with higher returns and lower standard
deviations.
In relation to negative Sharpe ratios making the interpretation counterintuitive and illogical in
matters of risk return relation, the Sharpe ratio is rejected during bear periods in Israelsen
(2003, 2005) and replaced by the modified Sharpe ratio. The modified Sharpe ratio is used in
Abugri and Dutta (2009) as estimation of emerging markets hedge funds performance and the
benchmarks indices.
Abugri and Dutta (2009) conclude that the emerging markets hedge funds in their study do
not consistently outperform the benchmarks of S&P/IFCI Emerging Markets Composite
Index and MSCI Emerging Market Total Return Index. Although in the terms of
performance, it is suggested that on risk adjusted basis that some emerging markets hedge
funds indices outperform the benchmarks. But as mentioned earlier, there are no
performances abundant enough to conclude that the emerging markets hedge funds, in
general, consistently outperforming the benchmarks. The strongest Sharpe ratios of emerging
markets hedge funds from the index of HFR Emerging Market Total Return Index is 0.0011
in the period of January 1997-August 2008 and the benchmark indices of S&P/IFCI
Emerging Market Composite Index −0.0018 and MSCI Emerging Market Total Return Index
-0.0019. In the other periods the Sharpe ratios indicated a better value for the emerging
markets hedge funds than for the benchmarks indices.
In January 1997-December 2006, HFR Emerging Market Total Return Index showed the
value of 0.0010; S&P/IFCI Emerging Market Composite Index -0.0018; MSCI Emerging
Market Total Return Index -0.0018. In the final period of January 2007-August 2008 HFR
Emerging Market Total Return Index had the ratio of 0.001 and S&P/IFCI Emerging Market
Composite Index -0.002 and MSCI Emerging Market Total Return Index -0.0023. It
happened within the period when emerging markets hedge funds index was outperformed by
18
the benchmark, e.g. the HFR Emerging Market Total Return Index showed the Sharpe ratio
of 0.001 and Barclays-Lehman Emerging Market World Bond Index the ratio of -0.0004. A
table of the results from the research concerning performance of emerging markets hedge
funds and emerging markets benchmark indices will be presented in the appendix.
In Ackerman et al. (1999) it is concluded that the ability of hedge funds to outperform the
market clearly depends on the market index and the hedge fund category under consideration.
This is something that Abugri and Dutta (2009) take in regard by choosing many benchmarks
indices to each emerging markets hedge funds category.
3.2.7 Treynor’s Ratio
The performance analysis is continued with calculation and interpretation of Treynor‟s Ratio.
Eling and Schumacher (2007) estimate Treynor‟s ratio in their study to analyse performance
of hedge funds. According to the authors, the Treynor‟s ratio estimates adjusted return
without the leveraging the fund return which Jensen‟s alpha been criticised for. In their
research they evaluate the tools of estimating performance i.e. Treynor‟s and Jensen‟s alpha
against the performance of the Sharpe ratio. The Treynor‟s ratio considers the excess return
of the fund in relation of the beta factor (Eling&Schuemacher, 2007, p. 2637).
So, considering the information from analyses earlier, it might be implied that emerging
markets hedge funds have not been as successful performance-wise; both in absolute and
relative terms and that they have not generally added any significant value when included in a
portfolio. Due to the underperformance of emerging markets hedge funds during the period
1994-2004, investors have relocated their funds from this strategy. Assets under management
(AUM) have increased in the beginning of the period (Strömqvist, 2008, p. 19). There was a
recession in AUM during the Russian and Asian financial crises as well as the fall of LTCM.
The impression thereof is that emerging markets hedge funds only temporarily decrease
during the years of financial downturns. During the conducted sample period there has been a
significant cash inflow into the hedge funds, though the assets under management in
emerging markets hedge funds related to the AUM in the industry declined from 10% in 1994
to only 3% in 2004. This has not influenced the fact that assets under management in the
whole fund industry have increased. Emerging markets hedge funds increased exponentially
in Strömqvist (2008) study until it peaked in 1997 at 200 funds. The number shrank in the
end of the period, though. Subsequently, emerging markets hedge funds became larger; the
net flows became less volatile in the end of the period, even giving the industry a net capital
flow around 5% within the latest four years of the studied period.
3.3 Financial Tools of Performance
Following financial tools and methods have been used to evaluate performance of Standard
Emerging Markets Equity benchmark and InvestHedge Emerging Markets and Barclay
Emerging Markets:

19
Covariance and Correlation
Covariance indicates how two variables are related; positive covariance means the variables
are positively related, whilst a negative covariance means the variables are inversely related.
The formula for calculating covariance is shown below.
, where
x = the independent variable
y = the dependent variable
n = number of data points in the sample
= the mean of the independent variable x
= the mean of the dependent variable y
Correlation analysis usually supplements covariance as the latter only determines whether
units were increasing or decreasing, it does not measure the degree to which the variables
moved together because covariance does not use one standard unit of measurement.
Correlation determines how two variables are related: in addition to defining whether
variables are positively or inversely related, correlation also shows the degree to which the
variables tend to move together. Correlation can be calculated using the following formula
(“Statistical Sampling and Regression: Covariance and Correlation”, n.d.):
r(x,y) = correlation of the variables x and y
COV(x, y) = covariance of the variables x and y
sx = sample standard deviation of the random variable x
sy = sample standard deviation of the random variable y
The correlation coefficient always takes a value between -1 and 1, with 1 or -1 indicating
perfect correlation (all points would lie along a straight line in this case). A positive
correlation indicates a positive association between the variables (increasing values in one
variable correspond to increasing values in the other variable), while a negative correlation
indicates a negative association between the variables (increasing values is one variable
correspond to decreasing values in the other variable). A correlation value close to 0 indicates
no association between the variables. (“Correlation”, n.d.)
Abugri and Dutta (2009) in their correlation estimations also used a p-value approach to
hypothesis testing, because different scientists use different levels of significance when
examining data. They calculated p-values as the latter provide a convenient basis for drawing
conclusions in hypothesis-testing applications. The p-value measures how possible the
20
sample results are, assuming the null hypothesis is true; the smaller the p-value, the less
possible the sample results (“p-value”, 2011).
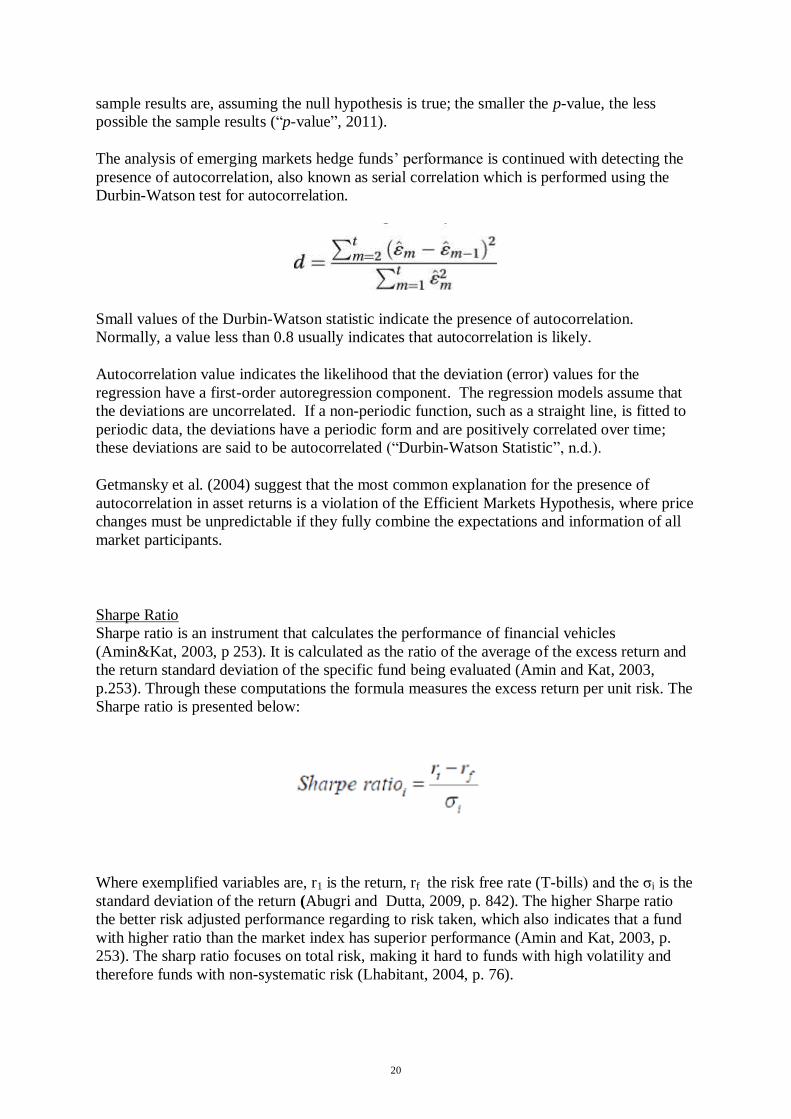
The analysis of emerging markets hedge funds‟ performance is continued with detecting the
presence of autocorrelation, also known as serial correlation which is performed using the
Durbin-Watson test for autocorrelation.
Small values of the Durbin-Watson statistic indicate the presence of autocorrelation.
Normally, a value less than 0.8 usually indicates that autocorrelation is likely.
Autocorrelation value indicates the likelihood that the deviation (error) values for the
regression have a first-order autoregression component. The regression models assume that
the deviations are uncorrelated. If a non-periodic function, such as a straight line, is fitted to
periodic data, the deviations have a periodic form and are positively correlated over time;
these deviations are said to be autocorrelated (“Durbin-Watson Statistic”, n.d.).
Getmansky et al. (2004) suggest that the most common explanation for the presence of
autocorrelation in asset returns is a violation of the Efficient Markets Hypothesis, where price
changes must be unpredictable if they fully combine the expectations and information of all
market participants.
Sharpe Ratio
Sharpe ratio is an instrument that calculates the performance of financial vehicles
(Amin&Kat, 2003, p 253). It is calculated as the ratio of the average of the excess return and
the return standard deviation of the specific fund being evaluated (Amin and Kat, 2003,
p.253). Through these computations the formula measures the excess return per unit risk. The
Sharpe ratio is presented below:
Where exemplified variables are, r1 is the return, rf the risk free rate (T-bills) and the σi is the
standard deviation of the return (Abugri and Dutta, 2009, p. 842). The higher Sharpe ratio
the better risk adjusted performance regarding to risk taken, which also indicates that a fund
with higher ratio than the market index has superior performance (Amin and Kat, 2003, p.
253). The sharp ratio focuses on total risk, making it hard to funds with high volatility and
therefore funds with non-systematic risk (Lhabitant, 2004, p. 76).
21
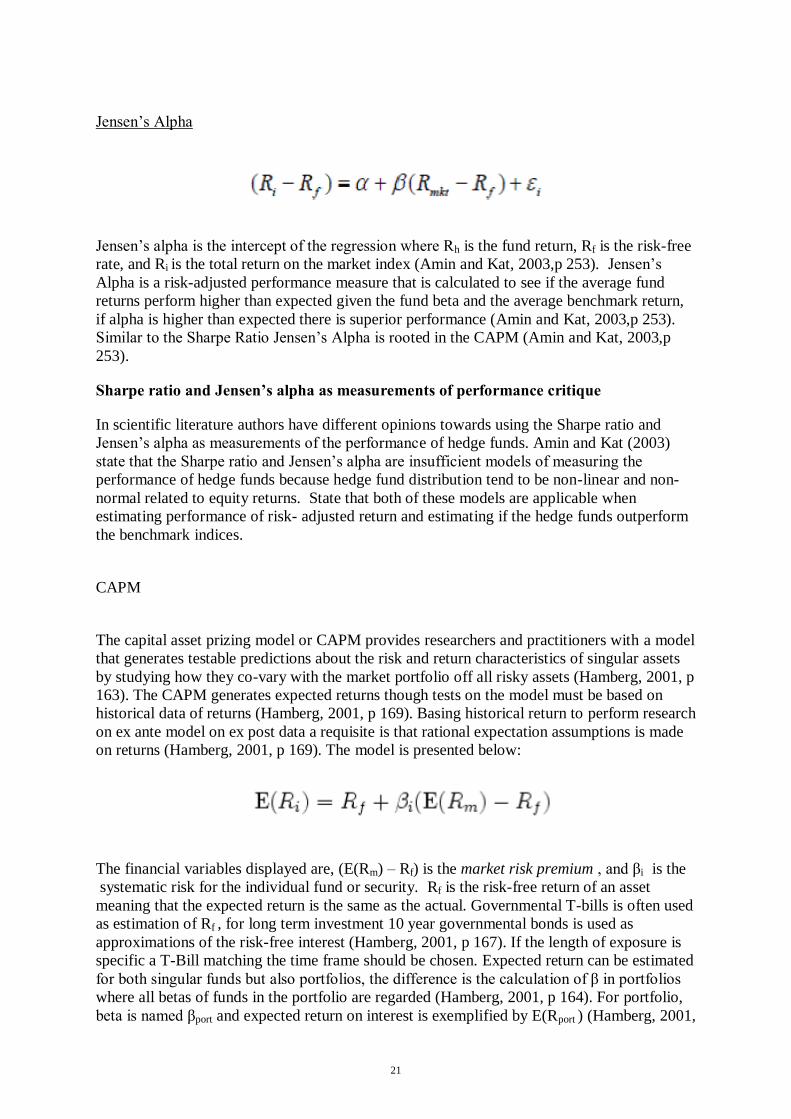
Jensen‟s Alpha
Jensen‟s alpha is the intercept of the regression where Rh is the fund return, Rf is the risk-free
rate, and Ri is the total return on the market index (Amin and Kat, 2003,p 253). Jensen‟s
Alpha is a risk-adjusted performance measure that is calculated to see if the average fund
returns perform higher than expected given the fund beta and the average benchmark return,
if alpha is higher than expected there is superior performance (Amin and Kat, 2003,p 253).
Similar to the Sharpe Ratio Jensen‟s Alpha is rooted in the CAPM (Amin and Kat, 2003,p
253).
Sharpe ratio and Jensen’s alpha as measurements of performance critique
In scientific literature authors have different opinions towards using the Sharpe ratio and
Jensen‟s alpha as measurements of the performance of hedge funds. Amin and Kat (2003)
state that the Sharpe ratio and Jensen‟s alpha are insufficient models of measuring the
performance of hedge funds because hedge fund distribution tend to be non-linear and non-
normal related to equity returns. State that both of these models are applicable when
estimating performance of risk- adjusted return and estimating if the hedge funds outperform
the benchmark indices.
CAPM
The capital asset prizing model or CAPM provides researchers and practitioners with a model
that generates testable predictions about the risk and return characteristics of singular assets
by studying how they co-vary with the market portfolio off all risky assets (Hamberg, 2001, p
163). The CAPM generates expected returns though tests on the model must be based on
historical data of returns (Hamberg, 2001, p 169). Basing historical return to perform research
on ex ante model on ex post data a requisite is that rational expectation assumptions is made
on returns (Hamberg, 2001, p 169). The model is presented below:
The financial variables displayed are, (E(Rm) – Rf) is the market risk premium , and βi is the
systematic risk for the individual fund or security. Rf is the risk-free return of an asset
meaning that the expected return is the same as the actual. Governmental T-bills is often used
as estimation of Rf , for long term investment 10 year governmental bonds is used as
approximations of the risk-free interest (Hamberg, 2001, p 167). If the length of exposure is
specific a T-Bill matching the time frame should be chosen. Expected return can be estimated
for both singular funds but also portfolios, the difference is the calculation of β in portfolios
where all betas of funds in the portfolio are regarded (Hamberg, 2001, p 164). For portfolio,
beta is named βport and expected return on interest is exemplified by E(Rport ) (Hamberg, 2001,
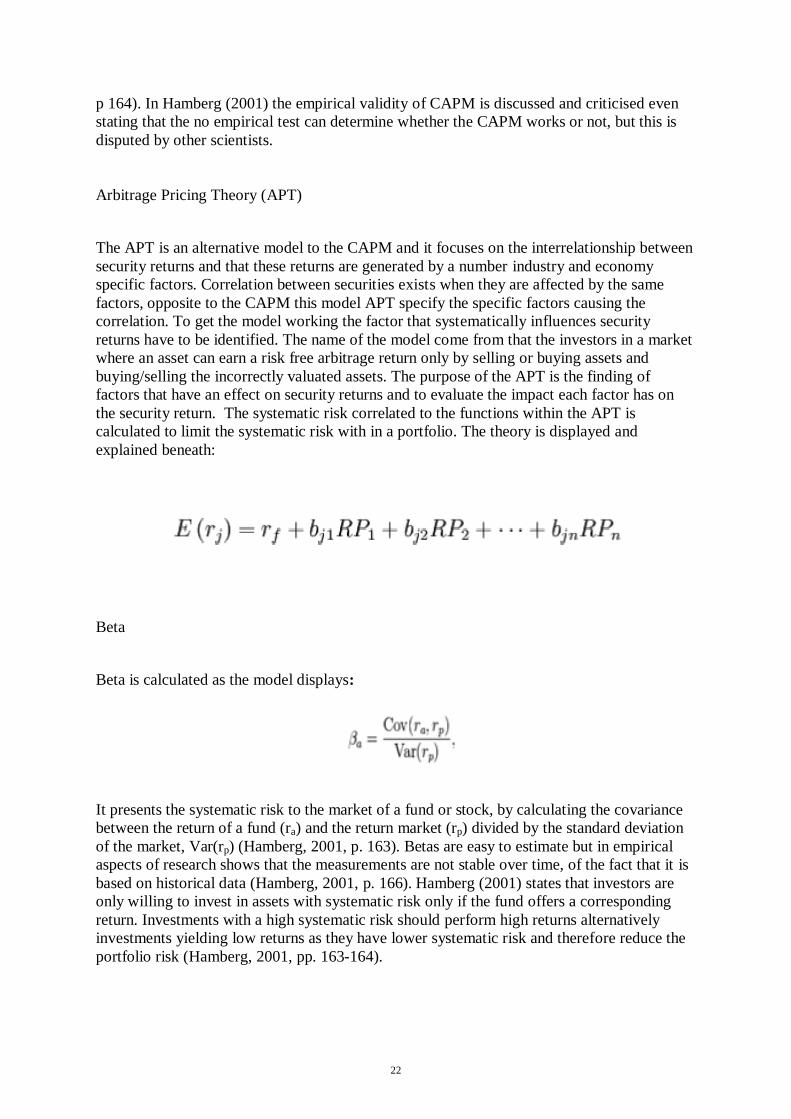
22
p 164). In Hamberg (2001) the empirical validity of CAPM is discussed and criticised even
stating that the no empirical test can determine whether the CAPM works or not, but this is
disputed by other scientists.
Arbitrage Pricing Theory (APT)
The APT is an alternative model to the CAPM and it focuses on the interrelationship between
security returns and that these returns are generated by a number industry and economy
specific factors. Correlation between securities exists when they are affected by the same
factors, opposite to the CAPM this model APT specify the specific factors causing the
correlation. To get the model working the factor that systematically influences security
returns have to be identified. The name of the model come from that the investors in a market
where an asset can earn a risk free arbitrage return only by selling or buying assets and
buying/selling the incorrectly valuated assets. The purpose of the APT is the finding of
factors that have an effect on security returns and to evaluate the impact each factor has on
the security return. The systematic risk correlated to the functions within the APT is
calculated to limit the systematic risk with in a portfolio. The theory is displayed and
explained beneath:
Beta
Beta is calculated as the model displays:
It presents the systematic risk to the market of a fund or stock, by calculating the covariance
between the return of a fund (ra) and the return market (rp) divided by the standard deviation
of the market, Var(rp) (Hamberg, 2001, p. 163). Betas are easy to estimate but in empirical
aspects of research shows that the measurements are not stable over time, of the fact that it is
based on historical data (Hamberg, 2001, p. 166). Hamberg (2001) states that investors are
only willing to invest in assets with systematic risk only if the fund offers a corresponding
return. Investments with a high systematic risk should perform high returns alternatively
investments yielding low returns as they have lower systematic risk and therefore reduce the
portfolio risk (Hamberg, 2001, pp. 163-164).
23
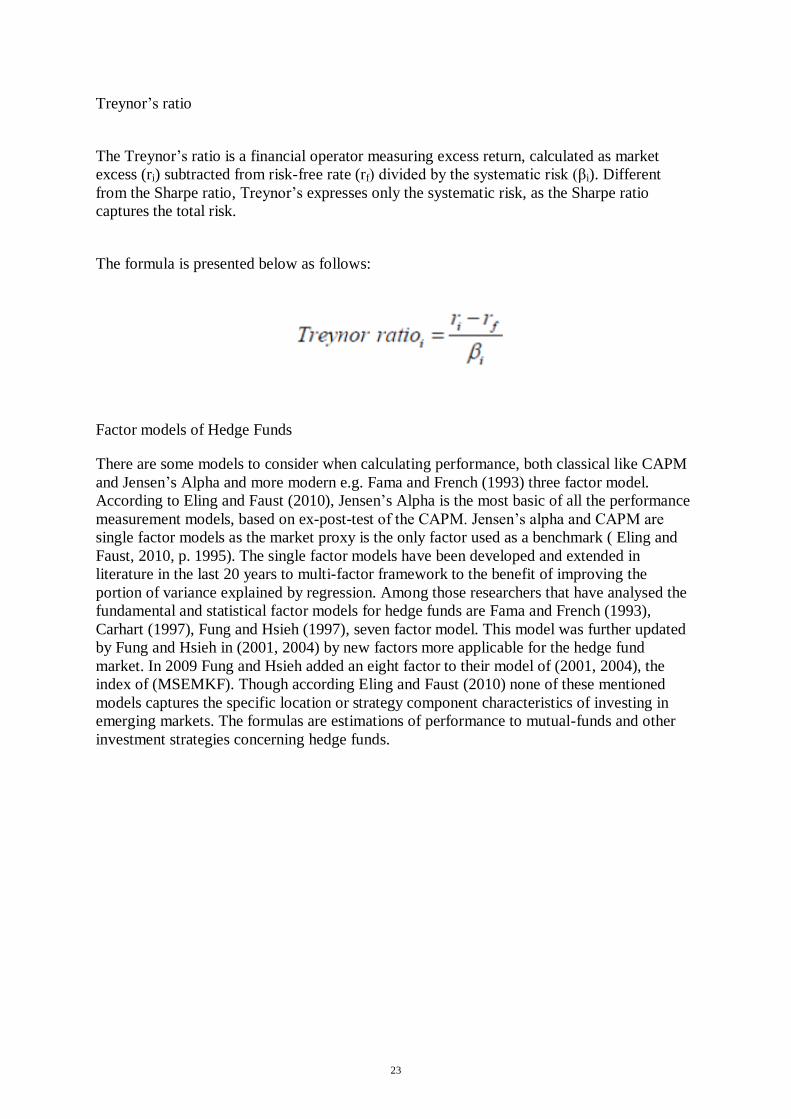
Treynor‟s ratio
The Treynor‟s ratio is a financial operator measuring excess return, calculated as market
excess (ri) subtracted from risk-free rate (rf) divided by the systematic risk (βi). Different
from the Sharpe ratio, Treynor‟s expresses only the systematic risk, as the Sharpe ratio
captures the total risk.
The formula is presented below as follows:
Factor models of Hedge Funds
There are some models to consider when calculating performance, both classical like CAPM
and Jensen‟s Alpha and more modern e.g. Fama and French (1993) three factor model.
According to Eling and Faust (2010), Jensen‟s Alpha is the most basic of all the performance
measurement models, based on ex-post-test of the CAPM. Jensen‟s alpha and CAPM are
single factor models as the market proxy is the only factor used as a benchmark ( Eling and
Faust, 2010, p. 1995). The single factor models have been developed and extended in
literature in the last 20 years to multi-factor framework to the benefit of improving the
portion of variance explained by regression. Among those researchers that have analysed the
fundamental and statistical factor models for hedge funds are Fama and French (1993),
Carhart (1997), Fung and Hsieh (1997), seven factor model. This model was further updated
by Fung and Hsieh in (2001, 2004) by new factors more applicable for the hedge fund
market. In 2009 Fung and Hsieh added an eight factor to their model of (2001, 2004), the
index of (MSEMKF). Though according Eling and Faust (2010) none of these mentioned
models captures the specific location or strategy component characteristics of investing in
emerging markets. The formulas are estimations of performance to mutual-funds and other
investment strategies concerning hedge funds.
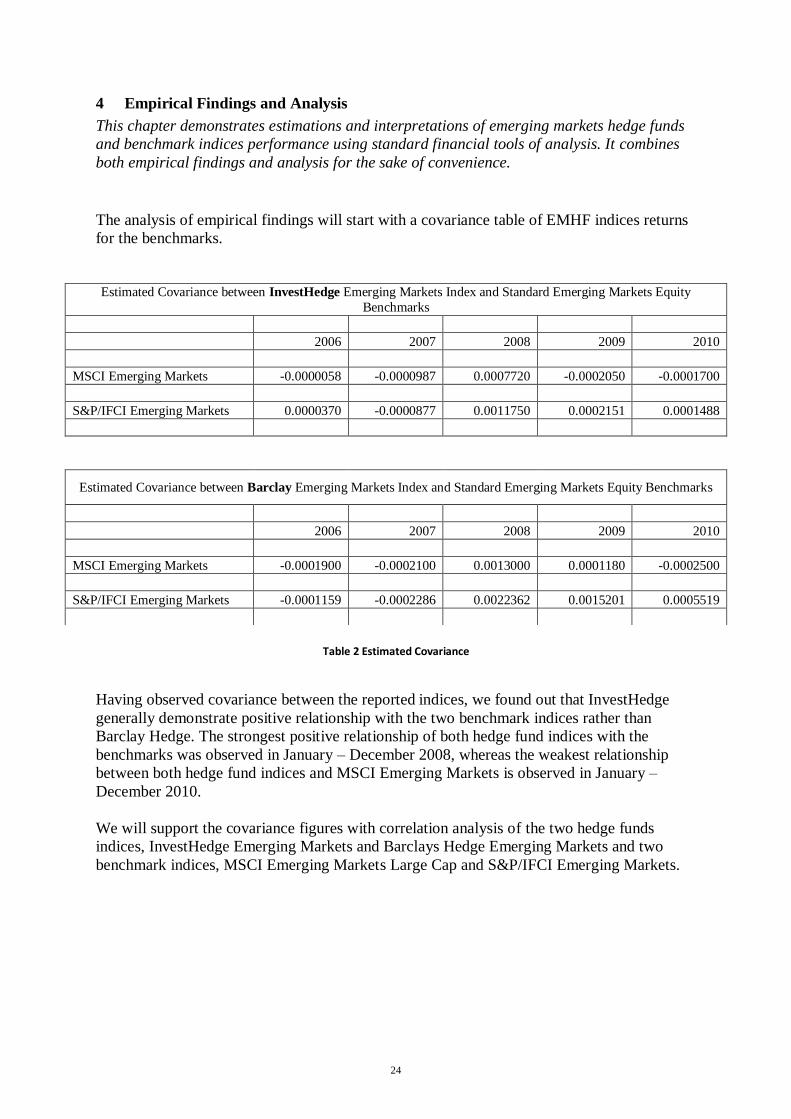
24
4 Empirical Findings and Analysis
This chapter demonstrates estimations and interpretations of emerging markets hedge funds
and benchmark indices performance using standard financial tools of analysis. It combines
both empirical findings and analysis for the sake of convenience.
The analysis of empirical findings will start with a covariance table of EMHF indices returns
for the benchmarks.
Table 2 Estimated Covariance
Having observed covariance between the reported indices, we found out that InvestHedge
generally demonstrate positive relationship with the two benchmark indices rather than
Barclay Hedge. The strongest positive relationship of both hedge fund indices with the
benchmarks was observed in January – December 2008, whereas the weakest relationship
between both hedge fund indices and MSCI Emerging Markets is observed in January –
December 2010.
We will support the covariance figures with correlation analysis of the two hedge funds
indices, InvestHedge Emerging Markets and Barclays Hedge Emerging Markets and two
benchmark indices, MSCI Emerging Markets Large Cap and S&P/IFCI Emerging Markets.
Estimated Covariance between InvestHedge Emerging Markets Index and Standard Emerging Markets Equity
Benchmarks
2006 2007 2008 2009 2010
MSCI Emerging Markets -0.0000058 -0.0000987 0.0007720 -0.0002050 -0.0001700
S&P/IFCI Emerging Markets 0.0000370 -0.0000877 0.0011750 0.0002151 0.0001488
Estimated Covariance between Barclay Emerging Markets Index and Standard Emerging Markets Equity Benchmarks
2006 2007 2008 2009 2010
MSCI Emerging Markets -0.0001900 -0.0002100 0.0013000 0.0001180 -0.0002500
S&P/IFCI Emerging Markets -0.0001159 -0.0002286 0.0022362 0.0015201 0.0005519
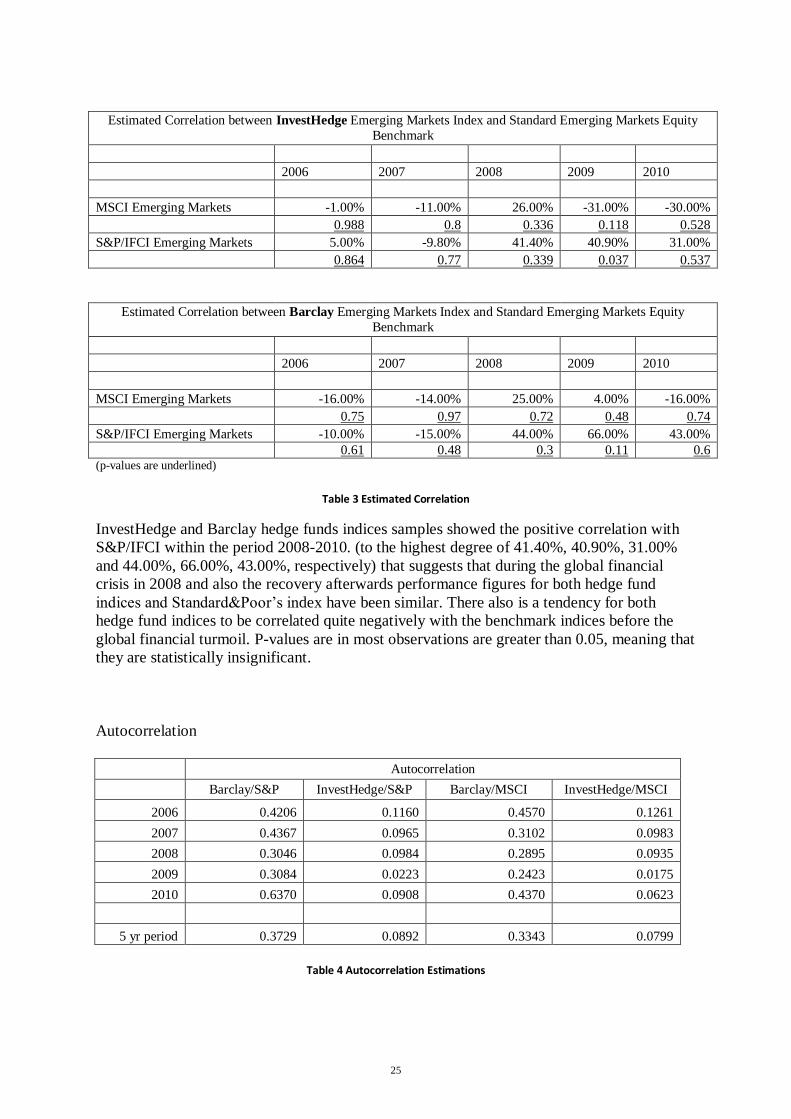
25
Estimated Correlation between InvestHedge Emerging Markets Index and Standard Emerging Markets Equity
Benchmark
2006 2007 2008 2009 2010
MSCI Emerging Markets -1.00% -11.00% 26.00% -31.00% -30.00%
0.988 0.8 0.336 0.118 0.528
S&P/IFCI Emerging Markets 5.00% -9.80% 41.40% 40.90% 31.00%
0.864 0.77 0.339 0.037 0.537
Estimated Correlation between Barclay Emerging Markets Index and Standard Emerging Markets Equity
Benchmark
2006 2007 2008 2009 2010
MSCI Emerging Markets -16.00% -14.00% 25.00% 4.00% -16.00%
0.75 0.97 0.72 0.48 0.74
S&P/IFCI Emerging Markets -10.00% -15.00% 44.00% 66.00% 43.00%
0.61 0.48 0.3 0.11 0.6 (p-values are underlined)
Table 3 Estimated Correlation
InvestHedge and Barclay hedge funds indices samples showed the positive correlation with
S&P/IFCI within the period 2008-2010. (to the highest degree of 41.40%, 40.90%, 31.00%
and 44.00%, 66.00%, 43.00%, respectively) that suggests that during the global financial
crisis in 2008 and also the recovery afterwards performance figures for both hedge fund
indices and Standard&Poor‟s index have been similar. There also is a tendency for both
hedge fund indices to be correlated quite negatively with the benchmark indices before the
global financial turmoil. P-values are in most observations are greater than 0.05, meaning that
they are statistically insignificant.
Autocorrelation
Autocorrelation
Barclay/S&P InvestHedge/S&P Barclay/MSCI InvestHedge/MSCI
2006 0.4206 0.1160 0.4570 0.1261
2007 0.4367 0.0965 0.3102 0.0983
2008 0.3046 0.0984 0.2895 0.0935
2009 0.3084 0.0223 0.2423 0.0175
2010 0.6370 0.0908 0.4370 0.0623
5 yr period 0.3729 0.0892 0.3343 0.0799
Table 4 Autocorrelation Estimations
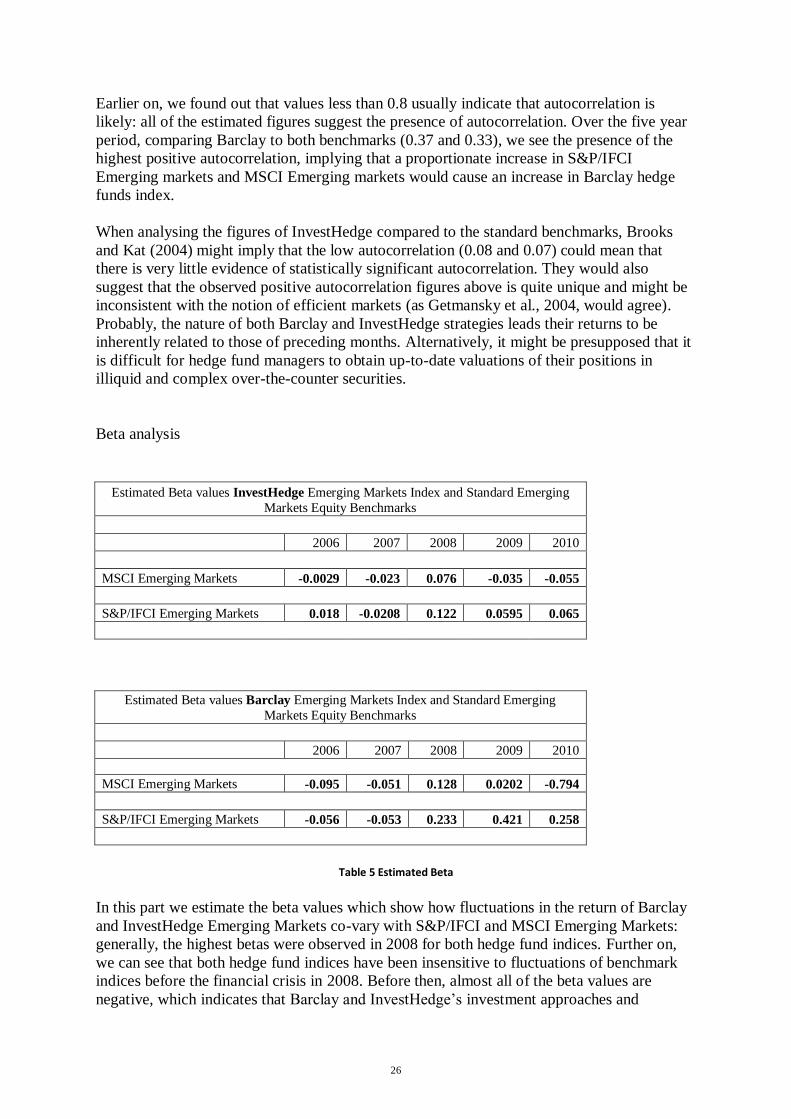
26
Earlier on, we found out that values less than 0.8 usually indicate that autocorrelation is
likely: all of the estimated figures suggest the presence of autocorrelation. Over the five year
period, comparing Barclay to both benchmarks (0.37 and 0.33), we see the presence of the
highest positive autocorrelation, implying that a proportionate increase in S&P/IFCI
Emerging markets and MSCI Emerging markets would cause an increase in Barclay hedge
funds index.
When analysing the figures of InvestHedge compared to the standard benchmarks, Brooks
and Kat (2004) might imply that the low autocorrelation (0.08 and 0.07) could mean that
there is very little evidence of statistically significant autocorrelation. They would also
suggest that the observed positive autocorrelation figures above is quite unique and might be
inconsistent with the notion of efficient markets (as Getmansky et al., 2004, would agree).
Probably, the nature of both Barclay and InvestHedge strategies leads their returns to be
inherently related to those of preceding months. Alternatively, it might be presupposed that it
is difficult for hedge fund managers to obtain up-to-date valuations of their positions in
illiquid and complex over-the-counter securities.
Beta analysis
Estimated Beta values InvestHedge Emerging Markets Index and Standard Emerging
Markets Equity Benchmarks
2006 2007 2008 2009 2010
MSCI Emerging Markets -0.0029 -0.023 0.076 -0.035 -0.055
S&P/IFCI Emerging Markets 0.018 -0.0208 0.122 0.0595 0.065
Estimated Beta values Barclay Emerging Markets Index and Standard Emerging
Markets Equity Benchmarks
2006 2007 2008 2009 2010
MSCI Emerging Markets -0.095 -0.051 0.128 0.0202 -0.794
S&P/IFCI Emerging Markets -0.056 -0.053 0.233 0.421 0.258
Table 5 Estimated Beta
In this part we estimate the beta values which show how fluctuations in the return of Barclay
and InvestHedge Emerging Markets co-vary with S&P/IFCI and MSCI Emerging Markets:
generally, the highest betas were observed in 2008 for both hedge fund indices. Further on,
we can see that both hedge fund indices have been insensitive to fluctuations of benchmark
indices before the financial crisis in 2008. Before then, almost all of the beta values are
negative, which indicates that Barclay and InvestHedge‟s investment approaches and
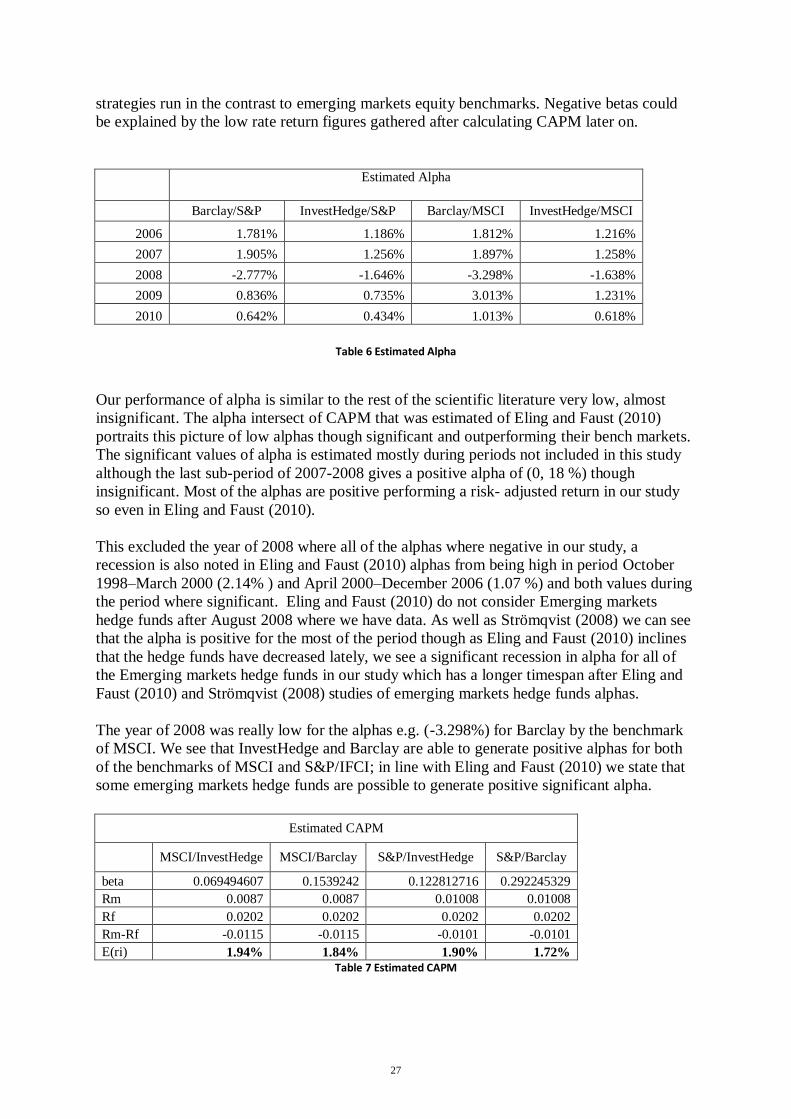
27
strategies run in the contrast to emerging markets equity benchmarks. Negative betas could
be explained by the low rate return figures gathered after calculating CAPM later on.
Estimated Alpha
Barclay/S&P InvestHedge/S&P Barclay/MSCI InvestHedge/MSCI
2006 1.781% 1.186% 1.812% 1.216%
2007 1.905% 1.256% 1.897% 1.258%
2008 -2.777% -1.646% -3.298% -1.638%
2009 0.836% 0.735% 3.013% 1.231%
2010 0.642% 0.434% 1.013% 0.618%
Table 6 Estimated Alpha
Our performance of alpha is similar to the rest of the scientific literature very low, almost
insignificant. The alpha intersect of CAPM that was estimated of Eling and Faust (2010)
portraits this picture of low alphas though significant and outperforming their bench markets.
The significant values of alpha is estimated mostly during periods not included in this study
although the last sub-period of 2007-2008 gives a positive alpha of (0, 18 %) though
insignificant. Most of the alphas are positive performing a risk- adjusted return in our study
so even in Eling and Faust (2010).
This excluded the year of 2008 where all of the alphas where negative in our study, a
recession is also noted in Eling and Faust (2010) alphas from being high in period October
1998–March 2000 (2.14% ) and April 2000–December 2006 (1.07 %) and both values during
the period where significant. Eling and Faust (2010) do not consider Emerging markets
hedge funds after August 2008 where we have data. As well as Strömqvist (2008) we can see
that the alpha is positive for the most of the period though as Eling and Faust (2010) inclines
that the hedge funds have decreased lately, we see a significant recession in alpha for all of
the Emerging markets hedge funds in our study which has a longer timespan after Eling and
Faust (2010) and Strömqvist (2008) studies of emerging markets hedge funds alphas.
The year of 2008 was really low for the alphas e.g. (-3.298%) for Barclay by the benchmark
of MSCI. We see that InvestHedge and Barclay are able to generate positive alphas for both
of the benchmarks of MSCI and S&P/IFCI; in line with Eling and Faust (2010) we state that
some emerging markets hedge funds are possible to generate positive significant alpha.
Estimated CAPM
MSCI/InvestHedge MSCI/Barclay S&P/InvestHedge S&P/Barclay
beta 0.069494607 0.1539242 0.122812716 0.292245329
Rm 0.0087 0.0087 0.01008 0.01008
Rf 0.0202 0.0202 0.0202 0.0202
Rm-Rf -0.0115 -0.0115 -0.0101 -0.0101
E(ri) 1.94% 1.84% 1.90% 1.72%
Table 7 Estimated CAPM
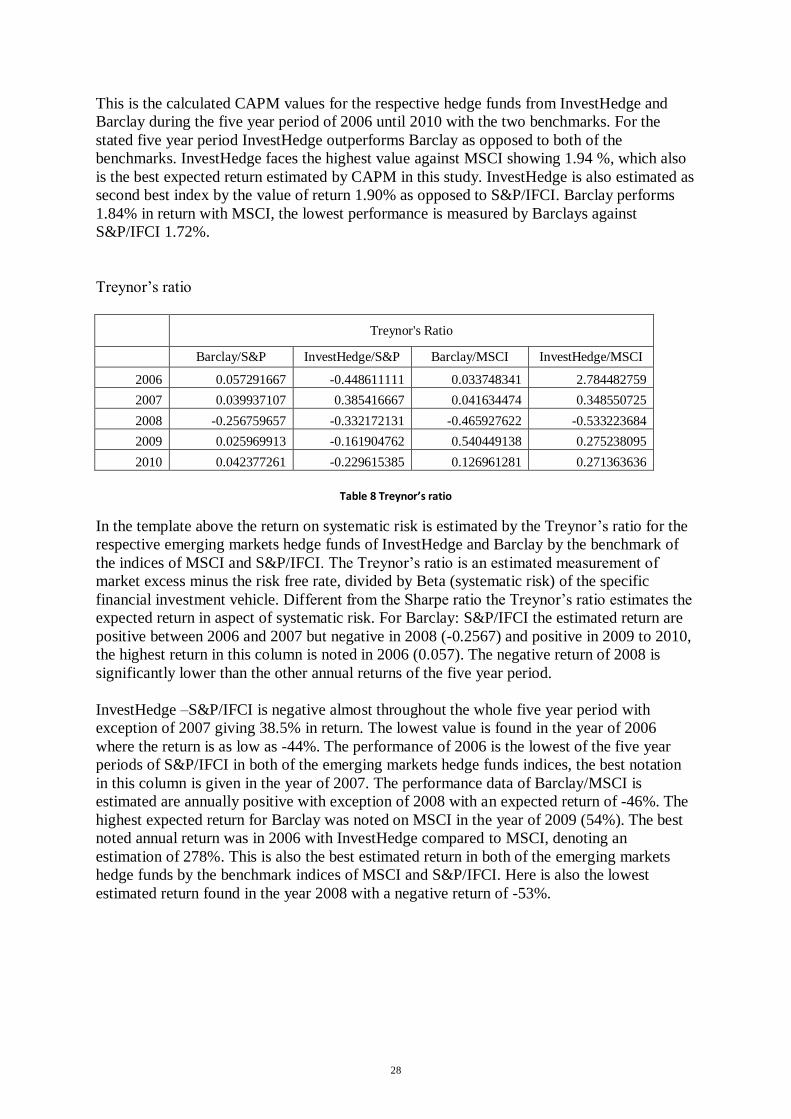
28
This is the calculated CAPM values for the respective hedge funds from InvestHedge and
Barclay during the five year period of 2006 until 2010 with the two benchmarks. For the
stated five year period InvestHedge outperforms Barclay as opposed to both of the
benchmarks. InvestHedge faces the highest value against MSCI showing 1.94 %, which also
is the best expected return estimated by CAPM in this study. InvestHedge is also estimated as
second best index by the value of return 1.90% as opposed to S&P/IFCI. Barclay performs
1.84% in return with MSCI, the lowest performance is measured by Barclays against
S&P/IFCI 1.72%.
Treynor‟s ratio
Treynor's Ratio
Barclay/S&P InvestHedge/S&P Barclay/MSCI InvestHedge/MSCI
2006 0.057291667 -0.448611111 0.033748341 2.784482759
2007 0.039937107 0.385416667 0.041634474 0.348550725
2008 -0.256759657 -0.332172131 -0.465927622 -0.533223684
2009 0.025969913 -0.161904762 0.540449138 0.275238095
2010 0.042377261 -0.229615385 0.126961281 0.271363636
Table 8 Treynor’s ratio
In the template above the return on systematic risk is estimated by the Treynor‟s ratio for the
respective emerging markets hedge funds of InvestHedge and Barclay by the benchmark of
the indices of MSCI and S&P/IFCI. The Treynor‟s ratio is an estimated measurement of
market excess minus the risk free rate, divided by Beta (systematic risk) of the specific
financial investment vehicle. Different from the Sharpe ratio the Treynor‟s ratio estimates the
expected return in aspect of systematic risk. For Barclay: S&P/IFCI the estimated return are
positive between 2006 and 2007 but negative in 2008 (-0.2567) and positive in 2009 to 2010,
the highest return in this column is noted in 2006 (0.057). The negative return of 2008 is
significantly lower than the other annual returns of the five year period.
InvestHedge –S&P/IFCI is negative almost throughout the whole five year period with
exception of 2007 giving 38.5% in return. The lowest value is found in the year of 2006
where the return is as low as -44%. The performance of 2006 is the lowest of the five year
periods of S&P/IFCI in both of the emerging markets hedge funds indices, the best notation
in this column is given in the year of 2007. The performance data of Barclay/MSCI is
estimated are annually positive with exception of 2008 with an expected return of -46%. The
highest expected return for Barclay was noted on MSCI in the year of 2009 (54%). The best
noted annual return was in 2006 with InvestHedge compared to MSCI, denoting an
estimation of 278%. This is also the best estimated return in both of the emerging markets
hedge funds by the benchmark indices of MSCI and S&P/IFCI. Here is also the lowest
estimated return found in the year 2008 with a negative return of -53%.
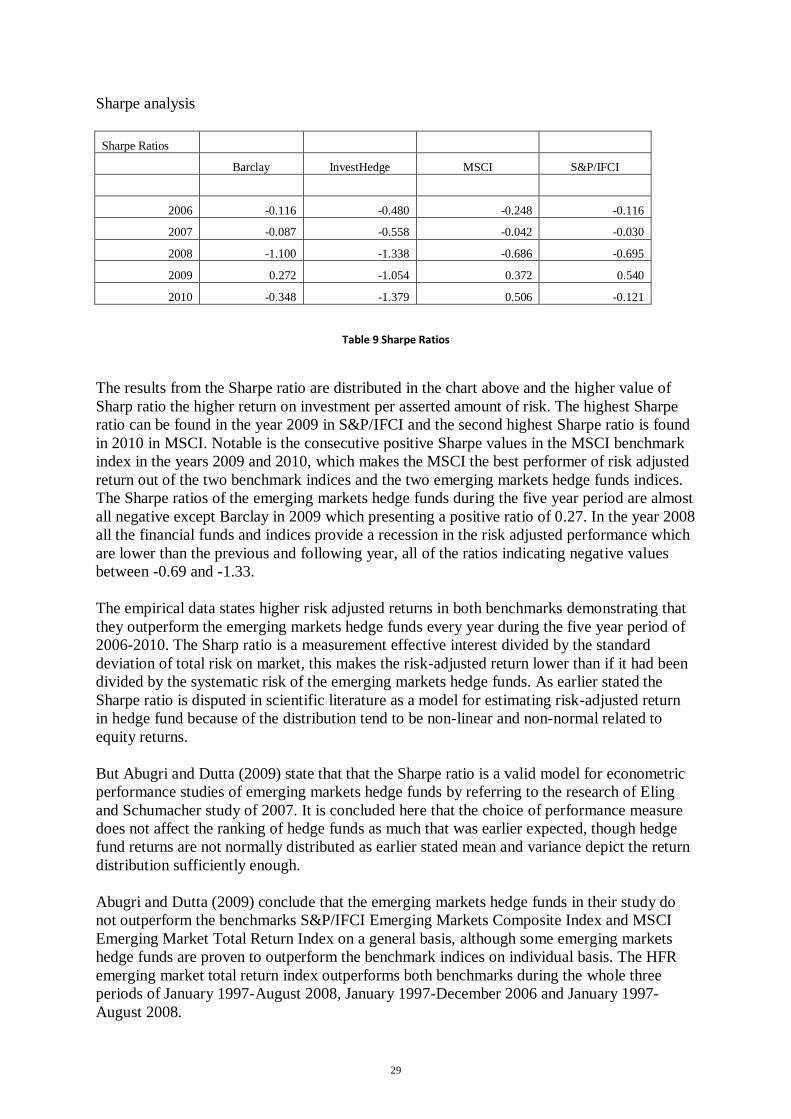
29
Sharpe analysis
Sharpe Ratios
Barclay InvestHedge MSCI S&P/IFCI
2006 -0.116 -0.480 -0.248 -0.116
2007 -0.087 -0.558 -0.042 -0.030
2008 -1.100 -1.338 -0.686 -0.695
2009 0.272 -1.054 0.372 0.540
2010 -0.348 -1.379 0.506 -0.121
Table 9 Sharpe Ratios
The results from the Sharpe ratio are distributed in the chart above and the higher value of
Sharp ratio the higher return on investment per asserted amount of risk. The highest Sharpe
ratio can be found in the year 2009 in S&P/IFCI and the second highest Sharpe ratio is found
in 2010 in MSCI. Notable is the consecutive positive Sharpe values in the MSCI benchmark
index in the years 2009 and 2010, which makes the MSCI the best performer of risk adjusted
return out of the two benchmark indices and the two emerging markets hedge funds indices.
The Sharpe ratios of the emerging markets hedge funds during the five year period are almost
all negative except Barclay in 2009 which presenting a positive ratio of 0.27. In the year 2008
all the financial funds and indices provide a recession in the risk adjusted performance which
are lower than the previous and following year, all of the ratios indicating negative values
between -0.69 and -1.33.
The empirical data states higher risk adjusted returns in both benchmarks demonstrating that
they outperform the emerging markets hedge funds every year during the five year period of
2006-2010. The Sharp ratio is a measurement effective interest divided by the standard
deviation of total risk on market, this makes the risk-adjusted return lower than if it had been
divided by the systematic risk of the emerging markets hedge funds. As earlier stated the
Sharpe ratio is disputed in scientific literature as a model for estimating risk-adjusted return
in hedge fund because of the distribution tend to be non-linear and non-normal related to
equity returns.
But Abugri and Dutta (2009) state that that the Sharpe ratio is a valid model for econometric
performance studies of emerging markets hedge funds by referring to the research of Eling
and Schumacher study of 2007. It is concluded here that the choice of performance measure
does not affect the ranking of hedge funds as much that was earlier expected, though hedge
fund returns are not normally distributed as earlier stated mean and variance depict the return
distribution sufficiently enough.
Abugri and Dutta (2009) conclude that the emerging markets hedge funds in their study do
not outperform the benchmarks S&P/IFCI Emerging Markets Composite Index and MSCI
Emerging Market Total Return Index on a general basis, although some emerging markets
hedge funds are proven to outperform the benchmark indices on individual basis. The HFR
emerging market total return index outperforms both benchmarks during the whole three
periods of January 1997-August 2008, January 1997-December 2006 and January 1997-
August 2008.
30
This is coherent with our study; almost all of the ratios from the annually based Sharpe ratios
do not outperform the benchmark indices of MSCI and S&P/IFCI with reservation of Barclay
in 2006 when the Sharpe ratio is at par with S&P/IFCI and outperforms the MSCI benchmark
index.
Analysis of Theoretical Data results and Empirical Data Results
The most of the data apprehended from the theoretical framework uses the CAPM model as
model of estimating the performance of hedge funds or funds in general. The usage of the
CAPM is in our study used as an estimation of the expected return on interest and to be able
to calculate the alpha of the risk adjusted return. In scientifically this model has been used as
a theoretical way of increasing the adjusted R2 or explanatory power of the regression by
applying multifactorial regression models to enhance the power of adjusted R2. Usually
CAPM is the first benchmark test of adjusted R2 exemplified e.g. Eling and Faust (2010) and
Capocci and Hübner (2002) to for see a stronger explanatory power of the regression of hedge
funds and index benchmarks. The model of CAPM has as an estimative measure of return
been criticised for not being sufficient enough, this is clear in Ronaldos and Favres study
from (2002). As Ronaldos and Favres (2003) stated that the hedge funds have different risk
return performance and suggesting that the hedge fund index should be separately analysed
and that unique pricing models for hedge funds may be misguiding. Further on Ronaldo and
Favres (2002) that hedge fund should not be treated as on unanimous financial class but to be
diversified as we have done by strategy, in our case emerging markets hedge funds. The
production of beta in their study is around 1.0 for emerging markets hedge funds by the
benchmark index of 70% Russell 3000 and 30% Lehman US aggregate while the highest beta
for our study is estimated to 29% during the five year regression of Barclay vs. S&P/IFCI.
For hedge funds as financial instruments there is no predictive certainty that the highest beta
will perform the highest rate of expected excess return. This statement is coherent in our
study where the highest beta gives the lowest return and the lowest beta gives the highest
expected excess return.
31
5 Conclusions and Implications
In this chapter, main conclusions are drawn by comparing the results of empirical data
analysis with the previous research findings.
After reviewing previous research in emerging markets hedge funds and using the tools of
performance analysis, we have come to results in line with most of the scientists in testing a
sample emerging market hedge fund indices‟ performance as opposed to the benchmarks
during the study period of 2006 – 2010.
A preliminary conclusion drawn from the descriptive statistics the figures shows that on a
five year basis, emerging markets hedge funds are less volatile than benchmark indices and
generally, the latter demonstrated higher mean performance figures than hedge funds.
Benchmark indices have also been more exposed to the financial downturn in 2008.
The benchmark indices outperform Barclays and InvestHedge emerging markets hedge funds
indices in terms of risk-adjusted return. The Sharpe ratios were found to be significantly low
for most of the time during the five year period. So, judging the gained figures, we can say
that hedge funds have outperformed benchmarks.
Similar to Abugri and Dutta (2009) study testing if emerging markets hedge funds have
outperformed the index market, it is concluded in our study that the emerging markets hedge
funds during the time frame 2006-2010 have not outperformed the benchmark indices; on a
general basis thereby performing higher Sharpe ratios. Though as seen in Abugri and Dutta
(2009) there have been singular emerging markets hedge funds that have been outperforming
their indices on a singular basis, which is clear in the eras of better Sharpe ratios in the
periods of January 1997-December 2006 and January 2007-August 2008 by the emerging
markets hedge funds of and S&P/IFCI Emerging Market Composite Index and HFR
Emerging Market Total Return Index.
In our research the emerging markets hedge funds are outperformed by the benchmark
indices, though, showing Sharpe ratio at par in the year of 2006 with Barclay and S&P/IFCI
with Sharpe ratio of negative 0.116. This is reoccurring in the literature of Abugri and Dutta
(2009), where some of the Sharp ratios of emerging markets hedge funds are at par with the
benchmarks indices. The benchmark index performing the best in our study was MSCI during
the years 2009 and 2010 generating positive values of risk adjusted return.
In terms of CAPM we estimated not only expected return on interest but also adjusted return
in terms of alpha which is as Strömqvist (2008) states the meaning with hedge funds. Because
Jensen‟s alpha is derived from CAPM and the theoretical framework uses the intercept of
alpha as a test if emerging markets hedge funds have outperformed the benchmark index.
Concluding the emerging markets hedge funds sample in our study expected return figures
have been rather low, where the emerging markets hedge fund index InvestHedge compared
to MSCI gives the highest expected return on interest and the lowest for Barclay compared to
S&P/IFCI.
In addition, our study confirms the results gained by Eling and Faust (2010) where the alphas
are positive and significant, although very low during the whole period of 2006-2010 with
exception of 2008 which was negative in all four indices. Finalising the alpha is significant
and the emerging markets hedge funds by theoretical framework and our study proves that
although the alpha is low, it is still significant. This is in line with Strömqvist‟s (2008) study
stating that alpha values generated by emerging markets hedge funds are low.
32
The Treynor‟s ratio as mentioned earlier is the return on asset divided by the systematic risk
of beta, which gives a value for the risk taken per asset, not as the Sharpe ratio asserting total
risk for the return. The Treynor‟s value is not widely considered in emerging markets hedge
funds either; however it could be a good measure of foreseeing the risk when there is only
systematic risk. The values in our study are negative for the most of the time during 2006-
2010. It can be useful for practitioners in terms of which systematic risk to choose, for
example in 2007 InvestHedge/S&P generate better values than InvestHedge/MSCI, so this
could give direction and indication of future investments. This concludes that this report
might inform about direction and indication of future performance of emerging markets
hedge funds of Barclays and InvestHedge by two benchmark indices of MSCI and S&P/IFCI.
This enables performance data to practitioners, who can use this data in future investment
decision of emerging markets hedge funds of how to invest.
For theoretical and practical implications these findings can give room to news frontiers of
research and practising. Our data follows a range of time that was extensively covered in
theory. Most of the data apprehended from the previous research do not include post-crisis
period and its influence on funds performance. Neither Strömqvist (2010) nor Eling and Faust
(2010) considered alpha risk-adjusted return for hedge funds after August 2008 where we
gained data demonstrating still positive alpha values throughout 2009 and 2010. Noted has to
be the fact from Ackerman et al.(1999) that the result of whether the emerging markets hedge
funds or hedge fund outperform or underperform the benchmark indices depends on the
specific emerging markets hedge funds and benchmark index. We conclude that this is the
case in our study where the different emerging markets hedge funds generate different risk
adjusted return for the both hedge funds indices Barclay and InvestHedge compared to the
MSCI and S&P/IFCI. This can be seen in the alpha values, Sharpe ratio, Treynor‟s ratio and
CAPM.
33
6 Recommendations/Suggestions for Further Research
There are quite a few areas for further research of emerging markets hedge funds since this
hedge funds strategy has not been studied as extensively. The proposed topic could be
developed in several directions:
1. Different benchmark indices could be used for similar comparative analysis: for
instance, researchers might consider comparing emerging markets hedge funds
indices to emerging markets benchmark bond indices, such as Barclays Global
Emerging Market Debt benchmark index and/or take into consideration standard
emerging markets regional benchmark equity indices.
2. It might also be interesting to find out how incentive fees and also hedge fund
manager‟s own capital influence the investment approach that they undertake
3. When performing performance analysis, researcher might use Arbitrage Pricing
Theory instead of CAPM. This theory is the alternative way of evaluating an
investments performance instead of evaluating risk-adjusted return in case of CAPM.
CAPM assumes that all risk can be expressed using one measure, whereas APT can
identify all systematic factors and how important of each of these factors might be.
This is why scientists prefer to use ATP model as opposed to CAPM. The problem
with the APT model is that it needs to empirically identify systematic factors. By
identifying new ways of executing benchmark analysis the insight for practitioners in
their decision of EMHFs management. The APT model is more factorial to more
markets which can give new information of the financial situation for emerging
markets hedge funds today.
34
7 References and Appendices
7.1 Scientific articles
Abugri, B.A., Dutta, S. (2009). Emerging market hedge funds: Do they perform like regular
hedge funds? Journal of International Financial Markets, Institutions & Money, 19 (5), pp.
834–849.
Ackermann, C., McEnally, R., Ravenscraft, D. (1999). The performance of hedge funds: risk,
return and incentives. Journal of Finance, 54 (3), pp. 833–874.
Agarwal, V., Naik, N.Y. (1999). “On taking the „alternative‟ route: risk, rewards, style and
performance persistence of hedge funds”. Journal of Alternative Investments. Volume 2,
Number 4, 6-23.
Agarwal, V., Naik, N.Y. (2000). Multi-Period performance persistence analysis of hedge
funds. Journal of Financial and Quantitative Analysis 35 (3), pp. 327–342.
Agarwal, V., Naik, N. (2004). Risks and portfolio decisions involving hedge funds. Review of
Financial Studies, 17(1), 63-98.
Amin, G.S, Kat, H.M. (2003). Hedge fund performance 1990-2000: do the "money
machines" really add value? Journal of Financial and Quantitative Analysis, 38(2), pp. 251-
274.
Amenc, N., Martellini, L., Vaissié M. (2003). Benefits and risks of alternative investment
strategies. Journal of Asset Management, 4(2), 96-118.
Bianchi, R J., Drew, M E., Stanley, A. (2008). The search for hedge fund alpha. JASSA The
Finsia Journal of Applied Finance, pp. 39-47
Capocci, D., Hubner, G. (2004). Analysis of hedge fund performance. Journal of Empirical
Finance 11 (1), pp. 55–89.
Dichev, I., Yu, G. (2009). Higher risk, lower returns: what hedge fund investors really earn?
Journal of Financial Economics (JFE), 100, pp. 248–263.
Ding, B., Shawky, H., Tian, J. (2009). Liquidity shocks, size and the relative performance of
hedge fund strategies. Journal of Banking and Finance, 33, pp. 883-891.
Eling, M., Schumacher, F. (2007). Does the choice of performance measure influence the
evaluation of hedge funds? Journal of Banking & Finance, 31 (9), pp. 2632–2647.
Eling, M., Faust R. (2010). The performance of hedge funds and mutual funds in emerging
markets. Journal of Banking & Finance. 34. (8), pp. 1993–2009.
Fama, E.F., French, K.R. (1993). Common risk factors in the returns on stocks and bonds.
Journal of Financial Economics, 33 (1), pp. 3–56.
35
Fung, W., Hsieh, D.A. (1997). Empirical Characteristics of Dynamic Trading Strategies: The
case of Hedge Funds. Review of Financial Studies, Volume 10, Number 2, pp. 275-302(28).
Oxford University Press.
Getmansky, M., Lo, A., Makarov, I. (2004). An econometric model of serial correlation and
illiquidity in hedge fund returns. Journal of Financial Economics 74, pp. 529-609.
Israelsen, C.L. (2003). Sharpening the Sharpe Ratio. Financial Planning 33 (1), pp. 49–51.
Israelsen, C.L. (2005). A refinement to the Sharpe Ratio and information ratio. Journal of
Asset Management 5(6), pp. 423–427.
Lo, A.W. (2002). The statistics of Sharpe ratios. Financial Analysts Journal 58(4), pp. 36–52.
Meziani, J. (Feb 15, 2007). Equity Long/Short Hedge Funds: Properties and Behavior:
[PowerPoint slides]. Retrieved from:
<http://www.iafe.org/html/documents/PropertiesandBehaviorofELSHedgeFunds.pdf>
Morey, M R., Morey, R C. (2000). An analytical confidence interval for the Treynor index:
formula, conditions and properties. Journal of Business Finance & Accounting, 27 (1) & (2),
pp. 127-154.
Modigliani, F., Modigliani, L. (1997). Risk adjusted performance – how to measure it and
why. Journal of Portfolio Management 23 (2), pp. 45–54.
Pedersen C.S. (2001). Derivatives and Downside Risk. Derivatives Use, Trading &
Regulation. London: 7(3), pp. 251-268.
Robertos, L., Favres, A. (2003). How to Price Hedge Funds: from Two- to Four-Moment
CAPM. Edhec Risk and Asset Management Research Centre, pp. 1-26
Sadka, R. (2010). Liquidity risk and the cross-section of hedge fund returns. Journal of
Financial Economics 98, pp. 54-71.
Samiev, S., Wu, Y. (2010). Do hedge fund investment strategies matter in hedge fund
performance? (Unpublished Master thesis). Umeå School of Business, Umeå, Sweden.
Wacker, J.G. (1998). A definition of theory: research guidelines for different theory-building
research methods in operations management. Journal of Operations Management, 16(4). pp.
361–385.
7.2 Literature
Bryman, A., Bell, E. (2007). Business research methods (second edition). New York: Oxford
University Press Inc.
Elton, E., Gruber, M. (1995). Modern portfolio theory and investment analysis (fifth edition).
New York: John Wiley & Sons, Inc.
Hamberg, M. (2001). Strategic Financial Decisions. Malmö: Mattias Hamberg & Liber AB.
36
Sweden.
Lavinio, S. (1999). The hedge fund handbook. A definitive guide for analyzing and evaluating
alternative investments. New York, NY: McGraw-Hill.
Lhabitant, F.S. (2004). Hedge Funds: Quantitative Insights. Chichester: John Wiley & Sons
Ltd, England.
Neuman, L, W. (2003) Social Research Method; qualitative and quantitative Approaches. (5th
Ed.) Boston: Pearson Education Inc.
Potter. S. (2006). Doing Postgraduate Research (second edition). London: Sage Publications
Ltd.
Strömqvist.M. (2008) Hedge Funds and International Capital Flows. (Published doctoral
thesis). Stockholm School of Economics, Stockholm, Sweden.
7.3 Web Pages
"About ScienceDirect | Sciverse." Sciverse | Open to Accelerate Science. Retrieved from,
<http://www.info.sciverse.com/sciencedirect/about>.
"About Us." Oxford Journals. Retrieved from:
<http://www.oxfordjournals.org/about_us.html>.
"Barclay Emerging Markets Index.” BarclayHedge. Alternative Investment Databases.
Retrieved from:
<http://www.barclayhedge.com/research/indices/ghs/Emerging_Markets_Index.html#?btg_tr
k>
"Correlation." The Department of Statistics. Yale University. Retrieved from:
<http://www.stat.yale.edu/Courses/1997-98/101/correl.htm>.
“Durbin-Watson statistic.” NLREG - Nonlinear Regression Analysis Program. Retrieved
from:
<http://www.nlreg.com/results.htm>.
"Global Fund of Hedge Fund Index and Indices - Methodology." Your Source of Hedge Fund
News and Performance Data - HedgeFund Intelligence. Retrieved from:
<http://www.hedgefundintelligence.com/Database-InvestHedge-Indices-Methodology.html>.
"S&P/IFCI Factsheet." Standard&Poors. The McGraw-Hill Companies. Retrieved from:
<http://www2.standardandpoors.com/spf/pdf/index/SP_IFCI_Factsheet.pdf>
"Kurtosis, Peakedness & Fat Tails." Investment Performance Analysis & Risk Management.
Retrieved from:
<http://www.andreassteiner.net/performanceanalysis/?Risk_Measurement:Return_Distributio
ns:Kurtosis%2C_Peakedness_%26amp%3B_Fat_Tails>.

37
"MSCI Emerging Markets." MSCI. A clear view of risk and return. Retrieved from:
<http://www.msci.com/products/indices/licensing/msci_emerging_markets>
p-value. (2011). In Encyclopædia Britannica. Retrieved from:
<http://www.britannica.com/EBchecked/topic/437362/p-value>
"Skewness". Investment Performance Analysis & Risk Management. Retrieved from:
<http://www.andreassteiner.net/performanceanalysis/?Risk_Measurement:Return_Distributio
ns:Skewness>
"Statistical Sampling and Regression: Convariance and Correlation." Columbia University.
Retrieved from:
<http://ci.columbia.edu/ci/premba_test/c0331/s7/s7_5.html>
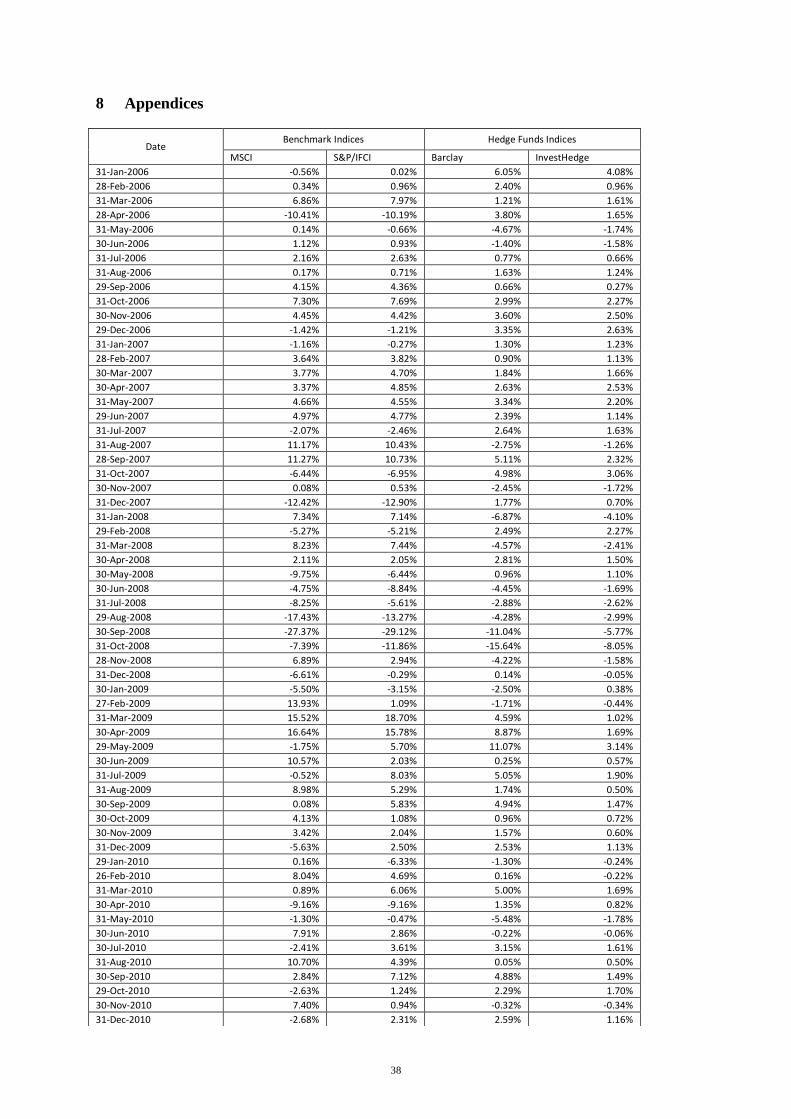
38
8 Appendices
Date Benchmark Indices Hedge Funds Indices
MSCI S&P/IFCI Barclay InvestHedge
31-Jan-2006 -0.56% 0.02% 6.05% 4.08%
28-Feb-2006 0.34% 0.96% 2.40% 0.96%
31-Mar-2006 6.86% 7.97% 1.21% 1.61%
28-Apr-2006 -10.41% -10.19% 3.80% 1.65%
31-May-2006 0.14% -0.66% -4.67% -1.74%
30-Jun-2006 1.12% 0.93% -1.40% -1.58%
31-Jul-2006 2.16% 2.63% 0.77% 0.66%
31-Aug-2006 0.17% 0.71% 1.63% 1.24%
29-Sep-2006 4.15% 4.36% 0.66% 0.27%
31-Oct-2006 7.30% 7.69% 2.99% 2.27%
30-Nov-2006 4.45% 4.42% 3.60% 2.50%
29-Dec-2006 -1.42% -1.21% 3.35% 2.63%
31-Jan-2007 -1.16% -0.27% 1.30% 1.23%
28-Feb-2007 3.64% 3.82% 0.90% 1.13%
30-Mar-2007 3.77% 4.70% 1.84% 1.66%
30-Apr-2007 3.37% 4.85% 2.63% 2.53%
31-May-2007 4.66% 4.55% 3.34% 2.20%
29-Jun-2007 4.97% 4.77% 2.39% 1.14%
31-Jul-2007 -2.07% -2.46% 2.64% 1.63%
31-Aug-2007 11.17% 10.43% -2.75% -1.26%
28-Sep-2007 11.27% 10.73% 5.11% 2.32%
31-Oct-2007 -6.44% -6.95% 4.98% 3.06%
30-Nov-2007 0.08% 0.53% -2.45% -1.72%
31-Dec-2007 -12.42% -12.90% 1.77% 0.70%
31-Jan-2008 7.34% 7.14% -6.87% -4.10%
29-Feb-2008 -5.27% -5.21% 2.49% 2.27%
31-Mar-2008 8.23% 7.44% -4.57% -2.41%
30-Apr-2008 2.11% 2.05% 2.81% 1.50%
30-May-2008 -9.75% -6.44% 0.96% 1.10%
30-Jun-2008 -4.75% -8.84% -4.45% -1.69%
31-Jul-2008 -8.25% -5.61% -2.88% -2.62%
29-Aug-2008 -17.43% -13.27% -4.28% -2.99%
30-Sep-2008 -27.37% -29.12% -11.04% -5.77%
31-Oct-2008 -7.39% -11.86% -15.64% -8.05%
28-Nov-2008 6.89% 2.94% -4.22% -1.58%
31-Dec-2008 -6.61% -0.29% 0.14% -0.05%
30-Jan-2009 -5.50% -3.15% -2.50% 0.38%
27-Feb-2009 13.93% 1.09% -1.71% -0.44%
31-Mar-2009 15.52% 18.70% 4.59% 1.02%
30-Apr-2009 16.64% 15.78% 8.87% 1.69%
29-May-2009 -1.75% 5.70% 11.07% 3.14%
30-Jun-2009 10.57% 2.03% 0.25% 0.57%
31-Jul-2009 -0.52% 8.03% 5.05% 1.90%
31-Aug-2009 8.98% 5.29% 1.74% 0.50%
30-Sep-2009 0.08% 5.83% 4.94% 1.47%
30-Oct-2009 4.13% 1.08% 0.96% 0.72%
30-Nov-2009 3.42% 2.04% 1.57% 0.60%
31-Dec-2009 -5.63% 2.50% 2.53% 1.13%
29-Jan-2010 0.16% -6.33% -1.30% -0.24%
26-Feb-2010 8.04% 4.69% 0.16% -0.22%
31-Mar-2010 0.89% 6.06% 5.00% 1.69%
30-Apr-2010 -9.16% -9.16% 1.35% 0.82%
31-May-2010 -1.30% -0.47% -5.48% -1.78%
30-Jun-2010 7.91% 2.86% -0.22% -0.06%
30-Jul-2010 -2.41% 3.61% 3.15% 1.61%
31-Aug-2010 10.70% 4.39% 0.05% 0.50%
30-Sep-2010 2.84% 7.12% 4.88% 1.49%
29-Oct-2010 -2.63% 1.24% 2.29% 1.70%
30-Nov-2010 7.40% 0.94% -0.32% -0.34%
31-Dec-2010 -2.68% 2.31% 2.59% 1.16%
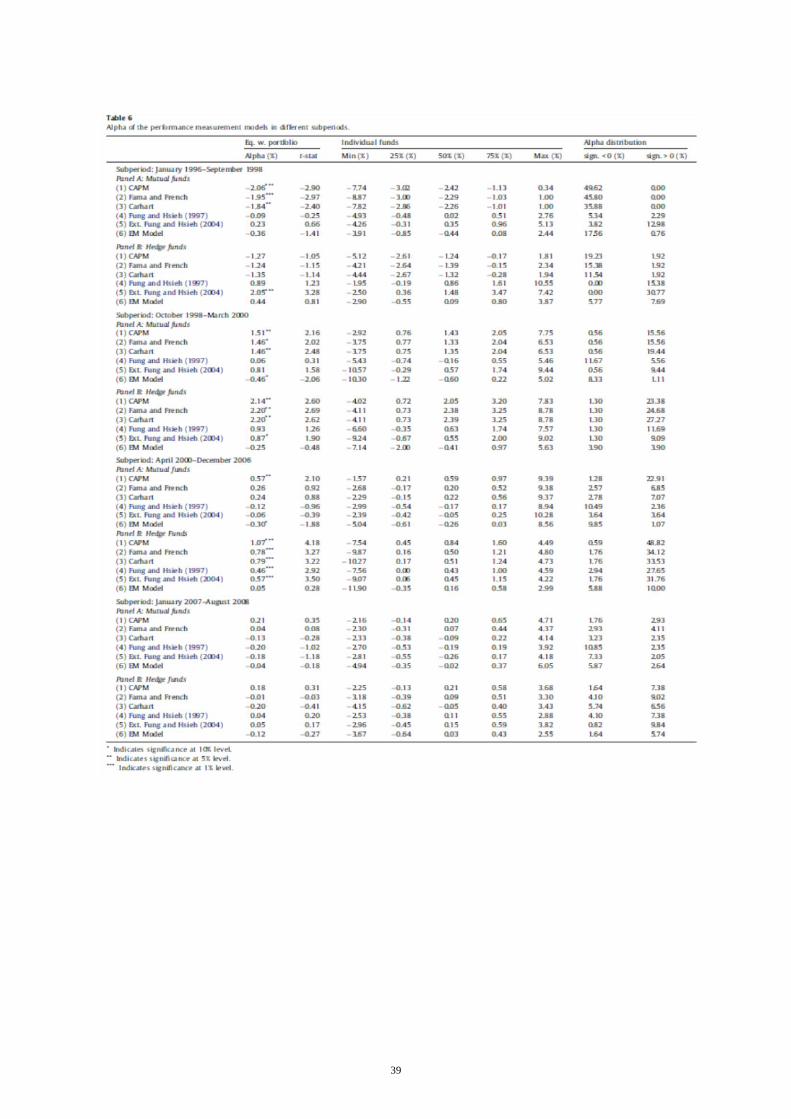
39
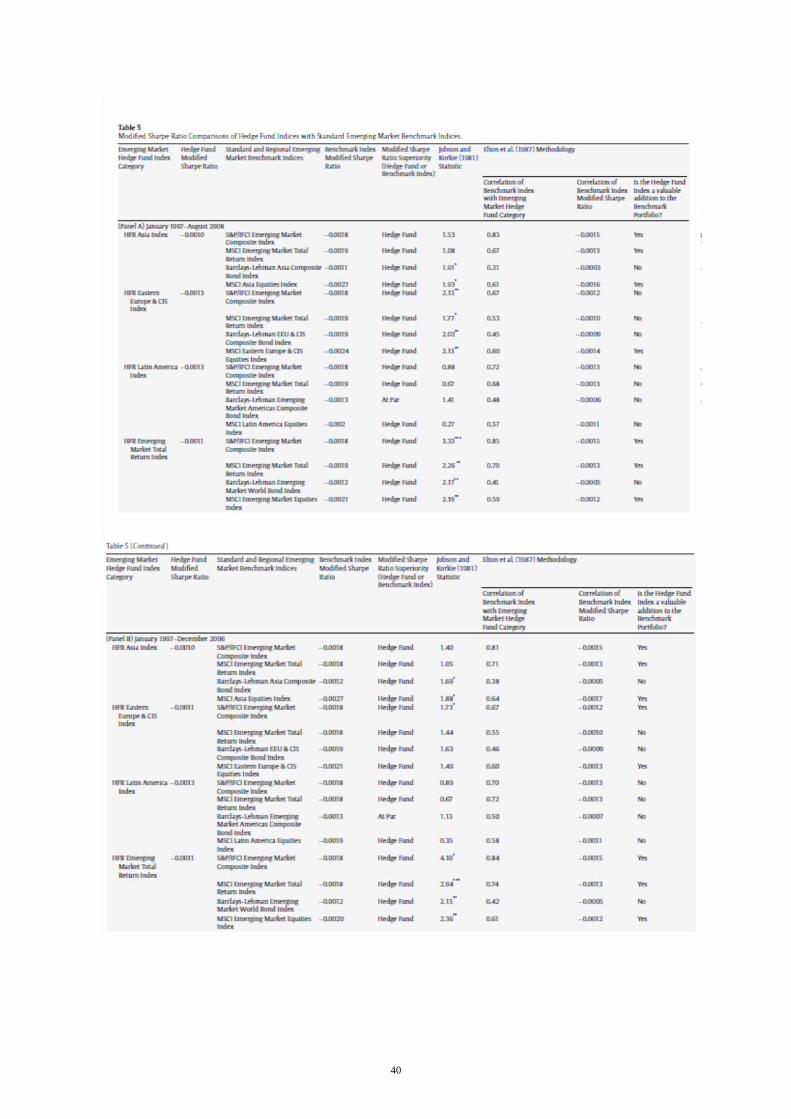
40
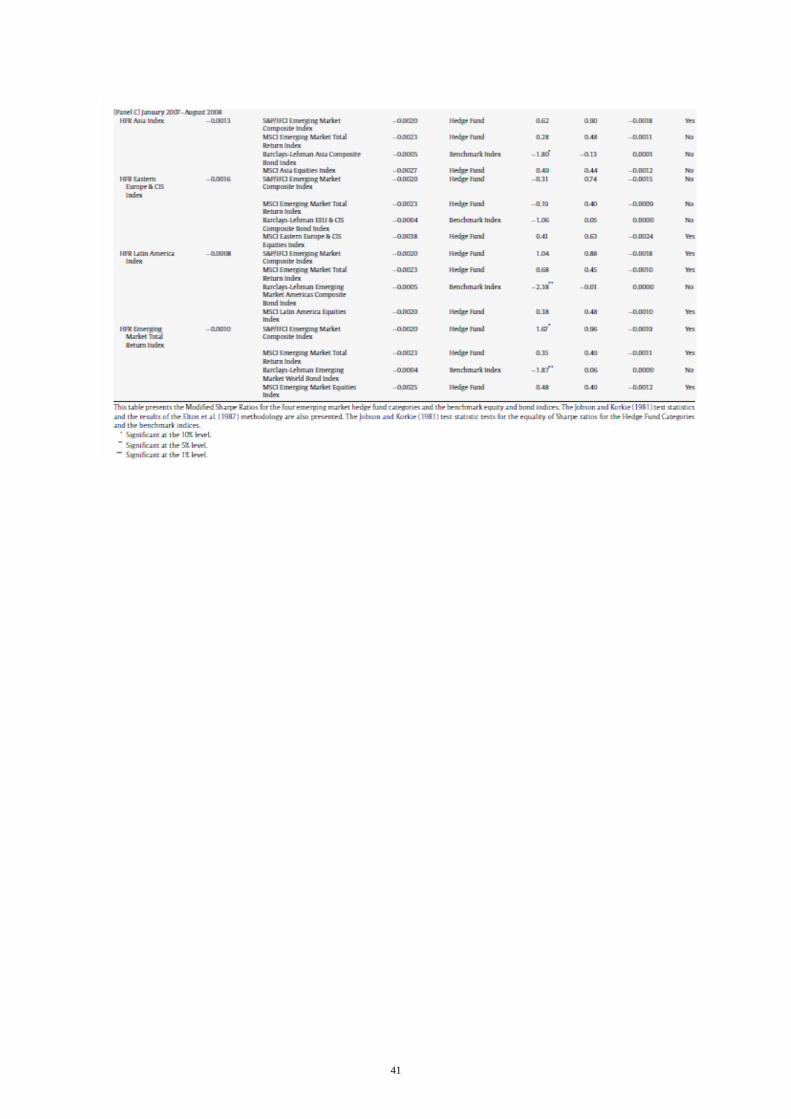
41
Top Related