


Languages
Pages
Legal


University of Wisconsin MilwaukeeUWM Digital Commons
Theses and Dissertations
May 2016
Making Test Batteries Adaptive By UsingMultistage Testing TechniquesWen ZengUniversity of Wisconsin-Milwaukee
Follow this and additional works at: https://dc.uwm.edu/etdPart of the Educational Assessment, Evaluation, and Research Commons, and the Educational
Psychology Commons
This Dissertation is brought to you for free and open access by UWM Digital Commons. It has been accepted for inclusion in Theses and Dissertationsby an authorized administrator of UWM Digital Commons. For more information, please contact [email protected].
Recommended CitationZeng, Wen, "Making Test Batteries Adaptive By Using Multistage Testing Techniques" (2016). Theses and Dissertations. 1236.https://dc.uwm.edu/etd/1236

MAKING TEST BATTERIES ADAPTIVE BY USING MULTISTAGE TESTING
TECHNIQUES
by
Wen Zeng
A Dissertation Submitted in
Partial Fulfillment of the
Requirements for the Degree of
Doctor of Philosophy
in Educational Psychology
at
The University of Wisconsin-Milwaukee
May 2016

ii
ABSTRACT
MAKING TEST BATTERIES ADAPTIVE BY USING MULTISTAGE TESTING
TECHNIQUES
by
Wen Zeng
The University of Wisconsin-Milwaukee, 2016
Under the Supervision of Cindy M. Walker
The objective of this dissertation research is to investigate the possibility to improve both
reliability and validity for test batteries under the framework of multi-stage testing (MST). Two
test battery designs that incorporate MST components were proposed and evaluated, one is a
multistage test battery (MSTB) design and the other is a hybrid multistage test battery (MSTBH)
design. The MSTB design consists of three tests: The first test used the AMI (approximate
maximum information) method as the routing strategy; and as for the second and third, the
“On-the-Fly” strategy (OMST) was employed. The MSTBH design also consists of three tests;
the first two are administered via MST while the third one via CAT.
This dissertation presents a new test battery design by combining the strengths from
different testing models. To improve estimation precision, each subsequent test in the test battery
for an examinee was assembled according to the examinee’s previous ability estimate. A set of
simulation studies were conducted to compare MSTB, MSTBH with two baseline models for
both measurement accuracy and test security control under various conditions. One of the
baseline models is a MST design consisting of three MST procedures without borrowing
information from each other’s; the other is a computerized adaptive test battery (CATB) design
consisting of 1 to 3 CAT procedures, being the second and the third procedures borrowing

iii
information from the previous ones. The results demonstrated that the test battery designs
yielded better measurement accuracy when considering previous subtest score as a predictor for
the current subtest. All designs yielded acceptable mean exposure rates, but only the CATB
design had ideal pool utilization. Finally, the discussion section presents some limitations on
current studies

iv
© Copyright by Wen Zeng, 2016
All Rights Reserved

v
To
my parents

vi
TABLE OF CONTENTS
ABSTRACT ............................................................................................................................. ii
LIST OF FIGURES .................................................................................................................. viii
LIST OF TABLES ..................................................................................................................... ix
ACKNOWLEDGEMENTS .......................................................................................................... x
I. INTRODUCTION ............................................................................................................... 1
II. LITERATURE REVIEW ....................................................................................................... 7
Computerized Adaptive Testing (CAT) .............................................................................................7
Item Pool Framework ........................................................................................................................... 8
Item Selection Algorithms and Ability Estimate Methods ................................................................... 8
Multistage Testing (MST) .............................................................................................................. 11
Important Components of Building MSTs .......................................................................................... 12
Practical Issues to be Addressed ................................................................................................... 19
Item Exposure Control ........................................................................................................................ 20
Item Pool Stratification ....................................................................................................................... 20
Evaluation Index ................................................................................................................................. 22
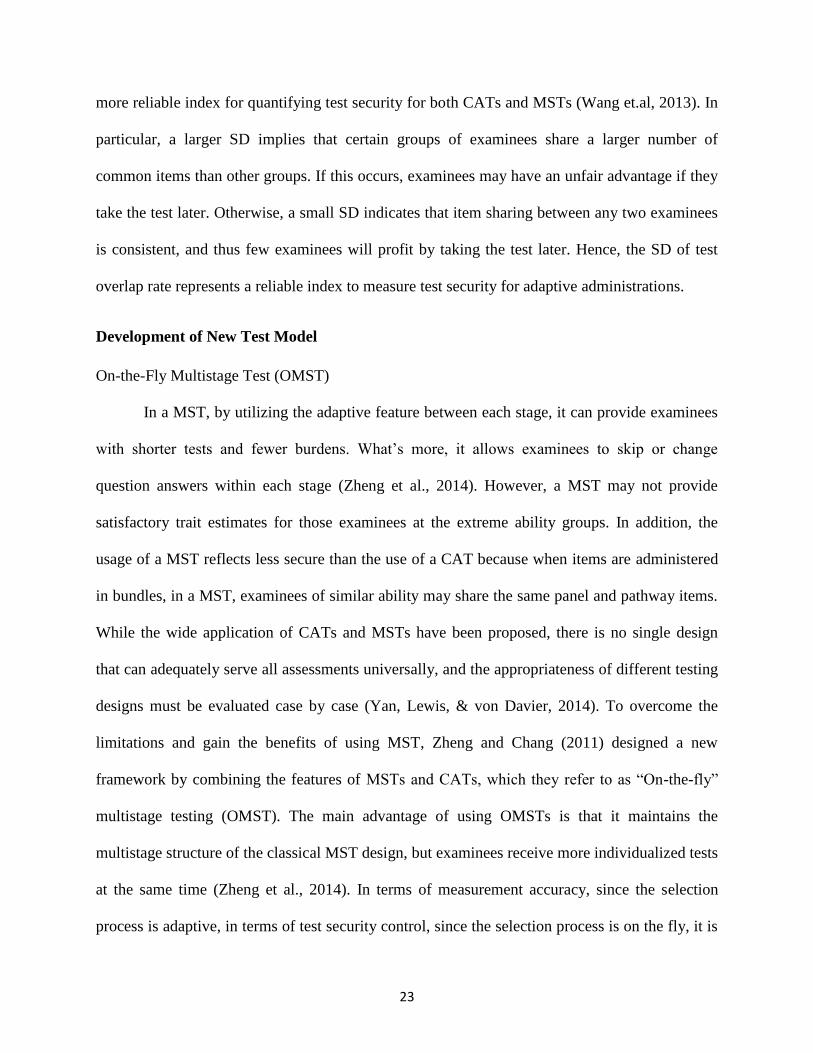
Development of New Test Model ................................................................................................. 23
On-the-Fly Multistage Test (OMST) .................................................................................................. 23
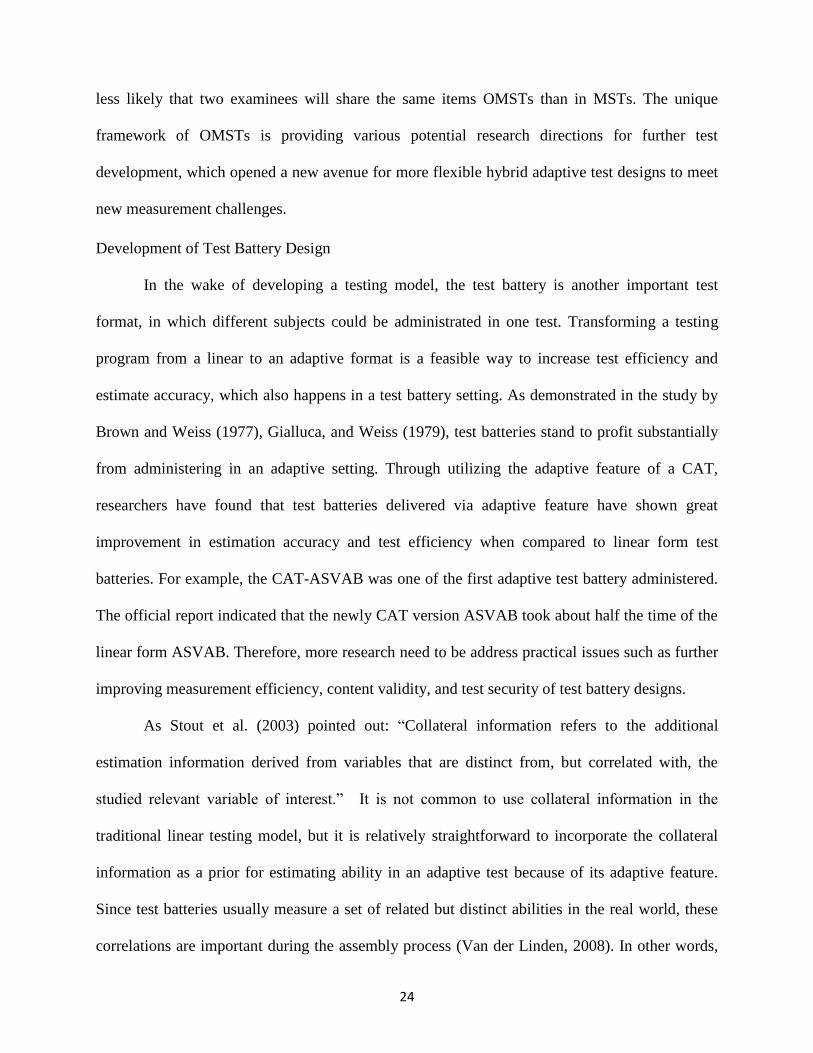
Development of Test Battery Design .................................................................................................. 24
Summary of Previous Studies ....................................................................................................... 26
Statement of Question ................................................................................................................. 31
II. METHODOLOGY ............................................................................................................ 33
Design of Overview ...................................................................................................................... 33
Item Pool Framework ......................................................................................................................... 34
Test Sequence ..................................................................................................................................... 36
Manipulated Conditions ...................................................................................................................... 37
Data Generation .................................................................................................................................. 37
Test Battery Simulation Study ....................................................................................................... 38
Multistage Test Battery (MSTB) Design ............................................................................................ 38
MST Procedure Design ....................................................................................................................... 39
Test Administration ............................................................................................................................ 46
OMST Procedure Design .................................................................................................................... 46
vii
Hybrid MSTB (MSTBH) Design ........................................................................................................ 48
Baseline Models Simulation Study ................................................................................................ 49
CATB Design ...................................................................................................................................... 49
Data Analysis ............................................................................................................................... 50
Measurement Precision ....................................................................................................................... 50
Test Security ....................................................................................................................................... 50
IV. RESULTS ...................................................................................................................... 51
Measurement Precision ................................................................................................................ 53
Test Security Properties ................................................................................................................ 59
V. DISCUSSION ................................................................................................................ 65
Conclusions .................................................................................................................................. 65
Limitation and Directions for Future Research ............................................................................... 68
REFERENCES ........................................................................................................................ 70

viii
LIST OF FIGURES
Figure 1.1: Structure of a 1-3-3 MST Design ............................................................................................... 3
Figure 1.2: General Procedure of OMST Strategy, Zheng & Chang (2014) ................................................ 5
Figure 3.1: Construct of the MSTB Design ................................................................................................ 39
Figure 3.2: Structure of 1-2-4 MST test ...................................................................................................... 40
Figure 3.3: Module Information Curves for the three-stage MST under “12-6-6” condition. .................... 43
Figure 3.4: Module Information Curves in a panel for the three-stage MST under “12-6-6” condition .... 44
Figure 3.5: Pathway Information Curves in the three-stage MST module ................................................. 45
Figure 3.6: Construct of the MSTBH design .............................................................................................. 48

ix
LIST OF TABLES
Table 3.1: General Framework of All Designs ........................................................................................... 34
Table 3.2: Descriptive Statistics for Three Item Pools ............................................................................... 35
Table 3.3: Item Parameter for Each Content Constraint ............................................................................. 35
Table 3.4: Inter-correlation of three tests .................................................................................................... 36
Table 3.6: Anchor Points for Each Test ...................................................................................................... 49
Table 4.1: RMSE and CCR of the estimated θ ........................................................................................... 55
Table 4.2: Statistics of Item Exposure Rates .............................................................................................. 60
Table 4.3: Item Usage Rate ......................................................................................................................... 61

x
ACKNOWLEDGEMENTS
This dissertation would not have been possible without the help of so many people. First, I
would like to express my great appreciation to my advisor, Dr. Cindy M. Walker, for recognizing
my potential in the field of Educational Statistics and Measurement studies. I have always
appreciated her knowledge, plus offering very helpful strategies for my dissertation. Second, I
wish to acknowledge the help provided by Dr. Bo Zhang, Dr. Razia Azen and Dr. Timothy Hass.
I am particularly grateful for their helpful comments and feedbacks during the time when I was
writing my dissertation. Third, tremendous thanks to Dr. Hua-hua Chang who provided me with
very valuable and professional advice, and offered his perspective on ways to tie my research to
the latest measurement development. Last but not the least; my special thanks are extended to
Haiyan Lin, PhD. from ACT, Inc. for inspiring my interests in this dissertation topic and sharing
her experiences and knowledge with me, plus for assisting with the collection of my data.
I could never finish this dissertation without the love of my parents and my fiancé. Your
support and blessings always gives me courage to overcome all difficulties. I love you!
1
I. INTRODUCTION
Under the Race to the Top initiative, two promising testing models have been endorsed:
linear tests and Computer-based tests (CBT). Over the past few decades, paper and pencil (P&P)
was the most commonly used format of linear tests. With the development of the computer, CBT
has become popular in current testing systems. CBT can be either linear or adaptive. During a
linear CBT test, all examinees take the same items and the ability of each examinee is going to
be obtained by examinees’ performance on these items, which leads to less accurate estimates.
During an adaptive CBT test, examinees take different items according to their ability levels.
Thus, adaptive CBTs have been widely used in recent assessment tests because they show more
efficient and precise measurement of examinees’ performance (Hendrickson, 2007; Lord, 1980).
Computerized Adaptive Testing (CAT) and Multistage Testing (MST) are two major test models
in adaptive CBTs. In particular, a CAT is designed to select each item from an item pool
according to each examinee’s current ability estimate, and then update that estimate after each
item response. In other words, the administration test algorithm of this procedure is framed to
adapt at the item level to choose an item with a difficulty parameter that is near the current
estimate of an examinee’s ability. Ability estimates are updated after each item response, and this
step is repeated until a stopping criterion is met. In practice, many applications have adopted
CAT designs because it can provide the more precise measurement for all examinees than linear
tests can provide (Hendrickson 2007; Lord 1974; Wainer, Kaplan, & Lewis, 1992). Another
important CBT model is MST. The main difference between MSTs and CATs is that in a MST,
examinees always receive a set of pre-assembled items that are matched to their provisional

2
ability estimates (Hendrickson, 2007), but in a CAT, only a single item is selected to match the
ability estimates.
Usually, a MST is composed of several stages, and, within each stage, several bundles of
items are pre-assembled before test administration. Each module is constructed based on item
difficulty levels so that the information for a particular ability level can be maximized. Once all
of the modules are pre-assembled, the modules in different difficulty positions can be bundled
together in a unit called “panel”. Figure 1 illustrates a 1-3-3 MST design (e.g., Luecht, Brumfield
& Breithaupt, 2006; Zenisky, 2004). It is a MST design that includes three stages and ten parallel
panels. Each panel includes seven modules varying difficulty. In addition, there are seven
available pathways for each examinee; they are 1M+2H+3H, 1M+2H+3M, 1M+2M+3H,
1M+2M+3M, 1M+2M+3E, 1M+2E+3M and 1M+2E+3E. Specifically, “1” represents first stage,
“2” and “3” represent second and third stage, respectively. The E, M, and H represent the
difficulty level easy, medium, and hard, respectively. To prevent examinees from making
extreme jumps between difficulty levels, 1M+2H+3E and 1M+2E+3H pathways are not possible
paths. There can be many parallel panels in MST. However, once a panel is selected for
administration to an examinee only those items within that particular panel will be administered
to that examinee. During test administration, each examinee is administered one of the parallel
panels starting with a module of medium difficulty in stage 1 at random. This stage is called the
routing stage. After the first module is finished, one of the modules in stage 2 is administered
depending on the examinee’s current proficiency estimation. As shown in Figure 1.1, there are
three modules (2H, 2M, and 2E) in stag2, varying by their item difficulties. Once stage 2 is
finished, similar routing process will be used for routing examines from stage 2 to stage 3. The
final ability estimate for each examinee is based on his or her responses to the whole test. The

3
unique feature of pre-assembling items at the stage-level allows better test quality control while
sustaining the measurement advantages of CATs (Patsula 1999; van der Linden & Glas 2010).
Therefore, considerable attention has been paid to MST designs.
Figure 1.1: Structure of a 1-3-3 MST Design
To conduct the performance of different test models, several studies have compared the
benefits of CATs and MSTs (e.g., Kim & Plake, 1993; Luecht et al., 1996; Patsula, 1999).
Previous studies concluded the major advantage of a CAT is that more efficient latent trait
estimates are obtained with fewer items than would be required in linear tests, but the major
advantage of a MST is that it provides a relatively lower chance of getting unreliable ability
estimates when estimating examinees’ latent traits based on a group of items. Since each kind of
test model has its advantages and disadvantages, rather than selecting between only CAT and
Module

4
MST, researchers have been trying to find a new framework to overcome the limitations and
improve the benefits of these two models at the same time. Zheng and Chang (2014) proposed a
multistage assembly paradigm called “On-the-Fly” multistage (OMST) adaptive testing, which
merges a CAT and a MST into one big flexible framework. In an OMST, instead of assembling
all modules and panels before the test, a group of items is contiguously selected based on
examinees’ current ability estimate and administered together after the selection. One OMST can
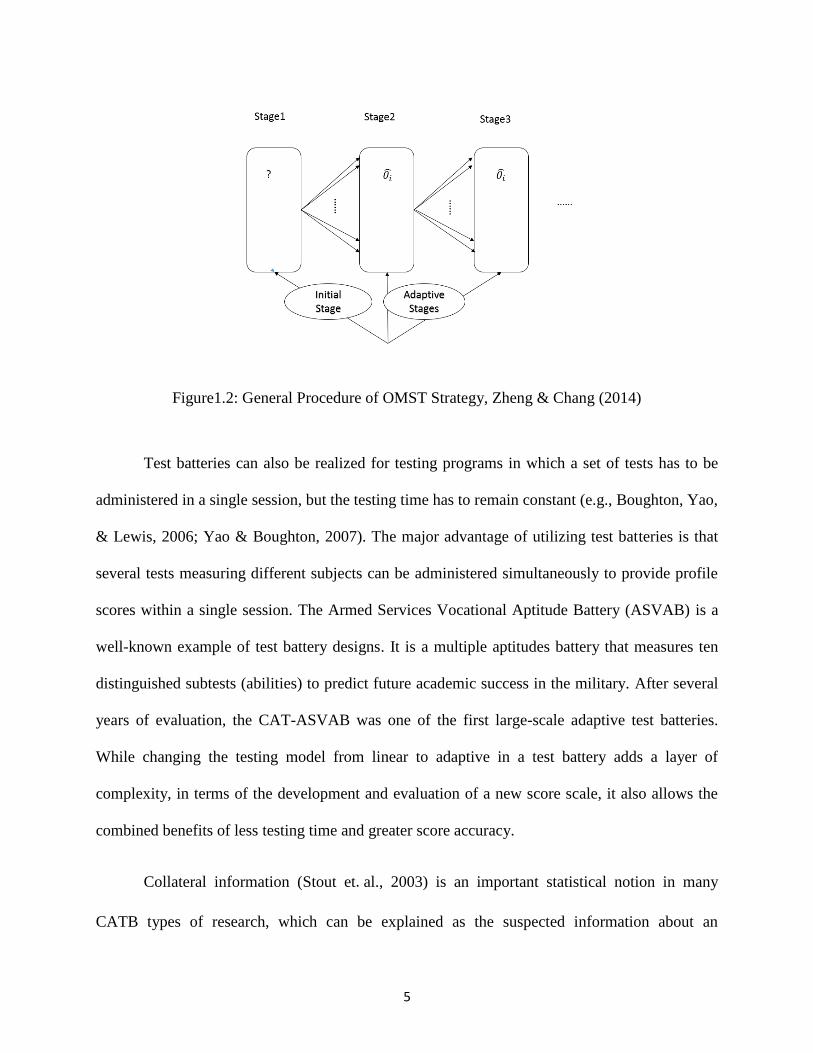
include multiple stages according to the administration goal. Figure 1.2 illustrates the general
process of an OMST obtains three stages. First, each examinee is administered one of the
preassembled module that provides moderate difficulty level, and then the initial ability estimate
is updated based on the responses of the certain module. Second, after completing stage 1, an
individualized module is assembled at stage 2 for the examinee, based on his or her initial ability
estimate. Third, the stage3 is assembled based on the examinee’s updated ability estimate from
stage 2. Finally, repeating this process until the whole test completed. As stage length decreases,
an OMST transforms smoothly from a MST to an adaptive format, and researchers treat this kind
of design as a hybrid design. Given that not much information about an examinee’ s ability level
can be provided at the beginning of a test, there are substantial measurement errors in the early
stages of a CAT. In an OMST, rather than maximizing test information for each single item,
optimizing the test information within an interval around the provisional ability estimate can
decrease measurement errors, especially those obtained early in the test administration phase.
5
Figure1.2: General Procedure of OMST Strategy, Zheng & Chang (2014)
Test batteries can also be realized for testing programs in which a set of tests has to be
administered in a single session, but the testing time has to remain constant (e.g., Boughton, Yao,
& Lewis, 2006; Yao & Boughton, 2007). The major advantage of utilizing test batteries is that
several tests measuring different subjects can be administered simultaneously to provide profile
scores within a single session. The Armed Services Vocational Aptitude Battery (ASVAB) is a
well-known example of test battery designs. It is a multiple aptitudes battery that measures ten
distinguished subtests (abilities) to predict future academic success in the military. After several
years of evaluation, the CAT-ASVAB was one of the first large-scale adaptive test batteries.
While changing the testing model from linear to adaptive in a test battery adds a layer of
complexity, in terms of the development and evaluation of a new score scale, it also allows the
combined benefits of less testing time and greater score accuracy.
Collateral information (Stout et.al., 2003) is an important statistical notion in many
CATB types of research, which can be explained as the suspected information about an

6
examinee's ability measured by one test that is suspected based on the examinee’s responses to
items on other tests. Since many test batteries include a cluster of different subjects but strongly
related, such as a battery consisting of a mathematics subtest and a logical skill subtest, the
amount of collateral information among these subtests can be substantial and these correlations
should not be ignored (van der Linden, 2010). Therefore, the collateral information among
different subtests is useful component to improve measurement accuracy in test batteries.
Moreover, the amount of collateral information relates to the strength of the correlation among
the tests within the battery. These high correlations imply that the performance on one test is a
good predictor of ability for the remaining tests (Wang et al., 2012). Some other positive findings
associated with the use of test batteries include the enhanced feasibility of administration,
decreased testing cost, and reduced examinees’ testing burden (e.g., Boughton, Yao, & Lewis,
2006; Yao & Boughton, 2007).
Since MST has become one of the most prominent testing models used in large-scale
state assessments, it is interesting and important to extend such study to battery formats.
Therefore, the primary purpose of this study was to investigate the possibilities to making test
batteries adaptive by using multistage testing techniques. Although many testing programs have
effectively used both CATs and MSTs, the usage of using these procedures within the context of
administering test batteries is not well developed. Another purpose of this dissertation was to
investigate if the reliability and validity of the administration of a test battery could be improved
by utilizing different testing models. Two battery designs were constructed; a MST battery
design (MSTB) and a hybrid MST battery (MSTBH) design. The MSTB design was
administered using three highly correlated tests with multistage design. The MSTBH also

7
consisted of three tests. However, the first two tests were administered as multistage tests while
the third one was administered as an adaptive test.
II. LITERATURE REVIEW
The following literature review describes the background and previous researches
relevant to this dissertation. The first section involves an overview of conceptions and
technologies that related to traditional CAT and MST designs. The second section focuses on
introducing the practical issues that need to be address in adaptive test designs. The third section
reviews the development of test batteries and some issues that emerged from large-scale
implementation. The final section summarizes some previous studies and emphasizes the
research questions of this dissertation.
According to Lord (1970), the most effective test should provide neither too difficult nor
too easy items for examinees. To obtain certain goal, researchers are continuously looking for
applied testing models for educational scale testing. Among them, numerous studies proposed
the performance of using CATs and MSTs. In the following section, commonly used techniques
in CAT designs will be reviewed first; subsequently the development of MST designs will be
described.
Computerized Adaptive Testing (CAT)
A CAT is a prominent testing model of test administration that has been widely applied
in large-scale educational assessment, such as the Graduate Management Admission Test
(GMAT) and the National Council of State Boards of Nursing (NCLEX). The main difference
between a CAT and a linear test is that each item in a CAT is selected sequentially according to
the current performance of an examinee; while in a linear test, each examinee takes the same
preassembled items in the same order, and the final estimate of ability is based on the answers of

8
these items. Based on the adaptive feature, the item selection process of CAT tailors a test to
each examinee according to his or her ability level. Particularly, if the examinee answers an item
correctly, the next item should be more difficult. Otherwise, the next item should be easier. On
the one hand, CATs reflect several distinct features compared to linear tests. First, they provide
higher or equivalent measurement precision with shorter tests when compared with conventional
linear tests, especially for examinees with extreme ability levels (e.g., Lord, 1974; Loyd, 1984;
Weiss, 1982). On the other hand, CATs also have some potential problems, such as lacking the
review opportunity for examinees within tests; and requiring relatively complicated item
selection algorithms to satisfy content balance and control item exposure rates for test security
(e.g., Hambleton, Swaminathan, & Rogers 1991; Hendrickson 2007; Vispoel 1998; Wainer &
Kiely 1987). Several components need to be considered when designing CATs, including having
a feasible item pool, appropriate item selection algorithms, and ability estimation methods.
Item Pool Framework
In a computer-based test, an item pool contains numerous items that are calibrated based
on a particular distribution (Weiss & Kingsbury, 1984). An ideal items pool is designed for
examinees of average ability levels and as well as those have extreme ability levels. According to
Bergstrom & Lunz (1999) and Parshall et al. (2002), many components can influent item pool
size, including content areas, test length, the size of examinee population, and many
psychometric properties of items.
Item Selection Algorithms and Ability Estimate Methods
The Maximum Fisher Information method (MFI, Thissen & Mislevy, 2000) is one of the
most commonly used item selection method in CAT designs. The main goal of this method it is
to accumulate as much test information (TI) as possible in the most efficient manner (Parshall et

9
al., 2002). During the processing of MFI, an item j will be selected if it obtains the maximum
Fisher item information on the corresponding 𝜃 scale, defined as
𝐼𝑗(𝜃) =[𝜕𝑃𝑗(𝜃)
𝜕𝜃]
2
𝑃𝑗(𝜃)[1 − 𝑃𝑗(𝜃)]
(1)
In addition, since the contribution of each item to the total information is additive, then the
Fisher test information is equal to the sum of all Fisher item information, which is denoted as
𝑇(𝜃) = ∑ 𝐼𝑗(𝜃)
𝑛
𝑗=1
(2)
To maximize Fisher information is to match the item difficulty parameter directly with the latent
trait level of a test taker. The MIF approach has become one of the most popular item selection
algorithms for the last three decades. Alternative selection algorithms for item selection include
the approximate Bayes procedure (Owen, 1969, 1975), the maximum global information
criterion (Chang & Ying, 1996). The ability estimation methods in CAT designs include
maximum likelihood estimation (MLE; Birnhaum, 1968), expected a posteriori (EAP; Bock &
Mislevy, 1982), maximum posteriori (MAP; Samejima, 1969). Among them, MLE and EAP are
two most commonly used methods.
Maximum Likelihood Estimate (MLE) Method
In the 3PL-IRT (Birnbaum, 1968) model, the probability of a correct response on a
dichotomously scored item i at ability level theta is defined by
𝑃𝑖(𝜃) = 𝑐𝑖 +1 − 𝑐𝑖
1 + exp [−𝐷𝑎𝑖(𝜃 − 𝑏𝑖)] (3)

10
where D is the scaling constant equal to 1.702, and 𝑎𝑖, 𝑏𝑖, 𝑐𝑖 are the discrimination parameters,
difficulty parameter, and guessing parameter of item i, respectively. To introduce random error,
this probability was compared against a randomly generated value between 0 and 1 from the
uniform distribution. An examinee received a score of 1 if the random value was less than or
equal to the probability; otherwise the examinee received a score of 0. The likelihood estimation
is obtained by maximizing the following likelihood:
L(θi) = P(Y|θi) = ∏ Pij(θi)YijQij(θi)
1−Yij
j
(4)
where L(θi) denote the probability of observing the set of item response; Yij denotes the
response matrix, which contains the response of each item;
Yij = {1, if the examinee i gave correct response on item j
0, otherwise, (5)
In addition, 𝑃𝑖𝑗(𝜃𝑖) denotes the conditional probability of examinee i answering item j
correct given that the examinee’s ability level is 𝜃𝑖 , in contrast, 𝑄𝑖𝑗(𝜃𝑖) represents the
conditional probability of examinee i answering item j incorrect given that the examinee’s ability
level is 𝜃i.
To search for the solution of theta that maximizes the likelihood, first, taking the natural
logarithm on both sides of Equation (4) gives
L=Log [(θ|u)]=∑ ∑ YijJj=0 logPij(θ)m
i=1 (6)
The Newton-Raphson equation for estimation ability at iteration t is given by
[θ]t = [θ]t−1 −L′
L′′ (7)

11
Expected A Posteriori (EAP) Method
The EAP method uses the mean of the posterior distribution as examinees’ ability
estimates. It follows the Bayes’ theorem: posterior distribution ∝ likelihood function×prior
distribution (Chen & Choi, 2009).
P(θ|u) =P(u|θ)P(θ)
∫ 𝑃1
−1(u|θ)dθP(θ)
(8)
where P(𝜃) represents the prior information of 𝜃 and 𝑃(𝜃|𝑢) is the posterior distribution of
given u which is frequency data of two variables. 𝑃(𝑢|𝜃) is the same likelihood function L in
the ML method.
Then, the EAP (i.e., the mean of the posterior distribution) can be simply expressed as:
ρEAP = ∫ θP(θ|u) dθ1
−1
(9)
Then, Equation (9) can be re-expressed as:
P(θ|u) =P(θ)P(u|θ)
∑ 𝑃𝑘𝑖=1 (𝜃𝑖)P(u|𝜃𝑖)
(10)
ρEAP = ∑ 𝜃𝑖P(𝜃𝑖|u)𝑘
𝑖=1
(11)
Both the MLE procedure and the EAP procedure have been applied in the studies of many CATs
(e.g., Chang & Ying, 1999; Chen et al., 1997).
Multistage Testing (MST)
A MST is a compromise between a CAT and a traditional linear test (Jodoin et al., 2006),
in which the adaptive feature occurs at the level of stages instead of the level of individual items.
Therefore, MSTs have become a prominent testing model, especially since some assessments
have switched from CAT versions to the MST versions, such as the National Assessment of

12
Educational Progress (NAEP) and the Graduate Record Examinations (GRE). After various
research and development, it has been determined that MSTs have some advantages over CATs.
First, since a MST’s routing algorithm only happens between stages, it allows examinees to go
back to review questions within their current stage. Therefore, examinees may feel less stress
during the test. Second, rather than simply relying on the adaptive algorithm, the pre-assembled
structures of stages and modules in MSTs allow test developers to review items prior to test
administration (e.g., Wainer & Kiely, 1987; Luecht & Nungester, 1998; Wainer, 1990). As
Wainer & Kiely (1987) summarized “(multistage) testlets are a scheme that can maintain the
CAT advantages while still using the wisdom of experts.” However, compared to CATs, MSTs
also have some disadvantages, such as less accuracy in proficiency estimation and less efficiency
(e.g., Kim & Plake 1993; Loyd 1984; Luecht and Nungerster 1998).
Important Components of Building MSTs
Modules, panels, and pathways are the three basic components of any MST design
(Luecht, 2000). In particular, a module is composed of a set of items that stand on particular
content specifications or reliability requirements (Wainer & Kiely, 1987), such as content
balancing or maximizing the test information function at a particular theta value. After grouping
items into different modules based on distinguishing difficulty levels, distinct modules are
further grouped into different paths to optimize parallel forms for all possible routes. These
routes refer to panels. Usually, one MST can have several parallel panels that contain different
items but reflect the same objective ability level. Pathways are all possible sequences of certain
modules to which examinees may assign (Luecht & Nungester; 1998). When pre-assembled all
modules and panels, the adaptive nature of MSTs allows the routing decision between stages to
occur through different pathways. For instance, if an examinee gets a high estimated ability level
after finishing the first module, he or she will be routed to a pathway leading to a relatively hard

13
module at next stage. Otherwise, he or she will be routed to a pathway leading to a relatively
easy module at next stage. The first stage of a MST design can be referred to as the routing
stage (Kim & Plake, 1993), and increasing the length of the first-stage modules is an effective
way to reduce proficiency estimation errors. Similar to the design of a CAT, there are various
decisions that need to consider before implementing a MST. Overall, the complicated framework
of any particular MST design starts with determining a wide variety of test design elements,
including the number of stages, the number of alternative modules and items in each stage, and
the difficulty anchor and target information setting(e.g., Breithaupt, Ariel, & Veldkamp 2005;
Zheng et al., 2012).
Number of Stages
Two-stage and three-stage designs are the two commonly used MST structures. For
example, a two-stage design structure includes one routing stage and one measurement stage for
each examinee. During the administration process, since there is only one decision point about
how to route examinees, it is possible that some examinees are unable to recover if the decision
is made inappropriately (Zenisky, Hambleton, & Luecht, 2010). Therefore, unitizing a three- or
four-stage design structure, instead of a two-stage structure, in a MST is an appropriate way to
overcome this disadvantage (Pastula, 1999; Hendrickson, 2007), but the increase the number of
stages should be done under the control of balancing the content specifications and the
complexity of the test structure (Luecht et al., 1996; Luecht & Nungester, 1998).
Length of Modules and Number of Items
Patsula (1999) found that increasing the number of modules from three to five in later
stages could increase the accuracy of ability estimation, but at the expense of increasing the
complexity of the MST. Therefore, to balance the measurement precision with the complexity of
14
the test structure, it is important to consider the number of modules per stage in MST designs.
According to Loyd (1984) and Kim & Plake’s (1993) findings, administering a longer first-stage
module can provide more information in the routing decision for the following stages, which
results in a positive impact on the measurement precision of MST designs. In summary, the
length of the modules should vary across the stages, depending on the specifications of a test.
As noted in Figure 1.1, the three stages 1-3-3 structure is a common implementation of a MST
design.
Anchor Points for Modules
Modules are groups of items that built together to meet specific anchor points. Among
them, the test information functions (TIFs) is a commonly used target anchor points format.
Since it is hard to control the TIF at every point along the ability scale, test developers always
focus on deciding a few discrete ability points to identify certain critical ability levels (van der
Linder & Boekkooi-Timminga, 1989). In classification tests, the final classification boundaries
provide natural anchors points, such as easy, moderate and hard modules (Luecht & Nungeter,
1998). Thus, the TIF values can be set to maximize the information at those boundaries. The
most commonly used approach is to maximize the TIF at the corresponding difficulty anchors
through assembling several alternative forms for each module sequentially. The optimized TIF
values are calculated by averaging all the values of the assembled alternative forms (Luecht
2000; Luecht & Burgin 2003; Zheng et al. 2012). Choosing appropriate methods for technique
design is the next important component of MST designs. This includes the selection of test
assembly methods, panel assembly methods, and routing methods.
Test Assembly Methods
The automatic test assembly (ATA) process is commonly used for module assembly. The
15
primary goal of ATA algorithms is to optimize the information obtained for examinees by
matching their estimate of ability to the average item difficulty within the module. There are two
kinds of ATA methods: linear programming methods (e.g., van der Linden, 2005) and heuristic
methods (e.g., Swanson & Stocking, 1993; Luecht, 1998; Cheng & Chang, 2009). Linear
programming methods try to find a single optimization procedure to assemble all test forms
simultaneously. In contrast, the heuristic methods separate test assembly into several local
optimization problems, and sequentially solve them one by one (Acherman, 1989). Among all
heuristic methods, the normalized weighted absolute deviation heuristic method (NWADH;) has
been readily adapted to build multiple test forms for MSTs (e.g., Luecht & Nungester, 1998;
Patsula, 1999; Hambleton & Xing, 2006; Jodoin et al., 2006; Zheng et al., 2012). The unique
feature of the NWADH is that it treats all constraints as targets and normalizes the deviations for
each constraint (Yan et al., 2014). The statistics constraints usually include item-test correlations
and information functions, which are functionally, related to one or more target measurement
properties for specific test (Luecht & Hirsch, 1992; Stocking, Swanson, & Pearlman, 1993). The
non-statistical constraints represent the test-level constraints that built the test specifications,
such as the required frequencies or proportions of item from different subject areas, item type
codes, and item author identification codes. The main advantage of normalization is that dividing
the di variables by their sum over all eligible items transforms the absolute different function into
a proportional quantity. Hence, many different types of criterion can be treated simultaneously to
minimize the potential effects.
For a test includes n items, i=1,2 ,.., I denote one of the I items in the item bank; j=1,2,..,J
denote one of the J items needed to be selected into each optimization model; n=1,2,.., N denote
one of the N constraints; 𝑇𝑛 denotes all the constraints target function of the test. Therefore, to
select the 𝑗𝑡ℎ item to the test, the item selection process is managed to maximize the objective

16
function.
∑ eixi
I
i=1
(12)
and Equation 12 is explained through Equation 13 to Equation 18.
∑ xi = j
I
i=1
(13)
xi1 = xi2 = ⋯ = xij−1=1 (14)
xi ∈ {0,1}, i=1,…,I (15)
The local normalized absolute deviation for each candidate item t in the remaining item
pool is calculated by
ei =1-di
∑ dii∈Rj−1
, i∈ Ri−1 (16)
and
di=|(T−∑ ukxk
Ik=1
n−j+1) − ui| i∈ Ri−1 (17)
where 𝑅𝑖−1 is defined as a set of indexes for the remaining items in the item pool after
excluding the selected items. 𝑑𝑖 is defined as the absolute difference between the candidate
item’s contribution under the control of constraint T and the contribution necessary for each
remaining item to achieve the target, then the item with the smallest normalized absolute
deviation, 𝑒𝑖, will be selected into the test. As each new item is selected, the current value of
the target function after removing previously selected item is calculated by
T − ∑ ukxkIk=1
n − j + 1 (18)
17
Panel Assembly Methods
Two major strategies for achieving parallelism across panels are referred to as the
“bottom-up” approach and the “top-down” approach (Luecht & Nungester, 1998). In the
“bottom-up” panel assembly approach (e.g., Luecht, Brumfield & Breithaupt, 2006), parallel
forms of each module are first assembled and then mixed-and-matched to build parallel panels,
which results in panels that are constructed according to module-level specifications (Keng,
2008) to satisfy statistical targets. Hence, all modules are independent of one another and
exchangeable regarding the statistical specifications (e.g., item difficulty, item discrimination,
module information) across panels. In the “top-down” approach, all panels are built based on
test-level specifications (e.g., content coverage), which means that modules are dependent on one
another and must be combined to satisfy the specification table for the whole test. In addition to
use the “bottom-up” or “top-down” approach individually, they can be utilized together in one
design as well (e.g., Guo et.al, 2012). If both statistical and non-statistical constraints are
imposed in one MST design, the “bottom-up” approach can be used to assemble the test
regarding the statistical constrain such as, test information function; therefore, modules at the
same difficulty level are exchangeable based on the modules information to match the statistical
constraints. Meanwhile, the “top-down” approach can be used to assemble the test in terms of the
non-statistical constrain such as the content specification.
In MSTs, in addition to assigning modules and panels appropriately, it is also important
to ensure a balanced representation of content and exposure control when assembling a MST. To
control the distribution of item characteristics, there may need to be a large number of constraints
to identify all item properties and algorithms for item selection must incorporate all of these
constraints. The content balancing will occur at the module-level if use the “bottom-up” method.

18
The content balancing will occur at the test-level by obtaining the proportional distribution of
each content area if use the “top-down” method. Therefore, in the case of a MST, test developers
can preassemble test forms to control both statistical and non-statistical constraints by taking
advantage of assembly processes from both linear tests and CATs, prior to test administration.
Routing Methods
The main propose of routing in MSTs is to classify examinees to different next-stage
modules based on their current performances. The approximate maximum information method
(AMI; Leucht, Brumfield, & Breithaupt, 2006) is a commonly used routing strategy in MST
designs. This method is analogous to the maximum information criteria used in CAT designs,
which routes examinees to a module providing the maximum information at the corresponding
theta scale. The main goal of using the AMI method is to identify the optimal decision point (θ)
on the theta scale for module selection by calculating the cumulative test information functions
(TIFs). This procedure routes examinees to a module that will provide the maximum
information. If an examinee’s current ability estimate is higher than the optimal decision point θ,
then the module located at a higher difficulty level provides more information. Likewise, if an
examinee’s current ability estimate is lower than optimal decision point θ, then the module
located at a lower difficulty level provides more information. Given that the way to route each
examinee appropriately is an important topic in MST designs; more studies that are systematic
need in the future (Stark & Chernyshenko, 2006).
Ability Estimate Methods
The same methods that CATs always use, such as MLE and EAP, can be applied to
MSTs as well. Numerous studies have conducted these two methods in MST researchers (e.g.
Davis & Dodd, 2003; Kim & Plake, 1993; Hambleton & Xing, 2006; Jodoin, 2003).
19
Practical Issues to be Addressed
As pointed out by Chang (2004), security gaps caused by item-sharing activities among
examinees are obviously, especially after the Kaplan-ETS incident happened in 1994 (Davey &
Nering, 2002). Afterwards, researchers also found that the results obtained from the GRE-CAT
did not produce reliable scores for thousands of examines in early 2000 (e.g., Carlson, 2000 &
Merritt, 2003). Therefore, with the wide recognition and implementation of the
computer-administered test, test security has been a major concern in large-scale educational
assessments. Usually, researchers apply item exposure rate and item usage rate to evaluate the
test security statement of a test. The item exposure rate is defined as the ratio of the number of
times an item is implemented to the total number of examinees (Stocking & Lewis, 1998); the
item usage rate is calculated the ratio of the number of items are administered and the total
number of items in certain item pool.
During the selection of CAT tests, items that contain high discriminant parameters
(a-parameters) always selected to maximize precision in estimating ability, and this leads to
uneven item exposure rates across all items because certain items with higher a-parameters tend
to be used more often than others (Chang & Zheng, 2007). This may lead to examinees that take
the test earlier may share information with those who take it later, which may increase the risk
that items may expose to many examinees before they take the test. Thus, addressing test
security issues in adaptive tests administrations is of great importance. For years, researchers
have proposed that item exposure control and content balancing as the two main ways of helping
to improve test security in adaptive tests.
20
Item Exposure Control
When using information-based item selection methods, some items might seldom
be unexposed, whereas other might never be exposed. Hence, items with high exposure rates can
decrease test security because these items may become popular to subsequent examinees. To
address this issue, researchers proposed several exposure control procedures (e.g. McBride &
Martin, 1983; Sympson & Hetter, 1985; Chang & Ying, 1996). Among them, the
Sympson-Hetter method (SH, Sympson & Hetter, 1985) is one of the most popular methods,
which can present reliable results for reducing over-exposure in CAT designs (Chang & Ying,
1999). The unique characteristic of the SH method is that it distinguishes item selection process
from item administration process through pre-setting an maximum exposure rate to limit the
exposure rates of all items. For CAT designs without considering the SH method, the probability
of selecting an item equals to the probability of administrating certain item. However, when
applying the SH method to CAT designs, the maximum exposure rate of all items is calculated to
determine if the selected item should be administered to the test. For example, in the maximum
fisher information item selection method with using SH algorithm, if the selection of item j for a
randomly sampled examinee denotes as 𝑆𝑗, then the administration of item j for this examinee
denotes as 𝐴𝑗 . Therefore, at a specific ability interval P(𝐴𝑖) represents the probability of
administering item i, P(𝑆𝑖) represents the probability of selecting item i, and P(𝐴𝑗|𝑆𝑗)
represents the probabilities of administering an item given its selection. Following the Equation
19, if item i meet this relationship between probabilities, it will be administered to the examinee.
Otherwise, item i+1 will be evaluated. The main strength of this method is that it is able to
maintain the maximum item exposure rates at a desirable level without sacrificing too much
measurement precision.

21
P(𝐴𝑖) = P(𝐴𝑗|𝑆𝑗)P(𝑆𝑖) (19)
Item Pool Stratification
Items with high a-parameters close to the examinee’s true ability and provide the most
information (Hambleton & Swaminathan, 1991). Therefore, item with high a-parameters are
always been administered during the selection process, which lead to the overexposure for these
items. To prevent overexposure of high a-parameter items and increase the item usage rate of
less often-administered items, Chang and Ying (1999) first suggested the a-stratified selection
method (AST) to control item exposure rates. Davey and Nering (2002, p. 181) wrote the
following: “Highly discriminating items are like a tightly focused spotlight that shines intensely
but casts little light outside a narrow bean. Less discriminating items are more like floodlights
that illuminate a wide area but not too brightly. The idea is to use the floodlights early on to
search out and roughly locate the examinee, and then switch to spotlights to inspect things more
closely.” This vivid explanation reflects the affirmation of using a-stratified method. Also,
evenly selecting all items in an item pool is a significant way to improve test security. The main
purpose of this method is to force items with a low discrimination parameter to be administered
at the beginning of the test where the accuracy of the ability estimation is low, thus saving highly
discriminating items to be administered at the end of the test where the estimation accuracy
increases. The item pool is partitioned into n strata by the a-parameter, with the smallest and
the largest a- parameter items.
Step1. The item pool is partitioned into n strata by the a-parameter, with the first and last strata
containing, respectively, the largest and the smallest a items.

22
Step2. Accordingly, the testing process is also partitioned into k stages to match the n item strata.
Step3. At the k-th stage, several items are selected from the k-th stratum. The examinee’s ability
is updated by the MLE. Then items of difficulty parameter equal to the estimated ability are
selected and administered as the next item.
Step4. Step 3 is repeated for k = 1 through k = n stages.
To further satisfy other constraints in a practical testing situation, researchers explored
the a-stratified design to also control the difficulty parameter (b-parameter), which is called
“a-stratified with b blocking” (Chang, Qian, & Ying, 1999). The basic idea of this method is to
force each stratum of the a-stratified design to have a balanced distribution of b-parameter
values. Moreover, to protect items from being overexposed to examinees, items are selected
and administered based on controlling content balance such as Yi and Chang (2003)’s method
that blocks content effect by a pre-stratification process; Cheng, Chang and Yi (2007)’s
procedure specifically deals with content balancing in CATs.
Evaluation Index
Researchers have suggested a variety of statistical indices to quantify test security, such
as item exposure rate, item usage rate, and item overlap rate. Recently, Wang, Zheng and Chang
(2014) proposed the use of the “standard deviation” (SD) to quantify the security of multistage
testing. The major difference between quantifying test security for a CAT, as opposed to a MST,
is that CATs select every item adaptively based upon examinees’ previous performance while
MSTs select preassembled modules and then administers the modules adaptively as a unit.
Therefore, CATs and MSTs can have different SDs for the distribution of test overlap rate even
if they have the same mean. Therefore, reporting the standard deviation of test overlap rate is a
23
more reliable index for quantifying test security for both CATs and MSTs (Wang et.al, 2013). In
particular, a larger SD implies that certain groups of examinees share a larger number of
common items than other groups. If this occurs, examinees may have an unfair advantage if they
take the test later. Otherwise, a small SD indicates that item sharing between any two examinees
is consistent, and thus few examinees will profit by taking the test later. Hence, the SD of test
overlap rate represents a reliable index to measure test security for adaptive administrations.
Development of New Test Model
On-the-Fly Multistage Test (OMST)
In a MST, by utilizing the adaptive feature between each stage, it can provide examinees
with shorter tests and fewer burdens. What’s more, it allows examinees to skip or change
question answers within each stage (Zheng et al., 2014). However, a MST may not provide
satisfactory trait estimates for those examinees at the extreme ability groups. In addition, the
usage of a MST reflects less secure than the use of a CAT because when items are administered
in bundles, in a MST, examinees of similar ability may share the same panel and pathway items.
While the wide application of CATs and MSTs have been proposed, there is no single design
that can adequately serve all assessments universally, and the appropriateness of different testing
designs must be evaluated case by case (Yan, Lewis, & von Davier, 2014). To overcome the
limitations and gain the benefits of using MST, Zheng and Chang (2011) designed a new
framework by combining the features of MSTs and CATs, which they refer to as “On-the-fly”
multistage testing (OMST). The main advantage of using OMSTs is that it maintains the
multistage structure of the classical MST design, but examinees receive more individualized tests
at the same time (Zheng et al., 2014). In terms of measurement accuracy, since the selection
process is adaptive, in terms of test security control, since the selection process is on the fly, it is
24
less likely that two examinees will share the same items OMSTs than in MSTs. The unique
framework of OMSTs is providing various potential research directions for further test
development, which opened a new avenue for more flexible hybrid adaptive test designs to meet
new measurement challenges.
Development of Test Battery Design
In the wake of developing a testing model, the test battery is another important test
format, in which different subjects could be administrated in one test. Transforming a testing
program from a linear to an adaptive format is a feasible way to increase test efficiency and
estimate accuracy, which also happens in a test battery setting. As demonstrated in the study by
Brown and Weiss (1977), Gialluca, and Weiss (1979), test batteries stand to profit substantially
from administering in an adaptive setting. Through utilizing the adaptive feature of a CAT,
researchers have found that test batteries delivered via adaptive feature have shown great
improvement in estimation accuracy and test efficiency when compared to linear form test
batteries. For example, the CAT-ASVAB was one of the first adaptive test battery administered.
The official report indicated that the newly CAT version ASVAB took about half the time of the
linear form ASVAB. Therefore, more research need to be address practical issues such as further
improving measurement efficiency, content validity, and test security of test battery designs.
As Stout et al. (2003) pointed out: “Collateral information refers to the additional
estimation information derived from variables that are distinct from, but correlated with, the
studied relevant variable of interest.” It is not common to use collateral information in the
traditional linear testing model, but it is relatively straightforward to incorporate the collateral
information as a prior for estimating ability in an adaptive test because of its adaptive feature.
Since test batteries usually measure a set of related but distinct abilities in the real world, these
correlations are important during the assembly process (Van der Linden, 2008). In other words,

25
utilizing these correlations could be understood as incorporating the collateral information
among subtests. Some assessments procedures calibrate the items and make use of collateral
information to estimate all sub-scores in one large iterative estimation system, such as the
National Assessment of Educational Progress (NAEP, Mislevy, Johnson, & Muraki, 1992).
Therefore, researchers noted that the impact of these correlations could be used in the context of
the test battery to improve its measurement precision. Overall, previous literature proposed two
types of approaches to incorporating collateral information. First, as demonstrated in studies by
Brown and Weiss (1977), predicting the current subtest score using the previous subtest score
can help to reduce estimation error. Stout et al. (2003) further emphasized the advantages of
borrowing information from previous subtests to improve pretest item calibration through
ordering subtests according to their inter-correlation matrix. In particular, the two subtests that
have the highest bivariate correlation are selected as the initial two subtests, and then the subtest
that has the highest multiple correlations with the two initial subtests is selected as the third
subtest, and repeating this procedure until all subtests are selected. Van der Linden (2010)
introduced an approach to optimize individualized subtest sequence for each examinee through
utilizing a multidimensional normal distribution as a prior distribution. Although this approach
introduces a more flexible framework for a test battery setting, it is less favorable in practical
applications because it is easy to lead to unknown context effects if the order of subtests of each
examinee is flexible. Moreover, using this approach may increase test anxiety for examinees
because of the unpredictable order of subtests. Previous studies also noted that directly
borrowing collateral information from a previously administered test is a simple and
straightforward way to improve measurement precision for the entire battery of tests (e.g., Brown
& Weiss, 1977; Stout et al., 2003; Wang et al., 2013).

26
Summary of Previous Studies
Many studies have investigated computer-based testing from different aspects. Some of
them emphasized the outperformance of using MST by comparing it with CAT and linear tests;
while others investigated the performance of using combined different measurement approaches
in one test design, such as hybrid testing designs and test battery designs. The following parts
provide an overview of this research. The first part contains one study that comparing CATs and
MSTs. The second part discusses some studies that conducting the development of hybrid
designs and test battery designs. The third part reviews some new approaches for addressing test
security. The final part describes the goals of this dissertation followed by a summarization of
previous studies.
For years, researchers published different MST framework designs (e.g., Lord, 1971;
Kim & Plake, 1993). Hedrickson (2007) proposed a comprehensive summary to explain the
advantages and disadvantages of using multistage tests, as compared to linear tests and
item-level CATs. Besides describing concepts and structures for the test models, this study also
indicated some impotent components for building a MST, such as, how to decide the number of
stages, and how to assemble the test appropriately. To summarize, the advantages of using
MSTs, as compared to linear tests, include offering score that are more reliable, more precise
measurement accuracy and more efficient testing time management. Moreover, two major
advantages of MSTs, as compared to CATs, include providing more accurate estimates of test
scores; allowing examinees to skip or revisit the completed items within a stage. However, the
two main disadvantages of MSTs when compared to CATs include requiring more items to
obtain the same measurement accuracy as CATs; requiring a lot of time on assembling modules
for test developers before the administration.

27
Zheng et al. (2014) presented the “On-the-Fly assembled multistage testing” (OMST),
which maintains the advantages and offsets the disadvantages of individual MSTs and CATs.
The unique feature of OMSTs is that the adaptive process occurs between stages instead of at the
item level. This study not only compared OMSTs with CATs and MSTs theoretically, but also
conducted a simulation study to investigate measurement accuracy and test security of these
three frameworks. Eight simulated conditions were explored that varied regarding the
constrained item selection approach used (0-1 programming selection vs. heuristic selection),
exposure control algorithm (SH vs. MSH), and item pool stratification (stratified vs.
non-stratified). During the administration process of an OMST, a pre-assembled module with
moderate difficulty level was randomly administered to each examinee at the first stage and the
provisional ability estimate was calculated based on the response to the items of the selected
module. Then, a group of items was assembled together at the second stage to match this
provisional ability estimate. After examinees completed the second stage, repeating this process
until the whole test was terminated. The item pool used in this study consisted of 352
multiple-choice items retired from a large-scale computerized adaptive English language
proficiency test, which contains eight content categories, and all examinees were calibrated using
the 3PL-IR model. The results indicated that in this study, OMSTs not only provided comparable
measurement accuracy to both CAT and MST design but also decrease the item exposure rate
when controlled by the SH method. Besides these practical values, the unique feature of
OMSTs opened a door for hybrid designs.
To explore the possibly of different hybrid designs, Wang et al. (2015) investigated the
measurement properties of administering a test using a MST step and a CAT step in one test,
referred to as Hybrid Adaptive Testing (HAT). To illustrate the applicability of this hybrid
design, this study proposed some the use of principles that influenced the further development, in
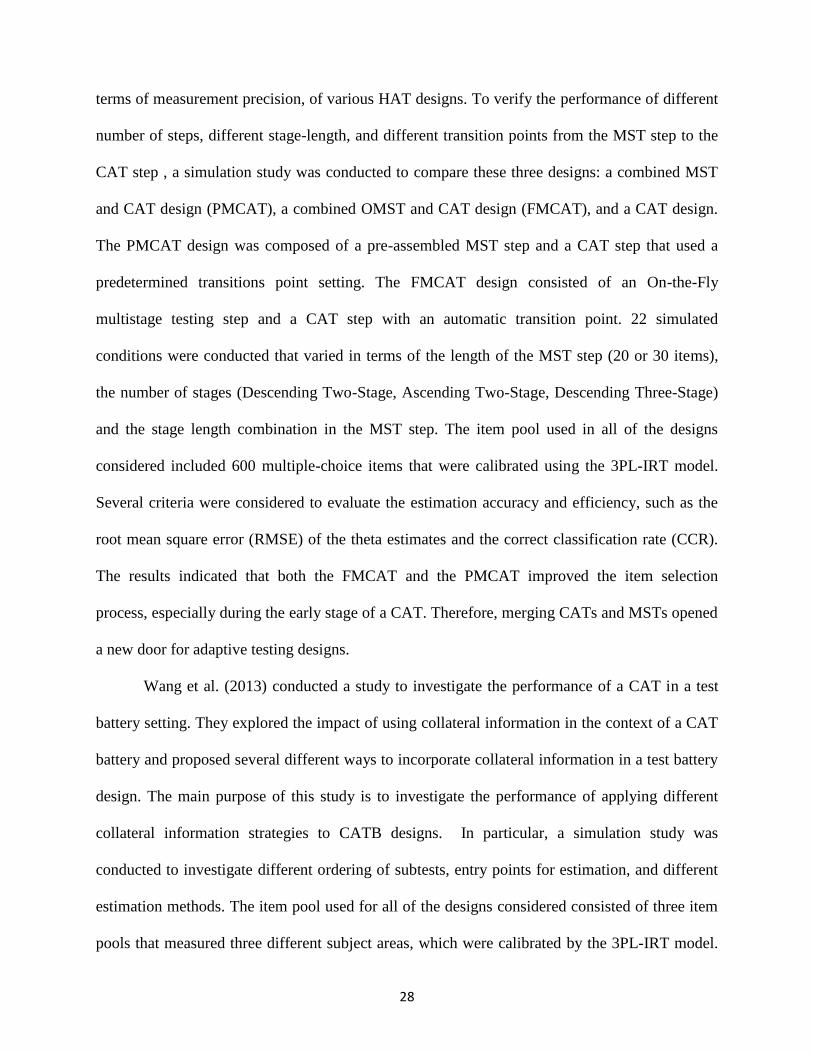
28
terms of measurement precision, of various HAT designs. To verify the performance of different
number of steps, different stage-length, and different transition points from the MST step to the
CAT step , a simulation study was conducted to compare these three designs: a combined MST
and CAT design (PMCAT), a combined OMST and CAT design (FMCAT), and a CAT design.
The PMCAT design was composed of a pre-assembled MST step and a CAT step that used a
predetermined transitions point setting. The FMCAT design consisted of an On-the-Fly
multistage testing step and a CAT step with an automatic transition point. 22 simulated
conditions were conducted that varied in terms of the length of the MST step (20 or 30 items),
the number of stages (Descending Two-Stage, Ascending Two-Stage, Descending Three-Stage)
and the stage length combination in the MST step. The item pool used in all of the designs
considered included 600 multiple-choice items that were calibrated using the 3PL-IRT model.
Several criteria were considered to evaluate the estimation accuracy and efficiency, such as the
root mean square error (RMSE) of the theta estimates and the correct classification rate (CCR).
The results indicated that both the FMCAT and the PMCAT improved the item selection
process, especially during the early stage of a CAT. Therefore, merging CATs and MSTs opened
a new door for adaptive testing designs.
Wang et al. (2013) conducted a study to investigate the performance of a CAT in a test
battery setting. They explored the impact of using collateral information in the context of a CAT
battery and proposed several different ways to incorporate collateral information in a test battery
design. The main purpose of this study is to investigate the performance of applying different
collateral information strategies to CATB designs. In particular, a simulation study was
conducted to investigate different ordering of subtests, entry points for estimation, and different
estimation methods. The item pool used for all of the designs considered consisted of three item
pools that measured three different subject areas, which were calibrated by the 3PL-IRT model.

29
The total test length of the CATB was 60 items, resulting in 20 items for each test. Through
evaluating the subtests and total-test correct classification rates (CCR), the results indicated that
utilizing collateral information improved the classification accuracy in the context of a test
battery design. Specifically, directly borrowing ability estimation from the previous subtest as a
prior was the most reliable and simplest method for using collateral information. In addition,
either Bayesian estimation procedures or MLE performed quite well when utilizing the collateral
information.
To address the test security issue in computer-based test designs, researchers have paid
much attention to the development of ideal item selection algorithms. Typically, many item
selection methods are based on providing maximum information for an examinee’s current
estimated trait level. However, these methods always select items for administration that have
high discrimination parameters, which may lead to the overexposure of these items. Chang and
Ying (1999) first published the design and analysis of the item-pool stratification method with
constraining the a-parameters. In this study, they proposed a notable process of item selection
that administers items with relatively lower a-parameters early in the test administration and
employed those with higher a-parameters later in the test administration. Simulation studies were
conducted to compare this method with some CAT designs based on other stratification methods
such as SH method varied in test length (short and long test lengths). The results indicate that
the item-pool stratification method successfully equalized item exposure rate for all items by
decreasing rates for items that have high possibility to be overexposed and by increasing rates for
those have high possibility to be underexposed. Chang et al (2001) and Chang and Yi (2003)
continually extended the a-stratified method by adding difficulty parameters (b-parameters) or
content blocking. The a-stratified with b blocking method separates item pool into several strata
according to items’ a-parameter values with blocking their b-parameters across all strata. In

30
Chang’s study, a simulation study was conducted to compare the performances of different
a-stratified methods, in terms of both measurement accuracy and test security control. This study
used 360 item parameters obtained from the GRE item pool, a fixed test length of 40 items, and
3000 examinees simulated from a standard normal N (0, 1) distribution. MLE was used to
estimate the examinees ability using both methods. The results indicated that with stratifying
a-parameter, these new approaches provided an efficient solution to reduce item exposure rate.
Moreover, the a-stratified with c blocking method is designed to consider extra content balances.
In Chang and Yi (2003)’s study, some simulation studies were conducted to explain the
advantages of using this new approach. Through comparing the performance of using three item
selection methods: the a-stratified method, the a-stratified with a b-blocking method and the
maximum Fisher information method with Sympson-Hetter exposure control. The results
demonstrated that the modified a-stratified method resulted in better item usage balance and
measurement precision in a situation where content balancing was required for the test. In sum,
the aforementioned a-stratified methods provided the development of stratification methods of
CAT designs.
Lately, Guo et al. (2013) investigated the effect of using the a-stratified method with
extra content blocking in the test assembly procedure of different MST forms. The primary goal
of this study was to investigate the performance of using stratification method by building a
MST component. Two MST structures including different stage lengths were simulated to
compare to a traditional linear form test. All conditions were generated from an item pool that
consisted of 600 polytomous items from an actual large-scale test. Within the MST design, ten
parallel panels were assembled using the heuristic method. After the whole test was finished,
each examinee was then classified into one of five classification categories, based on the range in
which the final ability estimate fell. This study also investigated the feasibility of using these two

31
panel assembly algorithms together for a large-scale classification test. In this study, there were
one statistical constraint and two non-statistical constraints imposed during the test assembly
procedure. The non-statistical constraints included a content coverage constraint in which all
pathways needed to have at least one item from each of the five content categories. To maintain
both the statistical constraints and the non-statistical constraints, a combination of bottom-up and
top-down assembly algorithms for a large-scale classification test was used by using a revised
version of the NWADH heuristic method. In particular, the “bottom-up” approach was used to
assemble the test in terms of the test information function; therefore, modules at the same
difficulty level were exchangeable based on the modules information to match the statistical
constraints. This study incorporated the “top-down” strategy to satisfy the content and answer
key specification in this study. Through comparing the measurement precision and test security
control, the results not only confirmed the outperformance of MSTs to linear tests but also
indicated the possibility of utilizing combined assembly algorithm (“bottom-up” and “top-down”
) in MST designs.
Statement of Question
Reviewing previous studies, lots of them focused on investigating the performance of
different computer-based testing modes, such as CATs, MSTs. On the one hand, the
development of CAT designs is primarily based on psychometric advantages, such as more
accurate ability estimates. On the other hand, the development of MSTs are primarily based on
non-psychometric advantages, such as more administrative control over content and the ability
for examinee to review items (Mead, 2006; Hendrickson, 2007). Additionally, previous studies
also conducted the performance of utilizing a combination of different testing frameworks
(CATs and MSTs) (e.g., Zheng et al. 2012). Besides that, some studies have focused on test
battery designs, which explored the possibility to improve both reliability and validity for test

32
batteries by utilizing the adaptive feature (e.g., Wang et al., 2012). Test security is a big concern
in the areas of computer-based assessment and adaptive testing. Of the literature reviewed,
Patsula (1999) and Jodoin (2003) proposed that CATs with conditional exposure control
procedures performed better than the various MST designs in both measurement characteristics
and exposure control, when considering exposure control as a manipulated condition. In
comparing the security of various conditions, different a-stratified designs outperformed the use
of stratification methods in MSTs, CATs or hybrid designs. (e.g., Chang & Ying, 1996; Davey &
Nering, 2002; Leung, Chang & Hau,1999; Yi & Chang, 2000). Researchers also explored the
issues of the multistage test security control in various directions (e.g., Lee, Lewis & von Davier,
2011; Below & Armstrong, 2008; Edwards, Flora, & Thissen, 2012).
To summarize, the goal of this dissertation was to investigate the performance of two
battery-based multistage testing designs under different manipulated test conditions (e.g., module
length and estimation method). It is expected that the new measurement techniques can reflect
great practical values, and utilizing the collateral information from previously administered
test(s) is a reliable approach to obtaining estimation accuracy for either classical or hybrid test
battery designs. One battery design was administered using three MST models; another battery
design was administered using a hybrid model, which consisted of two MST models and one
CAT models. For each test in both batteries, a sequential testing design was employed to utilize
collateral information between tests. Each subsequent test in the battery for an examinee was
assembled according to the examinee’s previous ability estimate. Research questions addressed
by this study included: 1) How does the MST battery design compare to the hybrid MST battery
design, in terms of measurement precision and test security control? 2) What’s the impact of
collateral information on measurement accuracy (estimation accuracy and classification accuracy)
of MST battery designs? 3) What effect does the On-the-Fly routing strategy have on the

33
measurement accuracy (estimation accuracy and classification accuracy) and test security
properties of MST battery designs? All designs were compared concerning estimation accuracy
and efficiency, as well as test security control.
III. METHODOLOGY
Design of Overview
Two test battery designs incorporating MST components were investigated for the
possibility of improving both reliability and validity. One is a MSTB design and the other is a
hybrid design. The MSTB design consists of three tests and each is administered via MST. For
the first test, AMI is used as the routing strategy, which denotes the MST procedure in this study;
and as for the second and third, the “On-the-Fly” strategy is employed, which denotes the OMST
procedure. The hybrid battery design also consists of three tests; the first two are administered
via MST while the third one via CAT. The AMI strategy is used in the first test, and the
“On-the-Fly” strategy is used in the second test. To improve estimation precision, each
subsequent test in the battery for an examinee was assembled according to the examinee’s
previous ability estimate. For making a reasonable comparison, two baseline models were
considered in the simulation study, one is a MST design consisting of three MST procedures
without borrowing information from each other’s; the other is a CATB design consisting of 1 to
3 CAT procedures, being the second and the third procedures borrowing information from the
previous ones. Since NWADH has been successfully used in MST designs (e.g., Luecht &
Nungester, 1998; Patsula, 1999; Hambleton & Xing, 2006; Jodoin et al., 2006), this assembly
algorithm was used to pre-assemble test forms in this study. The “top-down” and “bottom-up”

34
strategies were used together to assemble all panels in terms of both statistical and non-statistical
constraints. Additional factors include the following two manipulated conditions: 1) two
estimation methods: MLE and EAP, 2) three different module lengths: 6-6-12,12-6-6, and 8-8-8.
All tests investigated in this study fixed at 24 items. Table 3.1 depicts all of the designs
considered in this study. Then, the following sections describe the details of each design one by
one.
Table 3.1: General Framework of All Designs
Test
Order
Test
length
Comparison Model Baseline Model
MSTB MSTBH MST CATB
M
M
24 MST MST MST
CAT
I
I
24 OMST OMST MST
CAT
R
R
24 OMST CAT MST
CAT
Item Pool Framework
All items investigated in this study were generated from three item pools that measure
mathematics, information and reading skills (denoted by M, I, R respectively). Each item pool,
or test in the battery, included five content categories. These item parameters were generated
from a retired large-scale test used for certification purposes. Specifically, each item pool was
composed of 600 dichotomous items. All of the items were calibrated using the 3PL-IRT model.
Table 3.2 and Table 3.3 present the distribution of item parameters and numbers of items in each
content category. See Table1, M test is more difficult than the L and R tests. Table 3.3indicates
the high inter-correlations of the examinees’ response among each test, but these correlations do
not equal to 1.

35
Table 3.2: Descriptive Statistics for Three Item Pools
Mathematics (M)
Variable N Mean SD Minimum Maximum
a
b
c
600
600
600
1.120
0.008
0.144
0.341
1.778
0.081
0.278
-4.465
0.0076
2.531
5.439
0.498
Information (I)
Variable N Mean SD Minimum Maximum
a
b
c
600
600
600
0.901
-0.127
0.119
0.321
1.582
0.071
0.052
-3.533
0.005
2.701
4.799
0.500
Reading (R)
Variable N Mean SD Minimum Maximum
a
b
c
600
600
600
0.998
-0.778
0.105
0.336
-1.353
0.071
0.202
-4.640
0.005
2.581
3.078
0.500
Table 3.3: Item Parameter for Each Content Constraint
Mathematics (M)
Item Pool N a b c
Content1 163 0.97 -1.85 0.10
Content2 22 1.14 0.01 0.18
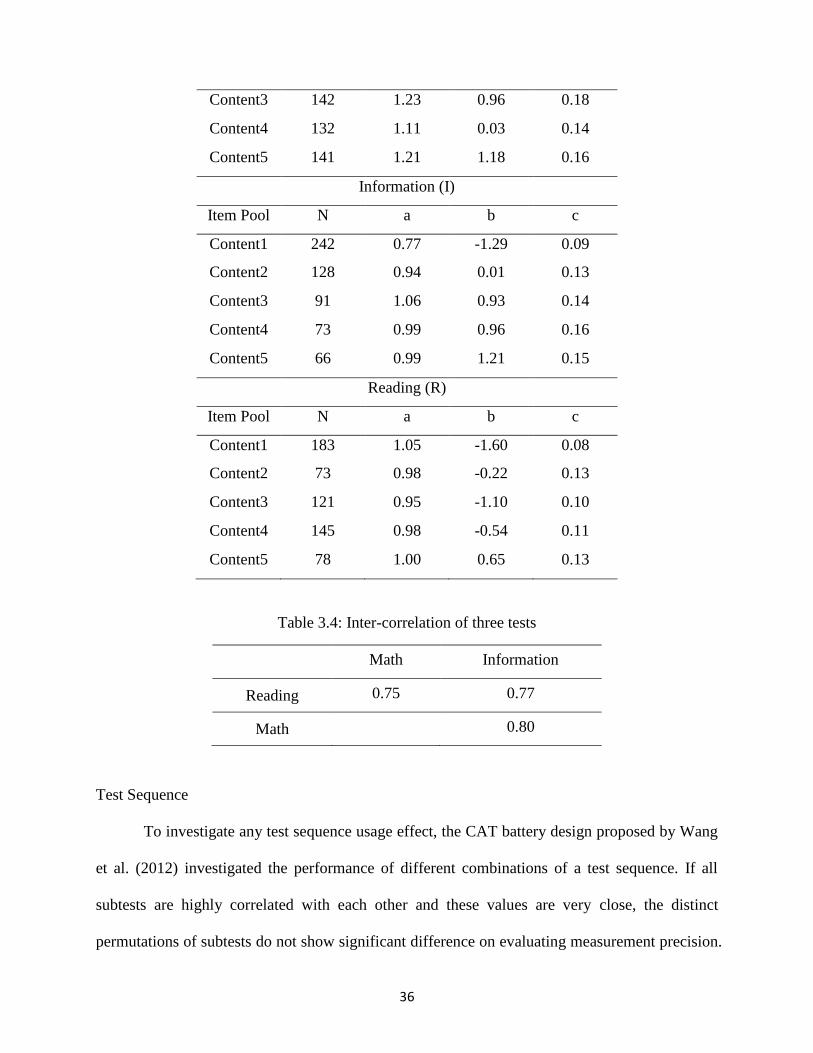
36
Content3 142 1.23 0.96 0.18
Content4 132 1.11 0.03 0.14
Content5 141 1.21 1.18 0.16
Information (I)
Item Pool N a b c
Content1 242 0.77 -1.29 0.09
Content2 128 0.94 0.01 0.13
Content3 91 1.06 0.93 0.14
Content4 73 0.99 0.96 0.16
Content5 66 0.99 1.21 0.15
Reading (R)
Item Pool N a b c
Content1 183 1.05 -1.60 0.08
Content2 73 0.98 -0.22 0.13
Content3 121 0.95 -1.10 0.10
Content4 145 0.98 -0.54 0.11
Content5 78 1.00 0.65 0.13
Table 3.4: Inter-correlation of three tests
Math Information
Reading 0.75 0.77
Math
0.80
Test Sequence
To investigate any test sequence usage effect, the CAT battery design proposed by Wang
et al. (2012) investigated the performance of different combinations of a test sequence. If all
subtests are highly correlated with each other and these values are very close, the distinct
permutations of subtests do not show significant difference on evaluating measurement precision.

37
Therefore, in this study, the subtests orders of all design were determined by their
inter-correlation matrix. Since the M and I tests contain the highest correlation, the M test was
delivered first, then both I and R tests were delivered afterward.
Manipulated Conditions
Module Length. According to research conducted by Loyd (1984) and by Kim and Plake (1993),
longer routing stages are associated with better measurement precision for MST designs.
Specifically, administering a longer first-stage module provides more information for the routing
decision in subsequent stages. Therefore, it is of interest to investigate if the outperformance of
initial test could be used in a test battery for better performance in subsequent tests. To explore
this idea, different conditions that varied in terms of the length of the first-stage module were
considered in the MST procedure of all designs. Specifically, three different conditions were
explored: (1) A longer first module (12-6-6); (2) A shorter first module (6-6-12); and, (3)
Equivalent modules (8-8-8).
Estimation Method. Two estimation methods, MLE, and EAP, were considered in this study,
which differ in intermediate ability updating and final ability estimation.
Data Generation
The data generation process of this study included two steps. First, item parameters were
generated from a retired item pool from a real working certification test. Then, response data for
every item and for each examinee were simulated based on these parameters. According to the
experiences from previous studies, there were ten replications for each condition of this study,
and each replication included 10,000 examinees. Therefore, the total true ability of 100,000
examinees for each item pool were simulated from a standard normal distribution N (0,1)
truncate within (-3.5,3.5) because many real tests such as the IQ test scores all follows an
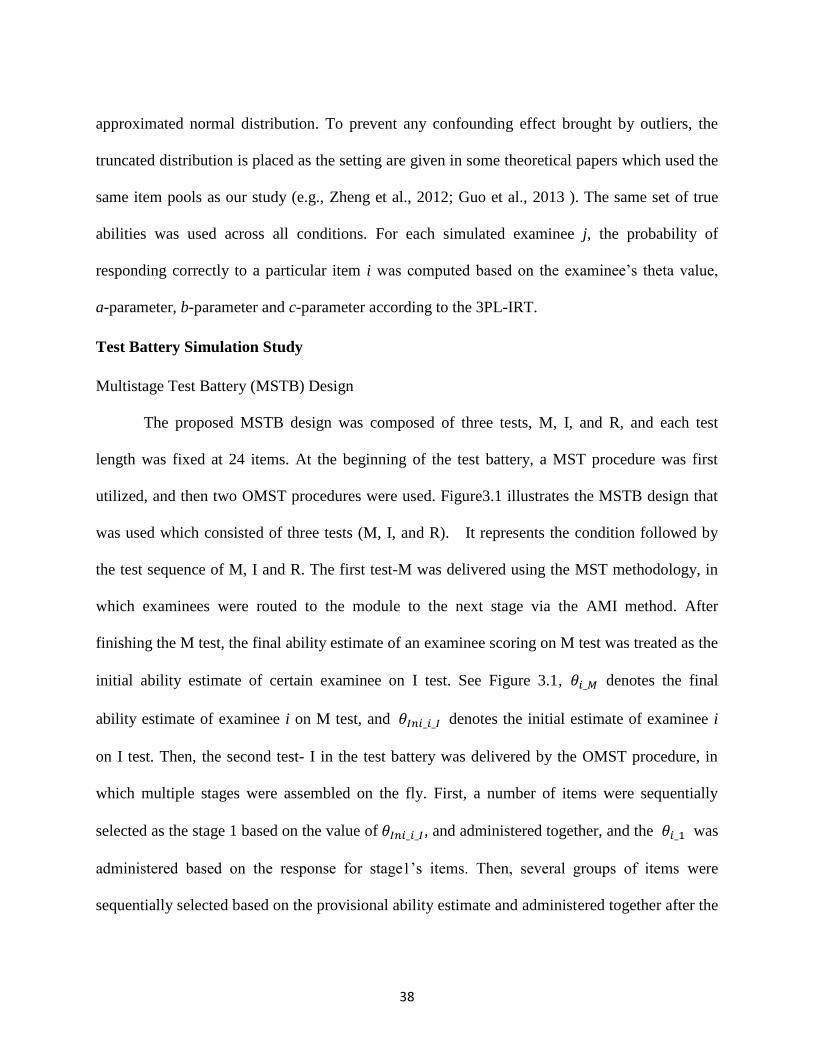
38
approximated normal distribution. To prevent any confounding effect brought by outliers, the
truncated distribution is placed as the setting are given in some theoretical papers which used the
same item pools as our study (e.g., Zheng et al., 2012; Guo et al., 2013 ). The same set of true
abilities was used across all conditions. For each simulated examinee j, the probability of
responding correctly to a particular item i was computed based on the examinee’s theta value,
a-parameter, b-parameter and c-parameter according to the 3PL-IRT.
Test Battery Simulation Study
Multistage Test Battery (MSTB) Design
The proposed MSTB design was composed of three tests, M, I, and R, and each test
length was fixed at 24 items. At the beginning of the test battery, a MST procedure was first
utilized, and then two OMST procedures were used. Figure3.1 illustrates the MSTB design that
was used which consisted of three tests (M, I, and R). It represents the condition followed by
the test sequence of M, I and R. The first test-M was delivered using the MST methodology, in
which examinees were routed to the module to the next stage via the AMI method. After
finishing the M test, the final ability estimate of an examinee scoring on M test was treated as the
initial ability estimate of certain examinee on I test. See Figure 3.1, 𝜃𝑖_𝑀 denotes the final
ability estimate of examinee i on M test, and 𝜃𝐼𝑛𝑖_𝑖_𝐼 denotes the initial estimate of examinee i
on I test. Then, the second test- I in the test battery was delivered by the OMST procedure, in
which multiple stages were assembled on the fly. First, a number of items were sequentially
selected as the stage 1 based on the value of 𝜃𝐼𝑛𝑖_𝑖_𝐼, and administered together, and the 𝜃𝑖_1 was
administered based on the response for stage1’s items. Then, several groups of items were
sequentially selected based on the provisional ability estimate and administered together after the
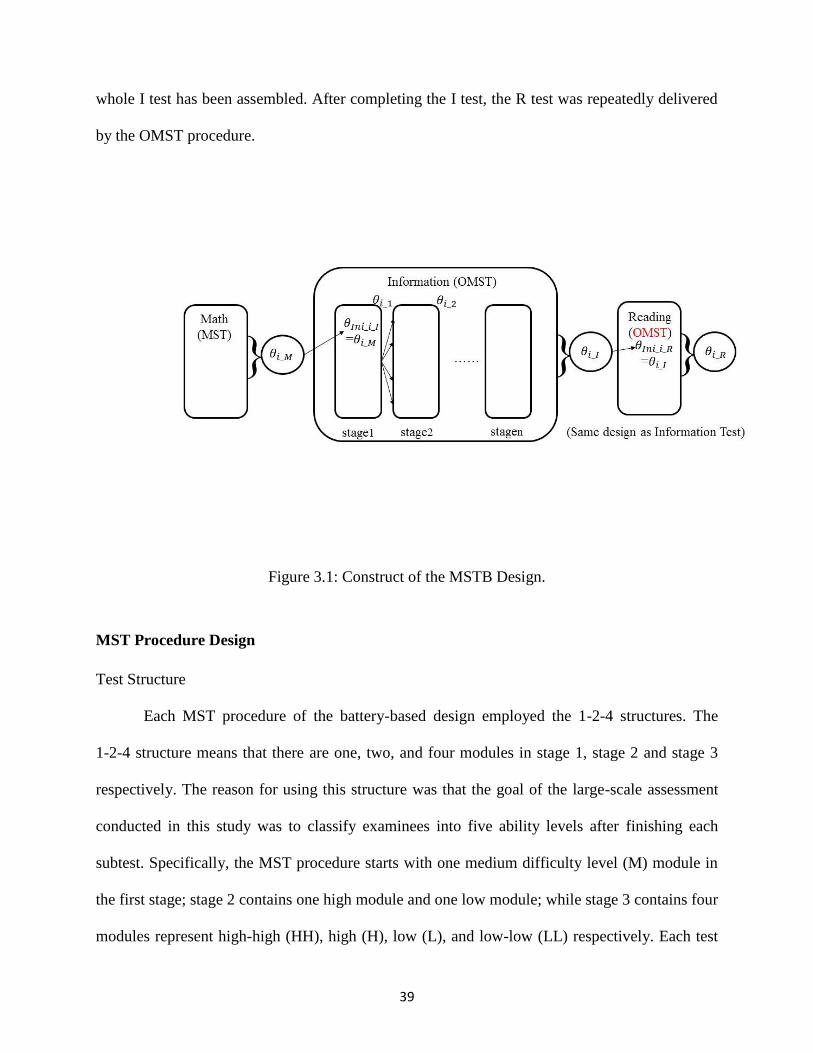
39
whole I test has been assembled. After completing the I test, the R test was repeatedly delivered
by the OMST procedure.
Figure 3.1: Construct of the MSTB Design.
MST Procedure Design
Test Structure
Each MST procedure of the battery-based design employed the 1-2-4 structures. The
1-2-4 structure means that there are one, two, and four modules in stage 1, stage 2 and stage 3
respectively. The reason for using this structure was that the goal of the large-scale assessment
conducted in this study was to classify examinees into five ability levels after finishing each
subtest. Specifically, the MST procedure starts with one medium difficulty level (M) module in
the first stage; stage 2 contains one high module and one low module; while stage 3 contains four
modules represent high-high (HH), high (H), low (L), and low-low (LL) respectively. Each test

40
length includes 24 items for illustrative purposes. Figure 3.2 presents the general structure of this
model.
Figure 3.2: Structure of 1-2-4 MST test
Test Construction Targets and Constraints
The very important first step of test assembly design is to find the optimal information of
each module. In this dissertation, the optimal information of each module was defined as the
target information function (TIF). According to the purpose of the large-scale test used in this
study, the item pool was divided into five groups based on four quintiles points according to the
true theta scale. The anchor point of each module was obtained by taking the average of the
anchor point values of its sub-routes. The final anchor points (stage3) of M test peaked at
(-0.832, -0.269, 0.245, 0.825), then the corresponding anchor points of modules in stage 1 and
stage 2 peaked at (-0.55,0.535) and (-0.007) respectively.

41
Module and Panel Assembly
The main goal of the module assembly in this MST procedure is to maximize each
module’s information at its corresponding anchor point, in which the module information equals
the sum of the Fisher information of all items within the module. According to the previous
description, examinees were classified into five ability groups based on the four anchor points
(θs) in stage3. The NWADH method combined with “bottom-up” and “top-down” approaches
was used to the assembly steps in this study. Module assembly was completed in three steps: (1)
calculating the target information function (TIF) on the anchor points (θ) of each module was
calculated by using the maximum information method. (2) Computing the current FI for all items
of the current item bank at the corresponding θ position, as well as the absolute deviation
between the target FI and the current FI for each item. (3) Choosing the candidate item contains
the highest information to satisfy the non-statistical constraint. Overall, this study considered six
constraints: the TIF value at the θ anchor of the module, and five content constraints on the five
content categories. The “bottom-up” strategy was used to satisfy the statistical constraint- test
information foundation (TIF) considered, and the “top-down” constrain was used to satisfy the
non-statistical constraint- each pathway must contain as least one item from each content
category. In this case, Equation 17 can be expressed as:
di,n=|(Tn−∑ ukxk
Ik=1
n−j+1) − ui,n| i∈ Ri−1
(20)
where 𝑑𝑖,𝑛 is computed for the TIF value at the corresponding θ anchor, 𝑢𝑖,𝑛 denote the
attribute associated with constraint n of item i. For the statistical constraint on TIF at the
corresponding θ ,n=1. For the non-statistical constraints on the content categories, n = 2, 4, …, 6,
and assume the minimum number of each category equals to 1, 𝑇𝑛=1 in this case.

42
After modules assembled, we got a module pool, which includes all parallel module
forms. Figure 3.3 represents the test information curves for each module under the condition of
“12-6-6”, in particular, ten parallel module information curves were assembled for the module at
stage1. Moreover, five parallel module forms were assembled for each module at stage1, and
three parallel module forms were assembled for each module at stage3. The next step is to
assemble panels from these modules. This study used a combined “bottom-up” and “top-down”
panel assembly approach to assemble ten parallel panels to match both the statistics constraints
and non-statistics constraints. Through unitizing the “bottom-up” strategy, the assemble modules
at the same difficulty level were interchangeable in terms of the TIF. Moreover, the “top-down”
strategy was used to maintain the non-statistics constraint that each pathway has at least one item
from each of the five content categories in the assembled test. Since the content balance
constraint was a test-level constraint, many of the mixed-and-matched panels could not satisfy
this constraint. Finally, we obtained ten parallel panels in which all pathways satisfied all of the
constraints. Figure 3.4 indicates the module information curves together with the cut-off points
in the three-stage model.

43
Figure 3.3: Module Information Curves for the three-stage MST under “12-6-6” condition.
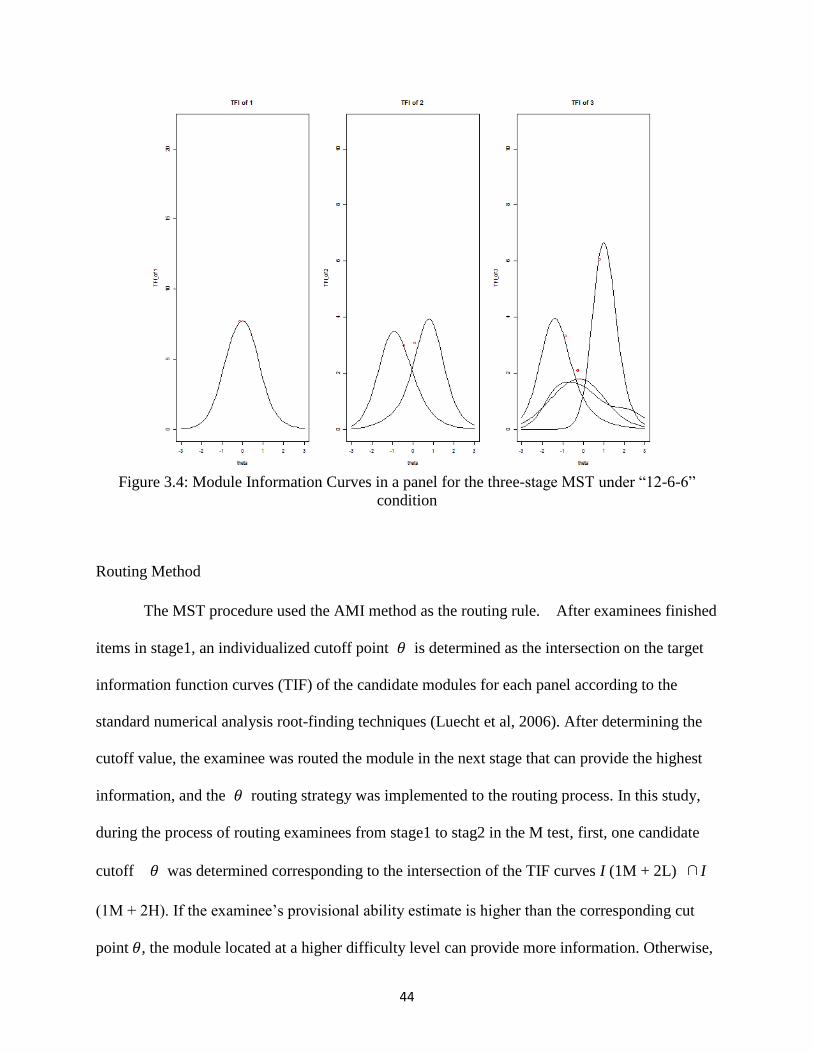
44
Figure 3.4: Module Information Curves in a panel for the three-stage MST under “12-6-6”
condition
Routing Method
The MST procedure used the AMI method as the routing rule. After examinees finished
items in stage1, an individualized cutoff point 𝜃 is determined as the intersection on the target
information function curves (TIF) of the candidate modules for each panel according to the
standard numerical analysis root-finding techniques (Luecht et al, 2006). After determining the
cutoff value, the examinee was routed the module in the next stage that can provide the highest
information, and the 𝜃 routing strategy was implemented to the routing process. In this study,
during the process of routing examinees from stage1 to stag2 in the M test, first, one candidate
cutoff 𝜃 was determined corresponding to the intersection of the TIF curves I (1M + 2L) ∩I
(1M + 2H). If the examinee’s provisional ability estimate is higher than the corresponding cut
point 𝜃, the module located at a higher difficulty level can provide more information. Otherwise,

45
the module located at a lower difficulty level can provide more information. Repeating this
process to determine the cutoff point for each of the possible routing panel after examinees
finished the second stage. Based on the 1-2-4 structure, there were three candidate cutoff points
θ1, corresponding to the intersection of the TIF curves I (2L + 3LL) ∩I (2L+ 3L) ∩I (2L+ 3H),
and θ2, corresponding to the intersection of the TIF curves I (2H + 3HH) ∩I (2H+ 3H) ∩I (2H+
3L). Figure 3.5 shows the pathway information curves of the ten parallel panels for the
three-stage MST model.
Figure 3.5: Pathway Information Curves in the three-stage MST module under “12-6-6”
condition

46
Estimation Methods
For the first MST test in the battery, each examinee got a randomly assigned panel, and
the MLE was use to update examines’ ability estimate. The estimation started by treating the
final estimation from the previous test as the initial estimate of ability.
Test Administration
After assembling the panels and modules, each examinee was administered a test through
MST procedure utilizing the following steps:
Step1: Randomly assign one of the ten panels to each examinee.
Step2: Estimate the provisional ability for each examinee based on item responses from the
first-stage module.
Step3: Route each examinee to the second-stage module (L or H) that provides the maximum
information, based on the test information function, for that examinee’s provisional estimate of
ability. Then estimate a new provisional ability for each examinee based on their item responses
from the second-stage module.
Step4: Repeat Step3 to route each examinee to a suitable module at the third-stage.
Step5: Calculate the final estimate of ability for each examinee based on the entire set of
responses to all modules in the subtest.
OMST Procedure Design
According to the OMST paradigm represents in Figure 3.1, a group of items is
sequentially selected based on the provisional ability estimate and administered together after the
whole I test has been assembled. Similar to the MST procedure design, each pathway of the

47
OMST must contain at least one item from each of the five content categories. The OMST
algorithm for the I test is generalized as followed:
Step1: Consider the initial ability estimate 𝜃𝐼𝑛𝑖_𝑖_𝐼 for examinee i on the I test as the final
estimate of ability from M test. Then, n items of the I test whose information functions yield
maximum information is selected simultaneously as the first stage for i. In this OMST paradigm,
the test is divided into six stages, and each stage includes six items, n =6.
Step2: Check the content balance against the content constraint. If any content category
constraint missing, an item replacement algorithm is used to choose item(s) from the remaining
item pool based on the information criterion. The item replacement algorithm is composed of
one selection step and one determination step. First, randomly selected an item i from the
missing content category. Then, n items from the remaining item pool that belong to category k
(k=1…5) are selected and the Fisher information function is maximized at the current ability
estimate. Finally, determine if item j does not belong to any of the missing categories and replace
item j by item i if this does not result in other content categories becoming deficient.
Step3: A provisional ability estimate is calculated based on these items’ 𝜃𝑖_1. Then, a number of
items are selected and administered as the stage2’s items according to the initial estimated
ability.
Step4: Repeat Step3 until finishing the entire test and estimate the final ability of the examinee
according to the entire set of responses.
The administration of the battery continues the same process through the third test, R, until the
whole test battery administered.

48
Hybrid MSTB (MSTBH) Design
The proposed MSTBH design also consisted of three tests. The first test was
implemented via MST while the second and the third were implemented as an OMST and a CAT
procedure, respectively. The MST and OMST procedures followed the same processes as the
MSTB design did. To investigate the performance of combining MSTs and CATs into one
battery design, after finishing the first two tests, a single CAT test was conducted for the third
test in which each item was selected through the maximal Fisher information method. Figure 3.6
indicates the general construct of the MSTBH design. Similar to the MSTB, each subsequent test
of an examinee in the test battery was assembled and administered according to the examinee’s
final ability estimate obtained based on responses to the previously administered test.
Figure 3.6: Construct of the MSTBH design

49
Baseline Models Simulation Study
CATB Design
In particular, the CATB design refers to the administration of three tests separately, using
the typical CAT methodology. For making a reasonable comparison, the test battery tied three
tests (M-I-R) together by utilizing the final estimate of ability for an examinee from the previous
test(s) as the initial estimate of ability for the subsequent test. Within each test, an item with the
largest information at the updated ability location was selected for administration, and at least
one item from each category was chosen to achieve content balance. The MFI method was used
as the item selection method, and the MLE method was used as the estimation method for each
test. To make a fair comparison, the stopping rule of each CAT procedure is finishing the whole
test. MST Design
The MST baseline model consisted of three unconnected tests, each of which was
administered independently via multistage testing. All design details are identical to what
described before. Table 3.6 illustrates the backward process (from stage3 to stage1) of
calculating anchor points for each test.
Table 3.6: Anchor Points for Each Test
stage3 stage2 stage1
M (-0.832, -0.269,0.245,0.825) (-0.550, 0.535) (-0.007)
I (-0.864, -0.265, 0.253,0.827) (-0.560, 0.540) (-0.01)
R (-0.844, -0.247,0.243,0.829) (-0.540, 0.536) (-0.002)

50
Data Analysis
Measurement Precision
The evaluation criteria used to compare each of the test administrations were estimation
accuracy and efficiency. Specifically, to evaluate estimation accuracy, the root mean square error
(RMSE) of 𝜃 estimates is computed,
RMSE = √∑ (θi − θi)2N
i=1
N (21)
Where N is the number of examinees, 𝑁𝑗 is the number of examinees in ability group
j(j=1…5), θ is the true value of the examinee ability and 𝜃 is the estimated ability. When the
objective of a MST is to classify examinees, it is important to maximize CCR (Weissman,
Dmitry, and Ronal, 2007). Therefore, the correct classification rate (CCR) and the conditional
classification rate (Conditional CCR) were used to evaluate classification accuracy in this study.
Accordingly, for the purposes of this study, which was based on an actual live exam, each
examinee was classified into one of the five classification categories used in the actual test
environment, based on the range where the final θ estimate fell in. Specifically, the CCR value is
computed by dividing the number of examinees correctly classified by the total number of
examinees, and the conditional CCR is computed by dividing the number of examinees classified
within each final classification category by the total number of examinees in each classification
category.
Test Security
Item exposure rate and item usage rate are two commonly used indexes in adaptive
applications. The standard deviation (SD) of the test overlap (Wang et al., 2013), was used as the
index of test security control. According to their findings, a large SD test overlap indicates that it

51
is possible for a group of examinees that have the same ability to share more common items than
other groups. In addition, when the mean overlap is the same between MSTs and CATs, MSTs
always represent larger SD test overlap than CATs. Hence, calculating the SD test overlap can
add important information to the test security profile.
The SD of test overlap rate of MST designs is
σMST =1
T√∑
Nt − 1
𝑁𝑡2
T
t=1 (22)
where T (1,…, t) represents the number of stages of the MST design, and Nt = ∑ PitSti=1
represents all forms of module at stage t. If different forms (𝑃𝑖𝑡) of different modules (𝑆𝑡)
including in stage t are equally likely to be selected, the SD of test overlap rate of certain MST is
calculated by Equation 22.
The SD of the test overlap rat for a CAT for the same test is
𝜎𝐶𝐴𝑇 =𝑆 − 𝐿
𝑆√𝑆 − 𝐿
(23)
where S represents the total number of item in the item pool, L represents the test length.
IV. RESULTS
In this study, the proposed MST battery (MSTB) design consists of three different but
correlated tests, each of which is administered using MST. To improve measurement precision,

52
ability information obtained from previous test(s) in the battery were used to adaptively connect
the three tests in the battery. Since NWADH has been successfully used in MST designs (e.g.,
Luecht & Nungester, 1998; Patsula, 1999; Hambleton & Xing, 2006; Jodoin et al., 2006), this
assembly algorithm was used to pre-assemble test forms in this study. The “top-down” and
“bottom-up” strategies were used together to assemble all panels in terms of both statistics and
non-statistics constraints. An OMST strategy was used as a routing strategy for the MSTB design.
To make a fair comparison, the proposed hybrid MSTB design (MSTBH) also consists of three
tests: the first two tests are implemented via MST whereas the last one is implemented as a CAT.
For both battery designs, an adaptive battery is used by considering an examinee’s final theta
estimate from the previously administered test as the initial theta of the current test. In order to
verify the feasibility of the design, a simulation study was conducted to compare the MSTB and
the MSTBH with two baseline models. An MST design which is the administration of three tests
separately using MST models, and a CATB design which is the administration of three tests
sequentially, such that the second and third CAT tests make use of the ability estimates from the
previous CAT as their initial estimates.
The simulation results for the two proposed test battery designs and the two baseline
designs across different conditions. There are two sets of evaluation indexes here. In the first set,
the four designs were compared on measurement precision, including REMS, overall CCR, and
conditional CCR, after examinees finished each subtest under different conditions. In the second
set, some test security properties were evaluated through calculating the mean item exposure rate,
item usage rate, and the SD of test overlap rate. All reported statistics were averaged across ten
replications; each replication contained 10,000 observations. Furthermore, two estimation

53
methods (MLE and EAP) were used cross all test battery designs. Here are some definitions of
some notations of this study.
1-2-4 MST: a design that allocates one module in stage 1, two modules in stage 2, and four in
stage 3.
12-6-6: a 1-2-4 MST design contains one, two, and four modules in stage 1, stage 2 and Stage 3
respectively, administering a longer first-stage module with 12 items in each module at stage1,
and 6 items in each module at stage2 and 3.
6-6-12: a 1-2-4 MST design that administers 6 items in each module at both stage 1 and stage 2,
and 12 items in each module at stage 3. The designs would allow us to investigate whether
administering shorter modules at early stages and longer module at last stage increases
efficiency.
8-8-8: a 1-2-4 MST design, that administers modules with the same length.
Measurement Precision
Table 4.1 presents RMSE and overall CCR across all designs under different conditions,
in which (𝜃��) represents the final ability estimate based on the response for all items of M test;
( 𝜃�� ) represents the final ability estimate based on the response for all items of I test;
(𝜃��) represents the final ability estimate based on the response for all items of R test. As
described in the methodology part, the four proposed designs all include three tests - M, I, and R.
As presented in Table 4.1, a MST was administered at the beginning of each of the three MST
designs, MSTB, MSTBH, and MST. On the other hand, CATB started with a CAT procedure.
Table 4.1 indicates that administering a MST at the beginning of testing increases estimation
accuracy and classification accuracy, not only MST yields the lowest RMSE (0.309), but also the

54
highest CCR (0.701). When examinees moved to do the second test, which is I test, an OMST
procedure with borrowing estimation information from previously administered test was
administered to both the MSTB and MSTBH designs. Then, the CATB design was used, which
uses a CAT procedure treating examinees’ initial estimates of the current test (𝜃𝐼𝑛_��) as their final
estimates from the previous test (𝜃��). As to the MST design, it still applied a MST procedure to
the I test. To evaluate the performance of using different estimation methods, two conditions
were presented here: One is an OMST procedure that using MLE as the estimation method
(OMST-MLE) and the other is an OMST procedure that using EAP as the estimation method
(OMST-EAP).
Table 4.1 indicates that administering an OMST followed by a MST improves
measurement precision. According to the descending order, the I test administered by the
OMST-EAP procedure provided the best estimation accuracy in predicting examinees’ true
ability (𝜃𝐼), as it had the lowest RMSE (0.245) and the highest CCR (0.744). The I test
administered by the OMST-MLE one provided the second highest CCR and lowest RMSE, and
the I test administered by the CAT procedure with borrowing previous estimation information
provided the third best estimation accuracy. However, administering a MST for the I test
provided the worst estimation accuracy, with the highest RMSE (0.367) and the lowest CCR
(0.662). When examinees finished the second test and moved to the third test, an R test, MSTB
delivers an OMST at the end of the battery as well. Note that MSTBH administered a CAT at the
end of the battery. Therefore, this is a hybrid design to use both MST and CAT. The MST and
CATB designs employed the same procedures in their previous two tests. The results indicate
that administering an OMST procedure that incorporating previous estimation information at the
end of the MSTB design increases estimation accuracy of the R test. Administering a CAT

55
procedure that incorporates previous estimation information at the end of the MSTBH design
increases estimation accuracy of the R test as well, but the improvement was not as large as that
of MSTB. The comparison between utilizing EAP and MLE shows that using EAP method
yields better measurement precision, and it not only had the lowest RMSE (0.220), but also the
highest CCR (0.766).
In sum for all the three designs, MSTB, CATB, MST, if the information obtained from
their previous estimation procedures can be utilized as initial predictors, measurement precision
of ability estimates can be greatly improved. In addition, all the designs performed similarly
across three module length conditions, which may indicate that having a longer testing length in
the initial testing stage will not improve efficiency in comparison with that using shorter testing
length.
Table 4.1: RMSE and CCR of the estimated θ
MSTB Design
Estimation
Test Order Design 12-6-6
12
6-6-12 8-8-8
RMSE CCR RMSE CCR RMSE CCR
M (θM) MST
0.309 0.701 0.300 0.707 0.305 0.705
I (θI) OMST-MLE
MLE
0.305 0.722 0.308 0.717 0.303 0.718
OMST-EAP
MLE
0.245 0.744 0.247 0.740 0.248 0.738
R(𝜃𝑅 ) OMST-MLE
MLE
0.368 0.662 0.356 0.666 0.357 0.673
OMST-EAP
MLE
0.220 0.766 0.220 0.767 0.248 0.767
MSTBH Design
0.334
0.687
0.323
0.688
0.330
0.685
M (θM) MST
MLE
0.309 0.701 0.300 0.707 0.305 0.705
I (θI) OMST-MLE
MLE
0.305 0.722 0.308 0.717 0.303 0.718
OMST-EAP
MLE
0.245 0.744 0.247 0.740 0.248 0.738
R(𝜃𝑅 ) CAT-MLE
MLE
0.310 0.683 0.308 0.687 0.311 0.687
CAT-EAP
MLE
0.284 0.695 0.288 0.694 0.286 0.691
MST Design
M (θM) MST 0.309 0.701 0.300 0.707 0.305 0.705
I (θI) MST 0.368 0.662 0.356 0.666 0.357 0.673
R(𝜃𝑅 ) MST 0.334 0.687 0.323 0.688 0.330 0.685
CATB Design
M (θM) CAT 0.344 0.688 0.344 0.688 0.344 0.688
I (θI) CAT 0.362 0.669 0.361 0.669 0.361 0.669
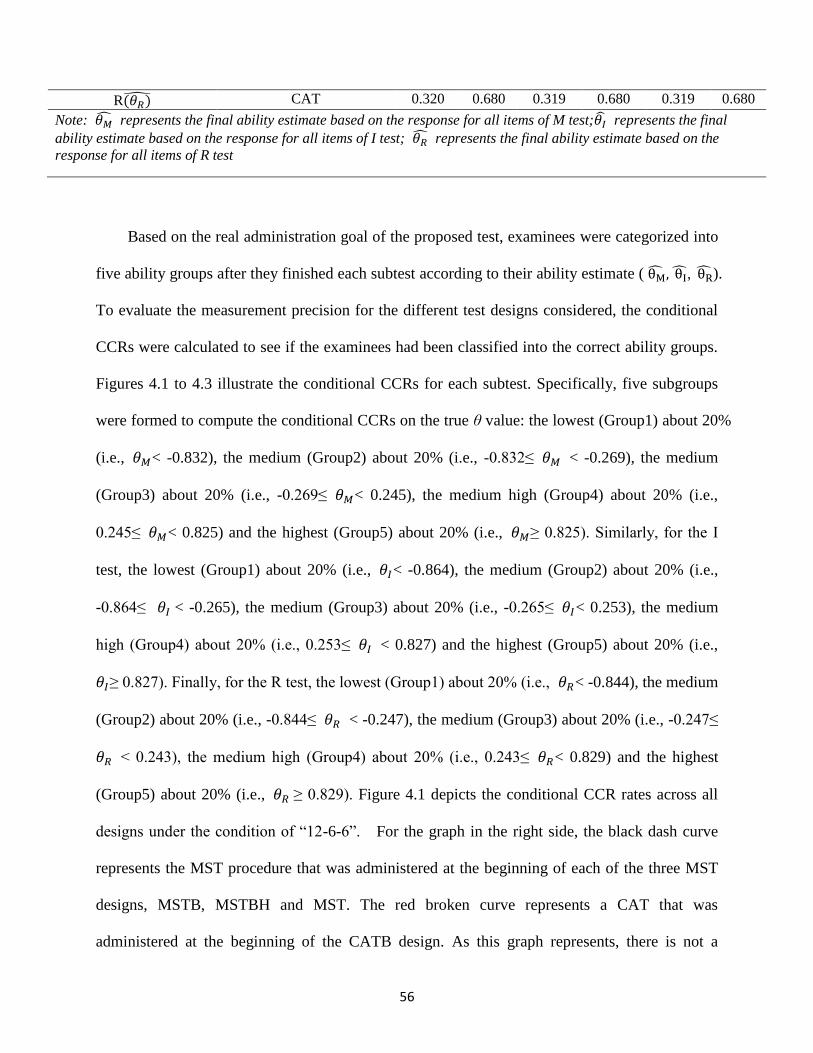
56
Based on the real administration goal of the proposed test, examinees were categorized into
five ability groups after they finished each subtest according to their ability estimate ( θM, θI, θR).
To evaluate the measurement precision for the different test designs considered, the conditional
CCRs were calculated to see if the examinees had been classified into the correct ability groups.
Figures 4.1 to 4.3 illustrate the conditional CCRs for each subtest. Specifically, five subgroups
were formed to compute the conditional CCRs on the true θ value: the lowest (Group1) about 20%
(i.e., 𝜃𝑀< -0.832), the medium (Group2) about 20% (i.e., -0.832≤ 𝜃𝑀 < -0.269), the medium
(Group3) about 20% (i.e., -0.269≤ 𝜃𝑀< 0.245), the medium high (Group4) about 20% (i.e.,
0.245≤ 𝜃𝑀< 0.825) and the highest (Group5) about 20% (i.e., 𝜃𝑀≥ 0.825). Similarly, for the I
test, the lowest (Group1) about 20% (i.e., 𝜃𝐼< -0.864), the medium (Group2) about 20% (i.e.,
-0.864≤ 𝜃𝐼 < -0.265), the medium (Group3) about 20% (i.e., -0.265≤ 𝜃𝐼< 0.253), the medium
high (Group4) about 20% (i.e., 0.253≤ 𝜃𝐼 < 0.827) and the highest (Group5) about 20% (i.e.,
𝜃𝐼≥ 0.827). Finally, for the R test, the lowest (Group1) about 20% (i.e., 𝜃𝑅< -0.844), the medium
(Group2) about 20% (i.e., -0.844≤ 𝜃𝑅 < -0.247), the medium (Group3) about 20% (i.e., -0.247≤
𝜃𝑅 < 0.243), the medium high (Group4) about 20% (i.e., 0.243≤ 𝜃𝑅< 0.829) and the highest
(Group5) about 20% (i.e., 𝜃𝑅 ≥ 0.829). Figure 4.1 depicts the conditional CCR rates across all
designs under the condition of “12-6-6”. For the graph in the right side, the black dash curve
represents the MST procedure that was administered at the beginning of each of the three MST
designs, MSTB, MSTBH and MST. The red broken curve represents a CAT that was
administered at the beginning of the CATB design. As this graph represents, there is not a
R(𝜃𝑅 ) CAT 0.320 0.680 0.319 0.680 0.319 0.680
Note: 𝜃�� represents the final ability estimate based on the response for all items of M test;𝜃�� represents the final
ability estimate based on the response for all items of I test; 𝜃�� represents the final ability estimate based on the
response for all items of R test
57
significant difference between these two curves across all ability groups. It implies that at the
beginning of all proposed designs, the MST performed similarly to the CAT in classifying
examinees into their corresponding ability groups. The middle graph of the Figure 4.1 shows the
conditional CCR curves for all designs when the I test was applied to the examinees. Here, the
blue curve presents the conditional CCR curve across all ability groups when administering an
OMST with the MLE estimation method to the MSTB design. The green curve presents the
conditional CCR curve across all ability groups when administering an OMST with the EAP
estimation method to the MSTB design. Each curve represents showed a U-shaped. As can be
shown in this graph, at the middle of the ability scale the difference of these four curves was
obviously. However, at the higher and lower end of the ability scale the difference of all curves
was practically negligible. Specifically, the blue curve performed similarly to the red and black
curves, in terms of measurement precision for extreme proficiency examinees, but was
considerably more precise at measuring examinees with average abilities. The green curve
performed better than the red and black curves across all ability groups, but was less precise than
the blue curve at measuring examinees with average abilities. The right graph includes the
conditional CCR curves for all designs after the R test was administered. The purple curve of this
graph represents a CAT using MLE estimation method of the MSTBH design. The light blue
curve represents a CAT using EAP estimation method of the MSTBH design. The results
indicate that the two OMST procedures (blue and green curves) that used either of the two
estimation methods, continued to perform well, in terms of classifying examinees of average
ability. Interestingly, the black curve performed better than either the red or the light blue one for
groups 1 and group 2, but performed worse for groups 3, 4, and 5. Besides that, the blue curve
performed similarly to the red and black curves, in terms of measurement precision for extreme
proficiency examinees (group1 and group 5), but was considerably more precise at measuring

58
examinees with average abilities (group2, group3, and group4). The green curve performed
better than the red and black curves across all ability groups, but was less precise than the blue
curve at measuring examinees with average abilities. When the MSTBH assigned a CAT-EAP,
instead of an OMST, at the end of the battery, the purple curve performed worse classification
accuracy than the blue and green ones. Conditioning on module length, all test designs
depicted in Figures 2 and 3 performed similarly, in terms of measurement accuracy at the
extremes, with less accuracy and more differences near the center of the ability distribution. All
designs (battery and non-battery) differed only slightly for the examinees at extremes. However,
the measurement accuracy of the MSTB design was considerably better for examinees of
average ability, especially when using EAP estimation method. Moreover, changing the module
length of the initial MST did not result in a noticeable impact on measurement precision for the
tests considered in this study.
Figure 4.1: Conditional CCR curves under “12-6-6” condition across all design.

59
Figure 4.2: Conditional CCR curves under “6-6-12” condition across all design.
Figure 4.3: Conditional CCR curves under “8-8-8” condition across all design.
Test Security Properties
Table 4.2 presents the mean, SD, and maximum exposure rates for the final estimated 𝜃s
(i.e., 𝜃��, 𝜃��, 𝜃��) across all deigns under different condition. To evaluate the mean exposure
situation for each subtest, the item exposure rate for each item was computed, and then the mean
item exposure rate was computed by averaging all item exposure rates. To evaluate how well
these designs controlled over-exposure of popular items; the standard deviation and maximum
item exposure rates among all items were reported as well.

60
Table 4.2 indicates that administering a CAT at the beginning of testing decreases item
exposure situation, yields the lower mean item exposure rate (0.04). When examinees moved to
the second test, which is I test, an OMST procedure with borrowing estimation information from
previously administered test was administered to both the MSTB and MSTBH designs.
Administering an OMST followed by a MST doesn’t improve the item exposure control.
According to the descending order, the I test administered by the OMST-MLE procedure
provided the largest maximum item exposure rate (0.76), which is three times higher than that
obtained from the MST procedure. The I test administered by the OMST-EAP one provided the
second highest maximum item exposure rate, and the I test administered by the CAT procedure
provided the third highest maximum item exposure rate. Administering a MST for the I test
provided the best item exposure rate, with the lowest max item exposure rate (0.219). According
to Cheng & Chang (2009), the item exposure rate for every item should not exceed 0.20 in one
item pool. Therefore, both the MSTB and MSTBH designs results in serious over-exposure of
certain items in this case because all the values mentioned before are larger than 0.2. Same as the
measurement precision evaluation, all the designs performed similarly across three module
length conditions.
Table 4.2: Statistics of Item Exposure Rates
MSTB Design
Estimation
Test Order Design 12-6-6
12
6-6-12 8-8-8
Mean SD Max Mean SD Max Mean SD Max
M (θM) MST
0.173 0.096 0.229 0.099 0.036 0.211 0.103 0.045 0.197
I (θI) OMST-MLE
MLE
0.123 0.171 0.761 0.122 0.169 0.746 0.122 0.169 0.744
OMST-EAP
MLE
0.126 0.149 0.669 0.125 0.149 0.663 0.125 0.149 0.666
R(𝜃𝑅 ) OMST-MLE
MLE
0.121 0.165 0.648 0.122 0.165 0.650 0.122 0.165 0.651
OMST-EAP
MLE
0.124 0.145 0.586 0.123 0.145 0.587 0.124 0.145 0.588
MSTBH Design
0.334
0.687
0.323

61
M (θM) MST
MLE
0.173 0.096 0.229 0.099 0.036 0.211 0.103 0.045 0.197
I (θI) OMST-MLE
MLE
0.123 0.171 0.761 0.122 0.169 0.746 0.122 0.169 0.744
OMST-EAP
MLE
0.126 0.149 0.669 0.125 0.149 0.663 0.125 0.149 0.666
R(𝜃𝑅 ) CAT-MLE
MLE
0.040 0.048 0.402 0.040 0.048 0.401 0.040 0.048 0.398
CAT-EAP
MLE
0.040 0.045 0.363 0.040 0.045 0.365 0.040 0.045 0.364
MST Design
M (θM) MST 0.173 0.096 0.229 0.099 0.036 0.211 0.103 0.045 0.197
I (θI) MST 0.097 0.030 0.219 0.095 0.042 0.250 0.100 0.048 0.241
R(𝜃𝑅 ) MST 0.095 0.037 0.242 0.090 0.032 0.161 0.096 0.039 0.206
CATB Design
M (θM) CAT 0.040 0.027 0.137 0.040 0.026 0.137 0.040 0.026 0.137
I (θI) CAT 0.041 0.046 0.474 0.040 0.046 0.474 0.040 0.046 0.474
R(𝜃𝑅 ) CAT 0.040 0.045 0.354 0.040 0.045 0.354 0.040 0.045 0.354
Note: 𝜃�� represents the final ability estimate based on the response for all items of M test;𝜃�� represents the
final ability estimate based on the response for all items of I test; 𝜃�� represents the final ability estimate based
on the response for all items of R test
To evaluate test security properties, Table 4.3 presents the item usage rates for the
different designs. The results indicate that when utilizing the CAT procedure under either
battery design (CATB) or hybrid design (MSTBH) leads to the desired patterns of item usage
rate across conditions, which is almost 100%. This implies that all 600 items in the item pool
were, administered at least once, indicating good item pool usage when test security is of
concern. However, this is not true when utilizing either only the MST algorithm under the
battery design (MSTB) or the non-battery design (MST) desirable item exposure property. Only
43% of the items were used for the MST design and only 33% for MSTB design, which is a
much worse item usage rates than was obtained for the CATB and MST designs.
Table 4.3: Item Usage Rate
MSTB
Test Order 12-6-6 6-6-12 8-8-8
M (θM) MST
0.43 0.44 0.39
I (θI) OMST-MLE
MLE
0.32 0.32 0.32
OMST-EAP
MLE
0.31 0.31 0.31
R(𝜃𝑅 ) OMST-MLE
MLE
0.32 0.32 0.32
OMST-EAP
MLE
0.32 0.31 0.32
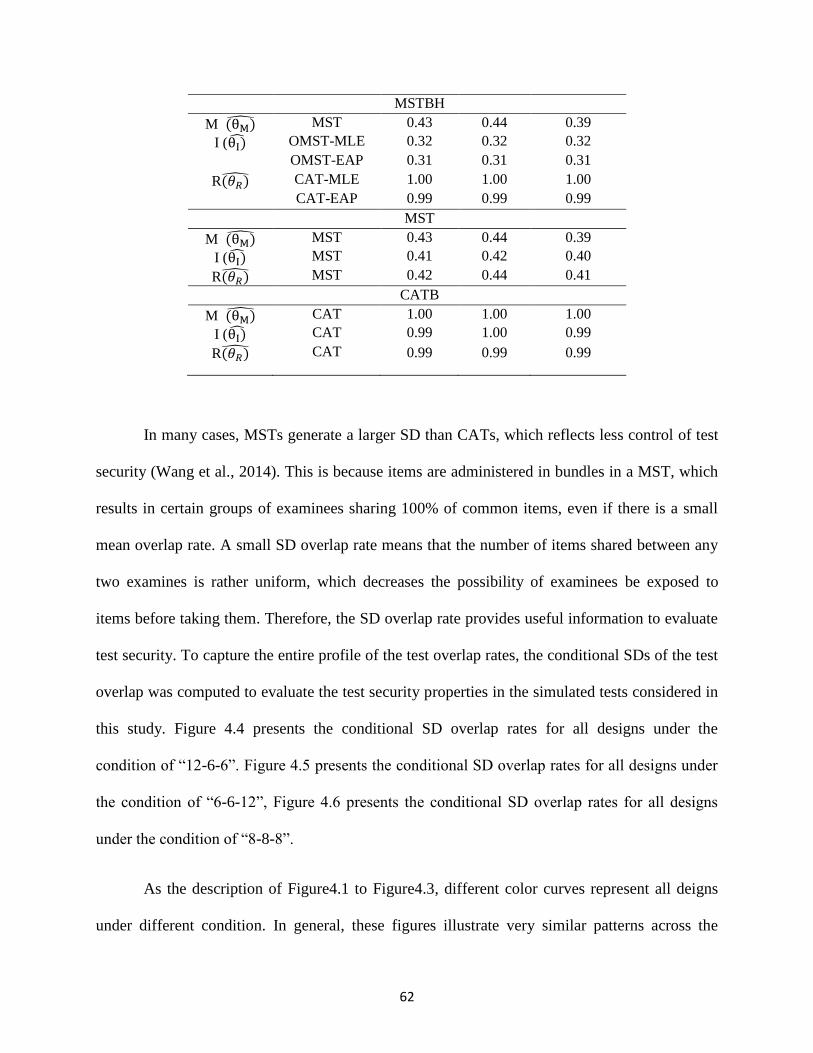
62
MSTBH
M (θM) MST
MLE
0.43 0.44 0.39
I (θI) OMST-MLE
MLE
0.32 0.32 0.32
OMST-EAP
MLE
0.31 0.31 0.31
R(𝜃𝑅 ) CAT-MLE
MLE
1.00 1.00 1.00
CAT-EAP
MLE
0.99 0.99 0.99
MST
M (θM) MST 0.43 0.44 0.39
I (θI) MST 0.41 0.42 0.40
R(𝜃𝑅 ) MST 0.42 0.44 0.41
CATB
M (θM) CAT 1.00 1.00 1.00
I (θI) CAT 0.99 1.00 0.99
R(𝜃𝑅 ) CAT 0.99 0.99 0.99
In many cases, MSTs generate a larger SD than CATs, which reflects less control of test
security (Wang et al., 2014). This is because items are administered in bundles in a MST, which
results in certain groups of examinees sharing 100% of common items, even if there is a small
mean overlap rate. A small SD overlap rate means that the number of items shared between any
two examines is rather uniform, which decreases the possibility of examinees be exposed to
items before taking them. Therefore, the SD overlap rate provides useful information to evaluate
test security. To capture the entire profile of the test overlap rates, the conditional SDs of the test
overlap was computed to evaluate the test security properties in the simulated tests considered in
this study. Figure 4.4 presents the conditional SD overlap rates for all designs under the
condition of “12-6-6”. Figure 4.5 presents the conditional SD overlap rates for all designs under
the condition of “6-6-12”, Figure 4.6 presents the conditional SD overlap rates for all designs
under the condition of “8-8-8”.
As the description of Figure4.1 to Figure4.3, different color curves represent all deigns
under different condition. In general, these figures illustrate very similar patterns across the
63
different module-length conditions. When examinees completed the first test under the MST
design there was a much larger SD test overlap rate for all ability groups on this first test, the M
test, when compared to the CAT design. This finding is consistent with Wang et al. (2013)’s
conclusion that MSTs usually have larger SD test overlap than CATs. When a OMST was
administered to the I test of the MSTB design, the SD overlap culver indicated better overlap
properties than the MST procedure of the MST design, but still not as good as what was obtained
from the CAT procedure of the CATB design. In the middle of all designs, when administering
an OMST to the I test, for any two randomly selected examinees, fewer item were shared
between them when compared to administer a MST procedure. However, more items were
shared between certain examinees when compared to administer a CAT procedure, on average.
The left graph of Figure 4.4 indicates that when administering a CAT at the end of the test
battery design. This graph shows several different forms of a curve. The MST one provides a
U-shaped curve, indicating the conditional SDs for examinees with extreme abilities were larger
than the conditional SDs for examinees of average ability. For the two MSTB designs, lower SD
overlap rates were observed for examinees of low or average ability, while higher SD overlap
rates were observed for examinees of medium to high ability. In conclusion, if every item in an
item pool has an equal probability of being selected then the SD overlap rate is minimized,
which can lead to an ideal security scenario.

64
Figure 4.4: Conditional SD overlap curves under 12-6-6 among best conditions
Figure 4.5: Conditional SD overlap curves under 6-6-12 among best conditions
Figure 4.6: Conditional SD overlap curves under 8-8-8among best conditions
In sum, when examinees moved to the second test, the MST procedure generated larger
overall and conditional SDs compared to those obtained from the CAT procedure. Moreover, the

65
conditional SD values are likely to be larger than the overall SD. This is because when
examinees have similar abilities, they tend to receive similar items or modules. In summary, no
matter which ability group is considered, the SDs obtained from using a CAT design was the
smallest. Merging CATs and MSTs into a hybrid test should improve the accuracy of early stage
ability estimates (Wang et al., 2015). This study further demonstrated that the hybrid design
could improve the overall measurement precision of a MSTB. As the order of the tests in the
battery changes, the measurement precision of an MSTB can be further improved upon when the
“On-the-Fly” routing strategy is employed, especially for examinees of average ability.
Therefore, the overall measurement precision of the MSTB is considerably greater than the two
baseline models (MST and CATB) when the sequential test(s) can borrow information from the
previously administered test. The overall test security results obtained from the CATB and MST
designs are consistent with the idea that a CAT usually provides greater test security than an
MST. The MSTB design, however, did not perform, as robustly, in terms of controlling test
security, as its SD test overlap did not increase to the same levels as the two baseline models and
the MSTBH design for the extreme ability groups.
V. DISCUSSION
Conclusions
The current study investigated four test designs: MST, CATB, MSTB, and MSTBH
under the 3PL IRT models across different conditions. Simulation studies were conducted for all
the conditions on each of which ten replications were carried out 10,000 simulated examinees on
each replication. Two sets of criterion indices were calculated to evaluate measurement precision
and test security, i.e., 1) The precision of the classification decision, including overall correct

66
classification rates, conditional correct classification rate, and root means square error (RMSE);
and 2) The test security properties, including mean item exposure rate, item usage rate, overall
and conditional overlap rates were calculated across each condition. The results pertaining to the
three research questions are presented in the following.
1) How does the MSTB design compare to the MSTBH design, regarding measurement
precision (estimation accuracy and classification accuracy) and test security control?
Through comparing the performance of MSTB and MSTBH designs in terms of
measurement accuracy, the difference between these two designs mainly occurred when
examinees moved to the third test, when the OMST procedure was applied to the MSTB design
and the CAT procedure was applied to the MSTBH design. The results indicated that applying
the OMST to the MSTB design yielded higher measurement accuracy, higher correct
classification rate, and lower RMSE across varied conditions. In terms of test security, applying
the OMST procedure didn’t yield reasonable item exposure control. Applying a CAT
procedure to a MSTBH design provided better exposure rates (both mean and maximum) the
MSTB design. However, neither design controlled the maximum exposure rate below 0.2.
Furthermore, both the MSTB and the MSTBH yielded worse item usage rates than that of the
CATB and MST designs, with the MSTBH resulting in better SD overlap rates.
2) What is the benefit of utilizing collateral information on measurement accuracy
(estimation accuracy and classification accuracy) of MST battery designs?
The results indicated that the overall measurement precision of the MSTB and MSTBH
designs with utilizing collateral information is considerably better than the MST design which
does not borrow information from the previously administered tests. In terms of measurement

67
precision, the results indicate that utilizing the collateral information in the test battery design
can improve the classification accuracy. Specifically, directly borrowing previous subtest
estimation as a prior, which is a straightforward and effective method to reduce the estimation
error for those examinees who have average abilities. However, in terms of test security
properties, the method would not reduce item exposure rates.
3) What effect does the “On-the-Fly” routing strategy have on the measurement accuracy
(estimation accuracy and classification accuracy) and test security control properties of
the MST battery designs?
The performance of a MST battery can be greatly improved when the “On-the-Fly”
design is used as a routing strategy. As the number of tests in the battery increase, the advantages
of using a MSTB become obvious, especially for extreme ability groups. However, employing
the “On-the-Fly” strategy to the MST battery design did not maintain the maximum item
exposure rate under an ideal level.
The comparison among different module-length conditions suggests that administering a
longer routing stage of the first MST at the beginning of the test battery did not show the
outperformance of improving estimation precision for the following subtests. In addition, the
comparison between whether to utilize MLE or EAP estimation methods on test battery designs
indicates that under the conditions where collateral information is employed, using EAP method
was more stable than the MLE method in estimating examinees’ abilities. The study also found
that both the MSTB and MSTBH designs yielded better measurement accuracy, especially for
improving the correct classification rate in the middle range of the ability scale. Although all
battery designs yielded acceptable mean exposure control properties across different conditions,
they were not able to meet the ideal specified maximum exposure control rate and maintain
68
excellent pool utilization. Therefore, certain types of exposure control mechanisms need to be
considered in future study.
One interesting finding of the study is that there is a connection between the maximum
item exposure rate and RMSE. Specifically, minimizing the item exposure rate of a test results in
a larger RMSE. Regarding exposure control properties, the CATB design was relatively robust to
changes in underlying conditions and resulted in the lowest maximum exposure rates and highest
item usage rates. However, the design did not result the best measurement accuracy. On the
other hand, the MSTB design performed in an opposite fashion --- higher item exposure rates
and better measurement accuracy. Therefore, the improvement of test security control may lead
to sacrificing measurement accuracy.
Limitation and Directions for Future Research
The results of the current study may raise a number of new research questions. While test
battery designs can increase measurement precision, it is not clear how to better control item
expense under such designs, and therefore, future research should be conducted in this regard. As
previously described, one major reason for unevenly distributed item exposure rates is that the
item selection process does not items evenly. Another reason is that the use of maximum
information to select items results in more frequently selecting high discriminating items.
Many theoretical and empirical studies have shown that it is possible to build an item selection
algorithm in Computerized Adaptive Testing that keeps a good balance between high test
security and high measurement accuracy. It will be interesting and important to extend these
methods to MSTB designs. Actually, many aspects of the a-stratified procedure (Chang and Ying,
1999) for controlling item exposure still need to be studied in the context of test battery designs.
In addition to pre-stratifying the item pool, controlling the proportion of each item being

69
administered is another solution that has been used to address test security issues in adaptive
designs, such as the SH method, which distinguishes item selection process from item
administration process. Hence, in future studies, different exposure control strategies should
be investigated in the context of test battery designs, in particular in a situation where
information from previously administered tests is borrowed for the next test.
As MST has become a prominent testing mode in large-scale educational assessment, such
as the Law School Admissions Test (LSAT), the Test of English as a Foreign Language (TOEFL)
and the National Assessment of Educational Progress (NAEP), more and more research needs to
be done to address practical issues that can further improve measurement efficiency, content
validity, and test security. Another limitation of the current study is that all the items
considered in the study were stand-alone single items in the assembly process of the test battery
designs. In real large scale testing, many tests are formed by both single stand-alone items and
testlets (or item groups). A testlet (Wainer & Kiely, 1987) refers to a set of items that measure a
content area and these items can administer the trait of certain content area together. For example,
items within each set may all pertain to a common passage in a reading comprehension test. To
make a versatile MST design, various non-statistical constraints, including item type constraints
should be considered during the assembly process. This is especially important, given that
testlets may yield better testing efficiency (Wainer, Bradlow, &Wang, 2007). If a MST included
both single items and testlets, it would be interesting to investigate how the assembly and
management algorithms can support different item formats in one test.
70
REFERENCES
Ackerman, T. (1989, March). An alternative methodology for creating parallel test forms using
the IRT information function. Paper presented at the annual meeting of the National
Council for Measurement in Education, San Francisco.
Bergstrom B. A., & Lunz, M. E. (1999). CAT for certification and licensure. In F. Drasgow & J.
B. Olson-Bunchanan (Eds.), Innovations in computerized assessment (pp. 67-91).
Mahwah, NJ: Lawrence Erlbaum Associates.
Birnbaum, A. (1968). Some latent traits and their use in inferring an examinee’s ability. In F. M.
Lord, & M. R. Novick, Statistical theories of mental test scores. Reading, MA:
Addison-Wesley.
Bock, R. D., & Mislevy, R. J. (1982). Adaptive EAP estimation of ability in a microcomputer
environment. Applied Psychological Measurement, 6, 431-444.
Bond, T., & Fox, C. (2007). Applying the Rasch Model: Fundamental Measurement in the
Human Sciences (2nd ed.). Mahwah, NJ: Lawrence Erlbaum Associates.
Boughton, K. A., Yao, L., & Lewis, D. M. (2006, April). Reporting diagnostic subscale scores
for tests composed of complex structure. Paper presented at the annual meeting of the
National Council on Measurement in Education, San Francisco
Breithaupt, K., Ariel, A., & Veldkamp, B. P. (2005). Automated simultaneous assembly for
multistage testing. International Journal of Testing, 5(3), 319-330.
Brown, J. M., & Weiss, D. J. (1977). An adaptive testing strategy for achievement test batteries.
(Research Report No. 77-6). Minneapolis: University of Minnesota, Psychometric
Methods Program.
Carlson, S. (2000). ETS finds flaws in the way online GRE rates some students. Chronicle of
Higher Education, 47(8), A47.

71
Chang, H. H. (2004). Understanding computerized adaptive testing: from Robbins-Monro to
Lord and beyond. In D. Kaplan (Ed.), The SAGE handbook of quantitative methodology
for the social sciences, (pp. 117-133). Sage Publications.
Chang, H. H. (2014). Psychometrics behind computerized adaptive testing. Psychometrika.
Published online Feb. 2014.
Chang, H. H., & Ying, Z. (1996). A global information approach to computerized adaptive
testing. Applied Psychological Measurement, 20, 213-229.
Chang, H.-H., & Ying, Z. (2008). To weight or not to weight? Balancing influence of initial
items in adaptive testing. Psychometrika, 73, 441–450
Cheng, Y., & Chang. H.-H. (2009). The maximum priority index method for severely
constrained item selection in computerized adaptive testing. British Journal of
Mathematical and Statistical Psychology, 62, 369-383.
Chen, J., & Choi, J. (2009). A Comparison of Maximum Likelihood and Expected A Posteriori
Estimation for Polychoric Correlation Using Monte Carlo Simulation. Journal of Modern
Applied Statistical Methods, 8, 337-354.
Chen, S., Hou, L., Fitzpatrick, S. J., & Dodd, B. G. (1997). The effect of population distribution
and method of theta estimation on computer adaptive testing using the rating scale model.
Educational and Psychological Measurement, 57(3), 422-439.
Davey, T., & Nering, M. (2002). Controlling item exposure and maintaining item security. In C.
Mills, M. T. Potenza, J. J. Fremer and W. C. Ward (Eds.), Computer-Based Testing:
Building the Foundation for Future Assessments, Mahwah, NJ: Lawrence Erlbaum
Associates.
Davis, L. L., & Dodd, B. G. (2003). Item Exposure Constraints for Testlets in the Verbal
Reasoning Section of the MCAT. Applied Psychological Measurement, 27(5), 335-356.

72
Embretson, S. E. & Reise, S. P. (2000). Item response theory for psychologists. Mahwah, NJ:
Lawrence Erlbaum Associates, Inc.
Gialluca, K. A., & Weiss, D. J. (1979). Efficiency of an adaptive inter-subtest branching strategy
in the measurement of classroom achievement (Research Report 79-6). Minneapolis:
University of Minnesota, Department of Psychology, Psychometric Methods Program,
Computerized Adaptive Testing Laboratory.
Guo, R., Gao, Liu, C.Y., & Gao, X.H. (2013). Multistage Testing with Item Pool Stratifications
and Non-statistical Constraints in a Large Scale Test. ACT Research Report Series
2013.
Hambleton, R. K., & Swaminathan, H. (1985). Item response theory: principles and
applications. Boston: Kluwer-Nijhoff Publishing.
Hambleton, R. K., Swaminathan, H, & Rogers, H. J. (1991). Fundamentals of Item Response
Theory. Newbury Park: Sage Publications.
Hambleton, R. K., & Xing, D. (2006). Optimal and nonoptimal computer-based test designs for
making pass-fail decisions. Applied Measurement in Education, 19(3), 221-239.
Hendrickson, A. (2007). An NCME instructional module on multistage testing.
Educational Measurement: Issues and Practice, 26(2), 44-52.
Jodoin, M. G. (2003). Psychometric properties of several computer-based test designs with ideal
and constrained item pools. Unpublished doctoral dissertation, University of
Massachusetts at Amherst.
Jodoin, M. G., Zenisky, A., & Hambleton, R. K. (2006). Comparison of the psychometric
properties of several computer-based test designs for credentialing exams with multiple
purposes. Applied Measurement in Education, 19(3), 203-220.

73
Keng, L. (2008). A comparison of the performance of testlet-based computer adaptive tests and
multistage tests. Unpublished doctoral dissertation, University of Texas, Austin
Kim, H., & Plake, B. S. (1993). Monte Carlo simulation comparison of two-stage testing and
computerized adaptive testing. Paper presented at the Annual Meeting of the National
Council on Measurement in Education, Atlanta.
Luecht, R. M. (1998). Computer-assisted test assembly using optimization heuristics. Applied
Psychological Measurement, 22(3), 224-236.
Luecht, R. M. (2000). Implementing the computer-adaptive sequential testing (CAST)
framework to mass produce high quality computer-adaptive and mastery tests. Paper
presented at the Annual Meeting of the National Council on Measurement in Education,
New Orleans, LA.
Luecht, R. M. (2003, April). Exposure control using adaptive multi-stage item bundles. Paper
presented at the Annual Meeting of the National Council on Measurement in Education,
Chicago, IL.
Luecht, R. M., Brumfield, T., & Breithaupt, K. (2006). A testlet assembly design for adaptive
multistage tests. Applied Measurement in Education, 19(3), 189-202.
Luecht, R. M., & Nungester, R. J. (1998). Some practical examples of computer-adaptive
sequential testing. Journal of Educational Measurement, 35, 229-249.
Loyd, B. H. (1984). Efficiency and precision in two-stage adaptive testing. Paper presented at the
Annual Meeting of the Eastern Educational Research Association, West Palm Beach,
Florida.
Lord, F. (1970). Some test theory for tailored testing. In W.H. Holzman (Ed.),
Computer-Assisted Instruction, Testing, and Guidance (pp. 139-183). Harper and Row,
New York.

74
Lord, F. M. (1971). A theoretical study of two-stage testing. Psychometrika, 36, 227–242.
Lord, F. M. (1974). Practical methods for redesigning a homogeneous test, also for
designing a multilevel test. Educational Testing Service RB-74–30.
Lord, F. M. (1980). Applications of item response theory to practical testing problems. HillSD
overlapale, NJ: Lawrence Erlbaum.
McBride, J. R. & Martin, J. T. (1983). Reliability and validity of adaptive ability tests in a
military setting. In D. J. Weiss (Ed.), New horizons in testing (pp.223-226). New York,
Academic Press.
Mead, A. D. (2006). An introduction to multistage testing. Applied Measurement in Education,
19(3), 185-187.
Merritt, J. (2003). Why the folks at ETS flunked the course—a tech-savvy service will soon be
giving B-school applicants their GMATs. Business Week, December 29, 2003.
Mislevy, R.J., Johnson, E.G., and Muraki, E. (1992). Scaling procedures in NAEP. Journal of
Educational Statistics, 17, 131-154.
Owen, R. J. (1969). A Bayesian approach to tailored testing (Research Report 69-92). Princeton,
NJ: Educational Testing Service.
Owen, R. J. (1975). A Bayesian sequential procedure for quantal response in the context of
adaptive mental testing. Journal of the American Statistical Association, 70, 351-356.
Parshall, C. G., Spray, J., Kalohn, J., Davey, T. (2002). Practical considerations in
computer-based testing. New York: Springer-Verlag.
Patsula, L. N. (1999). A comparison of computerized adaptive testing and multistage testing.
(Doctoral dissertation). University of Massachusetts Amherst, MA.
Rosenbaum, P. R. (1988). Item bundles. Psychometrika, 53(3), 349-360.

75
Samejima, F. (1969). Estimation of latent trait ability using a response pattern of graded scores.
Psychometrika Monograph, No. 17.
Schnipke, D. L., & Reese, L. M. (1997). A comparison of testlet-based test designs for
computerized adaptive testing. Paper presented at the annual meeting of the American
Educational Research Association, Chicago, IL.
Stark, S., & Chernyshenko, O. S. (2006). Multistage testing: widely or narrowly applicable?
Applied Measurement in Education, 19(3), 257-260.
Stocking, M. L., & Swanson, L. (1993). A method for severely constrained item selection in
adaptive testing. Applied Psychological Measurement, 17(3), 277-292.
Stout, W., Ackerman, T., Bolt, D., Froelich, A., & Heck, D. (2003). On the Use of Collateral
Item Response Information to Improve Pretest Item Calibration. Law School Admission
Council Computerized Testing Report 98-13.
Sympson, J. B., & Hetter, R. D. (1985). Controlling item exposure rates in computerized
adaptive testing. Paper presented at the annual meeting of the Military Testing
Association. San Diego: Navy Personnel Research and Development Center.
Swanson, L., & Stocking, M. L. (1993). A model and heuristic for solving very large item
selection problems. Applied Psychological Measurement, 17(2), 151-166.
Thissen, D., & Mislevy, D. (2000). Testing Algorithms. In H. Wainer (Ed.), Computerized
adaptive testing: A primer (2nd ed., pp. 101-134). Mahwah, NJ: Lawrence Erlbaum
Associates.
van der Linden, W. J. (1999). Empirical initialization of the trait estimator in adaptive testing.
Applied Psychological Measurement, 23(1), 21-29.
van der Linden, W. J. (2005). Linear models for optimal test design. New York: Springer-Verlag.
76
van der Linden, W. J. (2010). Sequencing an adaptive test battery. In W. J. van der Linden & C.
A. W. Glas (Eds.). Elements of Adaptive Testing (pp 103-119). New York, NY: Springer.
van der Linden, W. J.,& Boekkooi-Timminga, E. (1989). A maximin model for test design with
practical constraints. Psychometrika, 53, 237-247.
Vispoel, W. P. (1998). Reviewing and changing answers on computer adaptive and selfadaptive
vocabulary tests. Journal of Educational Measurement, 35, 328–345.
Wainer, H., Kaplan, B., & Lewis, C. (1992). A comparison of the performance of
simulated hierarchical and linear testlets. Journal of Educational Measurement, 29, 243–251.
Wainer, H. (2000). Computerized adaptive testing: A primer (2nd ed.). Mahwah, NJ: Lawrence
Erlbaum Associates.
Wainer, H., & Kiely, G. (1987). Item clusters and computerized adaptive testing: A case for
testlets. Journal of Educational Measurement, 24, 185-202.
Wainer, H., & Thissen, D. (1987). Estimating ability with the wrong model. Journal of
Educational Statistics, 12, 339-368.
Wainer, H. (1995). Precision and differential item functioning on a testlet-based test: The 1991
Law School Admissions Test as an example. Applied Measurement in Education, 8,
157-187.
Wainer, H., Bradlow, E. T., & Wang, X. (2007). Testlet response theory and its applications.
New York, NY: Cambridge University Press.
Wainer, H., & Kiely, G.L. (1987). Item clusters and computerized adaptive testing: A case for
testlets. Journal of Educational Measurement, 24, 185-201
Wang, C., Zheng, Y., & Chang, H.-H. (2014). Does standard deviation matter? Using "standard
deviation" to quantify security of multistage testing. Psychometrika, 79 (1), 154-174.

77
Wang, S., Lin, H., Chang, H.,& Douglas, J.A. (2015). Hybrid Computerized Adaptive Testing:
From Group Sequential Design to Fully Sequential Design. Journal of Educatonal
Measurement, under the second round review.
Wang,X., Nozawa,Y.,&Gao, X-H.(2012). A Study on Adaptive Test Battery: The Impact of
Collateral Information and Subtest Sequencing on Classification Accuracy. ACT
Research Report Series 2012.
Weiss, D. J. (1982). Improving measurement quality and efficiency with adaptive testing.
Applied Psychological Measurement, 6, 473-492.
Weiss, D.,& Kingsbury, G (1984). Application of Computerized Adaptive Testing to Educational
Problems. Journal of Educational Measurement, 21(4), 361-375.
Yan, D., Lewis, C., & von Davier, A.A. (2014). Overview of Computerized Multistage Tests. In
Yan, D.L., von Davier, A.A.,& Lewis, C (Eds). Computerized Multistage Testing: Theory
and Applicaiton (pp 1-20). New York, NY: CRC Press.
Yao, L., & Boughton, K. A. (2007). A multidimensional item response modeling approach for
improving subscale proficiency estimation and classification. Applied Psychological
Measurement, 31, 83–105.
Zenisky, A.(2004). Evaluating the effects of several multi-stage testing design variables on
selected psychometric outcomes for certification and licensure assessment (Doctoral
dissertation. University of Massachusetts, Amherst, MA, 2004.
Zenisky, A., Hambleton, R. K., & Luecht, R. M. (2010). Multistage testing: Issues, designs, and
research. In W. J. van der Linden & C. A. W. Glas (Eds.), Elements of adaptive testing
(pp. 355-372). New York: Springer.

78
Zheng, Y., & Chang, H. (2014). On-the-Fly assembled multistage adaptive testing, Applied
Psychological Measurement. Published online on September 5, 2014. DOI:
10.1177/0146621614544519
Zheng, Y., Nozawa, Y., Gao, X.H.,& Chang, H. H. (2012) Multistage Adaptive Testing for a
Large-Scale Classification Test: Design, Heuristic Assembly, and Comparison with Other
Testing Modes. ACT Research Report Series 2013(6).
Zheng, Y., Wang, C., Culbertson., & Chang, H.H. (2014). Overview of Test Assembly Methods
in Multistage Testing. In Yan, D.L., von Davier, A.A.,& Lewis, C (Eds). Computerized
Multistage Testing: Theory and Applicaiton (pp 1-20). Chapman and Hall/CRC.
79
CURRICULUM VITAE
Wen Zeng
Place of Birth: Shanghai, China
Education
B.A., Shanghai Ocean University, June 2009
Major: Management Information System
Ph.D., University of Wisconsin Milwaukee, June 2015
Major: Educational Psychology
Dissertation Title: Making Test Batteries Adaptive By Using Multistage Testing Techniques
Graduate Internships
Summer Internship, ACT Inc., June-July 2014
Department:Measurement Research Department
Teaching Experience
Teaching Assistant, University of Wisconsin Milwaukee, Sepertember 2013 – May 2014
Research Experience
Project Assistant, University of Wisconsin Milwaukee, September 2010- June 2011
Research Assistant, University of Wisconsin Milwaukee August 2011 – June2013 and August
2014- June 2015
Presentations
Zeng, W., Lin, H-Y & Walker, C. (April 2015). Adaptive Designs of Test Batteries with
Multistage Testing Models. Paper presented at the Annual Meeting of the National
Council on Measurement in Education (NCME), Chicago, IL.
Zeng, W., Walker, C. & Tang, S-W. (April 2015). The Impact of Dichotomizing Polytomous
Items and Using SIBTEST to Test for DIF. Paper presented at the Annual Meeting of the
National Council on Measurement in Education (NCME), Chicago, IL.
Zeng, W., Lin, H-Y. & Gao, X-H. (July 2014). Exploring Designs of Multistage Testing Battery.
Paper presented at the ACT Inc. summer internship report meeting, Iowa City, IA.
Zeng, W., Wang, C. & Chang, H-H. (April 2013). Improving Latent Trait Estimation by the Item
Weighted Methods for Computerized Adaptive Testing. Paper presented at the Annual
Meeting of the American Educational Research Association, San Francisco, CA.
Top Related