


Languages
Pages
Legal


EconomicResearch
DepartmentNº 0905
Main sources of uncertainty informulating potential growthscenarios for oil supply

1
Main sources of uncertainty in formulatingpotential growth scenarios for oil supply
Tatiana Alonso Gispert† ,BBVA Economic Research Department
3 March 2009
Abstract
The purpose of this paper is to provide an informed contribution to the existing debate on the topic of
peak oil and the future sustainability of the prevailing dominant energy model. More specifically, the
primary objective is to heighten general awareness of the high levels of uncertainty currently plaguing
the future physical potential of global oil supply. The main sources of uncertainty pinpointed in this analysis
are rooted, on the one hand, in the general shortage of verifiable information on the volume of existing
reserves and, on the other, in our collective hazy knowledge regarding the current rate of decline of the
world’s oil supply. The reliability of available estimates concerning these two variables has been clearly
thrown into doubt by the poor quality and availability of the source data employed.
JEL codes: Q31, Q32, Q38
Key words: Oil reserves, rates of decline, oil, peak oil, Hubbert peak theory, future oil production.
† E-mail: [email protected]

2
1 Excluding Alaska2 The Oil Depletion Analysis Centre (United Kingdom), The Uppsala HydrocarbonDepletion Study Group (Sweden), Energywatchgroup (Germany).
1. IntroductionPetroleum is an energy-rich hydrocarbon that formed
millions of years ago. Since its discovery towards the
middle of the nineteenth century, nations worldwide have
been struggling to harness it in increasing volumes, so
much so that it now forms the backbone of the current
energy model. Despite the efficiency gains reported over
the last thirty years, the global populace remains heavily
dependent on oil to cover over a third of its energy needs,
a figure that increases further in more developed
economies and reaches its zenith in the transportation
industry, where oil accounts for 95% of total energy
consumption.
The availability of abundant oil supplies at reasonable
prices is, therefore, an absolute must to ensure the
healthy running of the global economy and international
trade. Nevertheless, whereas oil consumption has
increased by over 43% over the last thirty years, the
volume of newly discovered conventional oil reserves has
slumped by over 50%. In stark contrast to a replacement
ratio of 2:1 towards the end of the seventies (two barrels
of oil discovered for each barrel consumed), we are
currently witnessing a ratio perhaps even worse than 1:3
(three barrels of oil consumed for each barrel discovered).
Despite the fact that oil is indeed an abundant natural
resource, its finite nature, coupled with our limited
extraction capabilities (as it currently stands, we are only
able to extract 35% of the total oil discovered in the
subsoil) and the sharp growth in global demand, would
all suggest that world oil production could well peak on a
global scale within the next two decades, unless we
witness major technological improvements and/or a
significant reduction in consumption.
Different parties have put forward widely divergent
estimates on the probability of this scenario occurring
(diverging also on the approximate date on which it could
occur). As will be seen, this is largely due to the shortage
of reliable information on the value and current state of
the main independent variables required to reach an
accurate estimate of future oil supply. Of these variables,
we would highlight the quantity and quality of estimated
oil reserves and the rate at which global production will
decline in the future due to natural causes.
In the nineteen fifties, the North American geologist K.
Hubbert came up with a theory (coined Hubbert peak
theory or simply peak theory), which he used to forecast
peak production within the US. To elaborate further,
Hubbert claimed that by the mid-seventies U.S.1 oil
production would hit its global maximum at around 3.5
million barrels per day (Mbd). Although actual maximum
production in fact turned out to be 4.5 Mbd, the peak did
indeed occur in 1970, much to the surprise of many. This
fact, combined with the two oil crises of 1973 and 1980,
led to rapidly increasing concern and alarm over the
question of future oil supply. However, these concerns
all but vanished in the wake of the low oil prices prevailing
from the mid-eighties onward all the way to the start of
the twenty-first century, together with the development
of major OECD oil wells.
Between 2005 and 2008, the spike in the price of
commodities, particularly oil (Brent barrel prices hit an
all-time high of 147 dollars in July 2008), once again
brought the issue to the fore and placed it firmly on the
front page of political agendas and international
economics. Yet the devastating global financial and
economic crisis unleashed in the summer of 2008 brought
about a sharp and unexpected u-turn in global demand.
In less than four months, oil prices plummeted by more
than 60% to return to levels not witnesses since 2005.
Although the pressing need to address looming oil
challenges has resided considerably in the short term
due to the foregoing, most experts still remain concerned
about the long term outlook. On the one hand, we can be
sure that the current situation of “low” prices (i.e. below
the average marginal cost of production, estimated at
roughly 70 dollars/barrel), together with the difficulties
most oil companies are experiencing in obtaining funding,
are combining to foster a scenario of low investment,
which could considerably weaken the industry’s future
capacity to meet renewed demand following the current
recession (ITPOES, 2008). On the other, the stagnation
we are seeing in the production of conventional crude
since 2005 has rekindled the debate on the validity of
the Hubbert peak theory (Korpela, 2006).
We are dealing with an immensely polarised debate. At
one end of the spectrum, we have a group made up
mostly of retired geologists and engineers who have been
brought together under the Association for the Study of
Peak Oil (ASPO, founded in 2000), along with other
similar non-governmental organisations.2 This group,

3
3 Proponents of this idea can find excellent backing in the famous words of SheikhZaki Yamani, a prominent former minister of the OPEC, when he claimed “thestone age came to an end not for a lack of stone, and the oil age will end, but notfor a lack of oil”.4 For further illustration, see Porter 2006.
which we will refer to as “pessimistic”, believes that the
global volume of remaining conventional oil reserves is
less than generally accepted by, for example,
organisations as important as the International Energy
Agency (IEA). The pessimists also consider it highly
unlikely that discoveries of new reserves will have the
required significance to reverse the downward trend we
are seeing in the replacement ratio. All this has led them
to the conclusion that peak global production of
conventional oil is on the near horizon (if indeed we
haven’t passed it already), and although they are quick
to underscore the importance of non-conventional oil
(such as natural gas liquids and tar sands), they believe
that their potential will be seriously hindered by economic
and environmental factors. As a result, they conclude that
world oil production (including conventional and non-
conventional sources) could reach its global peak before
2030, at levels of between 90 and 100 Mbd.
On the other side of the debate, we have the detractors
from peak theory, or the “optimists”, who maintain that
historic estimates of future global oil supply were proven
systematically biased downwards (Lynch 2001). The
sceptics are mostly economists who uphold the validity
of official figures on reserves and rates of decline and
essentially trust that technological advances and
prevailing price signals will spur on global oil production
to beyond the 110-Mbd mark in 2030. Some experts even
posit that peak oil will not result from supply restrictions,
but rather from slackening demand stemming from
efficiency gains and/or the replacement of oil with
alternative superior energy sources, as was the case with
coal in the first half of the twentieth century (Smil, 2005).3
Although traditionally speaking this latter group had
previously boasted the tacit support of industry and most
analysts and public bodies, the oil shock experienced
between 2005 and 2008 actually tipped the scales in
favour of the less optimistic advocates. In addition to the
vast range of books written on the subject of peak oil,4
we mustn’t forget the warnings of the IEA and numerous
analysts, as well as concerns voiced by a growing number
of oil companies.
Regardless of the exact date on which global peak oil
production will be reached (a topic in its own right not
covered by this document), the mere possibility that world
oil production could peak within the next twenty years
represents (in conjunction with the fight against climate
change) the greatest hurdle facing global risk
management in the history of modern economics (Hirsch,
2005). If demand is unwilling or unable to react in time,
the potential outcome of a prolonged energy shortage
could lead to major geopolitical and economic unrest,
with associated costs far outstripping those we would
incur from adopting preventing measures (WEC, 2007).

4
5 The Energy Returned on Energy Invested ratio (shortened to EROEI) can bedefined as the amount of final energy (oil barrels) obtained per unit of equivalentenergy expended in the extraction process.6 The first oil extractions in the middle of the nineteenth century were able toprovide 50 barrels of oil for each barrel consumed in the recovery, transport andrefinery process. Since then, the ratio has been gradually narrowing as companieshave had to drill for less accessible petroleum. As it currently stands, we recoverbetween one and five barrels of crude for each barrel expended in the process.
2. Peak oil theoryPractically all of the world’s oil reservoirs are typified by anextraction curve characterised by an initial stage (growth),in which production increases, an intermediate stage(plateau), during which production levels off, and a finalstage (decline), at which time production drops. Bear inmind that the specific timeline of each curve tends to vary,depending on geological, technical and economic variables,and all too often maximum economic returns takeprecedence over optimum recovery conditions bothtechnically and geologically speaking.
Oil extraction entails a gradual loss of pressure from insidethe well, which must be combated by turning to increasinglycomplex and expensive techniques. This entails additionalconsumption of resources, which in turns drags down theEnergy Returned on Energy Invested ratio (EROEI)5 . Asthe EROEI erodes the profitability of the operation (bothfinancially and in terms of energy), the point can be reachedwhere it is no longer profitable to continue stepping upproduction. From this time onward, the oil field enters themature phase, characterised by an initially constant andsubsequently declining primary recovery volume. Uponreaching the point when the effort required to produce onebarrel of oil outstrips the profit obtained from selling it, thebest decision is simply to close down the oil field, eventhough there may still be petroleum in the subsoil.6
Smaller oil fields and/or those located offshore (particularlyin deep waters) are typically exploited more rapidly andmore aggressively, meaning that they reach their peak morequickly and at higher production levels (measured as apercentage of reserves) than larger/onshore oil fields. Thesefields therefore reach their peak having produced a higherpercentage of their reserves, so that the subsequent declinein production is accordingly more pronounced (IEA, 2008).
If we combine the production curves of all the oil fields of agiven region, placing the larger and more profitable fieldsat the start and the smaller ones towards the end (as tendsto be the case when exploring and developing most oil-producing regions), we obtain a bell-shaped curve depictingglobal production. In 1956, Hubbert formulated this curvefor the US, explaining that production growth obeyed thelaws of logistics as follows:
dQ/dt= aQ(1-Q/Q0)
where Q is cumulative production at each reference datet, dQ/dt is the production volume at each reference datet, Q
0 is the total volume of estimated reserves initially-in-
place and k is a parameter that reflects the maximumpotential production growth rate. Given that the right sideof this equation is a parabola whose maximum point isreached at Q
0/2, the model predicts that peak oil will occur
when half of the initial reserves (Q0) have been depleted
(Korpela, 2006).
With the help of this theory, Hubbert was able to forecastwhen U.S. oil production would peak, although he wassome way off in his prediction for global peak oil, whichhe claimed would be reached between 1995 and 2000.Proponents of Hubbert’s theory put this deviation downto the existence of distorting factors, specifically variousrestrictions on investing and production, which werebarely evident when Hubbert developed his model.Hubbert was therefore unable to anticipate the drop inglobal oil production and demand in the wake of the 1973and 1980 crises, nor the resulting raft of policiesimplemented by the OPEC in an attempt to curb supply,nor for that matter the more recent advent of deep wateroil reservoirs and other non-conventional products inglobal oil supply. Far from invalidating Hubbert’s modeland all the forecasts based thereon over the years, the“pessimists” believe that the shortcomings describedabove simply reflect the intrinsically unpredictable natureof what the future holds in store.
Applying this method to currently available informationon the volume of global oil reserves initially-in-place(between 2,000 and 2,500 Gb, of which between 800and 1,300 Gb are estimated to remain), conventional oilwould peak somewhere between 2005 and 2013(Korpela, 2006). According to data from the U.S. EnergyInformation Administration, production of conventionalcrude has remained unchanged at around 75 Mb since2005 (WEC, 2007). As a result, followers of Hubberttheory have now turned their attention to when exactlypeak oil will be reached.
In order to answer this question, we must firstly analysethe main variables that have a bearing on potential futureproduction, leaving aside possible financial and/orgeopolitical restrictions. It is advisable in this respect tohighlight the volume of existing reserves (how muchpetroleum we can recover up to the cut-off) and theexpected rates of decline (the speed at which productiondecreases for wells that have already peaked). As wewill see, it is impossible to obtain consistent estimates ineither case, which has a very negative bearing on thereliability of future supply scenarios.

5
Estimates of conventional oil reserves(year-end 2007)
Source: IEA 2008, ASPO 2008, Enerdata 2006 and EWG 2008
0 200 400 600 800 1000 1200 1400
O&GJ
IHS
WEC
BP
OPEP
World Oil
EWG
Billion barrels (Gb)
3. Oil reservesOf the total oil resources identified in the world’s subsoil,
current technology only allows us to recover around a
third. This volume of potentially recoverable resources,
known as reserves, is simply the total expected future
production. We therefore have no way of knowing the
exact volume until the well has been closed down. In the
absence of any write-ups of initially estimated reserves,
the volume of remaining reserves of an oil field at any
given time is equal to this estimated volume initially-in-
place less cumulative production to date.
There are various bodies that publish estimates of world
oil reserves, most of them private companies. As
illustrated in the following chart, the various published
figures place remaining reserve volume at around 1,100
to 1,300 billion barrels (Gb). There is a far from
insignificant difference of 200 Gb between the lowest and
the highest estimates, which in fact comes close to the
estimated reserves of Saudi Arabia and equates to over
six years of worldwide oil consumption on a global scale.
The main differences between the published figures on
existing reserves are largely due to three causes. Firstly,
we are missing a clear distinction between conventionaloil and non-conventional oil. The existence of inconsistent
definitions for each concept has given rise to significant
differences in reserve estimates for countries with vast
amounts of non-conventional resources, such as Canada
and Venezuela. Secondly, there are key differences in
the definition that different countries afford to the concept
of proven reserves. In the strictest sense, only a small
percentage of reserves (US, United Kingdom, Norway
and a few other nations) have been effectively proven,
whereas it is highly likely that all remaining reserves refer
to reserves strictly classified as proved and probable(Laherrère, 2006). Lastly, there is widespread suspicion
that a number of the more prominent OPEC oil producers
hiked their oil reserve figures ad-hoc in the nineteen
eighties, with an aggregate effect of close to 300 Gb,
approximately one quarter of the current estimate of
remaining global reserves (WEC 2007, IEA 2008, EWG
2007).
3.1 Conventional oil vs. non-conventional oil
The starting point for any assessment is to define the
object to be measured. Petroleum (from the ancient Greek
word petrelaion, meaning “rock oil”) is a viscous and
relatively dense liquid made up of chains of hydrocarbons
of various lengths (from C5H
12 to C
42H
86). The particular
manner in which these different chains are arranged
results in various different kinds of petroleum, which can
then be refined to produce a wide variety of end products.
The greater the prevalence of short chains, the greater
the quality of the extracted oil (in terms of viscosity and
density) and the more energy-rich the end products
obtained (chemical compounds used within the
petrochemical industry, petrol, diesel and kerosene).
Longer hydrocarbon chains, in contrast, provide a greater
volume of products but with a lower energy value
(lubricating oils, fuel oil for heating and electricity
production, or bitumen for paving and roof insulation).
When these products are burned for final use, the
hydrocarbon chains are converted, together with oxygen
from the air, into carbon dioxide (CO2) and water (H
2O),
while releasing an enormous amount of thermal energy.
The longer the chains, the greater the release of
contaminating emissions, particularly CO2.
Lastly, there is a common misconception that petroleum
accumulates in underground pockets, whereas in reality
it tends to be trapped inside the pores of limestone or
sandstone formations. The more viscous and dense it is,
the more difficult it becomes to extract the petroleum from
these pores and pump it to the surface.
Bearing in mind all these geological and physicochemical
variables, we can identify the following types of petroleum
or oil:
1. Crude or “light” oil: low-density oil that flows freely
from the subsoil through the use of classic pumping
technologies. The most important remaining reserves
are located in the Middle East and Russia. These

6
offer the lowest extraction costs, at around 5 to 20
dollars per barrel on average.
2. Natural gas liquids (NGL): liquid hydrocarbons that
are found in natural gas fields and flow to the surface
during the gas extraction process. These include
propane, butane, ethane, pentane, natural gasoline
and other condensates.
3. Petroleum stored under the sea (offshore): light crude
located at depths of 400m to 1500m, or often deeper
than 1500m (super-deep water). The main reserves
are found in Brazil, the US, Angola and Nigeria.
Although the extraction costs vary enormously, they
tend to be significantly higher than for conventional
crude (64 dollars/barrel for US offshore reservoirs in
2006, according to EIA figures).
4. Polar oil (or Arctic oil): light crude found primarily in
hard-to-access Arctic zones that generally present
a high ecological value.
5. Heavy oils, with high or very high densities:
5.1. Heavy and extra heavy oil: flows to the surface
very slowly, if at all. Requires special
infrastructures and production and transport
techniques that consume huge amounts of
energy and water. Venezuela (Orinoco) and
Canada (Alberta) boast the largest resources
identified to date.
5.2. Tar sands: mixtures of sand, water and heavy
hydrocarbons (bitumen). They are extracted in
compact strips using surface mining techniques.
Once brought to the surface, the bitumen is
extracted from the rocks and sand. The process
is highly intensive in terms of energy and water
and produces a considerable amount of
contaminating emissions and waste in the form
of sand and rock. The largest reserves are
located in Canada (Alberta).
6. Synthetic oils, obtained from:
6.1. Shale oil: shale is a compact sedimentary rock
with properties similar to clay. It is impregnated
with an organic material known as kerogen,
which, once heated to very high temperatures
(500ºC), can be converted into a liquid fuel with
properties akin to low-quality coal. The shale is
extracted through mining techniques, and the
whole process is extremely energy and water-
intensive, as well as being environmentally
unfriendly. Large amounts can be found in the
U.S. (Colorado, Utah, Wyoming).
6.2. Other products obtained from: coal (coal to
liquids, or CTL), natural gas (gas to liquids, or
GTL) and biomass (biomass to liquids, or BTL).
Through the use of laboratory techniques,
certain products can be converted into liquid
fuels with more or less similar properties to petrol
and diesel.
Crude oil (category 1) is what has been largely extracted
to date. It currently supplies roughly 85% of oil demand
worldwide (EIA, 2007).
Natural gas liquids (category 2) have also been produced
en masse for many years and currently account for
approximately 11% of the world’s oil demand (WEC,
2007).
The other types of petroleum cannot be produced using
conventional recovery techniques, either due to problems
accessing them or other logistical constraints (categories
3, 4 and 5.2), or because they require different extraction
techniques more akin to traditional mining approaches
(categories 5.1 and 6.1), or alternatively special synthesis
techniques (category 6.2).
Most geologists include light crude and NGL (categories
1 and 2) within the conventional oil category, whereas
remaining categories are treated as non-conventional oil.This classification is used by the World Energy Council
(WEC, 2007), the Association for the Study of Peak Oil
(ASPO, 2007), the Energy Watch Group (EWG, 2007)
and the IEA, although the latter also classifies more
accessible offshore and polar oil as conventional oil (IEA,
2008).
That said, the most commonly used databases tend to
work around a more economics-oriented definition,
according to which conventional oil is that which can be
extracted profitably based on current techniques and
prices (non-conventional oil would encompass what’s
left).
Although on the face of it, this definition appears more
straight-forward and intuitive, the downside is that it
actually draws a subjective and wobbly line between both

7
Reserve distribution at an oil field
Source: BBVA ERD and EWG 2007
Pro
babi
lity
(%)
100
90
80
70
60
50
40
30
20
10
00 150 300 450 600 750
1P (proven): 90%
2P (proven+proved): 50%
3P ( proven, proved,provable): 10%
Reserves (Mb)
7 As we are not dealing with a symmetric distribution (almost never occurs inthese cases), the median does not coincide with the mean, although it doesmeasure the closest point to the latter.
categories of oil. Expected returns, coupled with the
evolution of financial variables, such as the cost of capital,
production costs and oil prices, are key inputs. The higher
the expectations of the evaluator, the more non-
conventional oil will instead be labelled as conventional,
and vice-versa.
3.2 Proved, probable and possible reserves
As mentioned above, the resources of an oil field reflect
the amount of oil that this could contain, whereas reservesmeasure the part of these resources that could be
extracted in the future. Drawing an accurate line between
resources and reserves is of paramount importance when
establishing realistic limits for future production scenarios.
The reserves of an oil field are essentially a percentage
of the resources identified (the so-called recovery factor),which depends largely on the porosity and permeability
of the rock structure in question. There are major
differences between the recovery factors observed at
different wells. The most permeable and porous rock can
boast recovery factors of 85%, while less porous
structures will struggle to get past 10%. The average
recovery factor worldwide is considered to be 35%
(Falcone et al., 2007).
There is currently no generally accepted international
standard dictating the minimum requirements needed to
prove the existence and quantity of identified oil (and gas)
resources, and enabling us to measure and classify
estimated reserves (IEA, 2008). The methodologies
proposed by the United Nations (1997 and 2004) were
ignored by the petroleum industry, which instead opted
to formulate its own classification system. In 2001, the
Society of Petroleum Engineers (SPE), the World
Petroleum Council (WPC) and the American Association
of Petroleum Geologists (AAPG) reached an agreement
to create a standard for classifying reserves based on
their probability of occurrence under commercial
conditions. This system, as subsequently updated in
2007, has been coined the Petroleum Resources
Management System (PRMS) and draws a distinction
between different reserves: proved, probable andpossible.
Proved reserves (1P or P90) are those for which the
extraction probability under commercial conditions
amounts to at least 90%, whereas probable and possiblereserves have an assigned a minimum probability of 50%
and 10% respectively. By adding probable reserves to
proved reserves, we get the aggregate proved andprobable reserves (2P or P50), whose cumulative
probability of occurrence is 50%. Lastly, the combined
total of proved, probable and possible reserves gives us
the broadest aggregate figure for reserves (3P or P10),
whose aggregate probability of occurrence is 10%.
As illustrated in the following chart, proved reserves (1P)
afford us a conservative estimate of the potential reserves
to be found in a given reservoir.
The proved reserves (1P) of this particular oil field equal
110 million barrels (Mb), although the greatest probability
of actual occurrence (mode) climbs to around 200 Mb,
with the median standing at 250 Mb (2P), more than twice
the value of the proved reserves.7 When total reserves
for a given country or region are calculated by adding
the proved reserves of all its reservoirs, we are in fact
underestimating the expected value (or median) of
potential future production for the country or region. For
this reason, and from a statistical standpoint, adding and
comparing reserves between regions on the basis of 1P
figures is the wrong path to take. Instead, we should
employ 2P figures, which are much closer to the expected
mean value of the reserves of a particular field or region.
Although there is no widely accepted definition of what is
meant by “commercial conditions”, it is clear that
variations in assumptions made regarding recovery costs,
the geology of the reservoir, available technology, access
to the markets and final price, amongst other factors, can
prompt 2P reserves to be reclassified as 1P (for example,
a drop in costs or an increase in the forecast price may
result in a reclassification of probable reserves to proved,
or vice-versa).
8
Evolution of the conventional world oil reservesaccording to BP data (LHS), and R/P ratio (RHS)
Source: BP Statistical Review 2008
0
200
400
600
800
1000
1200
1400
1980
1982
1984
1986
1988
1990
1992
1994
1996
1998
2000
2002
2004
2006
Res
erve
s (G
b)
0
5
10
15
20
25
30
35
40
45
50
R/P
in y
ears
RESERVES
R/P
Evolution of conventional oil production and newdiscoveries (average value by decade)
Source: AIE 2008
0
20
40
60
80
100
120
140
160
1960
-69
1970
-79
1980
-89
1990
-99
2000
-06
Gb/
year
Production
Discoveries
Accumulated discoveries
Accumulated production
8 The reserves-to-production ratio (R/P) is generally used to make a quick andapproximate calculation of the number of years over which it will be possible tomaintain current oil production levels. That said, it presents a number of seriousdrawbacks that are increasingly rendering its use ill-advised. To elaborate, theratio is based on the unlikely event that production volume will remain unchangedyear after year until the reserves are depleted, at which time production cuts offcompletely.
9 In its yearly statistical publication, BP clearly states that the information containedtherein comes from various sources consulted (O&G, WO, OPEC) and that itdoes not, therefore, necessarily reflect the views of the company itself regardingthe value of the reserves.
Considering that aggregate 1P affords a “prudent”
assessment of reserves, the US Securities Exchange
Commission has, for many years, been requiring all oil
companies operating in the country to publish their proved
reserves (1P), a practice which has since been adopted
by most international oil companies worldwide. It is
interesting to note, however, that these companies
continue to base their internal strategic exploration and
production decisions on 2P reserves.
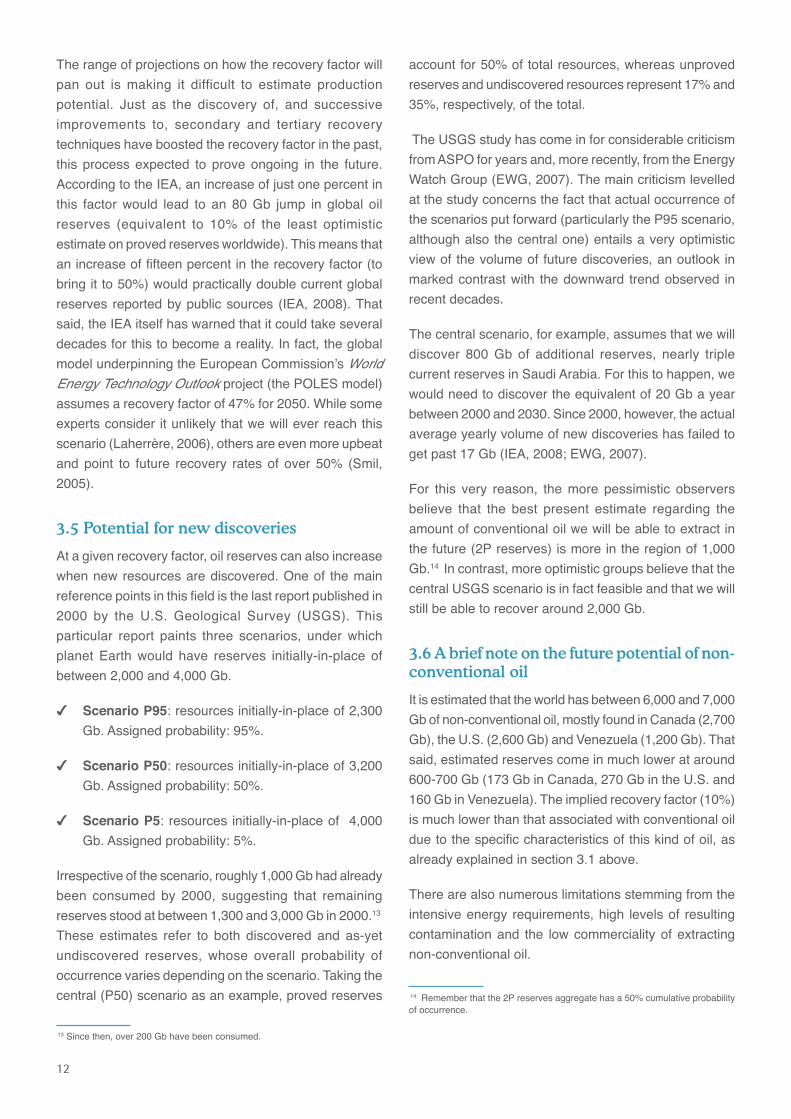
As a result, and in an attempt to offset the downward
bias inherent in proved reserves, many producing
companies and countries often write up their proved
reserve figures. When taken as a whole, this practice
has helped to create the illusion that global petroleum
reserves have been steadily on the up over recent
decades, as depicted in the following chart formulated
from British Petroleum figures (Statistical Review of World
Energy 2008).
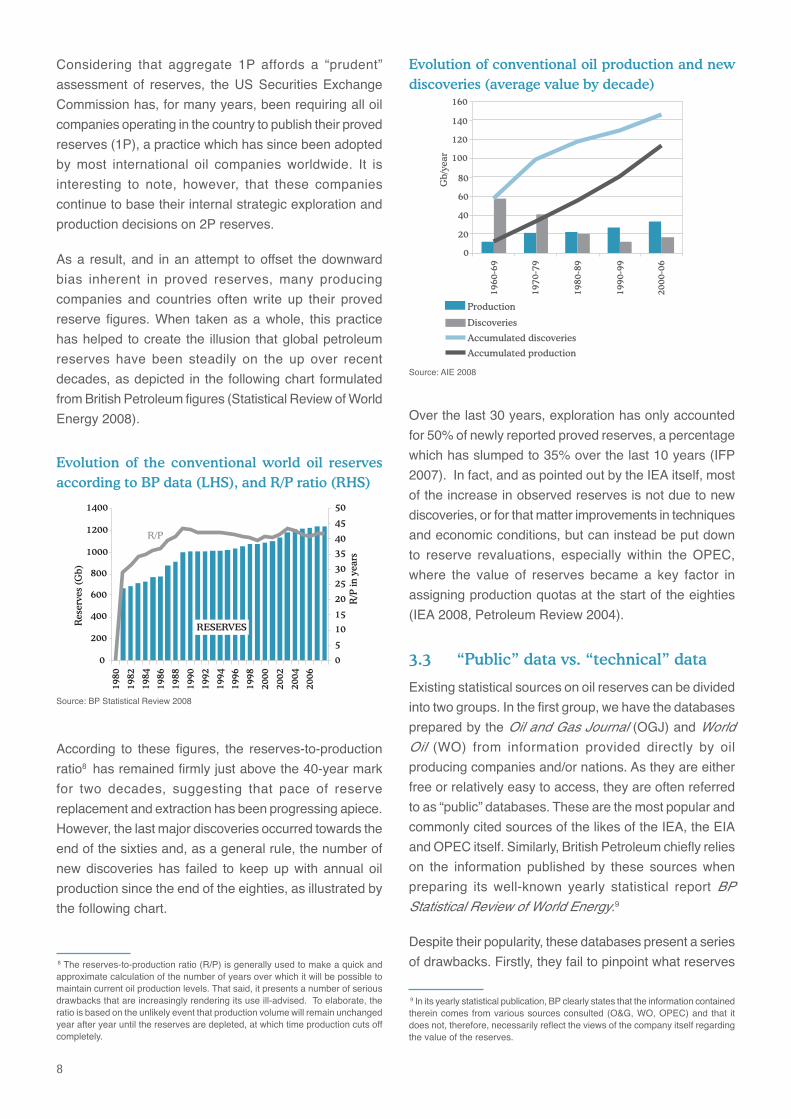
According to these figures, the reserves-to-production
ratio8 has remained firmly just above the 40-year mark
for two decades, suggesting that pace of reserve
replacement and extraction has been progressing apiece.
However, the last major discoveries occurred towards the
end of the sixties and, as a general rule, the number of
new discoveries has failed to keep up with annual oil
production since the end of the eighties, as illustrated by
the following chart.
Over the last 30 years, exploration has only accounted
for 50% of newly reported proved reserves, a percentage
which has slumped to 35% over the last 10 years (IFP
2007). In fact, and as pointed out by the IEA itself, most
of the increase in observed reserves is not due to new
discoveries, or for that matter improvements in techniques
and economic conditions, but can instead be put down
to reserve revaluations, especially within the OPEC,
where the value of reserves became a key factor in
assigning production quotas at the start of the eighties
(IEA 2008, Petroleum Review 2004).
3.3 “Public” data vs. “technical” data
Existing statistical sources on oil reserves can be divided
into two groups. In the first group, we have the databases
prepared by the Oil and Gas Journal (OGJ) and WorldOil (WO) from information provided directly by oil
producing companies and/or nations. As they are either
free or relatively easy to access, they are often referred
to as “public” databases. These are the most popular and
commonly cited sources of the likes of the IEA, the EIA
and OPEC itself. Similarly, British Petroleum chiefly relies
on the information published by these sources when
preparing its well-known yearly statistical report BPStatistical Review of World Energy.9
Despite their popularity, these databases present a series
of drawbacks. Firstly, they fail to pinpoint what reserves

9
10 As already seen, the U.S. and most developed countries tend to publish 1Preserves pursuant to the PRMS system. In contrast, Russia employs the ABC1classification system, under which, according to experts, overstates the equivalentin 2P reserves by approximately 30% (WEC, 2007).11 This is a legitimate phenomenon that has ravaged the OPEC. Over recentyears, the reserves of 37 oil producing countries have remained unchanged(Robelius 2007).
Evolution of the crude oil reserves of main OPECcountries
Source: Energy Watch Group 2007 (based upon data from BP 2006)
0
100
200
300
400
500
600
700
800
1980
1981
1982
1983
1984
1985
1986
1987
1988
1989
1990
1991
1992
1993
1994
1995
1996
1997
1998
1999
2000
2001
2002
2003
2004
2005
2006
2007
Gb
EAU Saudi Arabia IranIraq Venezuela ..Acc. Production since 1980
aggregate exactly they employ. They generally refer to
proved reserves, which they define as those quantities
that “can be recovered with a reasonable likelihood ofsuccess under existing economic and operatingconditions” (BP 2008), without specifying whether the
“reasonable” likelihood is 90% (as under the PRMS
system) or some other.
Depending on the reporting country, reported reserves
may therefore be closer to the 1P aggregate (most
countries from the OECD), the 2P aggregate (most of
the remaining countries) or even 3P (Russia) (Laherrère
2001, WEC 2007).10
Given the high strategic and political value attached to
reserves, reserve figures are kept strictly confidential in
most countries around the world (except for the U.S., the
United Kingdom and Norway). This makes it practically
impossible to verify the accuracy of the information that
oil producers furnish to the companies responsible for
preparing the public databases, detracting from the
credibility of their estimates.
We can find a clear example of this in the saga of strategic
write-ups reported in OPEC during the nineteen eighties,
which led to an increase in estimated 1P reserves of 300
billion barrels (300 Gb), despite the absence of any major
discoveries or significant technological advancements.
The successive waves of revaluations can be put down
to the agreement reached in 1982 within OPEC, under
which the production quotas for each country were to be
calculated thereafter on the basis of their reserves. There
is evidence to suggest that from 1982 onward, a number
of countries started to report the value of their original
reserves instead of remaining reserves, whereas others
directly inflated their reserves as required in order to
ensure they’d be awarded their desired production quota
(WEC, 2007; Salameh, 2004).
Moreover, the following chart confirms the fact that since
1990 figures on reserves for most OPEC countries have
remained unchanged, which is somewhat surprising in
the face of steadily increasing production.11 In order for
this to be possible, the volume of oil produced by each
country year after year would have to have been
equivalent to the volume of newly discovered reserves
(or those reclassified following operating or economic
improvements) for each country and year, a multiple event
that can be deemed improbable in light of the extensive
scope of the sample.
In contrast, “technical” databases manage to sidestep
most of the drawbacks associated with public databases,
although not all of them. These databases are prepared
by IHS (formerly Petroconsultants) and Wood Mackenzie(WM) by following a procedure that involves compiling
and aggregating technical data on 2P reserves from
thousands of oil fields worldwide. Given that we are
dealing with high-value added individual statistics, these
sources are not readily accessible by the wider public
(yearly subscription costs can reach 1,000,000 dollars,
clearly demonstrating the strategic value of thorough
reserve data).
By working with 2P aggregates, these databases
eliminate a significant chunk of the strategic bias typically
associated with public databases. They also backdate
their reserve estimates to the year of discovery (i.e., they
allocate new average reserve estimates retroactively to
the initial year of discovery and/or investment), thereby
ensuring that possible adjustments are not confused with
new discoveries.
At present, figures published by IHS and WM place global
reserves at around 1,200 Gb, not far off the 1,237 Gb
reported by BP in 2008, for example. That said, we mustn’t
forget that BP figures (public) allegedly refer to proved or
1P reserves, whereas IHS or WM figures (technical) refer
to 2P reserves, which, as explained above, paint a better
picture of the expected value of actual reserves. Adjusting

10
Evolution of world oil proven reserves: technical vs.public data
Source: Jean Laherrère 2006
0
200
400
600
800
1000
1200
1400
1940
1945
1950
1955
1960
1965
1970
1975
1980
1985
1990
1995
2000
2005
2010
Gb
Technical = 2 P
Public = 1 P
Oil reserves in Canada - most recent estimates (Gb)Canadian
government(AEUB) BP OGJ World Oil IHS EWG
Proven conventional and LNG 7 5Tar sands: proven/underdevelopment 21 21 20.6Total proven reserves 21 28 179 26 15 17
Conventional identified reserervesTar sands identified reserves 152 152Total identified reserves 152 152Total reserves 173 180 179 26 15 17
Source: IEA 2007, EWG 2007, EIA 2008
12 IHS is the current owner of consultancy firm Cambridge Energy ResearchAssociates (CERA).
the technical figures on 2P reserves by a conversion factor
of 75% gives us the technical 1P equivalent, which would
be between 25% and 44% less than public 1P figures
(Robelius, 2007).
Despite the foregoing, and although still more reliable
than public figures, technical data still come up against
certain problems. Numerous experts admit that although
the results obtained by Petroconsultants at the outset
were highly reliable due to the close (albeit informal) ties
among the multinational oil giants, the quality of the
information would have decayed substantially over recent
years due to deteriorating relationships with private
industry and the greater clout of state-owned oil
companies (WEC, 2007).12
In the absence of a better alternative, some independent
experts have resorted to working with modified versions
of the technical databases, either using the original
Petroconsultants data and adjusting it to take on board
reported production and new discoveries (ASPO), or
combining current IHS or WM data with qualitative
information obtained through formal or informal channels
(Energy Watch Group).
The following chart, taken from Laherrère 2006, depicts
the comparative evolution of O&GJ public data versus
the technical data estimated by Laherrère himself.
As we can observe, public reserves were much lower
than technical reserves up until 1985. This can largely
be put down to the fact that the former reflect the 1P
aggregate, whereas the latter refer to 2P. Nevertheless,
technical reserves start to tail off from 1980 onward due
to the effects of cumulative production and the decreasing
volume of discoveries. Over the same period, public
reserves remained stable and even experienced slight
increases. The gap between the two shrinks to nothing
as we reach 1990, in the wake of the large-scale
readjustments reported within OPEC in the mid-eighties
(300 Gb). From then onward, public figures remain
unchanged, whereas technical data continue to fall due
to the steadily decreasing replacement ratio. On a final
note, we can see how O&GJ figures leapt significantly in
2000, spurred by the inclusion of Canadian tar sands (179
Gb). Curiously, this jump is not reflected in the other
public databases, as illustrated in the following chart.

11
Crude oil reserves in main OPEC countries (Gb)
Country Oil & Gas Journal (a) BP Statistical (b) Campbell ( c ) Bakhtiari (d) IHS EWG
Iran 132.5 132.5 69 35 - 45 134 44Iraq 115 115 61 80 - 100 99 41
Kuwait 101.5 99 54 45 - 55 51.6 35Saudi Arabia 264.3 262.7 159 120 - 140 286 181
U.A.E. 97.7 97.8 44 40 - 50 56.6 39
Total 711 707 387 320 - 390 627.2 340
Source: Bakhtiari 2006( based upon different sources: a) O&GJ, 19 December 2005; b)BP 2005; c) ASPO, February 2006; d) Bakhtiari, February 2006).
On the other hand, in the case of OPEC, there is greater
consistency among public sources, which place total
proved reserves at around the 750Gb mark. As
demonstrated in the following chart, the most pessimistic
estimates (adjusted technical figures) would wipe up to
50% off the figures upheld by OPEC, based on “public”
databases, and widely relied on by most international
bodies and economic analysts.
3.4 Future improvements to the recoveryfactor
Although each oil field presents its own unique recovery
profile, we can identify three generic yet distinct phases
from a technical standpoint.
During the first stage, production steadily increases while
the field is being gradually constructed and extended to
reach its optimum projected size. In this phase, the natural
internal pressure of the well bore is enough to pump
petroleum to the surface through conventional “primary
recovery” techniques (vertical wells). Over time, however,
this pressure drops off and the recovery level begins to
deteriorate. As a general rule, this first stage accounts
for between 10% and 20% of the petroleum present in
the reservoir.
Economic conditions permitting, recovery will move to
the second stage, where an attempt is made to restore
the internal pressure of the well. To achieve this,
companies resort to secondary recovery techniques,
which include the use of special recovery pumps and
water flooding or gas injections (natural gas). This stage
tends to recover a further 10% to 20% of the petroleum
identified in the subsoil. One of the main side effects of
using these secondary recovery techniques is that they
increase the volume of water present within the well,
which, in turn, increases the amount of water obtained
per unit of liquid recovered (a variable known as watercut).
When the techniques employed during the second stage
prove insufficient and/or the water cut is too pronounced,
recovery may move on to a third stage, where much more
sophisticated and expensive tertiary or enhanced oilrecovery techniques are employed. These techniques
attempt to modify the chemical properties of the petroleum
to reduce its viscosity and make it easier to separate from
the rock. The process essentially involves injecting
chemical compounds or gases such as CO2, and applying
a range of different thermal heating techniques. Use of
enhanced oil recovery allows for recovery of a further
15% of existing resources in the reservoir, albeit at a
relatively high cost and with a notable reduction in EROI,
which is why its use tends to be limited to already mature
fields, those with high operating and maintenance costs
(offshore, polar, etc.), or non-conventional oil fields at
which the primary recovery factor is heavily reduced.
On average, making full use of all available techniques
(provided this proves commercially viable), the global oil
industry is able to extract between 27% (Laherrère, 2006)
and 35% (Schulte, 2005) of the total resources identified
in the subsoil. It is worth noting that this recovery factoris not a technical parameter, but rather an estimate of
the quotient between observed cumulative production and
resources initially-in-place. This means that the greater
the uncertainty shrouding the quality of available
information on resources and production, the less reliable
our estimates on the recovery factor will be.
12
13 Since then, over 200 Gb have been consumed.
14 Remember that the 2P reserves aggregate has a 50% cumulative probabilityof occurrence.
The range of projections on how the recovery factor will
pan out is making it difficult to estimate production
potential. Just as the discovery of, and successive
improvements to, secondary and tertiary recovery
techniques have boosted the recovery factor in the past,
this process expected to prove ongoing in the future.
According to the IEA, an increase of just one percent in
this factor would lead to an 80 Gb jump in global oil
reserves (equivalent to 10% of the least optimistic
estimate on proved reserves worldwide). This means that
an increase of fifteen percent in the recovery factor (to
bring it to 50%) would practically double current global
reserves reported by public sources (IEA, 2008). That
said, the IEA itself has warned that it could take several
decades for this to become a reality. In fact, the global
model underpinning the European Commission’s WorldEnergy Technology Outlook project (the POLES model)
assumes a recovery factor of 47% for 2050. While some
experts consider it unlikely that we will ever reach this
scenario (Laherrère, 2006), others are even more upbeat
and point to future recovery rates of over 50% (Smil,
2005).
3.5 Potential for new discoveries
At a given recovery factor, oil reserves can also increase
when new resources are discovered. One of the main
reference points in this field is the last report published in
2000 by the U.S. Geological Survey (USGS). This
particular report paints three scenarios, under which
planet Earth would have reserves initially-in-place of
between 2,000 and 4,000 Gb.
� Scenario P95: resources initially-in-place of 2,300
Gb. Assigned probability: 95%.
� Scenario P50: resources initially-in-place of 3,200
Gb. Assigned probability: 50%.
� Scenario P5: resources initially-in-place of 4,000
Gb. Assigned probability: 5%.
Irrespective of the scenario, roughly 1,000 Gb had already
been consumed by 2000, suggesting that remaining
reserves stood at between 1,300 and 3,000 Gb in 2000.13
These estimates refer to both discovered and as-yet
undiscovered reserves, whose overall probability of
occurrence varies depending on the scenario. Taking the
central (P50) scenario as an example, proved reserves
account for 50% of total resources, whereas unproved
reserves and undiscovered resources represent 17% and
35%, respectively, of the total.
The USGS study has come in for considerable criticism
from ASPO for years and, more recently, from the Energy
Watch Group (EWG, 2007). The main criticism levelled
at the study concerns the fact that actual occurrence of
the scenarios put forward (particularly the P95 scenario,
although also the central one) entails a very optimistic
view of the volume of future discoveries, an outlook in
marked contrast with the downward trend observed in
recent decades.
The central scenario, for example, assumes that we will
discover 800 Gb of additional reserves, nearly triple
current reserves in Saudi Arabia. For this to happen, we
would need to discover the equivalent of 20 Gb a year
between 2000 and 2030. Since 2000, however, the actual
average yearly volume of new discoveries has failed to
get past 17 Gb (IEA, 2008; EWG, 2007).
For this very reason, the more pessimistic observers
believe that the best present estimate regarding the
amount of conventional oil we will be able to extract in
the future (2P reserves) is more in the region of 1,000
Gb.14 In contrast, more optimistic groups believe that the
central USGS scenario is in fact feasible and that we will
still be able to recover around 2,000 Gb.
3.6 A brief note on the future potential of non-conventional oil
It is estimated that the world has between 6,000 and 7,000
Gb of non-conventional oil, mostly found in Canada (2,700
Gb), the U.S. (2,600 Gb) and Venezuela (1,200 Gb). That
said, estimated reserves come in much lower at around
600-700 Gb (173 Gb in Canada, 270 Gb in the U.S. and
160 Gb in Venezuela). The implied recovery factor (10%)
is much lower than that associated with conventional oil
due to the specific characteristics of this kind of oil, as
already explained in section 3.1 above.
There are also numerous limitations stemming from the
intensive energy requirements, high levels of resulting
contamination and the low commerciality of extracting
non-conventional oil.

13
Firstly, the process is extremely water and energy-
intensive. For example, Canada, the world’s leading
producer of non-conventional oil, has already
encountered water and natural gas supply problems for
its tar sand recovery operations. More specifically, rising
natural gas prices are jeopardising the continuing viability
of numerous projects. It is estimated that Canada will need
to consume more than twice its current natural gas
reserves to be able to extract all the tar sand reserves
present in its subsoil (Robelius, 2007). In light of these
concerns, Canada has been weighing up the merits of
constructing a number of nuclear power plants based on
the best-case scenario that it could quadruple its current
production of non-conventional oil by 2030, thereby
bringing its current one million barrels a day to 4-5 million
in 2030. This would account for roughly 5% of estimated
global demand for 2030.
The heavy dependence on energy and water
unfortunately entails a hefty environmental impact.
Specifically, the process generates vast amounts of
greenhouse gas emissions (three times above those
associated with conventional oil recovery operations in
Canada for example), and likewise requires proper
management of the rock waste produced by the extraction
process (approximately 1 ton of rock per barrel).
Economic and environmental restrictions are particularly
pronounced in the case of shale oil production in the U.S..
The resulting EROEI is very weak and the economic and
environmental costs simply too high to predict any more
than 1-2 million barrels a day in 2030.
Looking to Venezuela, the need to develop the necessary
infrastructures to step up production of extra-heavy oil
from within the Orinoco Belt could prove to be a major
hurdle unless investment conditions improve in the region.
With this in mind, the region is not expected to produce
more than 4 million barrels a day in 2030 (Robelius, 2007).
On a final note, future projections for deep-water oil
production remain very promising up to 2012, with
maximum production expected to come in at 10 Mbd.
From 2012 onward, however, production will drop off
sharply and will plummet to under 2 Mbd in 2030
(Robelius, 2007).
Combining all currently available information, neither the
IEA nor the EIA expect non-conventional oil to contribute
much more than 10 Mbd in 2030, somewhat less than
10% of demand for the year according to the latest IEA
estimates (106 Mbd).
However, it is interesting to note that whereas with
conventional oil, barrel prices play only a minor role when
it comes to bringing about an increase in reserves, in the
case of non-conventional oil, oil price trends are key.
Higher oil prices boost the commerciality of oil production
with tar sands, oil shale, biofuels or synthetic fuels.
Nevertheless, even against a backdrop of high oil prices,
one of the main factors dragging on development of non-
conventional oil is likely to be the huge environmental
costs involved. If the fight against climate change
continues and efforts to reduce emissions proliferate, the
future of non-conventional oil appears bleak, unless
significant progress is made on carbon capture and
storage technologies. Even if such progress is made, it
is highly likely that the total cost of the entire process,
ranging from oil extraction to final carbon sequestration,
will prove prohibitively high, forcing us to turn to other
sources of alternative energy, such as second generation
biofuels, electricity or hydrogen.

14
15 This database includes all 54 of the world’s super-giant oil fields (fields with 2Preserves initially-in-place of over 5 Gb), as well as 263 of the 320 giant oil fields(2P reserves above 0.5 Gb). Of the 481 remaining fields, 285 are classified aslarge (2P reserves of above 0.1 Gb) and represent over 50% of this kind of fieldworldwide. The remaining fields making up the 798 total are small fields (withless than 0.1 Gb of 2P reserves). According to the IEA, the main source of primaryinformation consulted to compile the database was IHS.16 70.2 million barrels a day. Excluding natural gas liquids (NGL).
4. Structure of currentproduction and rates of declineReturning our attention to conventional oil, and even if
we employ enhanced recovery techniques, there will
come a point when the volume of oil extracted from a
reservoir begins to drop off, whether due to geological
factors or simply because upping production is no longer
commercially viable. The oil field is said to achieve
maturity at this stage. Over the initial years of this mature
stage, oil field production remains relatively unchanged
following a kind of undulating plateau pattern. The number
of years during which a field can remain in this state varies
enormously, depending on its natural features and the
operating profile applied. For example, in the case of very
large onshore oil fields, production can remain in the
plateau stage for decades (IEA, 2008). Yet sooner or later,
production will succumb to the laws of physics and/or
economics and will begin to wane, marking the start of
the decline stage.
The yearly rate at which production declines (known as
the rate of decline or depletion rate) depends on the age
of the oil field, its geomorphologic features and the
operating profile applied. This rate is key to obtaining
accurate estimates on the future production potential of
existing infrastructures, and the extent to which the latter
must be expanded to supply projected future demand.
If we are to obtain a reliable yardstick of the global rate of
decline, we must have individual and broken-down
information on the production profiles of all the oil fields
that are contributing to current oil supply. This would
encompass roughly 70,000 fields, all presenting different
characteristics and each at its own operational stage
(growth, plateau, decline). Although such a database has
not been constructed yet, work has been conducted to
bring us one step closer to the global rate of decline by
extrapolating (taking the necessary precautions) the rates
observed in those oil fields for which we already have
sufficient information.
The two most noteworthy initiatives were rolled out
recently. The first was conducted by specialist consultancy
CERA (an IHS company). The main conclusions were
published in the 2007 Finding the Critical Numbers report
(restricted access). The second was carried out by the
IEA, with the conclusions published in the latest World
Energy Outlook (WEO) edition for 2008 (public access).
In its report, the IEA presents an in-depth analysis of the
historical production performance of 798 oil fields
worldwide, which jointly account for 60% of current global
production.15 The report concludes that the size of the
fields (measured in terms of their 2P reserves), coupled
with their location (onshore or offshore), are the two main
driving forces behind production. The greater the size,
the lower the level of maximum production reached (peak)
and the less the observed rate during the decline stage.
The observed rates of decline are clearly more
pronounced in smaller and offshore oil fields, particularly
those operating at great depths.
Of the 70,000 oil fields in existence worldwide in 2007, a
mere 110 accounted for over 50% of global conventional
oil production16 and, surprisingly, 27% of this oil was
recovered from just 20 super-giant fields, as depicted in
the following table (IEA, 2008).

15
Field Country Location
Classificationby 2P
reservesYear of
discoveryPeak annualproduction
2007production
% Worldconventionaloil poduction
Status at2007
Year Year kb/d kb/dGhawar Saudi Arabia Onshore Super-giant 1948 1980 5,588 5,100 7% PlateauCantarell Mexico Offshore Super-giant 1977 2003 2,054 1,675 2% post-peakSafaniyah Saudi Arabia On/off Super-giant 1951 1998 2,128 1,408 2% post-peakRumaila N&S Iraq Onshore Super-giant 1953 1979 1,493 1,250 2% post-peakGreater Burgan Kuwait Onshore Super-giant 1938 1972 2,415 1,170 2% post-peakSamotlor Russia Onshore Super-giant 1960 1980 3,435 903 1% post-peakAhwaz Iran Onshore Super-giant 1958 1977 1,082 770 1% post-peakZakum Abu Dhabi (UAE) Offshore Super-giant 1964 1998 795 674 1% post-peakAzeri-Chirag-GuneshliAzerbaijan Offshore Super-giant 1985 2007 658 658 1% PlateauPriobskoye Russia Onshore Super-giant 1982 2007 652 652 1% PlateauTop 10 20,300 14,260 20%Bu Hasa Abu Dhabi (UAE) Onshore Super-giant 1962 1973 794 550 1% post-peakMarun Iran Onshore Super-giant 1964 1976 1,345 510 1% post-peakRaudhatain Kuwait Onshore Super-giant 1955 2007 501 501 1% PlateauGachsaran Iran Onshore Super-giant 1928 1974 921 500 1% post-peakQatif Saudi Arabia On/ Off Super-giant 1945 2,006 500 500 1% PlateauShaybah Saudi Arabia Onshore Super-giant 1968 2003 520 500 1% PlateauSaertu (Daquing) China Onshore Super-giant 1960 1993 633 470 1% post-peakSamotlor (main) Russia Onshore Super-giant 1961 1980 3,027 464 1% post-peakFedorovo-Surguts Russia Onshore Super-giant 1962 1983 1,022 458 1% post-peakZuluf Saudi Arabia Offshore Super-giant 1965 1981 677 450 1% post-peakTop 20 30,240 19,163 27%Source: IEA 2008
17 The observed rate mustn’t be confused with the natural rate of decline, thelatter being the rate that would have been observed had no investments beenmade to curb the decline of the wells. According to the IEA, the actual rate ofdecline would be between two and five percent above the observed rate.
As we can see, the world’s twenty largest oil wells have
already reached their peak and 70% of them have actually
entered the decline stage (post-peak). The report also
confirms that approximately 35% of conventional oil
production worldwide comes from wells that were
commissioned before the nineteen seventies.
After due analysis of the production profiles of all the oil
fields included in its database, the IEA concludes that
48% of 2P reserves initially-in-place have already been
recovered. Fields that have been in operation for longer
periods and/or had their oil extracted more aggressively
will experience sharper rates of decline. In a similar vein,
the observed rate of decline is greater the smaller the
size of the field or if the field is located offshore, particularly
in deep waters. Large fields tend to take nearly twice as
long to peak in comparison to smaller fields, while
reporting comparatively lower peak production levels
(calculated as a percentage of their reserves). In the
decline stage, their production also drops off less abruptly.
In order to estimate the worldwide observed rate of
decline, the IEA bases its calculations on the average
observed rate for all oil fields in the sample that have
entered the stage of decline (a total of 580), leading it to
a value of 5.1%. Given that most fields included in the
report are either super-giant or giant, and in light of the
high negative correlation between observed rates of
decline and the size of the wells, the IEA has applied an
offsetting upward correction factor to estimate the global
observed rate of decline. The remaining fields worldwide
(over 69,000) have therefore been assigned a rate of
decline of 10.4%, the same as that observed in the smaller
fields covered by the study. As these fields are in fact
large (having reserves of 0.1 Gb or more), the IEA warns
that the global observed rate of decline reached from its
estimates should be considered a lower limit for the actual
value.
The results point to a 6.7% observed17 rate of decline for
all fields worldwide that are currently in decline. The IEA
offers no clues as to the percentage of global production
that is currently in decline, making it impossible to
estimate the appropriate global average rate for making
comparisons with other references. That said, based on
the assumed profile for formulating its estimates of
conventional oil recovered from existing wells up to 2030,
we can deduce an average global rate of decline of 4-
5%. This finding coincides with the 4.5% estimated by
CERA in 2007, although this is not entirely surprising when
we consider that both analyses were based on similar
information (both from IHS). Let us not forget, however,
the lower limit proviso that the IEA itself attached to its
estimate. Although the latter figures are certainly less
worrying than the initial figure of 6.7%, what this study
does reveal is the need to revise upwards the rates of
decline of 3-4% which were used until very recently by
most long-term supply projections.
16
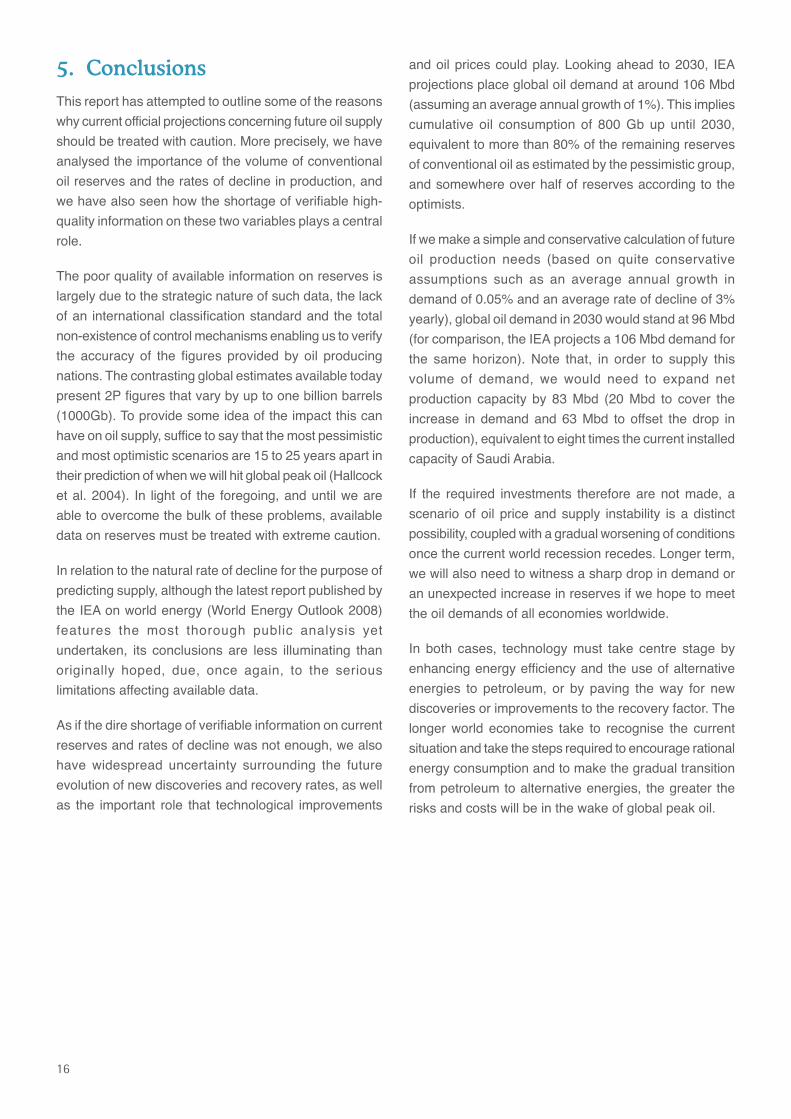
5. ConclusionsThis report has attempted to outline some of the reasons
why current official projections concerning future oil supply
should be treated with caution. More precisely, we have
analysed the importance of the volume of conventional
oil reserves and the rates of decline in production, and
we have also seen how the shortage of verifiable high-
quality information on these two variables plays a central
role.
The poor quality of available information on reserves is
largely due to the strategic nature of such data, the lack
of an international classification standard and the total
non-existence of control mechanisms enabling us to verify
the accuracy of the figures provided by oil producing
nations. The contrasting global estimates available today
present 2P figures that vary by up to one billion barrels
(1000Gb). To provide some idea of the impact this can
have on oil supply, suffice to say that the most pessimistic
and most optimistic scenarios are 15 to 25 years apart in
their prediction of when we will hit global peak oil (Hallcock
et al. 2004). In light of the foregoing, and until we are
able to overcome the bulk of these problems, available
data on reserves must be treated with extreme caution.
In relation to the natural rate of decline for the purpose of
predicting supply, although the latest report published by
the IEA on world energy (World Energy Outlook 2008)
features the most thorough public analysis yet
undertaken, its conclusions are less illuminating than
originally hoped, due, once again, to the serious
limitations affecting available data.
As if the dire shortage of verifiable information on current
reserves and rates of decline was not enough, we also
have widespread uncertainty surrounding the future
evolution of new discoveries and recovery rates, as well
as the important role that technological improvements
and oil prices could play. Looking ahead to 2030, IEA
projections place global oil demand at around 106 Mbd
(assuming an average annual growth of 1%). This implies
cumulative oil consumption of 800 Gb up until 2030,
equivalent to more than 80% of the remaining reserves
of conventional oil as estimated by the pessimistic group,
and somewhere over half of reserves according to the
optimists.
If we make a simple and conservative calculation of future
oil production needs (based on quite conservative
assumptions such as an average annual growth in
demand of 0.05% and an average rate of decline of 3%
yearly), global oil demand in 2030 would stand at 96 Mbd
(for comparison, the IEA projects a 106 Mbd demand for
the same horizon). Note that, in order to supply this
volume of demand, we would need to expand net
production capacity by 83 Mbd (20 Mbd to cover the
increase in demand and 63 Mbd to offset the drop in
production), equivalent to eight times the current installed
capacity of Saudi Arabia.
If the required investments therefore are not made, a
scenario of oil price and supply instability is a distinct
possibility, coupled with a gradual worsening of conditions
once the current world recession recedes. Longer term,
we will also need to witness a sharp drop in demand or
an unexpected increase in reserves if we hope to meet
the oil demands of all economies worldwide.
In both cases, technology must take centre stage by
enhancing energy efficiency and the use of alternative
energies to petroleum, or by paving the way for new
discoveries or improvements to the recovery factor. The
longer world economies take to recognise the current
situation and take the steps required to encourage rational
energy consumption and to make the gradual transition
from petroleum to alternative energies, the greater the
risks and costs will be in the wake of global peak oil.
17
6. ReferencesInternational Energy Agency (2006): World Energy Outlook 2006.International Energy Agency (2007): World Energy Outlook 2007.International Energy Agency (2008): World Energy Outlook 2008.U.S. Energy Information Administration (EIA): www.eia.doe.orgBabusiaux, D. and Bauquis, P.R. (2007): On the depletion of petroleum
reserves and oil price trends. Cuadernos de Energía (Issue no.19).
BP Statistical Review of World Energy (2008): www.bp.comWorld Energy Council (2007): 2007 Survey of Energy Resources.Campbell, C.J., Laherrère, J. (1998): The End of Cheap Oil, Scientific
American, March 1998.Energy Watch Group (2007): Crude Oil, The Supply Outlook. Report to
the Energy Watch Group, October 2007. EWG series No 3/2007.Falcone, G., Harrison, W., Teodoriu, C. (2007): Can we be more efficient
in Oil and Gas exploitation? A review of the shortcomings ofrecovery factor and the need for an open worldwide productiondatabase. Journal of Physical and Natural Sciences. Vol 1, No.2, 2007.
Hallock, J.L., Tharakan, P.J., Hall, C., Jefferson, M., Wu,W. (2004):Forecasting the limits to the availability and diversity of globalconventional oil supply. Energy, Vol. 29, No. 11, pages 1673-1696.September 2004.
Hirsch, R.L., Bezdek, R.H., Wendling, R.M. (2005): Peaking of WorldOil Production: Impacts, Mitigation and Risk Management. DOENETL. February 2005.
Industry Task Force on Peak Oil & Energy Security (ITPOES 2008):The Oil Crunch. Securing the UK’s energy future. First report.October 2008.
Korpela, Seppo A. (2006): Oil depletion in the World. Current Science,Vol 91, No. 9. November 2006.
Laherrère, J., (2006), Oil and gas: what future? Groningen AnnualEnergy Convention, November 2006.
Laherrère, J. (2007): Uncertainty of data and forecasts for fossil fuels.ASPO and ASPO France, April 2007.
Lynch, M.C., (2001): “Forecasting Oil Supply: theory and practice”.Quarterly Review of Economics and Finance 42 (2002) 373-389.
Porter, Richard M. (2006): “Beyond Oil: The View from Hubbert’s Peak/The End of Oil: the Edge of a Perilous New World/The LongEmergency: Surviving the Converging Catastrophes of theTwenty-First Century”; Journal of Economic Literature, 44 (1): 186-190
Robelius, F. (2007): Giant Oil Fields – The Highway to Oil”. UppsalaUniversity. PhD thesis. Uppsala University.
Schulte, W.M., (2005): Challenges and Strategy for Increased OilRecovery. Paper IPTC 10146, International Petroleum TechnologyConference, Doha (Qatar), 21-23 November 2005.
Salameh, Mamdouh G. (2004): How realistic are OPEC’s proven oilreserves? Petroleum Review. August 2004.
Smil, V. (2005): Energy at the Crossroads: Global Perspectives andUncertainties, MIT Press.
US Department of Energy and National Energy Technology Laboratory(2007): Peaking of World Oil Production: Recent Forecasts. DOE/NETL-2007/1263.
WORKING PAPERS
0001 Fernando C. Ballabriga, Sonsoles Castillo: BBVA-ARIES: un modelo de predicción y
simulación para la economía de la UEM. 0002 Rafael Doménech, María Teresa Ledo, David Taguas: Some new results on interest
rate rules in EMU and in the US 0003 Carmen Hernansanz, Miguel Sebastián: The Spanish Banks’ strategy in
Latin America. 0101 Jose Félix Izquierdo, Angel Melguizo, David Taguas: Imposición y Precios de
Consumo. 0102 Rafael Doménech, María Teresa Ledo, David Taguas: A Small Forward-Looking
Macroeconomic Model for EMU 0201 Jorge Blázquez, Miguel Sebastián: ¿Quién asume el coste en la crisis de deuda
externa? El papel de la Inversión Extranjera Directa (IED)
0301 Jorge Blázquez, Javier Santiso: Mexico, ¿un ex - emergente? 0401 Angel Melguizo, David Taguas: La ampliación europea al Este, mucho más que
economía. 0402 Manuel Balmaseda: L’Espagne, ni miracle ni mirage. 0501 Alicia García Herrero: Emerging Countries’ Sovereign Risk:Balance Sheets, Contagion
and Risk Aversion
0502 Alicia García-Herrero and María Soledad Martínez Pería: The mix of International bank’s foreign claims: Determinants and implications
0503 Alicia García Herrero, Lucía Cuadro-Sáez: Finance for Growth:Does a Balanced
Financial Structure Matter? 0504 Rodrigo Falbo, Ernesto Gaba: Un estudio econométrico sobre el tipo de cambio en
Argentina 0505 Manuel Balmaseda, Ángel Melguizo, David Taguas: Las reformas necesarias en el
sistema de pensiones contributivas en España. 0601 Ociel Hernández Zamudio: Transmisión de choques macroeconómicos: modelo de
pequeña escala con expectativas racionales para la economía mexicana
0602 Alicia Garcia-Herrero and Daniel Navia Simón: Why Banks go to Emerging Countries and What is the Impact for the Home Economy?
0701 Pedro Álvarez-Lois, Galo Nuño-Barrau: The Role of Fundamentals in the Price of
Housing: Theory and Evidence.

0702 Alicia Garcia-Herrero, Nathalie Aminian, K.C.Fung and Chelsea C. Lin: The Political Economy of Exchange Rates: The Case of the Japanese Yen
0703 Ociel Hernández y Cecilia Posadas: Determinantes y características de los ciclos
económicos en México y estimación del PIB potencial 0704 Cristina Fernández, Juan Ramón García: Perspectivas del empleo ante el cambio de
ciclo: un análisis de flujos. 0801 Alicia García-Herrero, Juan M. Ruiz: Do trade and financial linkages foster business
cycle synchronization in a small economy? 0802 Alicia García-Herrero, Eli M. Remolona: Managing expectations by words and deeds:
Monetary policy in Asia and the Pacific. 0803 José Luis Escrivá, Alicia García-Herrero, Galo Nuño and Joaquin Vial: After Bretton
Woods II.
0804 Alicia García-Herrero, Daniel Santabárbara: Is the Chinese banking system benefiting from foreign investors?
0805 Joaquin Vial, Angel Melguizo: Moving from Pay as You Go to Privately Manager
Individual Pension Accounts: What have we learned after 25 years of the Chilean Pension Reform?
0806 Alicia García-Herrero y Santiago Fernández de Lis: The Housing Boom and Bust in
Spain: Impact of the Securitisation Model and Dynamic Provisioning. 0807 Ociel Hernández, Javier Amador: La tasa natural en México: un parámetro importante
para la estrategia de política monetaria.
0808 Patricia Álvarez-Plata, Alicia García-Herrero: To Dollarize or De-dollarize: Consequences for Monetary Policy
0901 K.C. Fung, Alicia García-Herrero and Alan Siu: Production Sharing in Latin America
and East Asia. 0902 Alicia García-Herrero, Jacob Gyntelberg and Andrea Tesei: The Asian crisis: what did
local stock markets expect? 0903 Alicia Garcia-Herrero and Santiago Fernández de Lis: The Spanish Approach:
Dynamic Provisioning and other Tools 0904 Tatiana Alonso: Potencial futuro de la oferta mundial de petróleo: un análisis de las
principales fuentes de incertidumbre. 0905 Tatiana Alonso: Main sources of uncertainty in formulating potential growth scenarios
for oil supply. 0906 Ángel de la Fuente y Rafael Doménech: Convergencia real y envejecimiento: retos y
propuestas.
0907 KC FUNG, Alicia García-Herrero and Alan Siu: Developing Countries and the World Trade Organization: A Foreign Influence Approach.

0908 Alicia García-Herrero, Philip Woolbridge and Doo Yong Yang: Why don’t Asians invest in Asia? The determinants of cross-border portfolio holdings.
0909 Alicia García-Herrero, Sergio Gavilá and Daniel Santabárbara: What explains the low
profitability of Chinese Banks?. 0910 J.E. Boscá, R. Doménech and J. Ferri: Tax Reforms and Labour-market Performance:
An Evaluation for Spain using REMS. 0911 R. Doménech and Angel Melguizo: Projecting Pension Expenditures in Spain: On
Uncertainty, Communication and Transparency.
0912 J.E. Boscá, R. Doménech and J. Ferri: Search, Nash Bargaining and Rule of Thumb Consumers
0913 Angel Melguizo, Angel Muñoz, David Tuesta and Joaquín Vial: Reforma de las pensiones y política fiscal: algunas lecciones de Chile
0914 Máximo Camacho: MICA-BBVA: A factor model of economic and financial indicators for
short-term GDP forecasting. 0915 Angel Melguizo, Angel Muñoz, David Tuesta and Joaquín Vial: Pension reform and
fiscal policy: some lessons from Chile. 0916 Alicia García-Herrero and Tuuli Koivu: China’s Exchange Rate Policy and Asian Trade 0917 Alicia García-Herrero, K.C. Fung and Francis Ng: Foreign Direct Investment in Cross-
Border Infrastructure Projects. 0918 Alicia García Herrero y Daniel Santabárbara García; Una valoración de la reforma del
sistema bancario de China 0919 C. Fung, Alicia Garcia-Herrero and Alan Siu: A Comparative Empirical Examination of
Outward Direct Investment from Four Asian Economies: China, Japan, Republic of Korea and Taiwan
0920 Javier Alonso, Jasmina Bjeletic, Carlos Herrera, Soledad Hormazábal, Ivonne
Ordóñez, Carolina Romero and David Tuesta: Un balance de la inversion de los fondos de pensiones en infraestructura: la experiencia en Latinoamérica
0921 Javier Alonso, Jasmina Bjeletic, Carlos Herrera, Soledad Hormazábal, Ivonne
Ordóñez, Carolina Romero and David Tuesta: Proyecciones del impacto de los fondos de pensiones en la inversión en infraestructura y el crecimiento en Latinoamérica

The BBVA Economic Research Department disseminates its publications at the following
website: http://serviciodeestudios.bbva.com
The analyses, opinions and findings of these papers represent the views of their
authors; they are not necessarily those of the BBVA Group.

Interesados dirigirse a:
Servicio de Estudios Económicos BBVA P. Castellana 81 planta 7 48046 Madrid http://serviciodeestudios.bbva.com
Top Related