


Languages
Pages
Legal


Pág. Pág. 11
Main Health Issues Main Health Issues & Characteristics of & Characteristics of
Portuguese NHSPortuguese NHS
Amélia FernandesAmélia FernandesValencia, July 2002Valencia, July 2002
Pág. Pág. 22
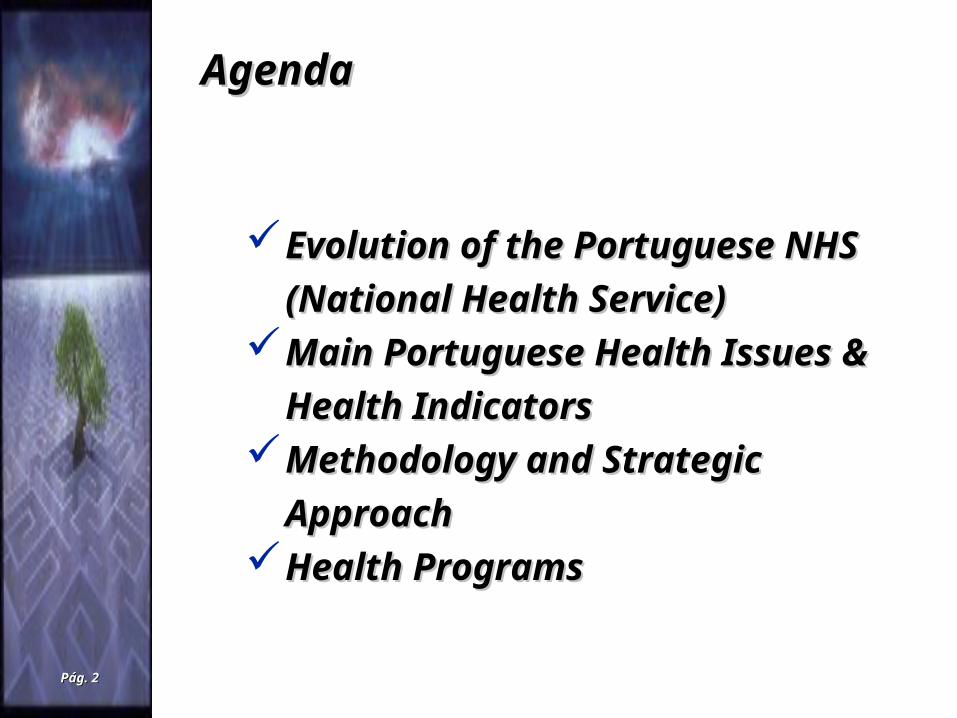
Evolution of the Portuguese Evolution of the Portuguese
NHS (National Health NHS (National Health
Service)Service)Main Portuguese Health Main Portuguese Health
Issues & Health IndicatorsIssues & Health IndicatorsMethodology and Strategic Methodology and Strategic
Approach Approach Health Programs Health Programs
AgendaAgenda

Pág. Pág. 33
PORTUGAL10.000.000 h (1999)
90.000 Km2
18 Districts (1982)
5 Administrative Regions (1993 RHAs)
+2 Autonomous Regions

Pág. Pág. 44
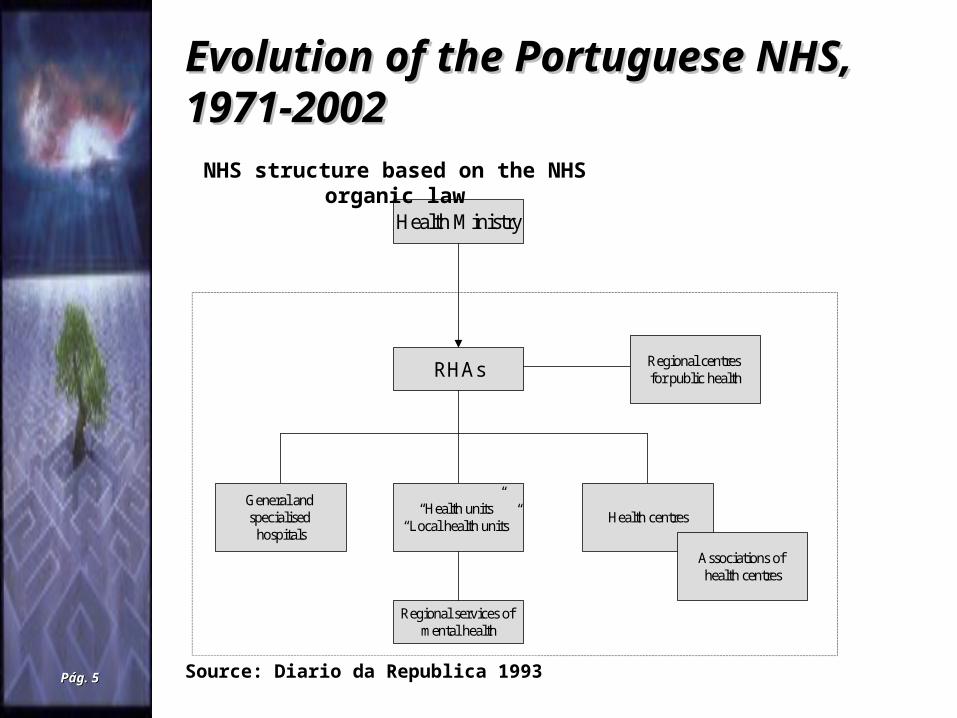
Evolution of the Portuguese Evolution of the Portuguese NHS, 1971-2002NHS, 1971-2002
Evolution of the PortugueseEvolution of the Portuguese NHS, 1971 – 2002 NHS, 1971 – 2002
Future?
Fonte:Relatório da Primavera dos Sistemas de Saúde (2002)
Pág. Pág. 55
Health Ministry
RHAs
General and specialised
hospitals
“Health units”“Local health units”
Health centres
Regional services of mental health
Associations of health centres
Regional centres for public health
Evolution of the Portuguese Evolution of the Portuguese NHS, 1971-2002NHS, 1971-2002
Source: Diario da Republica 1993
NHS structure based on the NHS organic law

Pág. Pág. 66
Evolution of the Portuguese Evolution of the Portuguese NHS, 1971-2002NHS, 1971-2002
The financing of NHS by GDP (1990-2002) (Values * 109 PTE)
Source:Annual report form IGIF, 2001 and 2002 NHS and 2002 Rectified budget
Fonte:Relatório da Primavera dos Sistemas de Saúde (2002)

Pág. Pág. 77
Evolution of the Portuguese Evolution of the Portuguese NHS, 1971-2002NHS, 1971-2002
Fonte:Relatório da Primavera dos Sistemas de Saúde (2002)

Pág. Pág. 88
Main Portuguese Health Main Portuguese Health Issues & Health IndicatorsIssues & Health Indicators
Medicines Expenditure (in % total health expenditures)
Fonte: OCDE Health Data 2001
9,0
11,0
13,0
15,0
17,0
19,0
21,0
23,0
25,0
27,0
1985 1990 1991 1992 1993 1994 1995 1996 1997 1998
França Alemanha Grécia IrlandaItália Portugal Espanha Reino Unido
Fonte:Relatório da Primavera dos Sistemas de Saúde (2002)

Pág. Pág. 99
Main Portuguese Health Main Portuguese Health Issues & Health IndicatorsIssues & Health Indicators
Total Medicines Expenditure ( % GDP)
0,3%
0,5%
0,7%
0,9%
1,1%
1,3%
1,5%
1,7%
1,9%
2,1%
2,3%
1970 1980 1990 1996
França Alemanha Grécia ItáliaPortugal Espanha Reino Unido Irlanda
Fonte: OCDE Health Data 1998
Fonte:Relatório da Primavera dos Sistemas de Saúde (2002)
Pág. Pág. 1010
Main Portuguese Health Main Portuguese Health Issues & Health IndicatorsIssues & Health Indicators
70,4%
75,5%
29,9%
29,6%
28,1%
23,5%
37,0% 36,3%
1,5% 1,0%
33,1% 34,1%
0,0%
10,0%
20,0%
30,0%
40,0%
50,0%
60,0%
70,0%
80,0%
Cefalosp. 1ª G. Cefalosp. 2ª G. Cefalosp. 3ª G.
NHS (England) - 1999 NHS (England) - 2001 RSLVT - 1999 RSLVT - 2001
Source: SI - ARSLVT and NHS (England)
Cephalosporins Ambulatory Prescription (% over total)
Fonte:Relatório da Primavera dos Sistemas de Saúde (2002)

Pág. Pág. 1111
Main Portuguese Health Main Portuguese Health Issues & Health IndicatorsIssues & Health Indicators
11,8%
1,2%
12,5%
1,2%
12,8%
1,3%
0,0%
2,0%
4,0%
6,0%
8,0%
10,0%
12,0%
1999 2000 2001
RSLVT NHS (England)
Source: SI - ARSLVT and NHS (England)
Quinolones Ambulatory Prescription (% over total antimicrobians)
Fonte:Relatório da Primavera dos Sistemas de Saúde (2002)

Pág. Pág. 1212
Evolution of the Portuguese Evolution of the Portuguese NHS, 1971-2002NHS, 1971-2002

Pág. Pág. 1313
Main Portuguese Health Main Portuguese Health Issues & Health IndicatorsIssues & Health Indicators
0,0%
10,0%
20,0%
30,0%
40,0%
50,0%
60,0%
70,0%
80,0%
90,0%
100,0%C
anad
á
Din
amar
ca
Fin
lând
ia
Nor
uega
Rei
no U
nido
Sué
cia
Itál
ia
Esp
anha
Por
tuga
l
Privado
Público
Source: Vinhas, J.
Patients in chronically haemodialysis treatments per provider type
PrivatePublic
Fonte:Relatório da Primavera dos Sistemas de Saúde (2002)

Pág. Pág. 1414
Main Portuguese Health Main Portuguese Health Issues & Health IndicatorsIssues & Health Indicators
20,0%
30,0%
40,0%
50,0%
60,0%
70,0%
1996 57,4% 36,6% 27,9% 29,9% 37,8% 41,1% 49,3% 56,5% 57,9% 61,0% 50,5%
1997 62,6% 41,1% 33,2% 36,9% 40,0% 45,1% 52,4% 61,8% 65,8% 66,9% 60,4%
1999 71,1% 45,4% 37,1% 39,7% 43,3% 47,0% 55,8% 64,4% 69,1% 70,8% 62,8%
0-4 5-9 10-14 15-24 25-34 35-44 45-54 55-64 65-74 75-84 85 +
Source: Inquérito Nacional de Saúde, Portugal Continental, 1996, 1997 e 1999
Health Care Consumption% people interviewed that declared having consumption in the last 3 mounths
Fonte:Relatório da Primavera dos Sistemas de Saúde (2002)

Pág. Pág. 1515
Evolution of the Portuguese Evolution of the Portuguese NHS, 1971-2002NHS, 1971-2002
1990 Governance Agenda, till 1990: - Salary improvements in Public Sector; - Public / Private split (Lei de Bases da Saúde, 1990); - Productivity Increase, in Public Sector. Dénouement in 1990:
- - The new ministerial staff confirms the salaries improvement, but give up in Public / Private split.
2000
Governance Agenda, till 2000: - Set of legislative framework, in view of NHS reform: beginning of a performance based salary (incompatibility in convention medicine; Experimental Salary Model (RRE); waiting lists recuperation programme (PERL); extra-work hours payment´s condition in Urgency Services. Dénouement in 2000: - The new ministerial staff directed salary improvements to an extra-work hours payment. The NHS reform become paralysed.
Two Main Critical Defeats of Health Governance
Fonte:Relatório da Primavera dos Sistemas de Saúde (2002)

Pág. Pág. 1616
Main Portuguese Health Main Portuguese Health Issues & Health IndicatorsIssues & Health Indicators
Evolution of the population health status
Population health status and utilisation in Portugal, Spain and the UK
Source: OCDE, 1998
Fonte:Relatório da Primavera dos Sistemas de Saúde (2002)
Pág. Pág. 1717
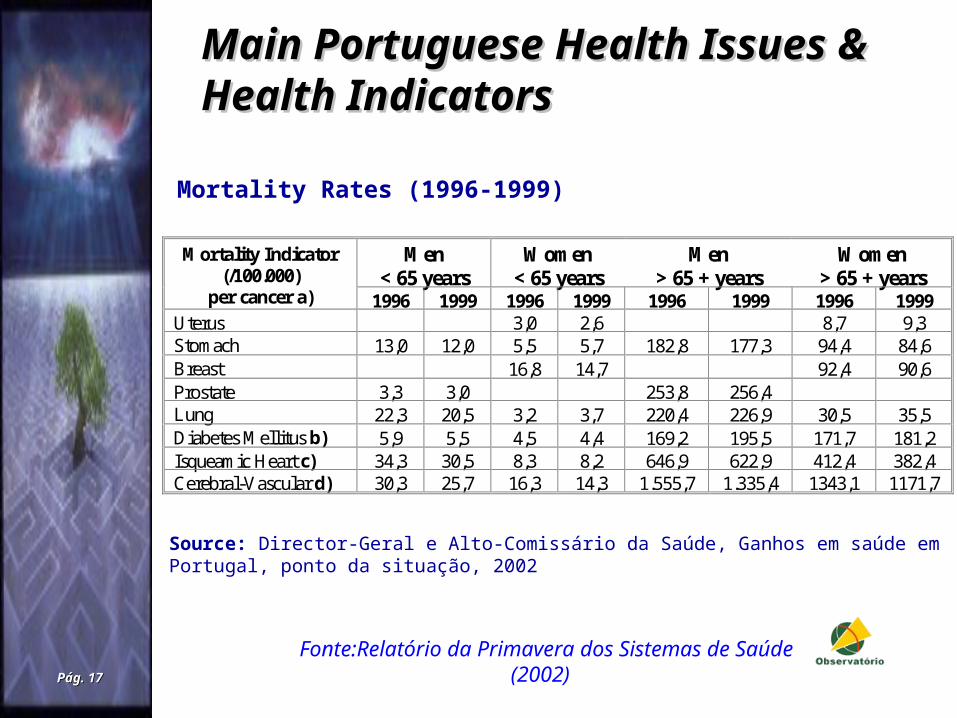
Main Portuguese Health Main Portuguese Health Issues & Health IndicatorsIssues & Health Indicators
Men < 65 years
Women < 65 years
Men > 65 + years
Women > 65 + years
Mortality Indicator (/100.000)
per cancer a) 1996 1999 1996 1999 1996 1999 1996 1999 Uterus 3,0 2,6 8,7 9,3 Stomach 13,0 12,0 5,5 5,7 182,8 177,3 94,4 84,6 Breast 16,8 14,7 92,4 90,6 Prostate 3,3 3,0 253,8 256,4 Lung 22,3 20,5 3,2 3,7 220,4 226,9 30,5 35,5 Diabetes Mellitus b) 5,9 5,5 4,5 4,4 169,2 195,5 171,7 181,2 Isqueamic Heart c) 34,3 30,5 8,3 8,2 646,9 622,9 412,4 382,4 Cerebral-Vascular d) 30,3 25,7 16,3 14,3 1.555,7 1.335,4 1343,1 1171,7
Mortality Rates (1996-1999)
Source: Director-Geral e Alto-Comissário da Saúde, Ganhos em saúde em Portugal, ponto da situação, 2002
Fonte:Relatório da Primavera dos Sistemas de Saúde (2002)

Pág. Pág. 1818
duas rodassem álcool no sanguecom álcool no sangueinferior a 0.5entre 0.5 e 0.8 g/l0
5.000
10.000
15.000
20.000
25.000
30.000
35.000
40.000
45.000
50.000
duas rodas pesados ligeiros
sem álcool no sangue
com álcool no sangue
Main Portuguese Health Main Portuguese Health Issues & Health IndicatorsIssues & Health Indicators
Road accidents – Alcoholism rate per vehicle type
Source: Direcção Geral de Viação, 1999
No alcohol in blood
Alcohol in blood
Motorcycles Trucks Tourism
Fonte:Relatório da Primavera dos Sistemas de Saúde (2002)
Pág. Pág. 1919
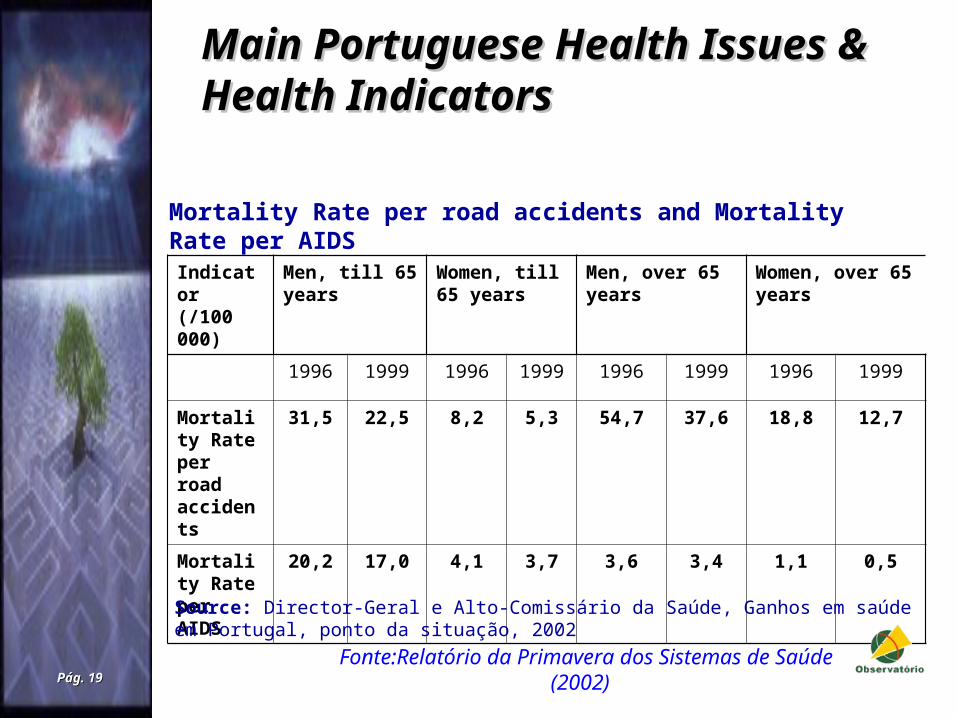
Main Portuguese Health Main Portuguese Health Issues & Health IndicatorsIssues & Health Indicators
Indicator (/100 000)
Men, till 65 years
Women, till 65 years
Men, over 65 years
Women, over 65 years
1996 1999 1996 1999 1996 1999 1996 1999
Mortality Rate per road accidents
31,5 22,5 8,2 5,3 54,7 37,6 18,8 12,7
Mortality Rate per AIDS
20,2 17,0 4,1 3,7 3,6 3,4 1,1 0,5
Source: Director-Geral e Alto-Comissário da Saúde, Ganhos em saúde em Portugal, ponto da situação, 2002
Mortality Rate per road accidents and Mortality Rate per AIDS
Fonte:Relatório da Primavera dos Sistemas de Saúde (2002)

Pág. Pág. 2020
Main Portuguese Health Main Portuguese Health Issues & Health IndicatorsIssues & Health Indicators
9,59,1
11,2
9,8
7,9
8,9
6,3
8,3
14,1
8
9,38,8
10,5
9
17,8
6,9
4,94,4
4,9 5,2
4,2 4,53,8
4,55,1 4,8
5,55,9
5,1 5,15,5
3,0
0
2
4
6
8
10
12
14
16
18E
UR
15
Ale
ma
nh
a
Áu
stri
a
Bé
lgic
a
Din
am
arc
a
Esp
an
ha
Fin
lân
dia
Fra
nça
Gré
cia
Ho
lan
da
Re
ino
Un
ido
Irla
nd
a
Itá
lia
Lu
xem
bu
rgo
Po
rtu
ga
l
Su
éci
a
19852000EURO 15 - Média (2000)
%0
Source: INE
Infant Mortality Rate in EU Countries, 1985 - 2000
Fonte:Relatório da Primavera dos Sistemas de Saúde (2002)
Pág. Pág. 2121
Health ProgramsHealth Programs
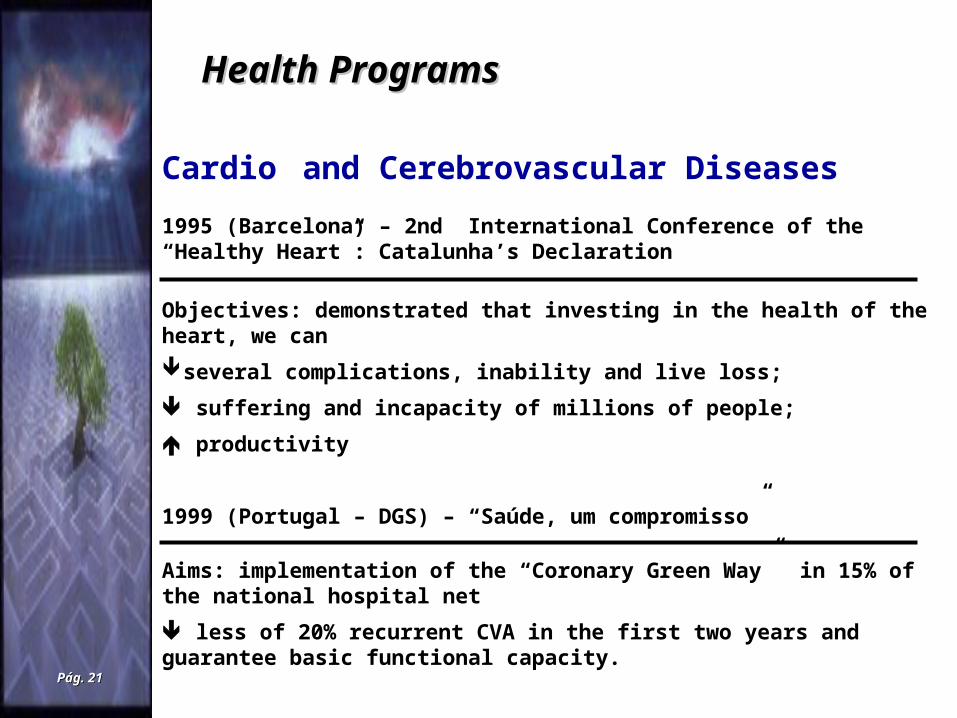
Cardio and Cerebrovascular Diseases
1995 (Barcelona) – 2nd International Conference of the “Healthy Heart”: Catalunha’s Declaration
Objectives: demonstrated that investing in the health of the heart, we can
several complications, inability and live loss;
suffering and incapacity of millions of people;
productivity
1999 (Portugal – DGS) – “Saúde, um compromisso”
Aims: implementation of the “Coronary Green Way” in 15% of the national hospital net
less of 20% recurrent CVA in the first two years and guarantee basic functional capacity.
Pág. Pág. 2222
Health ProgramsHealth Programs
0,0
100,0
200,0
300,0
400,0
500,0
600,0
700,0
800,0
900,0
1000,0
1992 1993 1994 1995 1996 1997 1998 1999 2000 2001
ARS Norte
ARS Centro
ARS LVTejo
ARS Alentejo
ARS Algarve
Continente
Amputations in diabetics (/100 000 diabetics)
NDP (1974); St. Vincent’s Declaration (Italy, 1989); 300 000 - 500 000 diabetics (3-5%, of which 10-12% are Diabetes Type I)Diabetic foot – hospitalisation; 40-60% amputations for NT causes; 15% Diabetic pop. favourable conditions.; annually: 1300 non traumatic amputations of forelimbs (2001); complications contra lateral limb; 5 years › 50% amputation of CL limb.
Source: OPSS Report 2002 in M. R. Gallego Investigation Project, 2002
Fonte:Relatório da Primavera dos Sistemas de Saúde (2002)
Pág. Pág. 2323
Health ProgramsHealth Programs
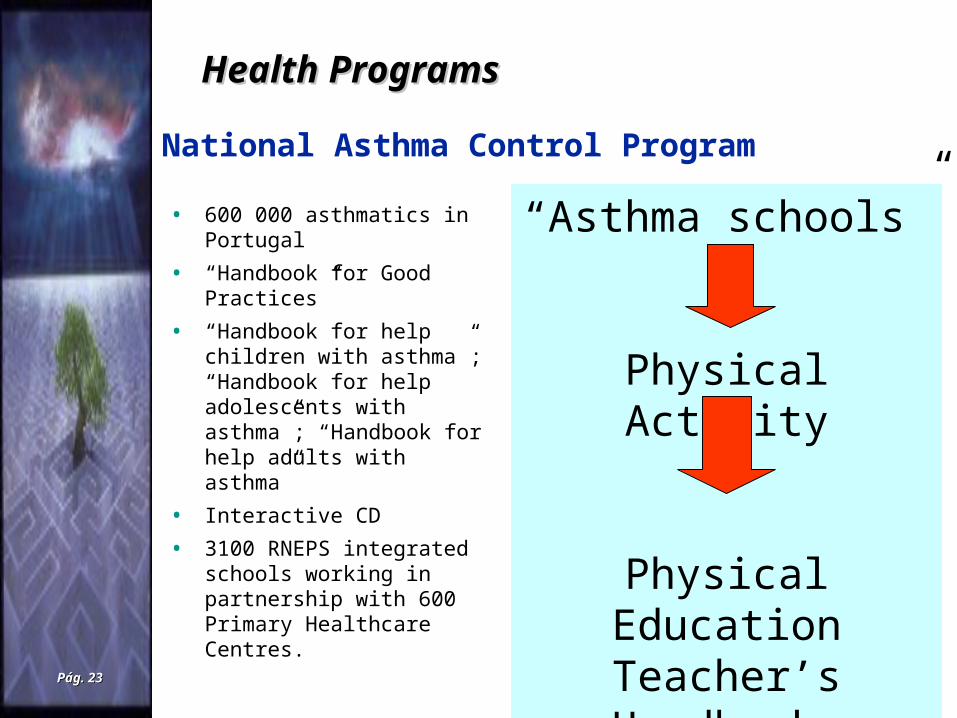
• 600 000 asthmatics in Portugal
• “Handbook for Good Practices”
• “Handbook for help children with asthma”; “Handbook for help adolescents with asthma”; “Handbook for help adults with asthma”
• Interactive CD
• 3100 RNEPS integrated schools working in partnership with 600 Primary Healthcare Centres.
“Asthma schools”
Physical Activity
Physical Education Teacher’sHandbook
National Asthma Control Program

Pág. Pág. 2424
Obrigado
Thank you
Top Related