


Languages
Pages
Legal


Mahindra & Mahindra Financial
Services Limited
Quarter Result Update
June - 2017
Regd. Office: Gateway Building, Apollo Bunder, Mumbai 400 001 India Tel: +91 22 2289 5500 Fax: +91 22 2287 5485 www.mahindrafinance.com CIN - L65921MH1991PLC059642
1
Corporate Office: Mahindra Towers, 4th Floor, Dr. G. M. Bhosale Marg, Worli, Mumbai 400 018 India Tel: +91 22 66526000 Fax: +91 22 24953608 Email: [email protected]

2
Transforming rural lives across the country
Company Overview
Industry Overview
Business Strategy
Financial Information
Key Subsidiaries
Awards & Accolades
Risk Management Policies

3
Company Background
Parentage: Mahindra & Mahindra Financial Services Limited (“MMFSL”) is a subsidiary of Mahindra and
Mahindra Limited (Mcap: Rs 859 billion)*, India’s largest tractor and utility vehicle manufacturer
About MMFSL: MMFSL (Mcap: Rs 201 billion)*, one of India’s leading non-banking finance companies focused
in the rural and semi-urban sector is the largest Indian tractor financier
Key Business Area: Primarily in the business of financing purchase of new and pre-owned auto and utility vehicles,
tractors, cars, commercial vehicles, construction equipments and SME Financing
Vision: MMFSL’s vision is to be a leading provider of financial services in the rural and semi-urban
areas of India
Reach: Has 1183 offices covering 27 states and 4 union territories in India, with over 4.85 million
vehicle finance customer contracts since inception
Credit Ratings: India Ratings has assigned AAA(ind)/Stable, CARE Ratings has assigned AAA/Stable,
Brickwork has assigned AAA/Stable and CRISIL has assigned AA+/Stable rating to the
Company’s long term and subordinated debt
*Source: Market capitalisation as of July 21, 2017 from BSE website

4
MMFSL Group structure
85%(1)
87.5%(2)
100%
51.20%
49%
Mahindra Insurance Brokers Limited (“MIBL”)
Mahindra Rural Housing Finance Limited
(“MRHFL”)
Mahindra Finance USA LLC
(Joint venture with Rabobank group subsidiary)
Mahindra & Mahindra
Financial Services Limited Mahindra Asset Management Company Pvt.
Ltd
100%
Mahindra Trustee Company Pvt. Ltd
Mahindra & Mahindra Limited
Note:
1. Balance 15% with Inclusion Resources Pvt. Ltd.,a subsidiary of Leapfrog Financial Inclusion Fund, incorporated in Singapore.
2. Balance 12.5% with National Housing Bank (NHB)

5
Our Journey
FY 06 FY 16 FY 15 FY 13 FY 11 FY 09 FY 08
Completed IPO,
Subscribed ~
27 times
Commenced housing finance
business through MRHFL
Raised Rs. 4.14 Bn through
Private Equity
Equity participation of
12.5%by NHB in MRHFL
Recommenced Fixed
Deposit Program
Maiden QIP Issue of Rs. 4.26 Bn
JV with Rabobank subsidiary for
tractor financing in USA
Stake sale in MIBL to
Inclusion Resources
Pvt. Ltd.
QIP Issue of Rs. 8.67 Bn
Long term debt rating
upgraded to AAA by
India Ratings and
Brickwork.
CARE Ratings assigned
AAA rating to long term
debt
Reach extended to over
1100 offices
Crossed 4 million
cumulative customer
contracts
Certificate of
Registration received
from SEBI by Mahindra
Mutual Fund
FY 10
Crossed 1 million
cumulative customer
contracts
FY 17
Maiden Retail NCD Issue
of Rs. 1000 crores.
Oversubscribed over 7
times over base issue size
of Rs. 250 crores
6
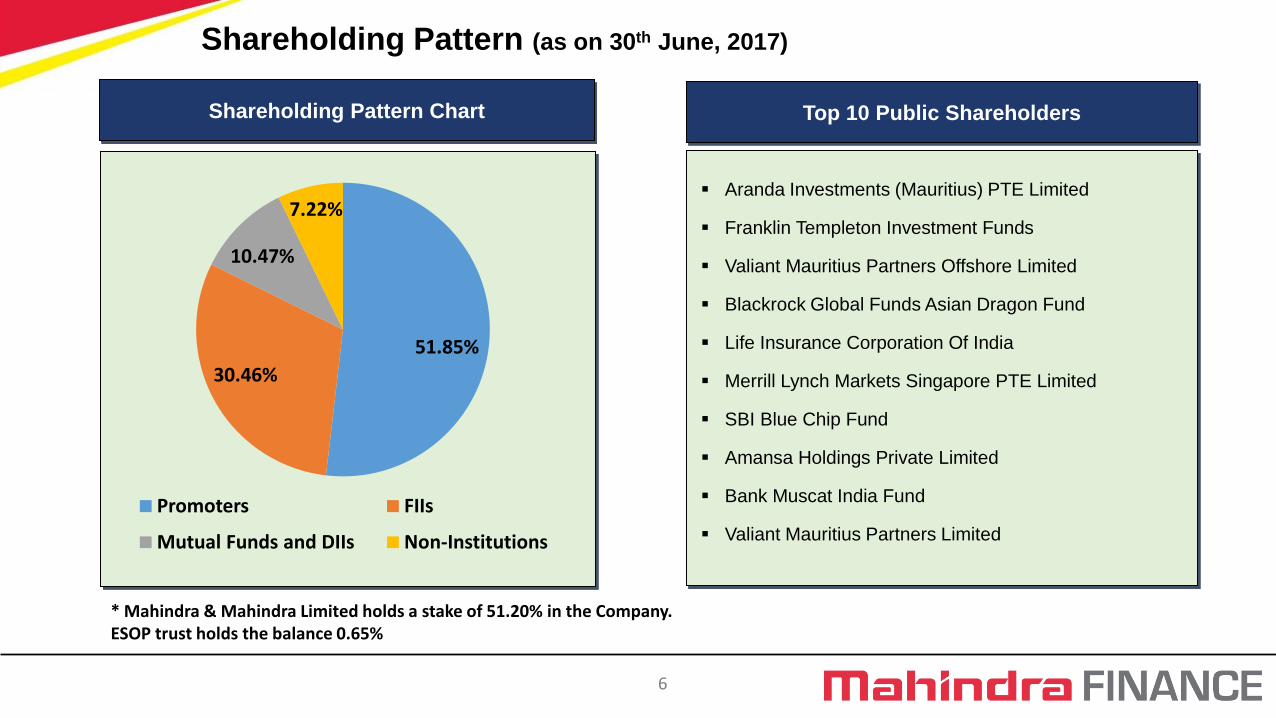
Shareholding Pattern (as on 30th June, 2017)
Top 10 Public Shareholders
Aranda Investments (Mauritius) PTE Limited
Franklin Templeton Investment Funds
Valiant Mauritius Partners Offshore Limited
Blackrock Global Funds Asian Dragon Fund
Life Insurance Corporation Of India
Merrill Lynch Markets Singapore PTE Limited
SBI Blue Chip Fund
Amansa Holdings Private Limited
Bank Muscat India Fund
Valiant Mauritius Partners Limited
Shareholding Pattern Chart
51.85%
30.46%
10.47%
7.22%
Promoters FIIs
Mutual Funds and DIIs Non-Institutions
* Mahindra & Mahindra Limited holds a stake of 51.20% in the Company. ESOP trust holds the balance 0.65%
7
Transforming rural lives across the country
Company Overview
Industry Overview
Business Strategy
Financial Information
Key Subsidiaries
Awards & Accolades
Risk Management Policies

8
Auto Industry: Long term growth potential
High domestic potential exists considering low penetration levels (20 cars per 1000 people - FY 2017) compared to developed economies.
Penetration shoots in the top deciles improve and is likely to improve further
Higher farm incomes, pick up in infrastructure spending and a normal monsoon will boost rural demand
Source: *CRISIL Research, Cars & UV – May 2017
` Expansion in Addressable market with Low Cost of Ownership
251 272
295
35
73 94
16 26 39
0
50
100
150
200
250
300
350
2011-12E 2016-17E 2021-22E
Total Households Addressable Household Total PV Population (Mn)
0.4% 0.8% 1.7% 3.0% 4.5% 5.5% 6.0% 10.0%
18.6%
44.5%
0.2% 0.5% 0.5% 0.7% 0.8% 1.4% 1.6% 1.9% 4.0%
11.3%
-5%
5%
15%
25%
35%
45%
55%
1 2 3 4 5 6 7 8 9 10
Urban Rural
Decile-wise penetration (Urban versus Rural)

9
Passenger Vehicles Industry: Overall Demand Drivers
Source: CRISIL Research, Cars & UV – May 2017
With cost of ownership likely to decline, first
time buyers and increasing proportion of rural
sales shall drive demand for small cars
Compact UV segment gained momentum with
shift from sedan
FY 07 – FY12 FY 12 – FY 17 FY 17 – FY 22 (P)
Small Cars 13% 3% 11% – 13%
Sedans 17% (12%) 9% – 11%
UV + Vans 16% 9% 9% – 11%
Total (Cars + UVs) 14% 3% 10% – 12%
Volumes in ‘000 FY 2016 FY 2017 FY 2018 (P)
Volume Growth Volume Growth Growth
Small Cars 1,754 8% 1,857 6% 7% – 9%
Sedans 271 6% 246 (10%) 9% – 11%
UV + Vans 763 5% 944 24% 11% – 13%
Total (Cars + UVs) 2,788 7% 3,047 9% 9% – 11%
On the back of GST, Improvement in Growth expected by 1.5% - 2% and 2.5% – 3% in UV’s and Sedan respectively.
Higher disbursements expected with reduced interest rate environment. Further new model launches shall enhance demand.

10
Commercial Vehicles Industry: Overall Demand Drivers
Source: CRISIL Research, Commercial Vehicles – May 2017
FY 12 – FY 17 FY 17 – FY 22 P
MHCV (goods) (3.1%) 5% – 7%
LCV (goods) (2.6%) 9% – 12%
Buses (0.1%) 8% – 10%
FY 2016 FY 2017 FY 2018 (P)
Volume Growth Volume Growth Growth
MHCV 257,987 32% 255,234 (1%) (2%) – 0%
LCV 334,371 (1%) 360,842 8% 6% – 8%
Buses 92,845 15% 98,126 6% 7% – 9%
High cost of BS-IV ownership led to advancement of purchase.
Uncertainty regarding logistics movement under GST scenario shall
lead to postponement of sales. Infrastructure, mining and
manufacturing shall prevent fall in MHCV sales.
Demand for LCVs fuelled by increase of hub-and-spoke model, growth of organised retail, rising consumption expenditure and
improvement in rural road infrastructure
Pick-up in the tours segment impacted by demonetisation along with school and intercity segment shall drive demand in buses
11
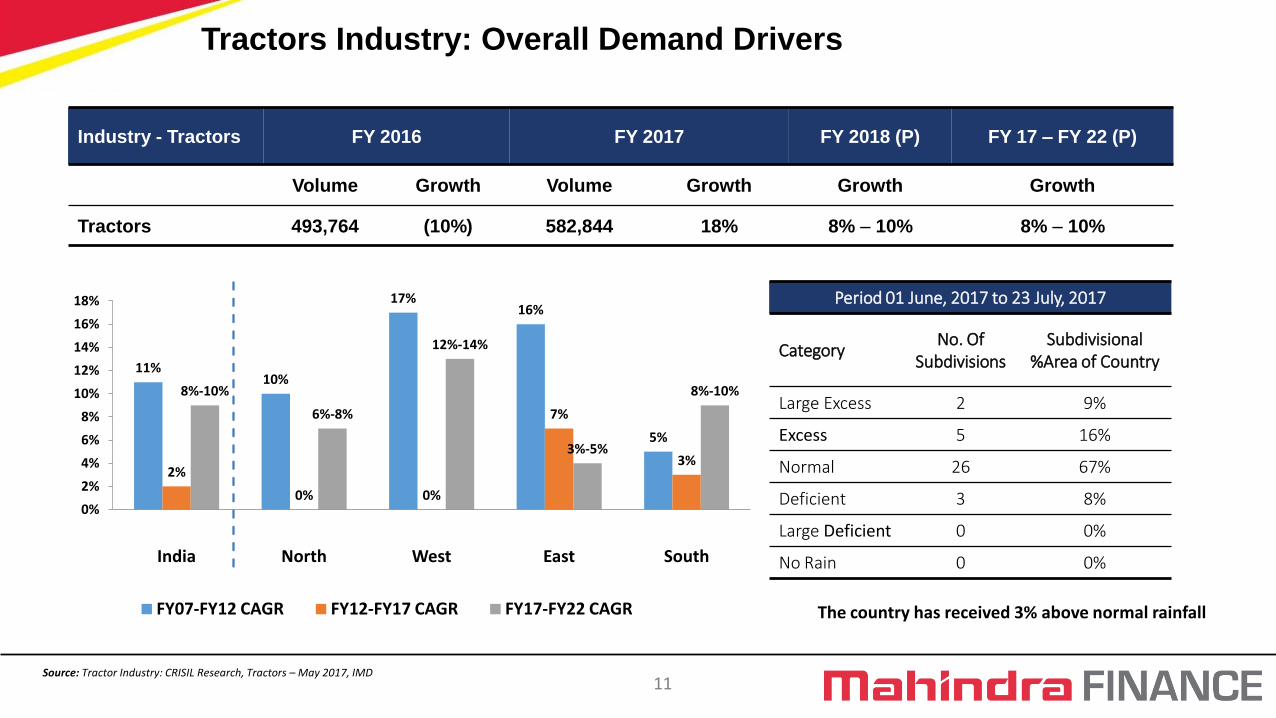
Tractors Industry: Overall Demand Drivers
Industry - Tractors FY 2016 FY 2017 FY 2018 (P) FY 17 – FY 22 (P)
Volume Growth Volume Growth Growth Growth
Tractors 493,764 (10%) 582,844 18% 8% – 10% 8% – 10%
Source: Tractor Industry: CRISIL Research, Tractors – May 2017, IMD
11% 10%
17% 16%
5%
2%
0% 0%
7%
3%
8%-10%
6%-8%
12%-14%
3%-5%
8%-10%
0%
2%
4%
6%
8%
10%
12%
14%
16%
18%
India North West East South
FY07-FY12 CAGR FY12-FY17 CAGR FY17-FY22 CAGR The country has received 3% above normal rainfall
Period 01 June, 2017 to 23 July, 2017
Category No. Of
Subdivisions Subdivisional
%Area of Country
Large Excess 2 9%
Excess 5 16%
Normal 26 67%
Deficient 3 8%
Large Deficient 0 0%
No Rain 0 0%

12
Source: Crisil
Auto Industry Volume
Domestic Sales
(Volume in ‘000)
1QFY18
(Nos.)
1QFY17
(Nos.)
Y-o-Y
Growth (%)
FY17
(Nos.)
FY16
(Nos.)
Y-o-Y
Growth (%)
Passenger Vehicles (PVs)
Passenger Cars / Vans 494 476 3.8% 2,103 2,025 3.9%
Uvs 233 221 5.4% 944 764 23.6%
Commercial Vehicles (CVs)
M&HCVs 48 71 (32.4%) 302 302 0.0%
LCVs 103 96 7.8% 412 382 7.6%
Three Wheelers 109 140 (22.1%) 512 538 (4.8%)
Tractors 177 164 7.9% 583 494 18.0%
13
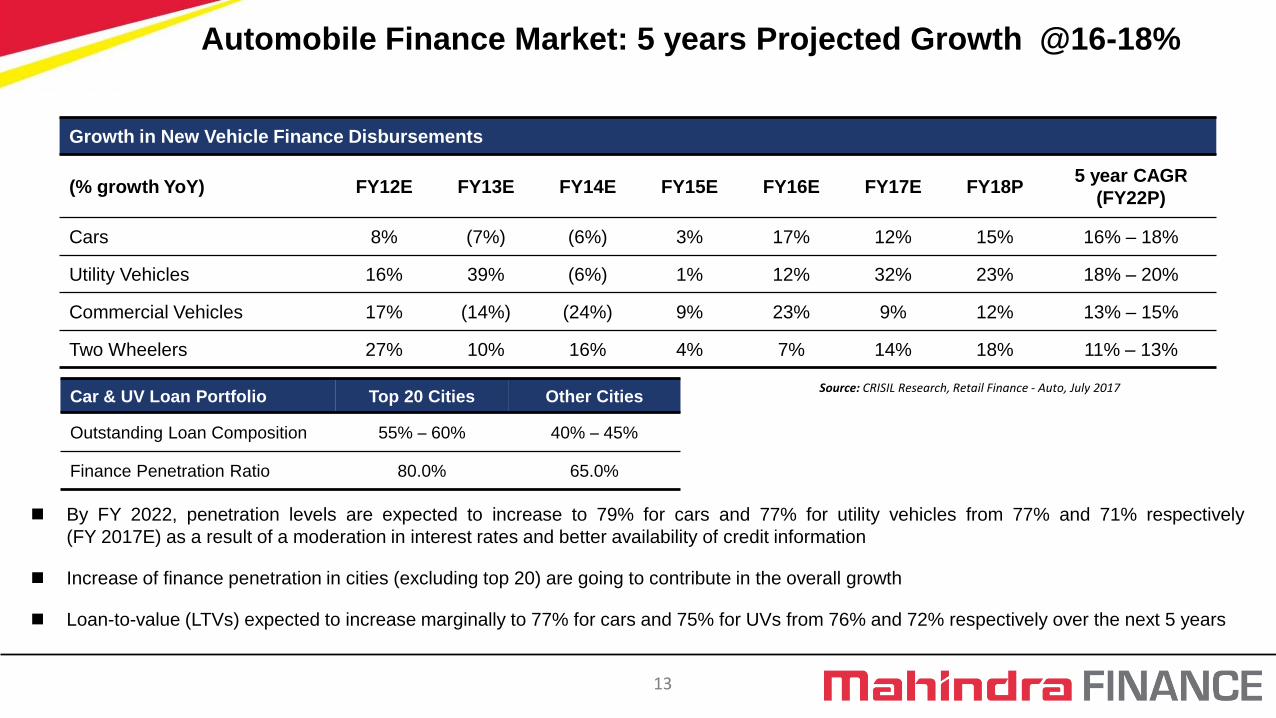
By FY 2022, penetration levels are expected to increase to 79% for cars and 77% for utility vehicles from 77% and 71% respectively
(FY 2017E) as a result of a moderation in interest rates and better availability of credit information
Increase of finance penetration in cities (excluding top 20) are going to contribute in the overall growth
Loan-to-value (LTVs) expected to increase marginally to 77% for cars and 75% for UVs from 76% and 72% respectively over the next 5 years
Source: CRISIL Research, Retail Finance - Auto, July 2017
Automobile Finance Market: 5 years Projected Growth @16-18%
Growth in New Vehicle Finance Disbursements
(% growth YoY) FY12E FY13E FY14E FY15E FY16E FY17E FY18P 5 year CAGR
(FY22P)
Cars 8% (7%) (6%) 3% 17% 12% 15% 16% – 18%
Utility Vehicles 16% 39% (6%) 1% 12% 32% 23% 18% – 20%
Commercial Vehicles 17% (14%) (24%) 9% 23% 9% 12% 13% – 15%
Two Wheelers 27% 10% 16% 4% 7% 14% 18% 11% – 13%
Car & UV Loan Portfolio Top 20 Cities Other Cities
Outstanding Loan Composition 55% – 60% 40% – 45%
Finance Penetration Ratio 80.0% 65.0%

14
10% 18% 20%
31% 34% 38% 40%
45% 52%
56%
67%
88%
0%
10%
20%
30%
40%
50%
60%
70%
80%
90%
100%
Ind
ia
Ch
ina
Thai
lan
d
Ko
rea
Mal
aysi
a
Taiw
an
Ge
rman
y
Ho
ng
Ko
ng
Sin
gap
ore
USA
UK
Den
mar
k
Source: Crisil Retail Finance – Housing – June 2017
Mortgage Penetration (as % of GDP)
Long term growth to remain intact as the real estate industry
becomes more transparent, affordability improves, prices
stabilize in major markets and interest rate decline under
MCLR regime.
Disbursements to grow @ 18% – 19% CAGR over FY 19 –
21 on the back of higher finance penetration, demand for
affordable housing and increasing urbanisation
Mid size and Small HFC’s is expected to maintain spread
supported by presence in niche rural markets
Despite mortgage penetration improving by 300 – 400 bps
over the last six years (now at 10%), the same is still low.
Mortgage penetration in India is 9 – 11 years behind other
regional emerging markets like China and Thailand
This increase was led by rising incomes, improving
affordability, growing urbanisation, emergence of Tier–II and
Tier–III cities along with tax incentives
Housing Finance Growth
0
1,000
2,000
3,000
4,000
5,000
6,000
7,000
8,000
9,000
10,000
2003-04 E
2006-07 E
2010-11 E
2014-15 E
2015-16 E
2016-17 E
2021-22 F
Banks HFCs
522
Growth in Housing Finance Disbursements
866 1,563
3,032
4,150
9,855
E: Estimated F: Forecasted
Rs. B
n.
3,554

15
Transforming rural lives across the country
Company Overview
Industry Overview
Business Strategy
Financial Information
Key Subsidiaries
Awards & Accolades
Risk Management Policies

16
Business Strategy
Grow in rural and semi urban markets for vehicle and automobile financing
Diversify Product Portfolio
Continuing to attract, train and retain talented employees
Effective use of technology to improve productivity
Broad base Liability Mix
Leverage the “Mahindra” Ecosystem
Leverage existing customers base through Direct Marketing Initiatives
Expand Branch Network
17
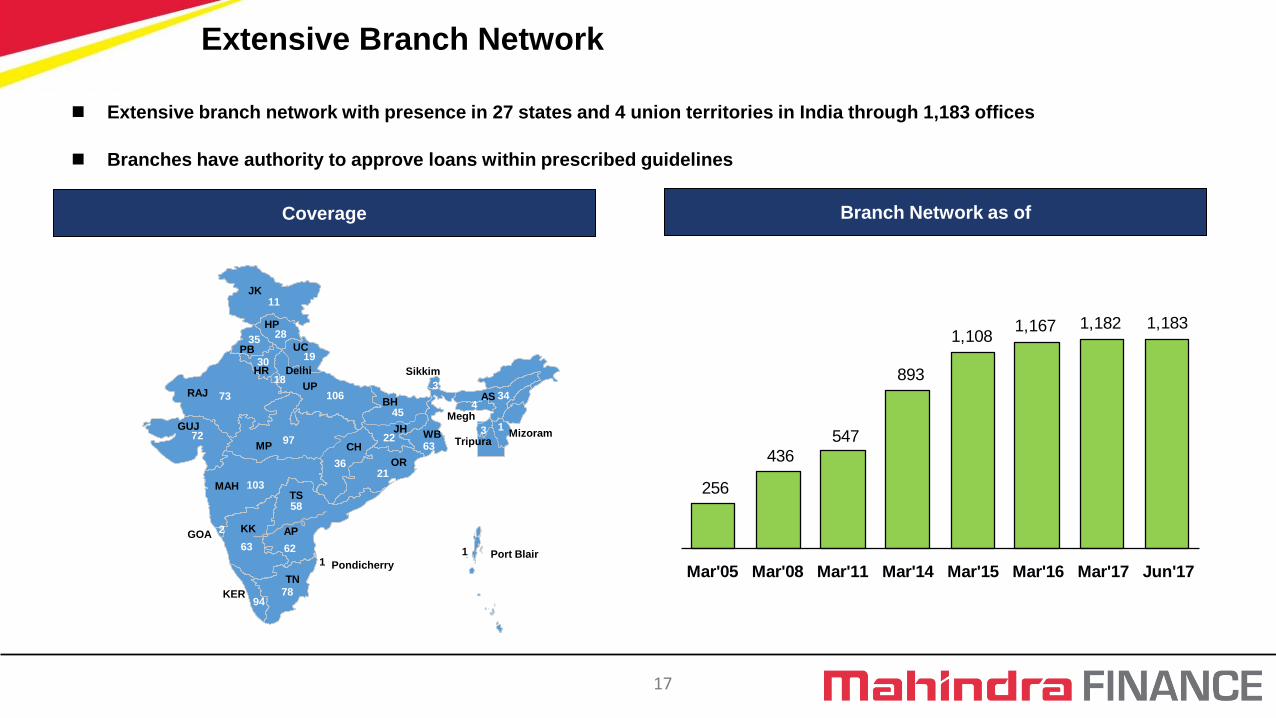
Extensive branch network with presence in 27 states and 4 union territories in India through 1,183 offices
Branches have authority to approve loans within prescribed guidelines
Coverage Branch Network as of
1
11
35 28
19 30
18
106 73
97 72
103
36
62 63
2
94 78
21
22
45
3
63
4
3
34
JK
PB
HP
UC
HR Delhi
UP RAJ
GUJ
MAH
MP CH
GOA KK
KER
TN
Port Blair
AP
OR
JH
BH
WB
AS
Sikkim
Megh
Tripura Mizoram
1
58 TS
256
436
547
893
1,108 1,167 1,182 1,183
Mar'05 Mar'08 Mar'11 Mar'14 Mar'15 Mar'16 Mar'17 Jun'17
Extensive Branch Network
1 Pondicherry

18
Loans for auto and utility vehicles, tractors, cars, commercial vehicles and construction
equipments Vehicle Financing
Pre-Owned Vehicles
Mutual Fund Distribution
Loans for pre-owned cars, multi-utility vehicles, tractors and commercial vehicles
Advises clients on investing money through AMFI certified professionals under the brand
“MAHINDRA FINANCE FINSMART”
SME Financing Loans for varied purposes like project finance, equipment finance and working capital
finance
Personal Loans Offers personal loans typically for weddings, children’s education, medical treatment and
working capital
Insurance Broking
Housing Finance
Insurance solutions to retail customers as well as corporations through our subsidiary
MIBL
Loans for buying, renovating, extending and improving homes in rural and semi-urban
India through our subsidiary MRHFL
Diversified Product Portfolio
Mutual Fund & AMC Asset Management Company/ Investment Manager to ‘Mahindra Mutual Fund’, which
received certificate of registration from SEBI

19
Asset Class Quarter ended
June – 17
Quarter ended
June – 16
Year ended
March – 17
Auto/ Utility vehicles 28% 29% 28%
Tractors 21% 17% 19%
Cars 21% 22% 22%
Commercial vehicles and Construction equipments 11% 13% 11%
Pre-owned vehicles 14% 14% 13%
SME and Others 5% 5% 7%
Break down of estimated value of Assets Financed
* Standalone

20
Asset Class As on
June – 17
As on
June – 16
As on
March – 17
Auto/ Utility vehicles 30% 31% 30%
Tractors 17% 17% 17%
Cars 23% 24% 23%
Commercial vehicles and Construction equipments 13% 13% 13%
Pre-owned vehicles 9% 9% 9%
SME and Others 8%* 6% 8%
As on 30th Jun 17, ~48% of the AUM was from M&M assets
* Share of SME: 5%
Break down of AUM
* Standalone

21
Break down by Geography
* Standalone
Central 10%
East 22%
North 27%
South 21%
West 20%
Loan Assets as on June 2017
Central 11%
East 23%
North 31%
South 19%
West 16%
Disbursement for Q1 FY2018
NORTH: Chandigarh, Delhi, Haryana, Himachal Pradesh, Jammu and Kashmir, Punjab, Rajasthan, Uttar Pradesh, Uttaranchal;
EAST: Assam, Bihar, Jharkhand, Meghalaya, Mizoram, Orissa, Sikkim, Tripura, West Bengal; WEST: Dadra and Nagar Haveli, Gujarat, Maharashtra, Goa;
CENTRAL: Chhattisgarh, Madhya Pradesh; SOUTH: Andaman and Nicobar Island, Andhra Pradesh, Karnataka, Kerala, Pondicherry, Tamil Nadu, Telangana;

22
MMFSL believes that its credit rating and strong brand equity enables it to borrow funds at competitive rates
Long term and Subordinated debt
Short term debt
Long term and Subordinated debt
Fixed Deposit Programme
Long term and Subordinated debt; Bank Facilities
IND AAA Stable
India Ratings Outlook
Brickwork Outlook
BWR AAA Stable
FAAA Stable
CRISIL Outlook
CRISIL AA+ Stable
CRISIL A1+ --
Credit Rating
Long term and Subordinated debt
CARE Ratings Outlook
CARE AAA Stable
Short term debt IND A1+ --
Credit Rating

23
Funding Mix by Investor profile (Jun’ 17) Funding Mix by type of Instrument (Jun’ 17)
Investor Type Amount (INR mn.) % Share
Banks 142,811 40%
Mutual Fund 89,678 25%
Insurance & Pension Funds 47,643 13%
FIIs & Corporates 36,028 10%
Others 42,853 12%
Total 359,013 100%
Instrument Type Amount (INR mn.) % Share
NCDs 167,204 47%
Retail NCDs 10,000 3%
Bank Loans 87,133 24%
Fixed Deposits 40,368 11%
CP, ICD 47,863 13%
Securitisation/ Assignment 6,445 2%
Total 359,013 100%
Broad Based Liability Mix
Working Capital Consortium Facility enhanced to Rs. 20,000 mn. comprising several banks
* Based on holding as on 30th June, 2017

24
All our offices are connected to the centralised data centre in
Mumbai through Lease line/HHD
Through hand held devices connected by GPRS to the central
server, we transfer data which provides
– Prompt intimation by SMS to customers
– Complete information to handle customer queries with
transaction security
– On-line collection of MIS on management’s dashboard
– Recording customer commitments – Enables better internal checks & controls
Technology initiatives
Training programs for employees on regular basis
5 days induction program on product knowledge, business
processes and aptitude training
Mahindra Finance Academy training programs for prospective
and existing employees at 5 locations
Assessment & Development Centre for promising employees
Employee recognition programs such as – Dhruv Tara, Annual
Convention Award and Achievement Box
Participation in Mahindra Group’s Talent Management and
Retention program
Employee engagement & training
Employee Management and Technology Initiatives

25
Transforming rural lives across the country
Company Overview
Industry Overview
Business Strategy
Financial Information
Key Subsidiaries
Awards & Accolades
Risk Management Policies

26
Rs. 474 mn
Rs. 870 mn
46%
Total Income Profit after Tax Value of Asset Financed
Rs. 76,399 mn
Rs. 65,639 mn
16%
Rs. 16,031 mn
Rs. 13,757 mn
17%
Key Financials
The Company, wef. quarter ended June 30, 2016, had started considering the estimated realisable value of underlying security (which conforms to the RBI norms) for loan assets to determine 100%
provisioning for assets which were 24 months overdue which had resulted in lower provision of Rs.1927.52 million for the quarter ended June 30, 2016 and Rs. 833.69 million for the year ended March 31, 2017
with a consequent impact on the profit before tax. In the quarter ended June 30, 2017, the Company has made additional provision of Rs. 833.69 million against the above mentioned 100% provision cases.
Q1 FY 18
Q1 FY 17
Figures on standalone basis

27
55.85 59.05
62.38
13.76 16.03
FY15 FY16 FY17 Q1FY17 Q1FY18
8.32
6.73
4.00
0.87 0.47
FY15 FY16 FY17 Q1FY17 Q1FY18
99.7 107.0
113.9 108.2
114.8
FY15 FY16 FY17 Q1FY17 Q1FY18
Note : (1) PAT post exceptional items. (2) Calculated as Shareholders funds/ Number of shares.
329.33 366.62
425.23 378.18
438.14
FY15 FY16 FY17 Q1FY17 Q1FY18
Growth Trajectory Figures on standalone basis
Loan Book (Rs. Bn) Revenues (Rs. Bn)
Book Value Per Share (2) (Rs.) Profit after Tax (1) (Rs. Bn)
28
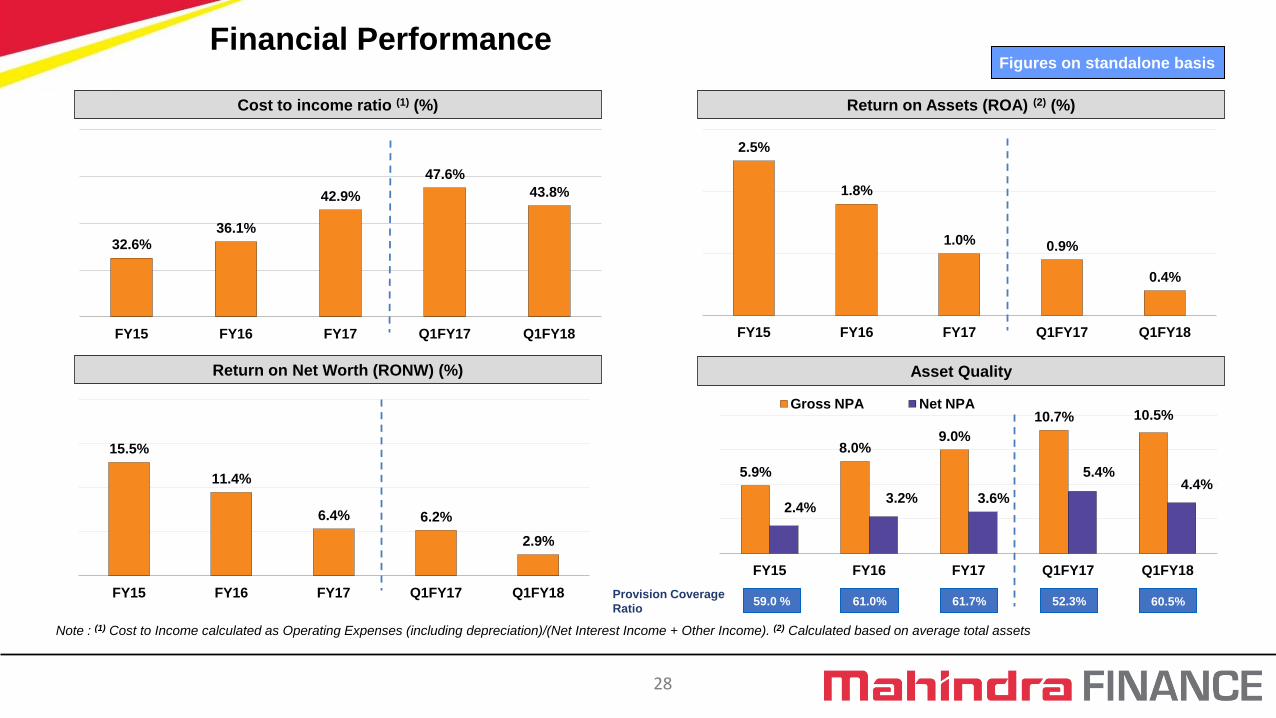
Note : (1) Cost to Income calculated as Operating Expenses (including depreciation)/(Net Interest Income + Other Income). (2) Calculated based on average total assets
Financial Performance Figures on standalone basis
Cost to income ratio (1) (%) Return on Assets (ROA) (2) (%)
Return on Net Worth (RONW) (%)
2.5%
1.8%
1.0% 0.9%
0.4%
FY15 FY16 FY17 Q1FY17 Q1FY18
5.9%
8.0% 9.0%
10.7% 10.5%
2.4% 3.2% 3.6%
5.4% 4.4%
FY15 FY16 FY17 Q1FY17 Q1FY18
Gross NPA Net NPA
Asset Quality
15.5%
11.4%
6.4% 6.2%
2.9%
FY15 FY16 FY17 Q1FY17 Q1FY18 59.0 % 61.0% 61.7% 52.3%
Provision Coverage
Ratio
32.6% 36.1%
42.9%
47.6%
43.8%
FY15 FY16 FY17 Q1FY17 Q1FY18
60.5%

29
Particulars (Rs. in Million) Q1FY18 Q4FY17 Q-o-Q Q1FY17 Y-o-Y FY 17
Revenue from operations 15,924 18,255 (12.8%) 13,664 16.5% 61,739
Less: Finance cost 7,327 7,138 2.7% 6,910 6.0% 28,574
NII 8,597 11,117 (22.7%) 6,754 27.3% 33,165
Other Income 107 172 (37.9%) 93 15.7% 636
Total Income 8,704 11,289 (22.9%) 6,847 27.1% 33,801
Employee benefits expense 1,980 1,797 10.2% 1,675 18.2% 6,809
Provisions and write Offs 4,258 3,614 17.8% 2,245 89.6% 13,091
Other expenses 1,720 2,105 (18.3%) 1,479 16.3% 7,240
Depreciation and amortization 110 135 (18.3%) 106 3.9% 460
Total Expenses 8,068 7,651 5.4% 5,506 46.5% 27,600
Profit before tax 636 3,638 (82.5%) 1,341 (52.6%) 6,201
Tax expense 162 1,297 (85.9%) 472 (65.6%) 2,199
Net Profit after Taxes 474 2,341 (80.6%) 870 (45.5%) 4,002
Standalone Profit & Loss Account
* Figures re-grouped where found relevant
30
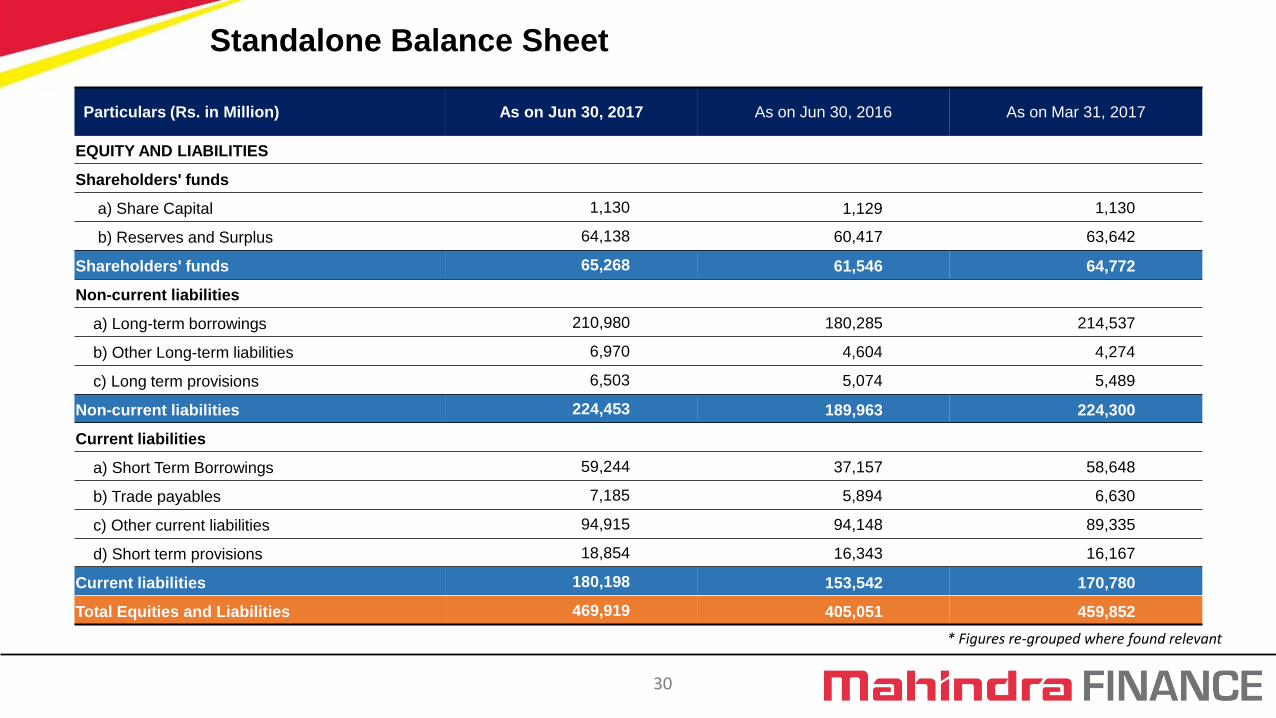
Particulars (Rs. in Million) As on Jun 30, 2017 As on Jun 30, 2016 As on Mar 31, 2017
EQUITY AND LIABILITIES
Shareholders' funds
a) Share Capital 1,130 1,129 1,130
b) Reserves and Surplus 64,138 60,417 63,642
Shareholders' funds 65,268 61,546 64,772
Non-current liabilities
a) Long-term borrowings 210,980 180,285 214,537
b) Other Long-term liabilities 6,970 4,604 4,274
c) Long term provisions 6,503 5,074 5,489
Non-current liabilities 224,453 189,963 224,300
Current liabilities
a) Short Term Borrowings 59,244 37,157 58,648
b) Trade payables 7,185 5,894 6,630
c) Other current liabilities 94,915 94,148 89,335
d) Short term provisions 18,854 16,343 16,167
Current liabilities 180,198 153,542 170,780
Total Equities and Liabilities 469,919 405,051 459,852
Standalone Balance Sheet
* Figures re-grouped where found relevant
31
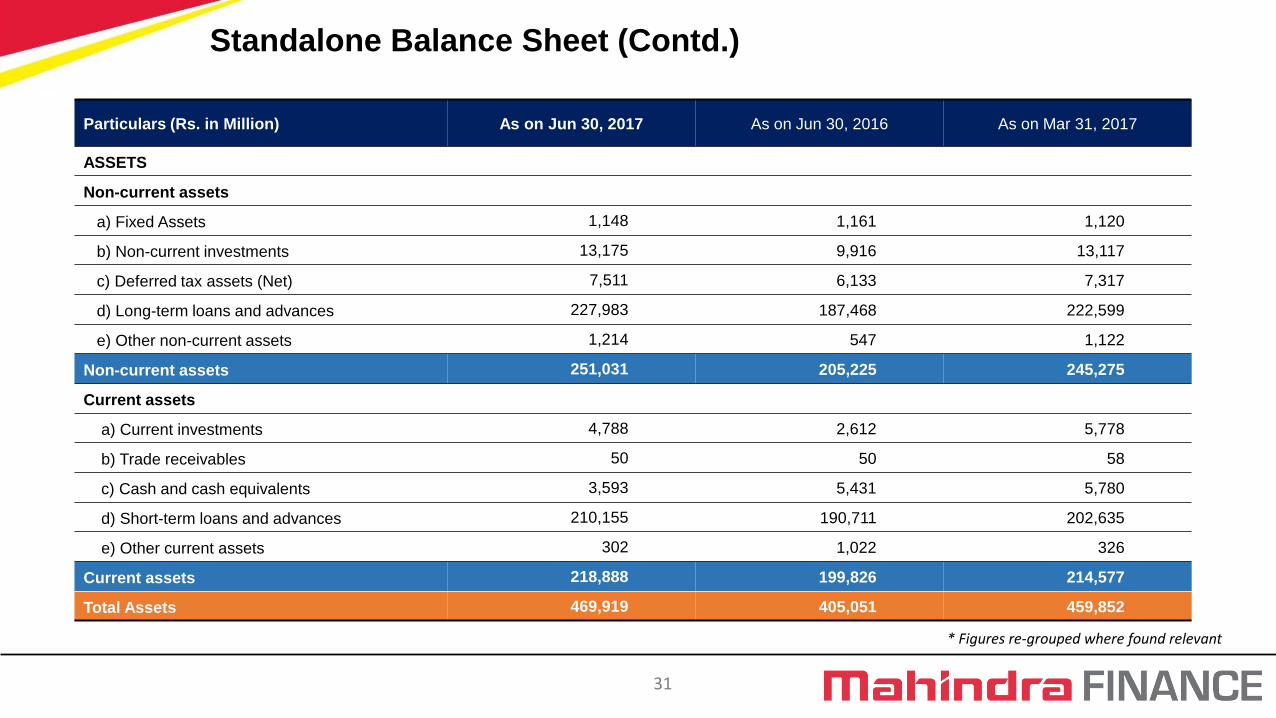
Particulars (Rs. in Million) As on Jun 30, 2017 As on Jun 30, 2016 As on Mar 31, 2017
ASSETS
Non-current assets
a) Fixed Assets 1,148 1,161 1,120
b) Non-current investments 13,175 9,916 13,117
c) Deferred tax assets (Net) 7,511 6,133 7,317
d) Long-term loans and advances 227,983 187,468 222,599
e) Other non-current assets 1,214 547 1,122
Non-current assets 251,031 205,225 245,275
Current assets
a) Current investments 4,788 2,612 5,778
b) Trade receivables 50 50 58
c) Cash and cash equivalents 3,593 5,431 5,780
d) Short-term loans and advances 210,155 190,711 202,635
e) Other current assets 302 1,022 326
Current assets 218,888 199,826 214,577
Total Assets 469,919 405,051 459,852
Standalone Balance Sheet (Contd.)
* Figures re-grouped where found relevant
32
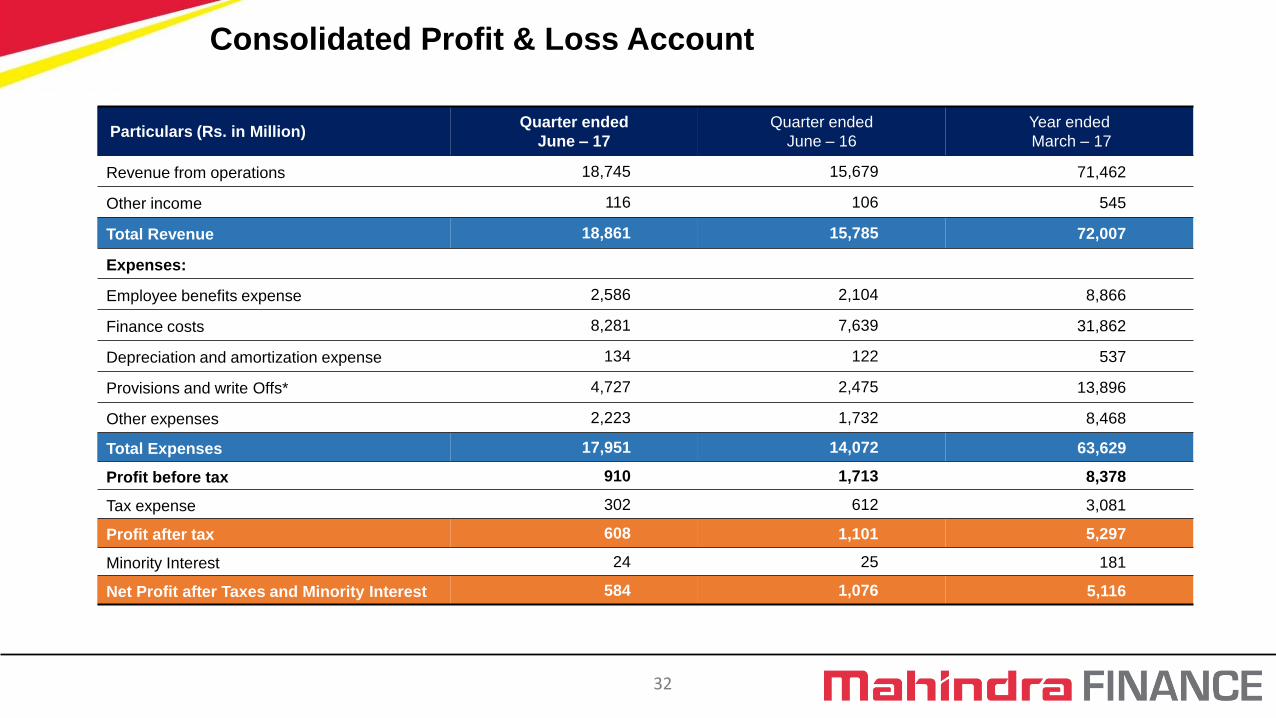
Particulars (Rs. in Million) Quarter ended
June – 17
Quarter ended
June – 16
Year ended
March – 17
Revenue from operations 18,745 15,679 71,462
Other income 116 106 545
Total Revenue 18,861 15,785 72,007
Expenses:
Employee benefits expense 2,586 2,104 8,866
Finance costs 8,281 7,639 31,862
Depreciation and amortization expense 134 122 537
Provisions and write Offs* 4,727 2,475 13,896
Other expenses 2,223 1,732 8,468
Total Expenses 17,951 14,072 63,629
Profit before tax 910 1,713 8,378
Tax expense 302 612 3,081
Profit after tax 608 1,101 5,297
Minority Interest 24 25 181
Net Profit after Taxes and Minority Interest 584 1,076 5,116
Consolidated Profit & Loss Account
33
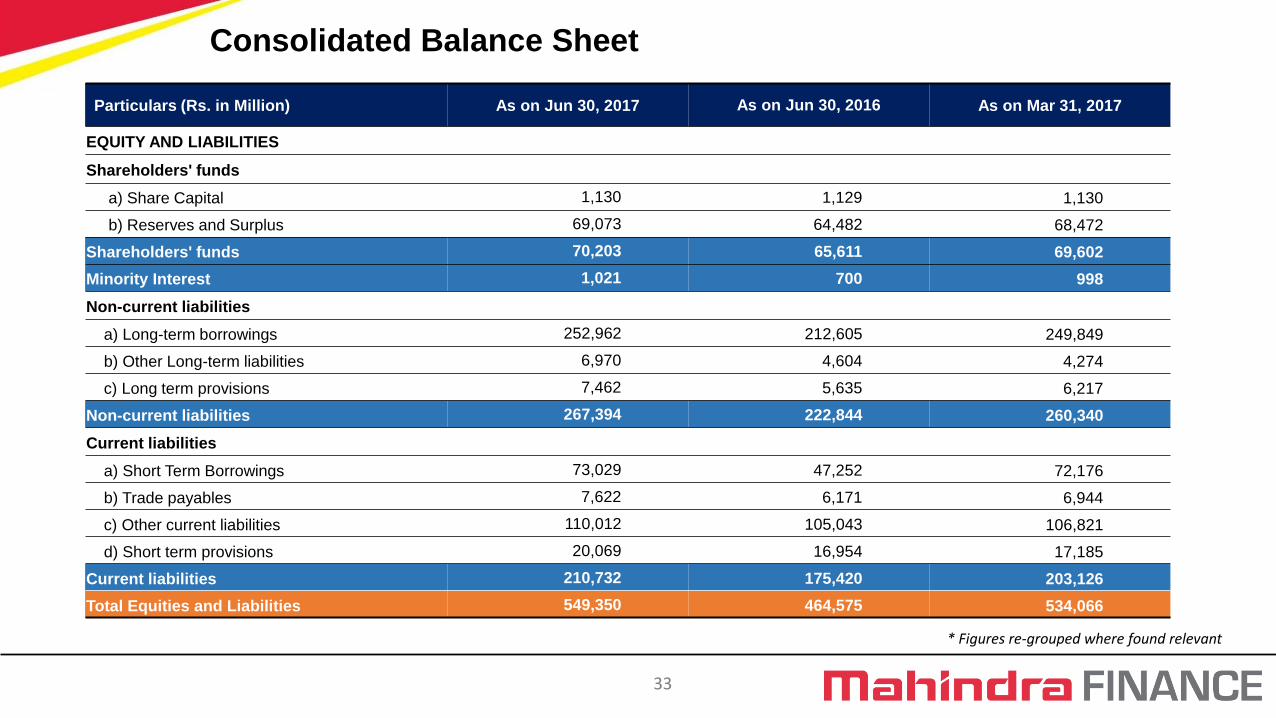
Particulars (Rs. in Million) As on Jun 30, 2017 As on Jun 30, 2016 As on Mar 31, 2017
EQUITY AND LIABILITIES
Shareholders' funds
a) Share Capital 1,130 1,129 1,130
b) Reserves and Surplus 69,073 64,482 68,472
Shareholders' funds 70,203 65,611 69,602
Minority Interest 1,021 700 998
Non-current liabilities
a) Long-term borrowings 252,962 212,605 249,849
b) Other Long-term liabilities 6,970 4,604 4,274
c) Long term provisions 7,462 5,635 6,217
Non-current liabilities 267,394 222,844 260,340
Current liabilities
a) Short Term Borrowings 73,029 47,252 72,176
b) Trade payables 7,622 6,171 6,944
c) Other current liabilities 110,012 105,043 106,821
d) Short term provisions 20,069 16,954 17,185
Current liabilities 210,732 175,420 203,126
Total Equities and Liabilities 549,350 464,575 534,066
Consolidated Balance Sheet
* Figures re-grouped where found relevant
34
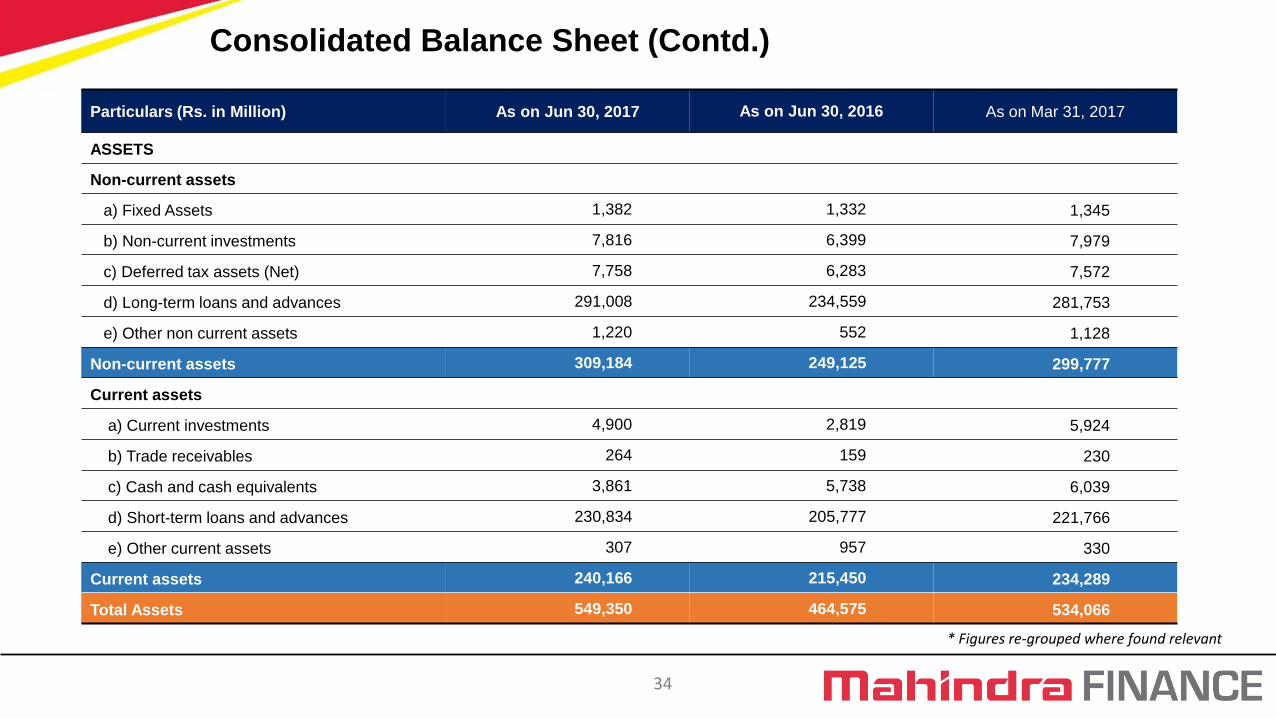
Particulars (Rs. in Million) As on Jun 30, 2017 As on Jun 30, 2016 As on Mar 31, 2017
ASSETS
Non-current assets
a) Fixed Assets 1,382 1,332 1,345
b) Non-current investments 7,816 6,399 7,979
c) Deferred tax assets (Net) 7,758 6,283 7,572
d) Long-term loans and advances 291,008 234,559 281,753
e) Other non current assets 1,220 552 1,128
Non-current assets 309,184 249,125 299,777
Current assets
a) Current investments 4,900 2,819 5,924
b) Trade receivables 264 159 230
c) Cash and cash equivalents 3,861 5,738 6,039
d) Short-term loans and advances 230,834 205,777 221,766
e) Other current assets 307 957 330
Current assets 240,166 215,450 234,289
Total Assets 549,350 464,575 534,066
Consolidated Balance Sheet (Contd.)
* Figures re-grouped where found relevant
35
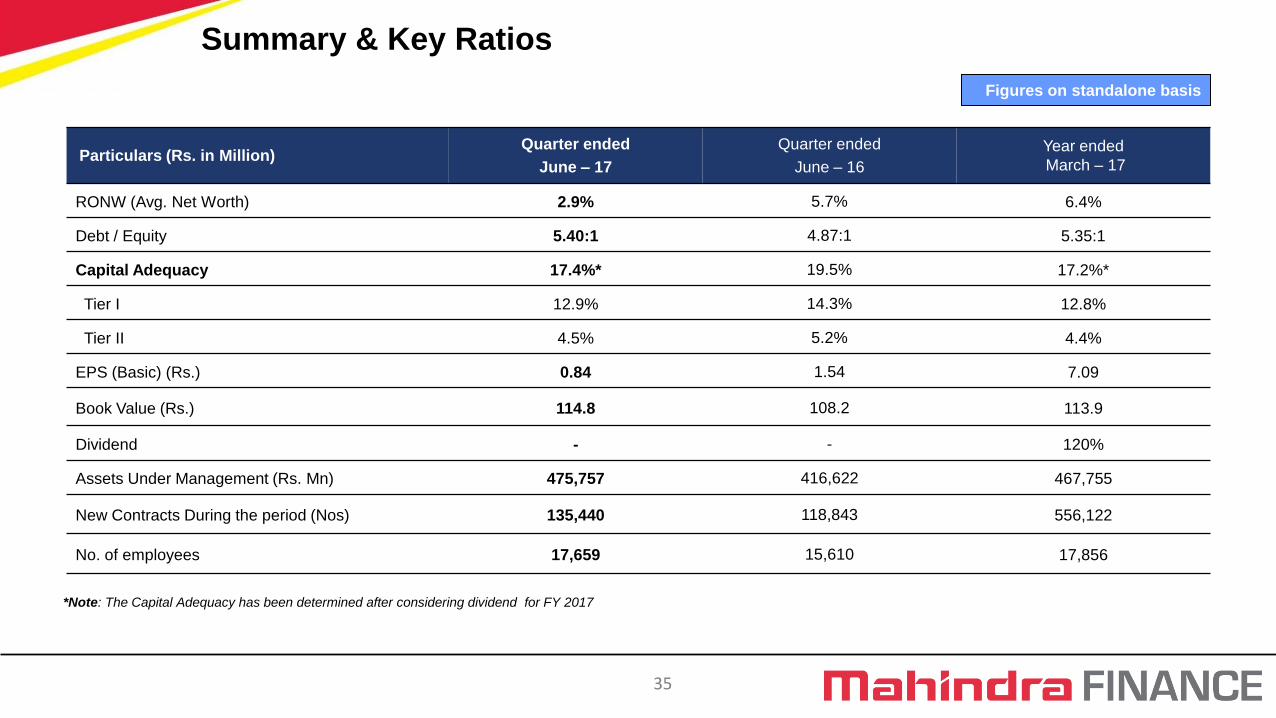
Particulars (Rs. in Million) Quarter ended
June – 17
Quarter ended
June – 16
Year ended
March – 17
RONW (Avg. Net Worth) 2.9% 5.7% 6.4%
Debt / Equity 5.40:1 4.87:1 5.35:1
Capital Adequacy 17.4%* 19.5% 17.2%*
Tier I 12.9% 14.3% 12.8%
Tier II 4.5% 5.2% 4.4%
EPS (Basic) (Rs.) 0.84 1.54 7.09
Book Value (Rs.) 114.8 108.2 113.9
Dividend - - 120%
Assets Under Management (Rs. Mn) 475,757 416,622 467,755
New Contracts During the period (Nos) 135,440 118,843 556,122
No. of employees 17,659 15,610 17,856
Figures on standalone basis
Summary & Key Ratios
*Note: The Capital Adequacy has been determined after considering dividend for FY 2017

36
Particulars (Rs. in Million) Quarter ended
June – 17
Quarter ended
June – 16
Year ended
March – 17
Total Income / Average Assets 14.5% 14.3% 15.2%
Interest / Average Assets 6.6% 7.2% 7.0%
Gross Spread 7.8% 7.1% 8.2%
Overheads / Average Assets 3.4% 3.4% 3.5%
Write offs & NPA provisions / Average Assets 3.8% 2.3% 3.2%
Net Spread 0.6% 1.4% 1.5%
Net Spread after Tax 0.4% 0.9% 1.0%
Spread Analysis
Figures on standalone basis
37
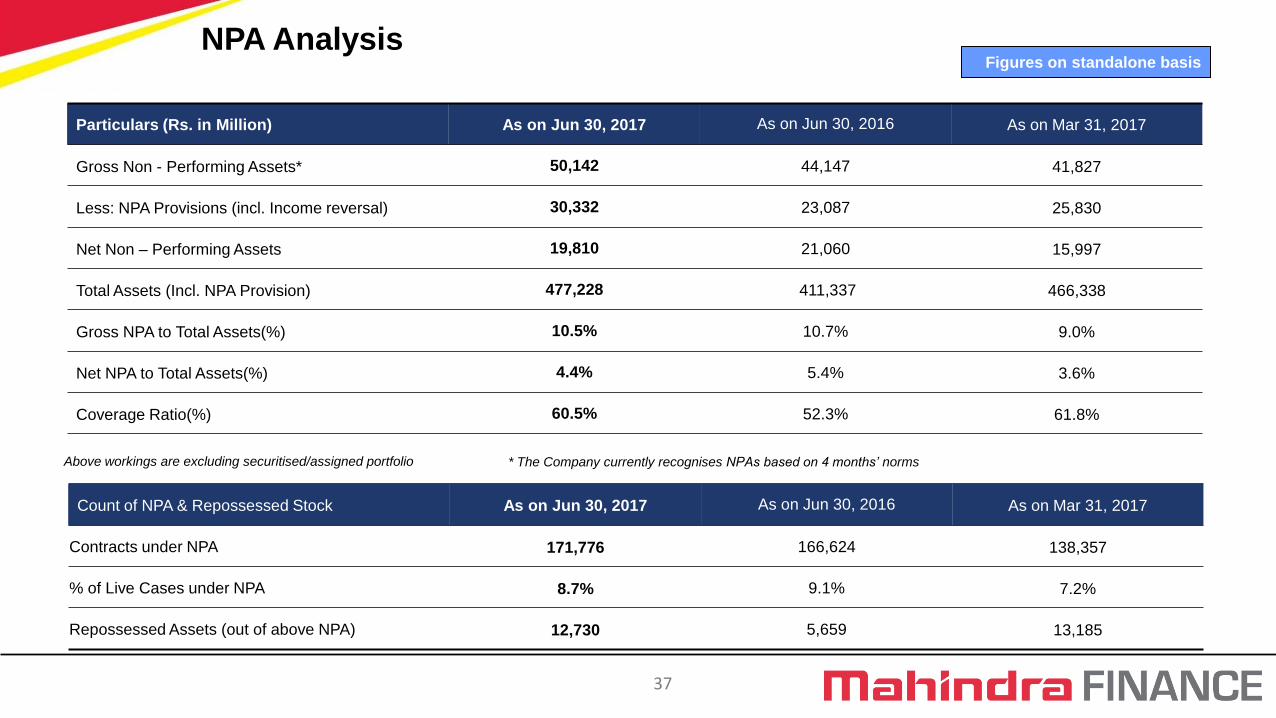
Particulars (Rs. in Million) As on Jun 30, 2017 As on Jun 30, 2016 As on Mar 31, 2017
Gross Non - Performing Assets* 50,142 44,147 41,827
Less: NPA Provisions (incl. Income reversal) 30,332 23,087 25,830
Net Non – Performing Assets 19,810 21,060 15,997
Total Assets (Incl. NPA Provision) 477,228 411,337 466,338
Gross NPA to Total Assets(%) 10.5% 10.7% 9.0%
Net NPA to Total Assets(%) 4.4% 5.4% 3.6%
Coverage Ratio(%) 60.5% 52.3% 61.8%
Above workings are excluding securitised/assigned portfolio
NPA Analysis Figures on standalone basis
* The Company currently recognises NPAs based on 4 months’ norms
Count of NPA & Repossessed Stock As on Jun 30, 2017 As on Jun 30, 2016 As on Mar 31, 2017
Contracts under NPA 171,776 166,624 138,357
% of Live Cases under NPA 8.7% 9.1% 7.2%
Repossessed Assets (out of above NPA) 12,730 5,659 13,185
38
Transforming rural lives across the country
Company Overview
Industry Overview
Business Strategy
Financial Information
Key Subsidiaries
Awards & Accolades
Risk Management Policies

39
Business Area: Provide loans for home construction, extension, purchase and improvement to a wide
base of customers in rural and semi-urban India
Shareholding pattern: MMFSL – 87.5%; NHB – 12.5%
Reach: Currently spread in 12 States & 1 Union Territory
Particulars (Rs. million) Quarter ended
June – 17
Quarter ended
June – 16
Year ended
March – 17
Loans disbursed 5,978 4,050 21,162
No. of Customer Contracts (nos.) 40,620 28,654 172,462
Outstanding loan book 52,443 35,576 48,235
Total income 1,985 1,437 7,034
PBT 44 124 1,269
PAT 29 81 830
Net-worth 4,788 2,838 4,759
GNPA % 12.8% 9.7% 9.7%
Mahindra Rural Housing Finance Limited

40
Particulars (Rs. million) Quarter ended
June – 17
Quarter ended
June – 16
Year ended
March – 17
Total income 445 365 1,742
Net premium 3,879 2,680 13,644
PBT 211 156 817
PAT 134 101 530
No. of Policies for the Period (nos.) 499,816 360,128 1,591,796
No. of employees (nos.) 1,014 825 956
Business Area: Licensed by IRDA for undertaking insurance broking in Life, Non-Life and reinsurance businesses
Shareholding pattern: MMFSL – 85%; Inclusion Resources Pvt. Ltd. – 15%
Mahindra Insurance Brokers Limited

41
Transforming rural lives across the country
Company Overview
Industry Overview
Business Strategy
Financial Information
Key Subsidiaries
Awards & Accolades
Risk Management Policies

42
■ Mahindra Finance was recognized as Top 19 Best Employer in Aon Best Employer
List 2017 .
■ Mahindra Finance is recognized in amongst the top 50 India’s Best Companies to
Work for 2017. The study is Conducted by the Great Place to Work Institute and
Economic Times .The organization was ranked at 49th position and also was declared
as one of the best in the Financial Services Sector .
■ Mahindra Finance is commended with Significant Achievement in HR Excellence at
the 7th Confederation of Indian Industry (CII) HR Excellence Award 2016.
■ Mahindra Finance has been appraised and rated at People CMM® Maturity Level 3.
■ Mahindra Finance included on Dow Jones Sustainability Index (DJSI) – Emerging
Market Trends for 4th year in a row. We are the only Indian Company from Diversified
Financial Services Sector to get selected.
■ Mahindra Finance was included in ‘The Sustainability Yearbook 2017’ which was
released by RobecoSAM.
Awards and Accolades

43
Transforming rural lives across the country
Company Overview
Industry Overview
Business Strategy
Financial Information
Key Subsidiaries
Awards & Accolades
Risk Management Policies
44
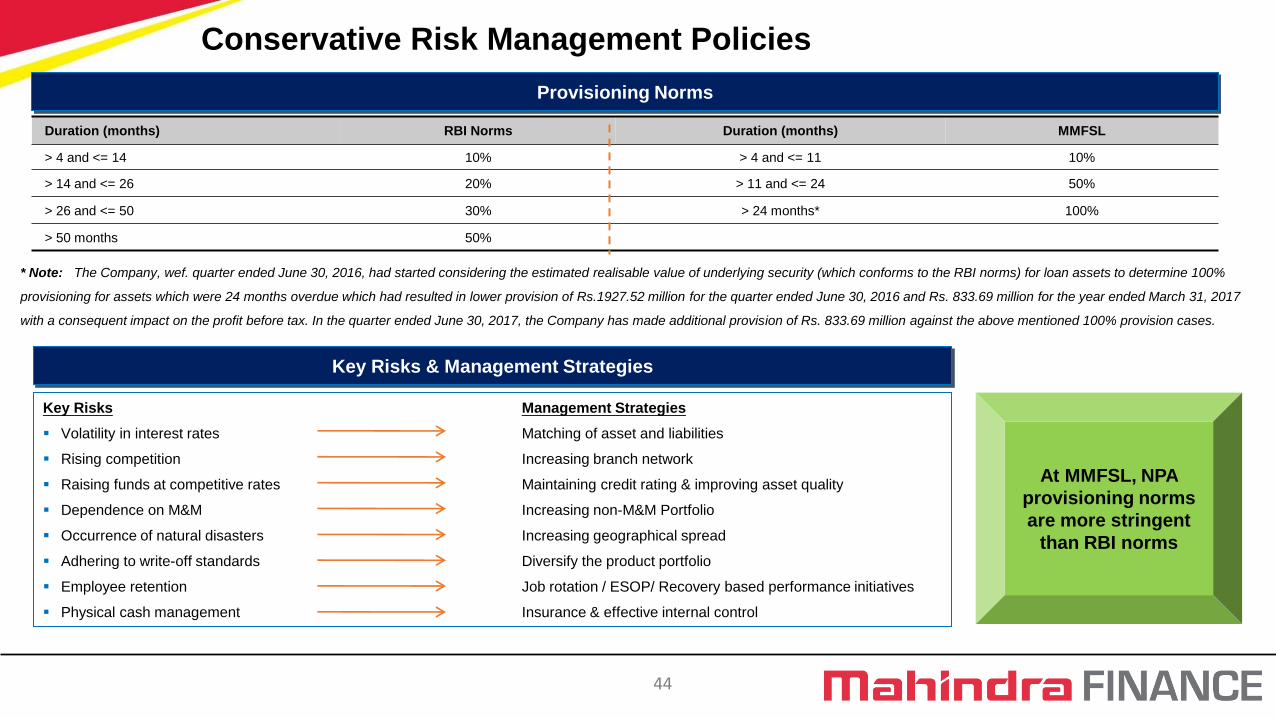
Duration (months) RBI Norms Duration (months) MMFSL
> 4 and <= 14 10% > 4 and <= 11 10%
> 14 and <= 26 20% > 11 and <= 24 50%
> 26 and <= 50 30% > 24 months* 100%
> 50 months 50%
Provisioning Norms
Conservative Risk Management Policies
* Note: The Company, wef. quarter ended June 30, 2016, had started considering the estimated realisable value of underlying security (which conforms to the RBI norms) for loan assets to determine 100%
provisioning for assets which were 24 months overdue which had resulted in lower provision of Rs.1927.52 million for the quarter ended June 30, 2016 and Rs. 833.69 million for the year ended March 31, 2017
with a consequent impact on the profit before tax. In the quarter ended June 30, 2017, the Company has made additional provision of Rs. 833.69 million against the above mentioned 100% provision cases.
Key Risks & Management Strategies
Key Risks Management Strategies
Volatility in interest rates Matching of asset and liabilities
Rising competition Increasing branch network
Raising funds at competitive rates Maintaining credit rating & improving asset quality
Dependence on M&M Increasing non-M&M Portfolio
Occurrence of natural disasters Increasing geographical spread
Adhering to write-off standards Diversify the product portfolio
Employee retention Job rotation / ESOP/ Recovery based performance initiatives
Physical cash management Insurance & effective internal control
At MMFSL, NPA
provisioning norms
are more stringent
than RBI norms

45
This presentation does not constitute or form part of any offer or invitation or inducement to sell or issue, or any solicitation of any offer to purchase or subscribe for, any securities of Mahindra & Mahindra Financial Services Limited (the “Company”), nor shall it or any part of it or the fact of its distribution form the basis of, or be relied on in connection with, any contract or commitment there for.
This presentation contains statements that constitute forward-looking statements. These statements include descriptions regarding the intent, belief or current expectations of the Company or its directors and officers with respect to the results of operations and financial condition of the Company. These statements can be recognized by the use of words such as “expects,” “plans,” “will,” “estimates,” “projects,” or other words of similar meaning. Such forward-looking statements are not guarantees of future performance and involve risks and uncertainties, and actual results may differ from those in such forward-looking statements as a result of various factors and assumptions which the Company believes to be reasonable in light of its operating experience in recent years. The Company does not undertake to revise any forward-looking statement that may be made from time to time by or on behalf of the Company.
No representation, warranty, guarantee or undertaking, express or implied, is or will be made as to, and no reliance should be placed on, the accuracy, completeness or fairness of the information, estimates, projections and opinions contained in this presentation. Potential investors must make their own assessment of the relevance, accuracy and adequacy of the information contained in this presentation and must make such independent investigation as they may consider necessary or appropriate for such purpose. Any opinions expressed in this presentation are subject to change without notice. None of the Company, the placement agents, promoters or any other persons that may participate in the offering of any securities of the Company shall have any responsibility or liability whatsoever for any loss howsoever arising from this presentation or its contents or otherwise arising in connection therewith.
This presentation and its contents are confidential and should not be distributed, published or reproduced, in whole or part, or disclosed by recipients directly or indirectly to any other person. In particular, this presentation is not for publication or distribution or release in the United States, Australia, Canada or Japan or in any other country where such distribution may lead to a breach of any law or regulatory requirement. The information contained herein does not constitute or form part of an offer or solicitation of an offer to purchase or subscribe for securities for sale in the United States, Australia, Canada or Japan or any other jurisdiction. The securities referred to herein have not been and will not be registered under the United States Securities Act of 1933, as amended, and may not be offered or sold in the United States or to or for the benefit of US persons absent registration or an applicable exemption from registration.
CRISIL DISCLAIMER: CRISIL limited has used due care and caution in preparing this report. Information has been obtained by CRISIL from sources which it considers reliable. However, CRISIL does not guarantee the accuracy, adequacy or completeness of any information and is not responsible for any errors or omissions or for the results obtained from the use of such information. No part of this report may be published/reproduced in any form without CRISIL’s prior written approval. CRISIL is not liable for investment decisions which may be based on the views expressed in this report. CRISIL Research operates independently of, and does not have access to information obtained by CRISIL’s Rating Division, which may, in its regular operations, obtain information of a confidential nature that is not available to CRISIL Research.
Disclaimer
46
Thank You
Transforming rural lives
across the country
Top Related