


Languages
Pages
Legal


Magnitude and Frequency of Floods in the United StatesPart 6-A. Missouri River Basin above Sioux Cit'% Iowa
By JAMES L. PATTERSON
GEOLOGICAL SURVEY WATER-SUPPLY PAPER 1679
UNITED STATES GOVERNMENT PRINTING OFFICE, WASHINGTON : 1966
UNITED STATES DEPARTMENT OF THE INTERIOR
STEWART L. UDALL, Secretary
GEOLOGICAL SURVEY
William T. Pecora, DirectorLibrary of Congress catalog-card No. GS 64-192
For sale by the Superintendent of Documents, U.S. Government Printing Office Washington, D.C. 20402

CONTENTS
PageAbstract _________________________________________ 1Introduction _______________________________ 1
Purpose and scope_________________________ 1Acknowledgments ________________________ _ 3
Application of flood-frequency data_____________________ _ 3Regional application_____________________________ _ 4Special application______________________________ 7Streams affected by regulation or diversion________________ 11
Description of the area__________ ____________ _ 12River basins____________________________________ 12Topography ____________________________________ 12Climate ______________________________________ 13
Flood-frequency analysis______________________________ 13Method of analysis_______________________________ 13Records used___________________________________ 14Flood frequency at a gaging station___________________.__ 14
Types of flood series_____________________ 14Flood-frequency curves___________________ 15
Regional flood frequency______________________________ 17Mean annual flood__________________________ 17Composite frequency curves_______________________ 17
Summary __________________________________________ 18Flood records at gaging stations and miscellaneous sites__________ 18
Maximum known floods____________________________ 20Missouri River main stem_________________________ 59
Red Rock River at Kennedy Ranch, near Lakeview, Mont_____ 59Sheep Creek basin________________________________ 59
Sheep Creek below Muddy Creek, near Dell, Mont________ 59Missouri River main stem___________________________ 60
Red Rock River near Dell, Mont_____________________ 60Horse Prairie Creek basin__________________________ 61
Horse Prairie Creek near Grant, Mont_________________ 61Grasshopper Creek basin___________________________ 61
Grasshopper Creek near Dillon, Mont_________________ 61Missouri River main stem___________________________ 62
Beaverhead River at Barratts, Mont_________________- 62Blacktail Creek basin_____________________________ 63
Blacktail Creek near Dillon, Mont___________________ 63Missouri River main stem___________________________ 64
Beaverhead River tributary No. 2 near Dillon, Mont______ 64Beaverhead River at Blaine, Mont___________________ 64
Ruby River 'basin_________________________________ 65Ruby River above Warm Springs Creek, near Alder, Mont____ 65Ruby River above reservoir, near Alder, Mont____________ 66
in

IV CONTENTS
Flood records at gaging stations and miscellaneous sites ContinuedRuby River basin Continued Page
Ruby River at damsite, near Alder, Mont___ 67Ruby River near Alder, Mont____________ ___ 67Ruby River at Laurin, Mont_____________________ 68Ruby River below Ramshorn Creek, near Sheridan, Mont_____ 68Ruby River near Twin Bridges, Mont________________ 69
Big Hole River basin_______________________________ 69Big Hole River near Jackson, Mont__________________ 69Miner Creek near Jackson, Mont__________________ 70Trail Creek near Wisdom, Mont___________________ 70Big Hole River near Melrose, Mont_________ _____ 71Birch Creek near Glen, Mont_____________-_______ 72
Missouri River main stem___________________________ 73Jefferson River near Twin Bridges, Mont______________ 73Jefferson River near Silverstar, Mont__________ ___ 73
Fish Greek basin_______________________________ 74Fish Creek near Silverstar, Mont__________________- 74
Pipestone Creek basin___________________________ 74Little Pipestone Creek near Whitehall, Mont___________ 74
Unnamed basin________________________________ 75Jefferson River tributary No. 2 near Whitehall, Mont ____ 75
Boulder River basin_____________________________ 75Boulder River above Rock Creek, near Basin, Mont________ 75Boulder River near Boulder, Mont_____________-___ 76
South Boulder River basin__________________________ 77South Boulder River near Jefferson Island, Mont_________ 77
Missouri River main stem___________________________ 77Jefferson River at Sappington, Mont________________ 77
Willow Creek basin_____________________________ 78Willow Oreek near Harrison, Mont___________ ___ 78Norwegian Creek near Harrison, Mont_________________ 79Willow Creek near Wallow Greek, Mont_______________ 79
Madison River basin_____________________________ 80Madison River near West Yellowstone, Mont____________ 80Madison River near Gameron, Mont _ _ 81Madison River below Cherry Creek, near Norris, Mont 81Madison River near Three Forks, Mont_________ _ 82
Gallatin River basin_______________________ ___ 82Taylor Creek near Grayling, Mont_______ 82Squaw Creek near Gallatin Gateway, Mont_____ __ 83Logger Creek near Gallatin Gateway, Mont_ 83Gallatin River near Gallatin Gateway, Mont 84Gallatin River near Salesville, Mont_______ 85East Gallatin River near Bozeman, Mont_____ 85Bear Canyon Creek near Bozeman, Mont___ 86East Gallatin River at Bozeman, Mont____ 86Bridger Creek near Bozeman, Mont _ 87Hyalite Creek at Hyalite ranger station, near Bozeman. Mont 88Gallatin River at Logan, Mont__________ 89
Missouri River main stem________ 90Missouri River at Toston, Mont________ 90
Crow Creek basin_____________________ 90Crow Creek near Radersburg, Mont_ _ 90

CONTENTS V
Flood records at gaging stations and miscellaneous sites Continued PageDeep Creek basin___________________________________ 91
Deep Creek below North Fork Deep Creek, near Townsend, Mont_ 91Missouri Biver main stem_____ _ ________________ 91
Missouri River near Townsend, Mont_________________ 91Spokane Creek basin_____________________________ 91
Mitchell Gulch near East Helena, Mont________________ 91Prickly Pear Creek basin___________________________ 92
Lump Gulch Creek at Zastrow's ranch, near Clancy, Mont____ 92Prickly Pear Creek near Clancy, Mont________________ 92Prickly Pear Creek at East Helena, Mont_______________ 93Tenmile Creek near Rimini, Mont___________________ 94Little Porcupine Creek tributary near Helena, Mont-__ ___ 95Tenmile Creek near Helena, Mont ________________ ___ 96
Missouri River main stem___________________________ 96Missouri River below Hauser Lake Dam, near Helena, Mont__ 96Missouri River below Holter Dam, near Wolf Creek, Mont___ 97
Little Prickly Pear Creek basin______________________ 97Little Prickly Pear Creek near Marysville, Mont_________ 97Little Prickly Pear Creek near Canyon Creek, Mont________ 98Lyons Creek near Wolf Creek, Mont__________________ 98
Dearborn River basin_____________________________ 99Dearborn River near demons, Mont__________________ 99Dearborn River near Craig, Mont____________________ 100
Missouri River main stem___________________________ - 100Missouri River at Cascade, Mont____________________ 100
Smith River basin________________________________ 101Smith River near White Sulphur Springs, Mont_______ 101Newland Creek near White Sulphur Springs, Mont____ 101Newland Creek near damsite, near White Sulphur Springs, Mont_ 102Nuggett Creek near Neihart, Mont__________________ 102Sheep Creek near White Sulphur Springs, Mont______ _ _ 102Smith River near Eden, Mont______________________ 103Goodman Coulee near Eden, Mont____________ 104Smith River at Truly, Mont_______________________ 104
Missouri River main stem___________________ 105Missouri River near Ulm, Mont_____________ 105
Sun River basin__________________________________ 105North Fork Sun River near Augusta, Mont_________ 105Beaver Creek at Gibson Dam, near Augusta, Mont____ 106Sun River near Augusta, Mont____________ 106Willow Creek near Augusta, Mont__ _ 107Smith Creek near Augusta, Mont____________ 108Ford Creek near Augusta, Mont_________ 108Smith Creek below Ford Creek, near Augusta, Mont_ 109Elk Creek at Augusta, Mont_______________________- 109Sun River at Fort Shaw, Mont_______________________ 110Sun River at Sun River, Mont_________________ 110Muddy Creek at Vaughn, Mont_______________ 111Sun River near Vaughn, Mont______________ 111Sun River tributary near Great Falls, Mont________ 112
Missouri River main stem___________________ 113Missouri River near Great Falls, Mont_________ 113

VI CONTENTS
Flood records at gaging stations and miscellaneous sites Continued PageBelt Creek basin_________________________________ 113
Belt Creek near Monarch, Mont____________________ 113Missouri River main stem___________________________ 114
Missouri River at Fort Benton, Mont_________________ 114Marias River basin________________________________ 115
Two Medicine Creek near Browning, Mont_______________ 115Badger Creek near Browning, Mont___________________ 115Badger Creek near Family, Mont____________________ 116Birch Creek near Dupuyer, Mont___________________ 116Dupuyer Creek near Valier, Mont___________________ 117Cut Bank Creek near Browning, Mont_______________ 118Cut Bank Creek at Cut Bank, Mont__________________ 118Marias River near Shelby, Mont_____________________ 119Dry Fork Marias River at Fowler, Mont_______________ 120Willow Creek near Devon, Mont___________________ 121Marias River near Brinkman, Mont_________________ 121Dry Fork Coulee tributary near Loma, Mont___________ 122Marias River tributary at Loma, Mont_________________ 123Marias River tributary No. 2 at Loma, Mont____________ 123Teton River near Farmington, Mont__________________ 123Teton River at Strabane, Mont_____________ ____ 124Spring Creek near Strabane, Mont____________ _______ 124Teton River near Choteau, Mont____________________ 125Willow Creek near Choteau, Mont____________ ____ 125Deep Creek near Choteau, Mont___________ _____ 126Muddy Creek near Bynum, Mont___________________ 126North Fork Muddy Creek near Bynum, Mont____________ 127Teton River near Dutton, Mont______________________ 127
Missouri River main stem_____ ___ 128Missouri River at Virgelle, Mont____________ _ 128
Judith River basin________________________________ 128South Fork Judith River near Utica, Mont______ ___ 128Judith River near Utica, Mont________ 129Ross Fork near Hobson, Mont______ 130Cottonwood Creek near Moore, Mont___ 131Wolf Creek at Neubert Ranch, near Stanford, Mont 131Wolf Creek near Stanford, Mont_______ 131
Missouri River main stem__________ 132Missouri River at powerplant ferry, near Zortman, Mcnt 132
Musselshell River basin____ _ 133North Fork Musselshell River near Delpine, Mont 133North Fork Musselshell River at Delpine, Mont 133Checkerboard Creek near Delpine, Mont 134Checkerboard Creek at Delpine, Mont 134North Fork Musselshell River near Martinsdale, Mont 135South Fork Musselshell River above Martinsdale, Mont 135South Fork Musselshell River near Martinsdale, Mont 136Musselshell River at Harlowton, Mont 136Antelope Creek tributary near Harlowton, Mont 137Antelope Creek tributary near mouth, near Harlowton, Mont 137Antelope Creek tributary No. 2 near Harlowton, Mont 138Antelope Creek at Harlowton, Mont 138American Fork near Harlowton, Mont - 139

CONTENTS VII
Flood records at gaging stations and miscellaneous sites ContinuedMusselshell River basin Continued Page
Lebo Creek near Harlowton, Mont__________________ 139American Fork below Lebo Creek, near Harlowton, Mont____ 140Musselshell River near Ryegate, Mont________________ 140Careless Creek at Wallum, Mont__________________ 141Big Coulee near Lavina, Mont_____________________ 141Currant Creek near Roundup, Mont_________________ 142Musselshell River near Roundup, Mont_______________ 142Musselshell River at Musselshell, Mont________________ 143Flatwillow Creek near Flatwillow, Mont_______________ 143Flatwillow Creek near Winnett, Mont________________ 144Box Elder Creek tributary near Winnett, Mont__________ 145Bos Elder Creek near Winnett, Mont_________________ 145McDonald Creek at Winnett, Mont___________________ 146German Coulee near Cat Creek, Mont_________________ 146Gorman Coulee tributary near Cat Creek, Mont__________ 147Musselshell River at Mosby, Mont__________________ 147
Dry Creek basin_________________________________ 148Cat Creek near Cat Creek, Mont____________________ 148Sand Creek near Jordan, Mont__________________ 148Little Dry Creek near Van Norman, Mont________ 148Dry Creek near Van Norman, Mont_______________ 149
Missouri River main stem_____________________ 150Missouri River below Fort Peck Dam, Mont______ 150
Milk River basin_________________________________ 150Milk River near Del Bonita, Mont_______ 150Milk River at western crossing of international boundary 151 North Fork Milk River above St. Mary Canal, near Browning.
Mont ___________________________________ 153North Milk River near international boundary - 153Milk River at Milk River, Alberta________________ 154Milk River at eastern crossing of international boundary 155Sage Creek at "Q" Ranch, near Wildhorse, Alberta_ 156Milk River above Havre, Mont_______________ 157Sage Creek near Kremlin, Mont_______________ 157Big Sandy Creek near Bos Elder, Mont________ 157Big Sandy Creek near Assinniboine, Mont___ _ 158Milk River at Havre, Mont_____________________ 158Milk River at Lohman, Mont_________________- 159Lodge Creek at international boundary_____ _ 160McRae Creek at international boundary___ _ 160Lodge Creek below McRae Creek, at international boundary 161 Battle Creek above Cypress Lake west inflow canal, near Weft
Plains, Saskatchewan__________ 162Battle Creek at international boundary____ _ 162Woodpile Coulee near international boundary ___ 163East Fork Battle Creek near international boundary_ 164Lyons Creek at international boundary____________- 165Battle Creek near Chinook, Mont_______________ 165Peoples Creek near Dodson, Mont___________ 166Alkali Creek near Malta, Mont___________________ 166Disjardin Coulee near Malta, Mont____ ___-_ 167South Fork Taylor Creek near Malta, Mont__-___ 167

VIII CONTENTS
Flood records at gaging stations and miscellaneous sites ContinuedMilk River basin Continued Page
Milk River at Malta, Mont________________________ 167Whitewater Creek near international boundary _ 168 Frenchman River above Eastend Reservoir, near Ravenscrag,
Saskatchewan _____________________________ 169 Frenchman River below Eastend Reservoir, near Eastend,
Sasketchewan _____________________________ 169Frenchman River at Morrisons, near Eastend, Saskatchewan__ 170Frenchman River at 50-Mile, near Bracken, Saskatchewan____ 171Frenchman River below Val Marie, Saskatchewan________ 171Frenchman River at international boundary_______________ 172Beaver Creek near Malta, Mont____________________ 173Rock Creek at international boundary______________ 173Horse Creek at international boundary_______________ 174Rock Creek below Horse Creek, near international boundary___ 175McEachern Creek at international boundary____________ 175Rock Creek near Hinsdale, Mont__________________ 176Milk River near Vandalia, Mont____________________ 176Unger Creek near Vandalia, Mont__________________ 177Willow Creek near Glasgow, Mont__________________ 177Milk River at Nashua, Mont_______________________ 178Porcupine Creek at Nashua, Mont____________________ 178
Wolf Creek basin_______________________________ 179Wolf Creek near Wolf Point, Mont___________________ 179
Missouri River main stem____________________________ 179Missouri River near Wolf Point, Mont_________________ 179
Redwater Creek basin____________________________ 180East Fork Duck Creek near Brockway, Mont____________ 180Duck Creek near Brockway, Mont_______ _____ 180Redwater Creek at Brockway, Mont_______________________ 181Tusler Creek near Brockway, Mont__________________ 181Redwater Creek tributary near Brockway, Mont_________ 181South Fork Dry Ash Creek near Circle, Mont_____________ 182McCune Creek near Circle, Mont____________________ 182Redwater Creek at Circle, Mont___________________ 182
Poplar River basin______________________________ 183Middle Fork Poplar River at international boundary________ 183East Poplar River at international boundary______________ 184West Fork Poplar River at international boundary________ 185West Fork Poplar River near Richland, Mont_____________ 185Poplar River near Bredette, Mont___________________ 186Poplar River near Poplar, Mont____________________ 186
Big Muddy Creek basin_____________________________ 187Big Muddy Creek at Daleview, Mont__________________ 187Big Muddy Creek at Plemtywood, Mont________________ 188Box Elder Creek near Plentywood, Mont_______________ 189Box Elder Creek at damsite, near Plentywood, Mont________ 189Spring Creek near Plentywood, Mont________________ 189Spring Creek at Highway 16, near Plentywood, Mont_______ 190Big Muddy Creek at Reserve, Mont_______ _______ 190Big Muddy Creek near Culbertson, Mont_____ __ _ 191
Missouri River main stem_________________________ 191Missouri River near Culbertson, Mont_______________ 191

CONTENTS IX
Flood records at gaging stations and miscellaneous sites Continued PageYellowstone River basin________________ 192
Yellowstone River at Yellowstone Lake Outlet, YellowstoneNational Park_______________________________ 192
Yellowstone River near Canyon Hotel, Yellowstone Nation"!Park ____________________________________ 192
Tower Creek at Tower Falls, Yellowstone National Park__ 193 Lamar River near Tower Falls ranger station, Yellowstone Na
tional Park___________________________ 194 Blacktail Deer Creek near Mammoth, Yellowstone National Park- 195 Gardner River at Mammoth, Yellowstone National Park 195 Gardner River near Mammoth, Yellowstone National Park 196 Yellowstone River at Corwin Springs, Mont______ - 197 Mill Creek near Pray, Mont____________ 198 Yellowstone River near Livingston, Mont____ 198 Shields River near Wilsall, Mont_________________ 199 Shields River at Clyde Park, Mont_______________ 200 Brackett Creek near Clyde Park, Mont___ _ - 20.! North Fork Big Timber Creek near Big Timber, Mont- _ 201 South Fork Big Timber Creek near Big Timber, Mont____ 202 Big Timber Creek near Big Timber, Mont_____ 202 Boulder River near Contact, Mont__________ 203 West Fork Boulder River near Bruffeys, Mont____________ 203 West Fork Boulder River at McLeod, Mont___________ 204 Boulder River at Big Timber, Mont___________________ 204 Sweet Grass Creek near Melville, Mont____________-_- 205 Sweet Grass Creek above Melville, Mont____________ 205 Sweet Grass Creek below Melville, Mont______ 206 Rosebud Creek near Absarokee, Mont__________ 207 Stillwater River near Absarokee, Mont__________-_ 208 Clarks Fork Yellowstone River above Squaw Creek, near Painter,
Wyo_____________________________________ 209 Clarks Fork Yellowstone River below Crandall Creek, near
Painter, Wyo_______________________________ 209Sunlight Creek near Painter, Wyo_________________ 210Clarks Fork Yellowstone River near Clark, Wyo_________ 210Clarks Fork Yellowstone River at Chance, Mont________ 211Clarks Fork Yellowstone River at Fromberg, Mont________ 212Clarks Fork Yellowstone River at Edgar, Mont______ 212Rock Creek near Red Lodge, Mont_______________-___ 213West Fork Rock Creek below Basin Creek, near Red Lodge, Mont_ 214West Fork Rock Creek near Red Lodge, Mont__________-_ 215Red Lodge Creek above Cooney Reservoir, near Boyd, Mont 215Willow Creek near Boyd, Mont____________________ 217Rock Creek at Joliet, Mont________________________ 218Rock Creek at Rockvale, Mont_____________________ 218Yellowstone River at Billings, Mont_____________ 219Wets Creek near Billings, Mont____________________ 220West Buckeye Creek near Billings, Mont_____________ 220Pryor Creek near Billings, Mont__________________ _ 221Pryor Creek at Huntley, Mont_____________________ 221Yellowstone River at Huntley, Mont_________________ 222Wind River near Dubois, Wyo_____________________ 222East Fork Wind River near Dubois, Wyo_______________ 223
X CONTENTS
Flood records at gaging stations and miscellaneous sites ContinuedYellowstone River basin Continued Page
Dinwoody Creek above lakes, near Burris, Wyo__________ 223Dinwoody Creek near Burris, Wyo__________________ 223Wind River near Burris, Wyo______ _ 224Dry Creek near Burris, Wyo_________ ___ _ ___ 225Willow Creek near Crowheart, Wyo__________________ 225Bull Lake Creek above Bull Lake, Wyo________________ 226Bull Lake Creek near Lenore, Wyo_____________ _____ 226Wind River near Crowheart, AVyo______________ _ 227Wind River at Riverton, Wyo_____________________ 228South Fork Little Wind River near Fort Washakie, Wye_____ 229North Fork Little Wind River at Fort Washakie, Wyo______ 229Little Wind. River above Arapahoe, Wyo_______________ 230Middle Popo Agie River near Lander, Wyo________ __ 230North Popo Agie River near Milford, Wyo_____________ 231North Popo Agie River near Lander, Wyo_____________ 231Little Popo Agie River near Lander, Wyo_________ _ 232Little Popo Agie River at Hudson, Wyo_______________ 233Little Wind River below Arapahoe, Wyo______________ 234Little Wind River near Riverton, Wyo___________ _ 234Muskrat Creek near Shoshoni, Wyo_________________ 235Fivemile Creek above Wyoming Canal, near Pavillion, Wyo__ 235Fivemile Creek near Riverton, Wyo______________ _ 236Sand Gulch near Shoshoni, Wyo____________________ 236Fivemile Creek near Shoshoni, Wyo_________________ 237Badwater Creek at Lybyer Ranch, near Lost Cabin, Wyo______ 237Badwater Creek at Booneville, Wyo_______________ _ 238Muddy Creek near Pavillion, Wyo___________________ 238Muddy Creek near Shoshoni, Wyo_____________ ___ 239Bighorn River at Thermopolis, Wyo___ ___ 240South Fork Owl Creek near Anchor, Wyo________________ 240 South Fork Owl Creek above Curtis Ranch, near Thermopolis,
Wyo ______________________________________ 241South Fork Owl Creek at Curtis Ranch, near Thermopolis, Wyo 242North Fork Owl Creek near Anchor, Wyo________ 242Owl Creek near Thermopolis, Wyo_____________ 243Owl Creek near Lucerne, Wyo_______________-_-_- 243Kirby Creek near Lucerne, Wyo_______ -_ 244Cottonwood Creek at Winchester, Wyo_________ 244Gooseberry Creek at Dickie, Wyo_______________ 245Gooseberry Creek near Grass Creek, Wyo_ ___ 245Gooseberry Creek at Neiber, Wyo_____________ 246Fifteen Mile Creek near Worland, Wyo__________ _ 246Bighorn River near Manderson, Wyo_______ 247Bighorn River at Manderson, Wyo_________-_ 247Nowood Creek near Tensleep, Wyo______-____ 248Canyon Creek near Tensleep, Wyo_________ 248Tensleep Creek near Tensleep, Wyo__________ 249Paintrock Creek below Lake Solitude, Wyo_______ 249Paintrock Creek near Hyattville, Wyo________ 250Medicine Lodge Creek near Hyattville, Wyo____ 250Paintrock Creek near Bonanza, Wyo________- 251Nowood Creek at Bonanza, Wyo_________ 252

CONTENTS XI
Flood records at gaging stations and miscellaneous sites ContinuedYellowstone River basin Continued Page
Greybull River near Pitchfork, Wyo___________________ 252Wood River at Sunshine, Wyo_____________________ 253Wood River near Meeteetse, Wyo____________________ 253Greybull River at Meeteetse, Wyo____________________ 254Greybull River near Basin, Wyo_____________________ 255Dry Creek at Greybull, Wyo________________________ 256Shell Creek above Shell Creek Reservoir, Wyo___________ 256Shell Creek near Shell, Wyo______________________ 257Shell Creek at Shell, Wyo_________________________ 258Bighorn River at Kane, Wyo_______________________ 258North Fork Shoshone River near Wapiti, Wyo____________ 259South Fork Shoshone River near Valley, Wyo____________ 259South Fork Shoshone River near Ishawooa, Wyo__________ 260South Fork Shoshone River above Buffalo Bill Reservoir, Wyo_ 260Shoshone River at Cody, Wyo_______________________ 261Shoshone River at Corbett Dam, Wyo________________ 261Bitter Creek near Garland, Wyo_____________________ 262Shoshone River at Byron, Wyo______________________ 262Sage Creek near Lovell, Wyo______________________ 263Shoshone River at Kane, Wyo______________________ 263Bighorn River near St. Xavier, Mont________________ 263Soap Creek near St. Xavier, Mont___________________- 264Soap Creek near mouth, near St. Xavier, Mont__________ 265Bighorn River near Hardin, Mont___________________ 265Little Bighorn River at State line, near Wyola, Mont_______ 266Little Bighorn River near Wyola, Mont________________ 267Pass Creek near Wyola, Mont_____________________ 267Little Bighorn River below Pass Creek, near Wyola, Mont______ 268Owl Creek near Lodgegrass, Mont___________ - 269 Lodgegrass Creek above Willow Creek diversion, near Wyoln,
Mont ______________________________________ 269Lodgegrass Creek near Lodgegrass, Mont________ _____ 270Lodgegrass Creek at Lodgegrass, Mont_______________ 270Little Bighorn River near Crow Agency, Mont_______-___ 271Little Bighorn River near Hardln, Mont___________ 272Bighorn River ut Bighorn. Mont_____________________ 272Little Porcupine Creek near Forsyth, Mont______ 273Rosebud Creek near Rosebud, Mont______________-___ 273Rosebud Creek near Forsyth, Mont_____________________ 274North Fork Tongue River near Dayton, Wyo_____ 274South Fork Tongue River near Dayton, Wyo_____ _ 275Tongue River near Dayton, Wyo__________________ 275Little Tongue River near Dayton. Wyo_________________ 276Wolf Creek at Wolf, Wyo_________________________ 277Bast Goose Creek near Big Horn, Wyo_____________ 277Cross Creek near Big Horn, Wyo____________________ 278West Goose Creek near Big Horn, Wyo_________ 278Goose Creek near Sheridan, Wyo_______________ 279Little Goose Creek in canyon, near Big Horn, Wyo___ 279Goose Creek below Sheridan. Wyo__________________ 280Tongue River near Acme, Wyo______________ 281Tongue River near Decker, Mont_____________ 281

XII CONTENTS
Flood records at gaging stations and miscellaneous sites ContinuedYellowstone River basin Continued Page
Leaf Rock Creek near Kirby, Mont_______________ _- 282Basin Creek tributary near Volborg, Mont_________ ____ 282Basin Creek near Volborg, Mont_______ _ _ 282Tongue River at Miles City, Mont_____________________ 283Yellowstone River at Miles City, Mont________________ 283Middle Fork Powder River above Kaycee, Wyo___________ 284Red Fork near Barnum, Wyo_____________________ 285North Fork Powder River near Hazelton, Wyo_______ _ 286North Fork Powder River near Mayoworth, Wyo______ ____ 286Powder River near Kaycee, Wyo____ __ 287South Fork Powder River near Kaycee, Wyo______ _ 288Powder River at Sussex, Wyo_____________ _ 288North Fork Crazy Woman Creek near Buffalo, Wyo___ ___ 289 North Fork Crazy Woman Creek below Spring Draw, near Buf
falo, Wyo__________________________________ 289 North Fork Crazy Woman Creek near Greub, Wyo _ 290 Middle Fork Crazy Woman Creek near Greub, Wyo _ 291 Crazy Woman Creek near Arvada, Wyo___ _ - 292 Powder River at Arvada, Wyo_______- 292 North Fork Clear Creek near Buffalo, Wyo___________ 293Clear Creek near Buffalo, Wyo____________ - 294Rock Creek near Buffalo, Wyo_____________ 295South Piney Creek at Willow Park, Wyo_______________ 296South Piney Creek near Story, Wyo__________ __ 296North Piney Creek near Story, Wyo__________________ 297Piney Creek at Kearney, Wyo______________ 298Piney Creek at Ucross, Wyo___________ _ 299Clear Creek near Arvada, Wyo___________ _ 299Powder River at Moorhead, Mont.__________________ 300Sand Creek near Broadus, Mont____________ _ _ 301Little Powder River near Broadus, Mont__ _ 302Powder River near Locate, Mont________ __ _ 302Yellowstone River at Glendive, Mont____________ - 303Griffith Creek near Glendive, Mont__________________ 304Burns Creek near Siavage, Mont___________________ 304Yellowstone River near Sidney, Mont____________ 305
Painted Woods Creek basin (upper)____________________ 306Painted Woods Creek tributary near Williston, N. Dak_______ 306Painted Woods Creek tributary No. 2 near Williston, N. Dak___ 306
Missouri River main stem______________ ___ 307Missouri River near Williston, N. Dak________________ 307
Sand Creek basin________________________________ 307Sand Creek near Williston, N. Dak___________________ 307
Little Muddy Creek basin____________________________ 308Little Muddy Creek below Cow Creek, near Williston, N. Dak__ 308Little Muddy Creek near Williston, N. Dak______________ 309
White Earth River basin____________________________ 309White Earth River at White Earth, N. Dak_____________ 309
Little Missouri River basin___________________________ 310North Creek near Alzada, Mont___________ 310Little Missouri River near Alzada, Mont_____ _ 310Wolf Creek near Hammond, Mont___________ __ 311
CONTENTS XIII
Flood records at gaging stations and miscellaneous sites ContinuedLittle Missouri River basin Continued Page
Willow Creek near Alaada, Mont____________________ 312Little Missouri River at Camp Crook, S. Dak_____________ 312Little Beaver Creek near Marmarth, N. Dak_____________ 313Little Missouri River at Marmarth, N. Dak______________ 314Deep Creek near Bowman, N. Dak___________________ 314Little Missouri River at Medora, N. Dak________________ 315Sheep Creek tributary near Medora, N. Dak_____________ 316Sheep Greek tributary No. 2 near Medora, N. Dak__________ 316Little Missouri River tributary near Medora, N. Dak________ 317Jules Creek near Medora, N. Dak___________________ 317Spring Creek near Wibaux, Mont____________________ 317Beaver Creek at Wibaux, Mont_____________________ 318Little Missouri River near Watford City, N. Dak__________ 319
Missouri River main stem____________________________ 320Missouri River near Elbowoods, N. Dak________________ 320
Douglas Creek basin_______________________________ 320East Branch Douglas Creek tributary near Garrison, N. Dak__ 320
Snake Creek basin________________________________ 321Snake Creek tributary near Garrison, N. Dak____________ 321
Knife River basin__________________________________ 321Knife River near Golden Valley, N. Dak________________ 321Spring Creek at Zap, N. Dak_______________________ 322Knife River at Hazen, N. Dak_____________________ 323
Turtle Creek basin________________________________ 324Turtle Creek near Turtle Lake, N. Dak_________________ 324
Painted Woods Creek basin__________________________ 324Painted Woods Creek near Wilton, N. Dak______________ 324
Square Butte Creek basin___________________________ 325Square Butte Creek.at Center, N. Dak_________________ 325Square Butte Creek tributary No. 2 near Center, N. Dak______ 325Square Buitte Creek tributary near Center, N. Dak_________ 325Square Butte Creek tributary No. 3 near Center, N. Dak______ 326
Burnt Creek basin_________________________________ 326Burnt Creek tributary near Baldwin, N. Dak____________ 326Burnt Creek tributary No. 2 near Baldwin, N. Dak_________ 327
Missouri River main stem____________________________ 327Missouri River at Bismarck, N. Dak___________________ 327
Heart River basin_________________________________ 328Heart River near South Heart, N. Dak_________________ 328Heart River tributary near South Heart, N. Dak___________ 329Heart River tributary near Dickinson, N. Dak___________ 329Heart River at Lehigh, N. Dak_____________________ 329Green River near Gladstone, N. Dak___________________ 330Antelope Creek near Dickinson, N. Dak_______________ 331Antelope Creek tributary near New England, N. Dak______ 331Antelope Creek tributary (site No. 2) near New England, N. Dak_ 331Heart River near Richardton, N. Dak_________________ 332Government Creek near Richardton, N. Dak____________ 333Heart River below Heart Butte Dam, near Glen Ullin, N. Dak__ 333Antelope Creek near Carson, N. Dak_________________ 334Muddy Creek near Almont, N. Dak__________________ 335Heart River near Lark, N. Dak____________________ 336
XIV CONTENTS
Flood records at gaging stations and miscellaneous sites ContiruedHeart River basin Continued Page
Sweetbriar Creek near Judson, N. Dak__ 336Heart River near Mandan, N. Dak______ 337
Apple Creek basin________________________________ 338West Branch Long Lake Creek near Hazelton, N. Dak___ _ 338Apple Creek near Menoken, N. Dak________ _ 338
Oannonball River basin________________________ 339Cannonball River at Regent, N. Dak______________ 339Cannonball River below Bentley, N. Dak_______________ 339Cedar Creek near Haynes, N. Dak________ ___ _ 340Cedar Creek near Pretty Rock, N. Dak_______________ 341Louise Creek tributary near Brisbane, N. Dak_________ _ 342Louise Creek tributary near Lark, N. Dak_________ 342Louise Creek tributary No. 2 near Lark, N. Dak___________ 342Louise Creek above Flasher, N. Dak_________________ 343Cannonball River at Breien, X. Dak_________________ 343
Beaver Creek basin_______________________________ 345Beaver Creek at Linton, N. Dak________________ 345Spring Creek near Linton, N. Dak______________ 346Sand Creek near Temvik, N. Dak___________________ 346
Grand River basin________________________________ 346Spring Creek near Bowman, N. Dak_______________ _ 346Spring Creek tributary near Bowman, N. Dak________ _ 347North Fork Grand River at Haley, N. Dak______________ 347Buffalo Creek tributary near Buffalo Springs, N. Dak______ 348North Fork Grand River near White Butte, S. Dak________ 349South Fork Grand River at Buffalo, S. Dak____________ 349Wide Sandy Creek near Buffalo, S. Dak______________ 350South Fork Grand River near Cash, S. Dak_____________ 350Grand River at Shadehill, B. Dak___________________ 351Grand River near Wakpala, N. Dak__________.._______ 352Claymore Creek tributary No. 2 near Trail City, S. Dak_______ 353
Deadman Creek basin_________________________ 353Deadman Creek tributary near Mobridge, S. Dak________.__ 353
Moreau River basin_______________________________ 354North Fork Moreau River tributary near Redig, S. Dak_ _ 354Moreau River at Bixby, S. Dak_________________ _ 354Moreau River near Faith, S. Dak______________ 355Moreau River near Eagle Butte, S. Dak_______________ 356Moreau River near Whitehorse, S. Dak____________ _ 357Moreau River at Promise, B. Dak________________ - 358
Cheyenne River basin______________________________ 359Lance Creek at Spencer, Wyo______________________ 359Cheyenne River near Spencer, Wyo_______________ - 360Beaver Creek near Newcastle, Wyo________________ _ 360Cheyenne River at Edgemont, S. Dak_________________ 361Pine Creek near Ardmore, S. Dak_____________ 362Hat Creek near Edgemont, S. Dak___________________ 362Cheyenne River near Hot Springs, S. Dak__________ - 363Fall River at Hot Springs, S. Dak_________________ 364Beaver Creek near Buffalo Gap, S. Dak__________ 365Battle Creek at Hermosa, B. Dak________________ - 366Sunday Gulch near Hill City, S. Dak_________________ 366

CONTENTS XV
Flood records at gaging stations and miscellaneous sites ContinuedCheyenne River basin Continued Page
Spring Creek near Hermosa, S. Dak_________ ____._ 367Castle Creek above Deerfield Reservoir, near Hill City, S. Dak___ 367Rapid Creek above Pactola Reservoir, at Silver City, S. Dak__ 368Rapid Creek below Pactola Dam, S. Dak________________ 369Rapid Creek above Canyon Lake, near Rapid City, S. Dak_ 370Rapid Creek at Rapid City, S. Dak______________ 370Rapid Creek near Parmingdale, S. Dak_______ 371Cheyenne River near Wasta, S. Dak_______________ 372Elk Creek near Elm Springs, S. Dak__________________ 373Belle Fourche River near Moorcroft, Wyo__________ 374Belle Fourche River below Moorcroft, Wyo_________ 374Belle Fourche River at Hulett, Wyo______________ 375Belle Fourche River at Wyoming-South Dakota State line 376Redwater Creek at Wyoming-South Dakota State line___ 377Spearfish Creek at Spearfish, S. Dak__________________ 377Miller Creek near Whitewood, S. Dak_________________ 378Redwater Creek above Belle Fourche, S. Dak____________ 379Hay Creek at Belle Fourche, S. Dak___________________ 379Belle Fourche River near Belle Fourche, S. Dak________ 380Belle Fourche River near Fruitdale, S. Dak______________ 381Belle Fourche River near Sturgis, S. Dak_______________ 381Boulder Creek near Deadwood, S. Dak______________ 382Bear Butte Creek near Sturgis, S. Dak_________________ 383Belle Fourche River near Elm Springs, S. Dak___________ 383Cheyenne River near Plainview, S. Dak________________ 385Cherry Creek near Plainview, S. Dak_________________ 385Cherry Creek tributary No. 3 near Avance, S. Dak__________ 386Beaver Creek near Faith, S. Dak_____________________ 386Cheyenne River near Eagle Butte, S. Dak______________ 387
Missouri River main stem__________________________ 388Missouri River at Pierre, S. Dak____________________ 388
Bad River basin__________________________________ 389North Fork Bad River at Philip, S. Dak________________ 389Bad River near Midland, S. Dak_____________________ 389Bad River near Fort Pierre, S. Dak___________________ 390
Mush Creek basin________________________________ 392Mush Creek near Pierre, S. Dak____________________ 392
Unnamed Missouri River tributaries____________________ 392Missouri River tributary near Pierre, S. Dak_________ 392Missouri River tributary near Canning, S. Dak__________.._ 392
Medicine Knoll Creek basin__________________________ 393Medicine Knoll Creek near Blunt, S. Dak____________-_ 393
Unnamed Missouri River tributaries_________________ 393Missouri River tributary near De Grey, S. Dak____ ____ 393
Medicine Creek basin______________________________ 394North Fork Medicine Creek near Vivian, S. Dak__________ 394Medicine Creek tributary near Vivian, S. Dak____________ 394Medicine Creek tributary No. 2 near Vivian, S. Dak________ 395Medicine Creek at Kennebec, S. Dak__________________ 395
Missouri River main stem____________________________ 396Missouri River at Chamberlain, S. Dak________________ 396

XVI CONTENTS
Mood records at gaging stations and miscellaneous sites Continued PageWhite River basin_________________________________ 396
White River tributary near Glen, Nebr_______________ 396Deep Creek near Glen, Nebr______________________ 397Soldiers Creek near Crawford, Nebr___________________ 397White River tributary No. 2 near Crawford, Nebr__________ 397White River at Crawford, Nebr_____________________ 398White River below Cottonwood Creek, near Whitney, Nebr__ 399White River near Chadron, Nebr________ __ 400Chadron Creek at Chadron State Park, near Cbadron, Netr____ 400Chadron Creek near Chadron, Nebr________________ 401White River near Oglala, S. Dak___________________ 401Cain Creek tributary at Imlay, S. Dak________________ 402White River near Interior, S. Dak___________________ 402White River tributary near Interior, S. Dak____________ 403White River near Kadoka, S. Dak___________________ 403South Fork White River near Rosebud, S. Dak___________ 404South Fork White River tributary near Mission, S. Dak___ 405South Fork White River below White River, S. Dak________ 405White River at Westover, S. Dak___________________ 406White River near Oacoma, S. Dak___________________ 406
Missouri River main stem__________________________- 408Missouri River below Fort Randall Dam, S. Dak__________ 408
Ponca Creek basin______________ _ _______________ 408Ponca Creek at Anoka, Nebr____________________ 408Ponca Creek at Verdel, Nebr_______________________ 409
Niobrara River basin______________________ _ 410Niobrara River at Wyoming-Nebraska State line___________ 410Niobrara River at Agate, Nebr______________ _ 410Niobrara River above Box Butte Reservoir, Nebr____ ____ 410Niobrara River near Dunlap, Nebr___________ ~ _ 411Pebble Creek near Esther, Nebr____________________ 412Pebble Creek near Dunlap, Nebr___________________ 412Cottonwood Creek near Dunlap, Nebr_________ ____ 412Niobrara River near Hay Springs, Nebr___ _ 413Berea Creek near Alliance, Nebr_____________ __ 413Niobrara River near Gordon, Nebr______ __ 414Antelope Creek at Gordon, Nebr______________ ____ 414Antelope Creek tributary near Gordon, Nebr _ 415Bear Creek near Eli, Nebr_______________ .. 415Niobrara River near Cody, Nebr_ _ 415Snake River near Burge, Nebr____________ ~ 416Minnechaduza Creek at Valentine, Nebr________ _ 417Niobrara River near Sparks, Nebr________ _ 417Niobrara River near Norden, Neibr______ 418Bone Creek tributary near Ainsworth, Nebr___ 418Bone Creek tributary No. 2 near Ainswortb, Nebr 419Sand Draw tributary near Ainsworth, Nebr______ 419Lone Pine Creek near Riverview, Nebr_________ 420Keya Paha River near Hidden Timber, S. Dak___________ 420Keya Paha River at Wewela, S. Dak____ 421Keya Paha River near Naper, Nebr_________ 421Niobrara River near Spencer, Nebr______ _ 422

CONTENTS XVII
Flood records at gaging stations and miscellaneous sites ContinuedNiobrara River basin Continued Page
Honey Creek near O'Neill, Nebr___________________- 423Oamp Greek near O'Neill, Nebr___________________ 423Blackbird Creek tributary near O'Neill, Nebr__ _ 424Niobrara River near Verdel, Nebr_______ 424
Bazile Creek basin______________________ ___ 424Bazile Creek near Niobrara, Nebr_________ 424
Missouri River main stem_________________________ 425Missouri River at Yankton, S. Dak_________________ 425
James River 'basin__________________________ 426James River near Manfred, N. Dak__________ __ 426James River tributary near Manfred, N. Dak____ _ 426James River tributary No. 3 near Manfred, N. Dak______ 427James River at New Rockford, N. Dak________ _ 427James River near Pingree, N. Dak_________ _ 428Pipestem Creek near Buchanan, N. Dak_______ _ 428Minneapolis Plats Creek tributary near Eldridge, N. Dak__ 429James River at Jamestown, N. Dak________________ 430Beaver Creek tributary near Eldridge, N. Dak________ 430Beaver Greek near Sydney, N. Dak___________ ___ 431Buffalo Creek tributary near Sydney, N. Dak___ __ 431James Raver at La Moure, N. Dak__________________ 432James River at Columbia, S. Dak___________________- 432Elm River tributary near Leola, S. Dak_______ _____ 433Maple River at North Dakota-South Dakota State line_______ 433Maple River at Frederick, S. Dak__________________ 433Willow Creek tributary near Leola, S. Dak___________ 434Willow Creek tributary near Barnard, S. Dak________ __ 434Elm River at Westport, S. Dak______________________ 435James River near Stratford, S. Dak__________________ 436Mud Creek near Stratford, S. Dak__________________ 436James River at Ashton, S. Dak___________________ 437West Branch Snake Creek near Athol, S. Dak___________ 437Snake Creek near Ashton, S. Dak___________________ 438Matter Creek tributary near Orient, S. Dak_____________ 438Shaefer Creek near Orient, S. Dak__________________ 439Shaefer Creek tributary near Orient, S. Dak____________ 439Shaefer Creek tributary near Miller, S. Dak_____________ 439Turtle Greek at Redfield, S. Dak_____________________ 440James River near Redfield, S. Dak____________________ 441Dry Run near Frankfort, S. Dak_________________ __ 441James River at Huron, S. Dak_____________________ 442Sand Creek near Alpena, S. Dak____________________ 443James River near Forestburg, S. Dak_________________ 443Firesteel Creek near Mount Vernon, S. Dak_____________ 444North Branch Dry Creek tributary near Parkston, S. Dak___ 444North Branch Dry Creek near Parkston, S. Dak__________ 445South Branch Dry Creek near Parkston, S. Dak___________ 445Dry Creek near Parkston, S. Dak_____________________ 445James River near Scotland, S. Dak_________________ 446
Vermillion River basin_____________________________ 447Saddlerock Creek near Canton, S. Dak________________ 447
219-848 O - 66 - 2

XVIII CONTENTS
Flood records at gaging stations and miscellaneous sites ContinuedVermillion River basin Continued Page
Saddlerock Creek tributary near Beresford, S. Dak 447Saddlerock Creek near Beresford, S. Dak__ 448Vermillion River near Wakonda, S. Dak___________ 448
Big Sioux River basin_____________ 449Big Sioux River near Ortley, S. Dak________________ 449Big Sioux River tributary near Summit, S. Dak 449Big Sioux River tributary No. 2 near Summit, S. Dak_______ 449Big Sioux River tributary No. 3 near Summit, S. Dak 450Big Sioux River at Watertown, S. Dak_________ _ 450Peg Munky Run near Estelline, S. Dak_________________ 451North Deer Creek near Estelline, S. Dak______________ 451Sixmile Creek tributary near Brookings, S. Dak 451Deer Creek near Brookings, S. Dak______________ 452Big Sioux River near Brookings, S. Dak______ _ 452Big Sioux River near Dell Rapids, S. Dak______________ 453Skunk Creek near Sioux Falls, S. Dak____________ 454Big Sioux River near Brandon, S. Dak______ 455Little Beaver Creek tributary near Canton, S. Dak___ 456Otter Creek north of Sibley, Iowa____________________ 456Schutte Creek near Sibley, Iowa__________ _ 456Otter Creek at Sibley, Iowa_____________________- 457Dawson Creek near Sibley, Iowa__________ 457Wagner Creek near Ashton, Iowa____-___ 457Otter Creek near Ashton, Iowa_____________ -_ 458Rock River near Rock Valley, Iowa_______________ 458Dry Creek at Hawarden, Iowa_____________________ 459Big Sioux River at Akron, Iowa____________ 460
Missouri River main stem________________________ 461Missouri River at Sioux City, Iowa_____________ 461
Selected references________________________________ 463Index _______________________________________ 465

CONTENTS XIX
ILLUSTRATIONS
PagePLATE 1. Map of Missouri River basin above Sioux City, Iowa, showing
gaging stations, hydrologic areas, and flood-frequercy regions..__________________________________________ In pocket
FIGURE 1. Map of conterminous United States._______________________ 22. Composite frequency curves for regions A-E________________ 5
3-4. Graphs showing variation of mean annual flood with drainage area and mean altitude:
3. Hydrologic area 6___---------_--_-_-_-----__--__-- 54. Hydrologic area 7_-___.-_-__--___________-_______. 6
5-8. Graphs showing variation of mean annual flood with drainr.ge area:
5. Hydrologic areas l-5_ _--_----__------_--_-_-_--__- 76. Hydrologic areas 8-10_____________________________ 87. Hydrologic areas 11-15-___________________________ 88. Main stem of Belle Fourche, Cheyenne, Niobrara,
James, and Big Sioux Rivers____________________ 99-10. Graphs showing relation of discharge for selected flood fre
quencies to drainage area:9. Missouri River main stem below Gallatin River______ 10
10. Yellowstone River main stem below Yellowstone, Lake_ 10 11. Flood-frequency curve for White River near Oacoma, S. Dak__ 16
TABLES
Page TABLE!. Maximum floods at gaging stations. ______________-___---_- 20
2. Peak discharges at miscellaneous sites and outstanding floodsat short-term gaging stations.___________________________ 48

MAGNITUDE AND FREQUENCY OF FLOODS IN THE UNITED STATES
PART 6-A. MISSOURI RIVER BASIN ABOVE SIOUX CITY,IOWA
By JAMES L. PATTERSON
ABSTRACT
The magnitude and frequency of expected floods of any recurrence interval between 1.1 and 50 years can be determined for most streams in the Missouri River basin above Sioux City, Iowa, by methods outlined in this report.
Composite frequency curves were drawn showing the relation of the mean annual flood to floods having recurrence intervals from 1.1 to 50 year?. Other curves express the relation of the mean annual flood to basin characteristics. In the mountainous areas of northern Wyoming and southern Montana both drainage-basin size and mean altitude were found to be important factors in fluencing the magnitude of the mean annual flood. Only drainage-l isin size was used as an independent variable in the remainder of the report area.
By combining data from the composite frequency curves and curves' showing the relation of mean annual flood to basin characteristics, flood-frequen°y curves can be drawn for streams in the report area whose peak flows are not materially affected by regulation or diversion. The curves should not be extrapolated beyond the range defined by base data. Some of the large streams do not lend themselves to regional analysis. These streams are given special treatment in this report.
INTRODUCTION
PURPOSE AND SCOPE
This report is one of a series covering flood frequency in the conter minous United States. The purpose of the report is (1) to present methods by which the magnitude and frequency of floods for gaged or ungaged sites in the report area can be predicted and (2) to pre sent all known significant peak flood data.
The area covered by this report (fig. 1) is the Missouri Biver basin above Sioux City, Iowa, and includes parts of Montana, Wyoming, North and South Dakota, Nebraska, Minnesota, and Iowa. Each of these States has published flood-frequency reports covering parts of the report area. A list of the publications of these States is included in the section on "Selected references."

2 MAGNITUDE AND FREQUENCY OF FLOODS, PART 6-A

APPLICATION OF FLOOD-FREQUENCY DATA 3
ACKNOWLEDGMENTS
This report was prepared under the general supervision of Francis J. Flynn, chief, Basic Eecords Section, Surface Water Branch, Water Eesources Division, U.S. Geological Survey. Technical guidance was provided by A. Rice Green, hydraulic engineer, U.S. Geological Survey. Basic data were compiled by Geological Survey personnel in the district offices of the Surface Water Branch under th^ super vision of their respective district engineers.
Unless otherwise noted in individual station descriptions, the data were collected by the U.S. Goelogical Survey with the assistance of many Federal and State agencies, municipalities, corporations, and private individuals. Credit has been given for cooperatior in the annual series of water-supply papers of the Geological Survey en titled "Surface Water Supply of the United States," and since 1960, in the annual Geological Survey surface-water reports of the various States.
APPLICATION OF FLOOD-FREQUENCY DATA
The method of analysis used in this report is explained by Dalrymple (1960) and Benson (1962). A brief description of the method used is given in the section entitled "Method of analysis."
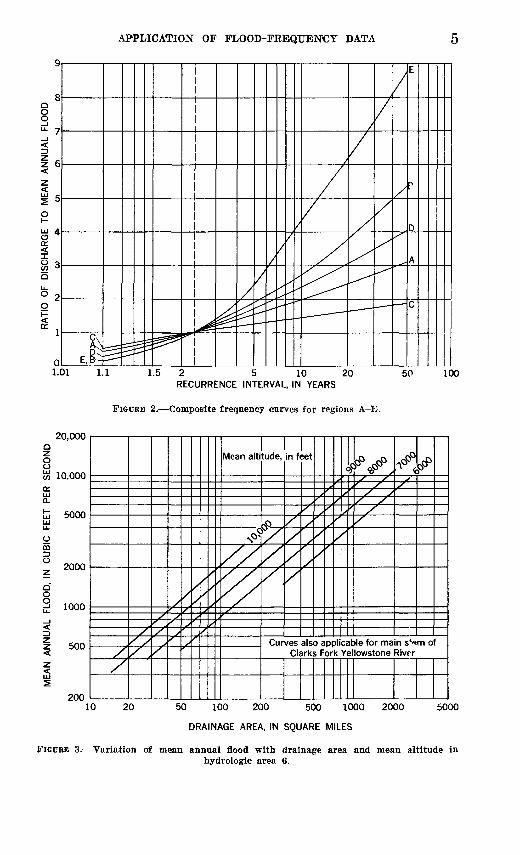
The method for estimating the magnitude of floods having re currence intervals from 1.1 to 50 years is based upon two sets of curves: a composite curve (fig. 2) showing as ordinate the ratio of peak dis charges to an index flood (mean annual flood) and as abscissa the re currence interval, in years, and a curve showing the relation of the mean annual flood to size of the drainage basin for all except mountain ous areas in northern Wyoming and southern Montana where a family of curves showing the relation of mean annual flood to size and mean altitude of the basin is used.
Eesults based on extrapolation of the curves beyond the indicated range in drainage-basin size and altitude and beyond recurrence in tervals of 50 years are not dependable. In mountainous arers where mean altitude is used in estimating the magnitude of the index flood, most of the small streams for which records are available are at high altitudes where flood peaks are mostly due to snowmelt. Small-area floods resulting from intense rainstorms occur at lower altitudes. Peak flows for such storms may be considerably greater than those defined by frequency curves based on snowmelt peaks. Extrapolation of curves to small areas at low altitudes may lead to seriou^ errors.
Flood-frequency relations are shown for virtually natural drainage

4 MAGNITUDE AND FREQUENCY OF FLOODS, PART 6-A
conditions. There are relatively few gaged streams in the Montana and Wyoming part of the report area whose peak flowr are not af fected to some extent by diversion or regulation. Records at stations for which peak flows were not believed to be materially a.ffected were used in the analysis.
REGIONAL APPLICATION
The following procedure is not applicable to some of the large streams in the area. Streams in the excepted category are listed in the section entitled "Special application." The general procedure for application of flood-frequency data is as follows:1. If the selected site is not in the excepted category, determine from
plate 1 the flood-frequency region (A-E) and hydrologic area (1- 15) in which the site is located.
2. Determine the size of the drainage area above the site from the best available map.
3. For areas 6-7, determine the mean altitude of the bisin. Mean altitudes used in this report were determined by placing a trans parent rectangular grid system overlay on contour maps of the Army Map Series, scale 1:250,000. The altitude at each grid intersection was recorded, and the arithmetic average of recorded altitudes was used as the mean altitude of the basir. The grid scale should be such that, except for very small areas, a minimum of 30 intersections fall within the basin.
4. Determine the discharge of the mean annual flood from the appro priate hydrologic-area curve (figs. 3-7). For hydrologic areas 6 and 7 the discharge must be obtained by interpolating between curves or by solving mean-annual-flood equations.
5. From flood-frequency curves (fig. 2) determine the ratio of the flood of the selected recurrence interval to the mean annual flood.
6. Multiply the ratio obtained in step 5 by the discharge of the mean annual flood (step 4). A complete frequency curve up to a 50- year recurrence interval can be defined by repeating steps 5 and 6 for several selected recurrence intervals.
The mean annual flood for areas 6 and 7 can be computed by solu tion of equations 02 . 33 = 0.1834-85#2 - 34 and Q 2 . 33 =Q.niA-85H2 - 34, re spectively ; $2.33 is the mean annual flood in cubic feet per second, A is the drainage area in square miles, and H is the mean altitude of the basin in thousands of feet above mean sea level.
These mean-annual-flood equations should not be used indiscrim inately for all basin altitudes and sizes. The user should be guided by the range indicated by curves in figures 3 and 4.
APPLICATION OF FLOOD-FREQUENCY DATA
LU 4 Otr
1.01 1.1 1.5 2 5 10 20 RECURRENCE INTERVAL, IN YEARS
FIGURE 2. Composite frequency curves for regions A-E.
50 100
Q
O OOT 10,000 trLUa.
fc 5000LU LU
0
CO
o z 2000
Q O
3 1000
< ^~z 500<
<LU
200
/
/
SX X
sfSj
/
r
S*
fS
/
S
f
j
;>
'
'
j
/
t
/
Mean alti
N°V
' ./^ J
^r
^
:ude,
rf>*/
/
in f
X//\x
jet
./
/.
/
js.
*
/
'
j'
s/
A
f
/
f
'
/
^
S f
^ r S
S^ S
/ /' //
JJ^
,
Curves also applicable for main s^m of Clarks Fork Yellowstone River
10 20 50 100 200 500 1000 2000 5000
DRAINAGE AREA, IN SQUARE MILES
FIGURE 3. Variation of mean annual flood with drainage area and mean altitude inhydrologic area 6.

6 MAGNITUDE AND FEEQUENCY OF FLOODS, PART 6-A
ILLUSTRATIVE PROBLEM
Assume that a bridge is to be built across North Fcrk Shoshone River at a point 1 mile upstream from the high-water line of Buffalo Bill Reservoir and that the bridge will be designed to pass a flood having a recurrence interval of 50 years. The discharge for the 50- year flood is computed as follows:1. An examination of the main stem stations listed under "Special
applications" indicates that North Fork Shoshone Biver is not in the excepted category. Although water from this stream is used for irrigation to some extent, peak flows are not materially affected.
2. The site is in hydrologic area 7 and region C (pi. 1).3. The drainage area measured from the best available maps is 800
square miles.4. Mean altitude of the basin computed by using a trarsparent grid
overlay on a 1:250,000 Army Map Service map is 8,510 feet.5. The discharge of the mean annual flood is 4,900 cfs if interpolated
between the 8,000- and 9,000-foot altitude curves (fig. 4) or if solved by the equation
^2.33=0.111A- 855r2 - 43 =0.111(800)- 85 (8.51) 2 - 34 =4,900cfs.
10,000
5000
2000
1000
500
200
1001
/
/
'
/ ,
//y/
V
/' / s
s//'
/f' .
sI//
Js
/
s
/.
/
J/
/
'
'
'
's/~7
^/
/
'
Mean <
s' // /
f /' / S/ /
/ ,
/ /
/
Itituc
y,'/,////
e, ir
rP
//
/s
s/
fe
^
/
/
/
s
3t
\\
,
'
f
P
/
'
/
*--
"7
,
/
0^
/ // s
/ /
7^I2' /S /'
<*>V
-j;
^
/^
i
Curves also applicable for main stems of Greybull and Shoshone Rivers
0 20 50 100 200 500 1000 2000 50(
DRAINAGE AREA, IN SQUARE MILES
FIGURE 4. Variation of mean annual flood with drainage area and mean altitude inhydrologic area 7.
APPLICATION OF FLOOD-FREQUENCY DATA 7
6. The ratio of the 50-year flood to the mean annual flood is 1.85 (fig.2).
7. The discharge of the 50-year flood is 4,900 X 1.85=9,060 cfs.If the recurrence interval of a known flood is desired for the above
site, compute the ratio of the discharge of the flood to that of the mean annual flood (4,900 cfs) and, using the computed ratio ss ordi- nate, read the recurrence interval from the abscissa scale, figure 2, curve C.
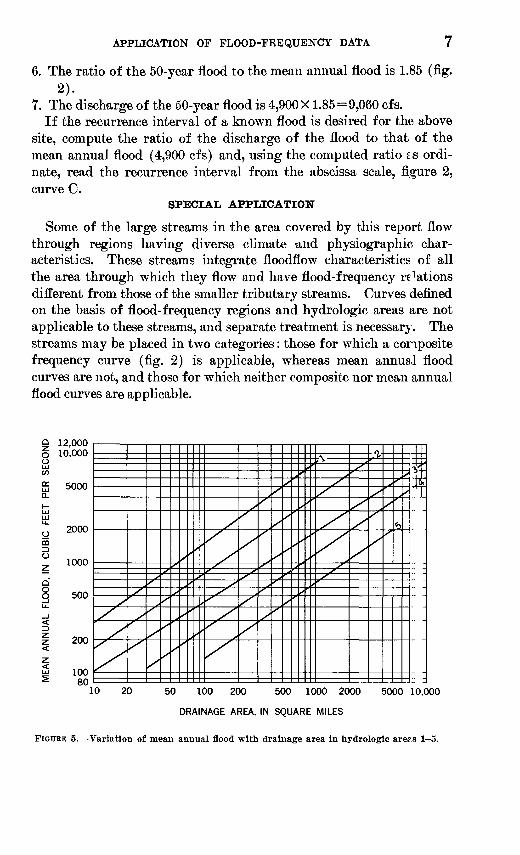
SPECIAL APPLICATION
Some of the large streams in the area covered by this report flow through regions having diverse climate and physiographic char acteristics. These streams integrate floodflow characteristics of all the area through which they flow and have flood-frequency relations different from those of the smaller tributary streams. Curves defined on the basis of flood-frequency regions and hydrologic areas are not applicable to these streams, and separate treatment is necessary. The streams may be placed in two categories: those for which a composite frequency curve (fig. 2) is applicable, whereas mean annual flood curves are not, and those for which neither composite nor mean annual flood curves are applicable.
0 10,0000 UI V)
g] 5000
UI UI
£ 2000 m
^ 1000
Q
8 500LL.
<
z 200<z w 100 s 80
1
//
//
0 2
/
/X
/
0
/I/1
X
/
/
/
/
/
5
^
/
/
0
/ '
x
^ '
X
//f^
./x^^x^
Xx^X
X100 2C
/X
X>^
X
X
)0
X
X
^
J/
/
x
X
x^
r
/
5C
X
X
X
x
K)
^ ?
x
x x
x _
x^
--;\ * ^
*>x>x
n*
X/ ^^ ^^^
/ ^ ^>^
jS*
LOGO 20
X
XxX
00
^
xX
X
^
x
x
50
^
<3
00
/
/
~¥-^T-
10,C
DRAINAGE AREA, IN SQUARE MILES
FIGURE 5. Variation of mean annual flood with drainage area in hydrologic arers 1 5.

8 MAGNITUDE AND FREQUENCY OF FLOODS, PART 6-A
Streams in the first category are Belle Fourche River Hlow Willow Creek, Cheyenne River below Belle Fourche River, Niobro,ra River be low Bone Creek, James River, and Big Sioux River.
o o$ 10,000ccUJ CL
i- 5000UJ UJ LL.
g § 20000
| 1000
8^ 500_i <^ z
< 200
<UJ
^ 1001
v
XxXX"
X^
X^
XX
x
s.
s
s
^
ss
''
X:»'V>X'+ r ._^X^f ^
X</
x X
X^
/
x -
''
ss^' ^X'""^
'
^x,x
,^
/x
X
X1
^
J,-_,<^
^ * s
''x9
Area 8 curve not applicabfe for main stems of Greybull and Shoshone Rivers, and Clarks Fo-k Yellow-stone Rive
III!r
Q 20 50 100 200 500 1000 2000 5000 10,000 20,
DRAINAGE AREA, IN SQUARE MILES
FIGURE 6. Variation of mean annual flood with drainage area in hydro?ogic areas 8-10.
o o(A) 3UUU
cc
1 ^uuuUJ UJ
0 100°
CD8 500 z.
0 200Oci _j 100
1 50
UJ Qn
X.
»* :
x x
^ x '
^
(/
^-.._
_/"1^, '
/'*' s
>'_/'
x^'''
X
^i-
x'
xx
^.
^ *
X-7*^
x x
,'
^^x( ,x^
x/^
s,
s.>'
-J?
/
>/^
**-
S
^
S
*
s
-/^
\
^
'
<
'
s
'
>
.^ \'i
' J_xy^
/
f.^
x/£
12 5 10 20 50 100 200 500 1000 200^ 5000 10,000
DRAINAGE AREA, IN SQUARE MILES
FIGURE 7. Variation of mean annual flood with drainage area in hydralogic areas 11-15.

APPLICATION OF FLOOD-FREQUENCY DATA 9
Individual curves (fig. 8) showing the relation of the mean annual flood to drainage area have been drawn for these streams. Flood magnitudes for sites lying within the stream reaches can be deter mined 'as outlined under "Regional application," except that values of the mean annual flood are taken from figure 8.
Streams in the second category are Missouri River above Fort Peck Reservoir and Yellowstone River below Yellowstone Lake. For these rivers, families of curves (figs. 9, 10) were drawn showing the relation of discharges for selected flood frequencies to drainage area. Flood magnitudes for selected recurrence intervals at sites on these rivers can be taken directly from the family of curves by first determin ing the drainage area for the site.
ILLUSTRATIVE PUOBUBM
Assume that a frequency curve must be prepared for Yellowstone River just downstream from Prior Creek at Huntley, Mont. 1. The drainage area for this site is 12,840 square miles.
50,000
Q
O 20,000
CO
£i 10,0000_
UJ
^ 5000omo
200
100
Cheyenne River below Belle Fourche River\ (Use with region B curve)___
I Jig Sioux Rive y
2 Belle
Niobrara River below y Bone Creek
Fourche River below Willow Creek (Use with region B curve)
100 200 500 1000 2000 5000 10,000 20,000 50,000
DRAINAGE AREA, IN SQUARE MILES
PIGDEE 8. Variation of mean annual flood with drainage area on main stem of Belle Pourche River below Willow Creek, Cheyenne River below Belle Pourche River. Niobrara River below Bone Creek, James River, and Big Sioux River.

10 MAGNITUDE AND FREQUENCY OF FLOODS, PART 6-A
c.200
O
Q.
fclOOLLl U_
Om
8 50
20
1512
Note: Numbers refer to gaging stations in table 1 and on plate 1
20 30 DRAINAGE AREA, IN THOUSANDS OF SQUARE MILE?
40 44
FIGURE 9. Relation of discharge for selected flood frequencies to drainage area, Missouri River main stem below Gallatin River.
200
100
Note: Numbers refer to paging stations in table 1 and on plate 1
2 5 10 20 50 DRAINAGE AREA, IN THOUSANDS OF SQUARE MILES
FIGURE 10. Relation of discharge for selected flood frequencies to drairage area, Yellow- stone River main stem below Yellowstone Lake.

APPLICATION OF FLOOD-FREiQUENCY DATA 11
2. As determined from figure 10, the magnitudes of floods having re currence intervals of 2.33, 10, 25, and 50 years at this site are 42,500,60,000,68,000, and 74,200 cf s, respectively.
3. Discharges determined in step 2 are then plotted against correspond ing recurrence intervals on suitable plotting paper to give the flood-frequency curve. Plotting paper shown in figure 2 is satisfactory.
4. If the magnitude of a flood having a specific recurrence interval (25 years, for example) is desired, the value can 'be taken d : rectly from figure 10 as 68,000 cfs.
5. Recurrence intervals of known floods can be obtained by interpolat ing between curves in figure 10 or by using the peak discharge of the flood in conjunction with the frequency curve plotted in step 3.
STREAMS AFFECTED BY REGULATION OR DIVERSION
Peak-flow records used to regionalize flood-frequency relations should ideally be unaffected by regulation or diversion. Owing to the paucity of peak-flow data completely unaffected by manmade changes, records for many streams whose peak flows are affected to a minor degree have been used in the analysis. Kecords for many other streams could not be used because of the excessive effect of reg ulation and (or) diversion nor can regional frequency curves be used to predict probable peak flows on streams similarly affected without first making allowances for manmade changes.
Peak flows for some of the large streams in the report area have been materially affected throughout the period for which records have 'been collected. As the effects of storage and diversion projects have been gradually increasing over the years, it is not feasible to define flood-frequency relations for either natural or affected conditions, nor can they be safely predicted from relations defined by smaller tributary streams. Streams falling in this category are
Missouri Kiver below Fort Peck ReservoirMilk Kiver below Battle CreekFrenchman KiverBighorn River below Boysen ReservoirPowder River below Clear CreekBelle Fourche River above Indian CreekNiobrara River above Bone Creek.

12 MAGNITUDE AND FREQUENCY OF FLOODS, PART 6-A
DESCRIPTION OF THE AREA
EIVEE BASINS
The area covered by this report is about 315,000 square miles and in cludes that part of the Missouri Eiver basin above Siou^ City, Iowa. The Missouri Eiver is formed by the confluence of the Jefferson, Madi son, and Gallatin Eivers, which head in the Northern Eocky Mountain province in southwestern Montana and northwestern Y^yoming. It flows generally north through Montana until entering the Great Plains province near Great Falls; from this point it flows east through Montana to the Montana-North Dakota State line where it turns south east and flows through North and South Dakota and northeastern Nebraska and forms the boundry between southeastern fouth Dakota and northeastern Nebraska just upstream from Sioux Oity. The principal tributary of the Missouri is the Yellowstone Eiver which drains about 70,000 square miles in northern Wyoming and southern Montana and joins the Missouri Eiver just east of the Montana-North Dakota State line. Other major tributaries are the Marias and Milk Eivers, draining northwestern Montana and extreme southern Canada; the Cheyenne and White Eivers in South Dakota; the Niobrara Eiver in northern Nebraska; the James Eiver in North and South Dakota.
TOPOGRAPHY
The topography of the upper Missouri basin varies from the flat terrain of the central lowlands in North and South LY,kota to the rugged peaks of the Eocky Mountains in the west. Altitudes range from about 1,100 feet in the vicinity of Sioux City to over 13,000 feet for some peaks in Wyoming. Many peaks in Wyoming and Montana exceed 10,000 feet in altitude. Feniieman (1931) giv^s a detailed description of the physiographic divisions in the basin.
The headwaters of the Missouri and Yellowstone Eivers drain the rugged mountainous areas lying in the Northern and Middle Eocky Mountain provinces and the Wyoming Basin province of the Eocky Mountain system in western Montana and northwestern Wyoming.
About two-thirds of the report area, including the eastern two- thirds of Montana, northwestern Wyoming, eastern North and South Dakota, and northern Nebraska, is in the Great Plains province. This area is characterized by broadly terraced river valleys, smoothly roll ing plains, and isolated mountains. The largest mountain range in the area is the Black Hills in South Dakota. Spectacular examples of stream erosion in the area are demonstrated by the "Padlands" be tween Cheyenne and White Eivers in South Dakota and badlands along the Little Missouri Eiver in North Dakota.
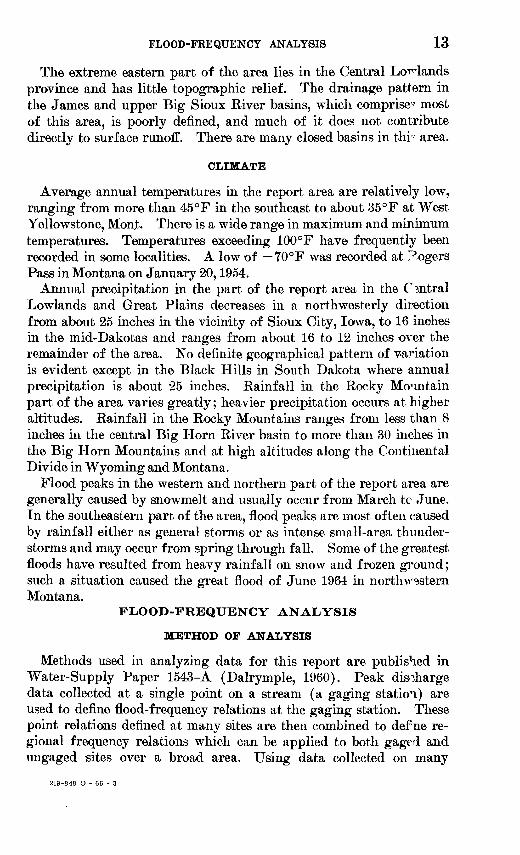
FLOOD-FREQUENCY ANALYSIS 13
The extreme eastern part of the area lies in the Central Lowlands province and has little topographic relief. The drainage pattern in the James and upper Big Sioux River basins, which comprise? most of this area, is poorly denned, and much of it does not contribute directly to surface runoff. There are many closed basins in thr area.
CLIMATE
Average annual temperatures in the report area are relatively low, ranging from more than 45°F in the southeast to about 35°F at West Yellowstone, Monjt. There is a wide range in maximum and minimum temperatures. Temperatures exceeding 100°F have frequently been recorded in some localities. A low of 70°F was recorded at Rogers Pass in Montana on January 20,1954.
Annual precipitation in the part of the report area in the Central Lowlands and Great Plains decreases in a northwesterly direction from about 25 inches in the vicinity of Sioux City, Iowa, to 16 inches in the mid-Dakotas and ranges from about 16 to 12 inches over the remainder of the area. No definite geographical pattern of variation is evident except in the Black Hills in South Dakota where annual precipitation is about 25 inches. Rainfall in the Rocky Mountain part of the area varies greatly; heavier precipitation occurs at higher altitudes. Rainfall in the Rocky Mountains ranges from less than 8 inches in the central Big Horn River basin to more than 30 inches in the Big Horn Mountains and at high altitudes along the Continental Divide in Wyoming and Montana.
Flood peaks in the western and northern part of the report area are generally caused by snowmelt and usually occur from March tc June. In the southeastern part of the area, flood peaks are most often caused by rainfall either as general storms or as intense small-area thunder storms and may occur from spring through fall. Some of the greatest floods have resulted from heavy rainfall on snow and frozen ground; such a situation caused the great flood of June 1964 in northwestern Montana.
FLOOD-FREQUENCY ANALYSIS
METHOD OF ANALYSIS
Methods used in analyzing data for this report are published in Water-Supply Paper 1543-A (Dalrymple, 1960). Peak discharge data collected at a single point on a stream (a gaging station) are used to define flood-frequency relations at the gaging station. These point relations defined 'at many sites are then combined to def ne re gional frequency relations which can be applied to both gaged and ungaged sites over a broad area. Using data collected on many
219-848 O - 66 - 3

14 MAGNITUDE AND FREQUENCY OF FLOODS, PART 6-A
streams of varying types and sizes of drainage basins ir the Missouri River basin, two basic relations were defined: a composite curve show ing as ordinate the ratio of peak discharges to the mear annual flood and as abscissa the recurrence interval in years and a curve showing the relation between the mean annual flood and the physical characteristics of the basin.
RECORDS USED
Peak data for 673 gaging stations on streams in the upper Missouri River basin are included in this report. Records for only 347 of these stations were used in the regional analysis. Records for 13 other stations were used to define flood-frequency relations fc^ main stems of Missouri and Yellowstone Rivers. In general, only records for stations having 10 or more years of peak-flow record not materially affected by regulation or diversion were used. Record? for 80 crest- stage partial-record gaging stations having less than 10 years record were used to help define the mean-annual-flood relations for small drainage basins.
FLOOD FREQUENCY AT A GAGING STATION
TYPES OF FljOOI> SERIES
Flood-frequency data at a gaging station can be anahrsed either as an annual flood series or as a partial-duration flood series. In the an nual flood series, only the highest peak discharge durir g each water year (Oct. 1 to Sept. 30) is used. The partial-durat: on series in cludes all peaks above a selected base. Although the annual flood series does not take into consideration some high floods th at are not the highest for the year, it has the advantage of being a complete duration series and is adaptable to mathematical analysis. The annual flood series has been used for analysis in this report.
Langbein (1949) has shown by statistical principles that the two methods give practically the same results for recurrence intervals of 10 years or more. The relation between the values in the two series is shown in the following table:
Recurrence intervals, in yearsAnnual Partial-
flood duration series series 1.16 _____________ 0.5 1.58 _____________ 1.0 2.00 _____________ 1.45 2.54 ______________ 2.0 5.52 ______________ 5.0
Annual Partial- flood duration series series 10.5 ___-______- 10 20.5 ________ 20 50.5 ________-__ 50
100.5 ________ 100
The preceding table can be used to compute values fo** the partial- duration series from curves shown in this report. Ther^ is a distinc tion in the meaning of "recurrence interval" between the two series.
FLOOD-FREQUENCY ANALYSIS 15
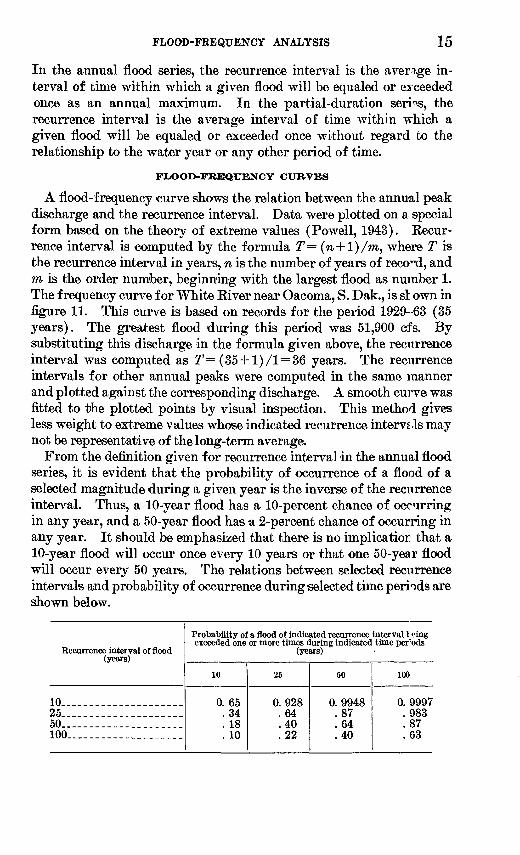
In the annual flood series, the recurrence interval is the avenge in terval of time within which a given flood will be equaled or exceeded once as an annual maximum. In the partial-duration series, the recurrence interval is the average interval of time within which a given flood will be equaled or exceeded once without regard to the relationship to the water year or any other period of time.
FLOOD-FREQUENCY CURVES
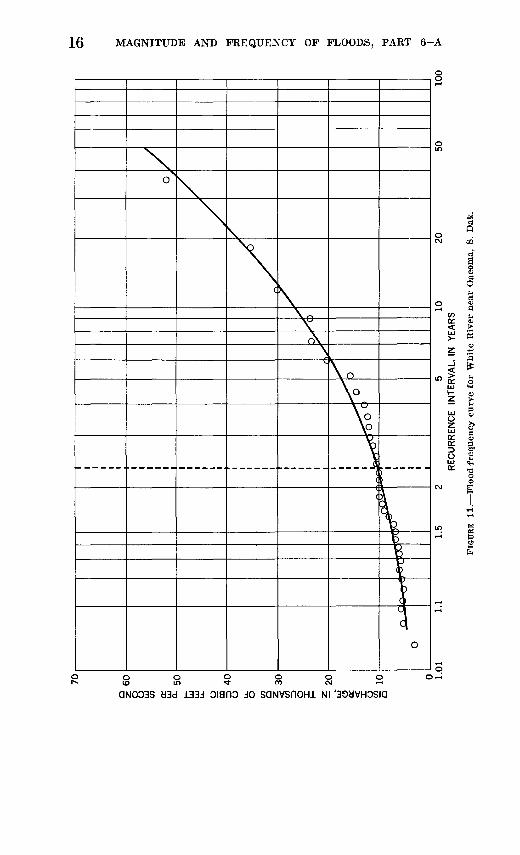
A flood-frequency curve shows the relation between the annual peak discharge and the recurrence interval. Data were plotted on a special form based on the theory of extreme values (Powell, 1943). Recur rence interval is computed by the formula T= (w+l)/m, where T is the recurrence interval in years, n is the number of years of record, and m is the order number, beginning with the largest flood as number 1. The frequency curve for White River near Oacoma, S. Dak., is si own in figure 11. This curve is based on records for the period 1929-63 (35 years). The greatest flood during this period was 51,900 cfs. By substituting this discharge in the formula given above, the recurrence interval was computed as T= (35 + !)/! = 36 years. The recurrence intervals for other annual peaks were computed in the same manner and plotted against the corresponding discharge. A smooth curve was fitted to the plotted points by visual inspection. This method gives less weight to extreme values whose indicated recurrence intervals may not be representative of the long-term average.
From the definition given for recurrence interval in the annual flood series, it is evident that the probability of occurrence of a flood of a selected magnitude during a given year is the inverse of the recurrence interval. Thus, a 10-year flood has a 10-percent chance of occurring in any year, and a 50-year flood has a 2-percent chance of occurring in any year. It should be emphasized that there is no implicatior that a 10-year flood will occur once every 10 years or that one 50-year flood will occur every 50 years. The relations between selected recurrence intervals and probability of occurrence during selected time periods are shown below.
Recurrence interval of flood (years)
10____-_-_-_--.________25.. _-_-____---__-__...60_._ ____ .____..._100_.____. ___.._.___...
Probability of a flood of indicated recurrence interval I <?ing exceeded one or more times during indicated time per'ods
(years)
10
0. 65 .34 . 18 . 10
25
0.928 .64 .40 .22
50
0. 9948 .87 .64 .40
100
0. 9997 .983 .87 .63
o 8 V)
(E
W
UJ
O §
40o LL
. O V
)O
Z
o
nS§
3015 O I -
20
ul s I tf\
-
5 1
0 0 l.(
o-H
o
Dl
1
<^-c
r«
l
l^fc
iT"
C3C0
? 1
7^^
5 S^
3^
>
***
nC°
)
f
D
.^X
0^,
'^C
X )
1
Xs^
r 0 2
/X 0
0V
^
501C
REC
UR
REN
CE
INTE
RVA
L, I
N Y
EARS
FIG
URE
11
. Flo
od-f
requ
ency
cur
ve f
or W
hite
Riv
er n
ear
Oac
oma,
S.
Dak
.

FLOOD-FREQUENCY ANALYSIS 17
REGIONAL FLOOD FREQUENCY
To permit regional application of flood-frequency relations defined at individual gaging sites, flood-frequency curves have been combined in two ways. First, the records were combined on the basis of similar ity of the slopes of the individual frequency graphs. This step defined a composite dimensionless curve representing the ratio of the discharge of a flood of any frequency to that of an index flood (the mean p.nnual flood). Secondly, a curve based on gaging-station records was de fined that shows the relation between the mean annual flood and signifi cant basin characteristics.
MEAN ANNUAL FLOOD
The mean annual flood is, by definition, a flood having a recurrence interval of 2.33 years in the annual flood series. According to the theory of extreme values, the arithmetic means of all the annual floods has a value corresponding to the flood of a 2.33-year recurrence in terval. The mean annual flood is not seriously influenced by floods of extreme magnitude; it is largely determined from floods of average magnitude. The mean annual flood has been found to be a gooc1 index of geographical variation of floodflow and has been used as the index flood in this report. It can be defined from a shorter period of record than can floods of greater recurrence interval.
The mean annual flood for each of the 347 gaging stations used in the regional analysis was computed. These data were graphically correlated with drainage basin size as the independent variab1 ^ In the mountainous areas of northern Wyoming and southern Montana, the use of mean basin altitude as a second variable was found to improve the correlation. On the basis of these correlations, 15 hydro- logic areas were defined. These areas are outlined on plate 1, and curves of relation are shown in figures 3-8. Mean annual floods used to define areas 1-7 were adjusted to a standard period 1921-63. Those used to define areas 8-15 were adjusted only to the period 1929-63 owing to the lack of long-term records in the eastern part of the report area. Data from the 80 short-term crest-stage partial-record gaging stations were used without time adjustment.
COMPOSITE FREQUENCY CURVES
The upper Missouri River basin has been divided into five homo geneous regions on the basis of the slopes of the individual frequency curves for all the 347 gaging stations used in the regional analysis except the 80 short-term partial-record stations whose records were not long enough to define a definite slope. The five regions are out lined on plate 1. Before combining a group of stations into a region,

18 MAGNITUDE AND FREQUENCY OF FLOODS, PART 6-A
a homogeneity test was made to determine whether the slope of the individual curves differ more than might be expected in random sam pling. The composite frequency curves shown in figure 2 show the relation of flood peaks to the mean annual flood in each of the five regions. These curves were derived by computing ratios of floods to the mean annual flood at recurrence intervals of 1.1, 1.5, 2.33, 5, 10, 25, and 50 years and by taking the median ratio at each recurrence interval for each of the five regions.
SUMMARY
Curves presented in this report can be used to predict the magnitude of floods having recurrence intervals from 1.1 to 50 year?' for streams in the Missouri River basin above Sioux City, Iowa. Flc od-f requency relations are for virtually natural conditions and are not applicable to streams whose peaks are materially affected by r^sulation or diversion. The composite frequency curves (fig. 2) should not be extrapolated to recurrence intervals beyond 50 years nor should mean- annual-flood curves (figs. 3-8) be extended above or below the ranges in drainage basin sizes or mean altitudes indicated.
Both drainage basin size and mean altitude have been used as inde pendent variables in determining the mean annual flood in hydrologic areas 6 and 7. Only drainage basin size has been used in other hydro- logic areas. The geographical delineation of hydrologic areas recognizes indirectly the effect of other variables.
FLOOD RECORDS AT GAGING STATIONS AND MISCELLANEOUS SITES
A summary of maximum known stages and discharges for the 673 gaging stations for which records are included in tl is report are contained in table 1. Table 2 contains similar data for outstanding floods at miscellaneous sites and at gaging stations having less than 5 years peakflow record through 1963. The data are listed in the downstream order currently being used by the U.S. Geological Survey. The station numbers shown in table 1 are permanent reference num bers used in Geological Survey water-supply papers since 1958. The station number and location of stations included in table 1 are shown on plate 1. Because all stations are in Part 6-A, the prefix denoting the "Part" has been omitted. Sites for data listed in table 2 have been numbered consecutively beginning with number 1 as the most upstream site. The period of known floods is the period, in water years, during which the listed peak is believed to be tv e maximum and does not necessarily indicate that all the annual floods are known for the period.

FLOOD RECORDS AT GAGING STATIONS AND MISCELLANEOUS SITES 19
Following the tables of maximum known floods is a compilation of flood peaks for the 673 gaging stations given in table 1. A brief description of each gaging station is accompanied by a tabulation of peaks. Both peak stages and discharges are usually given, but in some places, only peak stage or discharge is given. Frequently the peak stage for the year is caused by backwater from ice and occurs on a different day than the peak discharge. For such events, both peak stage and discharge are given with date of corresponding occurrence.
Peak discharges, unless otherwise noted, are instantaneous peaks expressed in cubic feet per second. The peaks are arranged by the water year which begins October 1 and ends September 30 and is identified by the year in which it ends; thus, a peak occuring ir Octo ber, November, or December 1949, would be given in the 1950 water year. Peaks are generally given for period of record throug^ 1963. Annual peaks are given for 1964 in that area covered by the unprece dented flood of June 1964 in northwestern Montana and for short- term crest-stage gages.
Underlines in the tables of peak stages and discharges hr.ve the following significance:1. Line in "Water year" column mean a discontinuous record.2. Line beginning at "Date" column and continuing througl "Dis
charge" column means a change in site and datum.3. Line in "Date" and "Discharge" column means a change in site
only.4. Line in "Gage height" column means a change in datum.5. No underlines are used for changes in. site or datum if records have
been adjusted to present conditions.Gaging-station records of less than 5 years in length, records on
irrigation or diversion ditches, and records for gaging staticns just downstream from major reservoirs that have completely regulated peak flows for the entire period of record are not included in this report.

MA
XIM
UM
KN
OWN
FLO
OD
S T
able
1.
Max
imum
st
ages
an
d dis
char
ges
at
ga
ging
st
ati
ons
No.
Gagi
ng station
Floo
d re
gion
and
hydr
o -
logic
area
Drai
nage
area
(sq
mi)
Mean
el
evat
ion
(feet)
Period of
kn
own
floods
(wat
er years
)
Area
l Q2
.33
Maxi
mum
floo
d
Date
Gage
heig
ht
(fee
t)
Disc
harg
e
Cfs
Recu
r
renc
e in
terv
al
(years)
Miss
ouri
River
main
stem
110
Red
River
at Ke
nned
y Ra
nch,
near Lakeview,
Mont.
C3323
-19
37-4
2,19
45-5
4,
1956-63
930
Apr.
30
, 1952
Apr.
19,
1954
5.24
a 5.
41,
360
11
§
Shee
p Cr
eek
basi
n H]
135
Shee
p Cr
eek
below
Muddy
Cree
k ne
ar D
ell,
Mont.
C5280
-1946-53,1960-63
265
Apr.
18,
1952
7.72
909
*1.86
g V,
Missouri River
main
stem
g140
-1,421
-1943-63
-Ju
ne
9, 1944
4.85
1,48
0hg
Hors
e Pr
airi
e Cr
eek
basi
n S
^15
0 | Ho
rse
Prai
rie
Creek
near Gr
ant,
Mont......
C3325
|19
46-5
3930
June
2, 1953
6.47
1,36
0H
tiGr
assh
oppe
r Cr
eek
basi
n o
155
Grasshopper
Cree
k near Dillon,
Mont.......
A5348
-19
21-3
3,19
46-5
3,
1955
-58,
1960
-63
310
Mir. 24,
1956
b 6.
471,
870
*1.9
8
Miss
ouri
River
main
stem
^160
| Beaverhead River
at Barratts,
Mont
........
C52,737
-19
08-6
31,
320
June
20,
1908
6.1
3,72
0*1.52
0Bl
ackt
ail
Cree
k ba
sin
O
175
C5312
-19
46-5
3,19
55-6
3285
June 11,
1947
Feb. 22,
1952
2.83
a 4.62
399
9.0
'n
Miss
ouri
River
main
stem
^18
2
185
Beaverhead River
trib
utar
y No
. 2 ne
ar
Dill
on,
Mont.
C5
C5
0.40
3,619
1958-63
1936-63
1,60
0
June
24
, 1958
June
12
, 1944
5.04
6.76
170
3,13
0Ru
by Riv
er b
asin
190
195
200
210
215
Ruby River
abov
e Wa
rm Sp
ring
s Cr
eek,
ne
ar
Alder
Mont .
Ruby River
abov
e reservoir, ne
ar Alder,
Mont.
Ruby
River
at damsite, ne
ar Al
der,
Mont...
C7
C3
C3
145
538
592
614
650
8,000
1948
-53
1938
-63
1911-12,1914,
1935-36
1929-33,1935-39,
1947
-60
1947
-60
994
1,28
0
1,36
0
May
3, 1952
May
21,
1948
May
13,
1960
Aug.
14,
1936
June 11,
1947
June
11.
1947
4.36
5.20
8.00
5.35
6.43
1,23
0
1,23
0
1,80
0
1,38
0
980
05
*1.06
>
5.0
2.1
6.7

220
Ruby
Ri
ver below
Rams
horn
Cr
eek,
ne
arSheridan,
Mont.
250
Ruby
River
near
Tw
in B
ridg
es,
Mont
....
..
235
Big
Hole Rive
r near Ja
ckso
n, Mont.........
A2240
Miner
Creek ne
ar Jackson, Mont............
A2
245
Trail
Creek near W
isdo
m, Mont.............
A225
5 Big
Hole Ri
ver
near
Melrose, Mont.........
A2
260
Birch
Cree
k near Glen,
Mont.............
265
Jefferson
Rive
r ne
ar Tw
in Br
idge
s, Mont...
A3
270
Jefferson
Rive
r ne
ar Sl
lver
star
, Mont.....
A3
277
Pish Cr
eek
near
Sl
lver
star
, Mo
nt..
....
....
| A3
285
Little Pl
pest
one
Cree
k ne
ar W
hite
hall
, A3
Mont.__________________________
303
Jeff
erso
n Ri
ver
trib
utar
y No
. 2 ne
ar
I A3
Whitehall, Mont.____________________
\
305
Boul
der
Rive
r above
Rock
Cr
eek,
near Basin, A3
Mont.
350
Boul
der
Rive
r ne
ar Boulder, Mont..........
A3
340I South
Boul
der
Rive
r near Je
ffer
son
Island,
C3
I Mont.__________________________
345
Jefferson
River
at Sappington,
Mont.......
A3
350
Willow Cr
eek
near
Harrison,
Mont........
355
Norwegian
Creek
near
Harrison,
Mont.....
365
Willow Creek
near
Willow
Cree
k, Mont....
843
935
1947-53
1942-43,1947-63
June 14
,
June 12
,
1947
1947
6.32
6.89
1,34
0
1,50
0Bi
g Hole Ri
ver
basin
44.0
17.6
71.4
2,476 36.0
1948-53
1948
-53
1948-53
1924-63
1946
-53,
1955
-63
450
235
630
7,60
0
May
29,
June
22,
June 13
, June
2,
June 14
, June
3,
Nov.
15
, June 21,
1948
1950
1953
1953
1927
1948
1959
1963
4.45
3.57
5.
89
14.0 7.76
a 5.33
938
336
1,07
0c 23
,000
14,1
00
12 4.3
6.5
8.5
Miss
ouri
Ri
ver main stem
7,632
7,68
31942-43,1958-63
1911
-16,
1921
-59
7,10
07,
150
May
28,
June 15,
1942
1927
12.5
3 d 15
,200
10
.0
e 20
,300
8.5
57Fish Cr
eek
basi
n
June
6,
June 11,
1959
1965
1.16
1.4
Pipe
ston
e Cr
eek basin
50.7
July
1, 1958
Unna
med
trib
utar
y ba
sin
4.50
June 24,
1958
4.45
Boul
der
Rive
r basin
19.4
581
1946
-53,
1955
-57
1929
-32,
1954
-65
155
1,03
0
May
19,
1948
May
22,
1948
5.72
10.37
582
2,62
0
*1.22
24So
uth
Boul
der
Rive
r basin 19
26-33
192
June 16
, 1929
*1.2
2
Miss
ouri
River main stem
9,27
71895,1897-1905,
1939-65
8,00
0 June 25,
1899
9.65
d21,000
Willow Cr
eek basin
85.8
22.4
1958-6
5
19
58
-45
,19
47
-51
1920-2
9,1
931-3
2,
19
47
-55
,19
55
-56
Feb
. 5
, 19
65Ja
n.
29,
1947
July
20,
1948
July
51
, 19
48
4.2
4a3.3
62.2
428
d
650
See
footnotes
at end
of ta
ble.
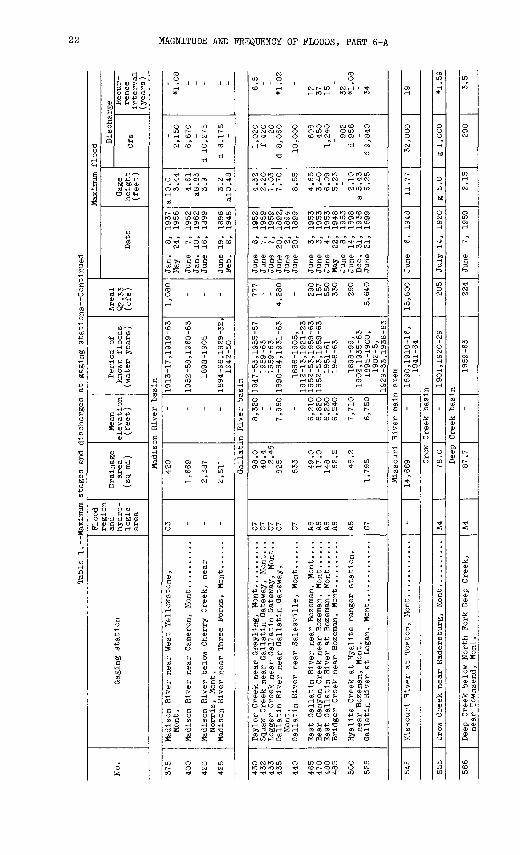
Tabl
e 1.--Maximum
stages and
disc
harg
es at
ga
ging
stations Continued
Gagi
ng station
Flood
regi
onand
hydr
o-lo
gic
area
Drai
nage
area
(s
q mi
)
Mean
elev
atio
n (feet)
Peri
od of
known
floo
ds
(water ye
ars
)
Area
l «2
.33
(cfs
)
Maximum
floo
d
Date
heig
ht
(feet)
Disc
harg
e
Cfs
Recu
r
renc
e in
terv
al
(years)
Madi
son
Rive
r ba
sin
375
Madison
River
near
Wes
t Ye
llow
ston
e,
Mont.
C3
400
Madison
River
near
Cameron, Mont.
420
Madison
River
below
Cherry Cr
eek,
near
Morris,
Mont.
425
Madison
River near Three
Porks, Mont.
45O
Tayl
or Creek
near
Grayling,
Mont..........
C7432
Squa
w Cr
eek
near
Ga
llat
in Gateway, Mont...
C743
3 Lo
gger
Creek near G
alla
tin
Gateway, Mont..
C7
435
Gall
atin
River
near
Ga
llat
in Ga
tewa
y,
C7Mont.
440
Gall
atin
River
near
Sa
lesv
ille
, Mo
nt..
....
C7
465
East Ga
llat
in River
near
Bozeman, Mont....
A8470
Bear
Ca
nyon
Creek near Bozeman, Mo
nt..
....
A8
480
East Ga
llat
in River
at Bozeman, Mo
nt..
....
A8
485
Brid
ger
Cree
k ne
ar B
ozeman,
Mont..........
A8
500
Hyalite
Cree
k at
Hyalite
rang
er station,
A8near Bo
zeman,
Mont.
525
Gall
atin
River
at Lo
gan,
Mont.............
C7
Missouri River
at Toston,
Mont
.
420
1,669
2,387
2,51
1
1913-17,1919-63
1952-58,1960-63
1898-1905
1894-96,1929-32
1942-50
1,08O
Jan.
8,
May
24,
June
7,
Jan.
10
, June 16
,
June 19,
Feb.
8,
1937
1956
1952
1962
1899
1896
1948
a 10.0
3.44
4.61
a8.8
33.
9
3.2
alO.48
2,15
06,
670
d 10
,275
d 8,
175
Gall
atin
River
basin
98.0
40.4
2.4
88
25
833 49.0
17.0
148 62.5
48.2
1,7
95
8,3
20
7,9
60
6,2
10
6,8
20
6,2
30
6,5
40
7,7
10
6,7
50
1947-5
3,1
955-5
71959-6
31959-63
1890-94,1931-63
1896-1905,
1912-13,1921-23
1952
-53,
1959
-63
1952
-53,
1959
-63
1951-61
1946-63
1898-99,
1902
,193
5-63
18
95-1
900,
1902-5,
1929
-33,
1936
-63
4,28
0
290
157
550
330
290
5,64
0
June
6,
June
7,June
7,June 20,
June
2,June 20,
June
3,June
3,June
4,May
22,
June
8,June 14
,De
c. 31,
June 21
,
1952
1959
1959
1892,
1894
1899
1953
1953
1953
1948
1953
1898
1936
1899
4.32
2.20
1.03
7.70
4.65
3.40
6.09
5.23
2.10
a 5.43
6.25
1,02
0f 420 20
d 8,
060
10,0
00 608
450
1,24
0
902
d 956
d 9,
840
6.5
*1.0
2
12 37 15 32
*1.08
Missouri River
main
stem
14,669
1890,1910-16,
1941
-64
15,8
00
June
6, 1948
11.77
32,000
Crow Cr
eek
basin
555
566
Crow Creek near Ra
ders
burg
, Mo
nt..
....
.I
76-°
I
1901,1920-29
205
July
14
, 1920
g 5.0
g 1,
000
*1.5
9
Deep Cr
eek
basi
n
Deep Cr
eek
below
North
Fork D
eep
Cree
k,
near Townsend,
Mont.
_____
87.7
224
June
7, 1959

Missouri River main stem
570
Missouri River near Townsend,
Mont
...
....
.-
15,343
-1892-1904
16,500
June 3-5,1894
June 24
, 1899
95.75
d 38
, 400
44
Spokane Creek basin
587
Mitchell Gulch near East He
lena
, Mont.....
A48.
09-
1959-63
-Feb.
4, 1963
1.41
107
-
Prickly Pear Creek basin
610
615
620
625
627
630
Lump Gulch Creek at
Zastrow's ranch, near
Clancy,
Mont
. Prickly Pear Creek near Cl
ancy
, Mo
nt ......
Prickly Pear Creek at
Ea
st Helena, Mont...
Little Porcupine Creek tributary near
Helena,
Mont
.
A4
A4
A4
A4
A4
A4
43.4
192
251 32.7
.48
102
-
1909-13
1911
-16,
1923
-33,
1946-53,1955-64
1909-13
1915-64
1959-63
1909-54
136
385
465
112
250
June
9, 19
09
June
9, 19
27
June 19,
1909
May
27,
1917
May
20,
1963
May
28,
1917
June 11,
1927
2.5
2.5
4.98
.57
6.58
d 106
g 900
d 535
781 2.
2
995
1.4
18
2.8
*2.28
*1.30
Missouri River main st
em
655
665
Missouri River below Hauser Lake Dam, near
Helena, Mo
nt.
Missouri River below Holter Da
m, near Wolf
Creek, Mont
.-
16,876
17,149
-
1923-42
1946-64
18,300
18,500
June 15,
18, 19 27
June
8, 1948
78.8
11.70
h 33
, 300
34,800
20
24
Little Prickly Pear Creek basin
685
710
712
Little Prickly Pear Creek near Marysville,
Mont
. Little Prickly Pear Creek near Canyon
Cree
k, Mo
nt.
Lyons Creek near Wolf Creek, Mo
nt .........
A4
A4
A4
44.4
183 29.4
-
1913-32
1909-11,1913-24
1959-63
140
375
103
May 25,
26,1
917
May 15,16, 19
17
June
8, 1964
3.8
3.80
d 454
gh 800
490
*1.06
13
*1.58
Dearborn River basin
730
735
Dearborn River near demons, Mont .........
Dearborn River near Cr
aig,
Mo
nt. ..
....
....
B2
B2123
325
-1921-64
1946-64
920
1,800
June
9, 19641
June
9, 1964
9.15
13.50
17,400
15,400
*3.55
*1.61
Missouri River main stem
740
-18,493
| 1903-15
23,000
June
5, 1908
16.7
54,250
42Smith River basin
745
760
765
7SS
770
775
See
f
Smith River near White Sulphur Springs,
Mont
. Newland Creek near White Sulphur Springs,
Mont
. Newland Creek near damsite, near White
Sulphur Springs, Mo
nt.
Sheep Creek near White Sulphur Springs,
Mont
.
ootnotes at end
of table.
A4
A4
A4 A4
A4 A4
30.7
6.74
44.8
1.48
54.4
1,594
-
1923-31,1924-36
1946-53,1960-63
1951
-57
1959-63
1942-64
1951-64
108
140
159
1,690
Apr.
11,
1936
June
4, 1953
June
5, 1953
June
7, 1959
June
4, 1953
June
4, 1953
Feb.
4, 1963
4.20
3.50
3.83
1.05
5.80
10.46
a 12.50
770 56
227 14
460
12,300
*2.33
5.8
40
*2.38

Tabl
e 1. Maximum stages and
discharges at
gaging st
atio
ns--
Cont
inue
d
Gagi
ng st
atio
n
Floo
dre
gion
and
hydr
o-lo
gic
area
Drai
nage
area
(sq
ml)
Mean
sl
evat
lc
(feet)
Period of
know
n fl
oods
(water years)
Area
l Q2.33
(cfs
)
Maxi
mum
floo
d
Date
Gage
heig
ht
(fee
t)
Disc
harg
e
Cfs
Recu
r
renc
e In
terv
al
(yea
rs)
Smith
Rive
r basin Continued
778
Good
man
Coul
ee ne
ar Eden,
Mont
....
....
....
A4
780
Smith
River
at Tr
uly,
Mont................
A4
782
Missouri Rive
r near Ulm, Mont.
785
North
Fork
Sun
Rive
r ne
ar Augusta, Mont...
Al79
6 Beaver Creek
at Gl
bson
Dam, ne
ar Augusta,
BlMon
t.
800
Sun
River
near Au
gust
a, Mo
nt..
....
....
....
Bl
815
Willow Creek near Augusta, Mo
nt..
....
....
. Bl
825
Smith
Creek
near
Augusta, Mo
nt..
....
....
..
Bl835
Ford Cr
eek
near Augusta, Mont.............
Bl
840
Smith
Creek
below
Ford Cr
eek,
ne
ar
B2Augusta,
Mont.
845
Elk
Creek
at Au
gust
a, Mo
nt..
....
....
....
..
B2860
Sun
Rive
r at
Port Shaw,
Mont
....
....
....
..875
Sun
Rive
r at
Sun
Rive
r, Mo
nt..
....
....
....
885
Mudd
y Cr
eek
at Vaughn,
Mont
....
....
....
...
B3
890
Sun
River
near V
augh
n, Mont...............
893
Sun
River
tributary
near
Great
Fall
s,
B3_____
Mont.______________________________
905
| Missouri Rive
r ne
ar Gr
eat
Fall
s, Mont.....
[ -
905
I Be
lt Creek
near
Monarch, Mont.............
I A2
21.8
2,00
61959-63
1905
-7,1
929-
32,
1953
Mar. 19
, 1962
2,00
0 Ju
ne
4, 1953
4.17
127
30,300
*4.97
Miss
ouri
River main st
em2
0,9
41
19
48
,19
53
,19
58
-64
1
95
8-6
425,500
June 1953
a 17
June
22,
1964
14.4
427,500
Sun
Rive
r ba
sin
258 20.3
96.1
25.0
19.4
74.0
157
1,41
71,
454
314
1,854 21.1
1911-12,1946-64
1959-64
1890,1905-29,
1964
1905-10,1912-25
1906
-12
1906
-12,
1964
1946
-52,
1964
1905
-24,
1964
1913
-28
1906
-12
1908
-64
1925
,193
4-64
1934-64
1956-64
3,02
0460
5,70
0
1,45
0530
445
640
1,09
0
910
160
June
8, 19
64June
8, 1964
June
9,
19
64
June
23,
1916
June
4,
1908
June
19,
1909
June
8, 1964
June
8,
19
64
June
8, 1964
June
21,
1916
June
7, 1908
June
1908
June
4,
1953
June
9,
1964
June
8, 1964
15.8
2
15.7
10.8
5.5
5.5
13.4
11.5
13
.4
f!24
16.7
23.4
5.46
51,1
004,
360
59,7
00
1,15
01,
500
2,70
06,
140
f12,000
20,0
00
27,2
00
7,60
053
,500 470
*5.5
5*1
.78
1.9
11 *1.1
4*1
.80
*2.07
*1.57
12
Missouri Ri
ver
main
stem
23,2
92
| -
|
Belt Cr
eek
basi
n
1909-6
3
| 2
8,7
00
[Ju
ne
4,
1955 |
66,600
- |
1908-6
4
I 1,9
90 |
Ju
ne
4,
19
55
[
10
.12
| 1
1,0
00
|
*1
.81
Miss
ouri
River
main
stem
908
Miss
ouri
Rive
r at Fo
rt Be
nton
, Mo
nt..
....
24,7
49
- 11891-9
9,1
901-6
4 |
5
1,0
00
| Ju
ne
6,
19
08
^1
18
.5
|f 1
40,O
OP
j
*1
.62
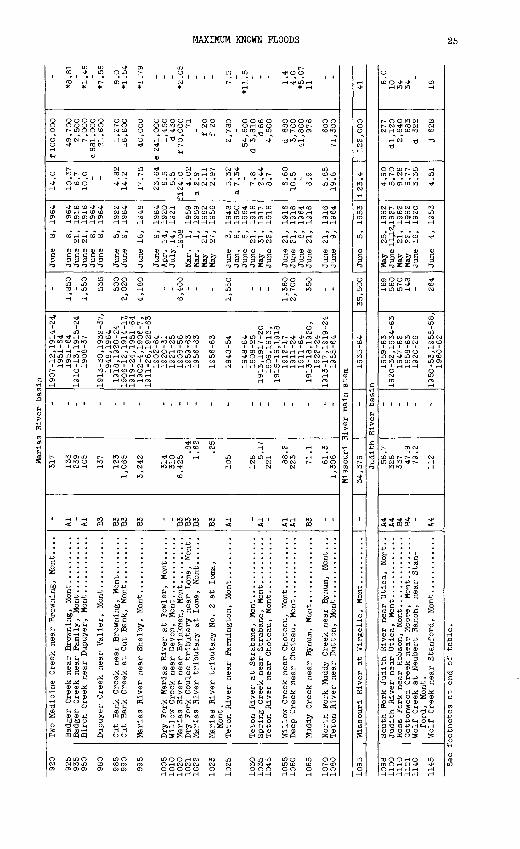
Marias River basin
920
Two Medicine Creek near Browning, Mont....
925
Badger Creek near Browning, Mont..........
Al935
Badger Creek near Fa
mily
, Mont............
950
Birch Creek near Dupuyer, Mont............
Al
980
Dupuyer Creek near Valier,
Mont...........
B3
985
Cut
Bank Creek near Browning, Mont........
B3990
Cut
Bank Creek at
Cut
Bank
, Mont..........
B3
995
Marias River near Sh
elby
, Mont............
B3
1005
Dry Fork Marias River at Fo
wler
, Mont.....
1010
Willow Creek near De
von,
Mont.............
1020
Marias River near Brinkman, Mont..........
B310
21
Dry Fork Coulee tributary near Lo
ma,
Mont
. B3
1022
Marias River tributary at
Lo
ma,
Mont......
B3
1023
Marias River tributary No.
2 at
Lo
ma,
B3
Mon
t.
1025
Teton River near Farmington, Mont.........
Al
1030
Teton River at
Strabane, Mont.............
1035
Spring Creek near Strabane,
Mont..........
Al1045
Teton River near Choteau, Mont............
1055
Willow Creek near Choteau, Mont...........
Al1060
Deep Creek near Ch
otea
u, Mont.............
Al
1065
Muddy Creek near Bynum, Mont..............
B3
1070
North Fork Muddy Creek near Bynum, Mont...
1080
Teton River near Dutton,
Mont.............
1095
| Missouri River at Virgelle, Mont..........
1098
South Fork Judith River near Ut
ica,
Mo
nt..
A4
1100
Judith River near Utica, Mont.............
A41110
Ross Fork near Ho
bson
, Mont...............
B411
21
Cottonwood Creek ne
ar-
Moore, Mont.........
B41140
Wolf Creek at Neubert Ra
nch,
near Stan
for
d, Mo
nt.
1145
Wolf Creek near Stanford, Mont............
A4
317
133
239
105
123
1,065
3,242
314
310
6,425.84
1.62
.25
105
128 5.
17221 88.2
223 71.1
61.3
1,308
1907
-12,
1914
-24,
1951-64
1951-64
1910-13,1915-24
1908-37
1913-30,1932-37,
1948,1964
1918,1920-24
1906
-12,
1914
-17,
1919-24,1951-64
1902-4,1906-7,
1911-26,1928-63
1902-64
1920-31
1921-25
1908-56
1959-63
1956-63
1956-63
1948-54
1948-64
1908-25
1913,1917-20
1906,1913,
1915-16,1918
1912-17
1911-24
1911-64
1913-18,1920,
1922-24
1913-17,1919-24
1955-64
1,850
1,550
535
500
2,020
4,180
6,400
1,550
1,360
2,700
Jvne
8, 1964
14.0
f100,000
June
8, 1964
June 21,
1916
June 21,
1916
June
8, 1964
June
8, 1964
June
5, 19
22
June
9, 1964
June 18,
1948
June
9, 1964
Apr. 14,
1920
July 14,
1921
1908
Mar.
1, 19
59
Mar.
1, 19
59
May
21,
1962
May
27,
1956
June
3, 1948
Jan.
6, 1950
June
8, 1964
June 21,
1916
May
31,
1917
June 22,
1916
June 21,
1916
June 21,
1916
June
8, 1964
June 21
, 19
16
June 21,
1916
June
9, 1964
10.3
76.7
10.0
4.82
14.2
17.75
23.64
6.5
5.5
fi24.0
4.02
2.9
2.11
2.97
5.32
a 7.34
7.8
2.44
8.7
6.60
10.5
6.9
5.85
19.8
49,700
2,500
7,000
c 881,000
21,600
1,270
16,600
40,000
e 241,000
1,450
d 430
f70,000 71
f 20
f 20
2,780
54,600
d 3,810
d 66
4,500
d 880
3,700
41,800
976
600
71,300
*8.81
*1.48
*7.58
9.0
*1.54
*1.7
9
*2.05
7.5
*11.5
1.4
4.0
*5.0
711
Missouri River main stem
| 54,5
79
[ -
| 1955-6
4
| 5
5,5
00
[ Ju
ne
5,
1955|l25.4
I
122,0
00
[ 41
Judith River basin
58.7
328
337 47.9
79.2
112
1959-63
1920-32,1934-63
1947-62
1958-63
1920-26
19
50
-53
,19
55
-58
, 1
96
0-6
2
169
56
0570
148
26
4
May
2
5,
19
62
Ju
ne 1
1,12
,192
7 M
ay
21,
1962
May
2
2,
1962
June
16
, 1
92
0
June
4,
1953
4.9
05.7
09
.26
6.7
73.3
5
4.5
1
277
dl,
120
2,6
40
683
d 322
j 62
8
6.0
10 34 34
See
fo
otn
ote
s at
end
of
table
.

Tabl
e 1. Maximum st
ages
an
d discharges at
ga
ging
stations Continued
No.
Gagi
ng station
Floo
dre
gion
and
hydr
o -
logic
area
Drainage
area
(sq
mi)
Mean
elev
atio
n(f
eet)
Period of
kn
own
floods
(water years)
Area
l Q2
.33
(cfs
)
Maxi
mum
flood
Date
Gage
heig
ht(feet)
Discharge Re
cur
renc
ein
terv
al(years)
Miss
ouri
River main stem
1150
Miss
ouri
Rive
r at
powerplant fe
rry,
ne
ar
Zortman, Mont .
-40
,763
-1934-64
42,0
00Ju
ne
6, 19
5322
.20
137,000
45
Muss
elsh
ell
Rive
r ba
sin
|=11
55
1160
1169
11
70
1180
1185
1195
1205
1206
1207
1208
1209
1210
1215
1220
1235
1255
1257
1263
1265
1275
1279
North
Fork Musselshell
River
near
Delpine,
Mont.
North
Pork Musselshell
River
at De
lpin
e,
Mont.
Checkerboard Creek
near
Delpine, Mont.....
Nort
h Pork Mu
ssel
shel
l Ri
ver
near
Martins
- dale,
Mont.
South
Fork Musselshell
River
above
Mart insdal e
, Mont .
South
Pork Mu
ssel
shel
l River
near
Ma
rtin
s -
dale
, Mont.
Musselshell
River
at Harlowton, Mont......
Ante
lope
Creek
tributary
near
Ha
rlow
ton,
Mont.
Ante
lope
Cr
eek
trib
utar
y ne
ar m
outh,
near
Harlowton, Mont.
Ante
lope
Cr
eek
trib
utar
y No.
2 ne
ar
Harlowton, Mont .
Amer
ican
Fork below
Lebo Cr
eek,
ne
ar
Harl
owto
n, Mo
nt.
Musselshell
River
near
Roundup, Mont ......
Musselshell
River
at Musselshell, Mo
nt..
..
Plat
will
ow Cr
eek
near
Fl
atwi
llow
, Mont....
A4
A4 AC
A8 B8
B8
B8
B8 A8 B8
B8 B8
31.4
48.6
21.1
23
.9
233
287
300
1,12
5 .4
7
1.92
21.2
88.7
94.6
59.1
166
1,98
2 47
1 23
2
220
4,02
3 4,
568
188
-
1941-63
1909-11,1922-32
1909
-11,
1913
-14
1922
-30,
1932
1908-14
1942
-63
1908-14,1932
1909-63
1956-63
1956-63
1956-63
1950-63
1908-11,1913,
1924
-30,
1932
1908-10,1913,
1924
-32
1947-63
1947-63
1934
-42
1958-63
1958
-59,
1961
-63
1946
-48,
1950
-63
1917
-63
1929
-30,
1932
, 1946-63
1911
-32,
1934
-56
110
805
850 4
180
406
580
1,08
0 720
695
Apr.
1,
1950
July 21,
1923
May
4, 1909
July 16
, 1923
Apr.
12
,191
3 f
June
5, 1948
June
2, 1911
June 24,
1938
June
15,
1956
Mar.
18
, 19
60
Mar. 17,
1956
June
16
, 1962
June
17,
1950
June
1, 1908
June
6, 1928
July
11,
1948
Mar.
19
, 1949
June 17,
1948
June 19,
193R
Jan. 29,
1962
June
19
, 1962
Mar.
1, 1959
June 18
, 1948
May
19,
1917
June 19
, 1948
June 4
-11,1917
4.63
4.50
2.0
3.1
6.8
6.56
6.0
8.72
2.04
1.60
5.56
16.7
3 4.60
6.90
5.67
a 6.86
10.92
12. n
a 4.
50
4.32
6.65
11.0
fn.1
2 8.5
9.0
423
d 545
d 146
d 167
d 66
8
1,24
0
1,38
0
d 4,
530 13 207
3,230
24,400
d 980
d 41
7
956
6,26
0 (k) 250
780
7,46
0
4,79
0
d 95
4
NITUDE
AND
FREQUENCY OF
FLOOD
S, PART
6-A
CD r--
(M
(M
CO
to
tO
iH
inin in in to H to cvi
*
*
iH *

1282
Platwillow Cr
eek
near
Winnett,
Mont.....
1289
Box
Elder
Creek
trib
utar
y ne
ar W
innett,
B8
Mont
.12
90
Box
Elder
Cree
k ne
ar Winnett,
Mont......
1295
Mc
Dona
ld Creek
at Winnett, Mont.........
1297
German Co
ulee
ne
ar Cat
Cree
k, Mont......
1298
Germ
an Co
ulee
tr
ibut
ary
near
Ca
t Creek,
B8
Mont
.13
05
Muss
elsh
ell
River
at Mosby, Mont........
1306
Cat
Cree
k ne
ar Ca
t Cr
eek,
Mo
nt..
....
....
..
B81307
Sand Cr
eek
near
Jo
rdan
, Mont..............
1309
.5
Litt
le Dr
y Cr
eek
near
Va
n Norman,
Mont
....
B8
1310
Dry
Cree
k ne
ar Van
Nor
man,
Mont...........
B9
1320
Miss
ouri
River below
Fort Pe
ck D
am,
Mont.
1327
Mi
lk River
near
De
l Bo
nita
, Mont..........
B3
1330
Milk
River
at western
cros
sing
of
in
ter-
B3
nati
onal
boundary.
1335
Nort
h Pork Mi
lk R
iver ab
ove
St.
Mary
B3
Cana
l, ne
ar Browning,
Mont.
1340
North
Milk
Ri
ver
near
international
B3boundary.
1345
Mi
lk River
at Mi
lk River, Al
bert
a...
....
1350
Milk
River
at eastern
cros
sing
of
inter-
B4na
tion
al boundary.
1355
Sa
ge Creek
at "Q
" Ra
nch,
ne
ar W
ildhorse,
B3A
lbert
a.
1370
M
ilk
Riv
er
abov
e H
avre
, M
ont.
...........
1330
Sa
ge Creek
near
fremlln, Mont...........
1385
Big
Sand
y Cr
eek
near
Bo
x El
der,
Mo
nt..
....
B4
1395
Bi
g Sa
ndy
Cree
k ne
ar Assinniboine,
Mont
...
B4
See
footnotes
at end
of table.
642 16.2
684
421 2.
32
.81
7,84
6
1923-29,1931-32,
1948-51
1955-63
1931
-32,
1934
-38,
1959
-63
1931-32,1934-45,
1953-63
1955
-59,
1961
-63
1955
-63
1929,1931-32,
1934
-63
1,29
0
152
1,01
0
5,50
0
July
5, 19
23
Mar.
1,
1959
June
15
, 1962
June 16
, 1962
May
15 or 16
,19
42Au
g. 23,
1955
Au
g. 23
, 1955
June
18,
1944
12.9
4
3.86
a 8.3
15.34
5.59
3.02
14.4
3
d 3,
770
412
9,91
0
900
385
159
18,0
00
12 10 2.0
Dry
Cree
k basin
36.5
317
1,22
4
2,55
4
1958
-63
1958-63
1958-63
1940
-48,
1950
-63
1,87
0
4,65
0
June 16,
1962
Mar.
17
, 1959
Mar. 19
, 19
60Mar. 18,
1959
Mar. 20,
1960
Mar. 21,
1947
Mar. 21
, 19
47
6.19
7.95
a 8.07
6.80
a 7.6
a 15
.26
13.3
9
748
2,12
0
5,20
0
24,6
00
11 49Mi
ssou
ri River main stem
57,5
56Ma
r. 10,
1936
a 12
.30
Aug.
8,
19
4651
,000
Milk
Riv
er bas
in
397 61.8
91.8
1,03
62,
588
175
3,82
6
914
1,62
9
1,805
1906-8,1911,
1913-17,1919,
1923
-24,
1927
,19
29-3
0,19
62-6
41931-64
1911-12,1924-64
1911
,191
3-64
1909
,191
3-64
19
10-6
4
1936-41,1943,
1946
-63
1928
-33
1946
-52
1927-32,1934-36,
1938
1946
-53,
1955
-63
940
June
8, 1964
1,05
0
320
410
2,35
0
600
1,70
0
1,85
0
June
9,
Apr. 22,
June 17,
May
22,
Mar. 28,
Mar.
31,
Apr.
11,
June 21
, June 17,
Apri
l May
24,
1964
1953
1948
1927
1952
1952
1937
1928
1932
1952
1927
Apr.
3,
19
52
9.0
9.77
7.55
6.47
11.41
113.65
9.34
15.8
7
6.15
11.8
45.85
14.7
0
17,3
00
8,80
0
2,12
0
2,950
8,73
0
9,53
0 e 3,
500
2,54
0
3,52
0 d 2,
000
5,57
0
*3.4
5
*1.5
7
*1.2
4
*1.3
5
24
*1.09
2.S
13

Tabl
e 1.
Max
imum st
ages
and
disc
harg
es at ga
ging
stations Continued
No.
Gaging station
Flood
region
and
hydro -
logic
area
Drainage
area
(sq
mi)
Mean
elevation
( feet
)
Period of
known floods
(water years)
Areal
Q2.33
(cfs
)
Maximum flood
Date
Gage
height
(fee
t)
Discharge
(i*»
-Recur-
rence
interval
(yea
rs)
Milk River basin Continued
1405
1430
1445
1450
1455
1480
1495
1500
1505
1510
1515
1545
1552
1553
1554
1555
1560
1580
1595
1605
1610
1635
1640
Milk River at Havre, Mo
nt.
. ...............
Lodg
e Creek
at in
tern
atio
nal
boun
dary
....
.Mc
Rae
Creek
at in
tern
atio
nal
boun
dary
....
.Lodge
Creek below
McRa
e Cr
eek,
at inter
national, boun
dary
.Ba
ttle
Creek
abov
e Cypress
Lake west
inflow c
anal
, ne
ar West
Plains,
Saskatchewan
.Ba
ttle
Creek
at in
tern
atio
nal
boundary....
Wood
pile
Co
ulee
near in
tern
atio
nal
boun
dary
.East Fo
rk B
attl
e Creek ne
ar i
nternational
boun
dary
.Ly
ons
Creek
at in
tern
atio
nal
boun
dary
....
.
South
Fork Taylor Cr
eek ne
ar M
alta,
Mont..
Milk
Riv
er a
t Ma
lta,
Mont ...
....
....
....
..Whitewater Cr
eek ne
ar i
nternational
boun
dary
.Frenchman
River
abov
e Ea
sten
d Reservoir,
near Ravenscr
ag,
Sask
atch
ewan
.Frenchman
River
below
East
end
Reservoir,
near
Eastend
, Sa
skat
chew
an.
Frenchman
River
at Morrisons, near
Eastend, Sa
skatchewan.
Frenchman
River
at 50
-Mil
e, ne
ar Br
acke
n,Saskatchewan
.Fr
ench
man
River be
low
Val
Mari
e,Saskatchewan
.Frenchman
River
at in
tern
atio
nal
boun
dary
.
B4
_
B3
B3 B3 B3
-B3 B3
B3 B3
B4 B4 B4 B4_
B4
B3
- - - - -
n 5,174
6,166
753 59.0
818
270
931 60.2
89.5
66.7
' 670
162 3.
42
5.08
11,762
458
n 442
n 478
n641
n 1,089
1,725
2,299
_ _ _ - - - - - - _ _ _ _ _ - _ _ - - - - - -
1899-1922,
1952-63
1919,1923,
1925,1934-51,
1952
1911-52
1927-52
1910-63
1939-63
1917-63
1927-63
1927-63
1927-63
1905-14,1917-21,
1952
1952-63
1956-59,1961-63
1956-63
1956-63
1903-9,1911-22
127-63
1913-17,1937-63
1909-15,1918-31,
1940-63
1939-52
1914-17,1919-31,
1936-52
1937-52,1962-63
1917-63
3,800
_
1,600
312
1,680
830
- 318
410
339
2,550
925
340
_ - _ 700
1,130
- - - - -
Apr. 12,
1899
Mar. 21,
1939
Mar. 22,
1947
1952
Mar.
30,
1943
Apr.
7,
1952
June 14,
1962
Apr.
14,
1952
Apr.
15,
1952
Mar.
30,
1943
July 12,
1955
July
6, 1955
June
8, 1906
Mar.
29,
1952
Mar. 30,
1952
Mar. 13,
1959
Feb.
5, 1963
July 18,
1962
Feb.
5, 1963
July 13,
1959
Mar. 26,
1918
Mar.
25,
1943
Apr.
14,
1952
Apr.
16,
1952
Apr.
16,
1952
Apr.
16,
1952
Apr.
17,
1952
Apr.
14,
1952
Apr.
15,
1952
4 1 Q ^
1 J.
y . o
12.08
a 14
.63
17.9
13.83
8.75
14.40
10.00
10.56
8.6
11.24
8.38
16.63
a 17.05
_
a 3.
092
. 23
a 3J25
1^94
20.22
6.62
-12.25
19.10
17.7
7
16.28
19.7
19.90
f 20,000
3,450
(k)
5,110
1,160
7,760
p 3,020
5,820
3,090
2,300
1,220
d 10,960
_.
h 3,500
f 800
f 200 84
d 11,500
3,500
12,600
11 , 500
f 12,000
14,000
17,700
22,700
48
_. _ -14 20 34 19
-*1.83
*1.05
18 OQ CO
_
207.7 _. _ - _ _
42 *2.09
- - - - -

1650
Beaver Creek near Malta, Mont............
1685
Rock Creek at international boundary......
B81690
Horse Creek at
international boundary.....
B81695
Rock Creek below Horse Cr
eek,
near inter-
B8national boundary.
1700
McEachern Creek at international boundary.
B81710
Rock Creek near Hinsdale, Mont............
1720
Milk River near Vandalia, Mont............
1723
Unger Creek near Vandalia, Mont...........
1740
Willow Creek near Glasgow, Mont...........
1745
Milk River at
Nashua,
Mont................
1750
Porcupine Creek at
Nashua, Mont...........
1765
Wolf Creek near Wolf Point, Mont..........
E9
1770
Missouri River near Wolf Po
int,
Mont......
1770.5
East Fork Duck Creek near Brookway,
Mont
..
B91771
Duck Creek near Brockway, Mont............
1771.5
Redwater Creek at Brockway,
Mont..........
1772
Tusler Creek near Brockway, Mont..........
1773
Redwater Creek tributary near Brockway,
Mont.
1773.5
South Pork Dry Ash Creek near Ci
rcle
, B9
Mont
.17
74
McCune Creek near Circle,
Mont...........
1775
Redwater Creek at
Ci
rcle
, Mont...........
1780
Middle Fork Poplar River at international
E8boundary.
1785
East Poplar River at
international
boundary.
1795
West Poplar River at
international
E8boundary.
1800
West Pork Poplar River near Richland,
E8Mont.
1805
Poplar River near Bredette, Mont..........
E81810
Poplar River near Po
plar
, Mont............
E8
1,010
241 73.5
328
182
1,313
20,926 11.1
538
22,332
725
1917-21
1927-61
1915-33,1935-61
1917,1919-26,
1952,1957-63
1924-63
1906-7,1912,
1914-20
1915-25,1929-39
1958-63
1954-63
1940-63
1909,1912-21,
1923-24,1939
1,220
730
365
870
620
June 18,
Apr.
15,
Apr.
15,
Apr.
15,
Apr. 15,
June
8,
Apr.
1,
July 14,
July 14,
Apr.
18,
Mar.
24,
1920
1952
1952
1952
1952
1906
1925
1962
1962
1952
1939
21.0
11.91
11.79
12.6
13.85
18.4
35.35
3.28
21.70
31.38
d 6,040
3,310
1,800
5,110
7,080
d 6,220
d 27,200
575
12,400
45,300
c 35,500
41 32 40 *1.10
*2.15
Wolf Creek basin
251
1910-12,1950-63
1,130
Apr.
4
or 5,
1954
12.9
Missouri River main stem
82,290
1908-63
1929-63
June 14,
1908
Mar. 25,
1939
Mar.
27,
1960
fi20
a 15.64
66,800
Redwater Creek basin
12.4
54.0
216 90.2
.29
5.74
29.9
547
1955-63
1957-63
1957-63
1957-63
1954,1957-63
1955-63
1955-63
1929-30,1932-63
180
440
1,020
305
1,800
June
6,
Mar.
18,
Mar. 20,
June
6,
July 19,
July 14,
1963
1959
1960
1963
1962
1957
Aug. 16,
1960
July 19,
June
6,
July 14,
1962
1963
1957
4.30
5.15
a. 6.
94
5.45
3.36
9.40
2.40
7.26
12.7
7
650
1,000
1,520
430 83
f 450
6,730
187.1
3.5
1.8
3.4
20
Poplar River basin
362
534
139
428
2,940
3,174
1931,1933-63
1931-32,1935-63
1931-52
1935-49
1934-47
1909,1915,
1921,1923,
1946-63
920
1,160
530
1,010
3,200
3,250
Apr.
6,
1954
Mar. 22
, Mar. 25,
Apr.
17,
Apr.
14,
Mar. 23
, Ma
r. 29,
July
9,
July 10,
1939
1943
1950
1952
1939
1943
1946
1946
10.25
12.40
a 12.8
a 5.
17
5.15
f 8.0
a 8.24
17.18
18.1
12,700
2,760
5,450
f3,600
40,000
40,000
*1.57
7.8
*1.1
7 7.6
*1.42
*1.40
See
footnotes at
end
of ta
ble.

Tabl
e 1.--Maximum
stages and
disc
harg
es at gaging st
atio
ns--
Cont
inue
d
No.
Gagi
ng st
atio
n
Floo
dre
gion
an
d hy
dro -
logi
cayea
Drainage
area
(sq
mi)
Mean
el
evat
ion
(fee
t)
Peri
od of
kn
own
floods
(water y
ears)
Area
l Q2
.33
(ofs
)
Maxi
mum
floo
d
Date
Gage
heig
ht(feet)
Disc
harg
e Recu
rre
nce
inte
rval
(yea
rs)
Big
Mudd
y Cr
eek
basi
n
1831
18
32
1834
1850
Box
Elde
r Cr
eek
near Pl
enty
wood
, Mont.....
Box
Elder
Cree
k at
da
msit
e, ne
ar Plenty-
wood,
Mont.
Spring Cr
eek
at Highway
16,
near
Pl
enty
- wo
od,
Mont
.
Big
Mudd
y Cr
eek ne
ar Cu
lber
tson
, Mont.....
B9
B9 B9 B9
279
850 9.
40
19.9
1,04
4
2,44
7
_ _ - - -
1948
-63
1948
-53,
1955
-63
1956-63
1953
,195
5-63
1955
-63
1955
-63
1920-21,1923-24,
1950
-53
1909-21
1,21
0
152
240
215
2,66
0
4,45
0
Apr.
7, 1952
July
23,
1957
Ju
ne 30
, 1953
June 26,
1959
Apr.
8, 1952
Mar.
31,
1916
7.24
6.52
3.70
11.4
6,36
08,
000
328
6,530
240
660
6,30
0
d 1,
550
6.4
*5.1
0
13 7.7
Miss
ouri
River
main stem
1855
Missouri River
near
Cu
lber
tson
, Mont ......
-91,557
-1942-51,1959-63
-Ma
r. 26,
1943
Mar.
23,
1960
14.8
0 a 19
.14
78,200
1Ye
llow
ston
e River
basi
n ^
1865
1870
1875
1880
1890
1905
1910
1915
1920
1925
1930
1935
Yellowstone
Rive
r at Yellowstone
Lake Ou
tle
t, Yellowstone
Nati
onal
Pa
rk.
Yell
owst
one
River
near Ca
nyon
Ho
tel,
Yell
owst
one
National Park.
Towe
r Cr
eek
at Tower
Fall
s, Yellowstone
Nati
onal
Park.
Lamar
River
near
To
wer
Fall
s ra
nger
station, Ye
llow
ston
e Na
tion
al Park.
Blacktail
Deer
Creek
near
Ma
mmot
h, Yellow-
stone
Nati
onal
Park.
Gard
ner
Rive
r at Mammoth, Yellowstone
Nati
onal
Park,
Gardner
River
near
Ma
mmot
h, Yellowstone
Nati
onal
Park.
Yell
owst
one
River
at Oorvrin
Sprins,
Mont
..
Yellowstone
Rive
r ne
ar Livingston,
Mont...
Shields
River
near
Wilsall, Mo
nt ...
....
...
Shie
lds
River
at Cl
yde
Park,
Mont .........
- -
C7 C6 C7 C7 C7
-C6 -
AS
A8
1,006
1,157 50.4
660 15.0
200
202
?, 6?5
148
3,551 87,8
543
- -
8,340
8,690
7,900
-
7,940
- _ - _ .
1923-63
1913-18,1921-51
1923-43
1923-63
1938-45
1923-38
1939-63
1890-9?;, 1911-63
1948-56
1951-56
1897-1905,
1929-32,1938-63
1936-57
1921-23,1929-63
4,800
4,800
-
7,200
140
-
1,280
17,700
_
19,7
00 404
1,18
0
June
21,
1956
June
27,
1918
May
30,
1925
May
28,
1928
May
25,
1928
June
1, 1943
May
28,
1928
June
4, 1956
June
16,
1962
.TUH
P 14
,15,
191f
iMay
1948
June
6, 1952
Nov. 17,
1955
June
20,
1943
June 4
or 5,
1948
June
3, 1953
June
5, 1948
7.55
4.50 -
6.27
9.75
3.17
3.59 -
4.78
11.5
f 6.
03.20
a 4.6
9.34
_
5.15
7.39
7,610
d q8,550
d 642
-13,600
168
1,790
2,080
-d 32,000
( k )
2,300
-d
30,600
1,770
4,500
32
*< O*1.03
^ *x\
f< O O
*1.02
0 C/3
4.3
s 521
_ o.
*1.07
_ - -17 *1.43
*1.25
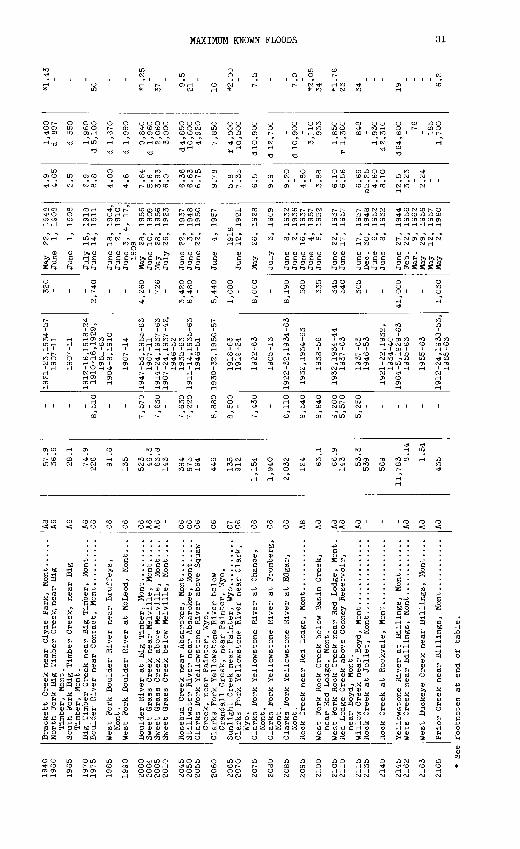
1940
1960
1965
1970
1975
1985
1990
2000
2004
2005
2010
2045
2050
2055
2060
2065
2070
2075
2080
2085
2095
2100
2105
2110
2115
2140
2145
2162
2163
2165
* See
Brao
kett
Creek
near
Clyde
Park
, Mo
nt ......
North
Fork
Big
Timb
er Creek, near
Big
Timb
er,
Mont.
South
Fork Big
Timb
er Cr
eek,
ne
ar Big
Timber,
Mont .
Big
Timb
er Creek near B
ig Timber,
Mont....
Boulder
River
near
Contact, Mont ...
....
...
West
Fo
rk Bo
ulde
r River
near Bruffeys,
Mont.
West Fork Bo
ulde
r River
at Mc
Leod
, Mo
nt..
.
Boul
der
River
at Big
Timber,
Mont ...
....
..Sweet
Gras
s Creek ne
ar Melville,
Mont.....
Swee
t Gr
ass
Creek
above
Melville,
Mont....
Sweet
Gras
s Creek below
Melville,
Mont
....
Rosebud
Creek
near
Absarokee, Mont ........
Stil
lwat
er Ri
ver
near
Absarokee, Mont.....
Clar
ks Fo
rk Y
ellowstone Ri
ver
abov
e Squaw
Cree
k, near Painter, Wy
o.Clarks Fo
rk Yellowstone
Rive
r below
Crandall Cr
eek,
ne
ar Pa
inte
r, Wyo.
Sunl
ight
Creek
near
Pa
inte
r, Wyo. ...
....
..Clarks Fo
rk Y
ello
wsto
ne Ri
ver
near Cl
ark,
Wyo.
Clar
ks Fo
rk Y
ellowstone Ri
ver
at Ch
ance
,Mont.
Clar
ks Fo
rk Y
ellowstone Ri
ver
at Fromberg,
Mont.
Clarks Fo
rk Yellowstone
Rive
r at
Ed
gar,
Mont.
West
Fo
rk Ro
ok Creek
below
Basin
Cree
k,ne
ar Re
d Lo
dge,
Mont.
West
Fork Rook Creek
near
Re
d Lo
dge,
Mo
nt.
Red
Lodg
e Creek
abov
e Co
oney
Re
serv
oir,
near
Boyd,
Mont
.
Rock Creek
at Joliet ,
Mont ...
....
....
....
.
Wets
Cr
eek
near
Billings,
Mont
...
....
....
.
West Bu
ckey
e Creek
near
Billings, Mont.,..
Prior
Creek near Billings,
Mont ...
....
....
foot
note
s at
end
of ta
ble.
AS A6 A6 A6 C6 C6 C6 C6 A6 A6-
C6 C6 C6 C6
C7 CG
C6
C6
C6
AS
AS
AS
A8
AS _ _
AS
AS
AS
57.9
36.6
28.1
74.9
226
91.6
135
52346.3
63.8
143
394
975
194
446
135
912
1,154
1,940
2,032
124 63.1
66.9
143 53.3
539
569
11,783 8.14
1.54
435
- - - -8,510
- -
7,570
7,630
-
7,630
7,220
-
8,880
8,500
7,430
-
6,110
9,540
9,640
9,200
5,570
5,250
_ _ _ - _
1921-23,1934-57
1907-11
1907-11
1912-16,1918-24
1910-16,1929,
1951-63
1904-8,1910
1907-14
1947-53,1955-63
1907-11
1914-24,1937-63
1907-24,1937-42,
1946-52
1935-63
1911-14,1935-63
1946-51
1930-32,1950-57
1918-63
1919-24
1922-63
1905-13
1922-32,1934-63
1932,1934-63
1938-56
1932,1934-44
1937-63
1937-63
1946-53
1921-22,1932,
1934-40
1904-5,1929-63
1955-63
1955-63
1912-24,1938-53,
1955-63
320
- - -2,740
- -
4,260
726
-
3,420
6,480
-
5,440
1,080
8,000
-
8,190
500
335
345
540
305
_
41,000
-
1,030
May
22,
1948
June
1, 1908
June
1, 1908
July 15
, 1918
June 14
, 1911
June 18, 19
04,
June
2, 1910
June 3,
4,
17
,1909
May
28,
1956
June 10,
1909
May
28,
1956
July 26
, 1923
June 22,
1937
June
3, 1948
June 22
, 1950
June
4, 1957
1918
June 12
, 1921
May
26,
1928
July
3, 1909
June
8, 1932
June
2, 1936
June 16
, 1937
June
4, 1957
June
6, 1952
June 22,
1937
June 17
, 1957
June 17,
1957
Dec. 30,
1948
June
6, 1952
June
8, 1932
June 27,
1944
Feb. 22
, 1956
Mar.
9, 1962
May
29,
1956
May
12,
1957
May
2, 1960
4.9
4.05
2.5
6.9
8.8
4.00
4.6
7.84
5.6
3.93
6.0
6.36
6.63
6.75
9.78
5.8
7.35
6.5
9.9
9.20
-
4.80
3.88
6.10
6.56
6.66
a5 . 25
4! 60
8.10
12 . 5
3 . 23
'-
2.24
- _
1,400
d 89
7
d 550
1,960
d 5,100
d 1,670
d 1,990
9,840
d 1,960
2,060
3,000
d4,850
10,600
4,920
7,850
f 4,000
10,500
dlO,900
d 12,700
-d 10,900
_
3,110
933
1,850
r 1,360
848
1,930
d2,310
d 64, 800
76
- 185
1,700
*1.43
- - -50
- -
*1 .25
137
-
9.5
21-
10 *2.00
7.5 - -
7.0
_
*2.05
34
*1.76
23
34
- _
19
_ - -6.
2

Table
1. Maximum stages and
disc
harg
es at ga
ging
stations Continued
No.
Gaging st
atio
n
Floo
d region
and
hydr
o-
logi
c ar
ea
Drai
nage
area
(sq
mi)
Mean
el
evat
ion
(feet)
Peri
od of
kn
own
floods
(water ye
ars)
Area
l Q2
.33
(cfs)
Maxi
mum
floo
d
Date
Gage
heig
ht
(fee
t)
Disc
harg
e
Cfs
Recu
r
renc
e in
terv
al
(years)
Yell
owst
one
River
basin --Continued
2170
2175
21
85
2205
2214
2215
2220
2225
2235
2240
2250
2255
2280
2285
2290
2310
2315
2320
2325
2330
2335
2340
2355
2390
2445
2500
2515
East Po
rk Wind
Rive
r near Du
bois
, Wy
o...
..
Dinw
oody
Creek
abov
e la
kes,
ne
ar Burris,
Wyo.
Willow Creek
near
Crowheart, Wyo. ...
....
..
Bull La
ke Cree
k near Lenore,
Wyo. ...
....
..
Litt
le Wind Ri
ver near Fort Washakie,
Wyo.
North
Pork
Li
ttle
Win
d River
at Po
rt
Wash
akie
, Wyo.
Little Win
d Ri
ver
abov
e Arapahoe,
Wyo.
....
Midd
le Popo Ag
ie River
near
La
nder
, Wyo...
North
Popo Ag
ie River
near Mi
lfor
d, Wyo...
North
Popo Ag
ie River
near La
nder
, Wyo....
Litt
le Popo Ag
ie Ri
ver
near Lander,
Wyo...
Litt
le Popo Agie Ri
ver
at Hudson,
Wyo.
....
Litt
le Wind River
below
Arapahoe,
Wyo.
....
Litt
le Wind Ri
ver
near
Riverton,
Wyo.
....
.
Five
mile
Cree
k ab
ove Wy
omin
g Ca
nal,
near
Pavillion, Wyo.
Five
mile
Cree
k ne
ar Riverton,
Wyo.
....
....
A8 C7
C7 C7
C7
C7 C7
-A7
A7
A7
A7 A7 A7 A7
A7
A7 E8
606
12,8
40
232
427 88.2
100
1,23
6 53.2
55.4
179
n 20
1 n 1,
873
2,309
118
127
716 86 98.4
134
125
384
1,53
0
1,85
1 733
118
356 18.6
8,92
0 9,
110
10,2
00
9,03
0
10,1
00
8,72
0
10,3
00
8,32
0
9,62
0
10,0
50
9,89
0 8,
970
8,02
0
1905
-6,1
908,
1910-15
1908
-16
1946
-63
1951
-57
1958
-63
1909
,191
8-30
, 1950-58
1947-53
1921
-27,
1929
-40
1909,1921-23,
1925
-40
1941
-53
1918
-63
1927
,194
6-63
1906,1908,
1911
-63
1921
-40
1921-40
1906,1908-9,
1911-18
1911-12,1918-24,
1926
1946
-63
1938
-53
1946-63
1908
-9,1
911-
12,
1913
-17,
1938
-53
1906-18
1941
-63
1923
-63
1948
,195
0-63
1950
-58,
1960
-63
1949-53
1,26
0
42,0
00
1,89
0 3,
440
1,27
0
8,02
0
773
491
2,12
0
9,52
0
1,36
0
1,07
0
1,17
0 1,
260
881
1,40
0
June
5, 19
05
June
20,
1916
June
2, 1956
June 26,
1954
Ju
ne 30,
1957
June
16,
1963
July 25,
1923
June
17,
1951
Ju
ne 14,
1953
June
12
, 1921
May
31,
1939
June
7, 1952
Aug.
8, 1951
June
16
, 1963
June
15
, 19
35
June
17
, 19
63
July
9, 1926
July
9, 1926
June
17
, 1911
July
9,
1926
June 16
, 1963
June 14,
1953
June
16
, 19
63
June
22,
1947
June
23,24,26,
1917
June
17
, 1963
Feb.
10,
1962
Septemberl948
July 25,
1950
July 25
, 19
50
16.0
12.8
5.66
9.27
4.
57
3.75
7.72
3.9
5.40
6.69
9.16
9.49
i 8.89
4.85
6.6
6.0
9.44
5.54
6.64
7.60
9.3
10.8
5 6.44
6.10
11.0
3.36
d 2,
300
d 60
,000
1,
910
5,70
0
1,27
0
1,71
0
9,90
0 1,
400
1,10
0
3,03
0 6,
200
13,0
00
13,3
00
5,22
0 2,
640
d3,840
2,90
0
4,50
0 1,
900
2,01
0 d 1,
540
11,5
00
14,7
00
13,3
00
f 2,
600
1,69
0 203
8.0
8.6
2.4
23 7/4
5.0
44
15 4.4
3.9
9.5
31 *1.26
4.9
16 *1.0
8

2530
2560
2570
2575
2580
2595
Five
mile
Creek
near
Shoshoni,
Wyo.
....
....
A9
Badw
ater
Cr
eek
at Ly
byer
Pl
anch
, ne
ar Lost
Cabi
n, Wyo.
Badw
ater
Cr
eek
at Booneville,
Wyo.
....
....
Muddy
Cree
k ne
ar Pavlllion, Wy
o...
....
....
Muddy
Cree
k ne
ar Shoshoni,
Wyo.
...
Bighorn
Rive
r at
Thermopolis, Wyo.
South
Pork
Ow
l Creek near Anc
hor,
Wy
o...
..26
00
2605
Sout
h Po
rk Ow
l Creek
abov
e Cu
rtls
Ranch,
D9nea
r Thermopolis, Wyo.
2610
Sout
h Po
rk Ow
l Creek
at Cu
rtis
Ranch, ne
arThermopolis,
Wyo.
2620
Nort
h Pork Ow
l Creek
near
Anchor, Wy
o...
..
D92640
Owl
Creek
near
Thermopolis, Wy
o...
....
....
2645
Owl
Creek
near
Lucerne, Wy
o...
....
....
....
2650
KIrby
Cree
k ne
ar Lucerne, Wy
o...
....
....
..
E82655
Cottonwood Cr
eek
at Winchester,
Wyo.......
D826
58
Gooseberry Creek
at Dickie,
Wyo...........
D82660
Goos
eber
ry Cr
eek
near Grass
Cree
k, Wyo....
D82670
Goos
eber
ry Cree
k at
Neiber,
Wyo...........
2685
Fi
ftee
n Mile Cr
eek
near
Worland,
Wyo.
....
. D8
2690
Bighorn
River
near
Ma
nder
son,
Wyo....
2695
Bigh
orn
River
at Manderson, Wy
o...
...
2700
Nowood Creek
near
Tensleep,
Wyo...........
E82705
Cany
on Cr
eek
near
Tensleep,
Wyo...........
A72710
Tens
leep
Cr
eek
near
Tensleep,
Wyo.
....
....
A7
2715
Paintrock
Cree
k below
Lake Solitude,
Wyo.
. A7
2725
Paintrock
Cree
k ne
ar Hyattville,
Wyo.
....
. A7
2730
Medi
cine
Lo
dge
Creek
near
Hy
attv
ille
, Wyo.
A72735
Pain
troc
k Cr
eek
near
Bonanza, Wy
o...
....
..2740
Nowood Creek
at Bonanza, Wyo..............
2745
Grey
bull
River
near
Pitchfork, Wyo........
D727
50
Wood River
at Sunshine,
Wyo.
....
....
....
..
D72755
Wood
River
near Me
etee
tse,
Wy
o...
....
....
. D7
2765
Grey
bull
River
at Meeteetse, Wyo..........
D72775
Grey
bull
River
near
Ba
sin,
Wyo............
D72780
Dry
Creek
at Greybull,
Wyo.
....
....
....
...
D827
83
Shel
l Creek
abov
e Sh
ell
Cree
k Re
serv
oir,
A6
Wyo.
2785
Shel
l Cr
eek ne
ar Sh
ell,
Wy
o...
....
....
....
A7
See
footnotes
at end
of table.
E8 D9
n 28
5
131
808
267
332
8,02
0 86.3
144
149 54.8
478
505
240
416 95.0
142
361
518
11,020
11,048
803 66.3
247 16.0
164 86.8
398
1,790
282
194
218
681
1,115
433 23.1
145
11,100
9,120
8,070
9,740
9,100
7,070
5,580
1923,1941-42,
1948-63
1949-63
1923-63
1949-53,1955-58,
1960-63
1923-63
1900-1905,
1911-53
1932,1940-43,
1959-63
1945-59
1932,1938-43
1941-45,1947-62
1911-12,1915-17,
1932,1938-63
1932,1938-53
1936-45
1941-45
1958-63
1946-57
1941-44,1946-53
1951-63
1948-53,1956
1941-49
1938-43,1950-55
1939-44
1911-12,1915-24,
1944-63
1947-53
1921-26,1941-53
1943-63
1911-13,1915-22
1911-28
1946-49,1951-63
1946-63
1911-12,1915-16,
1930-49
1921-63
1930-63
1951-53,1956-60
1957-63
1941-63
1,210
515
1,480
1,150
1,370
585
800
730
1,000
425
565
1,150
1,480
1,590
313
1,490
648
2,770
1,710
2,760
2,410
1,030
1,240
July 24,
1923
July
8, 1949
Mar. 30,
1952
July 24,
1923
June
5, 1949
July 24,
1923
July 24,
1923
July 25
, 1941
June 24,
1945
Aug. 11
, 1941
July 23,
1955
June 15, 1963
May
27,
1942
May
4, 1947
June 1936
July 27,
1941
June 15, 1963
June 22
, 1948
May
18,
1944
May
22,
1952
Feb. 19
, 1948
1, 1951
4, 1944
Feb. 19,
1948
June 16, 1955
May
18,
1944
June 15
, 1924
Jun
e Ju
ne
June
11,
June
24,
Jun
e 24,
June
12,
June
2,
June
15,
June
15,
Jun
e 15,
June
24,
Jun
e 15,
Jun
e 16,
Sep
t.1
9,
Jun
e 15,
1953
1945
1945
1918
1912
1924
1963
1963
1945
1963
1963
1961
1963
June
24,
1945
7.3
5
a 8.8
8
9.7
0
16.2
7.5
9
4.2
5
6.1
6
8.0
8.7
3
I 6.8
0
12.0
7.4
05.6
6I
4.9
77.1
35.7
7a!6
.45
10.1
512.6
0al
S.O
O12.3
3.4
i7.0
5
6.0
9.8
04.1
05
.38
.3
7.6
87.0
0
9.2
0
R.R
3
7.8
4
7.4
9
g 3,5
00
445
18
,60
02
,30
0
16
,30
02
9,8
00
1,9
40
1,5
20
1,0
70
3,2
00
7,0
30
d 92
81,0
90
d4,1
20
1,1
30
593
1,6
50
3,3
00
d10,6
00
d17,9
00
3,3
30
248
2,8
90
543
8,2
00
1,1
60
d3,3
90
d5
,16
0
8,6
10
5,0
80
2,1
50
13,600
19,400
7,200
1,870
3,020
40 2.0
*1.43
7.0
*2.97
27
6.2
3.2
*1.03
14 2.4
17
6.8
*1.81
7.5
22 19 *1.24
*2.|
~>1
*1.75

Table 1.--Maximum stages and
discharges at
gaging stations--Continued
No.
Gaging station
Flood
region
and
hydro -
logic
area
Drainage
area
(sq
mi)
Mean
elevation
(fee
t)
Period of
known floods
(water years )
Areal
Q2.33
(cfs
)
Maximum flood
Date
Gage
height
(fee
t)
Discharge
Cfs
Recur
rence
interval
(years)
Yellowstone River basin Continued
2790
2795
2800
2803
2805
2810
2825
2830
2845
2850
2855
2862
2870
2875
2877
2885
2890
2895
2900
2905
2910
2915
2925
2930
2935
North Fork Shoshone River near Wapiti,
Wyo.
South Fork Shoshone River near Valley, Wyo.
South Fork Shoshone River near Ishawooa,
Wyo.
South Fork Shoshone River above Buffalo
Bill Reservoir, Wyo.
Shoshone River at Corbett Dam, Wyo........
Bighorn River near St .
Xavi
er,
Mont
.......
Soap Creek near mouth,
near St.
Kavi
er,
Mont
.
Little Bighorn River at State
line
, near
Wyola, Mo
nt.
Little Bighorn River near Wyola, Mont.....
Little Bighorn River below Pa
ss Cr
eek,
near Wyola, Mo
nt.
Lodgegrass Creek above
Willow Creek
diversion, near Wyola, Mo
nt.
Lodgegrass Creek near Lodgegrass, Mont....
Little Bighorn River near Crow Agency,
Mont
.
C7 C7
C7 C7
D7 D8
D8 A7 A7
A7 A7
D8
D8
D8 D8
256
15,765
800
297
532
674
1,600
1,740 80.5
2,345
381
2,989
19,667
98.3
110
20,722
193
251
111
428
161 80.7
143
170
1,181
8,510
9,250
8,670
7,980
5,570
6,140
1913-23
1923-63
1929-63
1921-26
1957-58,1960-63
1915-23
1903,1905-7,
1921-26
1902-9
1909-25
1950-54,1958-60
1929-63
1951-60
1958-63
1935-63
1939-53
1914-16,1918,
1920-24
1904-24,1929-33
1939-63
1912-24
1935-49,1951-56
1939-58,1960-63
1939-45
1939-63
1912-15,1921-24
1916-20
1912,1914-24,
1929-32,1938-60
4,900
2,540
4,430
435
460
1,250
750
329
1,330
sen
390
540
1,850
June 11,
1918
Sept
. 30
, 1923
June 16,
1935
July 22,
1923
June 23,
1925
June 15
, 1963
June 14,
1918
July
4, 1907
July
3, 19
09
July
4, 19
09
June 15,
1918
June 10,
1960
Jan.
29,
1949
Se
pt. 19,
1961
July 31
, 19
58
Sept
. 19,
1961
June 16
, 1935
May
13,
1942
May
11,
1920
Mar.
11,
1929
June
3, 19
44
Junp
9, 1944
June 16
, 1924
Mar.
25,
1943
June
4, 1944
June 14,
1963
Mar.
1R,
1944
June 18,
1944
June
4, 1944
Apr.7 or 8,1924
Apr.
9,
1917
June 15,
1918
July 23
, 1923
i 5.55
S14.8
11.10
7.2
8.83
7.0
9.1
5.15
4.48
a 8.12
7.57
6.43
10.34
13.4
11.2
11.1 5.93
5.00
a6.22
4.82
7.43
a 14. 50
14.18
5.68
7.25
4.2
14.0
1,910
25,200
9,250
6,610
d 7,740
g 5,300
d 22,200
d!8,700
1,510
16,000
1,290
13,200
37,400
1,300
d 750
d 45,900
2,730
d 1,610
d 1,150
3,630
1,020
972
d 1,000
d624
d 6,200
§ l.OZ
3
*1.40
§
34
W O
- 1
: | o
>-<
: §
19
3
4.7
O
- §
14
: 1
*1.15
o,
33
^
5.3
22
8.5
1.14

2940
2947
2950.5
2965
2970
3005
3010
3035
3055
3082
3083
3085
3090
3095
3110
3115
3130
3135
3140
3145
See
]
Little Bighorn River near Hardin,
Mont....
Little Porcupine Creek near Porsyth, Mo
nt.
North Pork Tongue River near Dayton, Wyo..
South Pork Tongue River near Dayton, Wyo..
Little Goose Creek in canyon,
near Big
Horn
, Wyo.
Basin Creek tributary near Volborg, Mont..
Middle Pork Powder River above Kaycee,
Wyo.
North Pork Powder River near Hazelton,
Wyo.
North Pork Powder River near Mayoworth,
Wyo.
South Pork Powder River near Ka
ycee
, Wyo..
North Pork Crazy Woman Creek near Buffalo,
Wyo.
North Pork Crazy Woman Creek below Spring
Draw,
near Buffalo, Wyo.
ootnotes at end
of table.
D8
B8 B8 A7
A7
A7 A7 A7 A6 A6
_B9 B9 B9 A8 A7
A8 E9 E8
E8
1,294
614 32.4
85.0
pc
1
55
.14
5-2
70
450 25.0
106
1,150 44.9
51.7
- - _
9,270
8,920
9,560
7,480
_ - -
8,990
- -
1953-63
1945-63
1958-63
1959,1961-63
1946-57
1946-63
1941-63
1955-63
1949-63
1929-53
1947-63
1941-63
1934-36,1938-63
1938-40,1950-63
1938-40,1950-57
1944-49
1949-63
1,960
1,260
390
810
613
_
1,050
291
450
2,850
275
298
Mar.
20,
1960
Apr.
30
, 1963
June 24,
1947
Sept
. 20,
1961
May
30,
1953
May 21,
1948 f
June 15,
1963
June 15,
1963
June 15,
1963
June
7, 19
57
June 15,
1963
June 15,
1963
July
2, 1958
June 22,
1963
June 15,
1962
June 19,
1944
June 15,
1963
May
14,
1932
June 15,
1953
Aug.
11,
1941
Aug.
11,
1941
May
22,
1962
Mav
23,
1952
June
6, 1949
June 15
, 1963
all. 78
8.76
8.79
8.14
9 74
10.27
2.55
6.24
f 3.2
5.37
6.78
1Q
rjC
9.38
57Q
11.33
12.74
11.7
8.45
i 5.15
4.34
7.64
12.57
13.1
7
12.6
5.56
5.83
3,750
26,200
3,320
d827
d596
560
1,670
1,130
1,230
1,350
222
390
QCC
13,300
96,300
2,480
d 768
886
1,270
5,230
35,500
32,500
611
1,020
6.4
9.6
1.4
1.2
4.4
12 *1.28
28
-
14
-
21
18
4.3
50 36 *1.41
20 4.7
7.3

Tabl
e 1. Maximum st
ages
and
discharges at
ga
ging
stations Continued
Gagi
ng st
atio
n
Floo
dre
gion
and
hydr
o-logic
area
Drainage
area
(s
q mi
)
Mean
elev
atio
n (feet)
Peri
od of
kn
own
floods
(water years)
Area
l Q2
.33
(cfs)
Maxi
mum
floo
d
Gage
heig
ht
(feet)
Disc
harg
e
Cfs
Recu
r
renc
e in
terv
al
(yea
rs)
Yellowstone
Rive
r basin Continued
3150
North
Pork Craz
y Wo
man
Cree
k ne
ar Creub,
Wyo.
3155
Midd
le Po
rk Crazy Woman
Creek ne
ar Greub,
E8Wyo.
3165
Crazy Woman
Creek
near
Arvada,
Wyo.
....
..3170
Powder River
at Arvada,
Wyo.
....
....
....
..
E93175
North
Pork Clea
r Creek
near
Buffalo, Wyo.
3185
Clear
Creek ne
ar B
uffalo,
Wyo............
3200
Rock Cr
eek
near Bu
ffal
o, Wyo.............
3205
South
Pine
y Cr
eek
at Wi
llow
Pa
rk,
Wyo.....
A7
3210
South
Pine
y Cr
eek
near Story, Wyo........
3215
North
Pine
y Cr
eek
near
Story, Wyo.........
A73230
Piney
Creek
at Kearney, Wy
o...
....
....
..
3235
Pine
y Creek
at Ucross,
Wyo.
....
....
....
...
B9
3240
Clear
Creek ne
ar Ar
vada
, Wy
o...
....
....
..
3245
Powd
er River
at Moorhead,
Mont...........
3247
Sand
Cr
eek
near Br
oadu
s, Mont............
3255
Litt
le Po
wder
River
near
Br
oadu
s, Mont....
D8
3265
Powd
er R
iver ne
ar Locate,
Mont
....
....
...
3275
Yell
owst
one
River
at Olendive,
Mont......
3278
Griffith Cr
eek ne
ar Olendive,
Mont
....
....
B9
3292
Burns
Creek ne
ar S
avag
e, Mo
nt..
....
....
..3295
Yell
owst
one
River
near
Sidney,
Mont
....
..
174 82.7
956
6,05
0 29.0
60.0
33.6
70.5
37.7
106
267
1,110
8,08
8 10.6
1,97
4
13,1
89
66,7
88 15.5
233
68,8
12
10,1
00
7,92
0
1949
-63
1942
-63
1940-43,1950-63
1919
-63
1949-63
1894
,189
6-99
, 1917-27,1938-63
1941
-63
1946,1948-57,
1960
-63
! 1951-63
1951
-63
1903
-6,1
911-
17,
1919-23,1941-63
1917-63
1917
-23,
1950
-63
1916
-18,
1928
-29,
1940
-63
1923
-63
1929-63
1955
-63
1947
-53,
1956
-63
193R
-63
1903
-10,
1932
-34
1955
-63
1958-63
1911
-31,
1934
-63
390
7,80
0
1,17
0
120
2,48
0
205
1,07
070
,400
June
13,
1962
May
2, 1947
July 14
, 1962
Sept.29, 1923
Apr.
7, 1952
June
15
, 1963
June
15,
1963
June 15,
1963
June 15
, 1963
June
15
, 1963
June 15,
1963
June 15
, 1963
June
15,
1963
June
1,
1929
June
16
, 1963
Aug.
5, 19
54
Sept
.30,
Ma
r. 21,
June
17
, Ma
y 18
, Mar. 16,
June
15,
Feb. 19
, Ma
r. 23
, June
8,
Mar. 23,
June
29
, Mar. 20,
June
21,
Mar. 22,
1923
1956
1962
1959
1948
1953
1943
1956
1909
1932
1961
1960
1921
1947
9.05
5.77
12.79
23.7
a 4.91
3.95
6.19
7.98
4.68
5.30
4.37
5.04
6.05
i 10.9 7.33
10.45
19a!7.7
12.7
7 4.79
a 10
.59
8.94
11.2
3 a 12
.3
12.7
all.SO
3.96
5.31
12.6
a 21
.85
1,05
0
4,52
0
2,90
0 f100,000 675
3,42
0
1,86
01,
620
2,09
01,
820
3,410
3,57
09,600
23
2,
d 31,
000
236
340
000
d 118,000
2,
d 15
9,100
000
*1.3
2
*1.4
6
*1.2
4
*1.9
3
13
5.5
2.2
5.4
39
Painted Woods
Creek basin
(upp
er)
3297
3299
Painted
Woods
Creek
trib
utar
y ne
ar W
illis-
ton,
N.
Dak.
Pain
ted
Woods
Creek
trib
utar
y No
. 2 ne
arWi
llis
ton,
N. Dak.
0.35
8.30
1955
-63
1955
-64
June
26,
1959
March
1960
Mar.
19
, 1959
4.36
a 8.76
7.96
47.8
207

Miss
ouri
Ri
ver ma
in st
em_
1929-63
_Apr.
4, 1930
Mar.
22,
1960
18.0
a 20.8
(kl
231,
000
_ -
Sand
Creek
basin
5501
| Sand Cr
eek ne
ar Wllllston,
N. Dak.
D838.2
250
March
1960
(*)
Litt
le Muddy
Cree
k ba
sin
3310
3315
Litt
le Muddy
Cree
k below
Cow
Cree
k, near
Will
isto
n, N. Dak.
Litt
le Muddy
Creek ne
ar Wil
list
on,
N. Da
k.
D8 D8
n 77
5
n 910
_ -
1955-63
1904
-55
1,45
0
1,58
0
Mar. 27,
1960
Mar. 30
, 1955
13.5
7
-
6,91
0
3,64
0
*1.1
9
10White
Earth
River
basin
3320
White
Earth
River
at White
Earth, N. Dak..
D8n
320
-1929-64
1955-64
830
1929
Mar.
28,
1960
21.8
al8.
02(JO
2,30
016
Litt
le Mi
ssou
ri Ri
ver
basi
n
3340
3341
3345
3350
3355
3360
3361
3362
3363
3364
3370
Litt
le Mi
ssou
ri River
near Alzada, Mo
nt..
.
Litt
le Mi
ssou
ri River
at Camp Cr
ook,
S. Dak.
Litt
le Beaver Creek near M
armarth, N. Dak.
Litt
le Mi
ssou
ri River
at Marmarth,
N. Dak.
Litt
le Mi
ssou
ri River
at Medora,
N. Da
k...
Sheep
Creek
trib
utar
y ne
ar Medora,
N. Dak.
Sheep
Creek
trib
utar
y No
. 2 near Medora,
N. Da
k.
Litt
le Mi
ssou
ri Ri
ver
trib
utar
y near
Medora,
N. Da
k.
Little Mi
ssou
ri River
near Wat
ford
Ci
ty,
N. Dak.
D9 D9 D9 BIO
BIO
BIO
BIO
BIO
BIO
BIO
904
1,97
0
615
4,57
0
6,19
0 .29
.42
.32
8,49
0
- _ - - _ -
1912-25,1929-32,
1935-63
1952
-63
1956-63
1939
-46,
1948
-63
1939-63
1904
-63
1955-64
1955
-64
1955
-64
1921
-63
2,45
0
150
3,90
0
2,70
0 9,
700
11,7
00 _
14,4
00
Apr.
4, 1944
May
21,
1962
1952
May
28,
1962
Apr.
6,
1952
Mar.
23,
1947
Ma
r. 31,
1952
Mar.
23,
1947
Ju
ne 20,
1960
June
20,
1960
June
20,
1960
June
7, 1929
Mar. 25,
1947
5 47
f 16
13.0
7 13.9
21.7
a23.4
20.5
6.55
5.40
10.9
24.0
h 6,
000
550
(k)
7,600
12,7
00
45,000
65,0
00 147
139
200
619
110,
000
11
36
6.6
35
34 *1.0
4
_
*1.4
3
____Missouri Ri
ver main stem____
| 17
9,80
0 I
- I
1940
-55
5575
[ Mi
ssou
ri River
near
El
bowo
ods,
N. Dak.....
| -
[ Apr.
57 1952
25.2
0 [560,000
Doug
las
Cree
k ba
sin
3376
East
Branch D
ouglas Cr
eek
tributary ne
ar
Garrison,
N. Dak.
D81.39
-19
57,1
959-
64-
July 19
578.54
76-
See
foot
note
s at
en
d of
table.
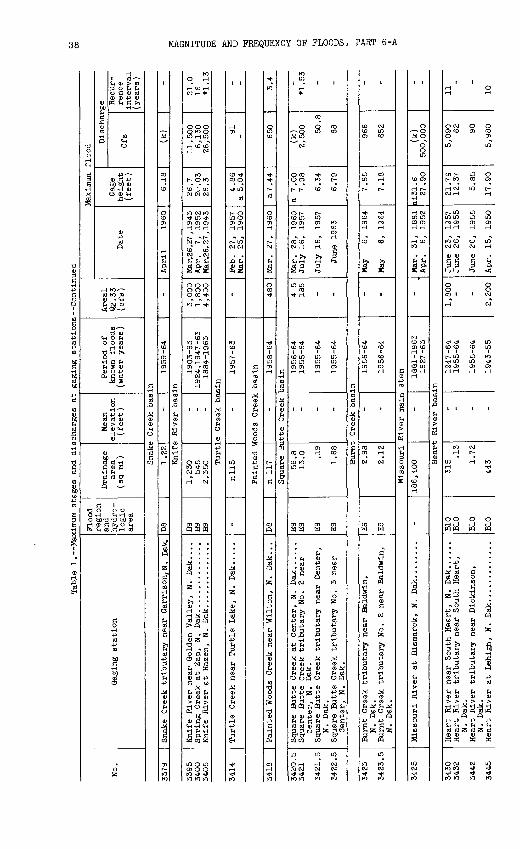
Tabl
e 1. Maximum stages and
discharges at
ga
ging
st
atio
ns--
Cont
inue
d
No.
Gagi
ng station
Floo
dre
gion
hydr
o -
logi
c
Drai
nage
area
( s
q mi
)
Mean
elev
atio
n (feet)
Peri
od of
know
n fl
oods
(w
ater
years)
Area
l02
.33
(cfs
)
Maxi
mum
floo
d
Date
Gage
heig
ht
(feet)
Disc
harg
e
Cfs
Recu
r
renc
e in
terv
al(y
ears
)
Snak
e Creek
basi
n
3379
| Snake
Creek
tributary near Garrison^N.
Dak.
D81.22
-19
59-6
4-
April
1960
6.18
(*)
IKn
ife
Rive
r ba
sin
3395
34
00
3405
Knif
e River
near
Go
lden
Valley., N. Dak....
Knif
e River
at Hazen, N. Dak. ...
....
....
..
B9
B9
B9
1,23
0 545
2,35
0_
1903-63
1924
,194
7-63
18
84-1
963
3,00
0 1,
800
4,40
0
Mar.26,27,1943
Apr.
7, 19
52
Mar.
26,2
7,19
43
26.7
2U.03
26.3
11,5
00
6,13
0 26
,500
21.0
16
*1.1
3Turtle Cr
eek
basi
n
3418
Painted Woods
Cree
k ne
ar W
ilto
n, N. Da
k...
D8
Painted
V
n 11
7
foods
Cree
k
-
basin 1958-64
480
Mar.
25,
1960
Mar. 27,
1960
a 5.04
a7.44
91 - 650
-
3.4
Squa
re Bu
tte
Cree
k basin
3420
.53421
3421
.5
3422
.5
Square Butte
Creek
trib
utar
y No
. 2 ne
arCe
nter
, N.
Dak.
Squa
re Bu
tte
Creek
trib
utar
y ne
ar Ce
nter
,N.
Dak.
Squa
re Butte
Cree
k tr
ibut
ary
No.
3 ne
arCenter,
N. Dak.
E9 E9 E9 E9
56.8
13.0 .1
9
1.68
_ - - -
1956-64
1955
-64
1955-64
1955-64
4 5
185
- -
Mar.
28,
1960
July
16,
1957
July
16
, 19
57
June 1963
a 7.
007.
98
6.34
6.79
flcl
\KI
2,50
0 50.8
88
_*1
.53
- -
Burnt
Cree
k basin
3423
3423
.5
Burn
t Creek
trib
utar
y ne
ar Ba
ldwi
n,N.
Dak.
Burn
t Creek
trib
utar
y No
. 2 ne
ar Ba
ldwi
n,N.
Dak.
E9 E9
2.98
2.12
- -
1956-64
1956
-64
- -
May
6, 1964
May
6, 19
64
7.85
7.18
966
652
- -
Miss
ouri
River
main
st
em
3425
_18
6,40
0 j
1927
-63
] Ap
r.
6, 1952
27.9
0fi
r)50
0,00
0-
Hear
t Ri
ver
basin
3432
3442
3445
Heart
River
trib
utar
y ne
ar So
uth
Heart,
N. Dak.
Hear
t River
trib
utar
y near D
ickinson,
N. Dak.
Heart
River
at LehiKh,
N. Dak. ............
BIO
BIO
BIO
.13
1.72
443
_ - - .
1955
-64
1955-64
1943-55
1,80
0
-
2,20
0
June
26,
1955
June 26
, 19
55
Apr. 15
, 19
50
21 7 9
12.37
5.85
17.9
0
5,09
0 62 90
5,98
0
-
10

3450
Green
River
near
Gl
adst
one,
N. Dak........
BIO
3451
An
telo
pe Creek
near
Dio
kins
on,
N. Dak.....
BIO
3452
Antelope Cr
eek
trib
utar
y ne
ar New En
glan
d,
BIO
N. Dak.
3453
Ante
lope
Creek
trib
utar
y (site
No.
2) ne
ar
BIO
New
England, N. Dak.
3455
Heart
River
near
Riohardton,
N. Dak.......
BIO
3457
Government Cree
k ne
ar Riohardton,
N. Dak..
E93465
Hear
t River below
Heart
Butt
e Da
m, near
E9Gle
n Ullin, N. Dak.
3470
Antelope Creek
near
Carson,
N. Dak........
E93475
Muddy
Creek
near
Alm
ont,
N. Dak...........
E93480
Heart
River
near
Lark,
N. Dak.............
3485
Swee
tbri
ar Cr
eek
near
Jud
son,
N. Da
k...
...
E934
90
Hart River
near
Mandan,
N. Da
k...
....
....
. E9
3492
West Branch Lo
ng La
ke Creek near Hazelton,
E8N.
Da
k.
3495
Ap
ple
Creek
near
Menoken, N. Dak..........
E8
3500
Cannonball River
at Regent,
N. Da
k...
....
. E9
3510
Cannonball River
below
Bentley, N.
Dak....
E935
20
Cedar
Creek
near
Ha
yes,
N. Da
k...
....
....
. E9
3525
Ce
dar
Creek
near
Pr
etty
Ro
ok,
N. Da
k...
...
E93536
Louise Creek
trib
utar
y ne
ar B
risbane,
E9
N. Dak.
3537
Louise Creek
trib
utar
y ne
ar Lark,
N. Da
k..
E9
3538
Louise Creek
trib
utar
y No
. 2 near Lark,
E9
N. Dak.
3539
Louise Creek
abov
e Flasher, N. Dak........
E935
40
Cannonball River
at Br
eien
, N. Dak........
E9
3545
Beaver Creek
at Linton,
N. Da
k...
....
....
. E8
3547
Spring Cr
eek
near
Linton,
N. Da
k...
....
...
E83548
Sand
Creek
near
Temvik,
N. Da
k...
....
....
. E8
3549
Spring Creek
near B
owman, N.
Dak..........
E93549.5
Spring Creek
trib
utar
y near B
owman,
E9N.
Dak.
See
foot
note
s at
end
of table.
356 69.2
13.0
22.4
1,240 33.4
1,710
221
456
2,'7 50
157
3,310
1943-63
1946-63
1955-64
1955-64
1905-21,1938,
1943-63
1950,1955-64
1904-63
1943-63
1895-1963
1947-63
1950-63
1924,1929-33,
1938-63
1,940
680
240
330
4,250
330
3,600
1,040
1,620
840
5,400
March
1943
Apr.
15,
1950
June 21
or 22
,19
57
June 12,
1960
June 21
or 22
,19
57
Apr.
16,
1950
Apr.
16,
1950
Mar.
24,
1947
Apr.
16,
1950
Apr.
17,
1950
Apr.
17,
1950
Apr.
17,
1950
Apr.
19,
1950
Apr.
4, 1952
f 20
18.3
11.98
10.93
6.34
28.05
15.05
a 21.5
17.9
5
30.7
2
0.7
0
12.5
2
3.6
4
a 2
5.7
5
5,260
6,100
1,360
1,200
23,400
4,300
25,000
11,100
20,200
29,200
5,910
30,500
10 *1.68
*1.06
19 *1.04
*1.48
26 *1.21
*1.41
27 17
Apple
Creek basin
16.5
n1,180
1955
-64
1946
-63
155
1,85
0
June
6, 19
56
Apr.
18
, 19
50
7.92
17,0
7
798
6,750
14
7.9
Cannonball River basin
580
1,140
553
1,340
.76
7.70
110
4,100
1950-63
1889-1963
1950-63
1943-63
1955-64
1956-64
1956-64
1955-64
1900-63
1,860
2,850
1,800
3,100
680
6,100
Apr. 16
, Ap
r. 17
, Ap
r. 16
, Ap
r. 17
, March
June 18
1964
March
March
March
1950
1950
1950
1950
1959
or 19
,
1959
1960
1960
Mar
. 30,
1956
A
pr.
19,
1950
26.1
34.0
f
23 26.5
a
4.6
9
4.6
8
a4.7
7
4.2
0
3.3
0
10.4
022.3
0
20
,30
05
1,8
00
27
,40
048,0
00 18 946
94
,80
0
*1
.24
*2
.06
*1.7
3*1.7
6
3.0
*1
.77
Beaver Cr
eek
basin
n 617 22.9
23.3
1943
-63
1955
-64
1955
-64
1,26
0188
190
Apr.
8, 1952
June
6, 19
56Ma
r. 22,
1959
June
18,
1962
17.50
8.18
a 5.65
4.42
9,800
2,790
1,670
35
*1.69
"ive
r ba
sin
51.2
11.4
1955-64
1955
-64
424
172
June
18,
1964
July
19
58
June
18,
1964
5.80
6.78
265 80
1.7
1.4

Table 1. Maximum stages an
d discharges at
ga
ging
stations Continued
Gagi
ng station
Floo
dregion
and
hydr
o-logic
area
Drainage
area
(sq ml)
Mean
sl
evat
lc
(feet)
Period of
know
n fl
oods
(water yea
rs)
Area
l 02
.33
(cfs)
Maxi
mum
floo
d
Qage
heig
ht
(feet)
Discharge
Cfs
Recu
r
renc
e In
terv
al
(years)
Grand
Rive
r basin Continued
North
Pork G
rand River
at Haley, N.
Da
k...
E935
50
3552
Buffalo
Creek
trib
utar
y near B
uffa
lo
E9Sp
ring
s, N.
Dak.
3555
North
Pork
Grand
River ne
ar White Butte,
S. Dak.
3560
South
Pork
Grand River
at Bu
ffal
o,S. Dak.
3560
.5
Wide
Sandy
Creek
near Buf
falo
, S. Dak.....
E93565
South
Pork
Grand
River ne
ar Cash,
S. Dak..
E9
3575
Gr
and
River
at Sh
adeh
lll,
S. Dak..........
E935
80
Grand
River ne
ar W
akpa
la,
N. Dak..........
E935
84
Clay
more
Creek
trib
utar
y No
. 2 ne
ar Trail
____
City
, S. Dak.___________________
3585
.2
Deadman
Creek
trib
utar
y near Mobridge,
E9
S. Dak._________________
3587
.5
North
Pork
Mo
reau
Ri
ver
trib
utar
y near
E9Redlg, S.
Dak.
3590
More
au River
at Bl
xby,
S. Dak.............
E93595
More
au River ne
ar Paith, S. Dak...........
E936
00
More
au River near Ea
gle
Butte, S. Dak..
3605
Moreau River near Whl
teho
rse,
S. Dak...
3610
Mo
reau
Ri
ver
at Pr
omis
e, S.
Dak...........
E9
3860
Lanc
e Creek
at Sp
ence
r, Wy
o...
....
....
....
B8
3865
Chey
enne
River
near Sp
ence
r, Wy
o...
....
...
B83940
Beaver Creek ne
ar N
ewca
stle
, Wy
o...
....
...
3950
Chey
enne
River
at Edgemont,
S. Da
k...
....
. B8
3997
Pine Creek ne
ar Ar
dmor
e, S. Dak...........
B840
00
Hat
Creek near Edgemont,
S. Dak...........
B840
05
Chey
enne
River ne
ar Hot
Spri
ngs,
S. Da
k...
B8
509 3.
39
1,190
148 38.8
1,35
03,
120
5,51
0.11
1912
-15,
1917
, 1946-63
1955-64
1946-63
1956-64
1956
,195
8-64
19
46-6
3 1943-55
1914
-16,
1929
-55
1956-64
1,750 82
2,85
0
805
360
3,100
5,20
07,
400
Apr. 15
, 19
50Apr.
7, 1952
June
9,
1958
Apr. 16
, 1950
June
14,
1963
June 1962
Apr. 15
, 19
50Apr. 16
, 19
50Ap
r. 18,
1950
May
18,
1962
17.10
6.17
20.0 9.01
6.66
15.4
019
.06
22.7
54.61
14,1
00 389
30,9
00
2,78
0
400
27,0
0058
,000
82,2
00(k)
39 *1.2
3
7.3
2.5
48 *1.27
*1.2
6
Deadman
Creek
basi
n
0.31
1956-64
June 17
, 1964
12.0
7180
More
au Ri
ver
basin
4.0
0
1,5
70
2,6
60
4,3
20
4,8
80
5,2
23
1956
,195
8-64
1949-53,1955-63
1944-63
1944-58
1953
-63
1955
-63
1929
-58
3,40
04,
700
6,30
0
6,80
0
7,100
May
1962
Apr.
1, 1952
Apr.
9, 1944
Apr.
9, 19
44Ju
ne 15,
1953
June 19
53May
22,
1962
Mar. 25
, 1947
Apr.
5, 1952
5.95
17.8
20.9
23.0
26.2
21.0
24.4
(k)
15,3
0026
,000
30,3
00
17,5
00
36,9
00
11 16 12
5.3
14Ch
eyen
ne River basin
2,0
70
5,2
70
1,3
20
7,1
43 5
.47
1,0
44
8,7
10
1948-54,1957-63
1949-63
1943
,194
5-63
1905
-63
1905,1929-32,
1947
-63
1956-64
1905
,195
1-63
1915
-20,
1943
-63
2,5
50
4,4
50
5,2
00
1,7
50
5,9
00
June 28,
1952
May
27,
1962
June
16,
1962
May
1, 1922
June
17,
1962
June
16
, 1962
May
23,
1954
May
12,
1920
8.3
8.74
19.9
812
.0 7.72
11.98
29.2
5,25
0 16
,000
11
,900
(k)
13,500
1,44
09,
430
114,
000
5.9
18 9.4
50
*3.6
3

4020
Fall River at
Hot
Springs, S. Dak.........
E84025
Beaver Creek near Buffalo Gap, S. Dak.....
E8
4060
Battle Creek at Hermosa, S. Dak...........
E84067.5
Sunday Gulch near Hill Ci
ty,
S. Dak.......
Ell
4085
Spring Creek near Hermosa, S. Dak........
4090
Castle Creek above Deerfield Reservoir,
Ell
near Hill Ci
ty,
S. Da
k.
4105
Rapid Creek above Paotola Reservoir, at
Ell
Silver Ci
ty,
S. Da
k.
4115
Rapid Creek below Paotola Da
m, S. Dak.....
Ell
4125
Rapid Creek above Canyon La
ke,
near Rapid
Ell
City
, S. Da
k.
4140
Rapid Creek at Rapid Ci
ty,
S. Dak.........
Ell
4215
Rapid Creek near Parmingdale, S. Dak......
Ell
4235
Cheyenne River near Wasta, S. Dak........
4255
Elk Creek near Elm Springs, S. Dak........
E9
4260
Belle Pourche River near Moororoft, Wyo...
E8
4265
Belle Pourohe River below Moororoft, Wyo..
4280
Belle Pourche River at Hu
lett
, Wyo........
4285
Belle Pourohe River at
Wyoming-South
Dakota State li
ne.
4305
Redwater Creek at
Wyoming-South Dakota
Ell
State li
ne.
4315
Spearfish Creek at
Spearfish, S. DaK......
Ell
4322.3
Miller Creek near Whitewood, S. Dak.......
Ell
4330
Redwater Creek above Belle Pourche, S. Dak. Ell
4335
Hay Creek at
Belle Pourohe, S. Dak........
Ell
4355
Belle Pourohe River near Belle Pourohe,
S. Dak.
4360
Belle Pourohe River near Prultdale,
S. Dak.
4370
Belle Pourohe River near Sturgis, S. Dak..
B
4371
Boulder Creek near Deadwood, S.
Dak.......
E94375
Bear Butte Creek near Sturgis, S. Dak.....
E94380
Belle Pourohe River near Elm Springs,
BS.
"a
k.
4385
Cheyenne River near Plainview, S. Dak.....
B
See
footnotes at
end of
table.
137
130
178 5.
72199 83 292
320
371
410
602
12,800
540
1,380
1,670
2,800
3,280
471
168 6.
72920
121
4,310
4,540
5,870 1.
69192
7,210
21,600
1938-63
1927-63
1938-63
1950-63
1956-64
1950-64
1949-64
1954-64
1920
1929-42,1947-63
1947-64
1905-6,1920-63
1905-6,1943-63
1947-58,1960-63
1915-63
1915,1929-32,
1934-63
1920-63
1950-63
1908-32
1924-32
1944-63
1882-1951
1929-32,1938-51
1947-63
1929-31,1936-37
1955-64
1904-64
1956-64
1946-63
1954-64
1924,1927-43
1946-58,1960-63
1946-63
1956-63
1946-64
1927-63
1929-63
1920-63
1951-63
520
510
610 20
134
330
350
390
420
560
12,300
1,800
2,040
1,950
2,500
2,700
460
222 23
740
178
3,000
7,200
950
12,500
22,800
Sept.
4, 1938
1927
Sept.
4, 1938
May
2, 1952
April
1957
May
23,
1952
May
22,
1952
July 28,
1955
May
12,
1920
May
22,
1952
May
23,
1952
May 12,
13,1
920
July 13,
1962
June 21,
1947
May
21,
1962
May 1920
May
6, 1932
May 1920
Mar. 29,
1952
June 1908
Apr.
7,
1924
May
27,
1962
Apr.
8,
1924
May
31,
1929
Mar. 26,
1943
June 18,
1962
June 16,
1962
June
5, 1904
June
9, 1964
June 16,
1962
June 22,
1964
Apr.
9, 1924
June 16,
1962
May
24,
1946
June 16,
1962
June 15,
1962
June 16,
1962
May 19
27
May
28,
1962
May 1920
May
26,
1957
May
22,
1962
18.4
18.0
16.46
14.00
3.55
4.56
5.81
t 7.75
6.74
8.08
13.6
8.37
9.77
f 16
11.28
f 17 10.61
f 15.0
14.33
18.7 8.90
11.95
7.00
3.48
11.69
7.05
11.25
14.32
8.46
12.45
21.8
14.31
f 17.50
11.65
13,100
(k)
11,700
2,950
(k) 580
615
1,520
(k)
2,190
2,600
(k)
3,300
2,640
(k)
d 46,300
(k)
8,540
(k)
g!2,500
4,420
(k)
d 6,320
4,400
2,340
f 5,000
275
16,400
530
d 22,400
7,840
17,900
210
12,700
(k)
37,900
(k)
41,700
*2.86
*2.61
12 11 11 22 24 36 12 12 19 13.1
*2.56
*1.36
*2.51
6.2
*1.52
13 4.8

Tabl
e 1. Maximum st
ages
an
d discharges at ga
ging
st
atio
ns C
onti
nued
No.
Gagi
ng station
Floo
d
and
hydro -
logic
area
Drainage
area
(sq
mi)
Mean
elev
atio
n ( feet
)
Peri
od of
know
n fl
oods
(w
ater
years)
Areal
Q2.3
3 (o
fs)
Maximum
floo
d
Date
Gage
height
(fee
t)
Disc
harg
e Recu
r
renc
einterval
(yea
rs)
Cheyenne Ri
ver basin Continued
4390
4390.8
4395
Cherry Cr
eek near Plainview, S. Dak. ......
Cher
ry Cr
eek
trib
utar
y No.
3 ne
ar A
vanc
e,
S. Dak.
Chey
enne
Ri
ver
near
Eag
le Butte, S. Da
k...
E9
E9 B
1,19
0 4.58
24,5
00
: -
1946-63
1956-64
1920-63
1929-63
2,850
24,500
Apr.
1,
1952
May
21,
1962
May
13,
1920
May
24,
1933
22.63
6.96
18.9
15.0
17,500
2,280
104,000
20 27
Missouri River main stem
Missouri River at
Pi
erre
, S. Da
k.243,500
1930-63
Apr.
10,
1952 |
25.55 I
440,000
Bad River basin
4405
4415
North Pork Bad River at
Philip,
S. Dak....
Bad
River
near
Port Pierre,
S. Da
k. .......
E9 E9
164
3,10
7
- _ -
1927-44
1939-44
1905-63
860
5,200
May 19
27June
4, 1942
July 1905
18.2
14.7
f 32
.9
(k)
1,640
f 70,000
-4.1
*1.53
Mush Creek basin
4416.5
E914.6
-1956-64
198
Aug.
10,
1956
7.49
3,620
*2.08
Unnamed Missouri River tributaries
4416.7
4417.5
Missouri River tributary near Pi
erre
, S.
Da
k.
Missouri River tributary near Canning,
S. Da
k.
E9
E9
0.42
.20
-
1956-64
1956-64
-
Aug. 10,
1956
May
18,
1960
10.38
7.40
705
284
-
Medicine Knoll
Creek basin
4420
Medicine Knoll Creek near Blunt, S. Dak...
Ell
455
-19
17
1950-63
450
1917
Ap
r.
5, 1952
f 15
1,830
9.1
Unnamed Missouri River tributaries
4420.5
Missouri River tributary near DeGrey,
S. Da
k.E9
1.64
-1956-64
-Au
g.
7, 1956
6.99
976
-
Medi
cine
Cr
eek
basi
n4423.5
4423.8
4424
North Pork Medicine Creek near Vivian,
S. Da
k.
Medicine Creek tributary near Vivian,
S. Da
k.
Medicine Creek tributary No.
2 near
Vivian, S.
Da
k.
E9
E9
E9
45.9
.30
8.62
-
1956-64
1956-64
1956-64
396
Apr.
3,
1960
June 15,
1962
Mar.
19,
1956
Mar.
26,
1960
7.05
9.72
a 6.67
4.80
1,080
302
475
5.7

4425
| Medicine Creek at
Kennebeo, S. Dak........
E9
4430
Missouri River at Chamberlain, S. Dak.....
4432
White River tributary near Gl
en,
Nebr.....
B84433
Deep Creek near Gl
en,
Nebr................
B84437
Soldiers Creek near Crawford,
Nebr........
B84439
White River tributary No.
2 near Crawford,
B8
Nebr.
4440
White River at
Crawford, Nebr.............
B84450
White River below Cottonwood Cr
eek,
near
B8Whitney, Nebr.
4455
White River near Chadron, Nebr............
B8
4455.3
Chadron Creek at
Chadron State Pa
rk,
near
B8Chadron, Ne
br.
4455.6
Chadron Creek near Chadron, Nebr..........
B84460
White River near Og
lala
, S. Dak...........
B84464
Cain Creek tributary at
Imlay, S. Dak.....
B94465
White River near Interior,
S. Dak.........
B9
4465.5
White River tributary near Interior,
B9S.
Da
k.
4470
White River near Kadoka,
S. Dak...........
B94495
South Fork White River near Rosebud,
B8S.
Dak.
4497
South Pork White River tributary near
B9Mission, S. Da
k.
4505
South Fork White River below White Ri
ver,
S. Dak.
4515
White River at
Westover, S. Dak...........
B9
4520
White River near Oa
ooma
, S. Dak...........
B9
4530
Missouri River below Fort Randall Da
m,S.
Dak.____________________
4535
Ponoa Creek at
An
oka,
Nebr................
B13
4536
Ponca Creek at
Verdel,
Nebr...............
B13
1,620
April
1952
17.0
Mar.
28,
1960
16.71
(k)
8,970
16
Missouri River main stem
250,800
1929,1943,
1945-54
Apr.
11,
1952
25.55
440,000
White River basin
7.97
10.9
52.6 5.45
313
676
750 3.35
14.9
2,200 14.0
4,120
.14
5,000
n 760 2.
62
n1,310
7,850
10,200
1953-63
1953-63
1955-63
1953-63
1918-44,1948-63
1949-61
1931-43,1947,
1949-52
1953-63
1953-63
1944-63
1956-64
1905-6,1912-18,
1929-32,1940-42
1956-64
1942-63
1944-63
1956-64
1930-32,1939-40,
1950-63
1913-18
1929-63
121
302
850
1,340
1,420
144
2,650
194
6,200
6,950
1,430
9,200
10,800
July 31,
Aug.
15,
July 10,
July 10,
May
24,
Aug.
20,
May
20,
June 22,
July 13,
June 11,
June 21,
June 15,
May
1,
1962
1953
1958
1958
1960
1944
1957
1947
1963
1962
1947
1962
1942
June
8, 1964
June
4, 1942
May
17,
1944
June 1962
Mar. 28,
1952
Mar. 22,
1960
Apr.
4,
1915
Mar.
22,
1917
Mar. 31,
1950
Mar. 30,
1952
14.4
014.9
221.9
011.2
9
14.4
20.0
9
19.1
12.1
2
14.4
723.5
01
1.5
712.4
16.2
413.9
2
10.1
5
a 10.9
0
6.6
6
13.0
ad
lS.l
a
17.6
15.4
0
435
3,0
50
3,9
70
698
f1,7
00
4
,48
0
5,5
00
188
2,7
40
5
,20
0(k
) 17,1
00
55
8
f 3
2,0
00
4
,47
0
646
6,0
50
d
15,2
00
51
,90
0
*4
.73
*2.4
7
*1
.62
5.6
16 *3
.57
5
.5
33 14
4.0
38
Missouri River main stem
263,500
1881-1963
1948-63
April
1881 f21.5
Apr.
12,
1952
20.82
(k)
447,000
Ponoa Creek basin
410
820
1949-63
1958-63
2,150
3,400
Mar.
27,
1960
Mar. 27,
1960
16.86
15.10
9,810
15,700
32 34
Nlobrara River basin
4540
Nlobrara River at
Wyoming-Nebraska State
line
.
See
footnotes at end
of ta
ble.
1956-63
June 17,
1962
Jan.31or Peb.1,
1963
5.84
a 6.47

Table 1. Maximum stages and
discharges at ga
ging
stations Continued
No.
Gagi
ng station
Floo
dre
gion
and
hydro -
logic
Drai
nage
area
(sq
mi)
Mean
elev
atio
n (feet)
Peri
od of
know
n floods
(wat
er y
ears
)
Area
l02
.33
(cfs
)
Maxi
mum
floo
d
Date
Gage
heig
ht(f
eet)
Discharge
Pf*a
Recu
r
rence
inte
rval
(years)
Niob
rara
Riv
er bas
in C
onti
nued
4541
4545
4563
4572
4575
4578
45
85
4615
4620
4631
4632
4633
4640
4654
46
55
Niobrara River
abov
e Bo
x Bu
tte
Rese
rvoi
r,
Nebr.
Antelope Cr
eek
tributary
near Gordon, Nebr.
Niobrara River
near Sparks,
Nebr ..........
Niob
rara
River
near N
orde
n, Nebr. .........
Bone Creek
tributary
near Ainsworth, Ne
br.
Bone Creek
tributary
No.
2 near Ainsworth,
Nebr.
Sand
Draw
tribut
ary
near Ainsworth, Nebr
..
Keya
Pa
ha R
iver near Hi
dden
Timber,
S. Dak.
Blac
kbir
d Cr
eek
tributary ne
ar O'N
eill
, Ne
br.
_ ~
B8 B8 B8
_ _
B8
All
B8 B13
B13
B13
B8 B13
B13
B13
B
_
3.07
34.0
2,59
5 26.6
6,40
6
.39
2.18
1.07
390
320 2.
54
1.65 .60
10,9
00
_ - _ - - - -
1947-63
1953-63
1948
-63
1946-63
1953-63
1956-63
1958-63
1956
-63
1948-53
1939-40,1950-63
1928-36,1938-63
1958-63
1958-63
1958-63
1938
-40,
1959
-63
205
660
2 050
860
1,76
0
10,8
00
11,0
00
July
28,
1951
June
17,
1955
Mar.
14
, 19
53
Feb.
7, 19
63
Mar. 22
, 1960
Mar.
5, 1949
Mar.
1,
19
63
July
1,
1962
Feb.
8,
1963
June
27
, 1960
June
30
, 1962
June
30,
1962
Mar.
24,
1950
Mar.
30
, 1952
Mar.
25,
1950
Mar.
31
, 1952
Har.
23,
I960
July
1,
1962
Mar. 12
, 19
55
Mar.
27
, 1960
July
11
, 1962
Mar.
27
, 1960
July 11
, 1962
July
26
, 1958
Mar.
27
, 19
60
10.3
0
16.69
da5.20
6.96
8.00
6.73
a 9.
07
7.10
a 7.
83
11.8
5 13
.29
14.4
10.8
7
a 13
.513
.08
a 13
.34
10.9
1 12
.16
14.7
4
a 12. 80
10.6
8 12.81
10.1
0
461
1,90
0
u 3,
170
1,10
010,200
7,38
0
202
640
747
2,71
0
5,43
0
9,28
0 27
,400 85 68
.9
94
39,0
00
-
*1.7
4
*1.36
4.1
14 13
8.8 -
18

Bazi
le Creek
basin
4665
B15
440
-1951-63
7,50
0Ju
ne 16
, 19
5719
.96
68,600
*1.7
2Mi
ssou
ri River
main
st
em
4675
-279,500
-18
81-1
963
1931
-63
- 1 A
pr.
5, 1881
1 Apr.
13,
1952
a30.5
1 (k
) 1
15.5
1
480,000
1Ja
mes
River
basin
4676
46
76.5
4678
4680
4685
46
95
4696
4700
47
02
4703
47
04
4705
47
10
4710
.5
4712
4713
.5
4714
47
14.5
4715
4720
4725
4730
4735
4737
4738
4738
.2
James
River
trib
utar
y ne
ar M
anfred,
N. Da
k.
Jame
s River
trib
utar
y No
. 3 ne
ar Manfred,
N. Da
k.
Minneapolis
Plats
Creek
trib
utar
y near
Eldridge,
N. Dak.
Beaver Creek
trib
utar
y near E
ldridge,
N. Da
k.
Buff
alo
Creek
trib
utar
y near S
ydney,
N. Da
k.
Elm
River
trib
utar
y near Le
ola,
S. Da
k...
. Ma
ple
River
at North
Dakota-South D
akot
a St
ate
line.
Willow Creek
trib
utar
y near L
eola
, S. Dak.
Willow Cr
eek
trib
utar
y ne
ar B
arna
rd,
S. Da
k.
West
Br
anch
Sn
ake
Creek
near
Athol,
S. Da
k.
Matter Creek
trib
utar
y near Or
ient
, S. Da
k.
Ell
Ell
Ell
E E Ell
Ell
E Ell
Ell
Ell
E E Ell
Ell
Ell
Ell
Ell
Ell
E Ell
E Ell
Ell
Ell
Ell
n50
n37.2
n 20
n406
n 1,
140
n 475 9.
91
n 1,
890 .19
92.2
26.2
2,94
0 n4,050
14.7
n 480
552 3.
74
.18
n 1,
170
n 6,
070
n470
n6,810
n 1,
090
n 1,
770 5.
41
45.1
-
1950
,195
5-64
19
55-6
4
1955
-64
1925
-63
1951
-63
1953
-63
1950
-64
1955
-64
1897
-196
3 19
55-6
4
1955-64
1955
-64
1882
-196
3 1946-63
1956
-64
1957-64
1956-64
1956
-64
1956
-64
1947
-63
1956
-63
1946-63
1950-63
1956-63
13Rf
i-fi
4
1956-64
95
76 50 160
200
470 30
600
143 60
600
600 40
470
520
890
600
460
600
840
1,19
0 ?n 88
Mar. 27
, 1960
March
1960
Apri
l 1956
March
1960
Apri
l 1948
Apr. 12,
1951
Apr.
3, 1960
Apr. 13,
1960
Ap
r.
9, 19
50
Apr. 17
, 1950
July 6
or 7,
1962
May
13,
1950
July 19
or 20,
1962
July
8, 19
62
June
6,
1956
Feb.
28,
1958
May
16,
1950
May
24, 25, 1950
May
3, 19
64
July
9,
1962
July
10,
1962
Ma
y 3, 19
64
Apr.
5,
19
60
Apr.
8, 1952
May
14 or 15
, 1950
Apr.
19,2
0,19
52
Mar. 28
, 1962
May
19,
1950
Apr.
23,2
4,19
52
Apr.
9, 1952
Apr.
9, 1960
Mar.
v>,
iQ6n
Mar.
30,
1960
Mar. 27
, 1962
6.15
2.70
a3.98
2.70
f 13 10
.16
37.6
2 all. 89
10.77
3.36
15.8
2 5.55
7.66
6.16
a 6.
58
15.3
4 16
.89
8.62
10.97
9.72
2.58
2.59
20.1
0
18.1
3 10
.53
19.59
a!6.
42
12.8
77.41
5.12
a 5.47
555
(K) 70
840
293
4,48
0 60
6,39
0 45 700
130
5,73
0 5,
420
418
2,03
0
2,80
0 33
20
7,52
0 5,
580
637
5,17
0
2,20
0
1,15
0 3?5
870
18 3.0
14
3.1
*1.08
4.2
*1.2
1
12 4.6
*1.0
9 *1
.03
*1.1
9 10 15 45
*1
.06
3.0
47
5.4
2.1
*i.es
*1.1
2

Table
1. M
axim
um st
ages
an
d discharges at ga
ging
stations Continued
No.
Gagi
ng station
Flood
regi
on
and
hydro -
logic
area
Drai
nage
ar
ea
(sq
mi)
Mean
el
evat
ion
(fee
t)
Period of
kn
own
floo
ds
(wat
er y
ears)
A re
al
02.3
3 (c
fs)
Maxi
mum
floo
d
Date
Gage
heig
ht
(feet)
Disc
harg
e
Cfs
Recu
r
renc
e in
terv
al
(years)
James
Rive
r basin Continued
4738.5
4738.8
4745
4750
4755
4760
4765
4770
Shaefer
Creek
trib
utar
y near Or
ient
, S.
Da
k.
Shaefer
Creek
trib
utar
y ne
ar M
ille
r,
S. Dak.
James
River
near Fo
rest
bure
. S. Dak. ...
...
Ell
Ell
Ell
E Ell
E B12
E
6.08
5.75
1,54
0 nlO,200
225
n!2,
010
240
n!3,810
:
1956
-64
1956
-64
1946-63
1950-63
1956
-64
1881
-196
3 19
29-3
2,19
44-6
3 1950-64
1920
-63
21
20
1,08
0 1,
040
275
1,33
0 750
Mar. 30,
1960
Mar. 30,
1960
Apr.
10,
1952
Apr. 11
, 1952
Mar. 29,
1962
Apri
l 1881
Apr.
2, 1962
Mar. 28
, 1950
Mar. 28,
1960
Marc
h 19
20.
6.12
4.61
15.5
1 22
.12
9.16
19.8
15.8
0 a!
4.1
13.3
5 f 18
221
(k)
6,42
0 6,
100
772
(k)
6,250
2,24
0 (k
)
*1.19
18
18 5.7
12
12
Verm
illi
on River
basin
4788
.2
4788
.4
Sadd
lero
ck Creek
trib
utar
y ne
ar Be
resf
ord,
S. Dak.
Sadd
lero
ck Creek
near
Be
resf
ord,
S. Dak...
B12
B12
B12
2.32
26.3
-
1956-64
1956
-64
156
May
18,
1962
Apr.
1, 1960
Mar. 31
, 1962
6.69
94
1,10
0
8,66
0
*1.3
2
12
Big
Sioux
River basin
4792
4792.3
4792
.4
4792.6
Big
Sioux
River
near Ortley,
S. Dak.......
Big
Sioux
River
trib
utar
y ne
ar S
ummi
t,S.
Da
k.Big
Sioux
River
trib
utar
y No
. 2 near
Summit,
S. Dak.
Big
Sioux
River
tributary
No.
3 near
Summit,
S. Dak.
B B12
B12
B12
53.8 1.27 .26
6.60
_ - - -
1956-64
1956-64
1956
-64
1956
-64
175 58
July
1, 1962
Apr.
2, 1956
Apr.
6,
19
56Ju
ly
1, 1962
July
1,
1962
5.73
a 4.99
3.10
5.16
10.6
8
950
M (k) (k)
*1.02
- - -

4795
Bi
g Sioux
River
at Wa
tert
own,
S. Da
k...
...
B
4797
.5
Peg
Munky
Run
near
Es
tell
lne,
S. Da
k...
...
B13
4798
Nort
h De
er Cr
eek
near
Es
tell
lne,
S. Da
k...
B13
4799
Slxm
ile
Creek
trib
utar
y ne
ar Brookings,
B13
S. Da
k.
4799
.5
Deer Creek near Brookings, S. Dak.........
B13
4800
Bi
g Sioux
Rive
r near B
rookings,
S. Dak....
B48
10
Big
Siou
x River
near Dell Ra
pids
, S. Dak..
B48
15
Skun
k Creek near Sioux
Pall
s, S. Da
k...
...
B13
4821
Big
Sioux
Rive
r near Brandon, S. Dak......
B48
28.7
Li
ttle
Beaver Creek
trib
utar
y near Canton,
B13
S. Da
k.4834.1
Otter
Creek
north
of Si
bley
, Iowa.........
B14
4834
.2
Schu
tte
Creek near Si
bley
, Iowa...........
B14
4834
.3
Otter
Creek
at Si
bley
, Iowa...............
B14
4834
.4
Dawson Creek near Sibley,
Iowa
....
....
....
B14
4834
.5 Wagner Creek
near
Ashton,
Iowa
....
....
....
B14
4834
.6
Otter
Creek
near
Ash
ton,
Iowa.............
B14
4835
Rook River ne
ar Ro
ok Valley,
Iowa.........
B14
4840
Dry
Creek
at Hawarden,
Iowa...............
B14
4855
Bi
g Si
oux
River
at Akron, Io
wa..
....
....
..
B
4860I Missouri River
at Sioux
City
, Iowa........ I-
n400 25.4
48.3
9.42
4.21
n 2,450
n 3,090
520
n 3,840.22
11.9 1.43
29.94.35
7.09
88.0
1,600 48.4
n 7,060
1956-64
1956-64
1956-64
1956-64
1954-64
1891-1963
1949-63
1881-1963
1956-64
1952-63
1952-63
1952-63
1952-63
1952-63
1952-63
1897-1963
1948-63
1926-63
1948-63
1929-63
340
520
176
104
2,400
3,000
2,500
4,300
430
123
750
235
320
1,420
1,000
12,200
Apr.
4, 1952
Apr.
9,
1952
Apr.
6, 1960
July
4, 1962
July
4, 1962
June
7, 1961
Mar.
29,
1962
Mar.
30,
1962
June 17,
1957
Mar.
31,
1962
May
21,
1959
Mar. 31,
1962
June
7, 1953
June
7, 1953
June
7, 1953
June
7, 1953
June
7, 1953
1897
Mar.
30,
1962
September 1926
June
7, 1953
Mar.
31,
1962
6.68
7.61
6.68
5.83
12.95
15.14
17.78
19.93
3.78
8.49
5.15
9.82
6.21
5.37
12.16
17.0
16.91
18.0
17.5
722.08
2,220
1,080
590
820
194
10,600
18,400
29,400
17,100
(k)
1,410
503
5,400
4,290
2,840
17,400
(k)
28,400
(k)
10,900
54,300
43 142.5
34
5.0
30 *1.15
*2.21
23 15 24 *1.35
*3.43
*1.66
*2.30
18 *2.40
3CMissouri River main stem
314,000
- I
1879-1963
Apr. 14,
1952 [
24.28 [
441,000
* Ra
tio
of pe
ak di
scha
rge
to that of 50
-yea
r fl
ood.
a Backwater
from
ice.
b In
gag
e we
ll;
7.33
ft,
from
outside
gage
.c
Result of
dam
failure.
d Ma
ximu
m observed.
e Affected by
da
m fa
ilur
e.f
About.
g Es
tima
ted.
h Maximum
daily
i At
present
site and
datu
m.
J Includes an
es
tima
ted
50 cfs
in by
pass
channel.
k No
t de
term
ined
.m A
t site an
d da
tum us
ed 19
45 to
19
49.
n Does not
Include
noncontributing
drai
nage
ar
ea.
p Does not
incl
ude
abou
t 700
to 1,
000
cfs
over
flow
in
to Lo
dge
Creek.
q Wa
s probably higher
seve
ral
days earlier.
r Does not
include
some po
ssib
le by
pass
flow.
s Site and
datu
m us
ed 1932-56.
t At site and
datum used 1932-42.
u Ca
used
by
release
of st
orag
e behind te
mpor
ary
construction dike.

48 MAGNITUDE AND FREQUENCY OF FLOODS, PART 6-A
"8ol-(
IM
1i
4)
1?
50aS
4) O r-C-~ C a) a5 > k S E, fflf< 0) 4)3*> (>»o C»--fS H
b
<2 oj1o
aIMo
01 -p
s
r-l (0--~ffl£«:
g H 0) p U)3 ") cXi C H Htl ffl C P tnS 10oo
§H*>a)C
01p01 o *o4)Offlr-1a o §
§ S*>
CO
O 09
if"rs_^
OH> E0 o1
09
d o o oOH kH ffl O W'd'd to 4)
t-H 4) C >»O ti fe SK SxIrH ffl
O
11-1
(O
IO
o 1-1o 1-1
ffl
(O (O<n
r-i
I
0COCO
0enrH
090) rH
IO
1
t_3
oPK o£O .p
IIc «
EHa >T3 4)
^sj-P CgCOM
fc<M
4) O
Red Rock Rlv northwest
(Oo
i-i
cnffl
4>4)
O
P.4)
1CO
'
CO
ol-(
COen
IO
i
rH
en
O
09ffl01X!
§09
0)rH
ffl
$-tO
ta t*0)
In
O*-P
4>P
Sand Creek, t: Sapplngton
(0o
CM
c HmfflXI
it 4)55
co09
~H
4)
1
1
OCOCO
IO en
N
.
I
I
094)rH
B
N
rH
oSOrH
09
1
w. .
CO -P
S3O *
n0 r.H|>
oS o>
-P r<
X! 009 ffl -P tS 09
0)r(Oo
(0
nfflXI
0)>
§09
"O
1 1
IO(O
in r-i
oo ooON
XI XI
en enIOIOen en
r- r-
. .
II
00ooCO CO
rHrH
-fin00en en
.PCSlfi
t a3
4)C §O CO p A09
O 01r-t W>r-( XICD O(XW ^
P B-P09 0 C
fc E «ffl ffl W)
C &H-Pi-1
O IS
tfl-P O
WO 09
-PIO 3fflrH.fi
Madison Rive Madison Rive 8 miles no
(0(0oo
»
£*H09fflXI
4) J>Wi O
kffl(Xi
^o
ba,
i i
N 0
3 0
o en en -*
CO COin in en en
co r-
0) !»
1-3 rj
1 1
(0 -*
l-(
ma>rH
B1/5 X!
-p
* E *# g
« £
* g
o gr-t 4J
* 09-P^ P.C
rH <n S"J rH >
o g SL4> 4)" ffl 09
g O-rt^ «W^ 4)<HCO S -P O
A tlC ffl-P
H « 3 affl cr ii)
D 11) ffl01 r-( 09& 01 X! 01 OK OrH
H«H 3 Ecoo rl N
4) B ClJ M 01 -H C MS ^i ffl
1-1 CO
< <
co r-
rl 09fflXI
0)
O
fflo<^
^0 H
£
0)
p
3
IO (0
s1
enCO
CO
sin
COen
en
4)
1-3
0CMCO
1-1CO(O
g
O tn
"3 §
0 0)m U
-p
^ c
O 0
rH0)
«rH
4)
O IM
r-( fflOX!
pisffl CO
0) 4)« oo CH
ffl -pa> -P n
!>>8. E
O 0) 4)
(Xi o o
rH 1-1 1-1 4J O O
<
CO
no3 ^ *> o
XlOfflA! rH 4) en

13
B2South
Fork
Dearborn River ne
ar Cr
aig,
Mont.,
lat
47°09'40", lo
ng 112°13'00".
32.0
360
June
8,
1964
1,230
38.4
16
Smith Ri
ver
basin
14 15
A4 A4
Smith
River
a quarter
of a
mile
up
stre
am fr
om Fi
vemi
leCreek
and
8 miles
nort
heas
t of
White Sulphur
Springs,
Mont
.Hound
Creek
at co
unty
bridge,
I mi
le up
stre
am fr
om mou
thand
abou
t 7 miles
sout
hwes
t of
Eden,
Mont
.
73.2
232
198
440
Apr. 11
, 19
36
June
4,
19
53
1,86
0
7,500
25.4
32.3
*3.0
8
*5.6
0
Hardy
Creek
basin
16B2
|
Hardy
Creek ne
ar C
asca
de, Mont., l
at 47°
11 '00", lon
g 111°48'40"
9.46
-Ju
ne
8, 19
64440
46.5
|
Sun Ri
ver
basin
17 18 19
Al Al Bl
South
Pork
Sun River
1 mi
le up
stre
am from co
nflu
ence
with
North Fo
rk Su
n River
and
24 miles
nort
hwes
t of
Augusta, Mo
nt.
South
Pork
Willow
Creek near Augusta,
Mont., lat
47 "30 '58",
long
11
2°31
'05"
.Sun
River
north
of Au
gust
a, Mo
nt.,
la
t 47°32'40",
long
112
021'50".
252 26.9
827
2,97
0
570
7,15
0
June
8,
19
64
June
8, 19
64
June
9,
1964
28,8
00
2,79
0
46,7
00
114
104 56.5
*3.04
*1.6
1
*1.23
Belt Creek
basin
20A2
Belt Creek
in SE£ s
ec. 25
, T.
20 N.,
R.6
E.,
abou
t 5j m
iles
nort
h of
Belt,
Mont.
678
3,05
0Ju
ne
4, 19
5315
, 60
023
.0*1.68
Highwood Creek
basin
21A4
Highwood Creek
near ce
nter
of sec. 24,
T.21 N.,
R.7
E.,
2 miles
sout
heas
t of
Highwood,
Mont
.-
-Ju
ne
4, 19
539,
210
--
Mari
as River
basin
22 23 24 25 26 27 28 29 30
Al Al Al Al Al Al Al B3 B3
Two
Medi
cine
Creek
abov
e Trick
Fall
s, ne
ar E
ast
Glacier,
Mont., lat
48°30',
long 11
3°22
'.Dr
y Fo
rk Two
Medi
cine
Creek ne
ar East Glacier, Mont.,
lat
48°3
0'45
", lo
ng 113°23'30".
Two
Medi
cine
Creek near E
ast
Glacier, Mo
nt.,
lat
48°29'30", long 11
3°15
'40"
.South
Pork
Two
Medi
cine
Creek ne
ar E
ast
Glac
ier,
Mont .
,la
t 48°24'15", lo
ng 113°09'45".
North
Pork
Birch
Creek near Dupuyer,
Mont.',
lat
48°1
0'00
", long 11
2°55
I40"
.South
Pork
Birch
Creek ne
ar D
upuy
er,
Mont .
, lat
48°07
' ,lo
ng 112°54'.
Blac
ktai
l Creek
1 mi
le ups
trea
m fr
om br
idge
on U
.S.
High
way
89,
12 mi
les
northwest
of Du
puye
r, Mo
nt.
Cartwrig
ht Co
ulee
at hi
ghwa
y br
idge
on Valie
r-Dupuyer
road
8 miles
west
of
Valier,
'-lent.
Laug
hlin
Co
ulee
in
SW£
sec.
2,
T.29 N.
, R.6
W.,
4 mi
les
west
of
Valier,
Mont.
26.8 7.66
51.1
78.2
19.0
25.3
62.7
21.8 8.4
560 -
910
1,24
0
435
540
1,06
0
165 -
June
8,
1964
June
8,
1964
June
8,
19
64
June
8, 1964
June
8, 19
64
June
8,
1964
(d)
(d)
June
8, 19
64
13,6
00
3,94
0
63,5
00
25,6
00
8,89
0
9,77
0
4,68
0
3,58
0
912
507
514
1,240
327
468
386 74.6
164
109
*7.9
5
-
*22.
8
*6.77
*6.68
*5.9
2
*1.1
5
*4.0
2
-
See
foot
note
s at end
of table.

Tabl
e 2. Peak di
scha
rge
at miscellaneous
site
s an
d outstanding
floods at
short-term ga
ging
stations Continued
No.
Floo
dre
gion
and
hydro-
logi
car
ea
Stre
am and
plac
e of de
term
inat
ion
Cont
ribu
ting
dr
aina
geare
a
(sq
mi)
Are
al
Q2.
33
(cfs
)
Maximum
floo
d
Disc
harg
e
Cfs
per
sq mi
Recu
rren
cein
terv
al(years)
Marias River
basin--Continued
31 32 33 34 35 36 37 38 39 40 41 42 43 44
B3 B3 B3 B3 B3 B3 B3
-
B3 B3 B3 B3 B3 B3
Woods
Coul
ee at
culvert
on co
unty
road 7
miles
southwest
ofDu
puye
r, Mo
nt.
Two
Medi
cine
Cr
eek below
Birch
Creek
near
Ethridge,
Mont.,
lat
48°1
8'50
", lo
ng 112°13'40".
Will
ow Creek
at Browning,
Mont
., la
t 48°33'40",
long 113°02'00".
North
Pork
Dr
y Po
rk Marias River
near
Dupuyer, Mont.,
lat
48°0
9',
long 11
2°28
'.Heines Coulee tr
ibut
ary
near
Valier,
Mont
., la
t 48°15',
long
11
2°14
' .
Lone Ma
n Coulee in N
Ejj-
sec. 34,
T.29 N.
, R.5
W.,
upst
ream
from
Mi
ller
's Coulee and
6 miles
sout
h of
Va
lier
, Mo
nt.
Mill
ers
Coulee in SE£ s
ec. 27
, T.29 N.
, R.
5 W.,
5 mi
les
sout
h of
Valier, Mont .
Dry
Pork
Marias River
at br
idge
on U
.S.
Highway
91,
3 mi
les
north
of Co
nrad
, Mont.
Infl
ow t
o Tiber
Rese
rvoi
r, Mo
nt.,
la
t 48°19',
long 111°06'.
Pond
era
Coulee ne
ar Chester, Mont., la
t 48°16'10",
long 111°08'30".
Bruc
e Co
ulee
tr
ibut
ary
near
Choteau, Mont., la
t 47
°44'
,lo
ng 112°15'
.Teton
River
below
Deep Cr
eek,
ne
ar Choteau, Mo
nt.,
lat
47°49'15", long 112°04'30".
Muddy
Creek
near
Collins, Mont., la
t 47°57'40",
long 111°51'45".
Teton
River
near
Carter,
Mont., la
t 47°51'15",
long
110°58'20".
3.7
1,28
8 23.6
20.2 .6
0
11.4 1.7
264
f 4,
405
598 1.
7
443
385
1,76
2
-
2,25
0
170
157 -
108 - -
5,00
01,
380 -
1,14
0
1,03
0
2,75
0
(d)
June
9, 1964
June
8, 1964
June
8, 1964
June
8, 1964
(d)
(a)
(d)
June
9, 1964
June
8, 1964
June
8, 1964
June
8, 1964
June
8, 1964
June
9,
1964
227
e 20
4,00
0
1,230
4,240 64
1,82
0
197
13,0
00
e g 15
3,00
01,
950
148
64,3
00
13,9
00
84,3
00
61.4 -
52.1
210
107
160
116 49.2 -3.26
87.1
144 36.1
47.8
- -
*1.3
6
*5.07
-
*2.5
3
- - -3
-
*10.
6
*2.5
3
*5.7
3
Judi
th River
basi
n
Arme
lls
Cree
k basin
Musselshell
River
basin
45B4
Big
Spri
ng Creek
in SW
£ sec. 23, T.
15 N.,
R.18
E.,
abou
t three-quarters of
a mi
le so
uth
of Lewiston,
Mont
.103
250
May
30,
1953
1,20
011.7
37
46B4
Armells
Creek
6 mi
les
upst
ream
fr
om m
outh an
d 20
mi
les
nort
heas
t of
Ro
y, Mo
nt.
370
610
June 16
, 1962
14,6
0039.4
*4.47
47 48
A3 B8
Jawbone
Creek
at cu
lver
t just north
of foot
ball fi
eld
inHar 1 owt on
, Mo
nt .
Alka
li Creek
at bridge on co
unty
road 7y mil
es no
rthe
ast
ofHeath, Mo
nt.
2.14
3.76
_ -
July
12
, 1962
July
15,
1962
749
757
350
201
_ -

49
B8
Musselshell River tributary 100 ft above mouth and half a
mile north of State Highway 6
at Ryegate, Mont.
.082
-July 18
, r958
352
1 4,290
-
Dry
Cree
k basin
50B8
Second Creek tributary at culvert on State Highway 22,
11 miles south of Jordan, Mont.
0.75
-Aug.
8, 1954
281
375
-
Milk River basin
51
52
53
54
55 56
57 58 59 60
61 62 63
64
65
66 67 68 69
B3
B3
B3
B3
B4 B4
B4
B3
B3
B3
B4
B4
B4
B4
B4
B8
B8
B9
B8
Live
rmor
e Creek
at br
idge
on St
ate
Seco
ndar
y Hi
ghwa
y 46
4,13
-ij mi
les
sout
heas
t of
Ba
bb,
Mont
.South
Pork Mi
lk Ri
ver
below
Live
rmor
e Cr
eek, near B
abb,
Mont.,
lat
48°4
5'00
", long 113°07'30".
Midd
le Po
rk Mi
lk R
iver at
culvert
on St
ate
Seco
ndar
y Hi
gh
way
464, 10 mi
les
east of
Babb,
Mont.
Dry
Pork
Mi
lk R
iver at
br
idge
on
St
ate
Seco
ndar
y Hi
ghwa
y 46
4,11
mi
les
east of
Babb, Mo
nt.
Sage Cr
eek
trib
utar
y at
culvert
on farm road,
? mi
le no
rth
east of
Hingham, Mont.
Spri
ng Coulee at
culverts on co
unty
road,
13 m
iles
so
uthw
est
of H
avre,
Mont
.Be
aver
Cr
eek
6 mi
les
sout
hwes
t of Havre, Mo
nt., and
10 mi
les
upstream from m
outh.
Red
Rock
Coulee in
se
c. 2,
T.33
N.,
R.
17 E.,
6 mi
les
nort
hwes
tof
Lo
hman
, Mont.
Middle Cr
eek
about
2 mi
les
upstream fr
om Middle Cr
eek
Rese
rvo
ir and
18 mi
les
northwest
of Govenlock, Sa
skat
chew
an.
Lodg
e Cr
eek
in SE
£ se
c. 32, T.
34 N
., R.19 E.,
4^ mil
es north
west
of
Chinook, Mont.
Thir
ty Mile Creek
in N
Vf£ se
c.l,
T.32 N.,
R.22 E.,
3 mi
les
nort
hwes
t of H
arlem, Mo
nt.
Balanger Creek
half
a mi
le upstream fr
om L
onep
ine
Cree
k an
d15 mi
les
nort
hwes
t of
Palisade,
Saskatchewan.
Dann
iel
Creek
at Highway
4 cr
ossi
ng 6 mi
les
north
of Vol
Mair
e, Sa
skat
chew
an.
Fren
chma
n Ri
ver
in se
c. 27, T.
33 N
., R.
34 E.,
Just do
wnst
ream
from
he
adga
tes
for
Frenchman
Cana
l, near Saco,
Mont.
Beav
er Creek
9 miles
sout
hwes
t of
Saco,
and
16 mi
les
east of
Malt
a, Mont.
Lime Cr
eek
100
ft do
wnst
ream
from br
idge
on U.
S. Hi
ghwa
y 2,
4 mi
les
upstream from m
outh,
and
4 mi
les
northeast
ofTampico, Mo
nt.
Spri
ng Coulee tr
ibut
ary
300
ft so
uth
of NE
corn
er se
c. 18,
T.30
N.,
R.
40 E.,
13.8 miles
nort
heas
t of
Glasgow, Mo
nt.
Will
ow Creek
17 mi
les
sout
heas
t of Gl
asgo
w, Mo
nt. ...........
Dry
Pork
Creek
trib
utar
y in
SW£NW£
sec.
20, T.32 N.
, R.
40 E.
,at
cu
lver
t on
State
Seco
ndar
y Highway
247,
23.5 mi
les
nort
hof
Glasgow, Mont.
25.0
101 14.0
17.4 1.08
17.8
95 338
116
1,26
0
180 52 94 -
1,31
5
105
.70
_
.71
180
440
123
142 - -
240
960
480
2,220
370
156
230 -
1,460
450 - _ -
June
8, 1964
June
8, 1964
June
8, 1964
June
8, 1964
June 14,
1962
Mar. 11,
1959
July 13,
1920
Apr. 3
or 4,
1952
Apr. 15, 1952
April
1952
Apr. 8
or 9,
1952
April
1952
April
1952
April
1952
June
9, 1906
July 14
, 1962
Aug. 26,
1954
April
1952
Aug. 26,
1954
4,880
14,900
558
1,880
299
257
1,500
2,040
4,980
6,100
1,450
1,700
6,000
43,400
6,650
2,140
144
6,150
163
195
148 39.9
108
277 14.4
15.8
6.04
42.9
4.84
8.06
32.7
63.8 -
5.06
20.4
206
230
*5.09
*6.34
32 *2.48
-
*1.17
6
*1.93
10
22
*2.04
*4.88
-
32
36
- _ -
See
foot
note
s at
end
of ta
ble.

Table 2. Peak di
scha
rge
at miscellaneous
sites
and
outs
tand
ing
floods at
short-term gaging
stations Continued
No.
Flood
region
and
hydro-
logi
c ar
ea
Stre
am and
place
of determination
Cont
ribu
ting
drainage
area
(s
q mi)
Areal
^2.3
3 (cfs)
Maxi
mum
floo
d
Date
Discharge
Cfs
Cfs
per
sq mi
Recurrence
inte
rval
(y
ears
)
Wolf Cr
eek
basin
70E9
Wolf
Creek
trib
utar
y No
. 2
at br
idge
on
co
unty
ro
ad
9^ m
iles
no
rthw
est
of Wolf
Poin
t, Mont.
6.54
-
June
20,
1959
979
150
3Poplar R
iver b
asin
O t*71
E8Poplar River
at bridge on
U.
S. Highway
2, ha
lf a
mile
east of Poplar,
Mont .
3,27
03,
350
Apr.
7,
19
5434
,600
10.6
*1.1
7 S
r-fRed
Boy
Coul
ee basin
M
72B9
_May
2, 19
55968
629
^>
Big
Muddy
Creek basin
73 74 75 76 77 78
B9 B9 B9 B9 B9 B9
Beav
er Creek
500
ft do
wnst
ream
fro
m Li
ttle
Beaver Creek
and
6 miles
northwest
of D
aleview, Mont.
Big
Muddy
Creek
tributary
at cu
lver
t on St
ate
Highway
5,2 miles
nort
hwes
t of Plentywood,
Mont
.Bi
g Mu
ddy
Creek
tributary
at culvert
on Stat
e Highway
5,1.6
miles
nort
hwes
t of
Pl
enty
wood
, Mont.
Big
Mudd
y Creek
tributary
at culvert
on S
tate Hig
hway
5, 1 mile no
rthw
est
of Plentywood,
Mont.
Big
Mudd
y Creek
trib
utar
y at
cu
lver
t on Stat
e High
way
16,
2.7
miles
north
of Antelope,
Mont
.Clark
Coul
ee at
cu
lver
t on
St
ate
Highway
16,
1.8
mile
snorth
of Antelope,
Mont
.
185 1.
27 .46
1.02 .65
1.54
930
- - - - -
Apr.
7,
1952
July
26,
1954
July
26,
1954
July
26,
1954
July
21,
1954
July
21
, 19
54
4,02
0 64.5
82.9
45.5
411
480
21.7
50.8
180 44,6
632
312
50
- - - - -
Yellowstone
River
basin
79 80 81 82 83 84
C6 A8 C7 A7 A7 A7
Stil
lwat
er Riv
er a
bove W
oodbine
Creek, 7^ mil
esso
uthw
est
of Ny
e, Mo
nt.
Croo
ked
Creek
trib
utar
y at
br
idge
on
co
unty
road
1.7
miles
west
of
U.
S. Highway
87 be
twee
n Bi
llin
gsand
Roundup
and
12 miles
nort
hwes
t of
Shepherd,
Mont ...
...
Crow
Cr
eek
300
ft ab
ove
mouth
of Cr
ow Creek
Cany
on,
5 miles
nort
h of
Tipperary, Wyo.
Litt
le Wind River, 4,600
ft downstream from confluence of
No
rth
and
South
Pork
s and
1 mi
le east of Port Wa
shak
ie,
Wyo.
Trout
Creek
at br
idge
on Blue Tr
ail,
5.0
mile
s so
uthw
est
ofPo
rt Washakie,
Wyo.
Little Wind River
at highway
brid
ge,
5.7
mile
s west of
Arapahoe,
Wyo.
160 - 30 250 16.1
618
_ - - - - -
June
27
, 1927
June
4,
1962
June
15
, 19
63
June
6,
1909
May
20,
1964
June
8,
1952
6,52
0
5,12
0340
2,95
0
112
c 3,
200
40.3 -
11.3
11.8 6.96
5.18
_ - - - - -

85 86 87 88 89 90 91 92 93 94 95 96 97 98 99
100
101
102
103
104
105
106
107
108
109
110
111
A7 E8 E8 E8 A9 E8 E8 D9 E8 D9 D9 D9 D9 D8 D8 E8 D8
D7 D8 D8 D8 D7 A7 A7 A6 A6 B9
Middle Po
po Agie River 1.2
miles downstream from the
Sinks
and 6.5
miles southwest of Lander,
Wyo.
Beaver Creek 1 mile upstream from mouth and 3-
J miles ea
stof Arapahoe, Wy
o.Kirby Dr
aw,
1.5
miles upstream from mouth and 7,0
miles
northeast of Ri
ver-
ton,
Wyo.
Kirby Dr
aw,
1 mile downstream from Riverton-Gas Hills Road
and 6.1
miles ea
st of
Riverton, Wy
o.Five Mile Creek, 100
ft downstream from Wyoming Canal siphon
and 4
miles north of Pavillion, Wyo.
Poison Creek,
|- mile above normal high-water line of
Boysen
Reservoir and 1
mile west of Shoshoni, Wyo.
South Bridger Creek at bridge on
Bridger Creek Ro
ad,
12.5 miles northwest of Lysite,
Wyo.
Dry Cottonwood Cr
eek,
2.1
miles upstream from high-water
line of Boysen Reservoir and 12.5 miles northwest of
Booneville, Wyo.
Bighorn River tributary in
NW£ sec. 3,
T.42 N.
, R.59 W.,
1.4
miles west of
Thermopolis, Wyo.
Middle Pork Owl
Cree
k, three-quarters of
s. mile upstream
from mouth and 33
miles west of Thermopolis, Wy
o.North Pork Owl
Creek, 50
ft below culverts on
Anchor Dam
Road and
2 miles northeast of Anchor,
Wyo.
North Pork Owl
Creek, 1 mile upstream from South Pork and
21 miles northwest of
Thermopolis, Wyo.
Cold Draw tributary at culvert on State Highway 12
0,12
miles northwest of Thermopolis, Wyo.
Sand Draw at
culvert on
State Highway 120, 19 miles north
west of Thermopolis, Wyo.
Gooseberry Creek 5 miles downstream from Sand Draw and
14 miles ea
st of
Dickie,
Wyo.
Sand Creek at
culvert on
U.
S. Highway 16,
8.9
miles ea
st of
Norland, Wy
o.Dry Creek 600
ft upstream from bridge on
U.
S. Highways 14 and
16,
12 miles ea
st of Co
dy,
Wyo.
Shoshone River at
bridge on county ro
ad,
300
ft downstream
from Penrose Dam and
4 miles southeast of Garland, Wyo.
Whistle Creek 1.2
miles upstream from Emblem secondary road
and 12,9 miles northwest of Em
blem
, Wy
o.Coon Creek 1 mile downstream from Emblem secondary road and
9.7
miles northwest of
Em
blem
, Wyo.
Sage Creek 300
ft downstream from Po
le Cat
Creek and
2^ miles
east of Deaver,
Wyo,
Shoshone River at Lo
vell
, Wyo. ..............................
Tongue River at highway bridge at
Dayton, Wyo. ..............
Cross
Creek above Big Horn Reservoir, near Big Ho
rn,
Wvo....
Goose Creek at
West Loucks Street Bridge in
Sheridan, Wyo...
Cow
Siphon at
culvert on
U.S. Highway 10,
9.3
miles north
east of Miles Ci
ty,
Mont
.
87 .5
354
129
144
145
519 10.0
165
.4
33.6
60
100 3.
8
6.33
303 24.4
249
2,036 70 47 341
2,720
259
495 9.
29182.5
9
- 920
510
540
800
1,150
116
870
- 330
465
640
- - 840
195
740
- 355
282
900
_ _ _ - - -
June 16,
1963
July 13,
1952
June
2, 1961
June
2, 1961
Sept
. 19,
1948
Feb. 11,
1962
Sept
. 22,
1962
May
22j
1952
June 16,
1960
July 26,
1962
June 15,
1963
Aug. 15,
1930
June 16,
1960
June
9, 1960
June 23,
1938
September 1963
Sept
. 19,
1961
Sept
. 19,
1961
Sept
. 19,
1961
Sept
. 19,
1961
June
8, 1958
May
28,
1898
June
7, 1903
June 12,
1915
Jimf 15,
1963
June
9, 1912
Sept
. 5,
1954
4,180
1,680
7,390
7,290
2,600
c 2,200
330
2,120
361
538
1,370
3,380
1,740
2,490
13,000
3,740
2,060
9,550
4,260
2,360
2,250
12,300
960
3,000
285
4,000
321
47.8
4.75
57.3
50.6
17.9 4.24
33.0
12.8
902 16.0
22.8
33.8
458
393 42.9
153 8.
27
4.69
60.9
50.2 6.60
4 . 52
3.71
6.06
3D. 7
22.0
544
-
4 *1.64
*1.53
*1.06
4 6
11
-
5
18 *1.32
- -
*3.8
7
*2.18
16
-
*3.00
*2.08
12
_ _ _ - - -
See
foot
note
s at end
of table.

Table 2. Peak discharge at miscellaneous sites
and outstanding floods at
short-term gaging stations Continued
No.
Flood
region
and
hydro -
logic
area
Stream and place of determination
Contributing
drainage
area
(sq
mi)
Areal
02.33
(cfs
)
Maximum flood
Date
Discharge
Cfs
Cfs
per
sq mi
Recurrence
interval
(yea
rs)
Yellowatone River basin Continued
112
113
114
115
116
117
118
119
120
121
122
123
124
125
126
127
128
B9 B9 A8 E9 E9 E9 E9 E8 E9 E9 A7 D9 D9 B9 B9 B9 B9
Deep Creek at culvert on
Interstate Highway 94,
2 miles
southeast of Kinsey,
Mont
.Meadow Creek at culvert on
State Highway 33
3, 10
miles
southwest of Lo
cate
, Mo
nt.
Middle Pork Powder Ri
ver,
13 miles southwest of Barnum,
Wyo.
Salt Creek in se
c. 28, T.43 N
., R.79 W.,
4 miles southwest of
Sussex,
Wyo.
Coal Draw at
bridge on State Highway 38
7, 3.4
miles north
east of Midwest, Wy
o.Hay Draw at
culvert on
U.
S. Highway 87,
5.5 miles northeast
of Midwest, Wyo.
Dead Horse Creek at
bridge on dirt road 1.2
miles upstream
from Interstate Highway 90,
31 miles southeast of Buffalo,
Wyo.
Crazy Woman Creek at bridge 7 miles downstream from con
fluence of North and South Po
rks
and 20 miles southeast of
Buffalo, Wyo.
Deadman Creek at
bridge on State secondary highway, 1.2
mile
s north of Arvada, Wy
o.Powder River at highway bridge,
1,500 ft
upstream from Clear
Creek and 17 miles north of Arvada, Wyo.
Clear Creek at
highway bridge at
Buffalo, Wyo. .............
Maaon Creek at
bridge on county road 8.3
miles southeast of
Mizpah,
Mont .
Meyers Creek at culvert on county road on
ea
st side of
Powder River 3 miles southeast of
Lo
cate
, Mo
nt.
Lame Jones Creek tributary at culvert on State Highway 7,
half a mile south of
Willard, Mo
nt.
Sandstone Creek at county road br
idge
, 4 miles southeast of
Plev
na,
Mont.
Charbonneau Creek tributary No.
2 at
culvert on State High
way 23,
4 miles east of
Cartwright, N. Da
k.Charbonneau Creek tributary at
culvert on
county road north
oY State Highway 23 at
Cartwright, N. Da
k.
- - 46 - 11.4
1.60
155
464 -
6,580
130 10 -
.40
106
.17
3.8
- - 280
- 176
- 840
1,080
-
8,100
_ 160
- - 670
- -
June
5, 1963
June 14,
1962
June 15,
1963
May
23,
1952
May
21,
1962
July 1958
June 22
, 1959
June
2, 19
29
June 1962
July 14,
1918
June 11,
1912
Sept
. 5,
1954
June
6, 1963
Sept
. 5,
1954
June 26,
1955
Aug.
1,
1963
Aug.
1,
1963
*
2,420
1,400
7,110
21,600
1,060
970
1,640
2,640
16,600
10,800
c 16,000
3,040
1,370
149
c 10,000
1,320
2,040
- -
155-
93.0
606 10.6
5.69
- 1.64
123
304
-
372 94.3
7,760
537
- -
*8.33
-
19
-
4 5
-
3
_
*4.75
- -
*2.7
9
- -
Little Missouri River basin
129
130
BIO
D9
Little Missouri River tributary near Marmarth, N. Da
k.,
lat
46°11'25", long 103°57'10".
Corral Creek tributary in
SE
-J- sec. 35, T.7
N.,
R.60 E.,
65 mil
es so
uthe
ast
of B
aker,
Mont.
1.52
.50
_ -
June
9, 1964
Sept
. 5,
1954
289
1,680
190
3,360
_ -

131
132
133
134
135
BIO
BIO
BIO
BIO
BIO
Lone Tree Creek in sec. 24, T.ll N.,
R.60 E.,
near
Wibaux, Mo
nt.
Duck Creek in NE£ se
c. 36, T.13 N.,
R.60 E.,
near Wibaux,
Mont
.Sand Creek tributary near Amidon, N. Da
k.,
lat
46°2
9',
long 103°22'
.
Sully Creek at
road bridge 1.6 miles south of
Medora,
N. Dak.
23 - - 51.8
29.5
340
- - 570
400
June
7, 1929
June
7, 19
29
June 21,
1929
June 26
, 1955
June 26,
1955
4,100
1,700
1,740
5,480
3,270
178
- -
106
111
*2.25
- -
*1.80
*1.53
Baker Pond basin
136
T?Q
jiy
Baker Pond tributary No.
2 at
north si
de of
municipal golf
course at Bismark, N.
Da
k.0.
47-
June 26,
1954 1
86.5
1184
-
Heart River basin
137
138
139
140
BIO
BIO
E9 E9
Norwegian Creek at
road bridge 4^ miles southeast of
Fryburg, N.
Da
k.Norwegian Creek at
bridge on U.
S. Highway 85
, 2.7
miles
south of
Belfleld, N.
Da
k.Antelope Creek tributary near El
gin,
N.
Da
k.,
lat
46°2
7 ' ,
long 101°50'
.Antelope Creek tributary No.
2 near El
gin,
N.
Da
k.,
lat
46°25',
long 101°50
T.
16.7
33.8 .1
1
6.87
280
430
- -
June 26,
1955
June 26,
1955
June 13,
1961
June 13,
1961
5,170
5,860 72.5
554
310
173
659 80.6
*3.45
*2.55
- -
Little Heart River basin
141
E9Little Heart River at State Highway 6 near St.
Anthony,
N. Dak.
190
950
Apr.
16,
1950
8,770
46.2
*1.05
Apple Creek basin
142
E8East Branch Apple Creek tributary at
culvert on county
road
, 9 miles north of
MoKenzie, N. Da
k.0.49
-June
5, 1963
1,080
2,200
-
Missouri River tributary
143
E9Missouri River tributary at
county ro
ad,
2 miles north
west of
Hu
ff,
N. Da
k.2.6
-June
5, 1956
1,890
727
-
Cannonball River basin
144
145
146
E9
E9 E9
Thirty Mile Creek, 3 miles northeast of
Bently,
N. Dak......
Cannonball River,
£ mile upstream from Cedar Cr
eek,
near
Wade
, N.
Dak.
258
1,650
1,650
1,180
3,550
3,550
Apr.
16,
1950
Apr.
18,
1950
Apr.
18,
1950
11,400
44,000
43,800
44.2
26.7
26.5
*1.0
9 *1.40
*1.40
Grand River basin
147
148
E9 E9
North Pork Grand River tributary in SEjSEj sec. 10,
T.129 N.,
R.103 W.,
14 miles southwest of
Bo
wman
,N.
Dak.
North Pork Grand River at bridge on U.
S. Highway 85,
14.6 miles south of
Bowman, N.
Da
k.
14.9
114
200
700
July 28,
1951
July 28,
1951
3,600
5,300
242 46.5
*2.05
33
See
footnotes at
end of
table.

Tabl
e 2. Peak di
scha
rge
at miscellaneous
sites
and
outstanding
floo
ds at
short-term ga
ging
stations Continued
Flood
region
and
hydro-
logi
car
ea
Stre
am and
plac
e of determination
Cont
ribu
ting
dr
aina
gear
ea
(sq
mi)
Are
al
02.3
3 (c
fs)
Maximum
floo
d
Date
Disc
harg
e
Cfs
per
sq m
iRecurrence
inte
rval
(yea
rs)
Gran
d Ri
ver basin Continued
149
150
151
152
153
E9 E9 E9 E9 E9
Midd
le Po
rk C
rooked Cr
eek,
5 miles so
uthw
est
of K
orin
en,
N. Dak.
Crooked
Cree
k at
br
idge
on
U.S. Highway
85,
5 mi
les
north
of Ludlow,
S. Dak.
Buff
alo
Creek
near
Scranton,
N. Dak.,
lat
46°0
9',
long 10
3°08
'.North
Pork Grand
River
at br
idge
on
He
ttln
ger-
Lodg
epol
e road,
5 mile
s south
of No
rth Da
kota
-Sou
th Dakota
Stat
e li
ne.
Came
l (Middle) Cr
eek,
6 miles
east and
lj m
iles
north
ofLadner,
S. Da
k.
3.9
67.4
-
1,06
0 5.2
- 500
-
2,70
0
-
July
28,
1951
July 28,
1951
June
9,
19
58
Apr.
7, 1952
July 28,
1951
5,70
0
6,80
0
1,47
0
21 , 300
7,50
0
1,46
0
101
-
20.1
1,44
0
-
*1.5
4
-
37
-
More
au River basin
154
E9Li
ttle
Mo
reau
River
6^ miles south
of Ti
mber
lake
, S. Dak....
--
June
19,
1960
10,6
00-
-
Chey
enne
River
basin
155
156
157
158
159
160
161
162
163
164
165
B8 B8 B8 B8 B8 B8 E8 E8 Ell
Ell
Ell
Sand Cree
k in se
c. 7,
T.39 N.,
R.74 W
., 35
mil
es north
ofGlenrock,
Wyo.
Wyatt
Cree
k tributary, in
se
c. 11,
T.
33 N
., R.
65 W., at
high
way
brid
ge,
5 miles
north
of Manville,
Wyo.
Old
Woman
Cree
k tr
ibut
ary
No.
1, in se
c. 26, T.38 N.
,R.62 W
., on
ol
d U.S. Hi
ghwa
y 85
, at
Re
dbir
d, Wy
o.Old Wo
man
Creek
trib
utar
y No
. 2,
in
se
c. 22,
T.38 N.
, R.
62 W
.,on
U.S.
High
way
85 at
Redbird, Wyo.
Rush
Cr
eek
trib
utar
y No
. 2
at cu
lver
t on
U.S.
Highway
16,
1.9
mile
s southeast
of Moorcroft, Wyo.
Rush
Creek
tributary
at cu
lver
t on
U.S.
High
way
16,
1.6
miles
southeast
of Mo
orcr
oft,
Wy
o.Gr
ace
Coolidge Cr
eek
tributary
in NW^NE-J- s
ec. 10,
T.3
S.,
Dry
Cree
k, J mi
le up
stre
am fr
om m
outh and
1 mile so
uth
ofHe
rtno
sa,
S. Da
k.Castle Creek
tributary
No.
1, site No.
1, at
road 1.4
miles
upst
ream
fr
om Ca
stle
Creek
and
6.5 miles
sout
hwes
t of
Rochford,
S. Da
k.Castle Creek
trib
utar
y No
. 1, site No.
2, 1.1
miles
up
stre
am from mouth
and
6.4
mile
s southwest
of Rochford,
S. Da
k.Castle Creek
tributary
No.
1, site No.
3, 0.4
mile
up
stre
am fron n
outh and
6.2
mile
s so
uthw
est
of Rochford,
S. Dak.
- - - -
0.5 .2
3.44
5.25
1.25
1.75
2.20
- - - - - - _ - - - -
May
22,
1952
June 27,
1952
June 28
, 1952
June
28,
1952
May
24,
1960
May
24,
1960
July 28,
1957
July 28
, 1957
July 28,
1955
July
28
, 19
55
July
28,
1955
1,750
181
156
1,140
336
136
2,660
1,150
2,130
1,720
5,620
- - - -
672
680
773
219
1,750
983
2,550
- - - - - - - - - -

166
167
168
169
170
171
172
173
174
175
176
177
178
179
180
181
182
Ell
Ell
Ell
Ell
Ell
Ell
Ell
Ell
Ell
Ell
Ell
E8 E8 E8 E9 E9 E9
Castle Creek tributary No.
2, at culvert 5-J miles southwest
of Rochford, S. Dak.
Iron Creek above 300
ft upstream from mouth and 4.2
miles
southwest of Rochford,
S. Da
k.North Fork Castle Creek about \ mile upstream from mouth and
4 miles southwest of
Rochford, S. Da
k.Castle Cr
eek,
2 miles downstream from North Fork Castle
Creek and 3 miles south of
Rochford, S. Da
k.Castle Creek at
Ch
icag
o, Burlington, and Quincy RR.
brid
ge,
0.4
mile south of
My
stic
, S. Da
k.Rapid Creek tributary, on road to Nameless Ca
ve,
0.8 mile
upstream from mouth and 2 miles southwest of city limits
of Rapid Ci
ty,
S. Da
k.Claghorn Ca
nyon
, 900 ft
upstream from mouth and 1 mile south
west of
city limits of
Rapid Ci
ty,
S. Da
k.South Canyon 300
ft upstream from small tributary and
2 miles west of
city limits of Rapid Ci
ty,
S. Da
k.South Canyon near intersection of Nordbye Lane and Ha
llStreet in Rapid Ci
ty and l|- miles upstream from mouth.
Rapid Creek tributary in
NW
&ffi
i sec. 7,
T.I
N.,
R.8 E.,
insoutheast Rapid City,
S. Da
k.,
1 mile upstream from mouth.
Rapid Creek at highway bridge at Creston, S. Da
k.,
about
4 miles upstream from mouth.
Freda Creek Just upstream from bridge on
U.
S. Highway 16,
7.4
miles southeast of
Moorcroft, Wyo.
Inyan Kara Creek at bridge on
State Highway 116, 13
miles
northeast of Up
ton,
Wyo.
Belle Pourche River tributary No.
2 at
culvert on
State
Highway 24,
3.2
miles ea
st of Hulett,
Wyo.
Whitewood Creek at Chicago and Northwestern Railway bridge,
1 mile east of Whitewood, S. Da
k.Bear Butte Creek tributary three-quarters of
a mile upstream
from mouth and 4
miles southwest of
Sturgis, S. Da
k.Bear Butte Creek at
State Highway 79,
3-J- miles northeast of
Sturgis, S. Da
k.
.019
1.25
14.6
h 32.6
h 52.2 1.67
6.96
.92
6.06
2.84
710 5.
6
96.5
10.2
59.0 1.63
101
- - 40 70 93 - 24 - 21 - 620
- 430
116
464
- 640
July 28
, 1955
July 28,
1955
July 28,
1955
July 28,
1955
July 28,
1955
July 13,
1962
July 13,
1962
July 13,
1962
July 13,
1962
July 14,
1957
May
6, 1932
June 1962
July
1, 1959
July 13,
1962
July 15,
1962
June 15,
1962
June 16,
1962
98.9
2,410
4,490
8,500
2,360
2,130
2,920
1,310
2,960
256
16,000
1,990
4,660
1,630
8,460
1,940
5,980
5,200
1,930
308
261 45.2
1,280
420
1,420
488 90.1
22.5
355 48.3
160
143
1,190 59.2
_ - _
*13.8
*2.74
_
*13.8 -
*16.0
3 C*2.92
S 3 g
*1.23
g o*1.60
lj
*2.0
7 |3 O § w
*1.0
6
Medicine Creek basin
183
184
E9 E9
Medicine Creek tributary No.
1, 3£ miles northeast of
Lyman
and
5-f miles northwest of
Reliance, S. Da
k.Medicine Creek tributary No.
2, 3^ miles northeast of
Lyman
and 4£ miles northwest of Reliance, S. Da
k.
4.2 .4
- -
July
9, 1955
July
9, 1955
377
530
89.8
1,320
- -
White River basin
185
186
B8 B9
White Clay Creek, half a
mile upstream from Wolf Creek
and half a
mile west of Pine Ri
dge,
S. Da
k.White River tributary at culvert on
U.
S. Highway 16
A,8-
p miles northwest of
Co
nata
, S. Da
k.
- 0.17
- -
May
20,
1962
Sept
. 20,
1955
1,880
305
_
1,790
_ -
Maine Creek basin
187
B13
Marne Cr
eek,
400 ft
downstream from 12th Street Bridge
in Yankton, S. Dak.
30.7
380
June 16,
1957
4,450
145
*2.19
See
footnotes at
end of
table.

Table
2.--
Peak
dis
char
ge at
miscellaneous
sites
and
outstanding
floods at
short-term ga
ging
stations Continued
No.
Floo
d re
gion
and
hydr
o-
logi
c ar
ea
Stre
am and
plac
e of
determination
Contributing
drai
nage
ar
ea
(sq
mi)
Area
l 02
.33
(cfs
)
Maxi
mum
floo
d
Date
Disc
harg
e
Cfs
Cfs
per
sq mi
Recurrence
inte
rval
(y
ears
)
Marn
e Cr
eek basin Continued
188
B13
Marn
e Creek
trib
utar
y, 80
ft
downstream fr
om culvert
on
Stat
e Hi
ghwa
y 50
and
2 mi
les
nort
hwes
t of
Ya
nkto
n,
S. Da
k.
1"
May
30,
1959
510
510
"
Verm
illi
on River
basi
n
189
190
B12
B12
West
Po
rk V
ermillion
River
trib
utar
y in
SW
-J- se
e. 36,
T.109
N.,
R.56 W.,
13js- mi
les
north
of Howard,
S. Dak.
West
Po
rk V
ermi
llio
n River
trib
utar
y in NW£ s
ec. 12
,T.
108
N.,
R.56 W.
, at
cu
lver
t on
hi
ghwa
y, 12 mi
les
north
of Ho
ward
, S.
Da
k.
0.87
2.56
- -
June
4,
1956
June
4,
1956
817
780
939
305
- -
Big
Sioux
River
basin
191
192
193
194
195
196
B13
B13
B13
B13
B13
B13
Big
Siou
x River
tributary, at
culvert
on hi
ghwa
y, 3j m
iles
sout
hwes
t of
Dell
Rapids,
S. Dak.
Skunk
Creek
trib
utar
y at
culvert
on hi
ghwa
y, 2 mi
les
sout
heast of
Co
lton
, S. Dak.
Moun
d Cr
eek
trib
utar
y at
cu
lver
t on
U.S.
High
way
75,
half
a
mile
up
stre
am fr
om m
outh and
1 mile so
uthw
est
of Hardwick,
Minn.
Mound
Creek
at lower
damsite
in Mound
Springs
State
Park
,4^
mil
es north
of Luverne, Minn.
Kana
ranz
i Cr
eek
trib
utar
y at cu
lver
t on
private
road,
aqu
arte
r of a mi
le up
stre
am from m
outh and
3 mi
les
east
of A
drian, Minn.
North
Bran
ch Ka
nara
nzi
Creek
trib
utar
y at
culvert
on co
unty
road
ad
jace
nt to
St
ate
High
way
91,
60 ft
up
stre
am from
mouth
and
l£ mil
es no
rthe
ast
of Lismore, Minn.
0.68
5.80 .23
16
.76
-
-
128 -
248 - -
June
16
, 19
57
June
16
, 19
57
Apr.
28,
1959
May
28,
1959
Apr.
30
, 1959
June
9, 19
63
948
2,55
0
260
1,48
0
323
240
1,39
0
440
1,13
0 92.5
425
-
-
*3.7
2
-
*1.1
1
- -
* Ra
tio
of peak di
scha
rge
to that of
th
e 50-year
floo
d.a
r>bs
er"e
fl.
b Re
sult
of
earthquake (l
ands
lide
into reservoir).
c About.
d During fl
ood
of Ju
ne 16
-18,
1948.
e Af
fect
ed by
fa
ilur
e of
Swift
Dam
Reservoir.
f Do
es not
incl
ude
noncontributing
area.
g Average
infl
ow of
a
2.62
-hou
r pe
riod
, fu
rnis
hed
by U
.S.
Bure
au of Reclamation.
h Does not
incl
ude
area
ab
ove
Deer
fiel
d Da
m.

MISSOURI RIVER MAIN STEM 59
110. Red Rock River at Kennedy Ranch, near Lakeview, Mont.
Location.--Lat 44°39', long 112°03', near center of sec.2, T.14 S., R.4 W. , on right bank at Kennedy Ranch, 4 miles upstream from Long Creek and 14 miles northwest of Lakeview.
Drainage area.--323 sq mi.
Gage.--Recording. At site 1 mile upstream at different datum prior to Aug. 28, 1942. Datum of gage is 6,596.37 ft above mean sea level, unadjusted.
Stage-discharge relation. Defined by current-meter measurements below 450 cfs at former site and below 1,300 cfs at present site.
Remarks. No winter records after 1942. Natural storage in Red Rock Lake.Diversions for irrigation of about 6,000 acres above gage. Peaks are princi pally from snowmelt. Only annual peaks are shown.
Peak stages and discharges
Water year
1937 1938 1939 1940
1941 1942
1945
1946 1947 1948 1949 1950
1951
Date
Apr. 28, 1937 Apr. 27, 1938 Apr. 19, 1939 Apr. 14, 1940
Apr. 11, 1941 Apr. 12, 1942
May 4, 1945
Apr. 21, 1946 May 2, 1947 Apr. 30, 1948 Apr. 27, 1949 Apr. 22, 1950
Apr. 15, 1951
Oage height (feet)3.52 3.92 3.56 3.00
2.59 3.67
3.99
4,75 4,28 4,41 4.14 4.30
ab4.47
Discharge (cfs)
964 1,030
820 590
430 833
681
961a781 a820 a726 781
Water year
1951 1952 1953 1954
1956 1957 1958 1959 1960
1961 1962 1963
Date
Apr. 23, 1951 Apr. 30, 1952 May 5, 1953 Apr. 19, 1954 Apr. 23, 1954
Apr. 24, 1956 May 6, 1957 Apr. 30, 1958 Apr. 22, 1959 Apr. 8, 1960
Apr. 5, 1961 Apr. 27, 1962 Apr. 20, 1963
Gage height (feet)
3.96 5.24 4.10
ab5.4 3.54
3.77 4.77 3.77 2.81
b4.52
3.20
Discharge (cfs)
640 1,360 a715
546
a596 1,020 a590 a352 cSOO
C300 C900 486
a Maximum recorded; might have been exceeded during periods of no winter records, b Backwater from ice. c About.
SHEEP CREEK BASIN
135. Sheep Creek below Muddy Creek near Dell, Mont. (Published as "Sheep Creek near Dell" in 1936)
Location.--Lat 44°39', long 112°47', in SW£ sec.35, T.13 S. , R.10 W., on left bank 2 miles downstream from Muddy Creek and 6 miles southwest of Dell.
Drainage area. 280 sq mi.
Gage.--Recording prior to Oct. 1, 1953; crest-stage gage since 1960. Altitude of gage is 6,530 ft (from topographic map).
Stage-discharge relation.--Defined by current-meter measurements below 270 cfs and extended above by logarithmic plotting.
Remarks. Diversions for irrigation of about 6,600 acres above station do not materially affect peak flows. Peaks are principally from snowmelt. Base for partial-duration series, 130 cfs. Only annual peaks are shown subse quent to 1953.
Peak stages and discharges
Water year
1946 a/
1947
Date
May 28, 1946 June 24, 1946
Mar. 18, 1947Mar. 22, 1947Mar. 30, 1947 Apr. 15, 1947 May 3, 1947
Gage height (feet)
5.54 4.78
5.545.464.87 5.36 4.47
Discharge (ofs)
379 229
579559242 529 159
Water year
1947
Date
May 12, 1947 June 5, 1947June 9, 1947June 11, 1947June 21, 1947July 10, 1947 Aug. 22, 1947
Gage height (feet)
4.57 4.945.665.004.984.53 4.50
Discharge (ofs)
177 235349220229142 185
a Period May 24 to Sept. 30.

60 SHEEP CREEK BASIN
Peak stages and discharges of Sheep Creek below Muddy Creek near Dell, Mont.--Continued
Water year
1948
1949
1950
Date
Apr. 17, 1948Apr. 18, 1948May 8, 1948May 18, 1948May 20, 1948June 3, 1948June 10, 1948June 22, 1948June 26, 1948July 3, 1948Aug. 1, 1948
Apr. 6, 1949Apr. 12, 1949May 17, 1949May 21, 1949June 6, 1949
Apr. 1, 1950Apr. 7, 1950Apr. 14, 1950Apr. 17, 1950
Oage height (feet)5.085.034.254.404.754.584.254.954.694.275.49
5.136.025.165.314.55
5.684.934.584.38
Discharge (cfs)
285276136161224193137266219146369
295477291321183
406257193158
Water year
1951
1952
1953
1960
196119621963
Date
Apr. 9, 1951Apr. 13, 1951Aug. 4, 1951
Apr. 6, 1952Apr. 18, 1952Apr. 25, 1952May 4, 1952May 21, 1952June 20, 1952June 24, 1952June 27, 1952
Apr. 23, 1953May 29, 1953June 2, 1953June 7, 1953Mar. 26, 1960
Apr. 4, 1961Apr. 2, 1962June 15, 1963
Gage height (f 3et)
4.624.554.82
4.547.724.944.624.345.505.405.46
4.954.355.234.90
4.44
3.984.835.38
Discharge (cfs)
197184234
179909270217163380358371
258148313249
168
84236343
MISSOURI RIVER MAIN STEM
140. Red Rock River near Dell, Mont.
Location.--Lat 44°47' , long 112°44i , in NW^ sec.20, T.12 S., R.9 W. , on right bank half a mile downstream from Sage Creek and 4|- miles northwest of Dell.
Drainage area. 1,421 sq mi.
Gage.--Recording. Altitude of gage is 5,870 ft (by barometer).
Stage-discharge relation. Defined by current-meter measurements below 600 cfs.
Remarks.--No winter records. Some regulation by Lima Reservoir (usable ca pacity, 84,050 acre-ft). Natural storage in Red Rock Lake. Diversions for irrigation of about 35,000 acres above station. Regulation and diversions materially affect peak flows. Only annual peaks are shown.
Peak stages and discharges
Water year
194319441945
19461947194819491950
195119521953
Date
July 28, 1943June 9, 1944Aug. 14, 1945
May 28, 1946June 10, 1947May 20, 1948Apr. 12, 1949Apr. 2, 1950
Apr. 9, 1951July 28, 1952June 7, 1953
Gage height (feet)2.844.852.97
3.263.743.263.253.42
2.993.662.94
Discharge (cfs)
2061,480
268
449724438449562
268676256
Water year
19541955
19561957195819591960
196119621963
Date
June 10, 1954June 30, 1955
Aug. 5, 1956Sept. 7, 1957Apr. 17, 1958June 30, 1959July 9, 1960
June 13, 1961July 14, 1962June 15, 1963
GEge height (feet)
2.862.74
2.832.77_
2.712.82
2.452.882.92
Discharge (cfs)
223185
182188
a339170194
106231284
a Maximum daily.

HORSE PRAIRIE CREEK BASIN 61
150. Horse Prairie Creek near Grant, Mont.
Location.--Lat 45°00'50", long 113"13"30", in NE^NW^- sec.32, T.9 S., R.13 W., on left bank a quarter of a mile downstream from Bloody Dick Creek, 1\ miles west of Grant, and 17-| miles west of Artnstead.
Drainage area.--325 sq mi.
Gage.--Recording. Altitude of gage is 6,050 ft (from topographic map).
Stage-discharge relation. Defined by current-meter measurements below 1,100 cfs.
Remarks.--Diversions for irrigation of about 14,000 acres above station do not materially affect peak flows. Peaks are principally from snowmelt. Base for partial-duration series, 350 cfs.
Peak stages and discharges
Water year
1946
1947
1948
1949
1950
Date
May 28, 1946
Mar. 15, 1947Mar. 17, 1947May 11, 1947June 3, 1947June 11, 1947June 21, 1947
Apr. 17, 1948May 7-8, 1948May 30, 1948June 16, 1948June 22, 1948July 3, 1948
May 17, 1949May 31, 1949
June 7, 1950
Gage height (feet)
4.60
b6.154.586.144.404.393.91
5.163.785.964.794.983.79
4.974.26
5.07
Discharge (cfs)
a550
-585
1,240489489360
828417
1,140712778394
774539
810
Water year
1950
1951
1952
1953
Date
June 12, 1950June 14, 1950June 22, 1950
Mar. 22, 1951Apr. 2, 1951May 13, 1951May 31, 1951June 5, 1951June 18, 1951
May 4, 1952May 9, 1952May 15, 1952June 7, 1952June 28, 1952
June 2, 1953June 14, 1953
Gage height (feet)
4.184.164.33
_4.254.364.994.533.65
3.863.964.393.743.97
6.475.74
Discharge (cfs)
532526576
(c)533568782624355
420448578387451
1,3601,090
a Maximum for period May to September.b Backwater from ice.c Not known; exceeded base discharge.
GRASSHOPPER CREEK BASIN
155. Grasshopper Creek near Dillon, Mont.
Location. --Lat 45°06'40", long 112°48'00", in SW£w£ sec. 26, T.8 S., R.10 W., on left bank l-j miles upstream from mouth and 11 miles southwest of Dillon.
Drainage area. 348 sq mi.
Gage. Nonrecording at site 1,000 ft downstream at different datum prior to June 30, 1933, and 150 ft upstream at different datum Oct. 11, 194E, to May 15, 1946. Recording at present site and datum May 16, 1946, to Sept. 30 , 1961. Crest-stage gage since September 1961. Altitude of gage is 5,350 ft (from topographic map).
Stage-discharge relation. --Defined by current-meter measurements below 600 cfs at present site and extended above on basis of slope-area measurement at 1,870 cfs.
Remarks .--Diversions for irrigation of about 12,500 acres above station do not materially affect peak flows. Peaks are principally from snowmelt. Base for partial-duration series, 150 cfs. Only annual observed peaks are shown prior to 1946.
Peak stages and discharges
Water year
1921 1922 1923 1924 1925
1926
Date
June 10, 1921 May 28, 1922 June 23, 1923 Apr. 13, 1924 June 5, 1925
July 8, 1926
Gage height (feet)
6.60 6.48 5.68 5.05 6.52
5.52
Discharge (cfs)
516 543 283 120 557
197
Water year
1927 1928 1929 1930
1931 1932
Date
June 12, 1927 May 13, 1928 June 18, 1929 Apr. 25, 1930
Apr. 4, 1931 June 7, 1932
Gage height (feet)
6.2 6.10 5.45 5.08
5.02 6.06
Discharge (cfs)
355 327 172 90
85 322
219-848 O - 66 - 6

62 GRASSHOPPER CREEK BASIN
Peak stages and discharges of Grasshopper Creek near Dlllon, Mont.--Continued
Water year
1933
1946
1947
1948
1949
1950
1951
1952
Date
June 10, 1933
May 29, 1946
Mar. 16, 1947Mar. 17, 1947May 11, 1947June 10, 1947
Mar. 29, 1948Apr. 3, 1948Apr. 16, 1948May 8, 1948May 22, 1948May 30, 1948June 4, 1948June 23, 1948
Apr. 8, 1949May 18, 1949May 21, 1949June 2, 1949June 9, 1949
Apr. 2, 1950June 9, 1950June 23, 1950
Feb. 11, 1951Mar. 22, 1951Mar. 26, 1951Apr. 5, 1951May 14, 1951June 2, 1951June 7, 1951
Apr. 7, 1952
Gage height (feet)5.36
2.78
a4.794.443.613.46
-3.113.183.094.014.274.513.67
3.003.263.253.462.90
3.153.233.22
3.184.113.632.933.223.413.38
3.02
Discharge (cfs)
170
160
_640353310
b200234255228559623719394
170258255324165
222249252
324559380168258324314
200
Water year
1952
1953
1955
1956
1957
1958
1960
1961
19621963
Date
May 5, 1952May 16, 1952June 28, 1952
June 3, 1953June 8, 1953June 15, 1953
June 30, 1955
Mar. 24, 1956Apr. 11, 1956May 28, 1956
May 5, 1957May 13, 1957May 21, 1957June 9, 1957June 16, 1957June 21, 1957
May 25, 1958June 5, 1958June 14, 1958June 25, *1958
Mar. 25, 1960May 14, 1960June 11, 1960June 16, 1960
June 14, 1961
Mar. 27, 1962Feb. 3, 1963
Gige height (feet)
3.143.202.95
4.513.633.58
3.39
6.472.934.49
3.113.363.753.573.223.00
2.994.163.603.90
4.062.843.222.78
3.14
3.83a4.61
Discharge (cfs)
241257190
719370352
c328
1,870154679
228307433360246190
208579377475
539165263151
252
c450C465
a Backwater from Ice.b About.c Annual peak only.
MISSOURI RIVER MAIN STEM
160. Beaverhead River at Barratts, Mont.
Location.--Lat 45°06'59", long 112°45'00", in SE^ sec.19, T.8 S., R.9 W., on left bank 1 mile upstream from Barratts, li miles downstream from Grass hopper Creek, and 8^ miles southwest of Dillon.
Drainage area. 2,737 sq mi.
Gage.--Nonrecording prior to Oct. 19, 1934; recording thereafter, gage is 5,268.00 ft above mean sea level, datum of 1929.
Datum of
Stage-discharge relation.--Defined by current-meter measurements below 2,700 cfs.
Remarks. Some regulation by Lima Reservoir (usable capacity, 84,050 acre-ft). Diversions for irrigation of about 90,000 acres above station. Peaks are principally from snowmelt. Base for partial-duration series, 800 cfs. Only annual peaks are shown prior to 1935.
Peak stages and discharges
Water year
190819091910
1911191219131914
1915
1916
Date
June 20, 1908June 10, 1909Mar. 5, 1910
June 21, 1911June 10, 1912June 13, 1913May 11, June 6,
1914June 12, 1915
June 22, 1916
Qage height (feet)
6.13.253.9
2.755.34.33.15
3.5
4.2
Discharge (cfs)
3,7201,5102,170
1,3403,2202,2801,440
1,660
2,130
Water year
1917191819191920
19211922192319241925
1926
Date
May 16, 1917July 12, 1918Apr. 27, 1919May 17, 1920
June 17, 1921May 28, 1922June 24, 1923Apr. 15, 1924June 5, 1925
Apr. 19, 1926
Ga<re height (feet)
5.70?.202.30?.69
4.204.77£.90Z.393.50
2.40
Discharge (cfs)
3,200878938
1,130
2,0702,3601,200
9121,670
1,010
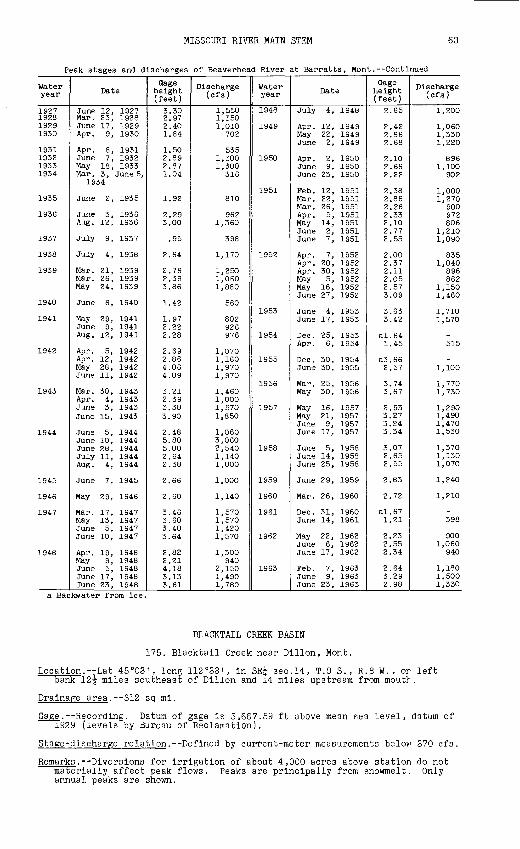
MISSOURI RIVER MAIN STEM 63
Peak stages and discharges of Beaverhead River at Barratts, Mont. Continued
Water year
1927192819291930
1931193219331934
1935
1936
1937
1938
1939
1940
1941
1942
1943
1944
1945
1946
1947
1948
Date
June 12, 1927Mar. 23, 1928June 17, 1929Apr. 9, 1930
Apr. 8, 1931June 7, 1932May 18, 1933Mar. 3, June 8,
1934
June 2, 1935
June 3, 1936Aug. 12, 1936
July 9, 1937
July 4, 1938
Mar. 21, 1939Mar. 26, 1939May 24, 1939
June 6, 1940
May 29, 1941June 9, 1941Aug. 12, 1941
Apr. 5, 1942Apr. 12, 1942May 28, 1942June 11, 1942
Mar. 30, 1943Apr. 4, 1943June 3, 1943June 15, 1943
June 5, 1944June 10, 1944June 28, 1944July 11, 1944Aug. 4, 1944
June 7, 1945
May 29, 1946
Mar. 17, 1947May 13, 1947June 5, 1947June 10, 1947
Apr. 19, 1948May 9, 1948June 5, 1948June 17, 1948June 23, 1948
Qage height (feet)
3.302.972.401.84
1.502.892.871.04
1.92
2.293.00
.95
2.64
2.762.393.86
1.42
1.972.222.28
2.692.864.064.09
3.212.393.383.90
2.485.805.002.642.38
2.66
2.60
3.463.603.403.64
2.822.214.183.133.61
Discharge (cfs)
1,5501,3501,010
702
5351,3001,300
316
810
9621,360
398
1,170
1,2501,0601,880
560
802926976
1,0701,1601,9701,970
1,4601,0001,5701,850
1,0603,0602,5401,1401,000
1,000
1,140
1,5701,5701,4201,570
1,300940
2,1501,4901,780
Water year
1948
1949
1950
1951
1952
1953
1954
1955
1956
1957
1958
1959
1960
1961
1962
1963
Date
July 4, 1948
Apr. 12, 1949May 22, 1949June 2, 1949
Apr. 2, 1950June 9, 1950June 23, 1950
Feb. 12, 1951Mar. 22, 1951Mar. 26, 1951Apr. 5, 1951May 14, 1951June 2, 1951June 7, 1951
Apr. 7, 1952Apr. 20, 1952Apr. 30, 1952May 5, 1952May 16, 1952June 27, 1952
June 4, 1953June 17, 1953
Dec. 25, 1953Apr. 6, 1954
Dec. 30, 1954June 30, 1955
Mar. 25, 1956May 30, 1956
May 16, 1957May 21, 1957June 9, 1957June 17, 1957
June 5, 1958June 14, 1958June 25, 1958
June 29, 1959
Mar. 26, 1960
Dec. 31, 1960June 14, 1961
May 22, 1962June 6, 1962June 17, 1962
Feb. 7, 1963June 9, 1963June 23, 1963
Gage height (feet)
2.65
2.422.862.68
2.102.662.22
2.382.862.262.332.102.772.55
2.002.372.112.052.573.09
3.633.42
al.641.45
a3.662.57
3.743.67
2.933.273.243.34
3.072.652.55
2.83
2.72
al.671.21
2.232.552.34
2.643.292.98
Discharge (cfs)
1,200
1,0601,3301,220
8961,100
902
1,0001,270
900972806
1,2101,090
8351,040
896862
1,1501,460
1,7101,570
-515
-1,100
1,7701,730
1,2901,4901,4701,530
1,3701,1301,070
1,240
1,210
-398
9001,060
940
1,1801,5001,330
a Backwater from Ice.
BLACKTAIL CREEK BASIN
175. Blacktail Creek near Dillon, Mont.
Location.--Lat 45°03', long 112°33', in SE£ sec.14, T.9 S., R.8 W. , or left bank 12^ miles southeast of Dillon and 14 miles upstream from mouth.
Drainage area. 312 sq mi.
Gage. Recording. Datum of gage is 5,667.59 ft above mean sea level, datum of 1929 (levels by Bureau of Reclamation).
Stage-discharge relation.--Defined by current-meter measurements below 370 cfs.
Remarks. Diversions for irrigation of about 4,000 acres above station do not materially affect peak flows. Peaks are principally from snowmelt. Only annual peaks are shown.

64 BLACKTAIL CREEK BASIN
p0av pi-.apps and disc.harges of Blacktail Creek near Dlllon, Mont.
Water year
19461947
19481949
1950
1951
1952
1953
1955
Date
June 7, 1946Feb.14-28, 1947June 11, 1947June 22, 1948Feb. 11, 1949May 21, 1949Feb. 14, 1950June 25, 1950
Feb. 14, 1951Mar. 21, 1951Feb. 26, 1952June 25, 1952Jan. 4, 1953June 20, 1953
June 17, 1955
Gage height (feet)2.30E3.31
-2.75
a3.48_
a3.44-
E2.77-
a4.62-
a3.01-
2.17
Discharge (cfs)
218-
399378-
226-
159
-130-
169-
304
166
Water year
1956
1957
1958
1959
1960
1961
1962
1963
Date
Mar. 7, 1956May 29, 1956Feb. 24, 1957June 7, 1957Feb. 2, 1958June 3, 1958Feb. 21, 1959June 28, 1959Feb. 24, 1960May 13, 1960
Jan. 2, 1961June 10, 1961Mar. 11, 1962June 17, 1962Feb. 4, 1963June 9, 1963
Q.'tce height (fset)a3.87
-82.96
-a2.92
-a2.85
-a3.38
-
a3.02-
a?. 95
a"5.38-
Discharge (cfs)
-144-
236-
208-
156-
148
-71-
145
157
a Backwater from ice.
MISSOURI RIVER MAIN STEM
182. Beaverhead River tributary No. 2 near Dlllon, Mont.
Location. Lat 45°19', long 112°32', in NW£ sec.13, T.6 S. , R.8 W. , at culvert on State Highway 41, 9 miles northeast of Dillon.
Drainage area. 0.40 sq mi.
Gage.--Crest-stage gage. Altitude of gage is 5,300 ft (from topographic map).
Stage-discharge relation.--Defined by current-meter measurements below 5 cfs and extended above on basis of computed flow through culvert u^ing head as indicated by crest-stage gage.
Remarks. Only annual peaks are shown.
Peak stages and discharges
Water year
1958 1959 1960
Date
June 24, 1958
Mar. 19, 1960
Sage height (feet)5.04
.41
Discharge (cfs)
170 (a) 3
Water year
1961 1962 1963
Date
June 12, 1961
Sept. 2, 1963
Qage height (feet)
0.36
.30a No evidence of flow during year.
Discharge (cfs)
2.5 (a) 2
185. Beaverhead River at Blaine, Mont.
Location.--Lat 45°23', long 112 "27', in NW^SE^ sec. 22, T.5 S., R.7 W., on left bank at downstream side of bridge on State Highway 41, 11^ miles upstream from Ruby River and 14^ miles northeast of Dillon.
Drainage area.--3.619 sq mi.
Gage.--Nonrecording prior to June 29, 1951; recording thereafter. At bridge half a mile upstream at different datum prior to Feb. 17, 1949. Altitude of gage is 4,810 ft (by barometer).
Stage-discharge relation. Defined by current-meter measurements below 2,200 cfs at former site and below 1,500 cfs at present site.
Remarks.--Some regulation by Lima Reservoir (usable capacity, 84,050 acre-ft). Diversions for irrigation of about 115,000 acres above station. Only annual peaks are shown.

MISSOURI RIVER MAIN STEM 65
Peak stages and discharges of Beaverhead River at Blalne, Mont.
Water year
19361937193819391940
19411942
1943
19441945
19461947194819491950
Date
Aug. 12, 1936Nov. 14, 1936July 5, 1938Mar. 27, 1S39Feb. 8, 1940Sept. 29, 1940
June 10, 1941Feb. 20, 1942June 12, 1942Jan. 24, 1943June 16, 1943June 12. 1944
(bj
May 30, 1946June 12, 1947June 26. 1948Apr. 8, 1949Sept. 30, 1950
Gage height (feet)
3.483.034.264.15
a4.26-
4.09a4.86
-a5.20
-6.763.51
3.945.255.755.805.29
Discharge (cfs)
720472
1,0001,170
-860
1,090-
1,300-
1,3203,130
620
9001,7102.1801,100
848
Water year
19511952195319541955
1956
1957
19581959
1960
196119621963
Date
Feb. 12, 1951June 28, 1952June 10, 1953Nov. 29, 1953July 1, 1955
Nov. 20, 1955Mar. 26, 1956Jan. 11, 1957June 19, 1957July 5, 1958Jan. 12, 1959July 1, 1959Mar. 27, 1960
Nov. 26, 1960June 7, 1962Feb. 8, 1963
Gage height (feet)
5.766.476.175.054.62
a7.23
a6.96_
6.00a6.58
6.38
4.846.057.05
Discharge (cfs)
1,1101,4401,240
714587
_1,430
1,6301,140
_1,2201,370
5991,0401,430
a Backwater from ice.b Nov. 25-27, Dec. 5-7, 1944.
RUBY RIVER BASIN
190. Ruby River above Warm Springs Creek, near Alder, Mont.
Location.--Lat 44°59'40", long 111 0 57'50", in NW£ sec.3, T.10 S., R.3 W., on right bank 2j miles upstream from Warm Springs Creek and 24 miles scuth of Alder.
Drainage area. 145 sq mi.
Gage.--Wonrecording at bridge 1 mile downstream at different datura prior to July 20, 1948; recording at present site and datum thereafter. Altitude of gage is 6,200 ft (from topographic map).
Stage-discharge relation.--Defined by current-meter measurements below 640 cfs.
Remarks.--Peaks are principally from snowmelt. Base for partial-duration series, 500 cfs.
Peak stages and discharges
Water year
1948
1949
1950
Date
May 21, 1948
May 11, 1949May 17, 1949May 22, 1949May 28, 1949June 6, 1949
May 17, 1950May 23, 1950May 28, 1950June 6, 1950
Qage height (feet)4.0
3.053.342.732.832.71
3.013.073.183.45
Discharge (cfs)
1,050
660776532572524
531554597706
Water year
1950
1951
1952
1953
Date
June 11, 1950
May 23, 1951
May 3, 1952May 13, 1952May 29, 1952June 5, 1952
June 2, 1953June 13, 1953June 17, 1953
Gage height (feet)
3.02
3.08
4.363.052.922.90
2.884.203.30
Discharge (cfs)
535
558
1,230568536536
5421,150
730
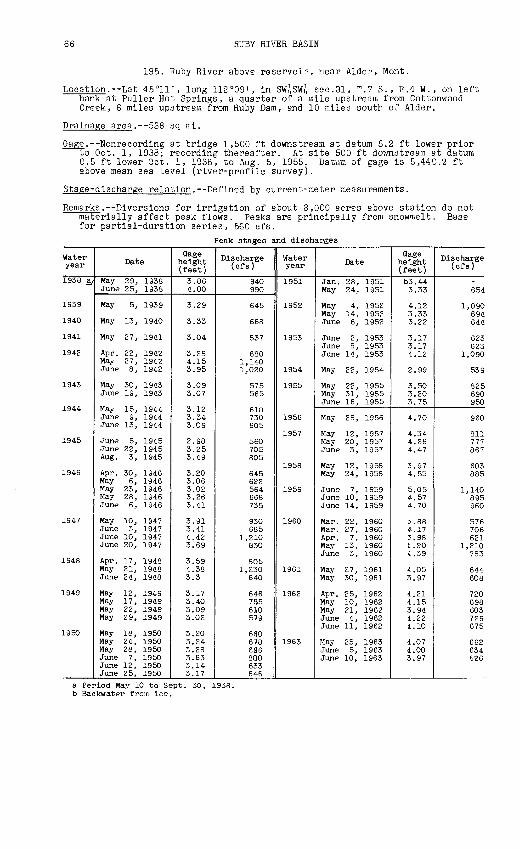
66 RUBY RIVER BASIN
195. Ruby River above reservoir, near Alder, Mont.
Location. Lat 45°11', long 112°09', in SW^SW£ sec.31, T.7 S., R.4 W., on left bank at Puller Hot Springs, a quarter of a mile upstream from Cottonwood Creek, 6 miles upstream from Ruby Dam, and 10 miles south of Alder.
Drainage area.--538 sq mi.
Gage.--Nonrecording at bridge 1,500 ft downstream at datum 5.2 ft lower prior to Oct. 1, 1938; recording thereafter. At site 500 ft downstream at datum 0.5 ft lower Oct. 1, 1938, to Aug. 5, 1955. Datum of gage is 5,440.2 ft above mean sea level (river-profile survey).
Stage-discharge relation.--Defined by current-meter measurements.
Remarks. Diversions for irrigation of about 3,000 acres above station do not materially affect peak flows. Peaks are principally from snowmelt. Base for partial-duration series, 560 cfs.
Peak stages and discharges
Water year
1938 a/
1939
1940
1941
1942
1943
1944
1945
1946
1947
1948
1949
1950
Date
May 29, 1938June 25, 1938
May 5, 1939
May 13, 1940
May 27, 1941
Apr. 22, 1942May 27, 1942June 8, 1942
May 30, 1943June 19, 1943
May 15, 1944June 9, 1944June 13, 1944
June 5, 1945June 22, 1945Aug. 3, 1945
Apr. 30, 1946May 6, 1946May 23, 1946May 28, 1946June 6, 1946
May 10, 1947June 3, 1947June 10, 1947June 20, 1947
Apr. 17, 1948May 21, 1948June 24, 1948
May 12, 1949May 17, 1949May 22, 1949May 29, 1949
May 18, 1950May 24, 1950May 28, 1950June 7, 1950June 12, 1950June 25, 1950
Oage height (feet)3.864.00
3.29
3.33
3.04
3.284.153.95
3.093.07
3.123.343.09
2.983.253.49
3.203.063.023.263.41
3.913.414.423.69
3.594.383.3
3.173.403.093.02
3.203.243.283.633.143.17
Discharge (cfs)
940990
645
668
537
6801,1401,020
575565
610730605
560705805
645622564668735
930685
1,210830
8051,230
640
646755610579
660678696800633646
Water year
1951
1952
1953
1954
1955
1956
1957
1958
1959
1960
1961
1962
1963
Date
Jan. 28, 1951May 24, 1951
May 4, 1952May 14, 1952June 6, 1952
June 2, 1953June 8, 1953June 14, 1953
May 22, 1954
May 22, 1955May 31, 1955June 16, 1955
May 28, 1956
May 12, 1957May 20, 1957June 3, 1957
May 12, 1958May 24, 1958
June 7, 1959June 10, 1959June 14, 1959
Mar. 22, 1960Mar. 27, 1960Apr. 7, 1960May 13, 1960June 3, 1960
May 27, 1961May 30, 1961
Apr. 25, 1962May 10, 1962May 21, 1962June 4, 1962June 11, 1962
May 25, 1963June 5, 1963June 10, 1963
Oage height (feet)b3.443.33
4.123.333.22
3.173.174.12
2.99
3.503.203.75
4.70
4.344.264.47
3.974.55
5.054.574.70
3.884.173.98f .204.39
4.053.97
4.214.153.944.224.10
4.074.003.97
Discharge (cfs)
_654
1,090694644
623623
1,090
539
825690950
960
811777867
603885
1,140895960
576706621
1,210783
644608
720698603729675
662634626
a Period May 10 to Sept. 30, 1938. b Backwater from ice.

RUBY RIVER BASIN 67
200. Ruby River at damsite, near Alder, Mont. (Published as Ruby River near Alder, 1911, and Passamari River
near Alder, 1912-14)
Location. Lat 45°14', long 112°07', in SE^ sec.8, T.7 S. , R.4 W., 1,500 ft above damsite and 6 miles south of Alder.
Drainage area.--592 sq mi.
Gage. Nonrecording. At site 2 miles upstream at different datum Apr. 28,1911, to June 30, 1914. Altitude of gage is 5,300 ft (from topographic map).
Stage-discharge relation. Defined by current-meter measurements below 720 cfs at site used 1911-14 and below 550 cfs at last site used.
Remarks.--Diversions for irrigation of about 3,500 acres above station do not materially affect peak flows. Peaks are principally from snowmelt. Only annual peaks are shown.
Peak stages and discharges
Water year
1911 1912
1914
Date
June 4, 9, 1911 May31,June 3,1912
May 23, June 4, 1914
Gage height (feet)
6.36.7
6.4
Discharge (cfs)
920 1,060
935
Water year
1935 1936
Date
June 9, 1935 Aug. 14, 1936
Gage height (feet)
3.02 8.00
Discharge (cfs)
740 1,800
210. Ruby River near Alder, Mont.
Location.--Lat 45°17'30", long 112°06'00", in NW^NEf sec.28, T.6 S., R.4 W. , on left bank 200 ft upstream from highway bridge, 2| miles south of Alder, 3 miles downstream from Ruby River Reservoir, and 6 miles upstream from Alder Creek.
Drainage area.--614 sq mi.
Gage.--Nonrecording prior to July 1946; recording thereafter. At site 1,200 ft downstream at different datum prior to Apr. 28, 1932. At bridge 200 ft downstream at different datum Apr. 28, 1932, to June 30, 1939. Altitude of gage is 5,190 ft (from topographic map).
Stage-discharge relation.--Defined by current-meter measurements below 800 cfs and extended above by logarithmic plotting.
Remarks.--Regulation by Ruby River Reservoir since 1937 (total capacity,38,950 acre-ft). Diversions for irrigation of about 9,500 acres, of which about 5,000 acres are below station. Regulation and diversions materially affect peak flows. Only annual peaks are shown.
Peak stages and discharges
Water year
1929 1930
1931 1932 1933
1935
1936 1937 1938 1939
1947 1948 1949
Date
May 25, 1929 Apr. 8, 1930
May 17, 1931May 20, 1932 June 3, 1933
July 9, 1935
Aug. 11,14, 1936 May 10, 1937 June 9, 1938 May 7, 1939
June 11, 1947 May 31, 1948 Jan. 13, 1949
Gage height (feet)
3.55 2.55
2.782.60 2.76
2.58
3.70 1.58 2.32 2.64
5.35 4.85
a3.88
Discharge (cfs)
745 409
470512586
530
965 204 450 510
1,380 1,080
Water year
1949 1950
1951
1952 1953 1954 1955
1956
1957 1958 1959 1960
Date
Mar. 22-2 5,1949 June 25, 1950
Nov. 14, 1950 Jan. 31, 1951 May 9, 1952 June 15, 1953 July 3, 1954 June 17, 1955
Dec. 30, 1955 May 29, 1956 June 4, 1957 Nov. 17, 1957 June 15, 1959 May 14, I960
Gage height (feet)
3.52
a2.95 3.36 4.42 2.82 3.98
a3.76
4.03 3.57 4.05 4.82
Discharge (cfs)
248 470
165
386 830 212 554
389 564 270 566 814
a Backwater from ice.

68 RUBY RIVER BASIN
215. Ruby River at Laurin, Mont.
Location. Lat 45°21', long 112°07', in SW^SE^ sec.32, T.5 S., R.4 W., on right bank 200 ft downstream from highway bridge in Laurin and three-quarters of a mile upstream from Alder Creek.
Drainage area. 650 sq mi.
Gage. Recording. Altitude of gage is 5,045 ft (from topographic map).
Stage-discharge relation. Defined by current-meter measurements below 670 cfs.
Remarks.--Flow regulated by Ruby River Reservoir (total capacity, 38,950acre-ft). Diversions for irrigation of about 13,000 acres. Pvpass flow of Clear Creek (secondary channel of Ruby River) not included in discharge. Peak flows are materially affected. Only annual peaks are shown.
Peak stages and discharges
Water year
1947194S1949
1950
1951
19521953
Date
June 11, 1947June 5, 1948Jan. 29, 1949Apr. 12, 1949June 25, 1950
Nov. 12, 1950Jan. S, 1951May 9, 1952June 16, 1953
Qage height ( feet )
6.435.64
a3.88-
4.57
-a3.S64.385.05
Discharge (cfs)
980737-
230442
143-
382568
Water year
19541955
1956
1957195S
19591960
Date
July 20, 1954June 17, 1955
Nov. 17, 1955May 29, 1956May 21, 1957Nov. 20, 1957Nov. 21, 1957June 15, 1959May 14, 1960
G>o;e height (fset)
3.274.67
a4.13-
4.51_
a3.894.325.17
Discharge (ofs)
117473
_250352227_
367564
a Backwater from ice.
220. Ruby River below Ramshorn Creek, near Sheridan, Mont.
Location.--Lat 45°25', long 112°12', near east line of SW^ sec.10, T.5 S., R.5 W., on downstream end of right abutment of highway bridge, half a mile downstream from Ramshorn Creek and 3 miles south of Sheridan.
Drainage area. 843 sq mi.
Gage. Nonrecording prior to Nov. 27, 1951; recording thereafter. Altitude of gage is 4,890 ft (from topographic map).
Stage-discharge relation. Defined by current-meter measurements below 1,100 cfs.
Remarks.--Plow regulated by Ruby River Reservoir (total capacity, 58,950 acre-ft). Diversions for irrigation of about 15,000 acres above station. Peak flows are materially affected. Only annual peaks are shown.
Peak stages and discharges
Water year
1947 1948 1949 1950
Date
June 14, 1947 June 4, 194S Oct. 30, 1948 June 25, 1950
(Jage height ( feet )
6.32 5.62 3.25 4.07
Discharge (ofs)
1,340 1,050
338 501
Water year
1951 1952 1953
Date
Aug. 28, 1951 June 7, 1953 June 16, 1953
Gfge height (feet)
2.89 3.964.38
Discharge (ofs)
263 472 763

RUBY RIVER BASIN 69
230. Ruby River near Twin Bridges, Mont.
Location. Lat 45°30'30", long 112°19'50", in NE^NW^ sec.10, T.4 S., R.6 W., on right bank at upstream side of county bridge, 1-jj- miles upstream fron mouth and 2-| miles south of Twin Bridges.
Drainage area. 935 sq mi.
Gage.--Nonrecording at different datum prior to June 30, 1943; recording there after. Altitude of gage is 4,670 ft (by barometer).
Stage-discharge relation. Defined by current-meter measurements below 1,300 cfs.
Remarks. Some regulation by Ruby River Reservoir (total capacity, 38,950acre-ft). Diversions for irrigation of about 28,500 acres. Peak flows are materially affected. Only annual peaks are shown.
Peak stages and discharges
Water year
1942
1943
1947194819491950
1951
1952
19531954
Date
Jan. 9, 1942June 12, 1942Jan.29,30, 1943June 21, 1943
June 12, 1947June 4, 1948Mar. 23, 1949Dec. 16, 1949June 26, 1950
Oct. 6, 1950Feb. 1, 1951Jan. 2, 1952June 7, 1952June 19, 1953Nov. 26, 1953Jan. 21, 1954
Qage height (feet)a4.0
-a2.60
-
6.896.844.35
a5. 77-
-a5.40a5.95
-5.65-
a5. 72
Discharge (cfs)
-1,040
-466
1,5001,470
395-547
294--839903235-
Water year
1955
195619571958
1959
1960
1961
1962
1963
Date
January 1955June 19, 1955
May 30, 1956June 9, 1957Jan. 8, 1958June 25, 1958Jan. 3, 1959June 27, 1959Jan. 22, 1960May 15, 1960
Dec. 10, 1960July 6, 1961Jan. 25, 1962June 17, 1962June 22, 1963
Gage height (feet)a5.56
-
4.875.86
a6.40-
a5.74-
a5.50-
a4.98-
a6.22_
6.61
Discharge (cfs)
-473
475754_
536_
524-
637
_262-
779944
a Backwater from Ice.
BIG HOLE RIVER BASIN
235. Big Hole River near Jackson, Mont.
Location. Lat 45°14'20", long 113°27'30", in NW^NW^ sec.9, T.7 S., R.15 W., on right bank 1 mile downstream from Pioneer Creek and 9 miles southwest of Jackson.
Drainage area. 44.0 sq mi.
Gage. Nonrecording at site 100 ft upstream at datura approximately 1.0 ft higher prior to June 20, 1948; recording at present site and datum there after. Altitude of gage is 6,970 ft (by barometer).
Stage-discharge relation. Defined by current-meter measurements below 500 cfs and extended above by logarithmic plotting.
Remarks. Natural storage in lakes at headwaters. No winter records after 1951. Peaks are principally from snowmelt. Base for partial-duration series, 120 cfs.
Peak stages and discharges
Water year
1948
1949
1950
Date
May 29, 1948
Apr. 29, 1949May 16, 1949May 30, 1949June 8, 1949
Apr. 14, 1950May 23, 1950June 7, 1950
Gage height (feet)
4.45
-3.643.223.11
-2.783.24
Discharge (cfs)
938
140352273250
(a)178277
Water year
1950
1951
Date
June 12, 1950June 22, 1950July 2, 1950July 11, 1950
May 12, 1951May 24, 1951June 17, 1951July 4, 1951
Gage height (feet)
2.954.413.262.78
3.173.703.622.97
Discharge (cfs)
214520281178
271377361227
a Unknown; probably exceeded base discharge.

70 BIG HOLE RIVER BASIN
Peak stages and discharges of Big Hole River near Jackson, Mont. Continued
Water year
1952
Date
May 3, 1952 May 14, 1952 June 1, 1952 June 21, 1952 June 24, 1952
Qage height (feet)3.04 3.07 3.79 2.63 2.72
Discharge (cfs)
234 241 381 149 166
Water year
1953
Date
May 20, 1953 June 2, 1953 June 14, 1953 June 19, 1953 July 1, 1953
Gage height (feet)
2.66 3.48 4.17 4.33 3.33
Discharge (cfs)
145 313 465 484 283
240. Miner Creek near Jackson, Mont.
Location.--Lat 45°20', long 113°33', in SW£ sec.3, T.6 S. , R.16 V., on right bank 1 mile downstream from Miner Lake, 7 miles southwest of Jackson, and 1\ miles upstream from mouth.
Drainage area.--17.6 sq mi.
Gage.--Recording. Altitude of gage is 6,960 ft (by barometer).
Stage-discharge relation.--Defined by current-meter measurements below 300 cfs.
Remarks. Natural storage in Miner Lake. Peaks are principally from snowmelt. Base for partial-duration series, 80 cfs.
Peak stages and discharges
Water year
1948
1949
1950
1951
Date
May 2 9 or June3,1948
Apr. 29, 1949May 14, 1949May 29, 1949June 11, 1949
Apr. 14, 1950May 24, 1950May 28, 1950June 6, 1950June 12, 1950June 22, 1950July 2, 1950July 11, 1950
Apr. 7, 1951May 14, 1951
Oage height (feet)3.34
1.832.742.512.49
-2.182.182.742.283.472.692.24
3.082.38
Discharge (cfs)
a300
87207182178
(b)133132210139336208142
(b)150
Water year
1951
1952
1953
Date
May 24, 1951May 28, 1951June 16, 1951July 5, 1951July 20, 1951
Apr. 8, 1952May 4, 1952May 14, 1952June 5, 1952June 22, 1952June 25, 1952
May 19, 1953June 2, 1953June 13, 1953June 18, 1953June 23, 1953July 1, 1953
Gage height (feet)
3.022.923.042.391.95
E3.172.362.403.022.132.20
2.112.S73.573.502.842.72
Discharge (cfs)
24823125015093
-153158248123132
104204310299200183
a About; maximum for period May 24 to Sept. 30. b Not known; probably exceeded base discharge.
245.. Trail Creek near Wisdom, Mont.
Location.--Lat 45°39', long 113°43', in SW£ sec.16, T.2 S., R.17 W., on left bank 100 ft downstream from Runaway Creek, 4 miles upstream from Ruby Creek, and 13 miles west of Wisdom.
Drainage area.--71.4 sq mi.
Gage.--Recording. Altitude of gage is 6,250 ft (by barometer).
Stage-discharge relation.--Defined by current-meter measurements below 850 cfs.
Remarks.--No winter records collected after 1951. Peaks are principally from snowmelt. Base for partial-duration series, 200 cfs.

BIG HOLE RIVER BASIN 71
Peak stages and discharges of Trail Creek near Wisdom, Mont.
Water year
1948
1949
1950
1951
Date
-
Apr. 29, 1949May 15, 1949
Apr. 3, 1950Apr. 15, 1950Apr. 18, 1950May 18, 1950May 24, 1950June 7, 1950June 17, 1950
Apr. 29, 1951
Gage height ( feet )
4.27
3.074.90
2.642.562. 603.583.934.284.27
2.51
Discharge (cfs)
a694
405858
288267277524601689686
254
Water year
1951
1952
1953
Date
May 12, 1951May 24, 1951June 5, 1951June 13, 1951
Apr. 29, 1952May 14, 1952May 26, 1952
May 7, 1953May 20, 1953June 2, 1953June 13, 1953
Oage height (feet)
4.624.573.062.89
4.424.474.16
2.783.855.895.47
Discharge (cfs)
779765379332
725739655
219493
1,070973
a Annual peak only.
255. Big Hole River near Melrose, Mont.
Location. Lat 45°32', long 112°42', in SW£ sec.34, T.3 S., R.9 W., on left bank at downstream side of bridge on Interstate Highway 15 and U.S. High way 91, an eighth of a mile downstream from Rock Creek and 7 miles south of Melrose.
Drainage area. 2,476 sq mi.
Gage. Recording prior to June 14, 1927, and since Sept. 30, 1931; nonrecording July 17, 1927, to Sept. 30, 1931. At site l| miles upstream at different datum prior to Oct. 1, 1931. Datum of gage is 5,032.87 ft above mea^ sea level, datum of 1929 (levels by Bureau of Reclamation).
Stage-discharge relation. Defined by current-meter measurements below 8,000 cfs at former site and below 14,000 cfs at present site.
Remarks. Diversions for irrigation of about 136,000 acres above station do not materially affect peak flows. Peaks are principally from snowmelt. Base for partial-duration series, 3,400 cfs.
Peak stages and discharges
Water year
1924
1925
1926
1927
1928
1929
1930
1931
1932
1933
1934
1935
1936
Date
May 19, 1924
May 23, 1925June 5, 1925June 23, 1925
Apr. 12, 1926Apr. 19, 1926
June 14, 1927
May 26, 1928
June 19, 1929
Apr. 9, 1930
June 5, 1931
June 17, 1932
June 5, 1933
Apr. 25, 1934
June 3, 1935June 13, 1935
Apr. 15, 1936Apr. 25, 1936May 16, 1936June 4, 1936
Gage height (feet)6.00
6.427.055.91
5.385.10
14.0
7.6
6.38
5.70
3.60
4.88
5.95
3.95
4.164.47
5.375.104.945.50
Discharge (cfs)
4,600
5,7106,9604,770
3,8803,460
a23,000
b9,230
b7 , 100
b5,690
b2,160
6,290
8,550
3,380
3,9204,520
6,7906,0705,7107,030
Water year
1937
1938
1939
1940
1941
1942
1943
1944
1945
Date
May 20, 1937
Apr. 19, 1938May 3, 1938May 30, 1938July 3, 1938
Apr. 14, 1939May 6, 1939May 25, 1939
May 28, 1940
May 29, 1941June 7, 1941
Apr. 12, 1942Apr. 22, 1942May 14, 1942May 27, 1942June 10, 1942
Apr. 10, 1943May 31, 1943June 22, 1943
May 20, 1944June 11, 1944June 29, 1944
June 8, 1945June 27, 1945
Gage height (feet)
3.43
4.894.185.736.39
3.995.004.43
3.96
4.284.82
6.194.123.997.726.83
4.326.476.26
4.165.994.79
4.614.46
Discharge (cfs)
2,390
5,5903,9207,1708,760
3,7006,2905,200
3,380
3,9105,200
8,9904,1203,70012,50010,100
4,1209,5008,910
3,5507,8304,940
4,4904,270
a Annual peak only; result of failure of Wise River Reservoir dam.b Annual peak only (observed) .

72 BIG HOLE RIVER BASIN
Peak stages and discharges of Big Hole River near Melrose, Mont. Continued
Water year
1946
1947
1948
1949
1950
1951
1952
1953
1954
1955
Date
May 9, 1946May 30, 1946
Apr. 20, 1947May 10, 1947June 11, 1947
Apr. 18, 1948June 3, 1948July 4, 1948
Apr. 19, 1949Apr. 29, 1949May 17, 1949June 2, 1949
June 22, 1950
Apr. 9, 1951Apr. 13, 1951May 13, 1951May 25, 1951June 16, 1951
Apr. 20, 1952May 17, 1952June 27, 1952
June 4, 1953June 14, 1953
May 21, 1954June 12, 1954June 28, 1954
May 23, 1955June 16, 1955July 2, 1955
Oage height (feet)4.635.16
4.447.455.17
6.57.764.0
4.914.615.785.88
6.16
4.334.135.665.805.01
5.755.624.01
7.026.57
5.114.325.01
4.295.374.57
Discharge (ofs)
4,6005,750
4,24013,6005,630
9,50014,1003,810
5,4304,6807,7608,040
8,860
3,8103,4006,6707,0605,120
7,6807,3203,540
11,5009,490
5,7103,9605,580
3,7606,2404,350
Water year
1956
1957
1958
1959
1960
1961
1962
1963
Date
Apr. 23, 1956May 12, 1956May 27, 1956June 18, 1956
May 21, 1957June 5, 1957
May 13, 1958May 25, 1958June 6, 1958June 13, 1958June 25, 1958
Apr. 16, 1959May 18, 1959June 9, 1959June 16, 1959June 27, 1959
Mar. 28, 1960Apr. 5, 1960Apr. 7, 1960May 13, 1960June 5, 1960
May 30, 1961June 13, 1961
Apr. 17, 1962May 22, 1962June 4, 1962June 15, 1962
June 5, 1963June 24, 1963
Gage hsight (feet)
4.724.367.194.35
6.135.71
4.646.055.485.344.30
-4.045.835.444.80
5.174.594.404.534.99
4.884.92
4.944.744.605.17
5.575.08
Discharge (cfs)
4,6803,900
11,8003,880
8,9407,410
4,6008,2706,7406,4204,050
(c)3,5007,9006,9005,300
6,1804,7104,2504,7605,840
5,3505,450
5,5004,9204,4705,950
7,2006,020
c Unknown; probably exceeded base discharge
260. Birch Creek near Glen, Mont.
Location.--Lat 45°22'45", long 112°47'50", in SE^SE^ sec.23, T.5 S., R.10 W. , on left bank 2^ miles downstream from Sheep Creek and 8 miles southwest of Glen.
Drainage area. 36.0 sq mi.
Gage. Recording. At site 1^ miles upstream at different datum prior to Nov. 16, 1949. Altitude of gage is 5,860 ft (from topographic map).
Stage-discharge relation. Defined by current-meter measurements below 160 cfs.
Remarks. Some regulation at lakes in headwaters. Water divertel from Willow Creek basin into Birch Creek above station materially affects peak flows. Peaks are principally from snowmelt. Only annual peaks are s'lown.
Peak stages and discharges
Water year
1946 1947 1948
1949
1950
1951 1952 1953
1955
1956
Date
May 28, 1946 June 18, 1947 Dec. 12, 1947 June 3, 1948 Dec. 9, 1948 May 16, 1949Mar. 13, 1950 June 22, 1950
June 16, 1951 June 7, 1952 June 13, 1953
June 29, 1955
Jan. 30, 1956
Gage height (feet)
3.26 3.42
a4.75
a4.14
a4.09
3.25 3.32 3.65
3.71
a4.50
Discharge (cfs)
90 140
175
?.39
E06
144 173 E23
166
Water year
1956 195.7
1958
1959
1960
1961
1962
1963
Date
June 6, 1956 Nov. 17, 1956 June 6, 1957 Mar. 12, 1958 May 23, 195S Mar. 14, 1959 June 16, 1959 Nov. 15, 1959 June 3, 1960
May 26, 1961 June 12, 1961 June 16, 1962 Aug. 10, 1962 June 14, 1963 June 21, 1963
Gage height (feet)
a3.97
a4.41
a4.48
a5.33
4.13
4.43 4.51
Discharge (cfs)
246
200
228
t>180
130
195147
362
a Backwater from ice. b Maximum daily discharge.

MISSOURI RIVER MAIN STEM 73
265. Jefferson River near Twin Bridges, Mont.
Location.--Lat 45°36'50", long 112"19'45", in SE^SW^ sec.34, T.2 S., R.6 W., on left bank 250 ft upstream from private bridge, an eighth of a mile upstream from Hell Canyon Creek, 4 miles downstream from confluence of Beaverhead and Big Hole Rivers, and 5 miles north of Twin Bridges.
Drainage area. 7,632 sq mi.
_.--Nonrecording at site 250 ft downstream at datum 4.46 ft lower August 1940 to September 1943; recording at present site and datum since October 1957. Altitude of gage is 4,560 ft (from topographic map).
Stage-discharge relation.--Fairly stable at high flows. Defined by current- meter measurements below 11,000 cfs at former site and below 7,900 cfs at present site.
Remarks.--Diversions for irrigation of about 300,000 acres above station. Some regulation by Lima Reservoir (usable capacity, 84,050 acre-ft) and Ruby River Reservoir (total capacity, 38,950 acre-ft). Diversions and regula tions do not materially affect peak flows. Peaks are principally from snow- melt. Only annual peaks are shown.
Peak stages and discharges
Water year
1942 1943
1958 1959 1960
Date
May 28, 1942 June 1, 1943
May 27, 1958 June 10, 1959 Jan. 18, 1960
Qage height (feet)12.53 11.94
7.04 6.94
a6.31
Discharge (cfs)
13,200 10,200
8,140 8,040
Water year
1960
1961 1962 1963
Date
Mar. 29, 1960
June 13, 1961 June 16, 1962 Feb. 4, 1963 June 25. 1963
Gage height (feet)
5.89 6.42
a7.28
lischarge (cfs)
6,270
5,460 6,820
8.240a Backwater from ice.
270. Jefferson River near Silverstar, Mont.
Location. Lat 45°39', long 112°18', in SW£ sec.23, T.2 S., R.6 W., on highway bridge half a mile west of Ironrod, 4 miles southwest of Silverstar, and 7 miles downstream from confluence of Beaverhead and Big Hole Rivers.
Drainage area. 7,683 sq mi.
Gage. Nonrecording. Altitude of gage is 4,550 ft (by barometer).
Stage-discharge relation. Defined by current-meter measurements below 14,000 cfs.
Remarks. Diversions for irrigation of about 300,000 acres above statior. Peaks are principally from snowmelt. Base for partial-duration series, 4,000 cfs.
Peak stages and discharges
Water year
1911
1912
1913
1914
1915
1916
Date
June 16, 1911
June 15, 1912
Apr. 16, 1913May 13, 1913May 30, 1913June 15, 1913June 29, 1913
May 11, 1914May 24, 1914June 6, 1914
Apr. 22, 1915May 2, 1915May 21, 1915June 7, 1915June 15, 1915July 11, 1915
May 7, 1916
Qage height (feet)
6.4
7.9
5.66.18.59.06.1
4.95.756.25
4.44.54.75.15.65.1
5.55
Discharge (cfs)
9,280
13 , 400
7,2608,61015,60017,1008,610
5,4407,6609,030
4,3204,5505,0105,9707,2605,970
7,120
Water year
1916
1921
1922
1923
1924
1925
1926
1927
Date
June 23, 1916
June 11, 1921
May 8, 1922May 27, 1922June 11, 1922June 17, 1922
May 29, 1923June 14, 1923June 27, 1923
May 19, 1924
May 24, 1925June 6, 1925June 23, 1925
Apr. 20, 1926
Apr. 30, 1927
Gage height (feet)
7.75
7.8
5.27.17.87.5
5.655.205.70
4.80
5.606.205.40
4.65
5.10
I Ischarge (cfs)
13,500
13,500
6,22011,40013 , 50012,600
7,4006,2207,530
5,240
7,2608,8906,730
4,900
5,970

74 MISSOURI RIVER MAIN STEM
Peak stages and discharges of Jefferson River near Silverstar, Mont.--Continued
Water year
1927
1928
1929
1930
1931
1932
1933
Date
May 20, 1927June 15, 1927
Apr. 28, 1928May 13, 1928May 28, 1928
Apr. 30, 1929May 26, 1929June 19, 1929
Apr. 10, 1930Apr. 26, 1930
Apr. 14, 1931
May 15, 1932May 23, 1932June 8, 1932June 19, 1932
June 11, 1933
Oage height (feet)
5.3010.0
5.407.106.80
4.404.805.80
5.404.20
3.40
4.204.805.205.30
6.1
Discharge (cfs)
6,470a20,300
9,73011,40010,600
4,5505,4808,070
7,4804,210
2,460
4,2105,7006,7006,960
9,130
Water year
1934
1935
1936
1937
1938
1939
Date
May 11, 1934
June 14, 1935
Apr. 16, 1936Apr. 20, 1936Apr. 25, 1936May 16, 1936June 5, 1936
Mar. 6, 1937May 8, 1937
May 30, 1938June 25, 1938July 4, 1938
Apr. 5, 1939May 6, 1939May 24, 1939
0,->.i;e height (fset)
3.98
4.70
4.804.805.205.205.47
b5.503.39
5.504.907.50
4.505.004.95
Discharge (cfs)
3,410
4,960
5,2005,2006,2106,2107,000
_2,090
6,7305,200
12,400
4,3505,4705,360
a Affected by failure of Wise River Reservoir, b Backwater from ice.
FISH CREEK BASIN
277. Fish Creek near Silverstar, Mont.
Location.--Lat 45°46', long 112°15', in NW£ sec.8, T.I S., R.5W., at bridge on county road, 6 miles north of Silverstar.
Drainage area.--39.5 sq mi.
Gage. Crest-stage gage. Altitude of gage is 4,800 ft (from topographic map).
Stage-discharge relation.--Defined by current-meter measurements below 100 cfs.
Remarks. Peaks are principally from snowmelt. Only annual peaks are shown.
Peak stages and discharges
Water year
1959 1960
1961
Date
June 6, 1959 May 13, 1960
Apr. 4, 1961
Oage height (feet)
1.15 .91
1.13
Discharge (cfs)
166 105
160
Water year
1962 1963
Date
June 3, 1962 June 11, 1963
Of>?e height (feet)
0.951.16
Discharge (cfs)
115 141
PIPESTONE CREEK BASIN
285. Little Pipestone Creek near Whitehall, Mont.
Location.--Lat 45°50', long 112°17 I , in NE^ sec.13, T.I N,, R.6 ¥., 500 ft down stream from Rader Creek and 9 miles west of Whitehall.
Drainage area.--30.7 sq mi.
Gage.--Nonrecording. At different datum prior to Oct. 1, 1938. Altitude of gage is 4,820 ft (by barometer).
Stage-discharge relation. Defined by current-meter measurements below 40 cfs.
Remarks.--Diversions for irrigation of about 250 acres do not materially affect peak flows. Peaks are principally from snowmelt. Only annual peaks are shown.
Peak stages and discharges
Water year
1935
1936 1937
Date
July 4, 1935
June 25, 1936 Apr. 20, 1937
Oage height (feet)2.30
1.10 1.05
Discharge (cfs)
74
8.8 7.2
Water year
1938 1939 1940
Date
July 1, 1938 Mar. 19, 1939 May 4, 1940
Oage height (feet)
3.01.22 .87
Discharge (cfs)
175 12.2 7.7

UNNAMED BASIN 75
303. Jefferson River tributary No. 2 near Whitehall, Mont.
Location. Lat 45°53', long 111°59', in SE^ sec.33, T.2 N., R.3 W., at culvert on State Highway 281, 6 miles east of Whitehall.
Drainage area. 4.50 sq mi.
Gage. Crest-stage gage. Altitude of gage is 4,330 ft (from topographic map).
Stage-discharge relation. Defined by computation of flow through culvert using head as indicated by crest-stage gage.
Remarks. Only annual peaks are shown.
Peak stages and discharges
Water year
1953 1959 1960
Date
Jane 24, 1958 Apr. 6, 1959
Qage height (feet)4.45 2.37
Discharge (cfs)
169 71
(a)
Water year
1961 1962 1963
Date
Sept. 11, 1961
Feb. 2, 1963
Qage height (feet)
1.32
1.38
Discharge (ofs)
34 (a) 39
a No evidence of flow during year.
BOULDER RIVER BASIN
305. Boulder River above Rock Creek, near Basin, Mont. (Published as "at CCC camp, near Bernice" April to September 1933)
Location. Lat 46°15'10", long 112°30'10", in SW£ sec.20, T.6 N., R.7 W., on left bank half a mile upstream from Rock Creek, 2 miles upstream fro-n Thunderbolt Creek, and 12 miles west of Basin.
Drainage area. 19.4 sq mi.
Gage.--Recording. Altitude of gage is 6,260 ft (from topographic map).
Stage-discharge relation. Defined by current-meter measurements below 270 cfs.
Remarks. Peaks are principally from snowmelt. Base for partial-duration series, 50 cfs.
Peak stages and discharges
Water year
1947
1948
1949
1950
1951
1952
Date
June 10, 1947
Apr. 22, 1948Apr. 30, 1948May 19, 1948June 3, 1948June 9, 1948June 11, 1948
Apr. 27, 1949May 15, 1949
May 16, 1950May 19, 1950May 21, 1950May 28, 1950June 12, 1950June 17, 1950
May 8, 1951May 12, 1951May 24, 1951June 7, 1951
Apr. 20, 1952Apr. 26, 1952May 4, 1952
Qage height (feet)2.S4
--
3.723.122.602.88
2.132.16
2.502.422.222.102.192.03
2.532.582.512.40
-3.342.51
Discharge (cfs)
a!43
M(b)582253110170
5462
958564556151
10811510490
(b)321118
Water year
1952
1953
1955
1956
1957
Date
May 15, 1952June 6, 1952
May 26, 1953May 30, 1953June 3, 1953June 8, 1953
May 8, 1955May 12, 1955May 20, 1955May 28, 1955June 17, 1955June 30, 1955July 5, 1955July 10, 1955July 12, 1955
Apr. 21, 1956May 10, 1956May 22, 1956
May 1, 1957May 6, 1957May 20, 1957June 8, 1957
Qage height (feet)
2.381.93
2.162.623.393.34
C2.882.702.402.202.102.082.082.192.16
2.522.482.47
2.371.942.652.02
Discharge (ofs)
10050
70128334285
-al!2
78625452526159
8781
106
9752
14059
a Annual peak only.b Not known; probably exceeded base discharge.c Backwater from Ice.
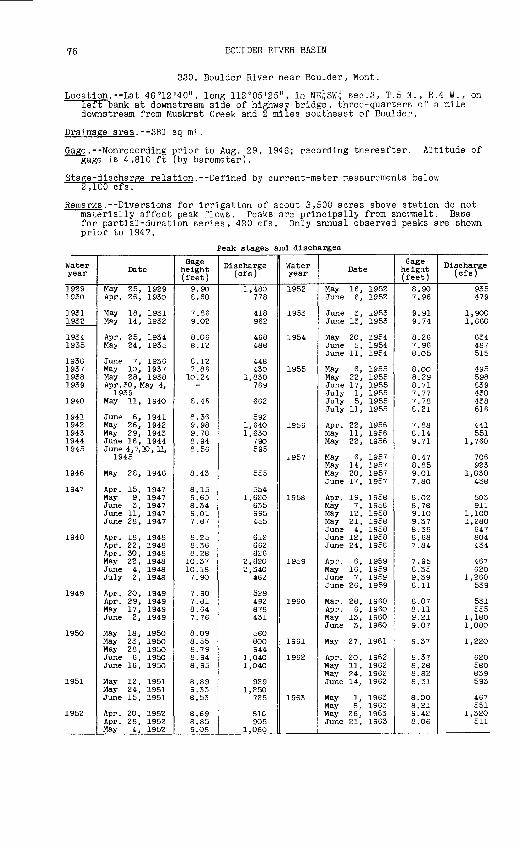
76 BOULDER RIVER BASIN
330. Boulder River near Boulder, Mont.
Location. Lat 46°12'40", long 112°05'25", in NE^SW-J- sec.3, T.5 N., R.4 ¥., on left bank at downstream side of highway bridge, three-quarters of a mile downstream from Muskrat Creek and 2 miles southeast of Boulder.
Drainage area. 381 sq mi.
Gage. Nonrecording prior to Aug. 29, 1946; recording thereafter. Altitude of gage is 4,810 ft (by barometer).
Stage-discharge relation. Defined by current-meter measurements below 2,100 cfs.
Remarks. Diversions for irrigation of about 3,500 acres above station do not materially affect peak flows. Peaks are principally from snovmelt. Base for partial-duration series, 420 cfs. Only annual observed peaks are shown prior to 1947.
Peak stages and discharges
Water year
19291S30
19311932
19341935
1936193719381939
1940
19411942194319441945
1946
1947
1948
1949
1950
1951
1952
Date
May 25, 1929Apr. 26, 1930
May 18, 1931May 14, 1932
Apr. 25, 1934May 24, 1935
June 7, 1936May 10, 1937May 28, 1938Apr. 30, May 4,
1939May 11, 1940
June 6, 1941May 26, 1942May 29, 1943June 16, 1944June 4,7,10, 11,
1945
May 28, 1946
Apr. 15, 1947May 9, 1947June 3, 1947June 11, 1947June 28, 1947
Apr. 18, 1948Apr. 22, 1948Apr. 30, 1948May 22, 1948June 4, 1948July 2, 1948
Apr. 20, 1949Apr. 29, 1949May 17, 1949June 2, 1949
May 18, 1950May 23, 1950May 28, 195OJune 6, 1950June 16, 1950
May 12, 1951May 24, 1951June 15, 1951
Apr. 20, 1952Apr. 28, 1952May 4, 1952
Gage height (feet)
9.908.60
7.869.02
8.068.12
8.127.86
10.24-
8.46
8.369.989.788.948.56
8.43
8.159.6'j8.349.017.87
8.258.368.2810.3710.187.90
7.907.818.647.76
8.098.558.798.948.95
8.899.338.53
8.698.859.08
Discharge (cfs)
1,480778
418962
468488
448430
1,830769
662
5921,6401,630
790595
555
5541,620
635995455
612662626
2,6202,340
462
529492878431
560800944
1,0401,040
9291,250
725
SIC905
1,O60
Water year
1952
1953
1954
1955
1956
1957
1958
1959
1960
1961
1962
1963
Date
May 16, 1952June 6, 1952
June 3, 1953June 13, 1953
May 20, 1954June 5, 1954June 11, 1954
May 6, 1955May 22, 1955June 17, 1955July 1, 1955July 5, 1955July 11, 1955
Apr. 22, 1956May 11, 1956May 22, 1956
May 6, 1957May 14, 1957May 20, 1957June 17, 1957
Apr. 19, 1958May 7, 1958May 12, 1958May 21, 1958June 4, 1958June 12, 1958June 24, 1958
Apr. 6, 1959May 16, 1959June 7, 1959June 26, 1959
Mar. 28, 1960Apr. 6, 1960May 13, 1960June 3, 1960
May 27, 1961
Apr. 20, 1962May 11, 1962May 24, 1962June 14, 1962
May 1, 1963May 8, 1963May 26, 1963June 21, 1963
Gage height (feet)
8.907.96
9.919.74
8.267.968.05
8.OO8.298.717.777.788.21
7.888.149.71
8.478.859.017.80
8.028.789.109.378.368.687.84
7.958.359.398.11
8.078.119.219.07
9.37
8.378.288.828.31
8.008.219.428.06
Discharge (cfs)
935479
1,9001,660
634487515
495598839430438616
441551
1,760
706923
1,030438
503911
1,1001,280
647804434
467620
1,260539
531555
1,1801,080
1,220
620580839593
467551
1,320511

SOUTH BOULDER RIVER BASIN 77
340. South Boulder River near Jefferson Island, Mont. (Previously published as "South Boulder Creek")
Location. Lat 45°39', long 112°01', In SW^ sec.18, T.2 S., R.3 W., 200 ft up stream from diversion dam of Liberty-Montana Mines Co. and 14 miles south of Jefferson Island.
Drainage area. 27.5 sq ml.
Gage.--RecordIng, except nonrecording at about 7 ft lower datum Oct. 1, 1931, To May 10, 1933. Altitude of gage Is 5,400 ft (from topographic map).
Stage-discharge relation. Defined by current-meter measurements below 150 cfs.
Remarks. No diversions or regulation above station. Peaks are principally from snowmelt. Base for partial-duration series, 140 cfs.
Peak stages and discharges
Water year
1926
1927
1928
1929
Date
May 5, 1926 May 20, 1926 May 24, 1926 June 5, 1926 July 8, 1926
June 26, 1927 July 4, 1927
May 26, 1928 June 26, 1928
May 24, 1929
Gage height (feet)
2.62 2.68 2.50 2.52
3.08 2.81
2.91 2.41
2.41
Discharge (cfs)
(a) 227 243 195 200
359281
253143
143
Water year
1929
1930
1931
1932
1933
Date
June 16, 1929 June 28, 1929
May 30, 1930 June 11, 1930 June 17, 1930
June 2, 1931
June 18-22,24, 1932
June 10, 1933
Gage height (feet)3.50 2.76
2.32 2.50 2.32
2.35
9.40
2.84
Tie charge (cfs)
434 215
150 195 150
157
135
305a Not determined; probably exceeded base discharge.
MISSOURI RIVER MAIN STEM
345. Jefferson River at Sappington, Mont.
Location.--Lat 45°48'15", long 111°45'05", in SE^ sec.29, T.I N., R.I W., on right bank at upstream side of bridge on State Highway 287, 1 mile north east of Sappington and 5-| miles upstream from Willow Creek.
Drainage area.--9,277 sq mi.
_.--Nonrecording at railroad bridge l| miles upstream at different dftum 1895 to 1905; recording at present site and datum since August 1938. Alti tude of gage is 4,170 ft (from topographic map).
Stage-discharge relation.--Defined by current-meter measurements below 10,000 cfs and extended above by logarithmic plotting at former site. Defired by current-meter measurements below 17,000 cfs at present site.
Remarks.--Diversions for irrigation of about 345,000 acres above statior. Regu lation by Lima Reservoir (usable capacity, 84,050 acre-ft) and since 1938 by Ruby River Reservoir (total capacity, 38,950 acre-ft) do not materially af fect peak flows. Peaks are principally from snowmelt. Base for partial- duration series, 6,000 cfs. Only annual peaks are shown prior to 1939.
Peak stages and discharges
Water year
1895
1897189818991900
19011902190319041905
1939
Date
May 24, 1895
May 19, 1897May 30, 1898June 23, 1S99Mav 16, 1900
May 20, 1901May 31, 1902June 7, 1903May 26, 1904June 28, 1905
May 26, 1939
Gage height (feet)2.01
4.506.059.656.60
6.306.606.406.654.70
6.91
Discharge (cfs)
3,330
11,04010,13021,00010,300
9,32510,3009,770
10,4005,485
6,000
Water year
1940
1941
1942
1943
Date
Mar. 1, 1940May 29, 1940
Dec. 13, 1940June 8, 1941
Apr. 14, 1942May 30, 1942June 13, 1942
Apr. 22, 1943June 3, 1943June 22, 1943
Gage height (feet)a6.905.84
a8. 297.33
7.869.799.43
7.219.098.56
r'.scharge (cfs)
-4,060
-6,680
8,70014,50013,400
7,15012,70011,000
a Backwater from ice.
219-848 O - 66 - 7

78 MISSOURI RIVER MAIN STEM
Peak stages and discharges of Jefferson River at Sapplngton, Mont.--Continued
Water year
1944
1945
1946
1947
1948
1949
1950
1951
1952
1953
1954
Date
June 13, 1944July 1, 1944
Dec. 28, 1944June 10, 1945
May 31, 1946
May 12, 1947June 13, 1947
Apr. 20, 1948June 6, 1948
Dec. 26, 1948May 19, 1949June 4, 1949
June 22, 1950
Jan. 24, 1951May 26, 1951June 18, 1951
Apr. 21, 1952May 17, 1952
Dec. 2, 1952June 16, 1953
Jan. 20, 1954
Oage height (feet)
8.507.85
a7.176.75
7.05
9.688.47
_10.97
a8.987.687.91
8.29
a9.537.856.70
7.067.80
all. 669.00
a6.64
Discharge (cfs)
10,9009,070
-6,200
6,600
12,8009,830
8,67019,900
-8,0408,540
10,200
_8,4106,020
6,9608,730
-12,200
-
Water year
1954
1955
1956
1957
1958
1959
1960
1961
1962
1963
Date
July 1, 1954
Mar. 30, 1955June 18, 1955
Dec. 23, 1955May 29, 1956
May 23, 1957June 7, 1957
May 14, 1958May 27, 1958June 14, 1958June 26, 1958
June 9, 1959June 17, 1959June 28, 1959
Nov. 19, 1959June 6, 1960
Jan. 6, 1961May 31, 1961
June 17, 1962
Feb. 3, 1963June 8, 1963
Oage height (feet)
6.37
a7.576.98
?10.129.37
8.357.79
6.547.767.516.52
7.777.256.86
alO.176.57
a6.826.48
7.02
a9.227.42
Discharge (cfs)
5,580
-6,910
-13,300
10,5008,880
6,0208,7808,1406,100
8,6507,3806,540
_5,960
-5,790
7,190
-8,110
a Backwater from Ice.
WILLOW CREEK BASIN
350. Willow Creek near Harrison, Mont.
Location.--Lat 45°43'20", long 111°44'20", in SW^NW^ sec.28, T.I S., R.I W., on right bank if miles upstream from Willow Creek Dam, 2j miles northeast of Harrison, and 11 miles upstream from mouth.
1946. Altitude of
Drainage area. 83.8 sq mi.
Gage.--Recording. At datum 0.22 ft higher prior to Oct. 8 ; gage is 4,750 ft (from topographic map).
Stage-discharge relation. Defined by current-meter measurements below 300 cfs and extended above by logarithmic plotting.
Remarks. Diversions for irrigation of about 12,500 acres materially affect peak flows. Peaks are principally from snowmelt. Only annual peaks are shown.
.Peak stages and discharges
Water year
193819391940
19411942194319441945
19461947
19481949
1950
1951
1952
Date
July 3, 1938May 5, 1939June 7, 1940
June 18, 1941June 10, 1942June 22, 1943June 27, 1944June 27, 1945
June 6, 1946Jan. 4, 1947June 21, 1947June 4, 1948Dec. 28, 1948May 17, 1949June 22, 1950
Feb. 2, 1951June 17, 1951Dec. 19, 1951
Oage height (feet)2.521.782.38
2.682.953.094.052.66
2.51a2.89
-2.83
a2.65-
2.07
a2.42-
a2.37
Discharge (cfs)
19680
158
174265246725162
175-
264301-
188182
-115
Water year
19521953
1954
1955
1956
1957195819591960
19611962
1963
Date
July 12, 1952Apr. 11, 1953June 19, 1953Apr. 1, 1954May 22, 1954Jan. 2, 1955June 17, 1955
Feb. 26, 1956May 29, 1956June 9, 1957June 25, 1958June 26, 1959Mar. 18, 1960May 13, 1960
June 14, 1961Dec. 19, 1961June 21, 1962Feb. 3, 1963
Gage \ eight (feet)
_a2.59
-al.90
a2.33_
a2.71-
2.572.522.17
a2.84
2.04a2.32
4.24
Discharge (cfs)
201
198_
118
143
_242259251204
146
177_
174813
a Backwater from Ice.

WILLOW CREEK BASIN 79
355. Norwegian Creek near Harrlson, Mont.
Location. Lat 45°40'40", long 111 043'10", In SW£ sec.10, T.2 S., R.I W., on left bank 3 miles upstream from Willow Creek Reservoir and mouth and 3 miles southeast of Harrlson.
Drainage area. 22.4 sq ml.
Gage.--Recording. Cone-type weir at datum 0.27 ft higher Apr. 22, 1938, to July 4, 1943. Concrete weir at present datum since Sept. 4, 1946. .Altitude of gage is 4,750 ft (from topographic map).
Stage-discharge relation. Defined by current-meter measurements below 20 cfs.
Remarks. Diversions into and out of basin may materially affect peak flows. Only annual peaks are shown.
Peak stages and discharges
Water year
1938 1939 1940
1941
1942
1943
1947
Date
June 29, 1938 Nov. 3, 1938 Apr. 24, 1940
Aug. 30, 1941 Sept. 23, 1941 May 12,16,27,
29, 1942 June 2, 1943
Oct. 5, 1946
Qage height (feet)1.43 1.56 1.58
1.51 1.58
1.48
-
Discharge (cfs)
19 22 19
19
21
23
26
Water year
1947 1948
1949
1950
1951
Date
Jan. 29, 1947 Jan. 15, 1948 July 20, 1948 Nov. 8, 1948 Apr. 12, 1949 Dec. 29, 1949 Sept. 9, 1950
Nov. 17, 1950 Apr. 1, 1951
Gage height (feet)a3.36 a2.53
a2.27
a3.32
a2.41
Discharge (cfs)
28
22
19
21
a Backwater from ice.
365. Willow Creek near Willow Creek, Mont.
Location. Lat 45°45'00", long 111°39'30", in SW^NWi sec.18, T.I S., R.I E., on left bank at upstream side of highway bridge, 4 miles downstream from Willow Creek Reservoir, 5^ miles south of town of Willow Creek, and 6 miles up stream from mouth.
Drainage area. 165 sq mi.
Gage. Nonrecording prior to Nov. 29, 1949; recording thereafter. At different datum prior to Dec. 10, 1932. At site half a mile downstream at different datum Oct. 1, 1947, to Nov. 28, 1949. Altitude of gage is 4,340 ft (from topographic map).
Stage-discharge relation. Defined by current-meter measurements below 2"0 cfs at present site. Defined by current-meter measurements below 140 cfs and extended above by logarithmic plotting at site used Oct. 1, 1947, to Nov. 28, 1949.
Remarks. Plow regulated since 1937 by Willow Creek Reservoir (total capacity, 18,000 acre-ft). Diversions for irrigation of about 12,800 acres above station. Regulation and diversions materially affect peak flows. Only annual peaks are shown.
Peak stages and discharges
Water year
1920
1921 1922 1923 1924 1925
1926 1927 1928 1929
1931 1932
Date
June 17, 1920
June 9, 1921 June 21, 1922 June 19, 1923 Apr. 8, 1924 June 22, 1925
May 8,11, 1926 June 13, 1927 May 29, 1928 June 24, 1929
June 2, 1931 June 16, 1932
Qage height (feet)4.80
4.72 3.40 2.96 2.11 2.54
2.08 3.32 2.74 3.00
2.18 3.16
Discharge (cfs)
295
280 456 388 143 247
149 330 191 251
99192
water year
1947 1948 1949
1950
1951 1952
1953
1955
1956
Date
Jan. 28. 1947July 31, 194S Nov. 26, 1948 Feb. 20. 1949July S, 1950
May 31, 1951 Dec. 9, 1951 June 10, 1952 June 20, 1953
July 28, 1955
June 4, 1956
Gage height (feet)
4.045.20
a3.423.74
3.71 a3.98
4.29
3.63
4.43
D" scharge (cfs)
246650 114
132
129
149 204
US
211
a Backwater from ice.

80 MADISON RIVER BASIN
375. Madison River near West Yellowstone, Mont. (Published as "near Yellowstone" prior to 1925)
Location.--Lat 44°39'20", long 111"04'00", in SW£ sec.36, T.13 S., R.5 E. (un- surveyed), on left bank a quarter of a mile upstream from Riverside ranger station, l|- miles east of West Yellowstone, and 12-| miles downstream from confluence of Pirehole and Gibbon Rivers.
Drainage area. 420 sq mi.
Gage. Nonrecording prior to Oct. 20, 1918, and recording or nonrecording Oct. 20, 1918, to June 29, 1930, at sites 2^ miles upstream at different datums; recording at present site and datum thereafter. Altitude of gage is 6,650 ft (from topographic map).
Stage-discharge relation.--Defined by current-meter measurements below 2,000 cfs.
Remarks.--Peaks are principally from snowmelt. Base for partial-duration series, 950 cfs. Only annual peaks are shown prior to 1919.
Peak stages and discharges
Water year
19141915
19161917
1919
1920
1921
1922
1923
1924
1925
1926
1927
1928
1929
1930
1931
1932
1933
1934
1935
Date
May 21, 1914June 1, 1915
June 13, 1916June 10, 1917
May 11, 1919
May 24, 1920June 9, 1920
June 11, 1921
June 2, 1922June 14, 1922
May 26, 1923June 23, 1923
May 16, 1924
Jan. 3, 1925June 23, 1925July 6, 1925
May 4, 1926May 21, 1926
Apr. 3, 1927May 18, 1927June 9, 1927Sept. 10, 1927
Nov. 10, 1927May 12, 1928May 27, 1928
May 25, 1929
May 21, 1930May 30, 1930
May 16, 1931
May 15, 1932May 22, 1932June 9, 1932June 16, 1932
June 2, 1933June 10, 1933
June 8, 1934
May 26, 1935June 8, 1935
Gage height (feet)2.251.9
2.52.64
4.35
2.044.58
4.55
4.464.40
4.474.23
1.75
2.074.234.27
-4.27
_2.072.361.80
1.752.222.25
2.02
1.82-
2.39
2.682.822.522.60
2.632.59
2.14
2.542.52
Discharge (cfs)
1,4001,040
1,7701,950
1,110
1,2201,510
1,440
1,3001,230
1,270966
864
1,220954990
(a)1,010(a)
1,4101,7701,000
9681,5801,550
1,330
992b930
902
1,2601,4501,0501,150
1,1601,110
661
1,0601,040
Water year
1936
1937
1938
1939
1940
1941
1942
1943
1944
1945
1946
1947
1948
1949
1950
1951
1952
Date
May 15, 1936June 1, 1936
Jan. 8, 1937May 16, 1937
May 29, 1938
May 5, 1939
May 13, 1940
Dec. 17, 1940May 14, 1941
Jan. 8, 1942May 11, 1942June 5, 1942
Apr. 29, 1943May 5, 1943June 1, 1943June 20, 1943
Jan. 8, 1944May 19, 1944June 9, 1944
May 11, 1945June 7, 1945
Apr. 30, 1946May 9, 1946May 22, 1946
May 9,10, 1947June 10, 1947June 21, 1947
May 22, 1948
May 16,17, 1949
May 24, 1950May 28, 1950June 7, 1950June 25, 1950
Feb. 3, 1951May 12, 1951May 24, 1951May 28, 1951
May 4, 1952May 21, 1952June 25, 1952
Qage height (feet)
2.752.65
clO.O2.23
2.82
2.41
2.46
02.832.42
C3.312.632.38
2.502.603.433.02
C2.812.462.62
2.572.59
2.632.652.57
2.842.702.64
2.86
2.74
2.672.822.922.81
C4.362.533.023.10
2.862.782.61
Discharge (cfs)
1,3201,190
_780
1,440
951
1,020
-973
-1,220
973
9621,0802,0901,580
_951
1,130
1,0601,090
1,1101,1301,040
1,3801,2101,140
1,400
1,280
1,1901,3701,4901,350
_979
1,5501,660
1,4001,3101,110
a Not known; probably exceeded base discharge.b Maximum daily.c Backwater from ice.

MADISON RIVER BASIN 81
Peak stages and discharges of Madison River near West Yellowstone, Mont. Continued
Water year
1953
1954
1955
1956
1957
Date
May 20, 1953May 29, 1953June 3, 1953
May 17, 1954June 11, 1954June 16, 1954
May 22, 1955May 31, 1955June 13, 1955
Dec. 24, 1955May 11, 1956May 24, 1956
May 14, 1957May 30, 1957
Qage height (feet)
2.783.072.79
2.892.622.88
2.642.702.53
2.582.573.44
2.842.72
Discharge (ofs)
1,3101,6601,320
1,4401,1201,430
1,0901,160
968
1,0601,0302,150
1,3201,170
Water year
1958
1959
1960
1961
1962
1963
Date
May 24, 1958
May 16, 1959June 7, 1959
May 13, 1960June 14, 1960
May 26, 1961
May 13, 1962May 21, 1962
May 9, 1963May 20, 1963June 11, 1963
Gage height (feet)
2.68
2.522.67
2.602.55
2.67
2.952.80
2.782.842.79
lischarge (ofs)
1,160
1,0101,180
1,1001,040
1,180
1,4101,250
1,2401,3201,220
400. Madison River near Cameron, Mont.
Location. Lat 45°14'00", long 111°45'00", at center of south line of sec.8, T.7 S., R.I W., on right bank 30 ft downstream from Varney Bridge, lj miles downstream from Wigwam Creek, and 4 miles northwest of Cameron.
Drainage area. 1,669 sq mi.
Gage. Recording. Altitude of gage is 5,135 ft (from topographic map).
Stage-discharge relation. Fairly stable. Defined by current-meter measure- ments below 5,500 cfs.
Remarks. Peak flows are materially affected by regulation by Hebgen Lake (capacity, 344,700 acre-ft). Only annual peaks are shown.
Peak stages and discharges
Water year
1952195319541955
1956
1957
Date
June 7, 1952June 13, 1953June 28, 1954Feb. 27, 1955June 17, 1955
Feb. 23, 1956June 2, 1956Feb. 20, 1957
Gage height (feet)
4.614.183.80
a8.37-
a8.ll-
a8.69
Discharge (cfs)
6,6705,2404,150
-3,700
-5,980
-
Water year
19571958
1960
19611962
1963
Date
June 7, 1957May 24, 1958
Oct. 24, 1959
May 30, 1961Jan. 10, 1962June 21, 1962June 15, 1963
Gage height (feet)
-3.42
4.09
2.75a8.83
-3.87
lischarge (ofs)
4,0403,110
4,890
1,730-
3,3304,430
a Backwater from ice.
420. Madison River below Cherry Creek, near Norris, Mont. (Published as near "Red Bluff" 1897-1902)
Location.--Lat 45°38'50", long 111°31'20", in SE^ sec.19, T.2 S., R.2 E., 2 miles downstream from Cherry Creek, 7 miles northeast of Red Bluff, and 10 miles northeast of Norris.
Drainage area. 2,387 sq mi.
Gage. Nonrecording. Altitude of gage is 4,400 ft (from topographic map).
Stage-discharge relation. Defined by current-meter measurements below 8,500 cfs.
Remarks.--Flow regulated by Ennis Lake since 1900 (usable capacity, 41,CCO acre-ft); peak flows are materially affected since that date. Peaks are principally from snowmelt. Only annual maximum observed stages and dis charges are shown.

82 MADISON RIVER BASIN
Peak stages and discharges of Madison River below Cherry Creek, near Morris, Mont.
Water year
1898 1899 1900
1901
Date
June 18, 1898 June 16, 1899 May 29, 1900
May 19, 1901
Gage height (feet)
3.2 3.9 3.0
3.7
Discharge(Cfs)
8,000 10,275 5,655
8,325
Water year
1902 1903 1904
1905
Date
June 1, 1902 June 10, 1903 May 25, June 3,
1904 June 6, 1905
Gage height (feet)
3.0 2.93 3.2
2.34
Discharge (cfs)
6,140 6,145 6,735
3,974
425. Madison River near Three Porks, Mont. (Published as "at Three Forks" prior to Oct. 1, 1928)
Location.--Lat 45°49'25", long 111°29'50", in SW^NE^ sec.20, T.I N., R.2 E., 5 miles south of Three Forks and 8 miles upstream from mouth.
Drainage area. 2,511 sq mi.
Gage. Nonrecording at site 6 miles downstream at different daturas Aug. 24, 1893, to May 1, 1897, and Nov. 8, 1928, to Sept. 30, 1932; recording at described site and datum thereafter. Altitude of gage is 4,160 ft (from topographic map).
Stage-discharge relation. Defined by current-meter measurements' below 3,300 cfs at site 6 miles downstream and below 7,500 cfs at last site used.
Remarks. Diversions for Irrigation of about 31,000 acres above station. Flow regulated by Ennis Lake since 1900 (usable capacity, 41,000 pcre-ft) and by Hebgen Lake since 1915 (usable capacity, 344,700 acre-ft). Peak flows are materially affected. Peaks are principally from snowmelt. Only annual peaks are shown.
Peak stages and discharges
Water year
1894 1895
1896
1929 1930
1931 1932
1942
Date
June 1-4,1894 May 22-27,1895
June 19, 1896
Sept. 4, 1929 Nov. 17, 1929 Feb. 1, 1930
Apr. 25, 1931 May 18-21, 1932
Feb. 17, 1942
Gage height (feet)2.8 1.3
3.2
3.58 3.01
b6.63
3.08 3.62
b9.98
Discharge (cfs)
6,980 3,880
8,175
3,280 al,780
2,320 3,600
-
Water year
1942 1943
1944 1945
19461947 1948
1949 1950
Date
June 10, 1942 Jan. 18, 1943 June 2, 1943 June 28, 1944 June 22, 1945
May 28, 1946 June 11, 1947 Feb. 8, 1948 June 4, 1948 June 3, 1949 Jan. 7, 1950 June 17, 1950
Gage height (feet)
5.83 b7.67 6.42 5.63 4.81
4.52 5.89
110.48 5.41 4.43
b7.84 4.96
Discharge(OfB)
6,650
7,840 5,940 4,040
3,450 6,540
5,410 3,320
4,170a Maximum peak observed; maximum observed, b Backwater from ice.
2,200 cfs Oct. 1, 1929 (stage falling).
GALLATIN RIVER BASIN
430. Taylor Creek near Grayling, Mont.
Location.--Lat 45°04'15", long 111°12'15", in NW^NW^ sec.11, T.P S., R.4 E., on right bank half a mile upstream from mouth and 17 miles nortt of Grayling.
Drainage area.--98.0 sq mi.
Gage.--Recording. Altitude of gage is 6,600 ft (by barometer).
Stage-discharge relation.--Defined by current-meter measurement? below 830 cfs.
Remarks. Small diversion for Irrigation of 10 acres above station. Natural storage at lakes in headwaters. Diversion does not materially affect peak flows. Peaks are principally from snowmelt. Base for partial-duration series, 300 cfs.

GALLATIN RIVER BASIN 83
Peak stages and discharges of Taylor Creek near Grayling, Mont.
Water year
1947
1948
1949
1950
1951
Date
June 1, 1947June 8, 1947June 20, 1947July 17, 1947
May 21, 1948May 29, 1948June 3, 1948July 2, 1948
May 17, 1949May 21, 1949May 30, 1949June 6, 1949June 10, 1949June 18, 1949
June 6, 1950June 21, 1950July 1, 1950July 10, 1950
May 23, 1951May 28, 1951June 16, 1951July 4, 1951Aug. 4, 1951
Qage height (feet)3.633.803.993.42
3.844.174.233.01
3.393.133.483.553.523.08
3.563.543.323.25
3.583.533.652.863.16
Discharge (cfs)
587662753527
735877905415
506405542570558388
570566478450
566546594308416
Water year
1952
1953
1955
1956
1957
Date
May 4, 1952May 13, 1952May 21, 1952May 29, 1952June 6, 1952July 2, 1952July 11, 1952
May 28, 1953June 2, 1953June 13, 1953June 18, 1953June 23, 1953June 30, 1953
June 15, 1955
May 26, 1956June 1, 1956June 10, 1956June 21, 1956
May 13, 1957June 4, 1957June 20, 1957June 30, 1957
Qage height (feet)
3.653.252.963.524.323.003.26
2.882.974.124.003.573.43
3.81
4.114.153.893.19
2.873.932.993.22
lischarge (cfs)
630449339585
1,020360476
346368884786580530
a715
878902750424
322872420503
a Annual peak only.
432. Squaw Creek near Gallatin Gateway, Mont.
Location. Lat 45°26', long 111°13', in SW£ sec.34, T.4 S., R.4 E., at private bridge 10 miles south of Gallatin Gateway.
Drainage area. 40.4 sq mi.
Gage. Crest-stage gage. Altitude of gage is 5,460 ft (from topographic map).
Stage-discharge relation. Defined by current-meter measurements below 180 cfs.
Remarks. Peaks are principally from snowmelt. Only annual peaks are si own.
Peak stages and discharges
Water year
1959 1960
1961
Date
June 7, 1959 May 12, 1960
May 26, 1961
Qage height (feet)2.20 1.66
1.47
Discharge (cfs)
420 147
200
Water year
1962 1963
Date
June 13, 1962 June 15, 1963
Qage height (feet)
1.34 1.49
F'.scharge (cfs)
168 208
433. Logger Creek near Gallatin Gateway, Mont.
Location. Lat 45°27', long 111°14 I , in SW^ sec.28, T.4 S., R.4 E., at culvert on U.S. Highway 191, 10 miles south of Gallatin Gateway.
Drainage area. 2.48 sq mi.
Gage.--Crest-stage gage. Altitude of gage is 5,340 ft (from topographic map).
Stage-discharge relation. Defined by current-meter measurements below 15 cfs.
Remarks. Peaks are principally from snowmelt. Only annual peaks are si own.
Peak stages and discharges
Water year
19591960
1961
Date
June 7, 1959May 12, 1960
May 26, 1961
Oage height (feet)
1.03.69
.34
Discharge (cfs)
209
6
Water year
19621963
Date
June 13, 1962May 27, 1963
Qage height (feet)
0.73.38
Tlscharge (cfs)
1811

84 GALLATIN RIVER BASIN
435. Gallatin River near Gallatin Gateway, Mont. (Published as West Gallatin River near Bozeman, 188?-94)
Location.--Lat 45°29'50", long 111°16'10", in SE^SE^ sec.7, T.4 S., R.4 E., on left bank a quarter of a mile downstream from Spanish Creek ?nd 1\ miles south of Gallatin Gateway.
Drainage area. 825 sq mi.
Gage.--Nonrecording prior to Oct. 20, 1932, at several different sites anddatums within three-quarters of a mile of present site; recording at present site thereafter. Datum of gage is 5,167.7 ft above mean sea level, datum of 1929, supplementary adjustment of 1940.
Stage-discharge relation.--Defined by current-meter measurement? below 3,000 cfs and extended above by logarithmic plotting at site used in 1892. De fined by current-meter measurements below 5,200 cfs at presert site.
Remarks. Diversions affect peak flows duration series, prior to 1931.
for irrigation of about 1,400 acres do not materiallyPeaks are principally from snowmelt. Baee for partial-
2,900 cfs. Only annual maximum observed peaks are shown
Peak stages and discharges
Water year
1890
18911S921S931894
1931
1932
1933
1934
1935
1936
1937
193S
1939
1940
1941
1942
1943
1944
1945
1946
1947
1948
Date
June 10, 1890
June 7, 1891June 20, 1892June 12, 1893June 2, 1894
June 2, 1931
June 16, 1932
June 13, 1933
May 8, 1934
June 13, 1935
May 15, 1936June 1, 1936
June 17, 1937
May 29, 1938June 6, 1938
May 17, 1939May 30, 1939
June 1, 1940June 13, 1940
May 27, 1941
May 26, 1942June 9, 1942
May 31, 1943June 19, 1943
May 18, 1944May 30, 1944June 4, 1944June 9, 1944June 27, 1944
June 6, 1945June 24, 1945
June 6, 1946
May 9, 1947May 27, 1947June 9, 1947June 20, 1947
May 22, 1948May 29, 1948
Gage height (feet)
5.20
4.457.707.007.70
4.23
4.60
5.03
3.03
5.09
4.584.11
4.22
4.905.00
4.024.04
4.174.39
3.74
4.425.32
5.055.61
3.703.843.994.074.02
3.754.55
4.38
4.303.864.464.96
5.045.63
Discharge (cfs)
3,800
2,9758,0606,8OO8,060
2,940
5,780
4,270
1,740
4,340
3,6602,990
3,120
4,4004,550
3,1003,170
3,3103,660
2,820
4,4506,050
5,2506,430
3,0003,2403,4303,6003,330
2,9704,450
4,360
3,9803,2404,2405,250
5,2306,440
Water year
1948
1949
1950
1951
1952
1953
1954
1955
1956
1957
1958
1959
1960
1961
1962
1963
Date
June 4, 1948June 22, 1948
May 17, 1949May 29, 1949June 11, 1949
June 7, 1950June 22, 1950June 30, 1950July 11, 1950
May 24, 1951May 28, 1951June 17, 1951
May 4, 1952May 14, 1952June 6, 1952
June 13, 1953June 18, 1953
May 22, 1954June 27, 1954
June 16, 1955June 22, 1955
May 28, 1956June 2, 1956June 10, 1956
June 7, 1957June 21, 1957
May 24, 1953
June 7, 1959June 10, 1959June 15, 1959
May 13, 1960June 4, 1960
May 30, 1961June 4, 1961
May 10, 1962May 21, 1962June 3, 1962June 14, 1962July 14, 1962
May 30, 1963June 15, 1963
Gage height (feet)
5.773.96
4.324.073.91
4.284.894.233.95
4.694.634.52
4.573.965.71
5.284.77
4.114.21
4.424.03
5.575.494.51
5.594.05
5.08
5.465.206.23
4.284.92
4.224.32
3.823.854.324.894.08
4.614.91
Discharge (cfs)
6,7403,350
4,1103,5603,190
3,8405,0303,7503,240
3,9403,8303,640
4,5803,3906,910
6,0104,980
3,6603,790
4,4803,700
7,0306,8204,600
5,9703,220
5,010
5,7205,2307,230
3,7104,940
3,4503,670
2,9502,9803,7604,7803,380
4,1704,800

GALLATIN RIVER BASIN 85
440. Gallatln River near Salesville, Mont. (Published as "West Gallatln River" 1895-1905, 1910-13)
Location.--Lat 45°32', long 111°14', on north line of sec.33, T.3 S. , K.4 E., at county road bridge, 4 miles south of Salesville (now called Galls tin Gateway) and 4 miles downstream from Spanish Creek.
Drainage area.--833 sq mi.
Gage. Nonrecording. Altitude of gage is 5,050 ft (from topographic map).
Stage-discharge relation. Defined by current-meter measurements below 7,900 cfs.
Remarks. Diversions for irrigation of about 16,000 acres above station do not materially affect peak flows. Peaks are principally from snowmelt. Only annual peaks are shown.
Peak stages and discharges
Water year
1896 1897 1898 1899 1900
1901 1902 1903
Date
June 18, 1896 May 21, 1897 June 16, 1S98 June 20, 1899 May 28, June 6 ,
190O
May 18, 1901 May 31, 1902 June 14, 1903
Gage height (feet)7.9 6.85 7.45 8.55 6.9
7.55 6.65 6.85
Discharge (oft)
S,700 5,780 7,230
1O,000 5,410
7,810 5,565 5,325
Water year
1904 1905
1912 1913
1921 1922 1923
Date
May 24, 1904 June 13, 1905
June 12, 1912 May 28, 1913
June 11, 1921 May 25, 1922 June 9, 1923
Oage height (feet)
7.2 5.3
7.27.8
8.32 8.5 7.2
Discharge (eft,)
5,775 2,700
5,860 6,940
6,390 7,460 5,120
465. East Gallatin River near Bozeman, Mont.
Location. Lat 45°38'35", long 110°55'35", in SE£ sec.24, T.2 S., R.6 E., on right bank 0.3 mile downstream from bridge on U.S. Highway 10 and 6 miles east of Bozeman.
Drainage area. 49.0 sq mi.
Gage. Recording. Datum of 1929 (unadjusted).
is 5,044.1 ft above mean sea level, datum of
Stage-discharge relation. Defined by current-meter measurements below 200 cfs.
Remarks. Diversions for irrigation of about 400 acres above station do not materially affect peak flows. Peaks are principally from snowmelt. Only annual peaks are shown.
Peak stages and discharges
Water year
1952 1953
1959 1960
Date
Apr. 19, 1952 June 3, 1953
Apr. 1, 1959 May 8, 1960
Oage height (feet)
4.08 4.65
3.9 3.64
Discharge (oft)
421 608
337 248
Water year
1961 1962 1963
Date
May 2, 1961 Apr. 16, 1962 Apr. 27, 1963
Oage height (feet)
3.03 3.42 4.11
Discharge (cfs)
90285 400

86 GALLATIN RIVER BASIN
470. Bear Canyon Creek near Bozeman, Mont.
Location. Lat 45°37'35", long 110°55'45", in NW£ sec.36, T.2 S. , R.6 E., on left bank 3 miles upstream from East Gallatin River and 6 mile c southeast of Bozeman.
Drainage area. 17.0 sq mi.
Gage. Recording. Datum of gage is 5,183.4 ft above mean sea lev?l, datum of 1929 (unadjusted).
Stage-discharge relation. Defined by current-meter measurements below 100 cfs.
Remarks. No regulation or diversion above station. Only annual peaks are shown.
Peak stages and discharges
Water year
1952 1953
1959 1960
Date
May 26, 1952 June 3, 1953
May 1, 1959 May 12, 1960
Oage height (feet)2.843.40
2.2 2.62
Discharge(ofB)
149 450
150 202
Water year
1961 1962 1963
Date
May 22, 1961 July 14, 1962 May 9, 1963
Gi>ge height (feet)
1.77 2.74 2.43
Discharge (cfs)
46 175 110
480. East Gallatin River at Bozeman, Mont.
Location. Lat 45°42'00", long 111°01'45", near center of south line of sec.31, T.I S., R.6 E., on left bank 100 ft upstream from highway bridge, 500 ft downstream from Bozeman Creek, half a mile upstream from Bridger Creek, and half a mile north of Bozeman.
Drainage area. 148 sq mi.
Gage.--Recording. Datum of gage is 4,701.6 ft above mean sea level, datum of 1929, unadjusted.
Stage-discharge relation. Defined by current-meter measurements below 1,200 cfs.
Remarks.--Diversions for irrigation of about 4,000 acres above station do not materially affect peak flows. Peaks are principally from snowmelt. Base for partial-duration series, 300 cfs.
Peak stages and discharges
Water year
1940
1941
1942
1943
1944
1945
1946
Date
Apr. 21, 1940May 4, 1940May 13, 1940June 9, 1940
Mar. 18, 1941
Apr. 15 1942Apr. 22, 1942May 24, 1942June 5, 1942
Mar. 25, 1943Mar. 28, 1943Apr. 16, 1943June 3, 1943
Mar. 17, 1944Apr. 1, 1944June 10, 1944June 17, 1944June 27, 1944
Feb. 8, 1945May 14, 1945
Dec. 18, 1945Mar. 28, 1946
Sage height (feet)3.924.024.084.41
3.81
4.734.374.124.03
4.664.043.854.29
4.074.374.223.994.82
4.203.87
a4.694.03
Discharge (cfs)
320351370482
295
615464384354
577369312454
378471410329577
412305
-367
Water year
1946
1947
1948
1949
1950
Date
Apr. 20, 1946
Mar. 17, 1947Apr. 1, 1947Apr. 14, 1947Apr. 21, 1947Apr. 30, 1947May 4, 1947May 12, 1947June 10, 1947
Apr. 15, 1948Apr. 23, 1948Apr. 30, 1948May 8, 1948May 21, 1948June 4, 1948June 17, 1948June 23, 1948
Jan. 17, 1949Apr. 20, 1949
Feb. 26, 1950Apr. 1, 1950Apr. 7, 1950May 18, 1950May 23, 1950
Qige height (f 3et)
3.90
4.623.915.034.324.284.874.896.06
5.865.565.034.856.045.043.914.30
a3.943.72
4.505.534.134.603.96
Discharge (cfs)
329
544314680405377581581
1,070
1,100852640600
1,170720360494
_304
6001,030
444592363
a Backwater from ice.

GALLATIN RIVER BASIN 87
Peak stages and discharges of East Gallatin River at Bozeman, Mont.--Cortinued
Water year
1950
1951
1952
1953
1954
1955
Date
May 28, 1950
Feb. 10, 1951Apr. 3, 1951May 6, 1951May 18, 1951
Apr. 20, 1952Apr. 29, 1952May 9, 1952May 22, 1952May 25, 1952
May 30, 1953June 4, 1953June 20, 1953Jan. 18, 1954June 5, 1954May 6, 1955May 22, 1955June 4, 1955June 17, 1955
Gage height (feet)3.78
a5.84.504.504.41
5.245.324.515.855.52
4.676.093.89
a4.173.554.264.064.09-
Discharge (cfs)
307
(b)592569535
734762489895781
6281,240
369-285460395422(b)
Water year
1956
1957
1958
1959
1960
1961
Date
Dec. 19, 1955Feb. 17, 1956Apr. 10, 1956May 12, 1956May 25, 1956
June 21, 1957
Apr. 18, 1958May 7, 1958
Apr. 1, 1959May 1, 1959May 17, 1959May 27, 1959June 7, 1959Mar. 25, 1960May 13, 1960Jan. 27, 1961May 27, 1961
Gage height (feet)a4.33a4.334.063.744.18
4.56
3.613.99
5.144.503.733.723.90a6.124.77
a3.893.29
Discharge (cfs)
__
413322451
585
308422
816592341333372
c500605_
207
a Backwater from ice. c Maximum daily.
b Not known; probably exceeded base discharge.
485. Bridger Creek near Bozeman, Mont.
Location.--Lat 45°42'20", long 110°57'40", in NE^SE^ sec.34, T.I S. , P.6 E., on right bank 3 miles upstream from mouth and 3 miles northeast of Bozeman.
Drainage area.--62.5 sq mi.
Gage. Nonrecording prior to June 28, 1946; recording thereafter. Altitude of gage is 4,960 ft (from topographic map).
Stage-discharge relation. Defined by current-meter measurements belov 380 cfs.
Remarks.--Diversions for irrigation of about 1,200 acres above station do not materially affect peak flows. Peaks are principally from snowmelt. Base for partial-duration series, 140 cfs.
Peak stages and discharges
Water year
1946
1947
1948
1949
1950
1951
1952
1953
1954
Date
Apr. 20,27, 1946
Mar. 21, 1947Apr. 13, 1947Apr. 30, 1947May 4, 1947June 10, 1947Apr. 23, 1948Apr. 30, 1948May 9, 1948May 22, 1948June 4, 1948
Apr. 20, 1949
Apr. 1, 1950May 18, 1950May 23, 1950May 28, 1950
May 6, 1951May 13, 1951May 19, 1951
Apr. 19, 1952Apr. 29, 1952May 4, 1952May 24, 1952May 30, 1953June 3, 1953
Mar. 31, 1954
Qage height (feet)
2.90
3.153.612.743.973.993.523.453.605.234.73
1.81
2.962.742.692.37
2.572.622.63
2.463.082.633.173.654.90
b2.43
Discharge (cfs)
a!58
252346180430446327312344776697
109
318279269208
246256258
236362272374583902
-
Water year
19541955
19561957
1958
1959
1960
1961
1962
1963
Date
June 11, 1954May 8, 1955June 4, 1955June 16, 1955
May 22, 1956May 5, 1957
May 12, 1958
Apr. 2, 1959Apr. 5, 1959May 1, 1959May 9, 1959May 16, 1959June 7, 1959
Mar. 23, 1960Mar. 24, 1960Apr. 10, 1960May 13, 1960
May 27 1961
Apr. 20, 1962Apr. 25, 1962May 5, 1962Feb. 5, 1963May 1, 1963May 12, 1963June 4, 1963
Gage height (feet)
2.092.032.272.09
2.642.06
2.22
2.422.082.982.272.572.84
b2.792.751.992.66
1.82
2.322.262.032.522.172.632.38
Discharge (cfs)
143141185152
293147
185
208145306154206280
-391160358
124
252234169237186267212
a Annual maximum only; observed. b Backwater from ice.

88 GALLATIN RIVER BASIN
500. Hyalite Creek at Hyalite ranger station, near Bozem^n, Mont. (Published as "Middle Creek near Bozeman" prior to 1?34)
Location.--Lat 45°33'40", long 111°04'10", in NW^SE^ sec.23, T.3 S., R.5 E., on right bank three-quarters of a mile south of Hyalite ranger station, 7? miles south of Bozeman, and 20 miles upstream from mouth.
Drainage area. 48.2 sq mi.
Gage.--Nonrecording at two sites about half a mile upstream at different daturas prior to September 1934; recording thereafter. At site a quarter of a mile downstream at different datum Sept. 13, 1934, to May 13, 1948. Datum of gage is 5,539.6 ft above mean sea level, datum of 1929, supplementary ad justment of 1940.
Stage-discharge relation. Subject to considerable shifting. Defined bycurrent-meter measurements below 290 cfs for site a quarter of a mile down stream and below 410 cfs for present site.
Remarks.--Peak flows materially affected by regulation in Middle Creek Reser voir since March 1951. Peaks are principally from snowmelt. Only annual peaks are shown.
Peak stages and discharges
Water year
18981899
1902
1935
19361937
19381939
1940
1941
1942
1943
1944
1945
1946
1947194S
Date
June 14, 1898June 4,20, 1899
June 11, 1902
June 13, 1935
June 1, 1936Dec. 31, 1936June 12, 1937May 28, 1938Dec. 17, 1938May 16, 1939Feb. 23, 1940June 14, 1940
Dec. 15-18, 1940June 5, 1941Jan. 3, 1942May 27, 1942Jan. 12, 1943June 20, 1943Jan. 8, 1944June 4, 1944Dec. 19, 1944June 23, 1945
Jan. 23, 1946June 6, 1946June 9, 1947Dec. 13, 1947May 20, 1948
Qage height (feet)2.101.70
1.90
2.18
2.42a5.43
-3.11
a3.60-
a3.12-
a4.01-
a4.00-
a3.91-
a2.98-
a3.Sl-
a3.39-
2.91a3.90
-
Discharge (ofs)
956760
500
441
205-
330502-
286-
360
-206-
375-
341-
375-
300
-222347-
641
Water year
19491950
1951
1952
1953
1954
1955
1956
1957
1958
1959
1960
1961
1962
1963
Date
May 16, 1949June 22, 1950
Jan. 29, 1951May 27, 1951Jan. 23, 1952June 4,6,7,1952Mar. 18, 1953June 3, 1953Mar. 23, 1954June 28, 1954June 16, 1955June 25, 1955
Dec. 31, 1955Mar. 28, 1956Feb. 21, 1957June 5, 1957Mar. 2, 1958May 26, 1958Jan. 5, 1959June 15, 1959Feb. 27, 1960June 16, 1960
Jan. 27, 1961June 10, 1961Feb. 6, 1962June 27, 1962Mar. 4, 1963June 15, 1963
O'?e height(net)
2.772.77
83.92-
a3.48-
a2.84-
s2.47-
2.44-
a3.31-
a2.87_
a3.12_
a3.45_
a3.49_
a2.86-
a3.92-
a2.86-
Discharge (cfs)
338295
.350-
422_
472-
344_
364
-516_
335_
301_
600_
348
-245-
285-
360
a Backwater from Ice.

GALLATIN RIVER BASIN 89
525. Gallatin River at Logan, Mont.
Location. Lat 45°53'10", long 111°26'20", in NE£ sec.35, T.2 N. , R.2 E., on right bank at former county road bridge site, half a mile west of Logan and 6 miles upstream from mouth.
Drainage area. 1,795 sq mi.
Gage.--Nonrecording prior to Oct. 8, 1941; recording thereafter. At several sites within half a mile of present site at various datums prior to Aug. 10, 1928. Datum of gage is 4,082.3 ft above mean sea level, datum of 1929, supplementary adjustment of 1940.
Stage-discharge relation. Defined by current-meter measurements below 5,300 cfs at site used in 1904 and below 7,800 cfs at present site.
Remarks.--Diversions for irrigation of about 110,000 acres above station might materially affect peak flows. Peaks are principally from snowmelt. Base for partial-duration series, 2,700 cfs. Only annual peaks are shown prior to 1942.
Peak stages and discharges
Water year
1S95
1S961897189818991900
1902
190319041905
19291930
193119321933
1935
19361937193819391940
1941
1942
1943
1944
1945
1946
1947
1948
Date
June 24, 1895
June 18, 1896May 26, 1897June 19, 1S98June 21, 1S99May 28, 1900
June 1,11,14,1902
June 14, 1903May 24, 1904June 9, 1905
June 17, 1929May 31, 1930
June 3, 1931June 16, 1932June 13, 1933
June 14, 1935
May 15, 1936June 17, 1937May 30 1938May 6, 1939June 14, 1940
June 6, 1941
Jan. 3, 1942May 27, 1942June 9, 1942
Feb. 10, 1943Mar. 26, 1943Mar. 29, 1943June 2, 1943June 20, 1943
June 10, 1944June 27, 1944
Dec. 27, 1944June 6, 1945June 24, 1945
June 6, 1946June 11, 1946
May 10, 1947June 10, 1947June 21, 1947
June 5, 1948June 24, 1948
Gage height (feet)3.90
5.604.705.256.254.00
4.40
4.605.153.25
6.605.36
5.466.425.94
6.10
6.305.956.905.405.92
4.80
a7.236.337.10
a8.945.806.557.07.50
6.006.68
a7.305.565.83
6.045.57
6.877.187.46
8.406.19
Discharge (cfs)
3,904
6,5506,4607,3009,8404,350
4,430
4,5005,4003,090
4,9702,820
2,9704,5703,700
3,990
4,3703,6505,5902,7903,500
1,990
-4,5505,940
_3,4204,5305,3106,160
3,7204,820
-3,0603,500
3,7303,000
5,0905,6206,160
7,3703,950
Water year
1949
1950
1951
1952
1953
1954
1955
1956
1957
1958
1959
1960
1961
1962
1963
Date
Dec. 25, 1948May 18, 1949May 30, 1949
June 7, 1950June 22, 1950
Mar. 27, 1951May 25, 1951
Jan. 24, 1952Apr. 7, 1952May 5, 1952May 15, 1952June 7, 1952
June 5, 1953June 14, 1953
Jan. 23, 1954June 23, 1954
Jan. 7, 1955June 16, 1955
Dec. 19, 1955Mar. 25, 1956May 29, 1956
Feb. 5, 1957June 9, 1957June 21, 1957
May 26, 1958
June S, 1959June 15, 1959June 27, 1959
Jan. 17, 1960Mar. 24, 1960May 13, 1960June 4, 1960June 16, 1960
May 30, 1961
Dec. 11, 1961Apr. 25, 1962May 10, 1962June 4, 1962June 15, 1962July 14, 1962
Feb. 5, 1963June 5, 1963June 15. 1963
Gage height (feet)a7.236.265.71
5.726.29
5.466.41
a7.945.537.396.717.73
6.247.34
a7.185.74
a7.4S6.18
a8. 83_
7.97
a7.296.795.87
5.90
7.277.656.19
a8. 835.196.346.165.32
4.88
as. 505.565.535.916.645.50
all. 836.196.56
Discharge (cfs)
-3,9003,060
3,0303,940
2,7204,140
_2,3105,8804,6606,640
4,0805,930
_3,380
-4,050
_b2,7007,190
_4,9903,490
3,620
5,4406,1203,760
-2,7304,3204,0402,750
2,160
-3,0903,0403,6404,8303,100
b4,0004,1304,750
a Backwater from ice. b Maximum daily.
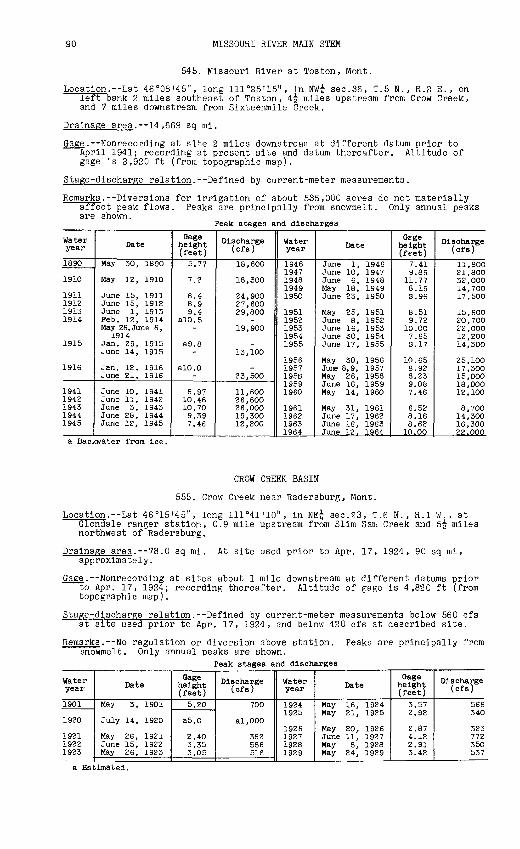
90 MISSOURI RIVER MAIN STEM
545. Missouri River at Toston, Mont.
Location.--Lat 46°08'45", long 111°25'15", In NW£ sec.36, T.5 N., R.2 E., on left bank 2 miles southeast of Toston, 4-| miles upstream from Crow Creek, and 7 miles downstream from Sixteenmlle Creek.
Drainage area. 14,669 sq ml.
Gage. Nonrecording at site 2 miles downstream at different datum prior to April 1941; recording at present site and datum thereafter. Altitude of gage is 3,920 ft (from topographic map).
Stage-discharge relation.--Defined by current-meter measurements.
Remarks. Diversions for irrigation of about 535,000 acres do not materially affect peak flows. Peaks are principally from snowmelt. Only annual peaks are shown.
Peak stages and discharges
Water year
1890
1910
1911191219131914
1915
1916
19411942194319441945
Date
May 30, 1890
May 12, 1910
June 15, 1911June 15, 1912June 1, 1913Feb. 12, 1914May 26, June 6,
1914Jan. 29, 1915June 14, 1915
Jan. 12, 1916June 21, 1916
June 10, 1941June 11, 1942June 3, 1943June 28, 1944June 12, 1945
Qage height (feet)5.77
7.2
8.48.99.4
alO.5-
a9.8-
alO.O-
6.9710.4610.709.397.46
1
Discharge (ofs)
18,600
18,300
24,90027,60029,800
-19,900
-13,100
-23,500
11,60026,60026,00019,30012,200
Water year
19461947194819491950
19511952195319541955
19561957195S19591960
1961196219631964
Date
June 1, 1946June 10, 1947June 6, 1948May 18, 1949June 23, 1950
May 25, 1951June 8, 1952June 16, 1953June 30, 1954June 17, 1955
May 30, 1956June 8,9, 1957May 26, 1958June 16, 1959May 14, 1960
May 31, 1961June 17, 1962June 16, 1963June 12. 1964
Ctege height (feet)
7.419.89
11.778.19S.96
8.519.72
10.007.65S.17
10.658.928.239.087.46
6.528.168.6210.00
Discharge(Ofs)
11,80021,80032,00014,70017,500
15,60020,70022,00012,20014,300
25,10017,30015,00018,00012 , 100
8,70014,30016,30022.000
a Backwater from ice.
CROW CREEK BASIN
555. Crow Creek near Radersburg, Mont.
Location. Lat 46°15'45", long 111°41'10", in NE£ sec.S3, T.6 N., R.I W. , at Glendale ranger station, 0.9 mile upstream from Slim Sam Creek and 5-| miles northwest of Radersburg.
Drainage area.--78.0 sq mi. At site used prior to Apr. 17, 1924, 90 sq mi, approximately.
^.--Nonrecording at sites about 1 mile downstream at different datums prior to Apr. 17, 1924; recording thereafter. Altitude of gage is 4,820 ft (from topographic map).
Stage-discharge relation. Defined by current-meter measurements below 560 cfs at site used prior to Apr. 17, 1924, and below 420 cfs at described site.
Remarks. No regulation or diversion above station. Peaks are principally from snowmelt. Only annual peaks are shown.
Peak stages and discharges
Water year
1901
1920
1921 1922 1923
Date
May 3, 1901
July 14, 1920
May 26, 1921 June 15, 1922 May 26, 1923
Oage height (feet)5.20
a5.0
2.40 3.35 3.05
Discharge (cfs)
700
al,000
362586 516
Water year
1924 1925
1926 1927 1928 1929
Date
May 16, 1924 May 21, 1925
May 20, 1926 June 11, 1927 May 8, 1928 May 24, 1929
Oage height (feet)
3.57 2.92
2.87 4.12 2.91 3.42
Discharge (ofs)
566 340
323 772 350 537
a Estimated.

DEEP CREEK BASIN 91
566. Deep Creek below North Fork Deep Creek, near Tovmsend, Mort.
Location. Lat 46°20', long 111°17', in SE^ sec.25, T.7 N., R.3 E. , at bridge on county road, 11 miles east of Tovmsend.
Drainage area. 87.7 sq mi.
Gage. Crest-stage gage. Altitude of gage is 4,450 ft (from topographic map).
Stage-discharge relation. Defined by current-meter measurements below 170 cfs.
Remarks. Peaks are principally from snowmelt. Only annual peaks are shown.
Peak stages and discharges
Water year
1959 1960
1961
Date
June 7, 1959 June 4, 1960
May 24, 1961
Qage height (feet)2.15 2.00
1.60
Discharge (cfs)
290 254
83
Water year
1962 1963
Date
May 22, 1962 June 2, 1963
Qage height (feet)
1.66 1.89
Discharge (cfs)
175 170
MISSOURI RIVER MAIN STEM
570. Missouri River near Townsend, Mont.(Published as "at Townsend" or as Townsend station on Missouri Fiver
prior to 1901)
Location.--Lat 46°26'10", long 111°31'55", in SW^NW^ sec.30, T.7 N., F.2 E., at highway bridge, 1 mile northwest of Townsend.
Drainage area. 15,343 sq mi.
Gage. Nonrecordlng. Datum of gage is 3,785.0 ft above mean sea level, Mis souri River Commission datum. A correction of +16.0 ft is necessary to correct to datum of 1929.
Stage-discharge relation. Defined by current-meter measurements belov 25,000 cfs.
Remarks. Diversion above station for Irrigation. Some regulation by Ennls Lake (usable capacity, 41,000 acre-ft) since 190C. Regulation and di versions do not materially affect peak flows. Peaks are principally from snowmelt. Only annual maximum observed stages and discharges are shown. Maximum observed discharges do not differ greatly from Instantaneous peaks.
Peak stages and discharges
Water year
1892 1893 1894 1895
1896 1897 1898
Date
June 22, 1892 June 14, 1893 June 4, 1894 Hay 22, 1895
June 20, 1896 May 22, 1897 June 18, 1898
Qage height (feet)95.1 94.5 95.7 91.9
94.90 93.00 93.64
Discharge (cfs)
34,700 31,000 38,400 15,400
32,500 21,300 25,010
Water year
1899 1900
1901 1902 1903 1904
Date
June 24, 1S99 May 14, 1900
May 20, 1901 June 1, 1902 June 9, 1903 May 25, 1904
heilnt Dif^rge (feet) (cfs )
95.75 38,000 92.40 17,340
93.00 22,150 93.18 23,600 92.90 21,445 8.40 a25,410
SPOKANE CREEK BASIN
587. Mitchell Gulch near East Helena, Mont.
Location. Lat 46°34', long 111°49', in NW£ sec.2, T.9 N., R.2 W., at culvert on U.S. Highway 12, 4.7 miles east of East Helena.
Drainage area. 8.09 sq mi.
Gage. Crest-stage gage. Altitude of gage is 4,060 ft (from topographic map).
Stage-discharge relation. Defined by current-meter measurements belov 90 cfs.
Remarks. Only annual peaks are shown.
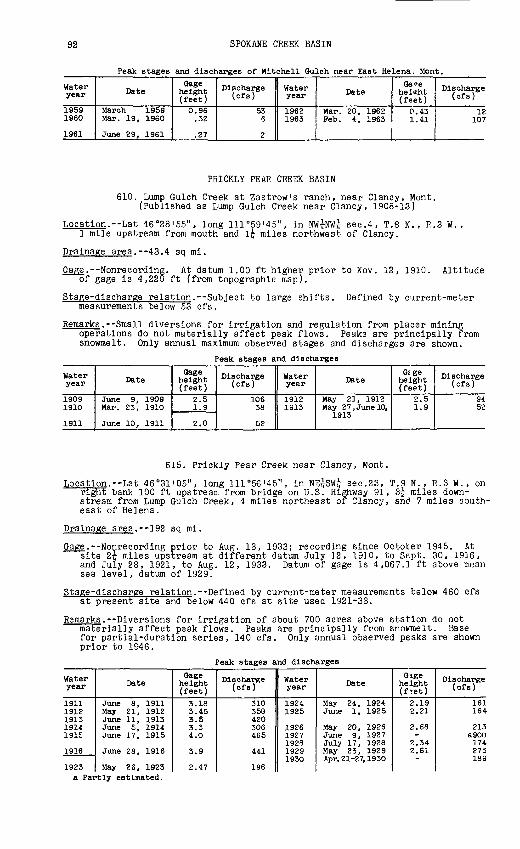
92 SPOKANE CREEK BASIN
Peak stages and discharges of Mitchell Gulch near East Helena. Mont.
Water year
1959 1960
1961
Date
March 1959 Mar. 19, 1960
June 29, 1961
Gage height (feet)0.96 .32
.27
Discharge (cfs)
53 6
2
Water year
1962 1963
Date
Mar. 20, 1962 Feb. 4, 1963
height (feet)
0.43 1.41
Discharge (cfs)
12 107
PRICKLY PEAR CREEK BASIN
610. Lump Gulch Creek at Zastrow's ranch, near Clancy, Mont. (Published as Lump Gulch Creek near Clancy, 1908-13)
Location.--Lat 46°28'55", long 111°59'45", in NW^NW£ sec.4, T.8 N. , R.3 W. , 1 mile upstream from mouth and ij miles northwest of Clancy.
Drainage area. 43.4 sq mi.
Gage.--Nonrecording. At datum 1.00 ft higher prior to Nov. 12, 1910. Altitude of gage is 4,220 ft (from topographic map).
Stage-discharge relation.--Sub.1ect to large shifts. Defined by current-meter measurements below 53 cfs.
Remarks. Small diversions for irrigation and regulation from placer mining operations do not materially affect peak flows. Peaks are principally from snowmelt. Only annual maximum observed stages and discharges are shown.
Peak stages and discharges
Water year
1909 1910
1911
Date
June 9, 1909 Mar. 23, 191O
June 10, 1911
Gage height (feet)
2.5 1.9
2.0
Discharge (cfs)
106 38
52
Water year
1912 1913
Date
May 21, 1912 May 27, June 10,
1913
Grge height (feet)
2.5 1.9
Discharge (cfs)
94 52
615. Prickly Pear Creek near Clancy, Mont.
Location.--Lat 46°31'05", long 111°56'45", in NE£SW£ sec.23, T.9 N. , R.3 W. , on right bank 100 ft upstream from bridge on U.S. Highway 91, 3-| miles down stream from Lump Gulch Creek, 4 miles northeast of Clancy, and 7 miles south east of Helena.
Drainage area.--192 sq mi.
Gage. Nonrecording prior to Aug. 13, 1933; recording since Octoter 1945. At site 2-f miles upstream at different datum July 12, 1910, to Sept. 30, 1916, and July 28, 1921, to Aug. 12, 1933. Datum of gage is 4,067.1 ft above mean sea level, datum of 1929.
Stage-discharge relation.--Defined by current-meter measurements below 460 cfs at present site and below 440 cfs at site used 1921-33.
Remarks. Diversions for irrigation of about 700 acres above station do not materially affect peak flows. Peaks are principally from snovonelt. Base for partial-duration series, 140 cfs. Only annual observed peaks are shown prior to 1946.
Peak stages and discharges
Water year
1911191219131914191E
1916
1923
Date
June 8, 1911May 21, 1912June 11, 1913June 5, 1914June 17, 1915
June 28, 1916
May 26, 1923
Gage height (feet)
3.183.453.53.34.0
3.9
2.47
Discharge (cfs)
310358420306465
441
196
Water year
19241925
19261927192819291930
Date
May 24, 1924June 1, 1925
May 20, 1926June 9, 1927July 17, 1928May 23, 1929Apr. 21-27, 1930
Gxge height (fiet)
2.192.21
2.68-
2.342.61-
Discharge (cfs)
161164
213a9OO174273189
a Partly estimated.

PRICKLY PEAR CREEK BASIN 93
Peak stages and discharges of Prickly Pear Creek near Clancy, Mont. Continued
Water year
193119321933
1946
1947
1948
1949
1950
1951
1952
Date
May 26, 1931June 9, 1932June 2, 1933
May 6, 1946
May 9, 1947June 9, 1947
May 8, 1948May 22, 1948June 5, 1948June 17, 1948June 23, 1948
May 17, 1949May 20, 1949June 3, 1949June 21, 1949
Apr. 1, 1950May 18, 1950May 23, 1950May 28, 1950June 7, 1950June 18, 1950
Mar. 21, 1951May 12, 1951May 24, 1951June 13, 1951
Feb. 26, 1952Apr. 6, 1952 Apr. 29, 1952 May 4, 1952 May 16, 1952May 26, 1952
Gage height (feet)
1.362.561.96
2.73
3.924.50
2.944.336.353.783.69
2.912.92-
2.81
2.813.043.203.063.183.61
3.622.892.893.08
b3.283.21 2.89 3.20 3.132.89
Discharge (cfs)
63260142
135
263333
163326778260249
167168150157
156178198181195246
247162162183
-193 158 192184158
Water year
1953
1955
1956
1957
1958
1959
1960
1961
1962
1963
1964
Date
June 4, 1953June 13, 1953
Mar. 29, 1955June 17, 1955July 19, 1955July 25, 1955
Feb. 23, 1956Mar. 23, 1956May 22, 1956
June 17, 1957
May 7, 1958May 12, 1958May 22, 1958June 4, 1958June 12, 1958
Feb. 23, 1959June 7, 1959June 26, 1959
May 13, 1960June 4, 1960
Jan. 4, 1961May 27, 1961
May 16, 1962May 25, 1962June 14, 1962Feb. 5, 1963 May 26, 1963 June 11, 1963June 9, 1964
Gage height (feet)
4.984.11
b3.653.542.983.00
b3.953.053.05
2.92
3.653.523.283.183.05
b3.523.392.96
3.712.97
b3.102.64
2.913.743.20
5.12 2.88 2.69
6.01
Discharge (cfs)
476318
220151153
-180180
154
251235207195178
_210160
256157
_120
147235192
486 159 142
C700b Backwater from Ice. c Annual peak only.
620. Prickly Pear Creek at East Helena, Mont.
Location.--Lat 46°35'15", long 111 "55'05", in NE^NE^ sec.36, T.10 N., R.3 W., at Northern Pacific Railroad bridge at East Helena.
Drainage area. 251 sq mi.
Gage.--Nonrecording. Altitude of gage is 3,880 ft (from topographic map).
Stage-discharge relation. Defined by current-meter measurements below 340 cfs.
Remarks.--Diversions for irrigation of about 2,000 acres above station do not materially affect peak flows. Peaks are principally from snowraelt. Only annual maximum observed stages and discharges are shown.
Peak stages and discharges
Water year
1909 1910
1911
Date
June 19. 1909
June 7, 1911
Qage height (feet)
2.51.5
2.0
Discharge (cfs)
535 140
288
Water year
1912 1913
Date
May 21, 1912 June 12, 1913
Gage height (feet)
2.1 2.4
Discharge (cfs)
326 450
a Mar. 19-22, Apr. 9, May 10, 1910.
219-848 O - 66 - 8

94 PRICKLY PEAR CREEK BASIN
625. Tenmile Creek near Rimini, Mont.
Location. Lat 46°31'30", long 112°15'20", in SW^NE^ sec.20, T.9 N., R.5 W., on left bank at Moose Creek ranger station, 500 ft upstream from Moose Creek and 3 miles north of Rimini.
Drainage area. 32.7 sq mi.
Gage. Recording. At site 40 ft downstream at different datum prior to Dec. 17, 1934. Altitude of gage is 4,850 ft (from topographic map).
Stage-discharge relation. Defined by current-meter measurements below 450 cfs.
Remarks. Some regulation by Chessman and Scott Reservoirs on tributaries above station (combined capacity, 2,340 acre-ft). Small diversion above station for water supply for city of Helena. Regulation and diversion do not materi ally affect peak flows. Peaks are principally from snowmelt. Base for partial-duration series, 80 cfs.
Peak stages and discharges
Water year
1915
1916
1917
1918
1919
1920
1921
1922
1923
1924
1925
1926
1927
Date
May 9, 1915May 26, 1915June 5, 1915June 16, 1915July 7, 1915
Apr. 27, 1916May 6, 1916June 4, 1916June 8, 1916June 28, 1916July 9, 1916
May 15, 1917May 27, 1917June 8, 1917June 17, 1917
May 4, 1918May 15, 1918June 7, 1918
May 20, 1919
May 11, 1920May 17, 1920May 21, 1920May 27, 1920June 7, 1920June 16, 1920
May 8, 1921May 17, 1921June 4, 1921June 16, 1921
May 21, 1922May 25, 1922June 4, 1922June 8, 1922June 15, 1922
May 10, 1923May 24, 1923June 7, 1923June 27, 1923
May 3, 1924May 16, 1924June 3, 1924
May 18, 1925June 3, 1925
Apr. 19, 1926Apr. 29, 1926May 18, 1926
Apr. 30, 192?May 17, 1927May 26, 1927
Gage height (feet)2.76-
3.334.182.57
2.973.423.503.523.672.97
4.874.984.004.05
1.861.771.84
1.35
1.672.102.122.172.272.23
1.882.512.071.52
2.152.562.182.382.08
1.581.831.581.65
1.522.5"1.57
1.761.73
1.731.711.58
1.562.061.89
Discharge (cfs)
114(a)24447180
125223245251296125
729781401418
171152172
80
134248254269299287
186373239103
262385271331242
115173115130
103367113
173164
200192149
128252198
Water year
1927
1928
1929
1930
1931
1932
1933
1934
1935
1936
1937
1938
1939
1940
1941
1942
1943
Date
June 8, 1927June 11, 1927
Apr. 27, 1928May 9, 1928May 18, 1928
May 23, 1929June 1, 1929June 6, 1929June 17, 1929
Apr. 24, 1930May 1, 1930May 18, 1930
May 13, 1931
May 13, 1932June 9, 1932
May 31, 1933
Apr. 13, 1934Apr. 23, 1934June 7, 1934
May 23, 1935
June 8, 1936
May 9, 1937May 20, 1937
May 1, 1938May 26, 1938June 18, 1938June 23, 1938July 3, 1938
Apr. 29, 1939May 3, 1939
May 3, 1940May 10, 1940June 8, 1940
May 12, 1941June 5, 1941
Apr. 21, 1942May 11, 1942May 25, 1942June 4, 1942
Apr. 20, 1943Apr. 23, 1943May 4, 1943May 27, 1943June 9, 1943June 12, 1943
Gage height (feet)
3.203.36
1.502.161.85
2.582.031.821.56
1.841.761.54
1.18
1.901.66
2.06
1.401.521.65
2.20
1.81
1.832.15
2.573.622.422.392.43
2.592.57
2.282.412.39
2.442.86
2.622.492.962.56
2.602.492.352.932.862.87
Discharge (cfs)
637703
92249165
400232173109
179158105
41
195123
258
85111143
81
66
82134
130490938897
136131
829694
101209
141110242126
15812288
297260264
a Not known; probably exceeded base discharge.

PRICKLY PEAR CREEK BASIN 95
Peak stages and discharges of Tenmile Creek near Rimini, Mont. Continued
Water year
1944
1945
1946
1947
1948
1949
1950
1951
1952
Date
May 18, 1944June 3, 1944June 9, 1944June 16, 1944June 20, 1944June 27, 1944
May 5, 1945May 10, 1945May 13, 1945May 17, 1945May 27, 1945May 31, 1945June 10, 1945
May 28, 1946
Oct. 25, 1946May 8, 1947June 1, 1947June 10, 1947
Apr. 29, 1948May 8, 1948May 21, 1948June 4, 1948June 23, 1948
May 13, 1949June 2, 1949June 21, 1949
May 17, 1950May 22, 1950May 27, 1950June 5, 1950June 16, 1950June 18, 1950
May 12, 1951May 17, 1951May 23, 1951June 11, 1951
Apr. 27, 1952May 3, 1952
Qage height (feet)
2.862.792.572.882.772.89
2.492.502.432.422.552.632.89
2.28
2.313.172.312.84
2.312.433.353.092.58
2.49-
2.37
2.792.942.892.903.003.02
2.912.812.842.92
2.752.56
Discharge (ofs)
242216143250210253
129132113106135152231
73
8233882
223
82107403310142
107blOO
90
226294276284309319
260222236289
242178
Water year
1952
1953
1954
1955
1956
1957
1958
1959
1960
1961
1962
1963
1964
Date
May 15, 1952May 19, 1952
May 7, 1953June 2, 1953June 12, 1953
May 18, 1954June 10, 1954
May 21, 1955May 29, 1955June 1, 1955June 12, 1955June 16, 1955July 11, 1955
May 20, 1956
May 14, 1957May 20, 1957May 26, 1957June 16, 1957
May 11, 1958May 20, 1958June 4, 1958June 11, 1958
June 6, 1959June 15, 1959
May 12, 1960June 2, 1960
May 25, 1961
May 26, 1962June 13, 1962
May 25, 1963June 3, 1963June 10, 1963
June 9, 1964
Gage height (feet)
2.422.34
2.24C3.563.27
2.332.40
2.522.382.402.492.502.38
2.73
2.282.372.472.26
2.692.522.372.40
2.532.25
2.712.50
2.49
2.512.21
2.682.322.33
3.77
Discharge (ofs)
136112
84469335
90111
145107115142145103
219
8510514585
216160118126
20299
274190
186
222111
152169176
d556
b About.c Occurred on following day.d Annual peak only.
627. Little Porcupine Creek tributary near Helena, Mont.
Location.--Lat 46°35', long 112°16' , in SW^ sec.29, T.10 N., R.5 W., at culvert on U.S. Highway 12, 11 miles west of Helena.
Drainage area. 0.48 sq mi.
Gage. Crest-stage gage. Altitude of gage Is 5,360 ft (from topographic map).
Stage-discharge relation.--Defined by current-meter measurements below 2 cfs.
Remarks.--Peaks are principally from snowmelt. Only annual peaks are shown.
Peak stages and discharges
Water year
19591960
1961
Date
June 6, 1959May 12, 1960
May 22, 1961
Oage height (feet)0.45.39
.17
Discharge (ofs)
1.51.2
.4
Water year
19621963
Date
June 2, 1962May 20, 1963
Gage height (feet)
0.49.57
Discharge (cfs)
1.72.2

96 PRICKLY PEAR CREEK BASIN
630. Tenmlle Creek near Helena, Mont.
Location. Lat 46°36'20", long 112°05'20", near center of SE£ sec.22, T.10 N., R.4 W., on right bank at Broadwater Hotel, l| miles west of Helena and 2i miles upstream from Sevenmile Creek.
Drainage area. 102 sq mi.
Gage. Nonreeording prior to Sept. 18, 1925; recording thereafter. At site 100 ft downstream at different datum prior to Mar. 16, 1929. Altitude of gage is 3,960 ft (from topographic map).
Stage-discharge relation. Defined by current-meter measurements below 710 cfs at site used prior to Mar. 16, 1929, and below 580 cfs at described site.
Remarks. Diversions for irrigation of about 1,200 acres above station and for water supply of Helena do not materially affect peak flows. Feaks are principally from snowmelt. Only annual peaks are shown.
Peak stages and discharges
Water year
1909
1910
19111912191319141915
1916
1917191819191920
19211922192319241925
19261927192819291930
1931
Date
May 2 8, June 11,1909
Apr. 20 1910
June 4, 1911May 22, 1912May 28, 1913May 16, 1914June 17, 1915
Mar. 10, 1916June 29, 1916May 28, 1917May 5,15, 1918Apr.27,29, 1919May 18, 1920
May 19, 1921June 9, 1922May 26, 1923May 17, 1924June 10, 1925
Apr. 19, 1926June 11, 1927May 10, 1928May 23, 1929Apr. 25, 1930
May 17, 1931
Gage height (feet)
4.7
2.8
3.854.44.34.84.8
a5. 45-
5.93.6-
4.5
4.74.53.83.93.6
4.266.585.062.702.25
1.32
Discharge (cfs)
477
85
230405328548424
_48699518676
440
456398211236165
340865404450257
37
Water year
1932193319341935
1936193719381939
1940
194119421943
19441945
19461947194819491950
1951195219531954
Date
May 14, 1932May 31, 1933June 7, 1934May 24, 1935
June 8, 1936May 20, 1937May 26, 1938Apr. 29, May 4,
1939June 9, 1940
June 5, 1941May 26, 1942Mar. 28, 1943June 13, 1943June 27, 1944June 10, 1945
May 28, 1946June 9, 1947May 21, 1948May 17, 1949June 18, 1950
June 12, 1951Apr. 28, 1952June 3, 1953June 11, 1954
G-«o;e height (feet)
1.912.211.831.95
1.801.863.552.33
2.28
2.582.81
a3.14-
2.973.11
2.223.383.262.363.06
3.062.853.912.47
Discharge (cfs)
140250129106
8386654108
95
169248-
325340360
80449399113355
329250774132
a Backwater from ice.
MISSOURI RIVER MAIN STEM
655. Missouri River below Hauser Lake Dam, near Helena, Mont.
Location.--Lat 46°46', long 111°53', in SWi sec.29, T.12 N., R.2 W., a quarter of a mile downstream from Hauser Lake powerplant, 1^ miles uprtream from Beaver Creek, and 15 miles northeast of Helena.
Drainage area.--16,876 sq mi.
Gage. Recording. At site a quarter of a mile upstream at datum 3,500 ft above mean sea level (levels by Montana Power Co; add 16 ft to obtain datum of 1929) prior to Feb. 1, 1940. Datum of last used gage is 3,581 ft above mean sea level, datum of 1929.
Stage-discharge relation. Defined by current-meter measurements.
Remarks. All gage-height records, numerous discharge measurements, and computed record for calendar year 1924 and water years 1927-40 furnished by the Montana Power Co. Many diversions for irrigation above station. Flow partly regulated by reservoirs and powerplants above station. Peaks are principally from snowmelt. Only annual peaks are shown.

MISSOURI RIVER MAIN STEM 97
Peak stages and discharges of Missouri River below Hauser Lake Dam, near Helena, Mont.
Water year
1923 1924 1925
1926 1927 1928 1929 1930
1931 1932
Date
May 28, 1923 May 21, 1924 May 22, 1925
May 26, 1926 June 15,18,1927 May 14, 1928 June 19, 1929 Apr. 17, 1930
Apr. 17, 1931 June 20, 1932
Oage height (feet)75.2 74.32 75.85
72.73 78.8
74.2 71.47
70.20 73.46
Discharge (cfs)
20,500 17,900 22,400
13,300 a33,300 a2 1,900 18,000
alO,000
6,690 al3,300
Water year
1933 1934 1935
1936 1937 1938 1939 1940
1941 1942
Date
June 20, 1933 Apr. 20 1934 June 13, 1935
May 18, 1936 July 2, 1937 July 6, 1938 May 8. 1939May 16, 1940
June 11, 1941 June 10, 1942
Gage height (feet)73.20 69.64 72.46
72.60 69.02 75.04 72.106.48
6.60 11.75
Discharge (cfs)
a!2,700 a5,500
all, 100
all, 100 a4,420
a!7,300 alO.100a8,910
alO,200 25,000
a Maximum daily.
665. Missouri River below Holter Dam, near Wolf Creek, Mont.
Location. Lat 46°59'40", long 112°00'50", in S| sec.5, T.14 N., R.3 W., on left bank a quarter of a mile downstream from Holter Dam and 3 miles south east of Wolf Creek.
Drainage area. 17,149 sq mi.
Gage. Recording. Datum of gage is 3,464.11 ft above mean sea level, datum of 1929.
Stage-discharge relation. Defined by current-meter measurements.
Remarks. Diversions for irrigation of about 574,000 acres above station. Plow regulated by nine smaller irrigation reservoirs and powerplants, and since 1953 by Canyon Perry Reservoir (usable capacity, 2,043,000 acre-ft). Annual peak flows not materially affected prior to 1953. Peaks are principally from snowmelt. Only annual peaks are shown.
Peak stages and discharges
Water year
19461947194819491950
19511952195319541955
Date
June 3, 1946June 12, 1947June 8, 1948June 6, 1949June 21, 1950
May 28, 1951June 9, 1952June 19, 1953Jan. 2, 1954July 18, 1955
Oage height (feet)
6.829.75
11.707.807.82
8.458.906.10--
Discharge (cfs)
16,00027,20034,80019,60018,700
22,00023,70013,500a5, 500a6,720
Water year
19561957195819591960
1961196219631964
Date
June 2, 1956June 8, 1957July 3, 1958June 17, 1959Dec. 13, 1959
Feb. 16, 1961June 18, 1962June 21, 1963June 19, 1964
Gage height (feet)
9.487.134.957.906.61
4.126.707.31
10.04
Discharge (cfs)
25,50017,0009,450
19,20014,900
7,76015,00016,70027,100
a Maximum daily.
LITTLE PRICKLY PEAR CREEK BASIN
685. Little Prickly Pear Creek near Marysville , Mont.
Location.--Lat 46°47', long 112°24', in SW^ sec.18, T.12 N. , R.6 W. , half a mile downstream from Deadman Creek and 6 miles northwest of Marysville.
Drainage area. 44.4 sq mi.
Gage.--Nonrecording. Altitude of gage is 4,700 ft (from topographic map).
Stage-discharge relation.--Sub.1ect to large shifts. Defined by current-meter measurements below 340 cfs.
Remarks.--Diversions for irrigation above station do not materially affect peak flows. Peaks are principally from snowmelt. Only annual maximum observed stages and discharges are shown.
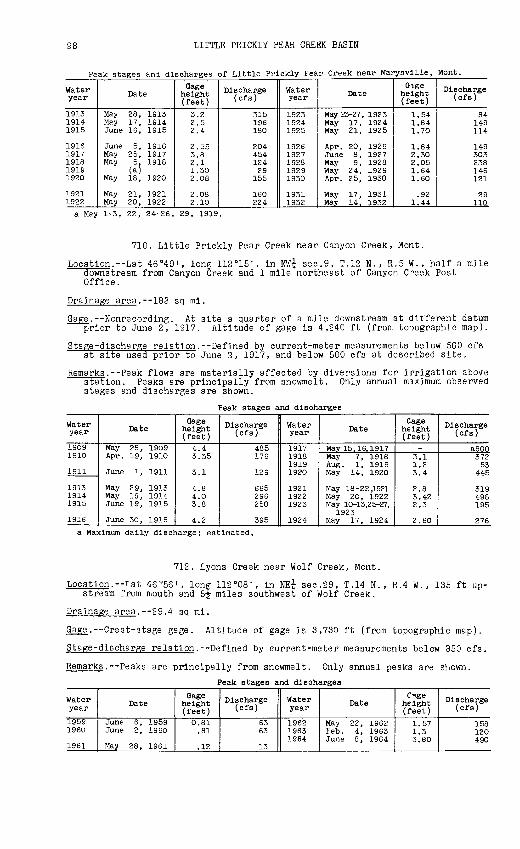
98 LITTLE PRICKLY PEAR CREEK BASIN
Peak stages and discharges of Little Prickly Pear Creek near Marysvllle, Mont.
Water year
191319141915
19161917191819191920
19211922
Date
May 28, 1913May 17, 1914June 16, 1915
June 5, 1916May 25, 1917May 5. 1918
(ajMay 18, 1920
May 21, 1921May 20, 1922
Qage height (feet)
3.22.52.4
2.553.82.11.302.08
2.082.10
Discharge (cfs)
315196180
20445412429
155
160224
Water year
192319241925
19261927192819291930
19311932
Date
May 23-27, 1923May 17, 1924May 21, 1925
Apr. 20, 1926June 8, 1927May 9, 1928May 24, 1929Apr. 25, 1930
May 17, 1931May 14, 1932
Qige height (feet)
1.541.841.70
1.842.302.051.641.60
.921.44
Discharge (cfs)
84149114
149303238146121
29110
a May 1-3, 22, 24-26, 29, 1919.
710. Little Prickly Pear Creek near Canyon Creek, Mont.
Location. Lat 46°49' , long 112°15' , in NW£ sec.9, T.12 N. , R.5 W. , half a mile downstream from Canyon Creek and 1 mile northeast of Canyon C-'eek Post Office.
Drainage area.--183 sq mi.
Gage. Nonrecording. At site a quarter of a mile downstream at different datum prior to June 2, 1917. Altitude of gage is 4,240 ft (from topographic map).
Stage-discharge relation. Defined by current-meter measurements below 560 cfs at site used prior to June 2, 1917, and below 500 cfs at described site.
Remarks.--Peak flows are materially affected by diversions for irrigation above station. Peaks are principally from snowmelt. Only annual maximum observed stages and discharges are shown.
Peak stages and discharges
Water year
1909 1910
1911
1913 1914 1915
1916
Date
May 28, 19O9 Apr. 19, 1910
June 1, 1911
May 29, 1913 May 19, 1914 June 19, 1915
June 3O, 1916
Qage height (feet)
4.4 3.35
3.1
4.8 4.0 3.8
4.2
Discharge (cfs)
485 176
129
665 296 250
395
Water year
1917 1918 1919 1920
1921 1922 1923
1924
Date
May 15,16,1917May 7, 1918 Aug. 1, 1919 May 14, 1920
May 18-22,1921 May 20, 1922 May 10-13,25-27,
1923 May 17, 1924
Gage height (feet)
-3.1 1.23.4
2.8 3.42 2.3
2.60
Discharge (cfs)
a800372 53
445
319 498 195
276
a Maximum daily discharge; estimated.
712. Lyons Creek near Wolf Creek, Mont.
Location.--Lat 46°56', long 112°08', in NE£ sec.29, T.14 N., R.4 W., 135 ft up stream from mouth and 5j miles southwest of Wolf Creek.
Drainage area. 29.4 sq mi.
Gage.--Crest-stage gage. Altitude of gage is 3,730 ft (from topographic map).
Stage-discharge relation. Defined by current-meter measurements below 350 cfs.
Remarks. Peaks are principally from snowmelt. Only annual peaks are shown.
Peak stages and discharges
Water year
1959 1960
1961
Date
June 6, 1959 June 2, I960
May 28, 1961
Gage height (feet)0.81 .81
.12
Discharge (cfs)
63 63
13
Water year
1962 1963 1964
Date
May 22, 1962 Feb. 4, 1963 June 8, 1964
Cage height (feet)
1.57 1.3 3.80
Discharge (cfs)
158 120 490

DEARBORN RIVER BASIN 99
730. Dearborn River near demons, Mont.
Location.--Lat 47°17'30", long 112°27'00", In SE^SE^ sec.23, T.18 N. , R.7 W. , on right bank 300 ft upstream from highway bridge, half a mile southeast of former post office at demons, 2 miles downstream from Falls Creek, and 14 miles south of Augusta.
Drainage area.--123 sq mi.
Gage.--Nonrecordlng prior to Apr. 8, 1931; recording thereafter. Altitude of gage is 4,560 ft (by barometer).
Stage-discharge relation. Defined by current-meter measurements.
Remarks.--Diversions for irrigation of about 2,500 acres below station do not materially affect peak flows. Peaks are principally from snpwtnelt. Base for partial-duration series, 450 cfs. Only annual peaks are shown p"ior to 1931.
Peak stages and discharges
Water year
192119221923
19291930
1931
1932
1933
1934
1935
1936
1937
1938
1939
1940
1941
1942
1943
1944
Date
May 25,27, 1921June 6, 1922Aug. 21, 1923
May 24, 1929Apr. 25, 1930
May 17, 1931
May 14, 1932June 10, 1932
June 1, 1933
Apr. 14, 1934Apr. 23, 1934May 7, 1934June 7, 1934
May 24, 1935
May 15, 1936
June 13, 1937
May 28, 1938June 24, 1938
May 5, 1939
May 12, 1940
June 1, 1941June 5, 1941
May 26, 1942June 8, 1942
Apr. 20, 1943May 29, 1943June 13, 1943
May 19, 1944
Gage height (feet)
3.223.703.28
3.112.72
1.37
2.573.41
3.54
2.642.942.955.58
2.86
2.43
2.58
4.573.19
2.24
2.14
2.782.67
3.513.36
2.803.145.32
3.99
Discharge (cfs)
9651,3401,010
958625
82
5441,150
1,260
540698703
2,450
655
470
515
1,890920
368
317
648584
1,2601,150
660878
2,490
1,320
Water year
1944
1945
1946
1947
1948
1949
1950
1951
1952
1953
1964
Date
June 10, 1944June 17, 1944June 28, 1944
June 5, 1945June 22, 1945
May 28, 1946
May 5, 1947May 10, 1947May 27, 1947June 9, 1947
May 22, 1948June 4, 1948June 16, 1948
May 17, 1949May 27, 1949
May 18, 1950May 23, 1950May 28, 1950June 6, 1950June 15, 1950
Apr. 30, 1951May 12, 1951May 24, 1951June 15, 1951July 13, 1951
Apr. 28, 1952May 16, 1952
Apr. 28, 1953May 8, 1953May 20, 1953June 4, 1953June 13, 1953
June 9, 1964
Gage height (feet)
2.964.123.35
3.972.95
3.44
3.693.702.873.17
4.255.974.22
3.263.32
3.663.813.503.614.64
3.183.693.594.343.24
3.433.93
3.243.423.156.204.57
9.15
Discharge (cfs)
6261,400
86S
1,260590
891
968975489658
1,3502,9701,290
576612
790938720790
1,690
540839748
1,420576
6841,060
535662540
3,2001,670
a!7,400a Annual peak only.

100 DEARBORN RIVER BASIN
735. Dearborn River near Craig, Mont.
Location. Lat 47°11'55", long 112°05'25", in NE^SEv sec.27, T.17 N., R.4 W., on right bank a quarter of a mile downstream from bridge on State Highway 287, 5 miles downstream from South Fork, 10 miles northwest of Craig, and 12 miles upstream from mouth.
Drainage area. 325 sq mi.
Gage.--Nonrecordlng prior to Oct. 1, 1946: recording thereafter. Altitude of gage is 3,790 ft (from topographic map).
Stage-discharge relation. Defined by current-meter measurements below 6.40C cfs.
Remarks. Diversions for irrigation of about 3,300 acres do not materially affect peak flows. Peaks are principally from snowmelt. Base for partial- duration series, 950 cfs.
Peak stages and discharges
Water year
1946
1947
1948
1949
1950
1951
1952
1953
Date
May 29, 1946
Mar. 15, 1947May 3, 1947June 10, 1947
Mar. 28, 1948May 9, 1948May 14, 1948May 22, 1948June 5, 1948June 17, 1948
Feb. 17, 1949May 28, 1949
May 18, 1950May 23, 1950May 28, 1950June 7, 1950June 16, 1950
Mar. 21, 1951Apr. 30, 1951May 12, 1951May 24, 1951June 13, 1951July 10, 1951
Apr. 28, 1952May 16, 1952
Apr. 28, 1953
Gage height (feet)
5.72
b7.975.755.24
5.325.135.466.487.897.61
b5.525.21
5.825.915.535.846.43
b7.596.185.885.576.205.35
5.326.06
5.38
Discharge (cfs)
al,170
(c)1,400
954
1,190986
1,1902,0504,4003,900
-798
1,2801,5601,0101,2901,990
-1,7101,5101,2301,8301,080
1,0201,690
1,030
Water year
1953
1954
1955
1956
1957
1958
1959
1960
1961
1962
1963
1964
Date
May 8, 1953May 25, 1953June 4, 1953
May 20, 1954June 12, 1954
May 22, 1955June 14, 1955
Dec. 22, 1955May 22, 1956
May 21, 1957
May 12, 1958June 4, 1958June 12, 1958
June 6, 1959June 15, 1959
May 13, 1960
May 30, 1961
May 17, 1962May 26, 1962June 15, 1962
June 11, 1963
June 9, 1964
Cage height (feet)
5.327.559.58
5.254.90
5.764.71
b5.064.75
8.64
5.456.167.96
5.705.33
6.12
5.23
5.987.505.87
5.42
13.50
Discharge (cfs)
9703,8807,960
1,5001,210
1,8901,010
-1,080
6,150
1,6202,4304,940
1,3301,010
1,820
876
1,5803,4701,840
1,400
dl5,400a Annual maximum observed only. b Backwater from Ice.
exceeded base discharge. d Annual peak only.c Not known; probably
MISSOURI RIVER MAIN STEM
740. Missouri River at Cascade, Mont.
Location.--Lat 47°16', long 111°42', in SE^NE^- sec.35, T.18 N., F.I W. , at highway bridge at Cascade.
Drainage area.--18.493 sq mi.
Gage.--Nonrecording. Datum of gage is 3,337.8 ft above mean sea level, datum of 1929.
Stage-discharge relation. Defined by current-meter measurements below 37,000 cfs.
Remarks.--Diversions for irrigation of about 588,000 acres above station. Some regulation by Hauser Lake .and Canyon Ferry powerplants. Peak flows are materially affected. Peaks are principally from snowmelt. Orly annual maximum observed stages and discharges are shown.

MISSOURI RIVER MAIN STEM 101
Peak stages and discharges of Missouri River at Cascade, Mont.
Water year
190319041905
1906190719081909
Date
June 9, 1903May 27, 1904June 30, 1905
June 19, 1906June 23, 1907June 5, 1908June 9, 1909
Gage height (feet)
9.39.56.65
8.013.216.713.5
Discharge (cfs)
22,70021,71010,410
17,18039,24054,25039,850
Water year
1910
1911191219131914
1915
Date
May 13, 1910
June 17, 1911June 17, 1912June 5, 1913May 27, June 9,
1914June 12, 1915
Gage height (feet)
8.9
10.911.3712.359.9
8.5
Discharge (cfs)
19,700
27,20029,08032,13022,800
17,500
SMITH RIVER BASIN
745. Smith River near White Sulphur Springs, Mont.
Location.--Lat 46°40', long 110°44', near center of sec.33, T.ll N. , R.8 E., at Meachen Ranch, 12 miles northeast of White Sulphur Springs.
Drainage area. 30.7 sq mi.
Gage.--NonrecordIng. At site 150 ft downstream prior to June 27, 1927. Alti tude of gage is 5,600 ft (from topographic map).
Stage-discharge relation. Defined by current-meter measurements below 180 cfs and extended above by logarithmic plotting.
Remarks.--Small diversions for irrigation above station do not materiallyaffect peak flows. Peaks are principally from snowmelt. Only annual peaks are shown.
Peak stages and discharges
Water year
1923 1924 1925
1926 1927 1928 1929 1930
Date
June 21, 1923 May 19, 1924 June 16, 1925
Apr. 15, 1926May 27, 1927 Apr. 26, 1928 May 24, 1929 Apr. 9, 1930
Qage height (feet)3.05 2.08 2.63
3.53.20 3.4 2.55 2.83
Discharge (cfs)
224 111 172
216al86 234 72
117
Water year
1931
1934 1935
1936
Date
Mar. 23, 1931 May 16, 1931
June 7, 1934 May 31, 1935
Apr. 11, 1936
Gage height (feet)
b2.60 2.43
2.52 2.41
4.20
Discharge (cfs)
33
54 46
770
a Maximum observed; was higher about June 9, 1927. b Maximum observed; backwater from ice.
760. Newland Creek near White Sulphur Springs, Mont.
Location.--Lat 46°44', long 110°50', near line between sees. 9 and 10, T.ll N., R.7 E., on left bank 13 miles north of White Sulphur Springs and 15 miles upstream from mouth.
Drainage area.--6.74 sq mi.
Gage. Recording gage and artificial control. Altitude of gage is 5,5SO ft (by barometer).
Stage-discharge relation. Defined by current-meter measurements below 10 cfs.
Remarks.--Small diversions for irrigation of hay meadows above station do not materially affect peak flows. Peaks are principally from snowmelt. Only annual peaks are shown.
Peak stages and discharges
Water year
1946 1947 1948 1949 1950
1951 1952
Date
June 11,17, 1946 May 6, 1947 May 8, 1948 June 1, 1949 May 28, 1950
May 13, 1951 May 4, 1952
Qage height (feet)
0.72 2.18 2.64 1.48 1.64
1.62 1.66
Discharge (cfs)
4.9 18 29 6.2 9.5
1114
Water year
1953
1960
1961 1962 1963
Date
June 4, 1953
May 19, 1960
May 31, 1961 May 29, 1962 June 26, 1963
Qage height (feet)
3.50
2.39
2.18 2.68 2.53
Discharge (cfs)
56
5.1
3.2 15 11

102 SMITH RIVER BASIN
765. Newland Creek near damslte, near White Sulphur Springs, Mont.
Location. Lat 46°38', long 110°57', in NW£ sec.14, T.10 N., R.6 E., on right bank 50 ft upstream from farm bridge, 4 miles downstream from U.S. Highway 89, and 6 miles north of White Sulphur Springs.
Drainage area. 44.8 sq ml.
Gage. Nonrecordlng. At site 50 ft downstream at datum 0.52 ft lower prior to June 14, 1951. Altitude of gage is 5,100 ft (by barometer).
Stage-discharge relation.--Defined by current-meter measurements below 150 cfs.
Remarks. Diversions for Irrigation of about 200 acres above station. Plow may be supplemented by diversion from Sheep Creek, which enters 8 miles up stream. Peak flows are not materially affected. Peaks are principally from snowmelt. Only annual peaks are shown.
Peak stages and discharges
Water year
1951 1952 1953 1954
Date
May 142 1951May 22, 1952 June 5, 1953 July 1, 1954
Qage height (feet)
1.281.38 3.83 1.04
Discharge (cfs)
5345
227 21
Water year
1955
1956 1957
Date
June 16, 1955
Mar. 25, 1956 June 16, 1957
Gage height (feet)
1.22
1.33 1.14
Discharge (cfs)
28
4327
768. Nugget Creek near Nelhart, Mont.
Location.--Lat 46°47", long 110"42 1 , In NE£ sec.27, T.12 N., R.8 E., at culvert on U.S. Highway 89, 11 miles south of Nelhart.
Drainage area. 1.48 sq mi.
Gage. Crest-stage gage. Altitude of gage Is 6,400 ft (from topoTraphlc map).
Stage-discharge relation. Defined by current-meter measurements below 7 cfs and by culvert computation at 14.3 cfs.
Remarks. Peaks are principally from snowmelt. Only annual peaks are shown.
Peak stages and discharges
Water year
1959 1960
1961
Date
June 7, 1959 May 12, 1960
May 27, 1961
Gage height (feet)
1.05 .38
.30
Discharge (cfs)
14 5
4
Water year
1962 1963
Date
May 25, 1962 June 2, 1963
Gage height
0.50 .50
Discharge (cfs)
66
770. Sheep Creek near White Sulphur Springs, Mont.
Location.--Lat 46°46', long 110°49', In SW£SE£ sec.26, T.12 N., R.7 E., on right bank 7 miles upstream from Moose Creek and 16 miles north of White Sulphur Springs.
Drainage area. 54.4 sq mi.
Gage.--Nonrecording prior to May 4, 1955; recording thereafter. At site 1,000 ft upstream at datum 7.03 ft higher prior to Oct. 1, 1942, and at site 700 ft upstream at datum 5.33 ft higher Oct. 1, 1942, to May 2, 1955. Alti tude of gage Is 5,820 ft (by barometer).
Stage-discharge relation.--Defined by current-meter measurements below 220 cfs at present site and below 390 cfs at site used 1943 to 1955.
Remarks.--Diversions for Irrigation of about 200 acres above station do not materially affect peak flows. Peaks are principally from snowmelt. Base for partial-duration series, 120 cfs. Only annual peaks are rhown prior to 1955.
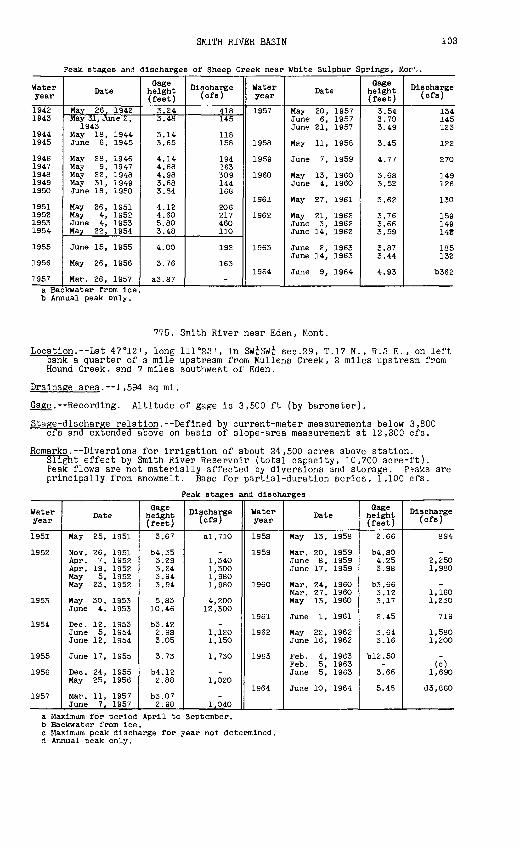
SMITH RIVER BASIN 103
Peak stages and discharges of Sheep Creek near White Sulphur Springs, Mort.
Water year
19421943
19441945
19461947194819491950
1951195219531954
1955
1956
1957
Date
May 26, 1942May 31, June 2,
1943May 18, 1944June 6, 1945
May 28, 1946May 9, 1947May 22, 1948May 31, 1949June 18, 1950
May 26, 1951May 4, 1952June 4, 1953May 22, 1954
June 15, 1955
May 26, 1956
Mar. 28, 1957
Gage height (feet)3.243.48
3.143.65
4.144.684.983.683.84
4.124.605.803.48
4.00
3.76
a3.87
Discharge (cfs)
418145
118158
194?63'509
144168
206217460110
192
163
-
Water year
1957
1958
1959
1960
1961
1962
1963
1964
Date
May 20, 1957June 6, 1957June 21, 1957
May 11, 1958
June 7, 1959
May 13, 1960June 4, 1960
May 27, 1961
May 21, 1962June 3, 1962June 14, 1962
June 2, 1963June 14, 1963
June 9, 1964
Gage height (feet)
3.543.703.49
3.45
4.77
3.683.52
3.62
3.763.663.59
3.873.44
4.93
Discharge (cfs)
134145123
122
270
149126
130
159149142
185132
b362
a Backwater from Ice. b Annual peak only.
775. Smith River near Eden, Mont.
Location.--Lat 47°12', long 111°23', in SW^SWi sec.29, T.17 N., R.3 E. , on leftbank a quarter of a mile upstream from Mullens Creek, 2 miles upstream fromHound Creek, and 7 miles southwest of Eden.
Drainage area. 1,594 sqmi.
Gage.--Recording. Altitude of gage is 3,500 ft (by barometer).
Stage-discharge relation. Defined by current-meter measurements below 3,800 cfs and extended above on basis of slope-area measurement at 12,300 cfs.
Remarks. Diversions for irrigation of about 24,500 acres above station. Slight effect by Smith River Reservoir (total capacity, 10,700 acre-ft). Peak flows are not materially affected by diversions and storage. Peaks are principally from snowmelt. Base for partial-duration series, 1,100 cfs.
Peak stages and discharges
Water year
1951
1952
1953
1954
1955
1956
1957
Date
May 25, 1951
Nov. 26, 1951Apr. 7, 1952Apr. 19, 1952May 5, 1952May 23, 1952
May 30, 1953June 4, 1953
Dec. 12, 1953June 5, 1954June 12, 1954
June 17, 1955
Dec. 24, 1955May 25, 1956
Mar. 11, 1957June 7, 1957
Gage height (feet)
3.67
b4.353.293.243.943.94
5.8310.46
b3.422.9S3.05
3.73
b4.122.88
b3.072.98
Discharge (cfs)
al,710
_1,3401,3001,9801,980
4,20012,300
-1,1201,150
1,730
-1,020
-1,040
Water year
195S
1959
1960
1961
1962
1963
1964
Date
May 13, 1958
Mar. 20, 1959June 8, 1959June 17, 1959
Mar. 24, 1960Mar. 27, 1960May 13, 1960
June 1, 1961
May 22, 1962June 16, 1962
Feb. 4, 1963Feb. 5, 1963June 5, 1963
June 10, 1964
Gage height (feet)
2.66
b4.SO4.253.98
b3.663.123.17
2.45
3.643.16
b!2.50-
3.66
5.48
Discharge (cfs)
894
_2,2501,980
-1,1601,230
719
1,5801,200
_(c)
1,690
d3,860
a Maximum for period April to September.b Backwater from ice.c Maximum peak discharge for year not determined.d Annual peak only.

104 SMITH RIVER BASIN
778. Goodman Coulee near Eden, Mont.
Location.--Lat 47°20', long 111 025', in center sec.12, T.18 N., R.2 E., at culvert on county road, 8 miles northwest of Eden.
Drainage area. 21.8 sq mi.
Gage. Crest-stage gage. Altitude of gage is 3,370 ft (from topographic map).
Stage-discharge relation. Defined by current-meter measurements below 15 cfs and extended above on basis of computed flow through culvert, u^ing head as indicated by crest-stage gages.
Remarks. Only annual peaks are shown.
Peak stages and discharges
Water year
1959 1960
1961
Date
Apr. 22, 1959 May 1, 1960
-
Gage height (feet)
1.57 1.92
-
Discharge (cfs)
49 41
(a)
Water year
1962 1963
Date
Mar. 19, 1962 Feb. 4, 1963
Q,\?e height (foot)
4.17 2.30
Discharge (cfs)
127 55
a No evidence of flow during year.
780. Smith River at Truly, Mont.
Location.--Lat 47°21', long 111°26', near center of sec.35, T.19 N., R.2 E., at highway bridge at former post office at Truly, 6 miles southeast of Ulm and 6 miles upstream from mouth.
Drainage area.--2,006 sq mi.
Gage. Nonrecording. At different datum prior to June 30, 1907. Altitude of gage is 3,330 ft (by barometer).
Stage-discharge relation. Defined by current-meter measurements below 1,700 cfs and extended to 8,800 cfs on basis of logarithmic plotting, and at 30,300 cfs by slope-area measurement.
Remarks. Diversions for irrigation of about 24,700 acres above station do not materially affect peak flows. Only annual maximum observed stages and dis charges are shown.
Peak stages and discharges
Water year
1905
1906 1907
1929
Date
June 12, 1905
June 7, 1906 June 24, 1907
May 25, 1929
Gage height (feet)
2.65
3.98 9.0
4.90
Discharge (cfs)
534
1,250 8,800
3,500
Water year
1930
1931 1932
1953
Date
Apr. 26, 1930
Apr. 8, 1931 June 10, 1932
June 4, 1953
G-x*e height (feet)
4.00
2.55 5.25
Discharge (cfs)
1,640
597 2,900
30,300
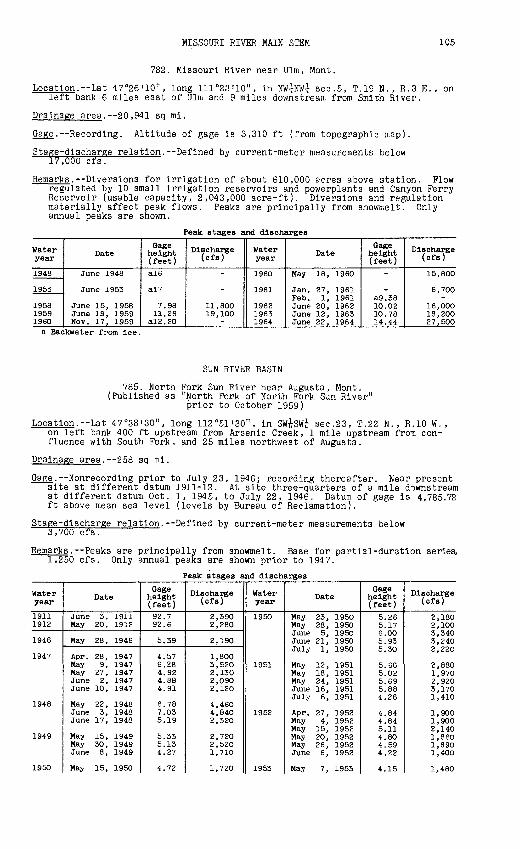
MISSOURI RIVER MAIN STEM 105
782. Missouri River near Ulm, Mont.
Location. Lat 47°26'10", long 111°23'10", in NW^NW^ sec.5, T.19 N. , R.3 E. , on left bank 6 miles east of Ulm and 9 miles downstream from Smith River.
Drainage area. 20,941 sq mi.
Gage.--Recording. Altitude of gage is 3,310 ft (from topographic map).
Stage-discharge relation. Defined by current-meter measurements below 17,000 cfs.
Remarks.--Diversions for irrigation of about 610,000 acres above station. Plow regulated by 10 small irrigation reservoirs and powerplants and Canyon Perry Reservoir (usable capacity, 2,043,000 acre-ft). Diversions and regulation materially affect peak flows. Peaks are principally from snowmelt. Only annual peaks are shown.
Peak stages and discharges
Water year
1948
1953
1958 1959 1960
Date
June 1948
June 1953
June 15, 1958 June 19, 1959 Nov. 17, 1959
Gage height (feet)a!6
al7
7.98 11.26
a!2.20
Discharge (cfs)
11,800 19,100
Water year
1960
1961
1962 1963 1964
Date
May 18, 1960
Jan. 27, 1961 Feb. 1, 1961 June 20, 1962 June 12, 1963 June 22, 1964
Gage height (feet)
a9.38 10.02 10.78 14.44
Discharge (cfs)
15,800
6,700
16,000 18,200 27,500
a Backwater from Ice.
SUN RIVER BASIN
785. North Pork Sun River near Augusta, Mont. (Published as "North Pork of North Pork Sun River"
prior to October 1959)
Location.--Lat 47°38'30", long 112°51'30", in Sw£sw£ sec.23, T.22 N., R.10 W., on left bank 400 ft upstream from Arsenic Creek, 1 mile upstream froTi con fluence with South Pork, and 25 miles northwest of Augusta.
Drainage area. 258 sq mi.
Gage.--Nonrecording prior to July 23, 1946; recording thereafter. Near present site at different datum 1911-12. At site three-quarters of a mile downstream at different datum Oct. 1, 1945, to July 22, 1946. Datum of gage is 4,785.72 ft above mean sea level (levels by Bureau of Reclamation).
Stage-discharge relation.--Defined by current-meter measurements below 3,700 cfs.
Remarks.--Peaks are principally from snowmelt. Base for partial-duration series, 1,250 cfs. Only annual peaks are shown prior to 1947.
Peak stages and discharges
Water year
19111912
1946
1947
1948
1949
1950
Date
June 3, 1911May 20, 1912
May 28, 1946
Apr. 28, 1947May 9, 1947May 27, 1947June 2, 1947June 10, 1947
May 22, 1948June 3, 1948June 17, 1948
May 15, 1949May 30, 1949June 8, 1949
May 15, 1950
Gage height ( feet )92.792.6
5.39
4.576.284.924.884.91
6.787.035.19
5.335.134.27
4.72
Discharge (cfs)
2,3902,280
2,190
1,8003,5202,1302,0902,120
4,4604,8402,320
2,7202,5201,710
1,720
Water year
1950
1951
1952
1953
Date
May 23, 1950May 28, 1950June 5, 1950June 21, 1950July 1, 1950
May 12, 1951May 18, 1951May 24, 1951June 16, 1951July 6, 1951
Apr. 27, 1952May 4, 1952May 15, 1952May 20, 1952May 26, 1952June 6, 1952
May 7, 1953
Gage height (feet)
5.265.176.005.935.30
5.665.025.695.884.26
4.844.845.114.804.594.22
4.15
Discharge (cfs)
2,1802,1003,3403,2402,220
2,8801,9702,9203,1701,410
1,9001,9002,1401,8601,6901,400
1,480
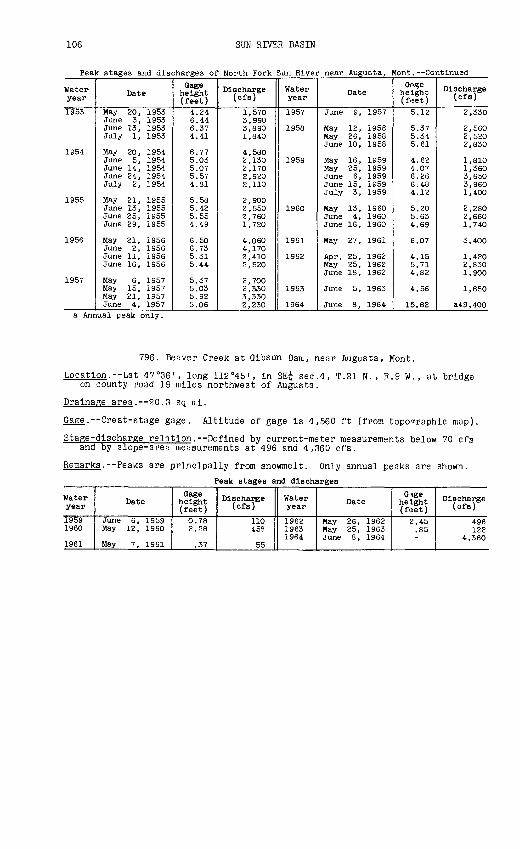
106 SUN RIVER BASIN
Peak stages and discharges of North Fork Sun River near Augusta, Mont.--Continued
Water year
1953
1954
1955
1956
1957
Date
May 20, 1953June 3, 1953June 13, 1953July 1, 1953
May 20, 1954June 5, 1954June 14, 1954June 24, 1954July 2, 1954
May 21, 1955June 13, 1955June 25, 1955June 29, 1955
May 21, 1956June 2, 1956June 11, 1956June 16, 1956
May 6, 1957May 15, 1957May 21, 1957June 4, 1957
Gage height (feet)
4.246.446.374.41
6.775.035.075.574.81
5.585.425.554.49
6.506.735.315.44
5.375.035.925.06
Discharge (cfs)
1,5703,9903,8901,840
4,5802,1302,1702,9202,110
2,9002,5502,7601,720
4,0604,1702,4102,520
2,7002,3303,3302,230
Water year
1957
1958
1959
1960
1961
1962
1963
1964
Date
June 9, 1957
May 12, 1958May 26, 1958June 10, 1958
May 16, 1959May 25, 1959June 6, 1959June 15, 1959July 3, 1959
May 13, 1960June 4, 1960June 16, 1960
May 27, 1961
Apr. 25, 1962May 25, 1962June 18, 1962
June 5, 1963
June 8, 1964
Oa?e height (fl5et)
5.12
5.375.345.61
4.624.076.266.484.12
5.205.634.69
6.07
4.155.714.82
4.56
15.82
Discharge (cfs)
2,330
2,5602,5202,830
1,8101,3603,6503,9601,400
2,2802,6601,740
3,400
1,4202,8301,900
1,680
349,400a Annual peak only.
796. Beaver Creek at Gibson Dam, near Augusta, Mont.
Location.--Lat 47°36', long 112°45', in SE^ sec.4, T.21 N., R.9 W., at bridge on county road 19 miles northwest of Augusta.
Drainage area. 20.3 sq mi.
Gage.--Crest-stage gage. Altitude of gage is 4,560 ft (from topographic map).
Stage-discharge relation.--Defined by current-meter measurements below 70 cfs and by slope-area measurements at 496 and 4,360 cfs.
Remarks. Peaks are principally from snowmelt. Only annual peaks are shown.
Peak stages and discharges
Water year
1959 1960
1961
Date
June 6, 1959 May 12, 1960
May 7, 1961
Gage height (feet)0.78 2.28
.37
Discharge (cfs)
110 458
55
Water year
1962 1963 1964
Date
May 26, 1962 May 25, 1963 June 8, 1964
0\ge height (feet)2.45.85
Discharge (cfs)
496 122
4,360

SUN RIVER BASIN 107
800. Sun River near Augusta, Mont.(Published as "above Augusta" 1889-90 and as North Pork Sun
River near Augusta 1904-40)
Location. Lat 47°37 I , long 112°42', In NW£ sec.36, T.22 N., R.9 W., 150 ft up stream from diversion dam and 18 miles northwest of Augusta.
Drainage area.--609 sq ml.
Gage. Nonrecordlng prior to Oct. 1, 1936; recording thereafter. At site 8 miles downstream at different datum prior to Jan. 1, 1916. At divsrsion dam 150 ft downstream at same datum Jan. 1, 1916, to Sept. 30, 1936. Datum of gage Is 4,474 ft above mean sea level (levels by Bureau of Reclamation).
Stage-discharge relation. Defined by current-meter measurements below 11,000 cfs.
Remarks.--Records for 1916-36 and Plshkun Canal data furnished by Bureau of Rec lamation. Plow since 1930 regulated by Glbson Dam (usable capacity, 105,000 acre-ft. Prior to 1939, usable capacity was 88,560 acre-ft). Rec ords for 1916-40 Include flow In Plshkun Canal. Peak flows not materially affected prior to 1930. Only annual peaks are shown.
Peak stages and discharges
Water year
1890
1905
19061907190819091910
19111912191319141915
1916
Date
May 9, 1890
June 6, 1905
June 5,13,1906June 2, 1907June 7, 1908June 3, 16, 1909May 8, 1910
June 15, 1911May 21, 1912May 24, 1913May 17, 1914May 1, 1915
June 21, 1916
Gage height (feet)
4.35
4.1
3.15.69.56.05.1
4.84.86.64.354.0
11.4
Discharge (cfs)
4,085
4,070
2,3206,530
20,0007,0305,040
5,6905,6709,8304,5703,850
32,300
Water year
1917191819191920
19211922192319241925
1926192719281929
1964
Date
May 25, 1917June 10, 1918May 28, 1919June 15, 1920
May 26, 1921June 5, 1922June 12, 1923May 15, 1924May 20, 1925
Apr. 30, 1926June 9, 1927May 23, 192SMay 24, 1929
June 9, 1964
Gage height (feet)
8.26.023.43.9
4.404.403.604.404.60
2.805.955.603.6
15.7
Discharge (cfs)
18,70011,9004,6706,130
7,2807,3505,2507,1507,920
3,54011,40010,7005,290
59,700
815. Willow Creek near Augusta, Mont.
Location. Lat 47°33 I , long 112 °28', In NW^SWi sec. 26, T.21 N. , R.7 W. , just downstream from Little Willow Creek, 5 miles northwest of Augusta.
Drainage area. --96. 1 sq ml.
Gage.. Nonrecordlng. Altitude of gage Is 4,150 ft (by barometer).
Stage-discharge relation. Defined by current-meter measurements below 650 cfs.
Remarks Diversions for Irrigation of about 2,000 acres above gage probably do not materially affect peak flows. Peaks are principally from snowmelt. Only annual peaks are shown.
Peak stages and discharges
Water year
1905
1906 1907 1908 1909 1910
1912 1913 1914 1915
Date
June 26, 1905
May 29, 1906 Feb. S, 1907 June 5, 1908 June 9, 1909 Mar. 3, 1910
May 22, 1912 May 28, 1913 June 13, 1914 June 16, 1915
Gage height (feet)
3.15
3.47 6. OS 9.5 8.1 5.8
5.9 4.2 3.3 3.4
Discharge (cfs)
103
116 347 900 672 312
338 189 109 132
Water year
1916 1917 191S 1919 1920
1921 1922 1923 1924 1925
Date
June 23, 1916 May 26, 1917 Dec. 26, 1917
(aj May 12, 1920
May 22, 1921 June 9, 1922 Aug. 21. 1923
W June 4, 1925
Gage height (feet)10.8 9.58 3.2 .8
4.75
1.63 1.85 1.45 1.70 1.37
Discharge (cfs)
1,150 914 127 16
272
60 82 50 64 50
a Oct. 1-6, 17, 1918, b Apr. 5-7, May 8-12,
Mar. 29, 31, 1919. 1924.

108 SUN RIVER BASIN
825. Smith Creek near Augusta, Mont.
Location. Lat 47°25', long 112°39', in NE^SE^ sec.8, T.19 N. , R.8 W., 5 miles upstream from Ford Creek and 13 miles southwest of Augusta.
Drainage area. 25.0 sq mi.
Gage.--Nonrecording. Altitude of gage is 4,600 ft (from topographic map).
Stage-discharge relation. Defined by current-meter measurements below 300 cfs.
Remarks. Only annual peaks are shown.
Peak stages and discharges
Water year
1906 1907 1908 1909
Date
June 3, 1906 June 23, 1907 June 4, 1908 June 8, 1909
Gage height (feet)
1.8 4.0 5.5 2.8
Discharge (efs)
175 911
1,500 580
Water year
1910
1911 1912
Date
(a)
May 15, 1911 May 22, 1912
Gix?e height (f«et)
0.9
2.40 2.5
Discharge (cfs)
63
454 484
a Mar. 20-22, Apr. 24-27, 1910.
835. Ford Creek near Augusta, Mont.
Location.--Lat 47°26', long 112°40', near center of south line of sec.31, T.20 N., R.8 W., at Ford Ranch, 14 miles west of Augusta.
Drainage area. 19.4 sq mi.
Gage. Nonrecording. Altitude of gage is 4,760 ft (from topographic map).
Stage-discharge relation. Defined by current-meter measurements below 140 cfs.
Remarks. One diversion for irrigation above station does not materially affect peak flows. Peaks are principally from snowmelt. Only annual peaks are shown.
Peak stages and discharges ___ __
Water year
1906 1907 1908 1909 1910
Date
June 2, 1906 June 23, 1907 June 4, 1908 June 19, 1909 Apr. 27, 1910
Gage height (feet)
1,8 3.55.1 5.5 1.75
Discharge (cfs)
93 430
1,030 1,230
72
Water year
1911
1912
1964
Date
May 15, June 7, 1911
May 20, 1912
June 8, 1964
G^e height (f»t)
2.2
2.7
Discharge (cfs)
128
216
2,700

SUN RIVER BASIN 109
840. Smith Creek below Ford Creek,near Augusta, Mont.
Location.--Lat 47°26' , long 112°31', in Sj sec.32, T.20 N., R.7 W., on right bank 2 miles downstream from Ford Creek, 4 miles upstream from mouth, and 7 miles southwest of Augusta.
Drainage area.--74.0 sq mi.
Gage.--Nonrecordlng at site 300 ft upstream at different datum prior to July 9, 1946; recording thereafter. Altitude of gage is 4,300 ft (from topographic map).
Stage-discharge relation.--Defined by current-meter measurements below £40 cfs.
Remarks.--Diversions for irrigation of about 1,000 acres above station do not materially affect peak flows. Peaks are principally from snowmelt. Base for partial-duration series, 75 cfs
Peak stages and discharges
Water year1946
1947
1948
1949
1950
Date
Jan. 26, 1946May 28, 1946
Feb. 1, 1947Mar. 15, 1947May 11, 1947June 12, 1947
Apr. 23, 1948May 20, 1948May 29, 1948June 5, 1948June 17, 1948
Feb. 23, 1949May 17, 1949May 26, 1949
Oct. 19, 1949May 18, 195OMay 23, 1950
Gage height (feet)a2.782.28
a4.183.083.072.78
2.563.823.715.705.01
a4.892.662.75
2.423.073.13
Discharge (ofs)
-102
-299294178
107550495
1,8301,300
-147170
91236256
Water year1950
1951
1952
1964
Date
June 14, 195O
Mar. 21, 1951Mar. 25, 1951Apr. 30, 1951May 12, 1951June 12, 1951July 11, 1951Aug. 28, 1951
Dec. 10, 1951May 4, 1952May 15, 1952May 30, 1952June 25, 1952July 12, 1952July 19, 1952Aug. 11, 1952
June 8, 1964
Gage height (feet)
3.79
2.492.443.293.323.773.302.54
a3.562.633.362.642.522.412.382.44
13.4
r'.scharge (cfs)
535
10192
315331555323111
-128339129104837789
6,140
a Backwater from ice.
845. Elk Creek at Augusta, Mont. (Formerly published as South Fork Sun River at Augusta)
Location.--Lat 47°29', long 112°23', in NW^SE^ sec.17, T.20 N., R.6 W., at old highway bridge, half a mile from Augusta and 6 miles upstream from mo'jth.
Drainage area.--157 sq mi.
Gage. Nonrecording. to December 1908.
At site 300 ft upstream at different datum Apr. 20, 1907, Altitude of gage is 4,070 ft (by barometer).
Stage-discharge relation. Defined by current-meter measurements below 1,200 cfs.
Remarks.--Diversions for irrigation of about 4,500 acres above station should not materially affect peak flows. Peaks are principally from snowmelt. Only annual maximum observed stages and discharges are shown.
Peak stages and discharges
Water year1905
1906
1907 1908 1909 1910
1911 1912 1913 1914 1915
Date
June 7, 9, 1905
May 29, June 4, 1906
June 24, 1907 June Z, 19O8June 9, 19O9
(aj
June 3, 1911 May 22, 1912 May 28, 1913 June 14, 1914 June 16, 1915
Gage height (feet)
2.5
2.5
4.9 6.84.151.2
2.7 3.9 3.0 3.1 2.8
Discharge (cfs)
620
625
1,810 4,3003,040
81
560 1,840 1,020 1,180
766
Water year1916 1917 1918
1919 1920
1921 1922 1923 1924
1964
Date
June 22, 1916 May 26, 1917 Dec. 30, 1917 July 15, 1918
(cj May 12, 192O
May 20, 1921 May 26, 1922 Aug. 21, 1923 Apr. 7, 1924
June 8, 1964
Gage height (feet)
4.4 5.4
b3.6
1.8 4.2
2.6 2.66 2.90 2.18
D' scharge (cfs)
1,910 2,400
421 44
1,420
339490 615 294
d!2,OOO
a Mar. 13, 14, 21-24, Apr. 11-20, 30, May 1, 1910. b Backwater from ice. c Oct. 16, 17, Nov. 2, Dec. 5, 13, 14, 1918. d Momentary maximum; about.
219-848 O - 66 - 9

110 SUN RIVER BASIN
860. Sun River at Port Shaw, Mont.
Location. Lat 47°31'10", long 111°48'50", on west line of SW^ se?.l, T.20 N., R.2 W., at highway bridge at Port Shaw.
Drainage area. 1,417 sq ml.
Gage. Nonrecording at several sites within a quarter of a mile of present site at different datums prior to May 20, 1925: recording thereafter. Altitude of gage Is 3,465 ft (from topographic map).
Stage-discharge relation. Large shifts occur. Defined by current-meter meas urements below 11,000 cfs.
Remarks.--Numerous diversions above station. Some regulation by Willow Creek Reservoir (usable capacity, 32,300 acre-ft). Peak flows are materially affected. Peaks are principally from snowmelt. Only annual p?aks are shown.
Peak stages and discharges
Water year
1913 1914
1915
1916 1917 1918 1919 1920
Date
May 29, 1913 May 17, June 3,
1914 May 2, 1915
June 21, 1916 May 26, 1917 June 11, 1918 May 23, 1919 June 16, 1920
Gage height (feet)
65.84.7
4.8
11.5 12.8 9.91 7.35 8.25
Discharge (cfs)
10 , 900 4,380
4,280
20,000 16,400 9,660 4,280 6,125
Water year
1921 1922 1923 1924 1925
1926 1927 1928
Date
May 26, 1921 June 5, 1922 May 26, 1923 May 17, 1924May 20, 1925
Apr. 30, 1926 June 9, 1927 May 23, 1928
Gage height (fjet)
8.4 8.8 7.84 8.508.82
6.90 10.32 9.5
Discharge (cfs)
6,440 7,280 4,830 5.9506,490
3,280 10,200 8,560
875. Sun River at Sun River, Mont.
Location.--Lat 47°32'10", long 111°43'00", In NW^NE^ sec.34, T.21 N. , R.I W. , at highway bridge at Sun River, 13 miles upstream from Muddy Creev.
Drainage area.--1,454 sq ml.
Gage. Nonrecording. Altitude of gage Is 3,400 ft (from topographic map).
Stage-discharge relation.--Large shifts occur. Defined by current-meter meas urements below 9,400 cfs and extended above by logarithmic plotting.
Remarks.---Numerous diversions above station and regulation by several reservoirs materially affect peak flows. Peaks are principally from snowmelt. Only annual peaks are shown.
Peak stages and discharges
Water year
1906 1907 1908 1909
Date
June 5., 1906 June 24, 1907 June 7, 1908 June 9, 1909
Gage height (feet)
5.8 9.6
13.4 10.2
Discharge (ofs)
3,000 10 , 900 27,200 12,000
Water year
1910
1911 1912
Date
May 11, 1910
June 11, 1911 May 22, 1912
Gige height (feet)
7.1
7.8 8.6
Discharge (cfs)
4,600
5,940 8,000

SUN RIVER BASIN 111
885. Muddy Creek at Vaughn, Mont,
Location.--Lat 47°33'40", long 111 032'30", near center of S^NE^ sec.24, T.21 N. , R.I E., near center of span on upstream side of old highway bridge at Vaughn, 1^ miles upstream from mouth.
Drainage area. 314 sq ml.
_. Nonrecordlng. Auxiliary crest-stage gage May 18, 1955, to Apr. 25, 1960, and since Sept. 24, 1962. At site 500 ft downstream at different datum prior to 1934. At present site at datum 1.00 ft higher Apr. 19, 1934, to Sept. 30, 1955. Altitude of gage Is 3,350 ft (from topographic map).
Stage-discharge relation.--Subject to large shifts. Defined by current-meter measurements below 3,000 cfs and extended above on basis of slope-area meas urement at 7,600 cfs.
Remarks.--Diversions for irrigation of about 500 acres above station. Natural flow Increased by wastage from Sun River Canal and by return flow from Irrigation. Some flow diverted above station to supplement water supply for Benton Lake Wildlife Refuge. Peak flows are not materially affected. Peaks are principally from snowmelt. Only annual peaks are shown.
Peak stages and discharges
Water year
1908
1925
1932
19341935
1936
1937
193819391940
19411942
19431944
1945
Date
June 1908
June 5, 1925
June 1932
June 8, 1934Aug. 7, 1935
Mar. 3, 1936Mar. 9, 1936Mar. 6, 1937June 17, 1937June 23, 1938May 1, 1939June 3, 1940
June 30, 1941Mar. 9, 1942May 16, 1942June 15, 1943Mar. 10, 1944Aug. 14, 1944
Mar. 11, 1945Aug. 13, 1945
Gage height (feet)a24
8.90
a!9
5.835.91
b5.88-
b6.43-
16.06.405.64
5.7b9.64
-8.36
b4.64-
b4.54-
Discharge (cfs)
-
602
-
334356
-
292-
346(c)393337
444-
326959-
351
-333
Water year
19461947
19481949
1950
1951
1952195319541955
1956195719581959
1960
1961196219631964
Date
June 24, 1946Mar. 16, 1947 June 10, 1947June 17, 1948Mar. 20, 1949May 18, 1949July 31, 1950
Mar. 22, 1951July 23, 1951July 21, 1952June 4, 1953Aug. 14, 1954Aug. 15, 1955
June 16, 1956May 21, 1957June 4, 1958Mar. 2, 1959June 27, 1959Aug. 6, 1960
July 7, 1961June 15, 1962June 22, 1963June 9, 1964
Gage height (feet)
7.4b!2.82
9.16b8.80
-3.83
blO . 80-
3.0816.73.621.89
3.285.156.91
b8.98-
4.57
5.074.704.8212.24
Discharge (cfs)
800
1,8001,470
-442518
_439475
7,600722386
419892
1,070_688494
632530546
3,750a At present site and datum; approximate.b Backwater from ice.c Not determined.
890. Sun River near Vaughn, Mont.
Location.--Lat 47°31'35", long 111°29'05", in SE^SW^ sec.33, T.21 N. , R.2 E., on right bank 4 miles downstream from Muddy Creek, 4 miles southeast of Vaughn, and 13 miles upstream from mouth.
Drainage area.--1,854 sq mi.
Gage. Nonrecording Apr. 19 to Aug. 3, 1934; recording thereafter. Altitude of gage is 3,315 ft (from topographic map).
Stage-discharge relation.--Large shifts occur. Defined by current-meter measurements.
Remarks. Plow regulated by four reservoirs (combined capacity, about 180,000 acre-ft). Diversions for irrigation of about 110,000 acres above station. Regulation and diversions materially affect peak flows. Peaks are princi pally from snowmelt. Only annual peaks are shown.
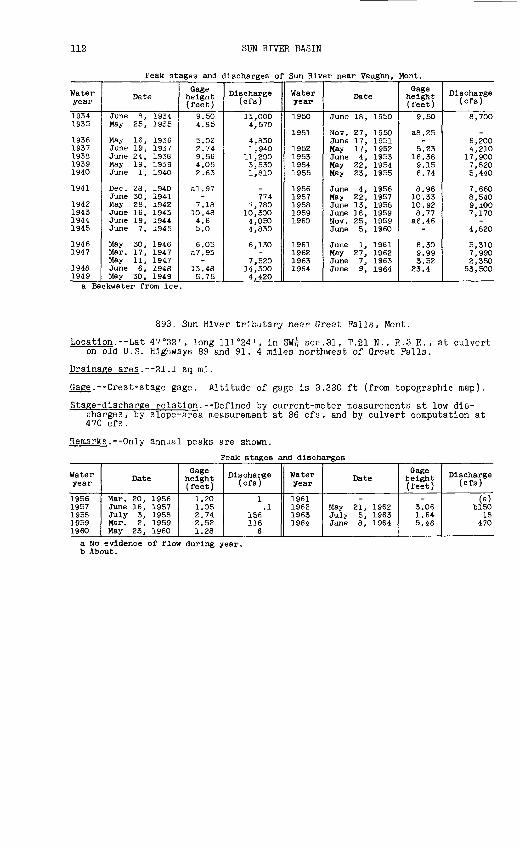
112 SUN RIVER BASIN
Peak stages and discharges of Sun River near Vaughn, Mont.
Water year
19341935
19361937193819391940
1941
1942194319441945
19461947
19481949
Date
June 8, 1934May 25, 1935
May 16, 1936June 19, 1937June 24, 1938May 19, 1939June 1, 1940
Dec. 28, 1940June 30, 1941May 28, 1942June 16, 1943June 19, 1944June 7, 1945
May 30, 1946Mar. 17, 1947May 11, 1947June 6, 1948May 30, 1949
Gage height (feet)
9.504.85
5.022.749.564.052.63
al.97-
7.1810.484.65.0
6.05a7.93
-13.485.75
Discharge (cfs)
11,0004,570
4,8301,940
11,2003,5301,810
_774
7,78010,3004,0504,830
6,130-
7,52014,3004,420
Water year
1950
1951
1952195319541955
19561957195819591960
1961196219631964
Date
June 18, 1950
Nov. 27, 1950June 17, 1951May 17, 1952June 4, 1953May 22, 1954May 23, 1955
June 4, 1956May 22, 1957June 13, 1958June 16, 1959Nov. 25, 1959June 5, 1960
June 1, 1961May 27, 1962June 7, 1963June 9, 1964
Gage height (feet)
9.50
a8. 25_
5.2316.389.156.74
8.9610.3310.928.77
a6.46-
6.309.993.52
23.4
Discharge (cfs)
8,700
-6,2004,210
17,9007,8205,440
7,6608,5409,1007,170
-4,820
5,3107,9902,350
53,500
a Backwater from ice.
893. Sun River tributary near Great Falls, Mont.
Location.--Lat 47°32', long 111°24 I , in SW£ sec.31, T.21 N., R.3 E., at culvert on old U.S. Highways 89 and 91, 4 miles northwest of Great Palls.
Drainage area. 21.1 sq mi.
Gage. Crest-stage gage. Altitude of gage is 3,330 ft (from topographic map).
Stage-discharge relation. Defined by current-meter measurements at low dis charges, by slope-area measurement at 86 cfs, and by culvert computation at 470 cfs.
Remarks. Only annual peaks are shown.
Peak stages and discharges __ ___ ________
Water year
1956 1957 1958 1959 1960
Date
Mar. 20, 1956 June 16, 1957 July 3, 1958 Mar. 2, 1959 May 23, 1960
Gage height (feet)
1.20 1.05 2.74 2.52 1.28
Discharge (cfs)
1 .1
156 116
6
Water year
1961 1962 1963 1964
Date
May 21, 1962 July 5, 1963 June 8, 1964
Gage height (feet)
3.06 1.64 5.46
Discharge (ore)
(a) blSO
18 470
a No evidence of flow during year, b About.

MISSOURI RIVER MAIN STEM 113
903. Missouri River near Great Falls, Mont.
Location. Lat 47°34'55", long 111°03'35", in NE^SW^- sec.14, T.21 N. , R.5 E. , at Moroney Dam, 10 miles northeast of Great Falls.
Drainage area. 23,292 sq mi.
Gage. Foxboro meters for determining discharge through powerplant and re cording gage on reservoir. Datum of gage is mean sea level (levels by Mon tana Power Co.
Stage-discharge relation.--Discharge computed from powerplant meters an1 flow through taintor gates on spillway. Current-meter measurements made at cable 800 ft downstream from dam to check computed discharges.
Historical data.--Flood of June 4, 1953, is greatest since 1908.
Remarks. Records collected by Montana Power Co., under general supervision of Geological Survey, in connection with Federal Power Commission project. Flow regulated by 18 smaller irrigation reservoirs and powerplants and, since 1953, by Canyon Ferry Reservoir (usable capacity, 2,043,000 acre-ft). Peak flows are materially affected by regulation and diversions. Peaks are principally from snowmelt. Only annual maximum daily discharges are shown, except peak discharge for 1953.
Maximum dally discharges ___
Water year
1953
1957 1958 1959
Date
June 4, 1953
June 11,12,1957 June 14, 1958 June 19, 1959
Gage height (feet)
^
Discharge (cfs)
a 66,60O
18,700 19,700 24,600
Water year
1960
1961 1962 1963
Date
May 18, 1960
Feb. 2, 1961 June 20, 1962 June 9,12,1963
Gage height (feet)
-
Discharge (cfs)
18,100
8,290 21,100 19,000
a Momentary maximum.
BELT CREEK BASIN
905. Belt Creek near Monarch, Mont.
Location. Lat 47°12', long 110°56', in SE^NW^ sec.26, T.17 N., R.6 E., on left bank half a mile south of Riceville and 9 miles northwest of Monarch.
Drainage area.--368 sq mi.
Gage. Recording. Altitude of gage is 3,960 ft (by barometer).
Stage-discharge relation. Defined by current-meter measurements below £,500 cfs and extended above on basis of slope-area measurement at 11,000 cfs.
Historical data. Flood in 1908 was several feet lower than in 1953, from infor mation by local resident.
Remarks. Peaks are principally from snowmelt. Base for partial-duration series, 600 cfs.
Peak stages and discharges
Water year
1952
1953
1954
1955
1956
1957
1958
Date
May 4, 1952May 26, 1952June 6, 1952
June 4, 1953
June 5, 1954June 12, 1954
May 22, 1955June 17, 1955
May 2S, 1956
May 28, 1957June 7, 1957June 21, 1957
May 12, 1958
Gage height (feet)
4.584.293.42
10.12
4.884.06
3.854.61
3.41
3.953.723.61
3.52
Discharge (cfs)
1,2901,110
635
11,000
1,460930
7981,270
565
842708648
625
Water year
1959
1960
1961
1962
1963
1964
Date
May 17, 1959May 25, 1959June 7, 1959June 16, 1959
May 13, 1960June 4, 1960
May 31, 1961
May 22, 1962June 15, 1962
June 5, 1963July 9, 1963
June 9, 1964
Gage height (feet)
3.583.675.404.87
4.133.74
3.53
5.513.92
4.333.65
7.74
Discharge (cfa)
605655
1,8301,410
994798
655
1,980836
1,080686
a4,710
a Annual peak only.

114 MISSOURI RIVER MAIN STEM
908. Missouri River at Fort Benton, Mont.
Location. Lat 47°49'03", long 110°39'59", in SE^-SE^ sec.23, T.24 N. , R.8 E., on left bank at downstream side of highway bridge at Fort Benton, 4 miles up stream from Shonkin Creek.
Drainage area. 24,749 sq mi.
Gage. Nonrecording prior to Oct. 11, 1921; recording thereafter. At datum 1.00 ft higher prior to Apr. 26, 1924. Datum of gage is 2,614.05 ft above mean sea level, datum of 1929.
Stage-discharge relation.--Defined by current-meter measurements below 63,000 cfs.
Remarks. Diversion for about 730,000 acres above station. Flow regulated by numerous small irrigation reservoirs and powerplants and since 1953 by Canyon Ferry Reservoir (usable capacity, 2,043,000 acre-ft). Annual peak flows probably not materially affected prior to 1953. Peaks are principally from snowmelt. Only annual maximum daily discharges are shown prior to 1921, except peak stage and discharge for 1908; annual peaks except as noted thereafter.
Peak stages and discharges
Water year
18911892189318941895
1896189718981899
19011902190319041905
1906
1907190819091910
19111912191319141915
19161917191819191920
19211922192319241925
19261927192819291930
1931193219331934
Date
July 14, 1891June 14, 1892June 16-18, 1893June S, 1894June 15, 1895
June 20-23 ,1896May 22,23,1897June 20, 2 1,18 98June 27, 1899
May 23, 24, 1901May 22, 1902June 9,10, 1903
(a)June 11, 1905
June 17, 18,20-22,1906
June 25, 2 6, 1907June 6, 1908June 12, 1909May 4,15,16,
1910
June 20, 1911June 17-19,1912June 5,6,1913June 15,16, 1914July 6, 1915
June 23, 1916May 28, 1917June 19, 1918May 30, 1919June 18-20 ,1920
June 16, 1921June 12, 1922June 26, 1923May 21, 1924May 25, 1925
Apr. 21, 1926June 13, 1927May 28, 1928June 2, 1929Apr. 13,20,1930
Feb. 1, 1931June 13, 1932June 10, 1933Jan. 3, 1934June 9, 1934
Gage height (feet)
-----
----
_----
-
-17.5
--
-----
-----
6.456.485.056.137.05
5.4510.37.655.654.8
4.005.956.49
d!2.2-
Discharge (cfs)
39,70065,80035,60055,30021,400
40,40027,30037,60046,000
30 , 40031,80030,40027,30015,900
19,800
47,5000140,00054,40023,500
31,90033,10044,00028,90030,700
48,60048,20028,00013,90030,700
32 , 20034,30025,40024,30029,800
20,400c 52, 90033,40021,500C16.900
13,00023,50026,200
-19,600
Water year
1935
1936
193719381939
1940
1941
1942
1943
19441945
19461947 .
19481949
1950
1951
1952
19531954
1955
19561957
19581959
1960
19611962
1963
1964
Date
June 15, 1935
Jan. 10, 1936May 18, 1936July 13, 1937June 24, 1938Feb. 15, 1939May 18, 1939Jan. 9, 1940June 14, 1940
Jan. 27, 1941June 13, 1941Jan. 2, 1942June 10, 1942Jan. 29,30, 1943June 16, 1943June 19, 1944June 14, 1945
June 6, 1946Feb. 4, 1947June 16, 1947June 7, 1948Jan. 13, 1949June 4, 1949Dec. 24, 1949June 19, 1950
Jan. 31, 1951May 14, 1951Dec. 20, 1951May 27, 1952June 5, 1953Jan. 19, 1954May 21, 1954Mar. 7, 1955May 23, 1955
June 4, 1956Dec. 9, 1956May 22, 1957June 14, 1958Jan. 27, 1959June 23, 1959Mar. 6, 1960May 16, 1960
June 1, 1961Jan. 10, 1962June 18, 1962Feb. 6, 1963June 8, 1963June 10, 1964
Gage height (feet)
5.14
d9.10-
3.567.2C
d8.61-
dlO.33-
dlO . 72-
d8.75-
d9.00-
7.706.57
5.62dll.90
-10.93
d!2.98_
d!2.89_
d9.56-
dlO . 62-
13.57dll.20
-d!2.65
-
7.86d!3.25
-6.13
d!2.22-
dll.46-
3.91dlO. 78
-d!2.78
_13.44
Discharge (cfs)
17,200
-24,00010,60030,600
-17,900
-13,600
_15,300
-33,200
-38,50031,00023,900
18,900-
34,20052,800
-22,700
-28,900
-27,500
-24,50078,700
-17,900
-15,900
31,100-
21,40020,500
-27,500
-20,600
10,300_
23,000-
22 , 20077,400
a Occurred May 25, 27-20, June 6, 7, 1904. d Backwater from ice.
c Maximum daily.

MARIAS RIVER BASIN 115
920. Two Medicine Creek near Browning, Mont.(Published as "at Family" 1907-24 and as "Two Medicine River"
prior to October 1957)
Location. Lat 48°28'30", long 112°48<10", in SE^ sec.5, T.31 N., R.9 W., on right bank 800 ft upstream from new bridge on U.S. Highway 89, 11 miles southeast of Browning, and 15 miles upstream from Badger Creek.
Drainage area. 317 sq mi.
Gage. Nonrecording at several sites within 3 miles of present site at various datums prior to Nov. 1, 1924; recording at present site and datum since May 1951. Altitude of gage is 3,930 ft (from topographic map).
Stage-discharge relation. Defined by current-meter measurements below 6,300 cfs at present site.
Remarks. Diversions above station into Two Medicine Canal for irrigation of about 10,000 acres below station. Flow affected by storage in Lower Two Medicine Lake since 1913 (usable capacity, 16,200 acre-ft). Peak flows are materially affected. Peaks are principally from snowmelt. Only annval peaks are shown.
Peak stages and discharges
Water year
1907190819091910
19111912
19141915
19161917191819191920
1921192219231924
Date
June 23, 1907June 6, 1908June 9, 1909Apr. 27, 1910
May 16, 1911May 21, 1912
May 17, 1914May 2, 1915
June 21, 1916June 8, 1917May 4, 1918May 29, 1919May 21, 1920
May 21, 1921June 7, 1922June 12, 1923June 11, 1924
Qage height (feet)8.6-
8.154.3
6.85.5
4.95.1
-7.87.85.385.48
5.586.265.606.05
Discharge (cfs)
7,950(a)
7,6001,790
4,1402,900
1,6401,840
b4,3005,1605,1602,0302,150
2,3203,1802,3402,890
Water year
19511952195319541955
1956
1957195819591960
196119621963
1964
Date
June 24, 1951Apr. 28, 1952June 4, 1953May 20, 1954May 20, 1955
May 21, 1956May 22, 1956May 4, 1957May 13, 1958June 6, 1959May 13, 1960June 4, 1960
May 31, 1961May 20, 1962Feb. 5, 1963June 6, 1963June 8, 1964
Qage height (feet)
5.544.486.786.624.59
5.67-
4.784.144.693.46-
4.253.18
C3.37_
14.0
Discharge (cfs)
4,6202,2806,5205,8602,590
-5,0203,9602,7203,940
_2,100
3,3501,790
1,540
d 100, 000
a Discharge not determined; exceeded that of June 23, 1907.b Maximum daily.c Backwater from ice.d About.
925. Badger Creek near Browning, Mont.
Location. Lat 48°21'00", long 112°50'20", in NE^ sec.24, T.30 N. , R.10 W. , on right bank Just upstream from point of diversion to Four Horns Canal, 15 miles upstream from mouth and 17 miles southeast of Browning.
Drainage area. 133 sq mi.
Gage. Recording gage and concrete control consisting of concrete diversion dam and two taintor gates (regularly closed). Datum of gage is 4,179.26 ft above mean sea level (Bureau of Reclamation bench mark).
Stage-discharge relation. Defined by current-meter measurements below 1,900 cfs.
Remarks. Water diverted into Four Horns Canal at station for irrigation of about 6,000 acres below station. Diversions are included in peak flovs. Peaks are principally from snowmelt. Only annual peaks are shown.

116 MARIAS RIVER BASIN
Peak stages and discharges of Badger Creek near Browning, Mont.
Water year
19511952
195319541955
19561957
Date
May 24, 1951Feb. 26, 1952Apr. 28, 1952June 4, 1953May 20, 1954May 21, 1955
May 22, 1956May 20, 1957
Gage height (feet)5.06
b4.68-
6.285.304.73
5.294.88
Discharge (cfs)
al,470-914
4,2202,2601,310
2,1501,710
Water year
195819591960
1961196219631964
Date
May 12, 1958June 6, 1959Nov. 14, 1959June 3, 1960
May 31, 1961May 26, 1962June 10, 1963June 8, 1964
Gige height (feet)
4.585.12
b4.92-
5.313.994.0510.37
Discharge (cfs)
1,2301,970
-1,210
2,330862769
49,700a Maximum for period b Backwater from ice,
May 20 to Sept. 30, 1951.
935. Badger Creek near Family, Mont.
Location.--Lat 48°26'10", long 112°42'00", in NE^ sec.19, T.31 N., R.8 W., at highway bridge, 4 miles southeast of Family.
Drainage area.--239 sq mi.
Gage. Nonrecording. At site 700 ft downstream prior to June 4, 1908, and at site 300 ft downstream July 21, 1908, to May 24, 1909; both at different daturas. Altitude of gage is 3,900 ft (from topographic map).
Stage-discharge relation. Large shifts occur. Defined by currert-meter meas- urements below 1,600 cfs.
Remarks. Bureau of Reclamation canal began to divert water in 1?15 for irriga tion above station. Peak flows are materially affected. PeaV.s are princi pally from snowmelt. Only annual peaks are shown.
Peak stages and discharges
Water year
1908
1910
1911 1912 1913
1915
1916
Date
June 7, 1908
Apr. 23, 1910
June 3, 1911 May 21, 1912 May 27, 1913
June 15, 1915
June 21, 1916
Gage height (feet)
-
5.15
5.4 5.6 5.85
4.7
6.7
Discharge (cfs)
(a)
810
1,120 1,350 1,780
504
2,500
Water year
1917 1918 1919 1920
1921 1922 1923 1924
Date
June 9, 1917 May 5, 191S May 22, 1919 June 6, 1920
May 20, 26, 1921 June 5, 1922 May 26, 1923 June 14, 1924
Gage height (feet)
6.3 6.35 5.9 6.29
6.44 6.16 5.80 6.35
Discharge (cfs)
1,910 1,460 1,020 1,400
1,600 1,280
965 1,460
a Maximum for period of record; discharge not determined.
950. Birch Creek near Dupuyer, Mont.
Location. Lat 48°15', long 112°39', near center of sec.28, T.29 N., R.8 W., half a mile upstream from B canal headgates and 8 miles northrest of Dupuyer.
Drainage area. 105 sq mi.
Gage. Nonrecording. At several sites within half a mile of described site at Different datums prior to June 29, 1927. Altitude of gage is 4,180 ft (from topographic map).
Stage-discharge relation. Defined by current-meter measurements below 2,000 cfs at both sites. Peak for flood of June 8, 1964, from slope-area measurement.
Remarks. Records furnished by Valier-Montana Land and Water Co. Flow regu lated by Swift Dam since 1913 (usable capacity, 30,000 acre-f';). Several small diversions for irrigation above station. Peaks since 1913 are materi ally affected by regulation. Only annual peaks are shown.

MARIAS RIVER BASIN 117
Peak stages and discharges of Birch Creek near Dupuyer, Mont.
Water year
190819091910
19111912191319141915
191619171918
19191920
192119221923
Date
June 6, 1908July 28, 1909May 9, 1910
May 16, 1911May 21, 1912May 29, 1913May 17, 1914June 14, 1915
June 21, 1916June 17, 1917June 17, 24, 26,
1918June 11, 1919June 15, 1920
May 27, 1921Nov. 15, 1921July 17, 1923
Gage height (feet)
-9.35.87
6.47.07.254.224.3
10.06.625.90
6.06.26
5.945.636.30
Discharge (of a)
(a)3,530
430
750990
1,230445554
7,0001,080
661
680838
674543853
Water year
19241925
19261927192819291930
19311932193319341935
19361937
1964
Date
June 15, 1924May 22, 1925
June 23, 1926June 11, 1927May 23, 1928Aug. 13, 1929Aug. 12, 1930
July 29, 1931June 16, 1932June 15, 1933June 7, 1934May 23, 1935
June 29, 1936May 7, June 27,
1937
June 8, 1964
Gage height (feet)
7.327.05
6.028.622.602.562.18
1.902.272.76-
2.67
2.482.31
-
Discharge (cfs)
1,290982
4742.300
894817487
324551871
b4,000756
565484
0881,000
a Discharge not determined; exceeded that of June 21, 1916. b Maximum daily; estimated, c Result of dam failure.
980. Dupuyer Creek near Valier, Mont.
Location.--Lat 48°14'10", long 112°23'50", in NW£ sec.33, T.29 N. , R.6 W., 6 miles downstream from Sheep Creek and 8 miles southwest of Valier.
Drainage area. 13', sq mi.
Gage. Nonrecording prior to Apr. 20, 1925; recording thereafter, gage is 3,920 ft (from topographic map).
Altitude of
Stage-discharge relation. Large shifts occur, urements below 1,700 cfs.
Defined by current-meter tneas-
Remarks. Records furnished by the Valier-Montana Land and Water Co. Snail diversions for irrigation above station do not materially affect peaV flows. Peaks are principally from snowtnelt. Only annual peaks are shown.
Peak stages and discharges
Water year
1913 19141915
1916 1917 1918 1919 1920
1921 1922 1923 1924 1925
1926
Date
May 28, 1913 May 24, 1914 June 5, 1915
June 21, 1916 Mar. 29, 1917 Dec. 31, 1917 Apr. 1, 1919 Apr. 13, 1920
May 20, 1921 Apr. 29, 1922 Aug. 22, 1923 June 15, 1924 Apr. 23, 1925
June 20, 1926
Gage height (feet)
3.7 3.85 3.70
6.5 a6.94
3.08 5.60
3.80 3.90 3.80 4.32 3.90
4.20
Discharge (cfs)
304 351 278
2,180 1,500 b300
44 1,370
230 265 172 351 222
359
Water year
1927 1928 1929 1930
1932 1933 1934 1935
1936 1937
1948
1964
Date
May 30, 1927 June 29, 1928 June 2, 1929 Feb. 5, 1930
June 11, 1932 June 2, 1933 June 7, 1934 Apr. 18, 1935
Apr. 12, 1936 June 14, 1937
June 17, 1948
June 8, 1964
Gage height (feet)
6.30 4.35 3.70
a4.76
3.87 3.90 7.40 4.64
3.08 4.76
Discharge (cfs)
2,000 384 170
203 211
3,330 498
55508
7,370
21,600
a Backwater from ice. b About.
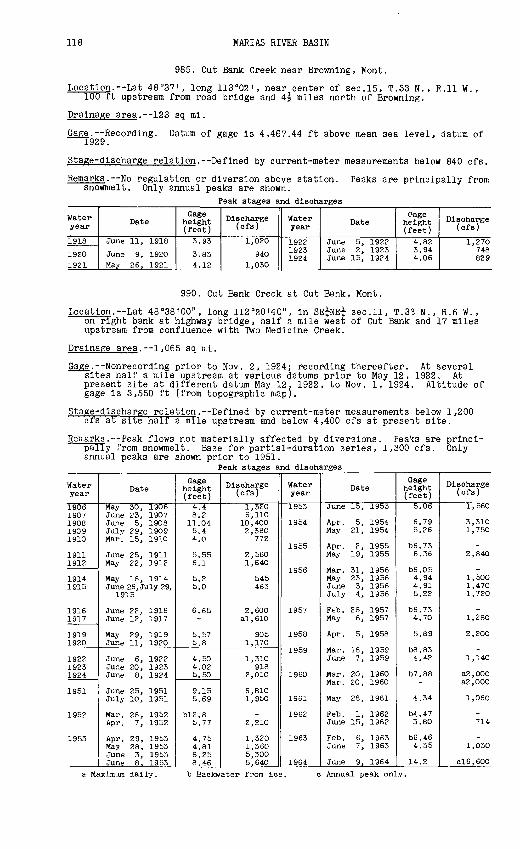
118 MARIAS RIVER BASIN
985. Cut Bank Creek near Browning, Mont.
Location. Lat 48°37', long 113°02', near center of sec.15, T.33 N. , R.ll W., 100 ft upstream from road bridge and 4j miles north of Browning.
Drainage area. 123 sq ml.
Gage.--Recording. Datum of gage Is 4,467.44 ft above mean sea level, datum of 1929.
Stage-discharge relation.--Defined by current-meter measurements below 840 cfs.
Remarks.--No regulation or diversion above station. Peaks are principally from snowmelt. Only annual peaks are shown.
Peak stages and discharges
Water year
1918
1920 1921
Date
June 11, 1918
June 9, 1920 May 26, 1921
Gage height (feet)3.93
3.83 4.12
Discharge (cfs)
1,020
940 1,030
Water year
1922 1923 1924
Date
June 5, 1922 June 2, 1923 June 15, 1924
C-age height (feet)
4.82 3.94 4.06
Discharge (cfs)
1,270748 829
990. Cut Bank Creek at Cut Bank, Mont.
Location. Lat 48°38'00", long 112°20'40", In SE^NE^ sec.11, T.33 N., R.6 W., on right bank at highway bridge, half a mile west of Cut Bank and 17 miles upstream from confluence with Two Medicine Creek.
Drainage area.--1,065 sq ml.
Gage. Nonrecordlng prior to Nov. 2, 1924; recording thereafter. At several sites half a mile upstream at various datums prior to May 12, 1922. At present site at different datum May 12, 1922, to Nov. 1, 1924. Altitude of gage Is 3,550 ft (from topographic map).
Stage-discharge relation.--Defined by current-meter measurements below 1,200 cfs at site half a mile upstream and below 4,400 cfs at present site.
Remarks. Peak flows not materially affected by diversions. Pea'cs are princi pally from snowmelt. Base for partial-duration series, 1,300 cfs. Only annual peaks are shown prior to 1951.
Peak stages and discharges
Water year
19061907190819091910
19111912
19141915
19161917
19191920
192219231924
1951
1952
1953
Date
May 30, 1906June 23, 1907June 5, 1908July 29, 1909Mar. 15, 1910
June 25, 1911May 22, 1912
May 18, 1914June 26, July 29,
1915
June 22, 1916June 12, 1917
May 29, 1919June 11, 1920
June 6, 1922June 20, 1923June 8, 1924
June 25, 1951July 10, 1951
Mar. 28, 1952Apr. 7, 1952
Apr. 29, 1953May 28, 1953June 3, 1953June 8, 1953
Gage height (feet)4.48.211.045.44.0
5.556.1
5.25.0
6.65-
5.575.8
4.504.025.50
9.155.69
b!2.85.77
4.754.818.258.46
Discharge (cfs)
1,3206,110
10,4002,S80
772
2,5601,640
545463
2,600al,610
9051,170
1,310918
2,010
6,8101,950
_2,210
1,3201,3605,3005,640
Water year
1953
1954
1955
1956
1957
1958
1959
1960
1961
1962
1963
1964
Date
June 15, 1953
Apr. 5, 1954May 21, 1954
Apr. 2, 1955May 19, 1955
Mar. 31, 1956 May 23, 1956June 3, 1956July 4, 1956
Feb. 28, 1957May 6, 1957
Apr. 5, 1958
Mar. 18, 1959June 7, 1959
Mar. 20, 1960Mar. 20, 1960
May 28, 1961
Feb. 1, 1962June 15, 1962
Feb. 6, 1963June 7, 1963
June 9, 1964
Gage height (feet)5.06
6.795.26
b6.736.36
b6.05 4.944.915.22
b6.734.70
5.89
b8.834.42
b7.88-
4.34
b4.473.80
b6.464.35
14.2
Discharge (cfs)
1,560
3,3101,750
-2,840
1,5001,4701,720
-1,280
2,200
~
1,140
a2,000a2,000
1,060
-714
-1,030
016,600
a Maximum daily. b Backwater from ice. c Annual peak only.

MARIAS RIVER BASIN 119
995. Marias River near Shelby, Mont.
Location.--Lat 48°26', long 111 G53', in SE^ sec.20, T.31 N., R.2 W., on left bank 200 ft downstream from bridge on U.S. Highway 91, 6 miles south of Shelby, and 24 miles downstream from Cut Bank Creek.
Drainage area.--3.242 sq mi, of which about 2,724 sq mi contributes directly to surface runoff.
Gage. Nonrecording or recording at several sites within 1,000 ft of present site at approximately the same datum prior to Dec. 23, 1947; recording there after. Datum of gage is 3,087.72 ft above mean sea level, datum of 1929.
Stage-discharge relation. Defined by current-meter measurements below 35,000 cfs.
Remarks. Diversions for irrigation of about 50,000 acres above station and about 15,000 acres below. Some regulation by four reservoirs above station (combined capacity, 177,870 acre-ft). Diversions and regulation probably do not materially affect peak flows. Peaks are principally from snowmelt. Base for partial-duration series, 2,900 cfs. Only annual peaks are shown prior to 1923.
Peak stages and discharges
Water year
190219031904
190619071908
19111912191319141915
19161917191819191920
19211922
1923
1924
1925
1926
1928
1929
1930
1931
Date
May 22, 1902June 7, 1903Apr. 8, 1904
June 9, 1906June 24, 1907
June 1908
May 16, 1911May 22, 1912May 29, 1913May 19, 1914May 3, 1915
June 22, 1916May 31, 1917June 10, 1918May 31, 1919May 10, 17, 1920
May 20, 1921May 22, 1922
May 11, 1923May 26, 1923June 12, 1923June 22, 1923July 18, 1923
May 14, 1924May 17, 1924June 17, 1924
Mar. 25, 1925Apr. 13, 1925Apr. 17, 1925Apr. 24, 1925May 3, 1925May 21, 1925June 22, 1925
June 24, 1926
Mar. 20, 1928Apr. 28, 1928May 9, 1928May 24, 1928June 29, 1928
May 25, 1929June 3, 1929
Apr. 17, 1930
May 18, 1931
Gage height (feet)
14.506.607.20
4.9014.9
-
8.38.07.66.65.3
13.58.46.35.587.40
6.346.02
5.685.605.725.525.22
5.746.367.00
-6.555.855.956.257.355.70
4.80
-6.117.127.16.21
6.126.16
5.09
4.. 60
Discharge (ofs)
27,6007,8008,560
4,09029,500
(a)
8,7508,0006,4804,8002,660
24,30010,0005,0203,3907,580
5,2304,690
3,9503,8004,0303,6603,120
3,6504,8806,240
(b)5,2803,8604,0505,0407,6803,880
2,240
(b)4,4106,4506,4504,600
4,1904,460
2,850
2,290
Water year
1932
1933
1934
1935
1936
1937
1938
1939
1940
1941
1942
1943
1944
1945
1946
1947
1948
Date
May 14, 1932June 15, 1932Aug. 21, 1932
Apr. 28, 1933May 16, 1933June 1, 1933June 10, 1933
Apr. 9, 1934Apr. 26, 1934May 8, 1934June 8, 1934
Apr. 18, 1935May 25, 1935
Mar. 3, 1936May 12, 1936
June 13, 1937
Apr. 19, 1938May 28, 1938June 28, 1938
Apr. 7, 1939
May 14, 1940
June 30, 1941
May 26, 1942June 6, 1942
Mar. 29, 1943Apr. 21, 1943June 3, 1943June 15, 1943
May 20, 1944
May 6, 1945May 11, 1945May 18, 1945June 8, 1945
May 29, 1946
Mar. 21, 1947
Apr. 17, 1948May 9, 1948May 24, 1948June 6, 1948
Gage height (feet)
5.606.986.18
5.185.296.266.30
5.506.296.0811.05
5.855.88
C5.635.00
8.55
5.356.26-
5.37
4.58
4.72
6.706.56
6.15.527.17
11.6
5.28
5.615.625.497.93
5.47
C14.0
5.776.249.12
11.5
Discharge (cfs)
4,4307,0005,470
3,2203,4305,4105,500
3,8405,3704,800
16,200
4,5804,660
_3,160
9,100
3,4105,020(b)
3,410
2,310
2,450
5,5905,340
4,4703,6406,290
17,200
3,140
3,5203,4903,1906,150
2,860
M
3,7404,3609,890
16,300
a May have exceeded peak of June 18, 1948.b Not knownj probably exceeded base discharge.c Backwater from ice.

120 MARIAS RIVER BASIN
Peak stages and discharges of Marias River near Shelby, Mont.--Continued
Water year
1948
1949
1950
1951
1952
1953
1954
1955
Date
June 18, 1948
May 18, 1949May 31, 1949
May 15, 1950May 23, 1950May 28, 1950June 7, 1950June 14, 1950
May 25, 1951Apr. 2, 1951May 1, 1951May 12, 1951May 24, 1951June 16, 1951June 25, 1951July 11, 1951
Mar. 27, 1952Mar. 29, 1952Apr. 7, 1952Apr. 19, 1952Apr. 28, 1952May 5, 1952May 16, 1952
Apr. 23, 1953Apr. 29, 1953May 9, 1953May 20, 1953June 5, 1953June 9, 1953
Apr. 6, 1954May 21, 1954June 14, 1954June 24, 1954
Mar. 31, 1955Apr. 4, 1955
Gage height (feet)
17.75
6.366.51
7.237.557.087.589.11
-6.557.877.637.197.239.727.80
C8.987.286.026.006.606.375.90
5.986.526.596.35
12.7710.53
5.398.246.465.94
C6.07-
Discharge (cfs)
40,000
3,5803,800
6,1006,8205,7506,870
10,700
d4,5004,4607,3406,7805,7805,870
12,1007,170
-6,3403,6903,5804,5504,1303,340
3,4704,4004,5304,090
21,90015,000
3,5709,6004,8504,170
M(b)
Water year
1955
1956
1957
1958
1959
1960
1961
1962
1963
1964
Date
May 22, 1955June 6, 1955June 26, 1955
May 10, 1956May 22, 1956June 17, 1956July 4, 1956July 12, 1956
Feb. 28, 1957May 6, 1957May 22, 1957
Apr. 5, 1958May 13, 1958June 5, 1958June 11, 1958
Mar. 18, 1959Mar. 22, 1959May 1, 1959May 10, 1959May 19, 1959June 6, 1959June 15, 1959
Mar. 20, 1960Mar. 21, 1960May 13, 1960June 4, 1960
May 31, 1961
Apr. 25, 1962May 21, 1962Feb. 6, 1962
June 7, 1963
June 9, 1964
Gage height (feet)
7.376.485.59
5.487.885.626.104.92
clO.586.786.98
5.146.315.195.86
cS.745.286.115.096.047.266.28
08.255.555.946.00
6.67
4.664.86
clO.74
4.69
23.64
Discharge (cfs)
6,9205,2703,840
3,7708,6604,0504,7602,960
_5,8306,340
3,1004,9503,3204,310
_3,5804,6903,2104,6906,9705,170
-4,0804,7004,800
6,010
3,0803,380
-
3,020
6241,000
b Not known; probably exceeded base discharge. c Backwater from ice. mum daily. e Annual peak only; affected by dam failure.
1005. Dry Pork Marias River at Fowler, Mont.
Location. Lat 48°19', long 111°47<, in NE^ sec.31, T.30 N., R.I W., at highway bridge at Fowler, 5 miles upstream from mouth.
Drainage area. 314 sq mi.
Gage. Nonrecording. At site a quarter of a mile downstream at different datum prior to October 1920. Altitude of gage is 3,130 ft (by barometer).
Stage-discharge relation. Defined by current-meter measurements below 400 cfs and extended above by logarithmic plotting.
Remarks. Peak flows materially affected by diversions above station. Peaks are principally from snowmelt. Only annual maximum observed stages and dis charges are shown.
Peak stages and discharges
Water year
1920
1921 1922 1923 1924 1925
Date
Apr. 14, 1920
July 1, 1921 Apr. 29, 1922 July 17, 1923 Feb. 13, 1924 June 14, 1925
Gage height (feet)
6.5
1.32 2.32 1.94 2.28 1.44
Discharge (cfs)
1,450
63 296 190 284 95
Water year
1926 1927 1928 1929 1930
1931
Date
June 21, 1926 May 30, 1927 Mar. 22, 1928 June 3, 1929 Mar. 22, 1930
Aug. 1, 1931
Gage l-eight (feet)
2.734.44 1.90 1.82 3.90
1.76
Discharge (cfs)
440 1,220
189 189 950
146

MARIAS RIVER BASIN 121
1010. Willow Creek near Devon, Mont.
Location.--Lat 48°38', long 111°28', Ln NW^NW^ sec.10, T.33 N., R.2 E., at road bridge, Z\ miles upstream from Trail Creek and 12 miles north of Devon.
Drainage area. 310 sq mi.
Gage. Nonrecording. Altitude of gage is 3,210 ft (by barometer).
Stage-discharge relation. Defined by current-meter measurements below 90 cfs.
Remarks. Diversions for irrigation above station materially affect peek flows. Peaks are principally from snowmelt. Only annual maximum observed stages and discharges are shown.
Peak stages and discharges
Water year
1921 1922 1923
Date
July 14, 1921 Apr. 8, 1922 July 29, 1923
Gage height (feet)5.5 3.2 3.76
Discharge (cfs)
430 167 224
Water year
1924 1925
Date
June 16, 1924 Mar. 23, 1925
Gage height (feet)2.60 3.30
Discharge (cfs)
112 177
1020. Marias River near Brinkman, Mont.
Location. Lat 48°16', long 110°42', in SE^SE^ sec.17, T.29 N., R.8 E., on left bank 4 miles southwest of Brinkman Post Office, 14 miles downstream from Cottonwood Creek, and 30 miles north of Fort Benton.
Drainage area.--6,425 sq mi, of which about 5,907 sq mi contributes directly to surface runoff.
Gage.--Nonrecording at site 2,800 ft downstream at datum 0.64 ft higher prior to Oct. 6, 1931; recording thereafter. At site 1,600 ft downstream at present datum Oct. 6, 1931, to July 1, 1939. Datum of gage is 2,677.25 ft above mean sea level, adjustment of 1912.
Stage-discharge relation. Defined by current-meter measurements below 48,000 cfs.
Historical data. Flood of 1908 is greatest known.
Remarks. Diversion for irrigation of about 65,000 acres above station. Peak flows regulated by Tiber Reservoir (usable capacity, 1,313,000 acre-ft) since Oct. 28, 1955, and four other reservoirs having a combined capacity of 177,870 acre-ft. Peaks are principally from snowmelt. Base for partial- duration series. 2,600 cfs. Only annual peaks are shown prior to 1S32.
Peak stages and discharges
Water year
1908
1922192319241925
19261927192819291930
1931
1932
Date
-
June 7, 1922July 2, 1923June 17, 1924Mar. 24, 1925May 23, 1925
June 22, 1926June 1, 1927May 10, 1928June 3, 1929Apr. 28, May 1,
1930
June 29, 1931
Feb. 29, 1932May 15, 1932May 21, 1932May 24, 1932June 17, 1932
Gage height (feet)
ab24.0
4.72'4.815.60
C7.255.65
3.059.25.34.783.27
4.55
C9.485.485.505.635.71
Discharge (cfs)
a70 , 000
4,6304,7106,38O
-6,480
2,10014,3005,8104,8803,400
4,500
d5,3OO4,O704,1104,1804,600
Water year
1933
1934
1935
1936
1937
1938
Date
Apr. 29, 1933May 19, 1933June 11, 1933
Nov. 1, 1933Apr. 27, 1934May 9, 1934June 10, 1934June 29, 1934
Apr. 19, 1935May 25, 1935July 22, 1935
May 14, 1936
June 15, 1937
May 30, 1938June 21, 1938June 28, 1938
Gage height (feet)
5.095.256.21
_6.126.O4
10.264.87
6.536.005.12
4.94
8.10
6.578.745.93
Discharge (cfs)
3,2303,5605,800
(e)4,77O4,620
14,OOO2,620
5,3304,5002,930
2,650
8,870
5,77010,2004,250
a About. b Present site and datum. c Backwater from ice. d Maximumdaily; approximate. e Not known; probably exceeded base discharge.

122 MARIAS RIVER BASIN
Peak stages and discharges of Marias River near Brlnkman, Mont. Continued
Water year
1939
1940
1941
1942
1943
1944
1945
1946
1947
1948
1949
1950
Date
May 7, 1939May 20, 1939
May 16,17, 1940
July 4, 1941
May 28, 1942June 9,10, 1942
Feb. 22, 1943Mar. 30, 1943Apr. 22, 1943May 1, 1943June 17, 1943
May 22, 1944
May 12, 1945June 9, 1945
June 25, 1946
Mar. 20, 1947Mar. 22, 1947May 13, 1947June 11, 1947
Apr. 18, 1948May 10, 1948May 25, 1948June 7, 1948June 19, 1948
Apr. 7, 1949June 2, 1949
May 17, 1950May 24, 1950
Gage height (feet)
5.214.97
5.92
6.16
7.367.45
-7.636.806.45
12.4
6.44
6.678.26
6.75
C12.18-
7.777.35
7.157.459.7
12.521.0
6.827.32
8.058.40
Discharge (cfs)
3,0502,620
1,900
2,220
4,2804,460
d2,5004,7403,2102,68015,300
2,550
2,9906,070
3,120
(e)4,6103,860
3,5404,0408,810
16,00050,700
2,7203,400
4,9205,580
Water year
1950
1951
1952
1953
1954
1955
1956
Date
June 8, 1950June 15, 1950July 3, 1950
Mar. 24, 1951Mar. 26, 1951Apr. 2, 1951Apr. 5, 1951May 3, 1951May 13, 1951May 25, 1951June 17, 1951June 26, 1951July 3, 1951July 11, 1951
Mar. 29, 1952Apr. 3, 1952Apr. 9, 1952Apr. 21, 1952Apr. 30, 1952
May 1, 1953May 10, 1953June 5, 1953
Mar. 18, 1954Apr. 8, 1954May 9, 1954May 22, 1954June 16, 1954June 27, 1954
Apr. 3, 1955June 17, 1955July 15, 1955
Feb. 29, 1956Sept. 18, 1956
C-age height (feet)
8.6610.08.48
C12.69-
7.899.028.798.268.178.22
10.438.188.67
_9.607.557.057.52
7.177.42
16.28
-7.448.669.888.047.63
C8.027.586.68
C6.125.28
Discharge (cfs)
6,1008,9905,740
-d5,0004,8007,2406,7106,3305,3705,470
10,6005,3906,640
d8,0008,5704,1603,2804,110
3,6404,120
28,100
(e)3,8206,3809,2404,9004,210
-4,4802,790
_f874
c Backwater from ice. ceeded base discharge.
d Maximum dailyj f Regulated peak.
approximate. e Not known; probably ex-
1021. Dry Fork Coulee tributary near Loma, Mont.
Location. Lat 47°57', long 110°33', in SW^ sec.2, T.25 N., R.9 E., at culvert on county road, 2 miles west of Loma.
Drainage area. 0.84 sq mi.
Gage.--Crest-stage gage. Altitude of gage is 2,580 ft (from topographic map).
Stage-discharge relation. Defined by current-meter measurements below 15 cfs and by culvert computation at 71 cfs.
Remarks. Only annual peaks are shown.
Peak stages and discharges
Water year
1959 1960
1961
Date
Mar. 1, 1959 Mar. 17, 1960
May 31, 1961
Gage height (feet)
4.02 .41
bl.42
Discharge (cfs)
71 a2
al
Water year
1962 1963
Date
May 21, 1962 Aug. 25, 1963
Gage height (feet)
0.85 1.54
Discharge (cfs)
6 16
a Approximate.b Backwater from ice.

MARIAS RIVER BASIN 123
1022. Marias River tributary at Loma, Mont.
Location. Lat 47°57', long 110°31', In SW^SE^ sec.l, T.25 N., R.9 E., at bridge on county road, five-eighths of a mile west of Loma.
Drainage area.--1.62 sq ml.
Gage.--Crest-stage gage. Altitude of gage Is 2,590 ft (from topographic map).
Stage-discharge relation. Poorly defined by current-meter measurements below 6 cfs.
Remarks. Only annual peaks are shown.
Peak stages and discharges
Water year
1956 1957 1958 1959 1960
Date
Mar. 1, 1957 Mar. 29, 1958 Mar. 1, 1959 Mar. 17, 1960
Gage height (feet)aO.8 al.74
.68 a2.9 1.50
Discharge (cfs)
b5 b3 b4
b!2 b6
Water year
1961 1962 1963
Date
May 21, 1962 Feb. 4, 1963
Gage height (feet)
2.11 al.88
Discharge (cfs)
(c) b20 blO
a Backwater from Ice or debris.b Approximate.c No evidence of flow during year.
1023. Marias River tributary No. 2 at Loma, Mont.
Location.--Lat 47°57', long 110°30', in NE^NE^ sec.12, T.25 N., R.9 E., at culvert on approach to U.S. Highway 87, a quarter of a mile north of Loma.
Drainage area. 0.25 sq mi.
Gage. Crest-stage gage. Altitude of gage Is 2,590 ft (from topographic map).
Stage-discharge relation. Poorly defined by current-meter measurements below 1 cfs and by culvert computation at 15 cfs.
Remarks. Only annual peaks are shown.
Peak stages and discharges
Water year
1956 1957 1958 1959 1960
Date
May 27, 1956 Mar. 1, 1957 Mar. 29, 1958 February 1959 Mar. 17, 1960
Gage height (feet)
2.97 a2.46 al.40 1.01
al.73
Discharge (cfs)
20 101 1 2
Water year
1961 1962 1963
Date
Mar. 17, 1962 June 28, 1963
Gage height (feet)
al.55 2.60
Discharge (cfs)
(b) 215
a Backwater from Ice or debris, b No evidence of flow during year.
1025. Teton River near Farmington, Mont.
Location.--Lat 47°53'00", long 112°36'35", in NE^NE^ sec.34, T.25 N., R.8 W., 300 ft downstream from highway bridge, 1 1/8 miles downstream from South Fork, and 20 miles west of Farmington.
Drainage area. 105 sq mi.
Gage.--Recording. Altitude of gage is 4,770 ft (from topographic map).
Stage-discharge relation. Defined by current-meter measurements below 1,100 cfs.
Remarks.--Peaks are principally from snowmelt. Base for partial-duration series, 400 cfs.

124 MARIAS RIVER BASIN
Peak stages and discharges of Teton River near Farmlngton, Mont.
Water year
1948
1949
1950
Date
May 23, 1948June 3, 1948June 17, 1948
Feb. 18, 1949May 13, 1949May 30, 1949June 6, 1949
Jan. 6, 1950 May 18, 1950May 23, 1950May 28, 1950June 6, 1950June 21, 1950July 1, 1950
Gage height (feet)
4.255.324.44
a6.414.764.924.74
a7.34 4.985.155.025.986.025.42
Discharge (cfs)
1,9702,7801,490
-432515402
575710606
1,5301,570
950
Water year
1951
1952
1953
1954
1964
Date
May 12, 1951May 24, 1951June 15, 1951July 12, 1951
Jan. 8, 1952Apr. 29, 1952May 20, 1952
June 3, 1953 June 13, 1953
May 20, 1954June 14, 1954June 23, 1954
June 8, 1964
Gige height (fset)
5.355.355.725.04
a<5.414.674.73
6.87 6.03
5.314.754.83
-
Discharge (cfs)
844844
1,230610
-455493
2,400 2,080
1,210700767
b54,600a Backwater from ice. b Annual peak only.
1030. Teton River at Strabane, Mont. (Published as "near Belleview" prior to 1910)
Location. Lat 47°53', long 112°28', in SE^NE^ sec.35, T.25 N., R.7 W., at bridge at Strabane, 8 miles downstream from South Fork Teton River and 14 miles northwest of Choteau.
Drainage area.--128 sq mi.
Gage.--Nonrecordlng. At site half a mile upstream at different d?tum May 9, 1906, to Mar. 30, 1911. Altitude of gage is 4,440 ft (by baro-neter).
Stage-discharge relation.--Defined by current-meter measurements below 1,700 cfs at described site.
Remarks.--Starting in 1918 canal diverted floodwaters above station for storage in Bynum Reservoir for irrigation. Peak.flows materially affected since 1918. Only annual maximum observed stages and discharges are shown.
Peak stages and discharges
Water year
1908 1909 1910
1911 1912 1913 1914 1915
1916
Date
June 10, 1908 July 27, 1909 May 4, 1910
May 16, 1911 May 22, 1912 June 2, 1913 June 4, 1914 May 9, 1915
June 21, 1916
Gage height (feet)
9.0 7.4 6.3
5.1 5.4 5.8 4.76 4.75
7.8
Discharge (cfs)
2,300 1,080
525
820 925
1,410 415 430
3,810
Water year
1917 1918 1919 1920
1921 1922 1923 1924 1925
Date
May 26, 1917 June 10, 1918 May 23, 1919 June 15, 1920
May 20, 1921 June 5, 1922 June 16, 1923 June 16, 1924 May 21, 1925
Gage height (fe*t)
6.45 4.25 2.82 3.70
3.59 3.74 3.24 4.06 4.06
Discharge (cfs)
2,460 636 217 432
396 412 252 502 642
1035. Spring Creek near Strabane, Mont.
Location.--Lat 47°52', long 112°27', in NE^SE^- sec.2, T.24 N., R.7 W., at high way bridge, l£ miles south of Strabane and 13 miles west of Choteau.
Drainage area. 5.17 sq mi.
Gage.--Nonrecording. At site 200 ft upstream at different datum May 30 to Dec. 31, 1913. Altitude of gage is 4,470 ft (by barometer).
Stage-discharge relation. Defined by current-meter measurements below 17 cfs.
Remarks.--Peaks are principally from snowmelt. Only annual maximum observed stages and discharges are shown.

MARIAS RIVER BASIN
Peak stages and discharges of Spring Creek near Strabane, Mont.
125
Water year
1913
1917
Date
July 27, 1913
May 31, 1917
Gage height (feet)
4.33
2.44
Discharge (cfs)
38
66
Water year
1918 1919 1920
Date
Mar. 31, 1918 Mar. 18, 1919 May 13, 1920
Gage height (feet)
1.50 1.15 1.58
Discharge (cfs)
26 16 28
1045. Teton River near Choteau, Mont.
Location.--Lat 47°48', long 112 "11', in SW^NE^ sec.36, T.24 N. , R.5 W., at high way bridge, 1 mile upstream from Deep Creek and lj miles south of Choteau.
Drainage area. 221 sq mi.
Gage. Nonrecording. At site 1 mile upstream at different datum prior to Apr. 19, 1918. Altitude of gage is 3,740 ft (by barometer).
Stage-discharge relation. Defined by current-meter measurements below 1,200 cfs and extended above by logarithmic plotting at site used prior to Apr. 19, 1918.
Remarks. Many diversions above station materially affect peak flows. Peaks are principally from snowmelt. Only annual peaks are shown.
Peak stages and discharges
Water year
1906
1913
1915
Date
June 14, 1906
June 4, 1913
(a)
Gage height (feet)
1.97
5.8
3.4
Discharge (cfs)
30
1,050
110
Water year
1916
1918
Date
June 22, 1916
June 11, 1918
Gage height (feet)
8.7
3.17
Discharge (cfs)
4,500
272
a Occurred July IS, 31, Aug. 1-6, 1915.
1055. Willow Creek near Choteau, Mont.
Location. Lat 47°45', long 112°20', in S^ sec.14, T.23 N., R.6 W., abcut 5 miles upstream from mouth and 9 miles southwest of Choteau.
Drainage area. 88.2 sq mi.
Gage. Nonrecording. Altitude of gage is 3,780 ft (by barometer).
Stage-discharge relation. Defined by current-meter measurements below 390 cfs.
Remarks. Small diversions above station do not materially affect peak flows. Peaks are principally from snowmelt. Only annual maximum observed stages and discharges are shown.
Peak stages and discharges
Water year
1912 1913 1914 1915
Date
May 21, 1912 May 29, 1913 May 24, 1914 July 30, 1915
Gage height (feet)
5.8 3.3 2.3 2.08
Discharge (cfs)
735 237 70 47
Water year
1916 1917
Date
June 21, 1916 May 26, 1917
Gage height (feet)
6.60 5.60
Discharge (cfs)
880 663
219-848 O - 66 - 10

126 MARIAS RIVER BASIN
1060. Deep Creek near Choteau, Mont.
Location.--Lat 47°45', long 112°14', in SW^NWir sec.15, T.23 N., R.5 W., 2 miles downstream from Willow Creek and 5 miles southwest of Choteau.
Drainage area. 223 sq mi.
Gage. Nonrecording. Altitude of gage is 3,860 ft (by barometer).
Stage-discharge relation. Defined by current-meter measurements below 1,300 cfs and extended above by logarithmic plotting.
Remarka. Several small diversions for irrigation above station do not materi ally affect peak flows. Peaks are principally from snowmelt. Only annual maximum observed stages and discharges are shown.
Peak stages and discharges
Water year
1911 1912 1913 1914 1915
1916 1917 1918
Date
May 16, 1911 May 21, 1912 May 30, 1913 May 25, 1914 July 26, 1915
June 21, 1916 May 26, 1917 Jan. 1, 1918
Gage height (feet)
7.3 8.4 7.45 6.5 6.6
10.5 9.17.1
Discharge (cfs)
582 1,460
644 212 260
3,700 2,150
477
Water year
1919 1920
1921 1922 1923 1924
1964
Date
Mar. 23, 1919 Apr. 13, 1920
May 19, 1921 June 10, 1922 July 8, 1923 June 9, 1924
June 8, 1964
Gage heiejit (feet)
f.93 £.35
7.15 7.10 6.85 6.70
Discharge (cfs)
84 1,420
490 465 361 304
a41,800a Momentary maximum.
1065. Muddy Creek near Bynum, Mont.
Location. --Lat 48°00', long 112°22', in NWiSE^ sec. 22, T.26 N. , R.6 W. , 200 ft upstream from Blackleaf Creek and 2i miles northwest of Bynum.
Drainage area. 71.1 sq mi.
Gage. --Nonrecording. In same vicinity at different datum prior to May 20, 1920. Altitude of gage is 4,020 ft (by barometer).
Stage-discharge relation. --Defined by current-meter measurements below 450 cfs.
Remarks. --Small diversions for irrigation above station. Only annual peaks are shown.
Peak stages and discharges
Water year
1913 1914 1915
1916 1917 1918
Date
June 27, 1913 June 14, 1914 Aug. 2, 1915
June 21, 1916 May 26, 1917 Dec. 31, 1917
Gage height (feet)
3.2 2.3 2.55
6.9 5.90 3.95
Discharge (efs)
32012 6
976 720 152
Water year
1920
1922 1923 1924
Date
Apr. 14, 1920
June 11,15,1922 July 8, 1923 June 9, 1924
Gage height (feet)
5.37
2.47 2.76 3.60
Discharge (efs)
519
31 43 96

MARIAS RIVER BASIN 127
1070. North Fork Muddy Creek near Bynum, Mont. (Formerly published as "Blackleaf Creek")
Location. Lat 48°00', long 112°22', in NW^SE^ sec.22, T.26 N., R.6 W., 200 ft upstream from mouth and 2 miles northwest of Bynum.
Drainage area. 61.3 sq mi.
Gage. Nonrecording. Altitude of gage is 4,020 ft (by barometer).
Stage-discharge relation. Subject to large shifts. Defined by current-meter measurements below 350 cfs.
Remarks. Most of flow at low stages diverted for irrigation above station. Only annual peaks are shown.
Peak stages and discharges
Water year
1913 1914 1915
1916 1917
1919
Date
Apr. 7, 1913 Oct. 13, 1913 Aug. 1, 1915
June 21, 1916 June 1, 1917
Nov. 13, 1918
Gage height (feet)
3.3 2.7 3.35
5.S5 5.03
3.12
Discharge (cfs)
91 40
118
600 352
9.0
Water year
1920
1921 1922 1923
1924
Date
May 12, 1920
May 7, 1921 Apr. 29, 1922 July 9, Aug. 21,
1923 June S, 1924
Gage height (feet)
4.26
2.8S 3.70 3.50
3.55
Discharge (cfs)
212
S.2 102 6S
92
1080. Teton River near Dutton, Mont.
Location. Lat 47°55'55", long 111°33'05", in SE^SW^ sec.12, T.25 N. , R.I E. , on left bank 300 ft downstream from Kerr Bridge, 1 mile downstream from Hunt Coulee, and 10 miles northeast of Dutton.
Drainage area. 1,308 sq mi.
Gage. Recording. Altitude of gage is 3,235 ft (from topographic map).
Stage-discharge relation. Defined by current-meter measurements below 1,100 cfs.
Remarks. Water diverted on left bank above station for storage in Byn-im Reser voir (usable storage, 75,000 acre-ft). Diversions for irrigation of about 44,000 acres above station. Storage and diversions materially affeot peak flows. Peaks are principally from snowmelt. Only annual peaks are shown.
Peak stages and discharges
Water year
1955
1956
1957
19581959
Date
Apr. 1, 1955July 17, 1955
Mar. 21, 1956Aug. 4, 1956Mar. 2, 1957May 23, 1957June 21, 195SMar. 9, 1959Mar. 19, 1959
Gage height (feet)a5. 56
-
a5.74-
a5.61-
5.96a8.6S
-
Discharge (cfs)
-1,040
_875-
1,1001,310
-975
Water year
1960
1961
1962
19631964
Date
Mar. 21, 1960May 4, 1960
Dec. 26, 1960June 1, 1961Mar. 19, 1962May 28, 1962Feb. 7, 1963June 9, 1964
Gage height (feet)
as. 30-
a4.02-
a5.77-
a7.0619. S
Discharge (cfs)
-744
_376-
1,040bl.OOO71,300
a Backwater from ice. b Maximum daily.

128 MISSOURI RIVER MAIN STEM
1095. Missouri River at Vlrgelle, Mont. (Published as "at Loma" prior to 1954)
Location. Lat 48°00'14", long 110 015'19", In SW£SE£ sec.13, T.26 N., R.ll E.,on left bank a quarter of a mile upstream from Vlrgelle ferry, half a milesouthwest of Vlrgelle, and 3 miles downstream from Spring Coulee.
Drainage area. 34,379 sq ml.
Gage.--Recording. At Loma, 18 miles upstream, at datum 35.90 ft higher prior to Sept. 30, 1953. Datum of gage Is 2,507.50 ft above mean sea level, datura of 1929.
Stage-discharge relation. Defined by current-meter measurements below 66,000 cfs at former site and below 29,000 cfs at present site.
Historical data.--Flood of 1908 reached a stage about 2 ft higher than that of June 5, 1953, from information by local residents.
Remarks.--Diversion for irrigation of about 830,000 acres above station. Plow regulated by 23 smaller irrigation reservoirs and powerplants, since 1953 by Canyon Perry Reservoir (usable capacity, 2,043,000 acre-ft), an-? since 1956 by Tiber Reservoir (usable capacity, 1,313,000 acre-ft). Peak flows materi ally affected since 1953. Peaks are principally from snowmelt. Only annual peaks are shown.
Peak stages and discharges
Water year
1935
19361937
19381939
1940
1941
1942
194319441945
1946
1947
19431949
Date
June 16, 1935
May 18, 1936Jan. 1, 1937June 16, 1937June 25, 1938Feb. 10, 1939May 9, 1939Jan. 3, 1940June 10, 1940
Feb. 28, 1941June 14, 1941Dec. 31, 1941June 10, 1942 'June 17, 1943June 19, 1944Jan. 3, 1945June 9, 1945
Dec. 29, 1945May 31, 1946Jan. 7, 1947May 12, 1947June 20, 1948February 1949June 4, 1949
Gage height (feet)
6.89
7.60all. 48
-9.12
a7.00-
aS.ss-
alO.48-
11.35-
12.96S.98
all. 51-
a!2.00-
all. 25-
17.63a9.7
-
Discharge (cfs)
19,800
23,700-
15,40031,400
-18,100
-13,200 ,
-14,600
-b37,10055,80031,400
-29,700
_20,600
-36,70092,000
-26,500 .
Water year
1950
1951
1952
19531954
1955
19561957
195819591960
19611962
1963
1964
Date
June 23, 1950
(e)May 14, 1951Dec. 22, 1951May IS, 1952June 5, 1953Feb. 20, 1954May 21, 1954Mar. 31, 1955May 24, 1955
June 4, 1956Jan. 19, 1957June 12, 1957June 15, 1958June 20, 1959Feb. 25, 1960May 19, 1960
June 2, 1961Dec. 24, 1961June 19, 1962Feb. 7, 1963June 8, 1963June 10, 1964
Gage height (fe*t)
10.34
a!6.92-
a!2.26-
d23.4all. 56
-all. 13
-
9.87all. 29
-8.499.71
all. 66-
5.59all. 18
-a8. 09
-21.30
Discharge (cfs)
36,300
_32,300
-27,700
6122.000-
22,400-
19,800
31,600_
22,90024,40030,600
_21,200
12,000-
25,200-
22,800105,000
a Backwater from Ice. b Maximum observed. c Between Mar. 27 and Apr. d From floodmark at present site and datum. e Adjusted to present site.
10, 1951.
JUDITH RIVER BASIN
1098. South Pork Judith River near Utica, Mont.
Location.--Lat 46°45', long 110°19', in Si sec.34, T.12 N., R.ll E., on right bank just downstream from Trask Gulch, 8 miles upstream from confluence with Middle Fork and 18 miles southwest of Utica.
Drainage area. 58.7 sq ml.
Gage.--Recording. Altitude of gage is 5,300 ft (from topographic map).
Stage-discharge relation.--Defined by current-meter measurements below 180 cfs.
Remarks. Minor diversions for Irrigation above station do not materiallyaffect peak flows. Peaks are principally from snowmelt. Base for partial- duration series, 80 cfs.

JUDITH RIVER BASIN 129
Peak stages and discharges of South Pork Judith River near Utica, Mont.
Water year
1959
1960
1961
1962
Date
May 16, 1959June 7, 1959
May 11, 1960
May 22, 1961
Apr. 24, 1962May 16, 1962
Gage height (feet)
-4.23
3.98
3.20
3.533.67
Discharge (cfs)
alls194
148
46
84101
Water year
1962
1963
Date
May 21, 1962May 25, 1962June 11, 1962June 14, 1962
May 6, 1963May 14, 1963June 10, 1963
Gage height (feet)
4.254.903.704.10
3.653.903.56
Discharge (cfs)
178277100156
9112882
a Maximum daily discharge; estimated.
1100. Judith River near Utica, Mont.
Location. Lat 46°54', long 110°14', in NW£ sec.17, T.13 N., R.12 E., en left bank at Noel Ranch, 3-| miles downstream from confluence of South and Middle Porks and 9 miles southwest of Utica.
Drainage area. 328 sq mi.
Gage. Nonrecording prior to June 6, 1937; recording and concrete control there after. Altitude of gage is 4,790 ft (by barometer).
Stage-discharge relation. Defined by current-meter measurements below 580 cfs.
Remarks.--Minor diversions for irrigation above station do not materially affect peak flows. Peaks are principally from snowmelt. Base for partial-duration series, 120 cfs. Only annual observed peaks are shown prior to 1938.
Peak stages and discharges
Water year
1920
19211922192319241925
19261927192819291930
19311932
19341935
19361937
1938
1939
1940
1941
1942
Date
June 18, 192O
May 28, 1921June 9, 1922June 24, 1923May 17, 1924May 22, 1925
May 7, 1926June 11, 1927May 9, 1928June 1, 1929May 31, 1930
June 4, 1931May 22, 1932
May 12, 1934June 3,13, 1935
May 15, 1936May 30, 1937
May 26, 1938June 19, 1938June 23, 1938June 29, 1938July 2, 1938July 4, 1938July 10, 1938July 19, 1938July 24, 1938
May 5, 1939
May 13, 1940May 30, 1940June 10, 1940July 12, 1940
June 5, 1941Aug. 8, 1941
Apr. 22, 1942May 12, 1942May 25, 1942
Gage height (feet)
4.25
3.034.604.374.223.95
3.955.704.43.783.54
2.184.30
2.402.62
4.002.10
4.533.434.415.274.463.793.873.312.91
3.41
2.922.923.223.78
3.185.52
2.983.295.56
Discharge (cfs)
552
21S675547514455
4341,120
628452330
63567
98121
47066
578271580928626407431240161
229
124124186320
1781,070
136202
1,100
Water year
1942
1943
1944
1945
1946
1947
1948
1949
1950
Date
Aug. 5, 1942
Mar. 24, 1943Apr. 21, 1943May 4, 1943June 2, 1943June 13, 1943
May 19, 1944June 3, 1944June 19, 1944June 27, 1944July 20, 1944Sept. 1, 1944
June 6, 1945
Apr. 27, 1946May 29, 1946June 11, 1946June 17, 1946July 2, 1946July 13, 1946July 17, 1946
Mar. 17, 1947May 11, 1947June 1, 1947June 11, 1947
May 1, 1948May 8, 1948May 22, 1948June 4, 1948June 21, 1948July 11, 1948July 20, 1948
Apr. 30, 1949May 17, 1949June 1, 1949June 17, 1949
Apr. 1, 1950May 18, 1950May 23, 1950
Gage height (feet)
3.19
3.323.223.054.244.34
3.913.723.653.573.153.44
3.72
3.014.003.473.354.093.002.92
3.794.533.504.08
2.743.274.395.134.063.172.97
2.993.733.633.05
2.773.434.05
Discharge (cfs)
204
240212169542580
476421387354226313
437
211493316279524191169
397665312500
130247602898486230183
188422386204
135318550
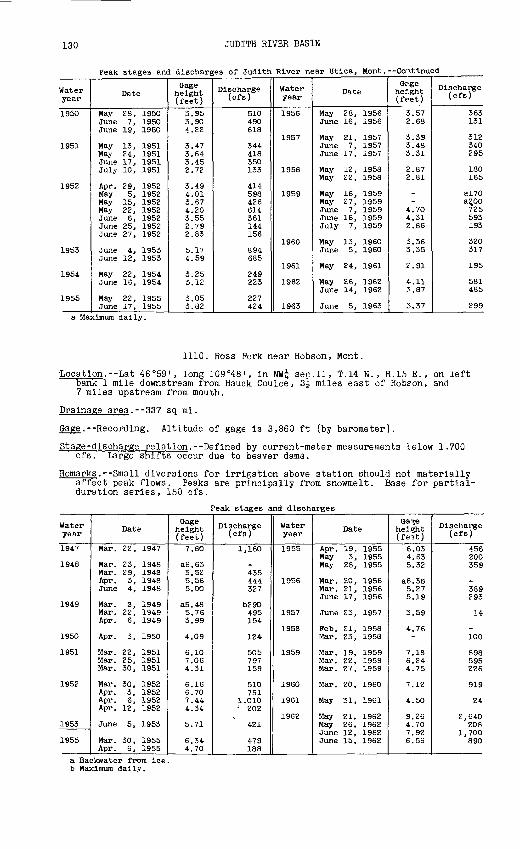
130 JUDITH RIVER BASIN
Peak stages and discharges of Judith River near Utlca, Mont. Continued
Water year
1950
1951
1952
1953
1954
1955
Date
May 28, 1950June 1, 1950June 19, 1950
May 13, 1951May 24, 1951June 17, 1951July 10, 1951
Apr. 29, 1952May 5, 1952May 15, 1952May 22, 1952June 6, 1952June 25, 1952June 27, 1952
June 4, 1953June 12, 1953
May 22, 1954June 16, 1954
May 22, 1955June 17, 1955
Gage height (feet)
3.953.904.22
3.473.643.452.72
3.494.013.674.203.552.792.83
5.174.59
3.253.12
3.053.82
Discharge (cfs)
510490618
344418350133
414598426614361144156
894685
249223
227424
Water year
1956
1957
1958
1959
1960
1961
1962
1963
Date
May 28, 1956June 16, 1956
May 21, 1957June 7, 1957June 17, 1957
May 12, 1958May 22, 1958
May 16, 1959May 27, 1959June 7, 1959June 16, 1959July 7, 1959
May 13, I960June 5, 1960
May 24, 1961
May 26, 1962June 14, 1962
June 5, 1963
Grge height (feet)
3.572.68
3.393.483.31
2.872.81
--
4.704.312.86
3.363.35
?.91
4-. 113.87
3.37
Discharge (cfs)
363131
312340295
180165
al70a2.00725593193
320317
195
581485
299
a Maximum daily.
1110. Ross Pork near Hobson, Mont.
Location. Lat 46°59' , long 109°48', In NW£ sec.11, T.14 N. , R.15 E., on left bank 1 mile downstream from Hauck Coulee, 3^ miles east of Hobron, and 7 miles upstream from mouth.
Drainage area.--337 sq ml.
Gage.--RecordIng. Altitude of gage Is 3,860 ft (by barometer).
Stage-discharge relation. Defined by current-meter measurements telow 1,700 cfs. Large shifts occur due to beaver dams.
Remarks. Small diversions for Irrigation above station should not materially affect peak flows. Peaks are principally from snowmelt. Base for partial- duration series, 150 cfs.
Peak stages and discharges
Water year
1947
1948
1949
1950
1951
1952
1953
1955
Date
Mar. 22, 1947
Mar. 23, 1948Mar. 29, 1945Apr. 3, 1948June 4, 1948
Mar. S, 1949Mar. 22, 1949Apr. 6, 1949
Apr. 3, 1950
Mar. 22, 1951Mar. 25, 1951Mar. 30, 1951
Mar. 30, 1952Apr. 3, 1952Apr. 6, 1952Apr. 12, 1952
June 5, 1953
Mar. 30, 1955Apr. 6, 1955
Gage height (feet)
7.80
a6.635.525.565.00
a5. 485.763.99
4.09
6.107.064.31
6.166.707.444.34
5.71
6.344.70
Discharge (cfs)
1,160
-435444327
b290495154
124
505797159
510751
1,0101 202
._421
479188
Water year
1955
1956
1957
1955
1959
1960
1961
1962
Date
Apr. 19, 1955May 3, 1955May 28, 1955
Mar. 20, 1956Mar. 21, 1956June 17, 1956
June 23, 1957
Feb. 21, 1958Mar. 23, 1958
Mar. 19, 1959Mar. 22, 1959Mar. 27, 1959
Mar. 20, 1960
May 31, 1961
May 21, 1962May 26, 1962June 12, 1962June 15, 1962
Ga-$e height (feit)
6.034.635.32
a6.355.275.19
3.59
4.76-
7.156.244.75
7.12
4.50
9.264.707.926.56
Discharge (cfs)
456200359
-389293
14
-100
898595226
919
24
2,640208
1,700890
a Backwater from ice. b Maximum daily.

JUDITH RIVER BASIN 131
1121. Cottonwood Creek near Moore, Mont.
Location.--Lat 46°59', long 109 C29', in NW^- sec.18, T.14 N. , R.18 E., on right bank 30 ft downstream from bridge, 9^ miles east of Moore, and 12 miles up stream from mouth.
Drainage area. 47.9 sq mi.
Gage. Recording. Altitude of gage is 4,300 ft (from topographic map).
Stage-discharge relation. Defined by current-meter measurements below 680 cfs.
Remarks. Peaks are principally from snowmelt. Only annual peaks are shown.
Peak stages and discharges
Water year
1958 1959 1960
Date
May 22, 1958 June 7, 1959 June 4, 1960
Gage height (feet)3.78 5.42 4.50
Discharge (cfs)
57 143 102
Water year
1961 1962 1963
Date
June 1, 1961 May 22, 1962 June 15, 1963
Gage height (feet)
4.83 6.77 4.75
Discharge (cfs)
101 683 216
1140. Wolf Creek at Neubert Ranch, near Stanford, Mont. (Published as "Wolf Creek near Stanford" except in WSP 1309)
Location.--Lat 47°07', long 110°17', in SE£ sec.26, T.16 N., R.ll E. , at Neubert Ranch, a quarter of a mile downstream from confluence of Dry Wolf an1 Running Wolf Creeks and 4 miles southwest of Stanford.
Drainage area.--79.2 sq mi.
Gage.--Nonrecording. Altitude of gage is 4,500 ft (by barometer). At site 250 ft upstream at different datum prior to Mar. 31, 1922.
Stage-discharge relation. Defined by current-meter measurements below 140 cfs.
Remarks. Many small diversions for irrigation above station. Only annual maxi mum observed stages and discharges are shown.
Peak stages and discharges
Water year
1920
1921 1922 1923
Date
June 16, 1920
June 8^ 1921June 10, 1922 June 26, 1923
Gage height (feet)
3.35
.932.12 2.68
Discharge (cfs)
322
71103 198
Water year
1924 1925
1926
Date
May 19, 1924 June 16, 1925
July 8, 1926
Gage height (feet)
2.20 1.91
2.09
Discharge (cfs)
116 63
101
1145. Wolf Creek near Stanford, Mont.
Location.--Lat 47°07', long 11017', in NE^-SE^- sec.26, T.16 N. , R.ll E., on right bank half a mile downstream from confluence of Dry Wolf and Running Wolf Creeks and 4 miles southwest of Stanford.
Drainage area. 112 sq mi.
Gage. Recording. Altitude of gage is 4,490 ft (by barometer).
Stage-discharge relation. Defined by current-meter measurements below 52 cfs and extended above on basis of velocity-area study.
Remarks.--Some regulation from small dam a quarter of a mile upstream. Several diversions for irrigation above station. Peak flows are not materially affected. Base for partial-duration series, 22 cfs.

132 JUDITH RIVER BASIN
Peak stages and discharges of Wolf Creek near Stanford, Mcnt.
Water year
1950
1951
1952
1953
1955
1956
Date
June 22, 1950
Mar. 7, 1951 July 10, 1951
Feb. 19, 1952 May 29, 1952 June 6, 1952
June 4, 1953 June 14, 1953 June 29, 1953 Aug. 4, 1953
Apr. 10, 1955
Feb. 1, 1956
Gage height (feet)
2.24
a2.87 1.92
a2.86 2.46 2.50
4.51 4.18 2.96 2.40
a2.98
a2.24
Discharge (cfs)
24
11
39 42
b578 371 77 31
clO
Water year
1956
1957
1958
1960
1961
1962
Date
Aug. 26, 1956
Jan. 14, 1957 Aug. 29, 1957
June 27, 1958
Mar. 3, 1960 June 19, 1960
Nov. 20, 1960 Sept. 28, 1961
Dec. 19, 1961 May 26, 1962
Gage height (feet)
1.95
a2.59 2.20
2.67
a2.48 1.98
1.55 e3.Z7
a4.04 3.49
Discharge (cfs)
9.0
15
d31
13
3.3
17
a Backwater from Ice. b Does not include an estimated 50 cfs in bypass channel. c Maximum daily. d Annual peak only. e Backwater from beaver dam.
MISSOURI RIVER MAIN STEM
1150. Missouri River at powerplant ferry, near Zortman, Mont.
Location. Lat 47°43'51", long 108°56'06", in NE^NE^ sec.30, T.2-3 N. , R.22 E., on left bank at powerplant ferry, 1-| miles downstream from Woodhawk Creek and 22 miles southwest of Zortman.
Drainage area.--40.763 sq mi.
Gage. Nonrecording prior to Feb. 7, 1935; recording thereafter. Datum of gage is 2,273.02 ft above mean sea level (levels by Corps of Engin3ers).
Stage-discharge relation. Defined by current-meter measurements.
Remarks. Diversions for irrigation of about 850,000 acres above station. Flow regulated by 24 smaller irrigation reservoirs and powerplants, Canyon Perry Reservoir (usable capacity, 2,043,000 acre-ft) since 1953, an1 Tiber Reser voir (usable capacity, 1,313,000 acre-ft) since 1956. Annual peak flows not materially affected prior to 1953. Only annual peaks are show.
Peak stages and discharges
Water year
1934
1935
1936193719381939
1940
1941
19421943
1944
1945
1946
1947
19481949
Date
Mar. 10, 1934June 12, 1934Mar. 16, 1935June 17, 1935
May 19, 1936June 12, 1937June 25, 193SMar. 18, 1939May S, 1939Mar. 18, 1940June 3, 1940
Mar. 26, 1941June 15, 1941June 4, 1942Mar. 28, 1943June 20, 1943Dec. 24, 1943June 17, 1944Dec. IS, 1944June 10, 1945
Dec. 30, 1945June 1, 1946Mar. 19, 1947May 13, 1947June 21, 1948Mar. 22, 1949June 5, 1949
Gage height (feet)
89.80-
al4.49-
7.697.22
10.25al2 . 54
-alO . 63
-
a8. 00-
12.94al9.5
-alO . 20
-al2 . 56
-
all. 00-
a30 . 16-
IS. 18alO.l
-
Discharge (cfs)
-31,900
-20,100
21,30019,00037,500
-18,000
-13,800
_14,00051 , 30O
-63,800
-34,800
-31,100
_21,500
-38,80093,200
-26,900
Water year
1950
1951
1952
19531954
1955
19561957
1958
1959
1960
1961
1962
1963
1964
Date
Apr. 3, 1950June 25, 1950
Apr. 1, 1951May 27, 1951Mar. 28, 1952Mar. 29, 1952June 6, 1953Feb. 4, 1954May 23, 1954Jan. 1, 1955May 25, 1955
June 16, 1956Dec. 10, 1956June 12, 1957Jan. 6, 1958June 16, 195SMar. 23, 1959June 21, 1959Nov. 21, 1959May 17, 1960
Dec. 24, 1960May 31, 1961Dec. 8, 1961June 17, 1962Feb. 6, 1963June 11, 1963June 11, 1964
Gage height (feet)
a!2.00-
a?l.o-
a?3.91-
22.20al2.59
-a9.02
-
10.64a!4.55
-a!3.52
-al5.44
-al4.22
-
a!3.30-
a!2.06-
alO.94-
19.75
Discharge (cfs)
_38,300
-31,200
_b55,000137,000
-21,900
-22,400
40,700-
23,800-
25,600-
34,400-
22,400
_18,300
-29,800
-23,200
115,000
a Backwater from ice. b Maximum dally.

MUSSELSHELL RIVER BASIN 133
1155. North Fork Musselshell River near Delpine, Mont.
Location. Lat 46°38', long 110°35', in SW^SE^ sec.22, T.10 N. , R.9 E., on right bank half a mile upstream from high-water line of Durand Reservoir at elevation 5,330 ft, 1 mile downstream from Lion Creek, and 4 miles northwest of Delpine.
Drainage area. 31.4 sq mi.
Gage.--Recording. Altitude of gage is 5,380 ft (by barometer).
Stage-discharge relation. Defined by current-meter measurements below 60 cfs.
Remarks. Small diversions for irrigation above station do not materially affect peak flows. Base for partial-duration series, 50 cfs.
Peak stages and discharges
Water year
1941
1942
1943
1944
1945
1946
1947
1948
1949
1950
1951
Date
June 17, 1941Aug. 29, 1941
Apr. 1, 1942Apr. 5, 1942Apr. 11, 1942June 3, 1942
Mar. 29, 1943Apr. 2, 1943June 3, 1943
Mar. 30, 1944
Mar. 21, 1945
Mar. 27, 1946May 27, 1946July 5, 1946
Mar. 17, 1947
Apr. 15, 1948May 8, 1948June 5, 1948June 17, 1948
Apr. 11, 1949Apr. 16, 1949June 1, 1949
Feb. 26, 1950Mar. 4, 1950Apr. 1, 1950
Feb. 10, 1951
Gage height (feet)
1.571.41
2.542.442.472.99
2.651.751.49
1.38
1.78
2.511.661.42
3.08
3.921.79-
1.74
2.301.621.78
2.821.724.63
b3.45
Discharge(Of 3)
6150
150140143199
1567552
48
76
1466550
a210
304758859
1055163
18669
423
-
Water year
1951
1952
1953
1954
1955
1956
1957
1958
1959
1960
1961
1962
1963
Date
Apr. 2, 1951
Apr. 6, 1952Apr. 13, 1952May 8, 1952May 21, 1952
Mar. 25, 1953June 7, 1953
Apr. 4, 1954Apr. 5, 1954
June 20, 1955
Dec. 28, 1955Apr. 15, 1956
June 6, 1957June 16, 1957
Apr. 13, 1958
Apr. 5, 1959June 7, 1959
Mar. 22, 1960Mar. 24, 1960
June 2, 1961
May 25, 1962June 15, 1962
Feb. 4, 1963June 14, 1963
Gage height (feet)
2.57
2.172.241.451.70
1.441.80
b2.00-
1.58
b2.031.51
1.561.43
1.77
1.511.49
1.512.22
.87
1.551.52
b2.441.42
Discharge (cfs)
116
1101205072
5279
-025
62
_54
5951
77
5655
56118
17
5856
-44
a Annual peak only, b Backwater from ice. c Maximum dally.
1160. North Fork Musselshell River at Delpine, Mont. (Published as "near Delpine 1909-11, 1922)
Location. Lat 46°35', long 110°34', in SW£ sec.35, T.10 N., R.9 E., at Delpine ; 1 mile upstream from Checkerboard Creek.
Drainage area. 48.6 sq mi.
Gage.--Nonrecording. At sibe 800 ft upstream prior to Sept. 26, 1923, at site 500 ft downstream Sept. 26, 1923, to Aug. 8, 1927, at different datums. Al titude of gage is 5,380 ft (by barometer).
Stage-discharge relation. Defined by current-meter measurements below 60 cfs at sites used prior to Aug. 8, 1927, and below 90 cfs at described site.
Remarks. Diversions for irrigation above station materially affect peak flows. Only annual maximum observed stages and discharges are shown.

134 MUSSELSHELL RIVER BASIN
Peak stages and discharges of North Fork Musselshell River at Delplne, Mont.
Water year
1909 1910
1911
1922 1923 1924 1925
Date
June 8, 1909 Mar. 13, 1910
Mar. 23, 1911
Apr. 22, 1922 July 21, 1923Apr. 7, 1924 Mar. 22, 1925
Gage height (feet)
2.5 3.5
2.45
3.40 4.505.95 6.22
Discharge (cfs)
80 178
71
296 545364 320
Water year
1926 1927 1928 1929 1930
1931 1932
Date
Apr. 11, 1926 June 1, 1927Apr. 24, 1928 Apr. 17, 1929 May 9, 1930
Apr. 1, 1931 Apr. 1, 1932
Gage height (feet)
f.54 4.823.60 2.. 34 2.05
1.57 1.64
Discharge (cfs)
266 125243 76 34
11 15
1169. Checkerboard Creek near Delpine, Mont.
Location.--Lat 46°34', long 110°36', in sec.4, T.9 N., R.9 E., half a mile up stream from Stohr Creek if miles west of Delpine, and 2^ miles upstream from mouth.
Drainage area. 21.1 sq mi.
Gage. Nonrecording. At site 40 ft upstream at different datum prior to Apr. 9, 1911. Altitude of gage is 5,300 ft (from topographic map).
Stage-discharge relation. Defined by current-meter measurements below 64 cfs at site used prior to Apr. 9, 1919, and below 41 cfs at described site.
Remarks. Small diversions for irrigation above station. Only annual maximum observed stages and discharges are shown.
Peak stages and discharges
Water year
1909 1910
1911
Date
May 4, 1909 (a)
June 1, 1911
Gage height (feet)
2.0 .72
3.30
Discharge (cfs)
146 17
64
Water year
1913 1914
Date
Apr. 13, 1913 May 10, 1914
Gage height (feet)
4.1 3.3
Discharge (cfs)
110 53
Occurred Apr. 12, 13, 20, 22, 23, 26-3O, May 1, 10, 191O.
1170. Checkerboard Creek at Delpine, Mont.
Location. Lat 46°34', long 110°34', in NE^ sec.2, T.9 N., R.9 E., 500 ft down- stream from highway bridge at Delpine, a quarter of a mile downstream from Brooks Creek, and half a mile upstream from mouth.
Drainage area. 23.9 sq mi.
Gage. Nonrecording. At site 500 ft upstream at different datum prior to Aug. 8, 1927. Altitude of gage is 5,200 ft (by barometer).
Stage-discharge relation. Defined by current-meter measurements below 40 cfs at site used prior to Aug. 8, 1927, and below 93 cfs at described site.
Remarks. Diversions for irrigation above station materially affect peak flows. Only annual maximum observed stages and discharges are shown.
Peak stages and discharges
Water year
1922 1923 1924 1925
1926
Date
June 18, 1922 July 16, 1923 May 16, 1924 May 29, 1925
Apr. 21, 1926
Gage height (feet)
1.90 3.1 2.92 2.40
2.02
Discharge (cfs)
75 167 89 49
49
Water year
1927 1928 1929 1930
1932
Date
June lj 1927Apr. 24, 1928 May 25, 1929 May 9, 1930
(a)
Gr«e height (feet)
2.662.75 1.68 1.52
1.39
Discharge (cfs)
73113 2214
12a Occurred May 9, 12, 13, 15, 18-21, 1932.

MUSSELSHELL RIVER BASIN 135
1180. North Pork Musselshell River near Martinsdale, Mont.
Location. Lat 46°29', long 110°17', in sec.6, T.8 N., R.12 E. ( at Martin J. Settle Ranch, half a mile upstream from confluence with South Pork ard 2-| miles north of Martinsdale.
Drainage area. 233 sq mi.
Gage.--Nonrecording. Altitude of gage is 4,670 ft (by barometer).
Stage-discharge relation. Defined by current-meter measurements below 440 cfs.
Remarks.--Diversions for irrigation above station materially affect peaV flows. Only annual maximum observed stages and discharges are shown.
Peak stages and discharges
Water year
1908 1909 1910
1911
Date
June 6, 1908 July 20, 1909 Mar. 7, 1910
June 2, 1911
Gage height (feet)6.25 6.S 5.66
4.8
Discharge (cfs)
529 640 410
248
Water year
1912 1913 1914
Date
May 22, 1912 Apr. 12, 1913 June 6, 1914
Gage height (feet)
6.4 6.8 5.8
Discharge (cfs)
572 668 448
1185. South Fork Musselshell River above Martinsdale, Mont.
Location.--Lat 46°27', long 110°23', in NW£ sec.17, T.8 N., R.ll E., on left bank 2 miles downstream from Cottonwood Creek, 3 miles west of Martinsdale, and 6 miles upstream from confluence with North Fork.
Drainage area. 287 sq mi.
Gage. Nonrecording prior to May 15, 1942; recording thereafter. Altitude of gage is 4,900 ft (by barometer).
Stage-discharge relation. Defined by current-meter measurements below 760 cfs.
Remarks.--Diversions for irrigation of about 6,600 acres do not materially affect peak flows. Peaks are principally from snowmelt. Base for partial- duration series, 480 cfs.
Peak stages and discharges
Water year
1942
1943
1944
1945
1946
1947
1948
1949
1950
Date
May 27, 1942June 4, 1942
Apr. 11, 1943Apr. 21, 1943May 5, 1943May 31, 1943June 10, 1943
May 19, 1944June 4, 1944June 9, 1944June 28, 1944
June 4, 1945
May 28, 1946
Dec. 15, 1946Apr. 15, 1947May 10, 1947June 10, 1947
May 8, 1948May 22, 1948June 5, 194SJune 18, 1948
May 17, 1949
May 18, 1950May 23, 1950
Gage height (feet)
5.715.85
4.754.424.325.315.37
4.824.784.854.63
4.33
4.49
4.424.95.385.31
4.78-
6.565. 63
5.58
4.884. 32
Discharge (cfs)
938993
650537627766770
631625651567
472
520
500637802772
600al,0001,240
898
863
696678
Water year
1950
1951
1952
1953
1954
1955
1956
1957
1958
1959
Date
June 7, 1950June 17, 1950
May 13, 1951May 19, 1951May 24, 1951
Apr. 19, 1952Apr. 29, 1952May 4, 1952
June 4, 1953
May 22, 1954
June 17, 1955
May 24, 1956May 29, 1956
May 15, 1957May 20, 1957May 29, 1957June 7, 1957June 17, 1957June 22, 1957
May 23, 1958
June 7, 1959June 16, 1959
Gage height (feet)
4. SO5.17
4.324.454.68
4.245.005.39
5.97
4.26
3.87
5.145.53
4.705.034.335.044.515.03
3,84
5.745.26
Discharge (cfs)
672783
528567636
481716849
997
437
336
784916
637746517750574746
353
975797
a About.

136 MUSSELSHELL RIVER BASIN
Peak stages and discharges of South Pork Musselshell River above Martlns^ale, Mont. Con.
Water year
1960
1961
1962
Date
Mar. 23, 1960
May 31, 1961
May 22, 1962
Gage height (feet)
4.32
3.75
4.61
Discharge (ofs)
461
277
552
Water year
1962
1963
Date
May 26, 1962 June 15, 1962
May 26, 1963 June 11, 1963
G^«;e height (feet)
5.68 4.67
5.34 4.63
Discharge (cfs)
941572
728 509
1195. South Fork Musselshell River near Martinsdale, Mont.
Location. Lat 46°28', long 110°18', in N? sec.12, T.8 N., R.ll E., lj miles northeast of Martinsdale and 2 miles upstream from mouth.
Drainage area. 300 sq mi.
Gage.--Nonrecording. At different datum prior to Dec. 2, 1914. Altitude of gage is 4,720 ft (by barometer).
Stage-discharge relation. Defined by current-meter measurements below 1,200 cfs.
Remarks. Many diversions for irrigation above station. Only annual maximum observed stages and discharges are shown.
Peak stages and discharges
Water year
1908 1909 1910
1911
Date
June 4, 7, 1908 May 25, 1909 Apr. 29, 1910
June 2, 1911
Gage height (feet)
5.8 5.6 4.6
6.0
Discharge (cfs)
1,260 1,140
585
1,380
Water year
1912 1913 1914
1932
Date
May 30, 1912 May 28, 1913 June 6, 1914
May 22, 1932
Gi^ge height (feet)
5.1 5.65 5.0
3.00
Discharge (cfs)
800 1,030
693
375
1205. Musselshell River at Harlowton, Mont.
Location. Lat 46°26', long 109°51', in NE£ sec.28, T.8 N., R.15 E., on left bank 300 ft downstream from bridge on State Highway 19, 1 mile southwest of Harlowton, and 6 miles upstream from American Fork.
Drainage area. 1,125 sq mi.
Gage. Nonrecording prior to Aug. 27, 1955; recording thereafter. At site T£ miles downstream at different datums prior to Dec. 8, 1937. At bridge 300 ft upstream at different datums Dec. 8, 1937, to Aug. 26, 1955. Alti tude of gage is 4,160 ft (by barometer).
Stage-discharge relation. At site used 1937-55: Defined by currant-meter meas- urements below 2,100 cfs and extended above by logarithmic plotting.
Remarks. Diversions for irrigation of about 37,000 acres above gage. Some ef- feet on peak flows by storage in Martinsdale Reservoir (total capacity, 23,180 acre-ft). Only annual peaks are shown.
Peak stages and discharges __
Water year
19091910
19111912191319141915
1916191719181919
Date
May 25, 1909Apr.29,May 11,
1910
June 3, 1911May 22, 1912May 29, 1913June 6, 1914June 13, 1915
June 22, 1916May 27, 1917July 15, 1918Mar. 31, 1919
Gage height (feet)
3.32.2
4.13.02.853.12.58
2.745.33.803.78
Discharge (cfs)
1,410680
2,5901,4101,2501,4901,000
1,2404,0202,500
748
Water year
1920
19211922192319241925
19261927192819291930
Date
May 13, 1920
June 9, 1921June 11, 1922June 21, 1923May 18, 1924July 24, 1925
May 22, 1926June 12, 1927May 12, 1928June 3, 1929Apr. 26, 1930
Grge height (feet)
5.43
4.525.905.804.735.40
4.306.325.254.403.76
Discharge (cfs)
1,570
5641,6902,1401,1601,960
8732,4201,620
775339

MUSSELSHELL RIVER BASIN 137
Peak stages and discharges of Musselshell River at Harlowton, Mont. Continued
Water year
1931193219331934
1935
1936
1937193819391940
194119421943
19441945
19461947
1948
Date
June 5, 1931June 13, 1932June 2, 1933Jan. 28, 1934June 8, 1934July 21, 1935
Mar. 3, 1936Apr. 14, 1936Apr. 17, 1937June 24, 1938Mar. 25, 1939June 9, 1940
June 10, 1941June 5, 1942Mar. 25, 1943June 12, 1943June 29, 1944June 7, 1945
May 29, 1946Mar. 18, 1947May 12, 1947June 6, 1948
Gage height (feet)
3.404.145.00
a4.08-
5.90
6.335.323.628.722.78-
2.875.32
a5.09-
4.503.28
2.90a5.09
-5.90
Discharge (cfs)
155561
1,360-385
2,330
-2,020
3684,530
584b!75
5862,050
-1,4001,430
708
550-
1,1002,470
Water year
19491950
1951195219531954
1955
1956
19571958
19591960
1961
19621963
Date
May 19, 1949June 19, 1950
May 20, 1951May 27, 1952June 13, 1953Dec. 8, 1953May 23, 1954Mar. 9, 1955June 18, 1955
Mar. 24, 1956May 30, 1956June 22, 1957Feb. 25, 1958May 13, 1958June 9, 1959Mar. 21, 1960Mar. 23, 1960
Jan. 8, 1961June 1, 1961May 28, 1962Feb. 7, 1963June 12, 1963
Gage height (feet)
3.784.14
3.084.333.97
a2.79-
a2.36-
a5.62-
5.48a4.05
-5.12
a4.43_
a3.04-
6.26a7.44
-
rischarge (cfs)
1,0601,330
6471,4201,230
-315-238
-1,1501,540
-376
1,230-595
-93
1,950-834
a Backwater from ice.b Maximum daily; estimated.
1206. Antelope Creek tributary near Harlowton, Mont.
Location.--Lat 46°39', long 109°58', in NE£ sec.8, T.10 N., R.14 E., at culvert on county road, 18.3 miles northwest of Harlowton.
Drainage area. 0.47 sq mi.
Gage. Crest-stage gage. Altitude of gage is 5,300 ft (from topographic map).
Stage-discharge relation.--Defined on basis of computed flow through culvert using head as indicated by crest-stage gage.
Remarks.--Only annual peaks are shown.
Peak stages and discharges
Water year
1956 1957 1958 1959 1960
Date
June 15, 1956 March 1957
March 1959 Mar. 18, 1960
Gage height (feet)
1.36 .56
1.72 2.04
Discharge (cfs)
13 7
(a) 36
Water year
1961 1962 1963
Date
June 13, 1961 Mar. 26, 1962 Feb. 4, 1963
Gage height (feet)
0.25 1.40 1.32
Discharge (cfs)
(a)1 1
a No evidence of flow during year.
1207. Antelope Creek tributary near mouth, near Harlowton, Mont.
Location.--Lat 46°37', long 109°57', in NW£ sec.22, T.10 N. , R.14 E. , at bridge on county road, 16.3 miles northwest of Harlowton.
Drainage area. 1.92 sq mi.
Gage.--Crest-stage gage. Altitude of gage is 5,000 ft (from topographic map).
Stage-discharge relation. Defined by current-meter measurements below 100 cfs.
Remarks. Only annual peaks are shown.

138 MUSSELSHELL RIVER BASIN
Peak stages and discharges of Antelope Creek tributary near mouth, near Harlowton, Mont.
Water year
1956 1957 1958 1959 1960
Date
Mar. 17, 1956 June 16, 1957 May 23, 1958 Mar. 20, 1959 Mar. 18, 1960
Gage height (feet)
1.60 1.51 .17 .75 .42
Discharge (of a)
207 188 17 65 33
Water year
1961 1962 1963
Date
Mar. 26, 1962 Feb. 4, 1963
Gage height (feet)
0.28 bl.49
Discharge (cfs)
(a) 20
c50
a No evidence of flow during year, b Backwater from ice. c Approximate.
1208. Antelope Creek tributary foo. 2 near Harlowton, Mont.
Location.--Lat 46°28', long 109°49', in SE^ sec.10, T.8 N., R.15 E., at E. S. Bacon Ranch, 1^ miles north of Harlowton.
Drainage area. 21.2 sq mi.
Gage.--Crest-stage gage. Altitude of gage is 4,210 ft (from topographic map).
Stage-discharge relation.--Defined by current-meter measurements below 50 cfs and by slope-area measurements at 299 and 3,230 cfs.
Remarks. Only annual peaks are shown.
Peak stages and discharges
Water year
1956 1957 1958 1959 1960
Date
June 15, 1956 June 21, 1957
June 1958 Mar. 20, 1959
Gage height (feet)
3.51 1.95 .36 .57
(a)
Discharge (cfs)
820 190 35 80
Water year
1961 1962 1963
Date
June 16, 1962 Feb. 4, 1963
Cage height (feet)
(a) 5.56 b.61
Discharge (cfs)
3,230 c20
a Below bottom of gage; discharge less than 25 cfs. b Backwater from ice. c Approximate.
1209. Antelope Creek at Harlowton, Mont.
Location.--Lat 46°26', long 109°49' , in NE£ sec.22, T.8 N., R.15 E., on overpass on U.S. Highway 12 at Harlowton.
Drainage area. 88.7 sq mi.
Gage.--Crest-stage gage. Altitude of gage is 4,160 ft (from topographic map).
Stage-discharge relation.--Defined by current-meter measurements below 600 cfs and by contracted-opening measurements at 1,600 and 24,400 off.
Remarks.--Only annual peaks are shown.
Peak stages and discharges
Water year
1950
1954 1955
1956 1957
Date
June 17, 1950
Aug. 15, 1954 June 26, 1955
June 15, 1956 June 21, 1957
Gage height (feet)
16.73
4.52 3.01
3.28 1.52
Discharge (cfs)
24,400
1,600 591
800 170
Water year
1958 1959 1960
1961 1962 1963
Date
June 16, 1962 Feb. 4, 1963
Gage height (feet)
,
a a
a:.C
a)2
Discharge (cfs)
1,280
a Below bottom of gage; discharge less than 3O cfs.
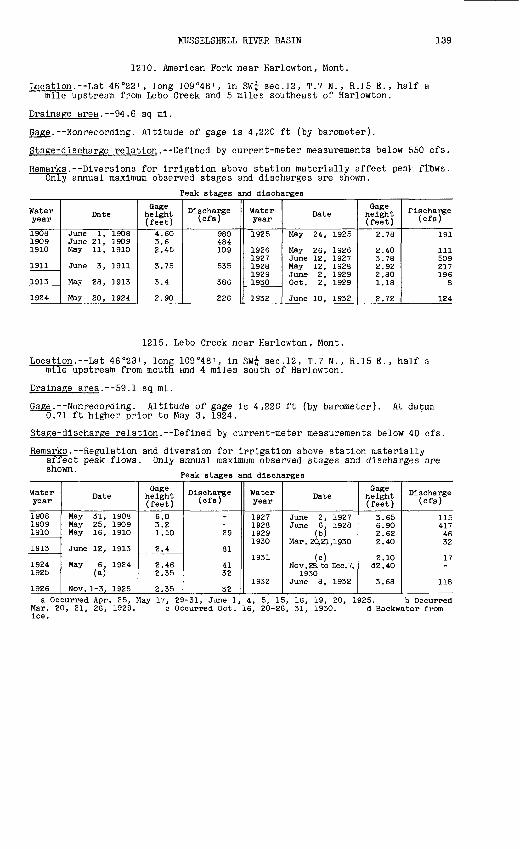
MUSSELSHELL RIVER BASIN 139
1210. American Fork near Harlowton, Mont.
Location. Lat 46°22', long 109°48', in SW£ sec.12, T.7 N., R.15 E., half a mile upstream from Lebo Creek and 5 miles southeast of Harlowton.
Drainage area. 94.6 sq mi.
Gage. Nonrecording. Altitude of gage is 4,220 ft (by barometer).
Stage-discharge relation. Defined by current-meter measurements below 550 cfs.
Remarks. Diversions for irrigation above station materially affect peak ftows. Only annual maximum observed stages and discharges are shown.
Peak stages and discharges
Water year
1908 1909 1910
1911
1913
1924
Date
June 1, 1908 June 21, 1909 May 11, 1910
June 3, 1911
May 28, 1913
May 20, 1924
Gage height (feet)
4.60 3.6 2.45
3.75
3.4
2.90
Discharge (cfs)
980 484 109
535
386
226
Water year
1925
1926 1927 1928 1929 1930
1932
Date
May 24, 1925
May 26, 1926 June 12, 1927 May 12, 1928 June 2, 1929 Oct. 2, 1929
June 10, 1932
Gage height (feet)
2.78
2.40 3.78 2.92 2.80 1.18
2.72
Tischarge (cfs)
191
111 509 217 196
8
124
1215. Lebo Creek near Harlowton, Mont.
Location. Lat 46°23', long 109°48', in Sw£ sec.12, T.7 N., R.15 E., half a mile upstream from mouth and 4 miles south of Harlowton.
Drainage area.--59.1 sq mi.
Gage.--Nonrecording. Altitude of gage is 4,220 ft (by barometer). At datum 0.71 ft higher prior to May 3, 1924.
Stage-discharge relation. Defined by current-meter measurements below 40 cfs.
Remarks. Regulation and diversion for irrigation above station materially affect peak flows. Only annual maximum observed stages and discharges are shown.
Peak stages and discharges
Water year
1908 1909 1910
1913
1924 1925
1926
Date
May 31, 1908 May 25, 1909 May 16, 1910
June 12, 1913
May 6, 1924 (a5
Nov. 1-3, 1925
Gage height (feet)
6.0 3.2 1.50
2.4
2.46 2.35
2.35
Discharge (cfs)
29
81
41 32
32
Water year
1927 1928 1929 1930
1931
1932
Date
June 2, 1927 June 6, 1928
(b5 Mar. 20,21,1930
(0 Nov. 28. to Dec. 7,
1930 June 8, 1932
Gage height (feet)
3.65 6.90 2.62 2.40
2.10 d2.40
3.68
Discharge (cfs)
115 417 46 32
17
118
a Occurred Apr. 25, May 17, 29-31, June 1, Mar. 20, 21, 26, 1929. c Occurred Oct. ice.
4, 5, 15, 16, 19, 20, 1925. b Occurred 16, 20-26, 31, 1930. d Backwater from

140 MUSSELSHELL RIVER BASIN
1220. American Fork below Lebo Creek, near Harlowton, Mont.
Location.--Lat 46°24', long 109°46', In 'NE£ sec.6, T.7 N., R.16 E., on left bank 2 miles upstream from mouth, 2 miles downstream from Lebo Creek, and 5 miles southeast of Harlowton.
Drainage area.--166 sq mi.
Gage.--Recording. Altitude of gage is 4,170 ft (by barometer).
Stage-discharge relation.--Defined by current-meter measurements below 560 cfs.
Remarks. Diversions for irrigation of about 7,500 acres do not materially affect peak flows. Base for partial-duration series, 150 cfr.
Peak stages and discharges
Water year
1947
1948
1949
1950
1951
1952
1953
1954
Date
Mar. 17, 1947May 11, 1947
May 22, 1948May 29, 1948June 5, 1948June IS, 1948July 11, 1948July 19, 1948
Mar. 19, 1949May 18, 1949
Feb. 25, 1950May 10, 1950May IS, 1950May 24, 1950May 23, 1950June 8, 1950June 17, 1950
Mar. 26, 1951Mar. 27, 1951May 13, 1951
May 15, 1952May 22, 1952
June 6, 1953June 13, 1953
Feb. 4, 1954Apr. 6, 1954
Gage height (feet)a4.624.42
4.544.225.375.225.674.05
a6.864.13
3.923.894.774.604.484.205.32
a4.994.823.73
4.504.79
4.374.74
a3.232.78
Discharge (cfs)
-367
401311742652956266
-287
231198364317298216712
b270424178
300430
272405
-59
Water year
1955
1956
1957
1958
1959
1960
1961
1962
1963
Date
Mar. 10, 1955June 26, 1955
Mar. 21, 1956May 30, 1956
May 16, 1957May 21, 1957June 7, 1957June 17, 1957June 22, 1957
May 12, 1958May 25, 1958
Mar. 1, 1959June 8, 1959June 26, 1959
Mar. 17, 1960June 4, 1960
Dec. 7, 1960May 31, 1961
May 26, 1962June 15, 1962
Feb. 4, 1963June 5, 1963June 11, 1963June 15, 1963June 21, 1963
Gage 1- eight (feet)
a3.463. OS
_4.93
4.374.924.134.824.93
4.023.69
a5. 824.353.80
a4.023.62
a2.932.40
4.804.69
a4.894.264.694.503.97
Discharge (cfs)
-92
b!60506
272501203446506
194153
-256158
-137
-29
440391
.231381306179
a Backwater from ice. b Daily mean.
1235. Musselshell River near Ryegate, Mont.
Location. Lat 46°18', long 109°12', in lot 6, NW£ sec.2, T.6 N., R.20 E., on left bank 1 mile upstream from Careless Creek and 3 miles east of Ryegate.
Drainage area. 1,982 sq mi.
Gage.--Recording. Altitude of gage is 3,580 ft (by barometer).
Stage-discharge relation. Defined by current-meter measurements.
Remarks. Some regulation by Durand, Martinsdale, and Deadman's Basin Reser voirs (combined capacity, 102,430 acre-ft). Diversions for irrigation of about 45,200 acres above station, of which about 2,700 acres is flood irri gated. Peak flows are materially affected. Only annual peaks are shown.

MUSSELSHELL RIVER BASIN 141
Peak stages and discharges of Musselshell River near Ryegate, Mont.
Water year
194719481949
1950
1951
195219531954
1955
Date
May 13, 1947June 17, 1948Mar. 23, 1949May 20, 1949June 19, 1950
Mar. 25, 1951Aug. 29, 1951May 23, 1952June 15, 1953Jan. 27, 1954May 24, 1954Apr. 1, 1955
Gage height (feet)
6.6610.92a6.84
-10.06
a7.63-
7.626.69
a5.05-
a4.37
Discharge (cfs)
1,2406,260
-1,2804,010
-1,0301,8001,370
-274-
Water year
1955
1956195719581959
1960
196119621963
Date
June 27, 1955
May 31, 1956June 22, 1957July 18, 1958Mar. 3, 1959June 10, 1959Mar. 24, 1960
July 31, 1961June 16, 1962Feb. 9, 1963June 16, 1963
Gage height (feet)
_
6.878.966.65
a9.25
a8. 40
5.167.71
a7.85-
Discharge (cfs)
245
1,4002,7801,330
_1,260b700
6541,970
1,000a Backwater from Ice. b About.
1255. Careless Creek at Wallum, Mont.
Location.--Lat 46°25', long 109°23', in SW^ sec.32, T.8 N., R.19 E., at highway bridge at Wallum, 4 miles upstream from Swimming Woman Creek and 7 miles north of Barber.
Drainage area.--471 sq mi.
Gage.--Nonrecording. Altitude of gage is 3,820 ft (by barometer).
Stage-discharge relation. Defined by current-meter measurements below 130 cfs.
Remarks. Diversions for irrigation do not materially affect peak flows. Only annual peaks are shown.
Peak stages and discharges
Water year
1934 1935
1936 1937 1938
Date
June 8, 1934 July 10, 1935
Mar. 3, 1936 July 14, 1937 June 19, 1938
Gage height (feet)
6.8 7.0
7.03 5.32
12.0
Discharge (cfs)
224 240
240 126
Water year
1939 1940
1941 1942
Date
Mar. 19, 1939 June 20, 1940
June 3, 1941 June 4, 1942
Gage height (feet)
4.96 5.80
3.30 8.4
Discharge (cfs)
110 156
37 410
1257. Big Coulee near Lavina, Mont.
Location.--Lat 46°16', long 108°57', in SE£ sec.15, T.6 N., R.22 E., on left bank 2 miles upstream from mouth and 2 miles southwest of Lavina.
Drainage area. 232 sq mi.
Gage.--Recording. Altitude of gage is 3,480 ft (from topographic map).
Stage-discharge relation.--Defined by current-meter measurements below 80 cfs.
Remarks. Minor flood irrigation in headwaters does not materially affect peak flows. Base for partial-duration series, 25 cfs.
Peak stages and discharges
Water year
1958
1959
1960
Date
July 20, 1958
Mar. 2, 1959June 11, 1959June 26, 1959June 30, 1959July 15, 1959
Mar. 3, 1960
Gage height (feet)
3.36
a4.303.083.273.333.78
a4.29
Discharge (cfs)
25
12425293050
-
Water year
1960
1961
1962
Date
Mar. 19, 1960
Jan. 31, 1961July 21, 1961
Jan. 29, 1962Mar. 20, 1962June 1, 1962June 4, 1962
Gage height (feet)
3.30
a3.092.91
a4.503.483.454.00
Discharge (cfs)
33
-9.7
-13287
191
a Backwater from ice.
219-848 O - 66 - 11

142 MUSSELSHELL RIVER BASIN
Peak stages and discharges of Big Coulee near Lavina, Mont. Continued
Water year
1962
Date
June 6, 1962 June 13, 1962 June 15, 1962 June 17, 1962 June 19, 1962
Oage height (feet)
3.05 3.78 3.82 4.00 4.32
Discharge (cfs)
37 116 116 144 250
Water year
1962
1963
Date
June 23, 1962 July 27, 1962 July 28, 1962
Feb. 6, 1963
Or age height (feet)
3.45 3.35 3.56
a3.55
Discharge (cfs)
98 65 98
20a Backwater from ice.
1263. Currant Creek near Roundup, Mont.
Location. Lat 46°22', long 108°39', in SW^ sec.7, T.7 N., R.25 E., at bridge on U.S. Highway 12, 7 miles southwest of Roundup.
Drainage area.--220 sq mi.
Gage. Crest-stage gage. Altitude of gage is 3,270 ft (from topographic map).
Stage-discharge relation. Defined by current-meter measurements below 450 cfs.
Remarks.--Only annual peaks are shown.
Peak stages and discharges
Water year
1958 1959
1961
Date
July 19, 1958 Mar. 1, 1959
July 21, 1961
Gage height (feet)
2.12 6.65
1.86
Discharge (cfs)
a40 780
31
Water year
1962 1963
Date
June 15, 1962 June 5, 1963
Oage height (feet)
5.28 b3.45
Discharge (cfs)
395 a20
a Approximate.b Backwater from ice or debris.
1265. Musselshell River near Roundup, Mont.
Location.--Lat 46°26', long 108°34', in SE^ sec.22, T.8 N., R.25 E., on left bank just downstream from Half Breed Creek, 2^ miles west of R?undup.
Drainage area.--4,023 sq mi.
Gage.--Nonrecording prior to Sept. 26, 1949; recording thereafter. Datum of gage is 3,188.22 ft above mean sea level, datum of 1929.
Stage-discharge relation.--Defined by current-meter measurements below 6,300 cfs.
Remarks. Some regulation by Durand , Martinsdale, and Deadman's Basin Reser voirs (combined capacity, 102,430 acre-ft). Diversions for irrigation of about 59,600 acres above station of which about 11,000 acres is flood irri gated. Peak flows are materially affected. Only annual peaks are shown.
Peak stages and discharges
Water year
194619471948
1950
19511952195319541955
1956
Date
July 4, 1946Mar. 20, 1947June 18, 1948
June 19, 1950
Aug. 30, 1951May 29, 1952June 16, 1953Aug. 5, 1954July 20, 1955
Mar. 18, 1956
Oage height (feet)
4.084.76
11.0
6.23
7.204.864.172.773.30
a7.29
Discharge (cfs)
1,3101,8007,460
2,960
3,8401,8801,420
532870
-
Water year
1956195719581959
1960
19611962
1963
Date
May 28, 1956June 22, 1957July 19, 1958Mar. 2, 1959Mar. 3, 1959Mar. 23, 1960Mar. 25, 1960
Aug. 1, 1961Mar. 19, 1962June 16, 1962
. Feb. 10, 1963June 17, 1963
Gage height (feet)
-5.643.91
alO . 68-
a3.85-
2.48a5.88
-a4.70
-
Discharge (cfs)
2,5202,2701,160
-b2,000
-819
366-
2,140-990
a Backwater from ice. b Maximum daily.
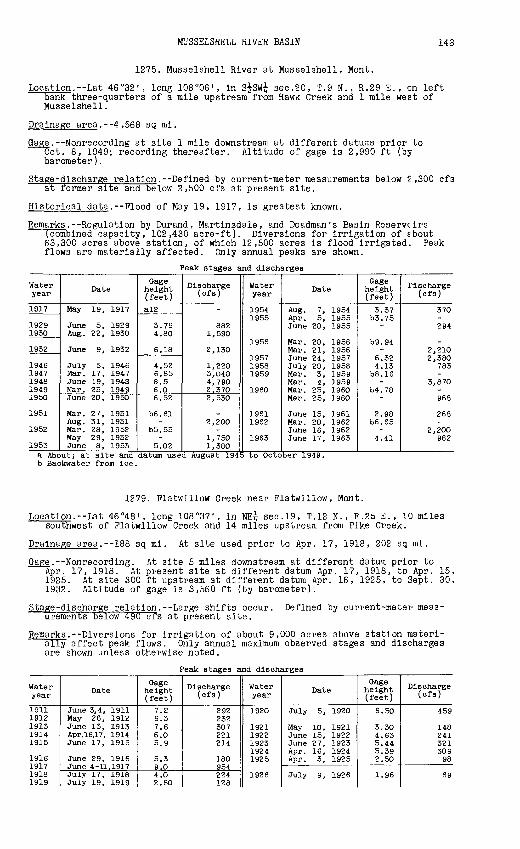
MUSSELSHELL RIVER BASIN 143
1275. Musselshell River at Musselshell, Mont.
Location. Lat 46°32 I , long 108 °06', in S^SW£ sec. 20, T.9 N. , R.29 E. , en left bank three-quarters of a mile upstream from Hawk Creek and 1 mile west of Musselshell.
Drainage area. 4,568 sq mi.
Gage. Nonrecording at site 1 mile downstream at different datums prior to Oct. 8, 1949; recording thereafter. Altitude of gage is 2,990 ft (by barometer) .
Stage-discharge relation. Defined by current-meter measurements below 2,300 cfs at former site and below 2,500 cfs at present site.
Historical data. Flood of May 19, 1917, is greatest known.
Remarks . Regulation by Durand, Martinsdale, and Deadman's Basin Reservcirs (combined capacity, 102,430 acre-ft). Diversions for irrigation of fbout 63,300 acres above station, of which 12,500 acres is flood irrigated. Peak flows are materially affected. Only annual peaks are shown.
Peak stages and discharges
Water year
1917
1929 1930
1932
1946 1947 1948 1949 1950
1951
1952
1953
Date
May 19, 1917
June 5, 1929 Aug. 22, 1930
June 9, 1932
July 5, 1946 Mar. 17, 1947 June 19, 194S Mar. 25, 1949June 20, 1950
Mar. 27, 1951 Aug. 31, 1951 Mar. 28, 1952 May 29, 1952 June 8, 1953
Gage height (feet)
al2
3.76 4.80
6.18
4.52 6.85 8.5 6.06.52
b6.61
b5.55
5.02
Discharge (cfs)
882 1,590
2,130
1,220 3,O40 4,790 2,3702,530
2,200
1,750 1,380
Water year
1954 1955
1956
1957 1958 1959
1960
1961 1962
1963
Date
Aug. 7, 1954 Apr. 5, 1955 June 20, 1955
Mar. 20, 1956 Mar. 21, 1956 June 24, 1957 July 20, 195S Mar. 3, 1959 Mar. 4, 1959 Mar. 25, 1960 Mar. 25, 1960
June 15, 1961 Mar. 20, 1962 June 16, 1962 June 17, 1963
Gage height (feet)
3.37 b3.75
b9.94
6.32 4.13
b8.16
b4.78
2.98 b6.65
4.41
Tlscharge (cfs)
370
294
2,210 2,380
783
3,870
968
268
2,200 962
a About; at site and datum used August 194 to October 1949. b Backwater from ice.
1279. Platwillow Creek near Platwillow, Mont.
Location.--Lat 46°48', long 108°37', in NE^ sec.19, T.12 N., R.25 E., 10 miles southwest of Platwillow Creek and 14 miles upstream from Pike Creek.
202Drainage area.--188 sq mi. At site used prior to Apr. 17, 1918,
Gage. Nonrecording. At site 5 miles downstream at different datum prior to Apr. 17, 1918. At present site at different datum Apr. 17, 1918, to Apr. 15, 1925. At site 300 ft upstream at different datum Apr. 16, 1925, to Sept. 30, 1932. Altitude of gage is 3,560 ft (by barometer).
Defined by current-meter meas-Stage-dlscharge relation. Large shifts occur, urements below 490 cfs at present site.
Remarks. Diversions for irrigation of about 9,000 acres above station materi- ally affect peak flows. Only annual maximum observed stages and discharges are shown unless otherwise noted.
Peak stages and discharges
Water year
1911 1912 1913 1914 1915
1916 1917 1918 1919
Date
June 3,4, 1911 May 26, 1912 June 13, 1913 Apr.16,17, 1914 June 17, 1915
June 29, 1916 June 4-11,1917July 17, 1918 July 19, 1919
Gage height (feet)
7.2 6.3 7.6 6.05.9
5.3 9.04.0 2.80
Discharge (cfs)
292 232 307 221 214
180 954224128
Water year
1920
1921 1922 1923 1924 1925
1926
Date
July 5, 1920
May 10, 1921 June 15, 1922 June 27, 1923 Apr. 16, 1924 Apr. 3, 1925
July 9, 1926
Gage height (feet)
6.50
3.30 4.63 5.44 5.39 2.50
1.96
Discharge (cfs)
459
148 241 321 309 98
69

144 MUSSELSHELL RIVER BASIN
Peak stages and discharges of Flatwillow Creek near Flatwillow, Mort. Continued
Water year
1927
192819291930
19311932
19341935
19361937193819391940
194119421943
Date
May 30 to June 4,1927
Mar. 26, 1928June 4, 1929Apr. 16, 1930
Jan. 31, 1931June 16, 1932
Mar. 5, 1934July 8, 1935
Apr. 13, 1936-
July 7, 1938June 24, 1939Mar. 4, 1940Apr. 30, 1940
June 28, 1941June 6, 1942June 14, 1943
Gage height (feet)
5.9
3.403.423.03
1.703.70
1.303.45
3.30-
4.282.54
bl.94-
2.637.006.22
Discharge (cfs)
336
160a!60115
37185
15153
1450
18693_27
92600400
Water year
19441945
1946
194719481949
1950
1951
195219531954
1955
1956
Date
June 28, 1944Mar. 12, 1945June 11, 1945
Feb. 4, 1946June 13, 1946Apr. 16, 1947June 22, 1948Mar. 9, 1949Mar. 25, 1949Apr. 4, 1950
Mar. 28, 1951Apr. 5, 1951Apr. 18, 1952June 6, 1953Feb. 10, 1954Apr. 8, 1954May 17, 1955
Mar. 22, 1956Mar. 24, 1956
Gage height (feet)
4.59b2.80
-
b2.14-
6.005.66
14.49-
2.44
13.94-
3.507.23
1 1.75-
2.96
12.00-
Discharge (cfs)
213_67
-39
275247-7658
_c!31c!20C708
_c83c96
_c46
a Maximum for period May 1 to Sept. 30. b Backwater from ice. c Momentary maximum.
1282. Flatwillow Creek near Winnett, Mont. (Published as "at Petrolia" 1921-32}
Location.--Lat 46°56', long 108°12', in NW^NE^ sec.32, T.14 N., F.28 E., Smiles upstream from Box Elder Creek and 8| miles southeast of Winnett.
Drainage area.--642 sq mi. At site used 1921-32, 660 sq mi.
Gage. Nonrecording at site 6 miles downstream at datum about 90 ft lower1921-32; recording at described site and datum thereafter. Altitude of gage is 2,790 ft (by barometer).
Stage-discharge relation. Defined by current-meter measurements below 300 cfs at site used 1921-32, and below 550 cfs at described site.
Remarks. Diversions for irrigation of about 13,000 acres above station.Storage in Petrolia Reservoir, 3 miles upstream, began in July 1951. Peak flows are not materially affected. Base for partial-duration series, 100 cfs. Only annual observed peaks are shown prior to 1948.
Peak stages and discharges
Water year
1923 1924 1925
1926 1927 1928 1929
1931 1932
1948 §/
Date
July 5, 1923 June 28, 1924 June 4, 1925
Nov. 11, 1925 May 28, 1927 July 7, 1928 Mar. 29, 1929
Feb. 26, 1931 June 9, 1932
May 20, 194S June 4, 1948 June 18, 1948 June 23, 1948
Gage height (feet)
12.94 5.89 3.36
2.028.56 3.04 4.00
2.38 11.1
4.6 4.79 3.55 2.47
Discharge (ofs)
3,770 866 242
45 2,170
209 414
120 3,100
730 776 488 250
Water year
1948
1949
1950
1951
Date
July 12, 1948
Feb. 25, 1949 Mar. 7, 1949 Mar. 22, 1949
Mar. 24, 1950 Mar. 24, 1950 June 16, 1950 June 26, 1950
Dec. 20, 1950 Mar. 29, 1951 Apr. 6, 1951 Aug. 30, 1951
Gage height (feet)
3.2
14.91
14.02
1.82 2.48
14.02
1.99 2.37
Discharge (cfs)
411
c200 C300
Cl60 134 237
c!60 136 219
a For period Apr. 1 to September 30. b Backwater from ice. c Daily mean.

MUSSELSHELL RIVER BASIN 145
1289. Box Elder Creek tributary near Winnett, Mont.
Location. Lat 47°01', long 108°10', in SW^NW^ sec.34, T.15 N., R.28 E., a quarter of a mile north of State Highway 20 and 8 miles east of Winrett.
Drainage area. 16.2 sq mi.
Gage. Crest-stage gage. Altitude of gage is 2,760 ft (from topographic map).
Stage-discharge relation. Defined by current-meter measurements below 10 cfs and by slope-area measurements at 193 and 412 cfs.
Remarks. Only annual peaks are shown.
Peak stages and discharges
Water year
1955
1956 1957 1958 1959
Date
Aug. 25, 1955
June 18, 1956 Feb. 28, 1957 July 51, 1958 Mar. 1, 1959
Gage height (feet)
2.20
2.11 .66
2.86 5.S6
Discharge (cfs)
132
125 27 195 412
Water year
1960
1961 1962 1965
Date
Mar. 18, 1960
Aug. 10, 1961 June 15, 1962 May 11, 1965
Gage height (feet)
3.57
.90 a8. 5 2.87
Discharge (cfs)
275
40 125 194
a Backwater from ice or debris.
1290. Box Elder Creek near Winnett, Mont.
Location. Lat 47°01', long 108°10', in SW£ sec.34, T.15 N., R.28 E., on right bank 500 ft upstream from bridge on State Highway 20, a quarter of a mile upstream from McDonald Creek, 7 miles upstream from Flatwillow Creek, and 8 miles east of Winnett.
Drainage area. 684 sq mi.
Gage. Nonrecording at site 1,500 ft downstream at different datums prior to Aug. 22, 1958; recording thereafter. Altitude of gage is 2,720 ft (by barometer).
Stage-discharge relation. Large shifts occur. Defined by current-meter meas- urements below 2,700 cfs at former site and below 9,900 cfs at present site.
Remarks. Diversions and regulation materially affect lower peaks. Base for partial-duration series, 200 cfs. Only annual peaks are shown prio" to 1959.
Peak stages and discharges
Water year
1951
1952
1954 1955
1956 1957 1958
1959
1960
Date
Oct. 12, 1950
June S, 1952
June 7, 1954 May 17, 1955
Mar. 7, 1936 July 14, 1957 July 5, 1958
Mar. 10, 1959 Mar. 17, 1959
Mar. 20, 1960
Gage height (feet)2.2
9.50
8.07 5.86
4.00 11.1 4.98
all. 16 6.61
5.26
Discharge (cfs)
237
4,210
2,840 578
620 4,750 1,060
1,220
691
Water year
1961
1962
1963
Date
July 30, 1961
May 14, 1962 May 16, 1962 May 24, 1962 May 27, 1962 June 5, 1962 June 15, 1962 June 16, 1962 Aug. 25, 1962
Feb. 6, 1965 Feb. 26, 1965 May 14, 1963 June 29, 1963
Gage height (feet)
5.07
4.11 6.59 5.09 4.51 4.07 8.74 15.34 6.24
alO . 53
4.54 5. S3
Discharge (cfs)
69
296 1,130
677 445 511
2,250 9,910
796
(b) c250 222 652
a Backwater from ice.b Not known; may have exceeded peak of June 29.c Approximate.

146 MUSSELSHELL RIVER BASIN
1295. McDonald Creek at Winnett, Mont.
Location.--Lat 47°00', long 108°21', in NW^ sec.7, T.14 N., R.2T E., at bridge on State Highway 244, three-quarters of a mile south of Winnett.
Drainage area.--421 sq mi.
Gage. Nonrecording at sites within 1 mile of Winnett at different datums prior to Oct. I, 1956; crest-stage gage thereafter. At Winnett, at different datum Oct. 1, 1956, to March 1960. Altitude of gage is 2.93C ft (by barometer).
Stage-discharge relation. Defined by current-meter measurements below 500 cfs.
Remarks. Only annual peaks are shown.
Peak stages and discharges
Water year
1931 1932
1934 1935
1936 1937 1938 1939 1940
1941 1942 1943 1944
Date
Mar. 2, 1931 June 9, 1932
June 9, 1934 July 8, 1935
Mar. 5, 1936 July 13, 1937 July 8, 1938 June 19, 1939 Mar. 3, 1940
June 28, 1941 May 15, 1942 June 8,18, 1943 June 20, 1944
Gage height (feet)
13.30 20.40
18.12 18.30
18.75 18.71 4.55
5.42 a8. 48 5.59 7.40
Discharge (cfs)
4.2 562
351 371
220 401 328 270 75
482 900 549 853
Water year
1945
1953 1954 1955
1956 1957 1958 1959 1960
1961 1962 1963
Date
June 7, 1945
June 10, 1953 Aug. 5, 1954 Apr. 11, 1955
Aug. 3, 1956Mar. 19, 1957 July 19, 1958 Mar. 1, 1959Mar. 19, 1960
Mar. 20, 1961 June 17, 1962 Feb. 4, 1963
Gage height (feet)
2.48
5.66 3.00 4.39
2.552.20 3.23 b6.844.44
1.25 4.20
Discharge (cfs)
180
424 47
241
8867
150
.1 485 250
a Present site and datum.b Backwater from ice or beaver dam.
1297. German Coulee near Cat Creek, Mont.
Location.--Lat 47°01', long 108°06', in SW£sw£ sec.31, T.15 N., R.29 E., at culvert on State Highway 20, 6 miles southwest of Cat Creek.
Drainage area. 2.32 sq mi.
Gage.--Crest-stage gage. Altitude of gage is 2,780 ft (from topographic map).
Stage-discharge relation.--Defined by current-meter measurements below 10 cfs and extended above on basis of computed flow through culvert using head in dicated by crest-stage gage.
Remarks. Only annual peaks are shown.
Peak stages and discharges
Water year
1955
1956 1957 1958
Date
Aug. 23, 1955
June 18, 1956 Aug. 30, 1957 July 19, 1958
Gage height (feet)5.59
2.73 1.37 2.09
Discharge (cfs)
385
126 43 83
Water year
1959
1961 1962 1963
Date
June 26, 1959
May 16, 1962
Gage height (feet)
1.84
1.06
Discharge (cfs)
68
(a) 28 (b)
a No evidence of flow during year, b Less than 5 cfs.

MUSSELSHELL RIVER BASIN 147
1298. Gorman Coulee tributary near Cat Creek, Mont.
Location. Lat 47°01', long 108°06', in SE^SW^ sec.31, T.15 N., R.29 E. , at culvert on State Highway 20, 6 miles southwest of Cat Creek.
Drainage area. 0.81 sq mi.
Gage. Crest-stage gage. Altitude of gage is 2,780 ft (from topographic map).
Stage-discharge relation. Defined by current-meter measurements below 5 cfs and extended above on basis of computed flow through culvert using head as indicated by crest-stage gage.
Remarks. Only annual peaks are shown.
Peak stages and discharges
Water year
1955
1956195719581959
Date
Aug. 23, 1955
June 18, 1956Aug. 30, 1957July 31, 1958Sept. 22, 1959
Gage height (feet)
3.02
.961.242.52.28
Discharge (cfs)
159
3244
12210
Water year
1960
196119621963
Date
Mar. 18, 1960
Aug. 10, 1961May 16, 1962
_
Gage height (feet)
0.37
.50
.55_
Discharge (cfs)
12
1517{a\
a Less than 5 cfs.
1305. Musselshell River at Mosby, Mont.
Location.--Lat 47°00', long 107°54', near northwest corner of sec.11, T.14 N., R.30 E., on left bank 800 ft downstream from highway bridge, half a nile west of Mosby, and 6 miles downstream from Flatwillow Creek.
Drainage area. 7,846 sq mi.
Gage.--Nonrecording prior to Dec. 6, 1962; recording thereafter. Recording gage used periodically during high stages in 1935-44. At site half a mile up stream at different datum prior to 1934. At site 800 ft upstream at datums 2.47 ft and 1.12 ft higher, respectively, Feb. 4, 1934, to Mar. 8, 1936, and Mar. 9, 1936, to rn=c. 5, 1962. Altitude of gage is 2,500 ft (by barometer).
Stage-discharge relation. Large shifts occur. Defined by current-meter meas- urements below 10,000 cfs at site used 1934-62.
Remarks. Diversions for irrigation of about 103,000 acres above station. Flow affected by offstream reservoirs. Peak flows are probably not materially affected. Only annual peaks are shown.
Peak stages and discharges
Water year
1929
19311932
19341935
19361937193S19391940
194119421943
19441945
1946
1947
Date
June 19, 1929
June 23, 1931June 9, 1932
June 6, 1934July 9, 1935
Mar. 6, 1936June 12, 1937June 22, 1938June 17, 1939Mar. 3, 1940
June 28, 1941June 4, 1942Feb. 15, 1943June 14, 1943June 18, 1944Feb. 12, 1945June 9, 1945
Feb. 19, 1946July 4, 1946Mar. 19, 1947
Gage height (feet)
5.60
3.187.94
10.14.16
7.4612.1813.578.77
aS. 97
S.9010.98
al3.0-
14.43a5.59
-
a4.42-
a!4.00
Discharge (cfs)
3,280
1,1003,440
8,6301,620
5,25013,40016,0005,6802,200
6,04010,OOO
-12,50018,000
-1,740
-775-
Water year
19481949
1950
19511952195319541955
1956
1957
1958
1959
1960
196119621963
Date
June 21, 1948Mar. 5, 1949Mar. 8, 1949June 15, 1950
Mar. 30, 1951Mar. 28, 1952June 3, 1953Aug. 6, 1954Apr. 14, 1955
Mar. 22, 1956Mar. 22, 1956Feb. 28, 1957June 25, 1957Mar. 25, 195SJuly 21, 195SMar. 2, 1959Mar. 3, 1959Mar. IS, 1960
Sept. 11, 1961June 17, 1962Feb. 5, 1963June 21, 1963
Gage height (feet)
8.18a7.81
-8.33
a7.109.50
10.555.234.50
a7.25-
a7.45-
a3.83-
all. 83-
12.02
3.8712.40a8.41
-
Discharge (cfs)
5,130-
2,7205,740
2,3507,3209,3001,8001,270
-2,310
-2,440
-590-
7,570b5,000
56510,200
-1,S40
a Backwater from Ice. b About.

148 DRY CREEK BASIN
1306. Cat Creek near Cat Creek, Mont.
Location. Lat 47°03', long 108°01', in SW£ sec.23, T.15 N. , R.29 E., at culvert on county road, 1\ miles south of Cat Creek.
Drainage area. 36.5 sq mi.
Gage. Crest-stage gage. Altitude of gage is 2,650 ft (from topographic map).
Stage-discharge relation. Defined by current-meter measurements below 20 cfs and extended above on basis of computed flow through culvert and over road using head as indicated by crest-stage gage.
Remarks. Only annual peaks are shown.
Peak stages and discharges
Water year
1958 1959 1960
Date
Aug. 15, 1958 Mar. 12, 1959 Mar. 18, 1960
Gage height (feet)2.76 4.58 5.85
Discharge (cfs)
92 170 379
Water year
1961 1962 1963
Date
June 23, 1961 June 16, 1962 June 29, 1963
C-age height (feet)
1.27 6.19 .72
Discharge (cfs)
40 748 26
1307. Sand Creek near Jordan, Mont.
Location. Lat 47°15', long 106°51', in NW^-NWi sec.11, T.17 N., R.38 E., on right bank 200 ft upstream from highway bridge, 5 miles southeast of Jordan, and 7 miles upstream from mouth.
Drainage area. 317 sq mi.
Gage.--Recording. Datum of gage is 2,586.28 ft above mean sea level, datum of 1929.
Stage-discharge relation.--Defined by current-meter measurements below 670 cfs.
Remarks.--There are 69 small reservoirs above station used for storage of stock water (total capacity, 1,270 acre-ft). Storage reservoirs may affect peak flows. Base for partial-duration series, 50 cfs.
Peak stages and discharges
Water year
1958
1959
1960
1961
Date
July 11, 1958
Mar. 17, 1959
Mar. 19, 1960
Feb. 6, 1961
Gage height (feet)
3.50
7.95
a8. 07
a2.25
Discharge (cfs)
205
2,120
b 1,000
-
Water year
1961
1962
1963
Date
May 22, 1961
Mar. 20, 1962 July 14, 1962 July 16, 1962
Feb. 6, 1963
Page height (feet)
1.96
4.87 5.02
a5.32
Discharge (cfs)
2.6
b200 576 591
b250a Backwater from ice.b Maximum daily discharge, estimated.
1309.5. Little Dry Creek near Van Norman, Mont.
Location. Lat 47°21', long 106°22', in SE£ sec.4, T.18 N., R.42 E., at bridge on State Highway 20, \\ miles southeast of Van Norman.
Drainage area. 1,224 sq mi.
Gage.--Crest-stage gage. Altitude of gage is 2,340 ft (from topographic map).
Stage-discharge relation.--Defined by current-meter measurements below 3,300 cfs.
Remarks. Only annual peaks are shown.
Peak stages and discharges
Water year1958 1959 1960
Date
July 6, 1958 Mar. 18, 1959 Mar. 20, 1960
Gage height (feet)0.83 6.80
a7.6
Discharge (cfs)
160 5,200
b4,OOO
Water year
1961 1962 1963
Date
Sept. 11, 1961 Mar. 22, 1962 Feb. 6, 1963
Gage height (feet)
3.08 2.32
a2.49
Discharge (cfs)
1,320 850
b800a Backwater from ice. b Approximate.

DRY CREEK BASIN 149
1310. Dry Creek near Van Norman, Mont.
Location.--Lat 47°21', long 106°22', in NW£ sec.3, T.18 N., R.42 E., on left bank 500 ft downstream from Little Dry Creek, 3f miles northeast of Van Norman Post Office, and 26 miles east of Jordan.
Drainage area. 2,554 sq mi.
Gage.--Recording. Altitude of gage is 2,330 ft (by barometer).
Defined by current-meter meas-Stage-discharge relation.--Large shifts occur, urements below 19,000 cfs.
Remarks.--Pew small diversions do not affect peak flows, duration series, 400 cfs.
Peak stages and discharges
Base for partial-
Water year
1940
1941
1942
1943
1944
1945
1946
1947
1948
1950
1951
Date
Apr. 21, 1940June 8, 1940July 5, 1940July 19, 1940Aug. 1, 1940
June 2, 1941June 20, 1941Aug. 30, 1941Sept. 8, 1941
Mar. 9, 1942June 4, 1942June 7, 1942
Feb. 22, 1943Mar. 24, 1943June 4, 1943June 15, 1943
Mar. 17, 1944Mar. 19, 1944June 12, 1944June 18, 1944
July 14, 1945
Feb. 22, 1946July 9, 1946
Feb. 16 1947Mar. 21, 1947Mar. 21, 1947
June 4, 1948June 18, 1948 July 14, 1948
Mar. 26, 1950Apr. 2, 1950Apr. 7, 1950June 16, 1950July 1, 1950
Mar. 22, 1951Sept. 1, 1951
Gage height (feet)
3.833.853.383.344.11
3.883.323.484.92
-6.074.52
_b8.185.234.01
b8.84-
3.188.31
2.40
b5.013.55
-b!5.2613.39
5.853.49 4.05
-b7.903.834.092.93
-4.15
Discharge (cfs)
86088048645S
1,170
858450552
1,950
(a)3,6201,530
(a)6,3402,4301,040
-(a)440
8,350
91
0900520
(a)
24,600
2,640486 792
(a)04,0001,0401,350
428
(a)858
Water year
1952
1953
1954
1955
1956
1957
1958
1959
1960
1961
1962
1963
Date
Apr. 1, 1952
Mar. 10, 1953May 30, 1953June 4, 1953June 12, 1953June 19, 1953June 24, 1953June 29, 1953
Oct. 22, 1953Aug. 5, 1954Aug. 17, 1954Aug. 21, 1954
Mar. 9, 1955Apr. 4, 1955June 26, 1955July 6, 1955July 28, 1955
Mar. 4, 1956Mar. 19, 1956
Feb. 28, 1957Aug. 31, 1957
July 6, 1958
Mar. 7, 1959Mar. 13, 1959Mar. 18, 1959Mar. 22, 1959
Mar. 20, 1960
Sept. 11, 1961
Mar. 21, 1962June 15, 1962July 6, 1962July 15, 1962
Feb. 7, 1963Feb. 25, 1963Feb. 26, 1963June 6, 1963
Gage height (feet)
11.60
b3.938.414.673.794.134.795.43
3.385.527.003.77
b4.883.773.475.013.82
__
4.773.67
2.55
--
9.205.68
blO.51
4.19-
3.223.365.04
-b4.93
3.34
Discharge (cfs)
18,600
(a)8,2101,250
706912
1,4501,930
4362,7406,400
877
(a)550510
1,600667
(a)c960
(a)575
152
\ a l(a)
12,7004,130
d!3,000
1,720
(a)778958
3,190
cl,000-
(a)886
a Not known; probably exceeded base discharge.b Backwater from ice.c Maximum daily mean discharge.d About.
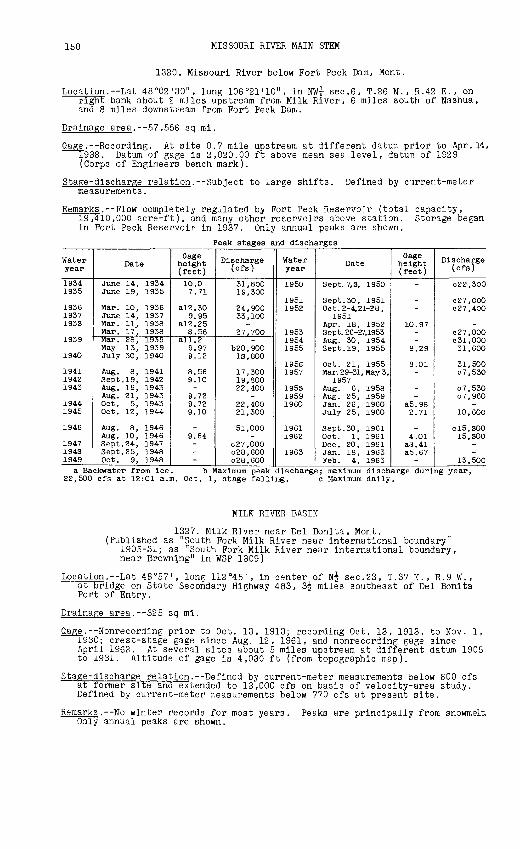
150 MISSOURI RIVER MAIN STEM
1320. Missouri River below Fort Peck Dam, Mont.
Location. Lat 48°02'30", long 106°21'10", in NW^ sec.6, T.26 N., R.42 E., on right bank about 2 miles upstream from Milk River, 6 miles south of Nashua, and 8 miles downstream from Port Peck Dam.
Drainage area. 57,556 sq mi.
Gage.--Recording. At site 0.7 mile upstream at different datum prior to Apr. 14, 1938. Datum of gage Is 2,020.00 ft above mean sea level, da tun of 1929 (Corps of Engineers bench mark).
Stage-discharge relation. Subject to large shifts, measurements.
Defined by current-meter
Remarks. Plow completely regulated by Port Peck Reservoir (total capacity,19,410,000 acre-ft), and many other reservoirs above station. Storage began in Port Peck Reservoir In 1937. Only annual peaks are shown.
Peak stages and discharges
Water year
19341935
19361937193S
1939
1940
194119421943
19441945
1946
1947194S1949
Date
June 14, 1934June 19, 1935
Mar. 10, 1936June 14, 1937Mar. llj 1938Mar. 17, 1938Mar. 28, 1939May 13, 1939July 30, 1940
Aug. 8, 1941Sept. 19, 1942Aug. 16, 1943Aug. 21, 1943Oct. 5, 1943Oct. 12, 1944
Aug. 8, 1946Aug. 10, 1946Sept. 24, 1947Sept. 25, 1948Oct. 9, 1948
Gage height (feet)
10.07.71
al2.309.95
al2.25S.56
all. 29.979.12
8.569.10-
9.729.729.10
_9.64---
Discharge (cfs)
31,30019,300
24,90033,100
-27,700
-b20,90013,800
17,30019,80022,400
-22 , 40021,300
51,000-
C27,000c28,600c28,600
Water year
1950
19511952
195319541955
19561957
195S19591960
19611962
1963
Date
Sept. 7,3, 1950
Sept. 30, 1951Oct. 2-4, 21-28,
1951Apr. 18, 1952Sept. 26-27,1953Aug. 30, 1954Sept. 19, 1955
Oct. 21, 1955Mar. 29-31, May 3,
1957Aug. 6, 1958Aug. 25, 1959Jan. 26, 1960July 25, 1960
Sept. 30, 1961Oct. 1, 1961Dec. 20, 1961Jan. 18, 1963Feb. 4, 1963
Gage height (feet)
-
_-
10.97--
8.29
8.01-
--
a5.982.71
_4.01
a8. 41a5. 67
-
Discharge (cfs)
C22,300
c27,000c27,400
-c27,000c31,00031,600
31,500c7,530
c7,530c7,960
-10,600
C15.SOO15,300
--
13,500a Backwater from ice. b Maximum peak discharge; maximum discharge during year,
22,500 cfs at 12:01 a.m. Oct. 1, stage falling. c Maximum daily.
MILK RIVER BASIN
1327. Milk River near Del Bonlta, Mont.(Published as "South Pork Milk River near International boundary"
1905-31; as "South Pork Milk River near international boundary, near Browning" in WSP 1309)
Location.--Lat 48°57', long 112°45', In center of N| sec.23, T.37 N., R.9 W. , at bridge on State Secondary Highway 483, 3| miles southeast of Del Bonlta Port of Entry.
Drainage area. 325 sq mi.
Gage.--Nonrecording prior to Oct. 13, 1913; recording Oct. 13, 1913, to Nov. 1, 1930; crest-stage gage since Aug. 12, 1961, and nonrecordlng gage since April 1962. At several sites about 5 miles upstream at different datum 1905 to 1931. Altitude of gage Is 4,030 ft (from topographic map).
Stage-dlscharKe relation. Defined by current-meter measurements below 600 cfs at former site and extended to 13,000 cfs on basis of velocity-area study. Defined by current-meter measurements below 770 cfs at present site.
Remarks .--No winter records for most years. Only annual peaks are shown.
Peaks are principally from snowmelt.

MILK RIVER BASIN 151
Peak stages and discharges of Milk River near Del Bonita, Mont.
Water year
1906 1907 1908
1913 1914 1915
1916 1917
1919
Date
May 31, 1906 June 23, 1907 June 6, 1908
May 16, 1911
Apr. 13, 1913 Apr. 12, 1914 June 25, 1915
Feb. 16, 1916 Apr. 8, 1917
Apr. 1, 1919
Gage height (feet)
5.9 8.90 15.4
6.55
5.7 4.80 6.9
8.6 6.42
3.14
Discharge (cfs)
629 1,940
al3,000
1,610
1,120 588
1,820
2,840 1,520
326
Water year
1923 1924
1927
1929 1930
1962
1963 1964
Date
June 22, 1923 June 8, 1924
Apr. 25, 1927
June 3, 1929 Mar. 28, 1930
Mar. 14, 1962 Mar. 20, 1962 Feb. 6, 1963 June 8, 1964
Gage height (feet)
3.62 4.96
7.60
3.77 5.90
b5.12 b5.10 9.0
Discharge (cfs)
487 1,230
3,290
597 1,570
aeoo765
17,300
a About.b Backwater from ice.
1330. Milk River at western crossing of international boundary(Published as "South Fork Milk River near international boundary"
prior to October 1961)
(International gaging station)
Location. --Lat 49°00'30", long 112°32'40", in NE^ sec.l, T.I, R.20 W., fourth meridian, on left bank half a mile north of international boundary, 22 miles upstream from North Milk Creek, and 23 miles southwest of Milk River, Alberta.
Drainage area. --397 sq mi.
Gage . - -Recording . At sites 0.4 and 0.5 miles downstream, respectively, at dif ferent datums Mar. 1, 1931, to Aug. 8, 1948, and Aug. 9, 1948, to Oct. 31, 1958. Altitude of gage is 3,820 ft (from topographic map).
Stage -dischare relation. 1931-48: Defined by current-meter measurements
2,300 cfs and by slope-area measurement at 3,860 cfs. current-meter measurements below 730 cfs.
1959-63: Defined by
Remarks . Station maintained Jointly by Canada and the United States. Seasonal records only. Peak flows are not materially affected by several smell di versions for irrigation above station. Peaks are principally from snowmelt. Base for partial-duration series, 340 cfs.
Peak stages and discharges
Water year
1931
1932
1933
1934
1935
1936
1937
1938
Date
Apr. 7, 1931
May 5, 1932
Apr. 29, 1933May 10, 1933May 16, 1933
Mar. 17, 1934Apr. 7, 1934May 7, 1934June 9, 1934June 27, 1934
Apr. 17, 1935
Apr. 11, 1936
Apr. 14, 1937Apr. 28, 1937June 13, 1937
Mar. 15, 1938Apr. 11, 1938Apr. 19, 1938May 19, 1938
Gage height (feet)
2.25
2.78
2.692.482.50
--
2.353.562.33
4.05
3.82
2.812.324.82
C5.26C2.702.402.45
Discharge (cfs)
275
435
495388397
(a)b635387
1,320364
1,790
1,560
664360
2,560
-b399396421
Water year
1938
1939
1940
1941
1942
1943
1944
1945
Date
May 23, 1938June 27, 1938
Mar. 25, 1939
July 4, 1940
June 13, 1941
Apr. 2, 1942Apr. 3, 1942Apr. 12, 1942May 26, 1942June 8, 1942
Apr. 3, 1943Apr. 10, 1943Apr. 16, 1943Apr. 29, 1943May 2, 1943June 8, 1943June 15, 1943
Apr. 4, 1944
June 7, 1945
Gage height ( feet )
2.302.72
c2.91
2.65
2.09
c4.203.602.722.783.00
03.592.522.502.332.552.872.56
C2.72
2.51
Discharge (cfs)
351562
(a)
540
293
-1,380
616624S16
-478452371490707524
blS8
426a Not known; probably exceeded base discharge. b Maximum daily, estimated, c Backwater from ice.

152 MILK RIVER BASIN
Peak stages and discharges of Milk River at western crossing of International boundary Continued
Water year
1946
1947
1948
1949
1950
1951
1952
1953
Date
Mar. 6, 1946May 30, 1946
Mar. 20, 1947Mar. 22, 1947Mar. 30, 1947Apr. 15, 1947Apr. 20, 1947Apr. 29, 1947May 4, 1947
Apr. 18, 1948May 8, 1948May 24, 1948June 5, 1948June 13, 1948June 18, 1948July 30, 1948
Apr. 7, 1949May 20, 1949
Apr. 17, 1950Apr. 21, 1950May 15, 1950May 24, 1950June 8, 1950June 19, 1950June 26, 1950July 3, 1950
Mar. 24, 1951Apr. 2, 1951Apr. 4, 1951May 1, 1951May 15, 1951May 26, 1951June 9, 1951June 21, 1951June 24, 1951July 2, 1951July 7, 1951July 10, 1951Aug. 31, 1951Sept. 3, 1951Sept. 26, 1951
Mar. 29, 1952Apr. 7, 1952Apr. 15, 1952Apr. 28, 1952May 5, 1952June 13, 1952
Apr. 22, 1953May 27, 1953June 4, 1953June 8, 1953
Gage height (feet)02.671.73
06.50C4.852.722.432.522.512.60
5.82-
3.012.762.956.832.00
clO.231.97
3.362.762.882.402.452.212.511.96
-06.573.873.142.832.002.982.015.603.002.373.112.511.932.03
-5.162.582.012.161.93
3.893.045.704.46
Discharge (cfs)
-141
-1,450
592411458452513
3,180(a)888736850
4,750342
b700368
1,400923
1,010653690520736363
(a)
1,4701,200
964382
1,080388
3,9301,170
6141,190
718348398
b862bl.100
779423504384
2,2201,2604,6002,930
Water year
1954
1955
1956
1957
1958
1959
1960
1961
1962
1963
1964
Date
Apr. 7, 1954Apr. 17, 1954May 13, 1954May 21, 1954June 11, 1954
Apr. 8, 1955Apr. 10, 1955Apr. 24, 1955May 2, 1955May 19, 1955June 26, 1955July 12, 1955
Mar. 27, 1956Apr. 17, 1956Apr. 22, 1956May 10, 1956May 18, 1956June 17, 1956July 4, 1956
Feb. 28, 1957Apr. 24, 1957May 5, 1957May 8, 1957May 15, 1957May 22, 1957June 10, 1957
Mar. 31, 1958Apr. 2, 1958Apr. 5, 1958Apr. 9, 1958May 14, 1958June 21, 1958
Mar. 29, 1959Apr. 4, 1959May 1, 1959May 19, 1959
Mar. 20, 1960Mar. 21, 1960May 2, 1960
Mar. 19, 1961May 18, 1961
Mar. 28, 1962Apr. 5, 1962Apr. 5, 1962Apr. 16, 1962
Feb. 6, 1963
June 9, 1964
Gage height (fset)
6.474.093.673.582.82
6.614.102.782.985.293.063.48
-2.882.773.223.123.013.84
3.882.813.293.342.823.262.86
5.5-
3.033.612.672.66
6.024.624.434.41
C7.09b6. 744/38
C5.794.07
-C6.684.714.40
C6.5
9.77
Discharge (cfs)
b3711,350
967897413
-1,350
353450
2,680572806
b514421355636570500
1,110
_393686720404666426
_b635541974374369
b364976875817
-d2,200
587
-431
d400-844600
b800
68,800
a Not known; probably exceeded base discharge. b Maximum dally, estimated, c Backwater from Ice. d About. e Annual peak only.
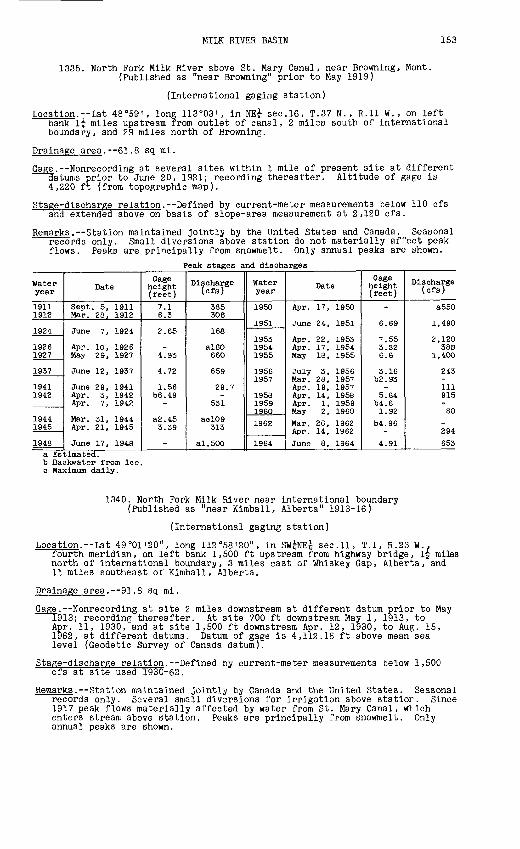
MILK RIVER BASIN 153
1335. North Fork Milk River above St. Mary Canal, near Browning, Mont. (Published as "near Browning" prior to May 1919)
(International gaging station)
Location. Lat 48°59', long 113°03', in NE^ sec.16, T.37 N., R.ll W., on left bank l£ miles upstream from outlet of canal, 2 miles south of international boundary, and 29 miles north of Browning.
Drainage area.--61.8 sq. mi.
Gage.--Nonrecordlng at several sites within 1 mile of present site at different daturas prior to June 20, 1921; recording thereafter. Altitude of gage is 4,220 ft (from topographic map).
Stage-discharge relation.--Defined by current-meter measurements below 110 cfs and extended above on basis of slope-area measurement at 2,120 cfs.
Remarks.--Station maintained jointly by the United States and Canada. Seasonal records only. Small diversions above station do not materially affect peak flows. Peaks are principally from snowmelt. Only annual peaks are shown.
Peak stages and discharges
Water year
1911 1912
1924
1926 1927
1937
1941 1942
1944 1945
1948
Date
Sept. 5, 1911 Mar. 28, 1912
June 7, 1924
Apr. 10, 1926 May 29, 1927
June 12, 1937
June 29, 1941 Apr. 3, 1942 Apr. 7, 1942
Mar. 31, 1944 Apr. 21, 1945
June 17, 1948
Gage height (feet)
7.1 6.3
2.65
4.93
4.72
1.56 b6.49
a2.45 3.39
Discharge (cfs)
385 306
168
al60 660
659
29.7
531
ac!09 313
al,500
Water year
1950
1951
1953 1954 1955
1956 1957
1958 1959 19601962
1964
Date
Apr. 17, 1950
June 24, 1951
Apr. 22, 1953 Apr. 17, 1954 May 18, 1955
July 3, 1956 Mar. 28, 1957 Apr. 19, 1957 Apr. 14, 1958 Apr. 1, 1959 May 2, 1960Mar. 26, 1962 Apr. 14, 1962June 8, 1964
Gage height (feet)
6.69
7.55 3. 32 6.6
3.16 b2.93
5.64 b4.6 1.92
b4.96
4.91
Discharge (cfs)
a550
1,490
2,120 383
1,400
243
111 915
SO
294 653
a Estimated.b Backwater from ice.c Maximum daily.
1340. North Fork Milk River near international boundary (Published as "near Kimball, Alberta" 1913-16)
(International gaging station)
Location.--Lat 49 "01'20", long 112°58'20", in SW^NE^- sec.11, T.I, R.23 W.,fourth meridian, on left bank 1,500 ft upstream from highway bridge, if miles north of international boundary, 3 miles east of Whiskey Gap, Alberta, and 11 miles southeast of Kimball, Alberta.
Drainage area. 91.8 sq mi.
Gage. Nonrecording at site 2 miles downstream at different datum prior to May 1913; recording thereafter. At site 700 ft downstream May 1, 1913, to Apr. 11, 1930, and at site 1,500 ft downstream Apr. 12, 1930, to Aug. 15, 1962, at different datums. Datum of gage is 4,112.16 ft above mean sea level (Geodetic Survey of Canada datum).
Stage-discharge relation. Defined by current-meter measurements below 1,500 cfs at site used 1930-62.
Remarks. Station maintained jointly by Canada and the United States. Seasonal records only. Several small diversions for irrigation above statior. Since 1917 peak flows materially affected by water from St. Mary Canal, wl ich enters stream above station. Peaks are principally from snowmelt. Only annual peaks are shown.

154 MILK RIVER BASIN
Peak stages and discharges of North Fork Milk River near international boundary
Water year
1911
191319141915
19161917191819191920
19211922192319241925
1926
1927192819291930
193119321933
19341935
1936193719381939
Date
June 25, 1911
Apr. 14. 1913Apr. 5, 1914Sept. 3, 1915
Feb. 16, 1916Apr. 9, 1917July 17, 1918May 9, 1919May 8, 1920
June 20, 1921Aug. 17, 1922June 22, 1923June 7, 1924Aug. 16, 1925
Oct. 1, 1925June 20, 1926May 29, 1927June 24, 1928June 2, 1929July 19, 1930
June 30, 1931June 16, 1932June 28, Aug . 24,
1933June 27, 1934July 28, 1935
May 28, 1936June 12, 1937June 26, 1938June 16, 1939
Gage height (feet)
6.06
5.034.484.60
-3.983.553.684.14
3.173.323.733.543.13
3.153.073.443.663.323.92
3.924.154.01
4.754.24
4.236.064.614.15
Discharge (cfs)
702
278517558
a700490427476898
473512676674590
544544771956727596
615708661
917745
7562,400
889716
Water year
1940
194119421943
19441945
19461947
1948
19491950
19511952
195319541955
1956195719581959
1960
1961196219631964
Date
July 27, 1940
June 3, 1941June 5, 1942Mar. 24, 1943June 13, 1943Aug. 8, 1944June 5, 1945
June 15, 1946Mar. 17, 1947July 19, 1947Apr. 16, 1948June 17, 1948May 17, 1949May 14,17, 1950
June 24, 1951Mar. 27, 1952Apr. 6, 1952June 3, 1953Aug. 26, 1954May 18, 1955
July 3, 1956May 21, 1957Apr. 12, 1958Mar. 21, 1959May 19, 1959June 20, 1960
Aug. 16, 1961Apr. 14, 1962June 22, 1963June 8, 1964
Gige height (feet)
4.07
3.994.30
14.713.723.663.89
3.7615.223.81
17.026.473.723.53
6.0515.164.145.173.323.95
3.983.283.55
13.833.593.26
3.513.416.257.98
Discharge (cfs)
730
705900-625595697
654-664-
2,950709635
al,650_892
1,680637988
1,020680842-856750
862782828
2,030
a Maximum daily; estimated, b Backwater from ice.
1345. Milk River at Milk River, Alberta
(International gaging station)
Location.--Lat 49°09', long 112°Q5< , in SE£ sec.28, T.2, R.16 W., fourth merid ian, on left bank 700 ft downstream from highway bridge at Milk River and 22 miles downstream from North Milk River.
Drainage area.--1,036 sq mi.
Gage.--Nonrecording prior to June 17, 1919; recording thereafter. At several sites about 1,000 ft upstream at datum 0.61 ft higher prior to Nov. 3, 1921. Datum of gage is 3,402.78 ft above mean sea level (Geodetic Survey of Canada datum).
Stage-discharge relation. Defined by current-meter measurements below 4,000 cfs and extended above on basis of area-velocity studies.
Remarks.--Station maintained jointly by Canada and the United States. Records prior to Oct. 1, 1920 (irrrigation season only), furnished by Canadian Depart ment of Resources and Development. Since 1917, peak flows have been affected by flow from St. Mary Canal during irrigation season. Several small di versions for irrigation. Peaks are principally from snowmelt. Only annual peaks are shown.
Peak stages and discharges
Water year
1909
1913 1914 1915
1916
Date
May 23, 1909
Apr. 14, 1913 Apr. 6, 1914 June 26, 1915
Feb. 17, 1916
Gage height (feet)
7.76
5.04 3.50 4.40
a8. 50
Discharge (cfs)
4,616
1,950 912
1,234
3,570
Water year
1917 1918 1919 1920
1921 1922
Date
Apr. 7, 1917 Mar. 28, 1918 May 10, 1919 Apr. 20, 1920
Apr. 3, 1921Apr. 30, 1922
Gage height (feet)
6.30 a3.80 3.055.84
4.74
Discharge (cfs)
3,326 1,000
752 3,064
bl.619cl,960
a Backwater from ice. higher Apr. 23, 1922.
b Maximum daily. c Maximum recorded; may have been

MILK RIVER BASIN 155
Peak stages and discharges of Milk River at Milk River, Alberta Continued
Water year
192319241925
19261927192819291930
19311932193319341935
19361937193819391940
194119421943
19441945
1946
Date
June 23, 1923Apr. 7, 1924Mar. 30, 1925
June 20, 1926May 22, 1927Mar. 21, 1928June 3, 1929Mar. 30, 1930
July 3, 1931May 5, 1932Apr. 24, 1933June 9, 1934Apr. 17, 1935
Apr. 11, 1936June 14, 1937Apr. 12, 1938June 16, 1939July 16, 1940
June 6, 1941Apr. 3, 1942Mar. 25, 1943Mar . 30 , Apr . 4,
1943May 21, 1944June 8, 1945
June 23, 1946
Qage height (feet)
4.005.045.15
3.3011.41a8. 074.98
a5.50
2.963.954.164.756.60
6.446.744.143.413.29
3.294.91
a7.59-
2.983.87
3.19
Discharge (cfs)
1,3202,0202,100
7708,7303,9001,9602,320
5701,2201,3301,7203,640
3,3603,8401,330
870783
7951,780
-1)1,460
6461,130
788
Water year
1947194819491950
19511952
19531954
1955
1956
1957
1958
1959
1960
19611962
19631964
Date
Mar. 22, 1947June 18, 1948May 21, 1949Apr. 17, 1950
June 25, 1951Mar. 28, 1952Mar. 30, 1952June 4, 1953Apr. 5, 1954Apr. 6, 1954Apr. 8, 1955May 19, 1955
Mar. 27, 1956July 4, 1956Mar. 1, 1957May 9, 1957Apr. 1, 1958Apr. 2, 1958Mar. 26, 1959May 20, 1959Mar. 20, 1960Mar. 21, 1960
May 18, 1961Mar. 20, 1962Apr. 16, 1962Feb. 7, 1963June 9, 1964
Gage height (feet)
8.329.053.745.14
8.80a9.12
_9.41
a7.38-
6.15-
a6.86-
a4.17-
a6.33_
a5.82-
a7.66-
3.42a5.02
-a4.2510.40
Discharge (cfs)
5,3306,1401,1202,080
5,860_
2,3807,200
-2,320
_3,430
-2,080
_1,350
-2,190
1,430_
2,900
1,070_
1,1001,0407,900
a Backwater from ice. b Maximum daily.
1350. Milk River at eastern crossing of international boundary
(International gaging station)
Location. Lat 48°59'50", long 110°35'30", in NE^ sec.6, T.37 N., R.9 E. , on right bank 500 ft south of international boundary, 500 ft downstrean from Canada Coulee, 30 miles north of Rudyard, Mont., and 37 miles south of Many Berries, Alberta.
Drainage area.--2.588 sq mi.
Gage.--Nonrecordlng at several sites within a quarter of a mile of present site at various daturas prior to Aug. 13, 1913. Nonrecording and recording gages at site 200 ft downstream at datum 2.34 ft lower Aug. 13, 1913, to June 13, 1917. Recording at present site and datum since June 13, 1917. Datum of gage is 2,698.4 ft above mean sea level (International Boundary Survey datum).
Stage-discharge relation.--Defined by current-meter measurements below 2,600 cfs.
Remarks.--Stations operated Jointly by the United States and Canada. Few winter records. Records prior to April 1913 furnished by Canadian Department of Re sources and Development. Peak flows are materially affected by diversions since 1917. Peaks are principally from snowmelt. Only annual peaks are shown.
Peak stages and discharges
Water year
1910 1911
1913 1914 1915
1917
1919 1920
1921 1922
Date
Mar. 25, 1910 June 27, 1911
Apr. 14, 1913Apr. 9, 1914 Mar. 24, 1915
Apr. 9, 1917
May 12, 1919 Apr. 22, 1920
Apr. 4, 1921 July 8, 1922
Gage height (feet)2.79 5.86
4.555.23
9.60
2.62 5.38
4.15 4.58
Discharge (cfs)
280 1,655
1,8581,065
al,750
4,860
789 3,960
1,770 1,910
Water year
1923 1924 1925
1926 1927 1928 1929 1930
1931 1932 1933 1934
Date
June 21, 1923 June 9, 1924 Mar. 24, 1925
June 23, 1926 May 23, 1927 Mar. 24, 1928 June 3, 1929 Mar. 31, 1930
July 31, 1931 June 16, 1932 Apr. 25, 1933 June 10, 1934
Gage height (feet)
6.28 4.20 7.09
2.71 10.16 7.30 4.42 4.90
3.02 4.71 3.69 4.06
Discharge (cfs)
4,100 1,800 2,000
817 8,400 5,400 2,580 3,000
1,100 2,940 1,820 2,270
a Maximum daily; estimated.

156 MILK RIVER BASIN
Peak stages and discharges of Milk River at eastern crossing of international boundary Continued
Water year
1935
19361937193819391940
19411942
194319441945
19461947194819491950
Date
Apr. 18, 1935
Apr. 13, 1936June 15, 1937Apr. 12, 1938Mar. 19, 1939Mar. 5, 1940
June 29, 1941Mar. 10, 1942Apr. 4, 1942Mar. 30, 1943Aug. 8, 1944Mar. 12, 1945June 9, 1945
June 5, 1946Mar. 23, 1947June 20, 1948May 23, 1949Apr. 19, 1950
Gage height (feet)
5.68
5.156.104.18
b5.42b4.43
4.08b6.2
-b6.762.86
b4.94-
4.13bll.28
7.853.354.08
Discharge (cfs)
3,380
2,8503,5301,9102,1401,410
1,820-
2,0203,310
705-
1,130
1,7408,7005,3501,1101,880
Water year
19511952
19531954
1955
19561957
1958
19591960
19611962
19631964
Date
June 27, 1951Mar. 28, 1952Mar. 31, 1952June 6, 1953Apr. 6, 1954Apr. 7, 1954July 12, 1955
July 6, 1956Mar. 2, 1957May 10, 1957Mar. 30, 1958Apr. 2, 1958Mar. 25, 1959Mar. 22, 1960
May 20, 1961Mar. 23, 1962Mar. 24, 1962June 28, 1963June 11, 1964
G\ge height (f.jet)
8.10b!3.65
-7.75
b^.76-
5.71
3.68b5.66
-bS.08
-3.09
b5.50
2.16-
b5.302.886.71
Discharge (cfs)
5,600-
9,5307,540
-al,6904,720
2,230-
1,380-
3,6001,7704,070
1,0801,480
-1,6207,770
a Maximum daily; estimated, b Backwater- from ice.
1355. Sage Creek at "Q" Ranch, near Wild Horse, Alberta
(International gaging station)
Location. Lat 49°07', long 110°13', in NW£ sec.9, T.2, R.2 W. , fourth meridian, in Alberta, on right bank 3^ miles north of "Q" Ranch building", ?i miles north of Wild Horse Customs Post at international boundary, an1 12f miles north of Simpson, Mont.
Drainage area. 175 sq mi.
Gage. Nonrecording at site 2 miles downstream at different datum prior to Sept. 24, 1935; recording thereafter. At site 100 ft upstream at datum 0.15 ft higher Sept. 24, 1935, to Oct. 31, 1951. Altitude of gage is 2,900 ft (from topographic map).
Stage-discharge relation. Defined by current-meter measurements below 1,800 cfs.
Remarks.--Station maintained Jointly by Canada and the United States. Records prior to 1952 furnished by Canadian Department of Resources an1 Development. Peaks are principally from snowmelt. Only peaks during season (generally March through October) are shown. Peak for year normally occurs during this period.
Peak stages and discharges
Water year
1936 1937 193S 1939 1940
1941
1943
1946 1947 1948 1949 1950
Date
Apr. 11, 1936 Apr. 11, 1937 Mar. 27, 1938 Mar. 22, 1939 Apr. 21, 1940
Mar. 20, 1941
Mar. 29, 1943
Mar. 12, 1946 Mar. 29, 1947 Apr. 17, 194S Apr. 2, 1949 Apr. 13. 1950
Gage height (feet)
8.50 15.87 14.82 12.76 11.95
blO.20
15.00
6.50 9.17 9.75 3.59 7.65
Discharge (cfs)
457 a3,500 2,840 1,760 1,370
825
2,950
260 568 688 55
342
Water year
1951 1952 1953 1954 1955
1956 1957 1958 1959 1960
1961 1962 1963
Date
Apr. 5, 1951 Apr. 14, 1952 June 3, 1953 Aug. 28, 1954 Apr. 19, 1955
July 7, 1956 Apr. 1, 1957 Apr. 5, 1958 Mar. 27, 1959 Mar. 21, 1960
Mar. 18, 1961 Mar. 27, 1962 July 5. 1963
Gage height (feet)
11.3713.12 9.91 6.95
13.06
7.81 9.72
bl?.98 9.13
10.57
3.26 bf.23 1C. 68
Discharge (cfs)
753 1,800
642 269
1,840
352 534
1,730 421 632
22.6 302 719
a Caused by failure of Elbow Coulee Dam. b Backwater from ice.

MILK RIVER BASIN 157
1370. Milk River above Havre, Mont.
Location. Lat 48°34', long 109°49', in SE^SW^ sec.32, T.33 N., R.15 E., a quar ter of a mile upstream from Big Sandy Creek and 6 miles west of Havre.
Drainage area. 3,826 sq mi.
Gage. Recording. Altitude of gage is 2,480 ft (from topographic map).
Stage-discharge relation. Large shifts occur. Defined by current-meter measurements.
Remarks. A few small diversions above station. Flow increased by diversion from St. Mary River during irrigation season. Peak flows may be materially affected. Only annual peaks are shown.
Peak stages and discharges
Water year
1928 1929 1930
Date
June 21, 1928 June 5, 1929 Apr. 1, 1930
Gage height (feet)
5.42 5.72 5.96
Discharge (cfs)
2,540 2,380 2,370
Water year
1931 1932 1933
Date
July 31, 1931 June 17, 1932 May 9, 1933
Gage height (feet)
5.33 6.15 5.27
Discharge (cfs)
1,420 2,520 1,390
1380. Sage Creek near Kremlin, Mont.
Location. Lat 48°28', long 110°06', in E^NE^ sec.12, T.31 N., R.12 E., 8 miles south of Kremlin and 16 miles upstream from mouth.
Drainage area. 914 sq mi.
Gage. Nonrecording prior to Feb. 22, 1946; recording thereafter. Altitude of gage is 2,680 ft (from topographic map).
Stage-discharge relation. Defined by current-meter measurements below 900 cfs and extended above on basis of slope-area measurement at 3,520 cfs.
Remarks. Peak flows affected by small storage reservoirs above station. Peaks are principally from snowmelt. Only annual peaks are shown.
Peak stages and discharges
Water year
1946 1947 1948 1949
Date
Feb. 25, 1946 Mar. 19, 1947 July 13, 1948
Gage height (feet)
1.91 7.23 2.05
Discharge (cfs)
4.5 942
8.4 0
Water year
1950
1951 1952
Date
Mar. 24, 1950
Mar. 23, 1951 April 1952
Gage height (feet)
4.59
4.52 11.84
Discharge (cfs)
207
alOO 3,520
a Maximum daily.
1385. Big Sandy Creek near Box Elder, Mont.
Location.--Lat 48°22', long 109°59', in NE£ sec.13, T.30 N., R.13 E., just below mouth of Sage Creek at Cowan Ranch and 3 miles north of Box Elder.
Drainage area.--1,629 sq mi.
Gage. Nonrecording. At site half a mile upstream on spillways of Cowan Dam at different datums prior to Mar. 7, 1928. Altitude of gage is 2,620 ft (from topographic map).
Stage-discharge relation. Defined by current-meter measurements below 150 cfs and extended above on basis of flow-over-dam measurement at 2,000 cfs at site used prior to Mar. 7, 1929. Defined by current-meter measurements below 350 cfs at described site.
Remarks. Some regulation by small storage dam and some diversions for irri- gation above station. Most annual peak flows are probably materially affected. Only annual observed peaks are shown, except as noted.
219-848 O - 66 - 12

158 MILK RIVER BASIN
Peak stages and discharges of Big Sandy Creek near Box Elder, Mont.
Water year
1927 1928 1929 1930
1931 1932
Date
May 24, 1927 Mar. 25, 1928June 8, 1929 Mar. 24, 1930
Jan. 29, 1931 Aug. 27, 1932
Gage height (feet)5.85
10.968.59 6.70
4.72 6.70
Discharge (cfs)
2,000 338206 15074
150
Water year
1934 1935
19361938
Date
Apr. 3, 1934 Oct. 26, 1934
Apr. 13, 1936 June 25, 1938
G£ge height (feet)
2.71 £.37
3.91 IE. 91
Discharge (cfs)
11.6 .8
36.5 a561
a Momentary maximum.
1395. Big Sandy Creek near Assinniboine, Mont.
Location. Lat 48°32', long 109°50', in SW£SW£ sec.18, T.32 N. , R.15 E.,2 miles northwest of Assinniboine, 7 miles upstream from mouth, and 16 miles downstream from Sage Creek.
Drainage area.--1,805 sq mi.
Gage.--Recording gage and concrete control. Altitude of gage is £.510 ft (by barometer).
Stage-discharge relation. Defined by current-meter measurements telow 4,400 cfs.
Remarks.--Diversions for irrigation of about 1,000 acres above station do not materially affect peak flows. Peaks are principally from snowmelt. Only annual peaks are shown.
Peak stages and discharges
Water year
194619471948194919501951195219531955
Date
Feb 27, 1946Mar 21, 1947Mar 22, 1948Mar 31, 1949Mar 29, 1950Mar 23, 1951Apr 3, 1952June 6, 1953
Apr. 11. 1955a Maximum dally.
Gage height (feet)
-9.68_-
3.885.01
14.706.56
6.48
Discharge (cfs)
a8 62,080
a!7a5
208391
5,570714698
b Backwater from Ice
Water year
19561957195819591960196119621963
Date
Mar 30, 1956Peb 28, 1957Mar 28, 1958Mar 11, 1959Mar 25, 1960June 3, 1961June 12, 1962Peb. 6, 1963
Ga-re height (fe^t)
b6.47b5.13
-7. SO4.13.642.542.16
Discharge (cfs)
c 5500250c 5001,100215
1326.1
c Approximate .
1405. Milk River at Havre, Mont.
Location.--Lat 48°33'30", long 109°40'10", in SE^SE^- sec.5, T.32 If., R.16 E., on upstream side of highway bridge on 7th Avenue East in Havre, 30 ft down stream from Bullhook Creek, 9 miles downstream from Big Sandy Creek, and 17 miles downstream from Presno Dam.
Drainage area.--5.84q sq mi,of which 5,174 sqmi contributes directly to surface runoff.
Gage.--Nonrecording. At site half a mile upstream at different datum prior to Nov. 2, 1902. At datum 0.47 ft higher Nov. 4, 1902, to Nov. 2E, 1910. At present datum Mar. 9, 1911, to July 13, 1920, and at datum 4.00 ft higher July 14, 1920, to Sept. 30, 1922. Datum of gage is 2,461.11 ft above mean sea level, datum of 1929 (levels by Corps of Engineers).
Stage-discharge relation. Defined by current-meter measurements below 5,200 cfs at site half a mile upstream and extended to 20,000 cfs by logarithmic plotting. Defined below 7,800 cfs at pref°nt site. Subject to large shifts.
Historical data.--Flood of 1899 is highest known. Flood of Apr. 3, 1952, is probably highest since 1899.
Remarks.--Bullhook Creek flood-control project is designed to bypass damaging floods to Milk River channel several miles downstream. Diversion for irri gation of about 6,000 acres above station. Since 1917 flow has been in creased during irrigation seasons by St. Mary Canal. Flow regulated by Fresno Reservoir (usable capacity, 127,200 acre-ft) since 1939. Only an nual peaks are shown.

MILK RIVER BASIN 159
Peak stages and discharges of Milk River at Havre. Mont.
Water year
1899 1900
1901 1902 1903 1904 1905
1906 1907 1908 1909 1910
1911 1912 1913 1914 1915
1916
Date
Apr. 12, 1899 May 17, 1900
May 4, 1901 July 1, 1902May 30, 1903 Apr. 7,13, 1904 July 29, 1905
June 8, 1906 Mar. 24, 1907 June 9, 1908 May 25, 1909 Mar. 4, 1910
Sept. 7, 1911 Mar. 29, 1912 Apr. 15, 1913 Mar. 14, 1914 Mar. 24, 1915
Mar. 12, 1916
Gage height (feet)
15.5 5.2
6.20 12.18.50 9.30 5.0
9.9 10.1 16.5 11.7 4.5
10.3 14.5 9.7 8.0 10.8
b!7.2
Discharge (cfs)
a20,000 1,650
2,540 9,9604,120 4,900
366
4,150 3,750 11,000 5,360 1,860
2,980 7,790 2,540 1,080 3,640
Water year
1917 1918 1919 1920
1921 1922
1952 1953
1955
1956 1957 1958 1959 1960
1961 1962 1963
Date
Apr. 11, 1917 Mar. 20, 1918 May 13, 1919 Apr. 22, 1920
Apr. 6, 1921 July 9, 1922
Apr. 3, 1952 June 6, 1953
May 23, 1955
July 19, 1956 July 26, 1957 May 21, 1958 Aug. 1, 1959 July 18, 1960
July 15, 1961 July 5, 1962 June 4, 1963
Gage height (feet)15.3 16.42 7.6
11.2
5.05 6.46
18.6 16.54
11.24
9.56 9.81 9.84 10.32 9.98
9.53 9.15 8.79
Discharge (cfs)
8,090 9,150
686 4,090
1,450 3,340
11,400 6,900
2,670
1,280 1,280 1,410 1,980 1,630
1,280 1,180 1,010
a About.b Backwater from ice.
1430. Milk River at Lohman, Mont.
Location.--Lat 48°36 I , long 109°24 1 , in SE^ sec.20, T.33 N., R.18 E., on right bank half a mile downstream from Fort Belknap diversion dam and three- quarters of a mile north of Lohman.
Drainage area.--6,166 sq mi.
Gage.--Nonrecording at site a quarter of a mile downstream at different datum prior to Jan. 7, 1934- recording thereafter. Altitude of gage is 2,420. ft (from topographic map).
Stage-discharge relation.--Large shifts occur. Defined by current-meter meas- urements below 3,200 cfs at described site.
Remarks. Flow regulated by Fresno Reservoir (usable capacity, 127,200 acre-ft) since 1939. Diversion for irrigation of about 6,000 acres above station. Only annual peaks are shown.
Peak stages and discharges
Water year
1919
1923
1925
1934 1935
1936 1937 1938 1939 1940
1941
Date
May 13, 1919
June 23, 1923
Mar. 24, 1925
June 12, 1934 Mar. 16, 1935 Apr. 20, 1935
Apr. 15, 1936 June 16, 1937 June 23, 1938 Mar. 21, 1939 Mar. 4, 1940 June 11, 1940
Mar. 8, 1941 June 29, 1941
Gage height (feet)
8.45
13.00
13.20
7.52 a9.55
10.18 11.24 11.90 12.08 a8.ll
b6.18
Discharge (cfs)
580
3,270
3,290
1,760
b3,000
2,260 2,680 3,230 3,450
660
699
Water year
1942 1943 1944
1945
1946
1947 1948
1950
1951
1952
Date
July 29, 1942 Mar. 26, 1943 Mar. 20, 1944 July 26, 1944 Mar. 12, 1945 July 22, 1945
Feb. 26, 1946 Aug. 1, 1946 Mar. 22, 1947 June 22, 1948
Apr. 2, 1950 June 8, 1950
Mar. 23, 1951 May 19, 1951
Gage height ( feet )
7.77 al2.66 a7.00
a9.44
a6.78
a!4.63 11.15
a9.51
a9.28
17.9
Discharge (cfs)
1,340
556
739
664 b3,000 2,450
1,090
1,480
a Backwater from ice.b Maximum daily; estimated.

160 MILK RIVER BASIN
1445. Lodge Creek at international boundary (Published as "at Willow Creek Police Detachment" April 1910
to October 1951)
(International gaging station)
Location. Lat 49°01', long 109°45', In SE£ sec.12, T.I, R.29 W., third merid ian, In Saskatchewan, on right bank 1 mile north of International boundary, ij miles upstream from McRae Creek, and 31 miles north of Havre, Mont.
Drainage area. 753 sq mi.
Gage. Nonrecording prior to May 7, 1919; recording thereafter. At datum0~.12 ft higher Mar. 17 to Nov. 15, 1911. Datum of gage is 2,721.06 ft above mean sea level (International Boundary Survey datum).
Stage-discharge relation. Defined by current-meter measurements below 4,000 cfs.
Remarks. Station maintained Jointly by Canada and the United Stetes. Only a few winter records collected. Records prior to Apr. 1, 1917, furnished by Canadian Department of Resources and Development. Peak flows materially af fected by storage reservoirs since 1937. Some effect prior tc this date by diversions. Peaks are principally from snowmelt. Only annual peaks are shown.
Peak stages and discharges
Water year
19111912191319141915
19171918
19191920
19211922192319241925
19261927192819291930
1931
Date
Sept. 6, 1911Apr. 5, 1912Apr. 12, 1913Mar. 16, 1914Apr. 2, 1915
Apr. 10, 1917-
Mar. 31, 1918Apr. 20, 1919June 18, 1920
Apr. 16, 1921Apr. 8, 1922June 22, 1923June 9, 1924Apr. 24, 1925
May 2, 1926May 23, 1927Mar. 23, 1928May 1, 1929Mar. 12, 1930
July 1, 1931
Gage height (feet)
9.5412.807.895.257.18
10.13al3.45
-4.196.50
7.1410.668.515.678.77
a7.6112.41
a!2 . 607.10
a6.30
3.13
Discharge (cfs)
2,2204,0901,481
5601,439
2,100-
b2 , 700338
1,030
1,1102,7401,520
7291,690
6503,6803,5001,080
797
164
Water year
1932193319341935
19361937193819391940
19411942194319441945
19461947194819491950
19511952
Date
Apr. 3, 1932Mar. 20, 1933Mar. 3, 1934Mar. 16, 1935
Apr. 11, 1936Apr. 10, 1937Mar. 2S, 1938Mar. 23, 1939Apr. 21, 1940
Mar. 20, 1941June 27, 1942Mar. 30, 1943July 6, 1944Mar. 20, 1945
Mar. 29, 1946Mar. 28, 1947Apr. 18, 194SApr. 8, 1949Apr. 14, 1950
Aug. 30, 1951Apr. 13, 1952
Q-"Ke height (feet)
5.664.88
a8.206.63
a8. 309.767.82
11.9312.22
all. 149.21
13.835.45
a"5.S6
4.3S6.976.722.368.32
10.7613.71
Discharge (cfs)
628459_913
1,5302,2001,2603,6103,610
2,2301,8805,110
575679
3581,020
87359
1,480
2,6004,990
a Backwater from Ice. b Maximum dally.
1450. McRae Creek at international boundary (Formerly published as "McRae Coulee")
(International gaging station)
Location. Lat 49°01'00", long 109°43'10", in SW£ sec.8, T.I, R.23 W., third meridian, on right bank three-quarters of a mile upstream from mouth, l£ miles north of international boundary, and 31 miles north of Havre, Mont.
Drainage area. 59.0 sq mi.
Gage. Nonrecording prior to Sept. 28, 1927; recording thereafter. Altitude of gage is 2,750 ft (from topographic map).
Stage-discharge relation. Defined by current-meter measurements below 500 cfs.
Remarks. Station maintained jointly by Canada and the United States. Few "winter records. Peaks are principally from snowmelt. Only annual peaks are
shown.

MILK RIVER BASIN 161
Peak stages and discharges of McRae Creek at International boundary
Water year
1927192819291930
19311932193319341935
19361937193819391940
Date
May 23, 1927Apr. 2, 1928
-Mar. 26, 1930
June 30, 1931Mar. 24, 1932June 29, 1933Mar. 3, 1934July 21, 1935
Apr. 12, 1936Apr. 1, 1937Mar. 27, 1938Mar. 23, 1939Apr. 19, 1940
Gage height (feet)
5.744.42-
4.40
4.15a2.351.88
a7.935.64
6.764.885.735.586.90
Discharge (cfs)
379166
0172
15012.74-
361
589216377350621
Water year
19411942194319441945
19461947194819491950
19511952
Date
Mar. 21, 1941June 6, 1942Mar. 29, 1943July 5, 1944Mar. 19, 1945
Mar. 11, 1946Mar. 30, 1947
--
Apr. 7, 1950
Apr. 10, 1951Apr. 7, 1952
Gage height (feet)
7.032.988.347.804.30
3.405.81--
6.23
a4.718.75
Discharge (cfs)
51241.0
976826126
57372
00
475
1901,160
a Backwater from Ice.
1455. Lodge Creek below McRae Creek, at international boundary (Published as "below McRae Coulee" prior to March 1962)
(International gaging station)
Location.--Lat 49°00'20", long 109°43'05", in SW£ sec.5, T.I, R.28 W., third meridian, in Saskatchewan, on right bank a quarter of a mile downstream from McRae Creek, 0.4 mile north of international boundary, three-quarters of a mile northwest of Willow Creek Customs Post, and 31 miles north of Havre, Mont.
Drainage area. 818 sq mi.
Gage. Recording. Datum of gage is 2,731.0 ft above mean sea level (Inter national Boundary Survey datum).
Stage-discharge relation. Defined by current-meter measurements below 5,400 cfs.
Historical data.--Flood of June 14, 1962, is probably the highest since 1910.
Remarks. Station maintained jointly by Canada and the United States. Seasonal records only. Peak flows affected by storage reservoirs and diversions above station. Peaks are principally from snowmelt. Only annual peaks are shown.
Peak stages and discharges
Water year
1952
1953 1954 1955
1956 1957
Date
Apr. 7, 1952 Apr. 13, 1952 June 4, 1953 Apr. 6, 1954 Apr. 19, 1955
July 4, 1956 Apr. 5, 1957
Gage height (feet)
a!2.73
9.20 5.61
10.33
5.23 a6.71
Discharge (cfs)
5,570 2,410
629 3,350
577
Water year
1957 1958 1959 1960
1961 1962 1963
Date
Apr. 5, 1957 Apr. 5, 1958 Mar. 28, 1959 Mar. 24, 1960
Apr. 25, 1961 June 14, 1962 July 9, 1963
Gage height (feet)
a9.97 a5.87 7.05
2.93 14.40 4.15
Discharge (cfs)
796 2,720
706 1,000
134 7,760
219a Backwater from Ice.

162 MILK RIVER BASIN
1480. Battle Creek above Cypress Lake west inflow canal, rear West Plains , Saskatchewan
(International gaging station)
Location. Lat 49°26', long 109°41', in NE^ sec.34, T.5, R.28 W., third merid ian, on right bank 1^ miles north of West Plains and 10 miles north of Senate.
Drainage area. 270 sq mi.
Gage. Recording. At site 1^ miles downstream at different datum prior to Oct. 13, 1939. Altitude of gage is 3,230 ft (information furrished by Department of Northern Affairs and National Resources, Canada).
Stage-discharge relation. Large shifts occur. Defined by current-meter meas- urements below 1,500 cfs and extended above by slope-area measurement at 1,500 cfs.
Remarks. Station maintained jointly by Canada and the United States. Seasonal records only. Records for 1939-46 furnished by Canadian Department of Re sources and Development. Small diversions for irrigation do rot materially affect peak flows. Peaks are principally from snowmelt. Only annual peaks are shown.
Peak stages and discharges
Water year
19391940
19411942194319441945
1946194719481949
1950
Date
Mar. 22. 1939Apr. 23, 1940
July 1, 1941June 26, 1942Mar. 30, 1943Apr. 1, 1944Mar. 2S, 1945
Mar. 29, 1946Apr. 14, 1947Apr. 24, 1948Apr. 8, 1949Apr. 10, 1949Apr. 16, 1950Apr. 22, 1950
Gage height (feet)
a6.759.29
5.107.60
a9.225.835.12
6.37a5. 447.62
a2.78-
a6.87-
Discharge (cfs)
2351,460
379782855237344
571450817_106-590
Water year
19511952195319541955
19561957195819591960
19611962
1963
Date
Apr. 29, 1951Apr. 14, 1952June 5, 1953May 8, 1954Apr. 11, 1955
Apr. 16, 1956May 2, 1957Apr. 1, 1958Apr. 15, 1959Mar. 20, 1960
Mar. 31, 1961Apr. 7, 1962Apr. 16, 1962Mar. 30. 1963
Gige height (feet)
8.4710.009.785.34
a9.69
a4.067.68
87.905.10
a°.56
3.08
a3.796.43
Discharge (cfs)
965b3,0202,360
3741,280
199731475305593
66C74
d300a Backwater from ice. b Does
Lodge Creek. c Maximum daily.not Include about
d Approximate700 to 1,000 cfs overflow into
1495. Battle Creek at international boundary
(International gaging station)
Location.--Lat 49°00'10", long 109°25'20", in SE£ sec.4, T.I, R.26 W., third meridian, on left bank 600 ft north of international boundary in Saskatche wan, 8 miles upstream from Woodpile Coulee, and 30 miles north of Chinook, Mont.
Drainage area. 931 sq mi.
Gage. Recording. Datum of gage is 2,729.8 ft above mean sea level (Inter national Boundary Survey datum, adjustment of 1928).
Stage-discharge relation. Defined by current-meter measurements below 4,400 cfs.
Remarks. Station maintained jointly by Canada and the United States. Onlyseasonal records in most years. Maximum flows materially affe?ted by storage reservoirs, diversion for irrigation, and return flow from irrigated areas. Peaks are principally from snowmelt. Only annual peaks are shown.

MILK RIVER BASIN 163
Peak stages and discharges of Battle Creek at International boundary
Water year
1917191819191920
19211922192319241925
19261927192819291930
193119321933
1934
1935
19361937193819391940
Date
Apr. 13, 1917Mar. 31, 1918Apr. 17, 1919May 11, 1920
Apr. 17, 1921Apr. 25, 1922June 25, 1923Apr. 11, 1924Apr. 2, 1925
Apr. 14, 1926Apr. 4, 1927Apr. 3, 1928Apr. 26, 1929Apr. 2, 1930
Apr. 7, 1931Apr. 6, 1932Mar. 27, 1933Apr. 22, 1933Mar. 3, 1934Apr. 9, 1934Apr. 21, 1935
Apr. 12, 1936Apr. 8, 1937Mar. 26, 1938Mar. 22, 1939Apr. 21, 1940
Gage height (feet)
8.50-
3.465.08
4.715.613.943.816.38
4.057.02
09.505.07
05.8
2.914.10
C4.32-
05.16-
5.30
7.844.975.096.887.60
Discharge (cfs)
3,200a2 , 500
165923
6901,060
341269
1,430
b3262,0102,320
7631,070
66418-310-324910
2,710740800
1,8302,290
Water year
19411942194319441945
19461947194819491950
19511952195319541955
1956
19571958
19591960
196119621963
Date
Mar. 21, 1941June 28, 1942Mar. 29, 1943Aug. 25, 1944Mar. 20, 1945
Mar. 11, 1946Mar. 28, 1947Apr. 14, 1948May 27, 1949Apr. 12, 1950
May 2, 1951Apr. 15, 1952June 8, 1953Apr. 5, 1954Apr. 9, 1955July 12, 1955
Mar. 27, 1956Mar. 28, 1956Apr. 1, 1957Mar. 29, 1958Apr. 3, 1958Mar. 26, 1959Mar. 23, 1960
Mar. 15, 1961Mar. 26, 1962July 6, 1963
Gage height (feet)
07.134.7308.635.204.23
4.31C5.0704.972.786.28
4.6010.565.57
07.9907.30
_05.14a6.84C7.21
C5.5606.25
07.43cS.253.55
Discharge (cfs)
1,720619
2,870859398
43750049339.7
1,480
5615,820
9521,720
_1,920
a200
655
1,020775
dl,000
1,290648210
a Maximum daily mean discharge, period of no record Nov. 1 to Mar.
b Maximum recorded; probably e 23. c Backwater from ice.
xceeded during d About.
1500. Woodpile Coulee near international boundary
(International gaging station)
Location.--Lat 48°59'00", long 109°31'50", in NW^ sec.8, right bank 600 ft downstream from Antelope Coulee, 1-q:national boundary, Mont.
T.37 N., R.17 E. , onAntelope Coulee, It miles south of inter-
7 miles upstream from mouth, and 30 miles north of Havre,
Drainage area. 60.2 sq mi.
Gage.--Nonrecording at site 4 miles downstream at different datum prior to Aug. 27, 1927; recording thereafter. Altitude of gage is 2,740 ft (from topographic map).
Stage-discharge relation. Defined by current-meter measurements below 330 cfs and extended above on basis of slope-area measurement at gage height 8.50 ft.
Remarks. Station maintained jointly by the United States and Canada. Only seasonal records in most years. Peaks are principally from snowmelt. Only annual seasonal peaks are shown. Maximum for year generally occurs during season.
Peak stages and discharges
Water year
1927192819291930
1932193319341935
19361937193819391940
Date
Apr. 4, 1927Apr. 2, 1928June 2, 1929Apr. 2, 1930
Mar. 23, 1932June 29, 1933Mar. 20, 1934Apr. 12, 1935
Apr. 13, 1936Apr. 9, 1937Mar. 27, 1938Mar. 22, 1939Apr. 18, 1940
Gage height (feet)
16.695.042.144.70
a2.822.57
a2.ll6.04
7.115.715.817.877.39
Discharge (cfs)
42335235.8
280
45.761-
591
1,220490551
2,1501,530
Water year
19411942194319441945
19461947194819491950
195119521953
Date
Mar. 22, 1941Mar. 31, 1942Mar. 30, 1943Aug. 25, 1944Mar. 19, 1945
Mar. 11, 1946Mar. 29, 1947
--
Apr. 13, 1950
Apr. 5, 1951Apr. 7, 1952May 1, 1953
Gage height (feet)
a7.784.368.68.504.98
4.305.89--
7.13
5.438.51.95
Discharge (cfs)
1,770204
3,0902,960
293
206547
00
1,160
3692,960
-
a Backwater from ice.
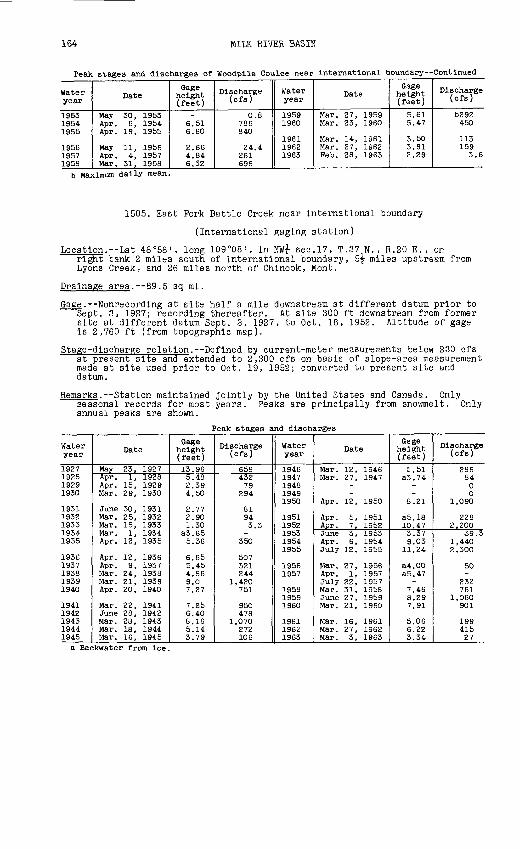
164 MILK RIVER BASIN
Peak stages and discharges of Woodpile Coulee near international boundary Continued
Water year
1953 1954 1955
1956 1957 1958
Date
May 30, 1953 Apr. 6, 1954 Apr. 19, 1955
May 11, 1956 Apr. 4, 1957 Mar. 31, 1958
Gage height (feet)
6.51 6.60
2.66 4.84 6.32
Discharge (cfs)
0.8 786 840
24.4 261 696
Water year
1959 1960
1961 1962 1963
Date
Mar. 27, 1959 Mar. 23, 1960
Mar. 14, 1961 Mar. 27, 1962 Feb. 28, 1963
Gage height (feet)
5.61 5.47
3.50 3.91 2.29
Discharge (cfs)
b292 450
113 159 3.6
b Maximum daily mean.
1505. East Pork Battle Creek near international boundary
(International gaging station)
Location. Lat 48°58' , long 109°08', in NW^ sec.17, T.37 N., R.20 E., onright bank 2 miles south of international boundary, 5f miles upstream from Lyons Creek, and 26 miles north of Chinook, Mont.
Drainage area. 89.5 sq mi.
Gage.--Nonrecording at site half a mile downstream at different datum prior to Sept. 3, 1927; recording thereafter. At site 300 ft downstrean from former site at different datum Sept. 3, 1927, to Oct. 18, 1952. Altitude of gage is 2,760 ft (from topographic map).
Stage-discharge relation. Defined by current-meter measurements below 230 cfs at present site and extended to 2,300 cfs on basis of slope-area measurement made at site used prior to Oct. 19, 1952; converted to present site and datum.
Remarks. Station maintained jointly by the United States and Canada. Only seasonal records for most years. Peaks are principally from snowmelt. Only annual peaks are shown.
Peak stages and discharges
Water year
1927192819291930
19311932193319341935
19361937193819391940
19411942194319441945
Date
May 23, 1927Apr. 1, 1928Apr. 15, 1929Mar. 29, 1930
June 30, 1931Mar. 25, 1932Mar. 15, 1933Mar. 1, 1934Apr. 12, 1935
Apr. 12, 1936Apr. 9, 1937Mar. 24, 1938Mar. 21, 1939Apr. 20, 1940
Mar. 22, 1941June 28, 1942Mar. 28, 1943Mar. 18, 1944Mar. 16, 1945
Gage height (feet)
13.965.482.394.50
2.772.901.30
a3.655.36
6.655.454.869.07.27
7.S56.408.165.143.79
Discharge (cfs)
65843279
294
81943.3
-350
507321244
1,420751
950478
1,070272106
Water year
19461947194819491950
19511952195319541955
19561957
195819591960
196119621963
Date
Mar. 12, 1946Mar. 27, 1947
--
Apr. 12, 1950
Apr. 5, 1951Apr. 7, 1952June 3, 1953Apr. 6, 1954July 12, 1955
Mar. 27, 1956Apr. 1, 1957July 22, 1957Mar. 31, 1958June 27, 1959Mar. 21, 1960
Mar. 16, 1961Mar. 27, 1962Mar. 3, 1963
Gage height (feet)
E.51a3.74
--
8.21
a5.1810.473.379.03
11.24
a4.00a5. 47
-7.468.297.91
5.066.223.34
Discharge (cfs)
2868400
1,090
2282,200
39.31,4402,300
50-
232761
1,060901
19941527
a Backwater from ice.

MILK RIVER BASIN 165
1510. Lyons Creek at international boundary (Published as "Lyons Coulee" prior to March 1962)
(International gaging station)
Location. Lat 49°00', long 109°14', in NW^ sec.l, T.I, R.25 W. , third neridian, on right bank half a mile north of international boundary, 8 miles south of Arena, Saskatchewan, and 28 miles north of Chinook, Mont.
Drainage area.--66.7 sq mi.
Gage. Nonrecording prior to Aug. 5, 1958; recording thereafter. At site half a mile south of international boundary at different datum prior to Oct. 19, 1935. At site H miles north of international boundary at different datum Oct. 19, 1935, to Oct. 31, 1940. Altitude of gage is 2,800 ft (from inter national boundary map).
Stage-discharge relation.--Defined by current-meter measurements below 600 cfs.
Remarks. Station maintained jointly by Canada and the United States. Only seasonal records in most years. Small stockwater dams above station do not materially affect peak flows. Peaks are principally from snowmelt. Only annual peaks are shown.
Peak stages and discharges
Water year
1927 1928 1929 1930
1931 1932 1933 1934 1935
1936 1937 1938 1939 1940
1941 1942 1943 1944 1945
Date
Apr. 3, 1927 Apr. 2, 1928 June 11, 1929 Apr. 2, 1930
June 10, 1932
Mar. 3, 1934 Apr. 13, 1935
Apr. 12, 1936 Apr. 9, 1937 Mar. 25, 1938 Mar. 23, 1939 Apr. 21, 1940
Mar. 21, 1941 June 29, 1942 Mar. 29, 1943 Mar. 17, 1944 Mar. 23, 1945
Gage height (feet)
7.65 aY.80 3.88
a7.20
3.83
5.14 6.80
6.75 5.1 4.89 7.16 8.26
5.45 4.4S 5.25 3.43 2.43
Discharge (cfs)
668 557 28.1
437
0 25 0
115 452
504 184 145 604 909
409 212 322 103 14.5
Water year
1946 1947 1948 1949 1950
1951 1952 1953 1954 1955
1956 1957 1958 1959 1960
1961 1962 1963
Date
June 5, 1946 Mar. 29, 1947
Apr. 13, 1950
Apr. 5, 1951 Apr. 7, 1952
Apr. 6, 1954 July 6, 1955
Apr. 4, 1956 Apr. 1, 1957 Mar. 31, 1958 Mar. 26, 1959 Mar. 23, 1960
Mar. 15, 1961 June 14, 1962 Feb. 27, 1963
Gage height (feet)
5.75 3.10
7.76
a3.98 7.4
6.38.38
2.94 3.50 3.92 3.97 4.53
3.90 4.07 2.63
Dis charge (cfs)
488 65 0 0
945
140 940 0
645 1,220
19.1 122 234 245 295
184 188 17
a Backwater from ice.
1515. Battle Creek near Chinook, Mont. (Published as "North Fork Milk River" prior to 1913)
Location. Lat 48°39', long 109°14', near center of sec.3, T.33 N., R.19 E., at county road bridge, 3f miles north of Chinook and 7 miles upstream from mouth.
Drainage area. 1,539 sq mi.
Gage. Nonrecording. At site 500 ft upstream prior to Apr. 8, 1918. Altitude of gage is 2,410 ft (from topographic map).
Stage-discharge relation. Defined by current-meter measurements below 7,300 cfs and extended above on basis of slope-area measurement at 9,540 cfs.
Remarks. Many diversions above station. Peaks are principally from srowmelt. Only annual maximum observed stages and discharges are shown.
Peak stages and discharges
Water year
1905
1906 1907 1908
Date
July 26, 1905
June 8, 1906 Apr. 10, 1907 Apr. 17, 1908
Gage height (feet)2.70
16.63 10.4 2.12
Discharge (cfs)
392
10,960 3,800
190
Water year
1909 1910
1911 1912
Date
June 21, 1909 Mar. 14, 1910
Sept. 7, 1911 Apr. 8, 1912
Gage height (feet)
13.04.47
10.0 13.0
Discharge (cfs)
6,650 991
3,220 6,650

166 MILK RIVER BASIN
Peak stages and discharges of Battle Creek near Chinook, Mont.--Continued
Water year
1913 1914
1917 1918 1919
Date
Apr. 1, 1913 Apr. 17, 1914
Apr. 10, 1917 Mar. 31, 1918Apr. 2, 1919
Gage height (feet)
7.6 4.0
13.1 16.56.80
Discharge (cfs)
2,200 700
7,800 10^8001,860
Water year
1920
1921
1952
Date
Mar. 31, 1920
Apr. 17, 1921
Apr. 6, 1952
G-ige height (feet)
6.76
3.95
15.38
Discharge (cfs)
2,130
641
a9,540
a Slope-area measurement.
1545. Peoples Creek near Dodson, Mont.
Location.--Lat 48°21', long 108°21', In Nj sec.21, T.30 N., R.26 E., on right bank a quarter of a mile upstream from Indian Service diversion, 6^ miles southwest of Dodson, and 7 miles upstream from mouth.
Drainage area. 670 sq mi.
Gage.--Recording. At site 300 ft downstream June 1, 1951, to Aug. 11, 1956. Altitude of gage is 2,310 ft (by barometer).
Stage-discharge relation.--Defined by current-meter measurements below 770 cfs and extended above on basis of slope-area measurements at 1,410, 1,730, and 2,620 cfs.
Remarks. Diversions for irrigation of about 700 acres above station do not materially affect peak flows. Base for partial-duration serie?, 500 cfs.
Peak stages and discharges
Water year
1952
1953
1954
1955
1956
Date
Feb. 11, 1952Mar. 29, 1952Mar. 30, 1952
May 27, 1953May 30, 1953June 1, 1953June 5, 1953
Apr. 5, 1954 Apr. 6, 1954
Mar. 10, 1955Apr. 11, 1955May 3, 1955May 16, 1955May 21, 1955
Mar. 25, 1956
Gage height (feet)
-a!7.05
-
6.416.076.336.84
a6.96 6.61
a6.847.835.045.595.50
-
Discharge (cfs)
b650
b3 , 500
1,010882973
1,120
1,020
(c)1,720
504700664
blOO
Water year
1957
1958
1959
1960
1961
1962
1963
Date
Mar. 21, 1957May 21, 1957
Mar. 25, 1958
Mar. 3, 1959Mar. 12, 1959
Mar. 19, 1960 Mar. 20, 1960
May 31, 1961
July 16, 1962
Feb. 6, 1963Feb. 25, 1963
G,\ge height (fuet)a*. 734.58
a5.46
aS. 085.57
alO.78
5.55
5.10
-a7.94
Discharge (cfs)
-186
b!55
_660
bl,500
648
414
b600-
a Backwater from ice. determined.
b Maximum daily. c Peak exceeded base; discharge not
1552. Alkali Creek near Malta, Mont.
Location.--Lat 48°16', long 107°58', near center sec.16, T.29 N., R.29 E., at bridge on U.S. Highway 191, 8^ miles southwest of Malta.
Drainage area. 162 sq mi.
Sage. Crest-stage gage. Altitude of gage is 2,280 ft (from topographic map).
Stage-discharge relation. Defined by current-meter measurements below 650 cfs.
Remarks.--Only annual peaks are shown.
Peak stages and discharges
Water year
1956 1957 1958 1959
Date
Mar. 19, 1956 Mar. 21, 1957 Mar. 25, 1958 Mar. 13, 1959
Gage height (feet)aO.85 1.69 .82
a3.0
Discharge (cfs)
b45 355104
b800
Water year
1961 1962 1963
Date
July 14, 1962 Feb. 5, 1963
Grge height (feet)
(c) 2.68
a3.09
Discharge (cfs)
750 b700
a Backwater from ice. than 220 cfs.
b Approximate. c Below bottom of gage; discharge less

MILK RIVER BASIN 167
1553. Disjardin Coulee near Malta, Mont.
Location. Lat 48°16', long 107°58', in SE^NW^ sec.16, T.29 N. , R.29 E., at bridge on U.S. Highway 191, 8 miles southwest of Malta.
Drainage area. 3.42 sq mi.
Gage. Crest-stage gage. Altitude of gage is 2,280 ft (from topographic map).
Stage-discharge relation. Defined by current-meter measurements below 130 cfs and by slope-area measurement at 160 cfs.
Remarks.--Only annual peaks are shown.
Peak stages and discharges
Water year
1956 1957 1958 1959 1960
Date
Aug. 5, 1956 Mar. 19, 1957
Mar. 18, 1959 Mar. 18, 1960
Gage height (feet)
3.22 1.02
1.62 .61
Discharge (cfs)
160 22 (a) 132 32
Water year
1961 1962 1963
Date
May 30, 1961 July 18, 1962 Feb. 5, 1963
Gage height (feet)
0.44 2.23
03.25
Discharge (cfs)
20 b200 blOO
a No evidence of flow during year.b About.c Backwater from ice.
1554. South Pork Taylor Creek near Malta, Mont.
Location.--Lat 48°19 C , long 107°55', in SE^ sec.26, T.30 N., R.29 E., at bridge on U.S. Highway 191, 3^ miles southwest of Malta.
Drainage area. 5.08 sq mi.
Gage.--Crest-stage gage. Altitude of gage is 2,290 ft (from topographic map).
Stage-discharge relation.--Defined by current-meter measurements below 90 cfs.
Remarks. Only annual peaks are shown.
Peak stages and discharges
Water year
1956 1957 1958 1959 1960
Date
Mar. 19, 1956 Mar. 19, 1957
July 13, 1959 Mar. 18, 1960
Gage height (feet)
1.75 1.43
1.94 1.89
Discharge (cfs)
52 22 (a) 84 75
Water year
1961 1962 1963
Date
July 30, 1961 July 18, 1962 Feb. 5, 1963
Gage height (feet)0.90 1.54 .95
Discharge (cfs)
2 65 20
a No evidence of flow during year.
1555. Milk River at Malta, Mont.
Location.--Lat 48°22' , long 107°52', in NW^ sec.17, T.30 N., R.30 E. , ft the old highway bridge at Malta.
Drainage area. 12,457 sq mi.
Gage. Nonrecording. Datum of gage is 2,221.40 ft above mean sea level, unadjusted.
Stage-discharge relation. Defined by current-meter measurements.
Remarks. Many large diversions for irrigation above station. Plow haf been supplemented by water from St. Mary Canal since 1917. Peak flows are materi ally affected. Only annual maximum observed stages and discharges are shown.
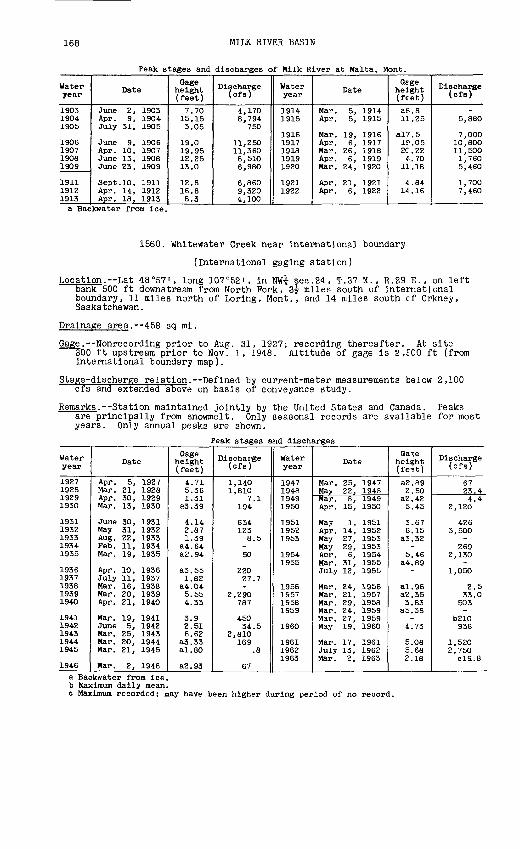
168 MILK RIVER BASIN
Peak stages and discharges of Milk River at Malta, Mont.
Water year
1903 1904 1905
1906 1907 1908 1909
1911 1912 1913
Date
June 2, 1903 Apr. 9, 1904 July 31, 1905
June 9, 1906 Apr. 10, 1907 June 13, 1908 June 23, 1909
Sept. 10, 1911 Apr. 14, 1912 Apr. 18, 1913
Gage height (feet)
7.70 15.15 3.05
19.0 19.95 12.25 13.0
12.8 16.8 8.3
Discharge (cfs)
4,170 8,794
750
11,250 11,360 6,510 6,980
6,860 9,320 4,100
Water year
1914 1915
1916 1917 1918 1919 1920
1921 1922
Date
Mar. 5, 1914 Apr. 5, 1915
Mar. 19, 1916 Apr. 6, 1917 Mar. 26, 1918 Apr. 6, 1919 Mar. 24, 1920
Apr. 21, 1921 Apr. 6, 1922
Grge height (feet)
a8.8 11.25
al7.5 IP. 05 2C.22 4.70
11.18
4.84 14.16
Discharge (cfs)
5,880
7,000 10,800 11,500 1,760 5,460
1,700 7,460
a Backwater from Ice.
1560. Whitewater Creek near international boundary
(International gaging station)
Location. Lat 48°57', long 107°52', in NW£ sec.24, T.37 N., R.29 E., on left bank 500 ft downstream from North Pork, 3? miles south of international boundary, 11 miles north of Loring, Mont., and 14 miles south cf Orkney, Saskatchewan.
Drainage area.--458 sq mi.
Gage. Nonrecording prior to Aug. 31, 1927; recording thereafter. At site 300 ft upstream prior to Nov. 1, 1948. Altitude of gage is 2,£00 ft (from international boundary map).
Stage-discharge relation. Defined by current-meter measurements telow 2,100 cfs and extended above on basis of conveyance study.
Remarks.--Station maintained jointly by the United States and Canada. Peaks are principally from snowmelt. Only seasonal records are available for most years. Only annual peaks are shown.
Peak stages and discharges
Water year
1927192819291930
19311932193319341935
19361937193819391940
19411942194319441945
1946
Date
Apr. 5, 1927Mar. 21, 1928Apr. 30, 1929Mar. 13, 1930
June 30, 1931May 31, 1932Aug. 22, 1933Feb. 11, 1934Mar. 19, 1935
Apr. 10, 1936July 11, 1937Mar. 16, 1938Mar. 20, 1939Apr. 21, 1940
Mar. 19, 1941June 5, 1942Mar. 25, 1943Mar. 20, 1944Mar. 21, 1945
Mar. 2, 1946
Gage height (feet)
4.715.361.31
a3.39
4.142.871.39
a4.64a2.94
a3.551.82
a4.045.554.33
3.92.516.62
a3.33al.80
a2.93
Discharge (cfs)
1,1401,810
7.1194
634123
8.5-50
22027.7-
2,290787
45034.5
2,810169
.8
67
Water year
1947194819491950
195119521953
19541955
1956195719581959
1960
196119621963
Date
Mar. 25, 1947May 22, 1948Mar. 8, 1949Apr. 15, 1950
May I, 1951Apr. 14, 1952May 27, 1953May 29, 1953Apr. 6, 1954Mar. 31, 1955July 12, 1955
Mar. 24, 1956Mar. 21, 1957Mar. 29, 1958Mar. 24, 1959Mar. 27, 1959May 19, 1960
Mar. 17, 1961July 13, 1962Mar. 2, 1963
Ga^e height (fe^t)
a2.892.50
a2.425.45
3.676.15
a3.32-
5.46a4.89
-
al.96a2.353.83
a5.38_
4.73
5.085.682.18
Discharge (cfs)
6723.44.4
2,120
4263,500
-269
2,130-
1,050
2.533.0
503_
b210936
1,5202,750
C19.8
a Backwater from Ice. b Maximum dally mean, c Maximum recorded; may have been higher during period of no record.
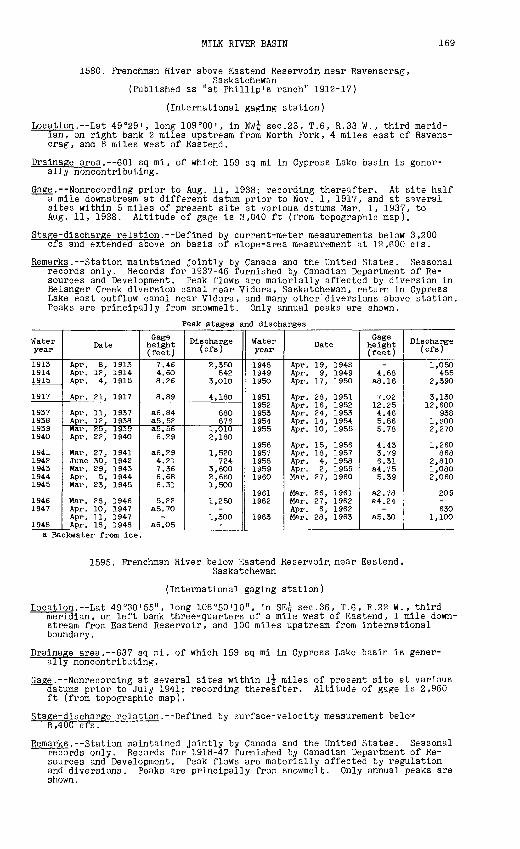
MILK RIVER BASIN 169
1580. Frenchman River above Eastend Reservoir, near Ravenscrag,Saskatchewan
(Published as "at Phillip's ranch" 1912-17}
(International gaging station)
Location. Lat 49°29', long 109°00', in NW^ sec.23, T.6, R.33 W., third merid ian, on right bank 2 miles upstream from North Pork, 4 miles east of Ravens- crag, and 8 miles west of Eastend.
Drainage area. 601 sq mi, of which 159 sq mi in Cypress Lake basin is gener ally noncontributing.
Gage. Nonrecording prior to Aug. 11, 1938; recording thereafter. At site half a mile downstream at different datum prior to Nov. 1, 1917, and at ssveral sites within 5 miles of present site at various daturas Mar. 1, 1937, to Aug. 11, 1938. Altitude of gage is 3,040 ft (from topographic map).
Stage-discharge relation. Defined by current-meter measurements below 3,200 cfs and extended above on basis of slope-area measurement at 12,600 cfs.
Remarks. Station maintained jointly by Canada and the United States. Seasonal records only. Records for 1937-46 furnished by Canadian Department of Re sources and Development. Peak flows are materially affected by diversion in Belanger Creek diversion canal near Vidora, Saskatchewan, return in Cypress Lake east outflow canal near Vidora, and many other"diversions above station. Peaks are principally from snowmelt. Only annual peaks are shown.
Peak stages and discharges
Water year
191319141915
1917
1937193819391940
19411942194319441945
19461947
1948
Date
Apr. 8, 1913Apr. 12, 1914Apr. 4, 1915
Apr. 21, 1917
Apr. 11, 1937Apr. 12, 1938Mar. 25, 1939Apr. 22, 1940
Mar. 27, 1941June 30, 1942Mar. 29, 1943Apr. 5, 1944Mar. 23, 1945
Mar. 28, 1946Apr. 10, 1947Apr. 11, 1947Apr. 18, 1948
Gage height (feet)
7.464.608.26
8.89
a6.84a5.52a5. 566.29
a6.294.217.366.686.31
5.22a5.70
-a6.05
Discharge (cfs)
2,350842
3,010
4,180
880676
1,0102,180
1,520724
3,6002,6SO1,500
1,250-
1,300-
Water year
194819491950
19511952195319541955
19561957195819591960
19611962
1963
Date
Apr. 19, 194SApr. 9, 1949Apr. 17, 1950
Apr. 28, 1951Apr. 16, 1952Apr. 24, 1953Apr. 14, 1954Apr. 10, 1955
Apr. 15, 1956Apr. 18, 1957Apr. 4, 1958Apr. 2, 1959Mar. 27, 1960
Mar. 26, 1961Mar. 27, 1962Apr. 6, 1962Mar. 28, 1963
Gage height (feet)
-4.68
a8.16
7.0212.254.465.865.78
4.433.796.31
a4.755.39
a2.78a4.24
-a5.30
Discharge (cfs)
1,050455
2,390
3,13012,600
9381,SOO2,270
1,260868
2,8101,0802,060
209-630
1,100
a Backwater from ice.
1595. Frenchman River below Eastend Reservoir, near Eastend, Saskatchewan
(International gaging station)
Location. Lat 49°30'55", long 108°50'10", in SE^ sec.36, T.6, R.22 W., third meridian, on left bank three-quarters of a mile west of Eastend, 1 mile down stream from Eastend Reservoir, and 100 miles upstream from international boundary.
Drainage area. 637 sq mi, of which 159 sq mi in Cypress Lake basin is gener ally noncontributing.
Gage.--Nonrecording at several sites within 1^ miles of present site at various datums prior to July 1941; recording thereafter. Altitude of gage is 2,960 ft (from topographic map).
Stage-discharge relation. Defined by surface-velocity measurement belo'f 8,400 cfs.
Remarks. Station maintained jointly by Canada and the United States. Seasonal records only. Records for 1918-47 furnished by Canadian Department of Re sources and Development. Peak flows are materially affected by regulation and diversions. Peaks are principally from snowmelt. Only annual peaks are shown.

170 MILK RIVER BASIN
Peak stages and discharges of Frenchman River below Eastend near Eastend, Saskatchewan
Water year
1909
19111912191319141915
191819191920
19211922192319241925
19261927192819291930
1931
1940
Date
June 22, 1909
Apr. 11, 1911Apr. 10, 1912Apr. 8, 1913Apr. 13, 1914Apr. 4, 1915
Apr. 10, 1918Apr. 3, 1919Apr. 21, 1920
Apr. 14, 1921Apr. 23, 1922Apr. 15, 1923Apr. 8, 1924Apr. 6, 1925
Mar. 19, 1926Apr. 26, 1927Mar. 22, 1928Apr. 22, 1929Apr. 5, 1930
Mar. 25, 1931
Apr. 22, 1940
Gage height (feet)
10.30
8.80-
bll.307.41
blO.87
7.84b8.059.43
7.8411.78b8.92
b!2.84bll.72
bll.8714.50
b!5.456.65
b!2.44
b2.58
11.11
Discharge (cfs)
2,560
1,910a7,0002,3601,0103,040
2,080660
2,300
1,6703,6501,000
9582,890
1,4204,3703,3801,1402,060
118
2,560
Water year
19411942194319441945
19461947194819491950
19511952195319541955
19561957195819591960
196119621963
Date
Mar. 27, 1941Apr. 13, 1942Mar. 30, 1943Apr. 5, 1944Mar. 23, 1945
Mar. 28, 1946Apr. 11, 1947Apr. 19, 1948Apr. 9, 1949Apr. 18, 1950
Apr. 29, 1951Apr. 16, 1952Apr. 24, 1953Apr. 14, 1954Apr. 20, 1955
Apr. 15, 1956Apr. 18, 1957Apr. 5, 1958Apr. 3, 1959Mar. 27, 1960
Mar. 25, 1961Apr. 6, 1962Mar. 28, 1963
Page height (feet)
8.455.47
15.4012.389.59
7.828.027.133.35
12.82
13.2219.107.009.14
11.20
8.146.20
13.586.66
blO.88
2.065.527.84
Discharge (cfs)
1,250662
3,7002,6151,700
1,2301,2401,030
3102,230
2,65011,500
9871,4602,010
1,200799
2,810921
1,730
152734
1,140a Estimated.b Backwater from ice.
1605. Frenchman River at Morrisons, near Eastend, Saskatchewan
(International gaging station)
Location. Lat 49°26', long 108"40', in SW~£ sec.6, T.6, R.20 W. , third meridian, on left bank at Morrison's farm, 8 miles southeast of Eastend.
Drainage area. 800 sq mi, of which 159 sq mi in Cypress Lake basin is gener ally noncontributing.
Gage.--Nonrecordlng prior to Apr. 1, 1942, and Oct. 25, 1952, to September 1955; recording Apr. 1, 1942, to Oct. 24, 1952. Altitude of gage is 2,930 ft (from topographic map).
Stage-discharge relation. Defined by current-meter measurements below 2,300 cfs.
Remarks. Station maintained jointly by Canada and the United States. Seasonal records only. Records for 1937-46 furnished by Canadian Department of Re sources and Development. Records for 1953-55 furnished by Canadian Depart ment of Northern Affairs and National Resources. Peak flows are materially affected by storage reservoirs and diversions. Peaks are principally from snowmelt. Only annual peaks are shown.
Peak stages and discharges
Water year
19391940
19411942194319441945
Date
Mar. 22, 1939Apr. 23, 1940
Mar. 28, 1941July 1, 1942Mar. 31, 1943Apr. 6, 1944Mar. 24, 1945
Gage height (feet)
9.1410.20
9.885.27
13.6010.859.13
Discharge (cfs)
2,1802,310
1,330673
3,4602,3171,780
Water year
19461947194819491950
19511952
Date
Mar. 29, 1946Apr. 11, 1947Apr. 19, 1948Apr. 10, 1949Apr. 19, 1950
Apr. 30, 1951Apr. 16, 1952
Gage height (feet)
7.16e8.166.424.159.44
10.6517.77
Discharge (cfs)
1,2201,570
966284
2,140
2,410b!2,000
a Backwater from ice. b About.

MILK RIVER BASIN 171
1610. Frenchman River at 50-Mile, near Bracken, Saskatchewan
(International gaging station)
Location.--Lat 49°25', long 108°01' , in SE^ sec.30, T.5, R.15 W., third merid ian, three-quarters of a mile downstream from highway between Bracken and Admiral, 17 miles northeast of Bracken, and 18 miles northwest of Val Marie.
Drainage area. 1,248 sq mi, of which 159 sq mi in Cypress Lake basin is gener- ally noncontributing.
Gage.--Nonrecording prior to Aug. 17, 1938; recording thereafter. At sites 3 miles upstream at various datums prior to May 1921. May 1921 to May 1931, and Sept. 12, 1935, to July 22, 1950, at several sites about 500 ft upstream at various datums. Altitude of gage is 2,750 ft (from topographic map).
Stage-discharge relation. Large shifts occur. Fairly well defined by current- meter measurements for most years and by slope-area measurement at 14,000 cfs.
Remarks. Station maintained jointly by Canada and the United States. Seasonal records only. Records prior to 1947 furnished by Canadian Department of Re sources and Development. Peak flows are materially affected by regulation and diversions. Peaks are principally from snowmelt. Only annual peaks are shown.
Peak stages and discharges
Water year
1914 1915
1916 1917
1919 1920
1921 1922 1923 1924 1925
1926 1927 1928 1929 1930
1931
Date
Apr. 6, 1914 Apr. 7, 1915
July 3, 1916 Apr. 25, 1917
Apr. 7, 1919 Apr. 23, 1920
May 14, 1921 Apr. 26, 1922 Apr. 18, 1923 Apr. 11, 1924 Apr. 8, 1925
Mar. 21, 1926 Apr. 30, 1927 Mar. 23, 1928 Apr. 24, 1929 Apr. 7, 1930
Apr. 4, 1931
Gage height (feet)
10.52
be.io6.72
9.25 6.96 6.27 8.66
7.64 10.40 10.08 5.63 7.65
Discharge (cfs)
a950 3,050
4,280 3,950
600 2,540
a220 2,720 1,340 1,080 2,310
1,870 3,030 3,280
865 1,890
a217
Water year
1936 1937 1938 1939 1940
1941 1942 1943 1944 1945
1946 1947
1948 1949 1950
1951 1952
Date
Apr. 17, 1936 Apr. 14, 1937 Apr. 14, 1938 Mar. 23, 1939 Apr. 25, 1940
Mar. 31, 1941 Apr. 16, 1942 Apr. 4, 1943 Apr. 8, 1944 Mar. 26, 1945
Mar. 31, 1946 Apr. 7, 1947 Apr. 13, 1947 Apr. 21, 1948 Apr. 12, 1949 Apr. 20, 1950
May 3, 1951 Apr. 17, 1952
Gage height (feet)
5.75 5.32 5.85
b8.12 7.40
6.92 4.55 9.46 7.47 6.65
5.62 b6.14
5.21 2.83 6.90
8.63 16.28
Discharge ' (cfs)
1,080 912
1,120 2,110 1,820
1,550 570
3,010 1,960 1,350
966
1,090 856 235
1,640
2,170 14,000
a Daily mean.b Backwater from ice.
1635. Frenchman River below Val Marie, Saskatchewan
(International gaging station)
Location.--Lat 49°12', long 107°41' , in NE^ sec.9, T.3, R.13 W., third meridian, on right bank 5 miles southeast of Val Marie and 6 miles northeast of Masefield.
Drainage area. 1,725 sq mi.
Gage. Nonrecording prior to Aug. 18, 1938; recording thereafter. At datum 1.00 ft lower prior to November 1950. Altitude of gage is 2,550 ft (from topographic map).
Stage-discharge relation.--Defined by current-meter measurements below 2,400 cfs and extended above on basis of slope-area measurement at 17,000 cfs.
Remarks.--Station maintained jointly by Canada and the United States. Seasonal records only. Records prior to 1947 furnished by Canadian Department of Re sources and Development. Only seasonal records are collected. Peak flows are materially affected by storage reservoirs and diversions. Peaks are principally from snowmelt. Only annual peaks are shown.

172 MILK RIVER BASIN
Peak stages and discharges of Frenchman River below Val Marie, Saskatchewan
Water year
1937 1938 1939 1940
1941 1942 1943 1944 1945
1946
Date
July 17, 1937 Apr. 16, 1938 Mar. 24, 1939 Apr. 24, 1940
Mar. 21, 1941 June 30, 1942 Mar. 25, 1943 Apr. 11, 1944 Mar. 29, 1945
Apr. 2, 1946
Gage height (feet)5.35 7.59
16.50 15.40
15.02 9.04
17.70 14.72 12.50
12.52
Discharge (cfs)
268 424
2,980 1,870
1,480 491
4,600 1,400
750
794
Water year
1947 1948 1949
1950
1951 1952
1962 1963
Date
Apr. 19, 1947 Apr. 25, 1948 Apr. 3, 1949 July 9, 1949 Apr. 16, 1950 Apr. 23, 1950
May 5, 1951 Apr. 14, 1952
July 15, 1962 Apr. 1, 1963
Gage height (feet)10.31 12.84 a5.99
al5.73
15.21 19.7
14.99 15.35
Discharge (cfs)
551 906
b56
1,590
2,530 17,700
1,060 1,110
a Backwater from ice. b Daily mean.
1640. Frenchman River at international boundary
(international gaging station)
Location.--Lat 49°00'00", long 107°18'10", in SE^ sec.5, T.I, R.10 W., third meridian, on left bank 50 ft north of international boundary and 22 miles northeast of Whitewater, Mont.
Drainage area. 2,299 sq mi.
Gage.--Recording. June 23, 1937.
At site half a mile upstream at different datum prior to Altitude of gage is 2,420 ft (from topographic map).
Stage-discharge relation.--Defined by current-meter measurements below 5,900 cfs at site used prior to June 23, 1937. Defined by current meter measure ments below 2,300 cfs at present site and extended above on basis of slope- area measurement at 22,700 cfs.
Remarks. Station maintained jointly by Canada and the United States. Seasonal records only for most years. Peak flows are materially affected by storage reservoirs and diversions. Peaks are principally from snowmelt. Only annual peaks are shown.
Peak stages and discharges
Water year
1917191819191920
19211922192319241925
19261927192819291930
1931193219331934
1935
19361937193819391940
1941
Date
Apr. 30, 1917Apr. 6, 1918Apr. 5, 1919May 10, 1920
Apr. 19, 1921Apr. 6, 1922June 23, 1923Apr. 14, 1924Mar. 29, 1925
Mar. 19, 1926Apr. 10, 1927Mar. 25, 1928Apr. 29, 1929Apr. 6, 1930
June 29, 1931Aug. 11, 1932Mar. 30, 1933Mar. 5, 1934Apr. 12, 1934Apr. 24, 1935
Apr. 16, 1936July 14, 1937July 5, 1938Mar. 27, 1939Apr. 26, 1940
Mar. 25, 1941
Gage height (feet)
9.998.655.466.10
4.728.9710.314.70
13.12
6.3211.4312.714.375.65
3.895.70
a4.80a5. 274.154.73
5.404.28
10.7713.4011.29
10.53
Discharge (cfs)
2,7802,2401,0601,660
8822,4802,920
7445,440
1,4403,3704,950
6371,340
5381,260
741-456837
1,310347
1,7902,9901,930
1,730
Water year
1942194319441945
1946194719481949
1950
1951
1952195319541955
19561957195819591960
196119621963
Date
June 28, 1942Mar. 30, 1943Apr. 3, 1944Apr. 1, 1945
Mar. 16, 1946Apr. 4, 1947Aug. 6, 1948Apr. 2, 1949Apr. 5, 1949Apr. 17, 1950
Apr. 10, 1951May 7, 1951Apr. 15, 1952May 30, 1953Apr. 8, 1954Apr. 20, 1955
Apr. 23, 1956Apr. 13, 1957Apr. 10, 1958Mar. 28, 1959Mar. 28, 1960
Mar. 19, 1961July 15, 1962Mar. 24, 1963June 8, 1963
Gage height (feet)
10.0016.36a9.026.26
a6.84£ 6.9610.20e5.024.81
13.24
a] 2. 7811.8219.909.36
13.8211.16
7.086.20
10.22alO.8912.96
a7.1312.60a7.987.64
Discharge (cfs)
1,5906,6301,040
624
736744
1,630
1922,870
_1,950
22,7001,3103,3301,950
788588
1,7801,8402,600
6402,800
931
a Backwater from ice.

MILK RIVER BASIN 173
1650. Beaver Creek near Malta, Mont.
Location. Lat 48°10', long 107°31', In SW^SWi sec.19, T.28 N., R.33 E., at highway bridge at Hales Crossing, 21 miles southeast of Malta.
Drainage area. 1,010 sq mi.
Gage.--Nonrecording. Altitude of gage Is 2,260 ft (from topographic map).
Stage-discharge relation. Defined by current-meter measurements below 2,800 cfs.
Remarks.--Several diversions for Irrigation above station do not materially affect peak flows. Peaks are principally from snowmelt. Only annual maxi mum observed stages and discharges are shown.
Peak stages and discharges
Water year
1917 1918 1919
Date
Apr. 6, 1917 May 20, 1918 Apr. 2, 1919
Gage height (feet)
19.5 19.3 15.1
Discharge (cfs)
4,990 4, S50 2,130
Water year
1920
1921
Date
June IS, 1920
May 12, 1921
Gage height (feet)
21.0
S.75
Discharge (cfs)
6,040
783
1685. Rock Creek at international boundary
(International gaging station)
Location.--Lat 48°59'20", long 106°47'30", In SE^ sec.l, T.37 N. , R.37 E. , on right bank three-quarters of a mile south of International boundary, 2 miles upstream from Horse Creek, and 9 miles northeast of Thoeny, Mont.
Drainage area. 241 sq mi.
Gage.--Nonrecordlng prior to Sept. 10, 1937; recording thereafter. At site 200 ft downstream Mar. 18, 1927, to Sept. 9, 1937. Altitude of gage Is 2,550 ft (from topographic map).
Stage-discharge relation.--Defined by current-meter measurements below 1,400 cfs and extended above on basis of slope-area measurement at 3,310 cfs.
Remarks. Station maintained jointly by the United States and Canada. No winter records for most years. Records prior to March 1927 furnished by Canadian Department of Resources and Development. Small diversions for Irrigation above station do not materially affect peak flows. Peaks are principally from snowmelt. Only annual peaks are shown.
Peak stages and discharges
Water year
1927192819291930
19311932193319341935
1936
1937193819391940
19411942194319441945
Date
Apr. 6, 1927Mar. 22, 1928Mar. 30, 1929Apr. 4, 1930
Mar. 19, 1931Mar. 25, 1932Mar. IS, 1933Mar. 4, 1934July 23, 1935
Apr. 12, 1936Apr. 14, 1936July 13, 1937Mar. 17, 1938Mar. 25, 1939Apr. IS, 1940
Mar. 22, 1941Apr. 3, 1942Mar. 30, 1943Apr. 2, 1944Mar. 14, 1945
Gage height (feet)
10.5110.443.747.47
a3.034.52
a5.33a8.035.02
a8.49-
4.55a9.7011.40a6.63
a9.066.26
11.18a8.58as, 81
Discharge (cfs)
1,3201.30C
56606
48.5169208-
254
-521208793
2,410421
925422
2,070776892
Water year
19461947194819491950
1951
1952195319541955
19561957195819591960
1961
Date
Mar. 20, 1946Apr. 3, 1947July 14, 1948Apr. 1, 1949Apr. 16, 1950
Apr. 10, 1951Apr. 2S, 1951Apr. 15, 1952June 9, 1953Apr. 7, 1954Apr. 2, 1955
Mar. 27, 1956Apr. 24, 1957Mar. 31, 1958Mar. 28, 1959Mar. 27, 1960
Mar. 19, 1961Mar. 20, 1961
Gage height (feet)
a6.128.199.26
a4.5010.37
all. 02-
11.915.59
all. 40alO.99
a7.904.67
a9.13a5.7010.83
a4.03-
Discharge (cfs)
271822
1,060166
1,330
-756
3,310330
2,2501,700
604213925304
1,620
-74
a Backwater from ice.
219-848 O - 66 - 13

174 MILK RIVER BASIN
1690. Horse Creek at international boundary (Published as "near Barnard, Mont." 1914-17)
(International gaging station)
Location.--Lat 48°59'20", long 106°50'10", in SE£ sec.3, T.37 N. , R.37 E.. on right bank three-quarters of a mile south of international bovndary, if miles upstream from mouth, and 8 miles northeast of Thoeny, Mont.
Drainage area.--73.5 sq mi.
Gage. Nonrecording prior to Sept. 9, 1937; recording thereafter. At datum 1.06 ft higher prior to June 16, 1919. Altitude of gage is 2,540 ft (from topographic mapl.
Stage-discharge relation. Defined by current-meter measurements below 800 cfs and extended above by logarithmic plotting.
Remarks. Station maintained jointly by United States and Canada. Only seasonal records for most years. Records prior to March 1927 furnished by Canadian Department of Resources and Development. Peaks are principally from snowmelt. Only annual peaks are shown.
Peak stages and discharges
Water year
1915
19161917191819191920
19211922192319241925
19261927192819291930
193119321933
1935
1936193719381939
Date
Apr. 4, 1915
Apr. 10, 1916Apr. 15, 1917Mar. 24, 1918Apr. 3, 1919Apr. 13, 1920
July 13, 1921Apr. 5, 1922June 1, 1923Apr. 3, 1924Mar. 30, 1925
Mar. 17, 1926Apr. 9, 1927Mar. 22, 1928Mar. 29, 1929Apr. 4, 1930
Mar. 21, 1931Mar. 24, 1932Aug. 22, 1933
Apr. 14, 1935
Apr. 12, 1936Apr. 10, 1937Mar. 17, 1938Mar. 24, 1939
Gage height (feet)
4.00
8.08.168.468.454.25
7.57-
9.394.8310.85
7.459.8010.503.597.71
2.38a5.298.28
7.64
8.084.018.0711.18
Discharge (cfs)
92
36456263942859
30545064988
1,040
27469194031.7
244
6.956
311
226
28943.5
288' 1,360
Water year
1940
19411942194319441945
19461947194819491950
1951
1952195319541955
19561957
195819591960
1961
Date
Apr. 19, 1940
Mar. 22, 1941Mar. 14, 1942Mar. 29, 1943Apr. 1, 1944Mar. 13, 1945
Mar. 20, 1946Apr. 3, 1947Apr. 16, 1948Mar. 30, 1949Apr. 16, 1950
Apr. 9, 1951Apr. 26, 1951Apr. 15, 1952June 2, 1953Apr. 5, 1954Apr. 1, 1955
Mar. 27, 1956Mar. 24, 1957Mar. 27, 1957Mar. 31, 1958Mar. 27, 1959Mar. 27, 1960
Mar. 22, 1961
Gtge height (feet)
7.87
a8.696.88
11.529.318.32
6.338.347.70
a"5.6910.55
a9.04-
11.7910.62
all. 76alO.56
__
3.909.165.999.88
3.52
Discharge (cfs)
253
295129
1,590482313
11930122578
970
_268
1,8001,0101,530
548
b90b40_
515140658
10.1
a Backwater from ice. b Dally mean.

MILK RIVER BASIN 175
1695. Rock Creek below Horse Creek, near international boundary (Published as "near Barnard, Mont." 1916-17)
(International gaging station)
Location.--Lat 48°58'10", long 106°49'50", in NE£ sec.15, T.37 N., R.37 E., on right bank 1 mile downstream from Horse Creek, 2 miles south of international boundary, and 21 miles northwest of Ophelm, Mont.
Drainage area. 328 sq mi.
. Nonrecordlng at several sites within 500 ft upstream at dlfferert datum arch 1916 to October 1926; recording at present site and datum since Septem
ber 1956. Altitude of gage Is 2,530 ft (from topographic map).
Stage-discharge relation. Defined at present site by current-meter measurements below 2,100 cfs and extended above on basis of slope-area measuremert at 5,110 cfs for the flood of Apr. 15, 1952.
Remarks. Station maintained jointly by the United States and Canada. Seasonal records only. Records 1917-26 furnished by Canadian Department of resources and Development. Small diversions for Irrigation above station do not materially affect peak flows. Peaks are principally from snowmelt. Only annual peaks for the season (generally March to October) are shown.
Peak stages and discharges
Water year
1917
19191920
19211922192319241925
1926
Date
Apr. 15, 1917
Apr. 4, 1919Mar. 26, 1920
July 13, 1921Apr. 5, 1922June 1, 1923Oct. 12, 1923Mar. 31, 1925
Mar. 17. 1926
Gage height (feet)
-
8.738.72
7.3111.009.454.85
12.54
6.50
Discharge (cfs)
2,500
1,265434
8292,3281,696
2823,610
606
Water year
1952
1957
195819591960
196119621963
Date
Apr. 15, 1952
Mar. 22, 1957Apr. 24, 1957Mar. 31, 1958Mar. 28, 1959Mar. 27, 1960
Mar. 20, 1961June 15, 1962Mar. 13, 1963Mar. 22, 1963
Gage height (feet)
12.6
a5.60-
a8.28a5.769.13
a4.036.80
a7.08-
Discharge (cfs)
5,110
_186
1,430461
2,070
82900-815
a Backwater from Ice.
1700. McEachern Creek at international boundary
(International gaging station)
Location.--Lat 48°59'30", long 106°55'40", In SW£ sec.l, T.37 N., R.36 E., on left bank half a mile downstream from East Fork, half a mile south cf Inter national boundary, and 8 miles north of Thoeny, Mont.
Drainage area.--182 sq mi.
Gage. Nonrecordlng prior to May 29, 1962; recording thereafter. At site a quarter of a mile downstream at datum 1.25 ft lower prior to Mar. 1, 1927, and at site 350 ft upstream at present datum Mar. 1, 1927, to Oct. 1, 1938. Altitude of gage Is 2,540 ft (from topographic map).
Stage-discharge relation. Defined by current-meter measurements below 2,800 cfs and extended above on basis of slope-area measurement at 7,080 cfs.
Remarks.--Station maintained jointly by the United States and Canada. Only seasonal records for most yeara. Records prior to March 1927 furnished by Canadian Department of Resources and Development. Several diversions for irrigation above station do not materially affect peak flows. Peaks are principally from snowmelt. Only annual peaks are shown.
Peak stages and discharges
Water year
1924 1925
1926 1927
a Bac b Da
Date
Apr. 3, 1924 Mar. 29, 1925
Mar. 17, 1926Apr. 9, 1927
.kwater from Ice Lly mean.
Gage height (feet)
9.75
6.3210.42
Discharge (cfs)
135 2,210
9493,190
Water year
1928 1929 1930
1931
Date
Mar. 21, 1928 Mar. 30, 1929 Mar. 23, 1930
June 30, 1931
Gage height (feet)
a9.19 a3.38 a6.96
6.05
Discharge (cfs)
bl,000 b63
b394
730

176 MILK RIVER BASIN
Peak stages and discharges of McEachern Creek at international boundary- -Continued
Water year
1932193319341935
19361937193819391940
19411942194319441945
19461947
Date
Mar. 26, 1932Aug. 22 , 1933Mar. 2, 1934Apr. 17, 1935
Apr. 12, 1936Apr. 11, 1937Mar. 17, 1938Mar. 23, 1939Apr. 17, 1940Apr. 18, 1940
Mar. 19, 1941June 29, 1942Mar. 29, 1943Apr. 1, 1944Mar. 13, 1945
Mar. 20, 1946Apr. 3, 1947
Gage height (feet)
a4.056.07
a7.184.40
5.973.116.52
11.12a6.30
-
a6.485.60
10.746.804.35
4.295.05
Discharge (cfs)
biie738-
210
69839.4
9343,750
_572
413560
3,4401,020
212
193340
Water year
194819491950
19511952195319541955
19561957195819591960
196119621963
Date
Apr. 16, 1948Apr. 3, 1949Apr. 16, 1950
Apr. 26, 1951Apr. 15, 1952June 3, 1953Apr. 6, 1954Apr. 2, 1955
Mar. 27, 1956Apr. 1, 1957Mar. 31, 1958Mar. 27, 1959Mar. 27, 1960
Mar. 22, 1961July 14, 1962June 22, 1963
Qa-5e height (fe=>t)
4.953.709.96
5.4613.856.31
11.78a7.63
a4.082.016.364.587.43
1.765.726.01
Discharge (cfs)
31274
3,350
6967,0801,0704,9601,270
1803.8
1,070394
1,640
1.3798914
a Backwater from ice. b Daily mean.
1710. Rock Creek near Hinsdale, Mont.
Location.--Lat 48°28', long 107°02', in NW£ sec.10, T.31 N., R.36 E., 2 miles downstream from Rock Creek Canal diversion and 5 miles northeast of Hinsdale.
Drainage area. 1,313 sq mi.
Gage. Nonrecording. At site 2 miles upstream at different datum prior to Apr. 19, 1912. Altitude of gage is 2,140 ft (from topographic map).
Stage-discharge relation. Defined by current-meter measurements telow 3,700 cfs.
Remarks. Peak flows are materially affected by diversions for irrigation. Only annual observed peaks are shown except as noted.
Peak stages and discharges
Water year
1906 1907
1912
1914 1915
Date
June S, 1906 Apr. 11, 1907
May 29, 1912
Apr. 24, 1914 May 27, 1915
Qage height (feet)
18.4 17. 0
19.6
16.5 21.1
Discharge (cfs)
6,220 5,520
3,890
2,880 a4,390
Water year
1916 1917 1918 1919 1920
Date
Apr. 13, 1916 Apr. 11, 1917 Mar. 25, 1918 Apr. 3, 1919 Mar. 27, 1920
Qage height (feet)
20.6 20.0 18.3 18.2 14.44
Discharge (cfs)
4,220 4,020 3,460 3,430 2,240
Momentary maximum.
1720. Milk River near Vandalia, Mont.
Location.--Lat 48°23', long 106°58', in NW£ sec.7, T.30 N., R.37 E., at Vandalia Dam, 3 miles northwest of Vandalia.
Drainage area. 20,926 sq mi.
Gage.--Nonrecording. Altitude of gage is 2,089 ft above mean sea level (Bureau of Reclamation bench mark).
Stage-discharge relation. Large shifts occur. Defined by current-meter measure- ments below 18,000 cfs.
Remarks. Many large diversions for irrigation above station. Sirce 1917, flow increased during irrigation season by water from the St. Mary River. Peaks are principally from snowmelt. Only annual maximum observed stager and dis charges are shown.

MILK RIVER BASIN 177
Peak stages and discharges of Milk River near Vandalia, Mont.
Water year
1915
1917 1918 19191920
1921 19221923 1924 1925
1929 1930
Date
May 27, 1915
Apr. 11, 1917 Mar. 28, 1918 Apr. 4, 1919Mar. 27, 1920
June 21, 1921 Apr. 7, 1922June 30, 1923 June 17, 1924 Apr. 1, 1925
June 10, 1929 Feb. 22, 1930
Gage height (feet)
19.2
34.5 34.3 27.5a3.80
27.4
18.4 35.35
12.3 d31.4
Discharge(Cfs)
8,300
25,200 24,900 15,70010,300
11,600 b20,000017,000
5,130 27,200
2,540
Water year
1930
1931
19321933
1935
1936 19371938 1939
Date
Apr. 5, 1930
Oct. 10, 1930 Feb. 1, 1931 June 14, 1932Aug. 26, 1933
Mar. 21, 1934 Mar. 26, 1935
Apr. 11, 1936 Apr. 11, 1937Mar. 17, 1938 Mar. 25, 1939
Gage height (feet)
-
d9.7 22.7825.22
d25.2
a4.42 a3.2831.09 36.47
Discharge (cfs)
6,100
1,370
7,0107,550
3,180 7,920
11,000 5,990
11,000 21,100
a Gage above dam at different datum, d Backwater from ice.
b Daily mean; estimated. c Diily mean.
1723. Unger Creek near Vandalia, Mont.
Location.--Lat 48°22', long 106°48', in Sw£ sec.9, T.30 N., R.38 E., at bridge on U.S. Highway 2, 4j miles northeast of Vandalia.
Drainage area. 11.1 sq ml.
Gage.--Crest-stage gage. Altitude of gage Is 2,220 ft (from topographic map).
Stage-discharge relation.--Defined by current-meter measurements below 350 cfs. Large shifts occur.
Remarks.--Only annual peaks are shown.
Peak stages and discharges
Water year
1958 1959 1960
Date
March 1958 Apr. 1, 1959 Mar. 20, 1960
Gage height (feet)
0.92 1.41 2.32
Discharge (cfs)
10 32
225
Water year
1961 1962 1963
Date
June 13, 1961 July 14, 1962 June 29, 1963
Gage height (feet)
1.02 3.28 2.23
Discharge (cfs)
13 575 46
1740. Willow Creek near Glasgow, Mont.
Location.--Lat 48°06'52", long 106°40'15", in NW^NE^ sec.10, T.27 N., R.39 E,, on right bank 6 miles south of Glasgow and 8 miles upstream from mouth.
Drainage area. 538 sq mi.
Gage.--Recording. Altitude of gage is 2,110 ft (by barometer).
Stage-discharge relation. Large shifts occur. Defined by current-meter meas- urements below 9,100 cfs.
Remarks. There are 159 storage reservoirs (aggregate capacity, 1,615 acre-ft), and 59 detention reservoirs (aggregate capacity, 27,840 acre-ft) above station. Flood or water spreader irrigation serves 5,035 acres. Annual peaks might be materially affected. Only annual peaks are shown.
Peak stages and discharges
Water year
1954 1955
1956 1957 1958
Date
Apr. 6, 1954 May 17, 1955
Aug. 31, 1956 Mar. 21, 1957 June 10, 1958
Gage height (feet)
16.75 17.26
8.23 9.3 4.14
Discharge (cfs)
3,280 3,240
747 955 131
Water year
1959 1960
1961 1962 1963
Date
Mar. 19, 1959 Mar. 20, 1960
June 14, 1961 July 14, 1962 June 6, 1963
Gage height (feet)
17.58 19.10
8.70 21.70 18.93
Discharge (cfs)
3,100 5,050
495 12,400 3,720

178 MILK RIVER BASIN
1745. Milk River at Nashua, Mont.
Location. Lat 48°07'50", long 106°21'50", in NE^-NE^ sec.l, T.27 N., R.41 E., on right bank at downstream side of highway bridge, 0.6 mile southwest of Nashua and 5 miles upstream from Porcupine Creek.
Drainage area. 22,332 sq mi.
Gage.--Recording. Datum of gage is 2,027.75 ft above mean sea level, datum of 1929, adjustment of 1948.
Stage-discharge relation.--Defined by current-meter measurements.
Remarks.--Diversions for irrigation of about 140,000 acres above station. Plow regulated by Presno and Nelson Reservoirs (usable capacity, 127,200 and 66,800 acre-ft, respectively) and four reservoirs in Frenchman River basin in Saskatchewan (capacity, 91,920 acre-ft). Peak flows are materially af fected by diversions and regulation. Only annual peaks are shown.
Peak stages and discharges
Water year
1940
19411942
194319441945
1946194719481949
1950
1951
Date
Apr. 23, 1940
Mar. 31, 1941Mar. 20, 1942June 6, 1942Apr. 2, 1943Mar. 27, 1944Mar. 28, 1945
July 11, 1946Mar. 30, 1947June 6, 1948Mar. 23, 1949Apr. 1, 1949Apr. 22, 1950
Apr. 3, 1951Apr. 9, 1951
Gage height (feet)
21.8
al7.67a!4 . 98
-26.97
al8.59a!2.08
12.74a23.5612.11a7.62
-22.62
a21.87-
Discharge (cfs)
12,000
6,660-
6,27017,400b6,700c2,500
5,080ell, 000
4,760-
2,07012,500
-10,100
Water year
1952195319541955
1956
1957
195819591960
1961
19621963
Date
Apr. 18, 1952May 31, 1953Apr. 13, 1954Apr. 6, 1955
Mar. 28, 1956Mar. 29, 1956Mar. 29, 1957Mar. 30, 1957Apr. 8, 1958Mar. 24, 1959Mar. 27, 1960
Feb. 6, 1961Mar. 22, 1961July 17, 1962June 10, 1963
Gage height (feet)
31.3825.5022.3520.98
-al3.34a8.74
-11.31
a24.4326.17
a4.05-
20.3011.70
Discharge (cfs)
45,30013,40010 , 90010,200
C3.170_-
cl,7503,840
clO.OOO14,200
_702
9,6704,250
a Backwater from ice.b About.c Daily mean.
1750. Porcupine Creek at Nashua, Mont.
Location.--Lat 48°09', long 106°21' , in NW^ sec.31, T.28 N., R.42 E. , a quarter of a mile upstream from highway bridge and three-eighths of a mile north of Nashua.
Drainage area. 725 sq mi.
Gage.--Nonrecording. At site 300 ft downstream at different datura prior to Apr. 19, 1911. Altitude of gage is 2,060 ft (from topographic map).
Stage-discharge relation. Defined by current-meter measurements below 810 cfs.
Remarks. Some regulation since 1918 by reservoir on Middle Fork Porcupine Creek Peaks materially affected. Only annual peaks are shovn.
Peak stages and discharges
Water year
1909
1912 1913 1914 1915
1916 1917 1918
Date
July 14, 1909
Aug. 20, 1912 Mar. 31, 1913 Apr. 3, 1914 May 27, 1915
Apr. 11, 1916 Apr. 10, 1917 Aug. 22, 1918
Gage height (feet)
9.15
18.0 16.0 13.6 12.3
18.0 16.6 13.2
Discharge (cfs)
408
2,390 1,110
755 456
2,700 1,270
537
Water year
1919 1920
1921
1923 1924
1939
Date
Apr. 3, 1919 Mar. 27, 1920
June 21, 1921
June 25, 1923 July 19, 1924
Mar. 24, 1939
Gage height (feet)
15.4 11.0
15.4
15.8 6.1
Discharge (cfs)
935 522
830
825 120
a35,500
a Computed by U.S. Indian Service; caused by failure of Middle Pork Dan.

WOLF CREEK BASIN 179
1765. Wolf Creek near Wolf Point, Mont.
Location.--Lat 48°06', long 105°41', near center of Nj sec.17, T.27 N., R.47 E., 2 miles northwest of Wolf Point and 2j miles upstream from mouth.
Drainage area. 251 sq mi.
Gage.--Honrecording at site three-quarters of a mile upstream at different datum prior to August 1914. Recording Aug. 1, 1914, to Sept. 30, 1953, and crest-stage gage thereafter. Altitude of gage is 2,010 ft (from topographic map).
Stage-discharge relation.--Defined by current-meter measurements below 1,700 cfs and extended above on basis of contracted-opening measurement gt 7,050 cfs. Large shifts occur.
Remarks.--Peaks are principally from snowmelt. Only annual peaks are shown.
Peak stages and discharges
Water year
1910
1911 1912
1950
1951 1952 1953 1954
Date
Mar. 14, 1910
Mar. 19-23, 1911 Apr. 1, 1912
Apr. 18, 1950
Apr. 5, 1951 Apr. 7, 1952 June 3, 1953 Apr. 4, 1954
Gage height (feet)
3.9
4.45 5.9
5.30
6.06 9.25 7.29
12.9
Discharge (cfs)
110
154 270
188
324 7,050 1,010 9,780
Water year
1956 1957 1958 1959 1960
1961 1962 1963
Date
Mar. 23, 1956 July 14, 1957 Apr. 1, 1958 June 21, 1959 Mar. 20, 1960
May 22, 1961 June 15, 1962 July 11, 1963
hp?fh t Discharge (?ett) (<*»)
a60 5.29 alSO 3 . 30 a6 6.74 a330 9.71
5.97 120 7.95 1,440 5.60 140
a Approximate.
MISSOURI RIVER MAIN STEM
1770. Missouri River near Wolf Point, Mont.
Location.--Lat 48°04', long 105°32', in NW£ sec.28, T.27 N., R.48 E., on rightbank 500 ft downstream from bridge on State Highway 13, 6 miles southeast ofWolf Point, and 6 miles downstream from Wolf Creek.
Drainage area.--82,290 sq mi.
Gage. Nonrecording at Wolf Point ferry landing 6 miles upstream at different datum prior to Apr. 13, 1930; recording thereafter. Datum of gage is 1,958.57 ft above mean sea level, datum of 1929.
Stage-discharge relation.--Defined by current-meter measurements below 44,000 cfs at present site.
Remarks. Diversions for irrigation of about 1,000,000 acres above station. Plow partly regulated by Port Peck Reservoir (total capacity, 19,410,000 acre-ft) since 1937 and by many other reservoirs above station. Peak flows materially affected by regulation by Port Peck Reservoir since 1937. Only annual peaks are shown.
Peak stages and discharges
Water year
1908
19291930
193119321933
19341935
1936
Date
June 14, 1908
June 4, 1929Mar. 30, 1930Apr. 20, 1930
Mar. 23, 1931May 23, 1932Mar. 25, 1933June 10, 1933June 15, 1934June 20, 1935
Mar. 11, 1936
Gage height (feet)
a20
11.51b!7.45
-
b8.4014.82
t>12.30-
11.309.65
b!4.64
Discharge (cfs)
-
26,900-
21,000
c!4,00041,000
-29,80032 , 30021,500
31,300
Water year
19371938
19391940
1941
19421943
19441945
Date
June 14, 1937Mar. 12, 1938Mar. 19, 1938Mar. 25, 1939Aug.14,24, 1940
Mar. 30, 1941Aug. 10, 1941Aug. 28, 1942Mar. 29, 1943Mar. 30, 1943Oct. 6, 1943Oct. 13, 1944Jan. 4, 1945
Gage height (feet)
10.44blS.OO
-b!4.40
9.06
b9.46-
8.42b!4.25
-9.77-
bll.81
Discharge (cfs)
23,900-
d36,00066,80017,200
-15,40015,100
-38 , 60021,50022,200
-
a Approximate; at present site and datum, d About.
b Backwater from ice. c Daily mean.

180 MISSOURI RIVER MAIN STEM
Peak stages and discharges of Missouri River near Wolf Point, Mont. Continued
Water year
19461947
19481949
1950
1951
1958
195319541955
Date
Aug. 24, 1946Apr. 2, 1947Aug. 13, 1947Aug. 9, 1948Oct. 1, 1948Oct. 14, 1948Apr. 16, 1950Sept. 6, 1950
Apr. 7, 1951Sept. 30, 1951Apr.- 7, 1952Apr. 19, 1952Sept. 28, 1953Aug. 31, 1954Sept. 20, 1955
Gage height (feet)
9.81blO.81
-10.7710.24
-blO.71
-
blO.90-
b!4.91-9.75
10.009.94
Discharge (cfs)
20,700-
27,20028,600
_29,100
-22,100
_29,100
-46,80028,10033,70030,500
Water year
19561957
1958
19591960
1961
1962
1963
Date
Oct. 19, 1955Mar. 26, 1957Mar. 29, 1957Feb. 18, 1958Apr. 9, 1958Mar. 26, 1959Mar. 27, 1960Mar. 28, 1960
Dec. 24, 1960Sept. 30, 1961Oct. 3, 1961Jan. 12, 1962Feb. 6, 1963
Ga^e height (fe,t)
9.22a6.87
a5. 53
bll.76bl5.64
b8. 73
_b9.64b9.57
Discharge (cfs}
31,500
313,000
9,910323,000
330,000
_15,60015,500
315,000
a Approximate; at present site and datum.b Backwater from ice.d About .
REDWATER CREEK BASIN
1770.5. East Pork Duck Creek near Brockway, Mont.
Location. Lat 47°12', long 105°47', In sec.31, T.17 N., R.47 E., at bridge on county road, 8 miles south of Brockway.
Drainage area.--12.4 sq ml.
Gage . - -Crest-stage gage. Altitude of gage Is 2 ,660 ft (from topographic map).
Stage-discharge relation. --Defined by current-meter measurements b?low 280 cfs.
Remarks . Only annual peaks are shown.
Peak stages and discharges
Water year
1955
1956 1957 1958 1959
Date
July 12, 1955
Mar. 2, 1956 July 14, 1957 July 21, 1958 Mar. 18, 1959
Gage height (feet)
1.46
1.08 3.64
.19 2.47
Discharge (cfs}
106
60 505
8 273
Water year
1960
1961 1962 1963
Date
Aug. 16, 1960
May 31, 1961 July 14, 1962 June 6, 1963
Ga^e height (feut)
1.65
1.62 1.97 4.30
Discharge (cfs}
140
134 190 650
1771. Duck Creek near Brockway, Mont.
Location. --Lat 47°15', long 105°49', In on county road, 5 miles southwest of
Drainage area. --54. 0
SE£ sec. 11, T.17 N., R.46 E., Brockway .
sq ml.
Gage. Crest-stage gage. Altitude of gage Is 2
Stage-discharge relation. De
Remark
Water year
s. Only annual peaks a
I
DateGage
height (feet)
at bridge
,580 ft (from Typographic map).
fined by current-meter measurements telow 900 cfs.
re shown.
>eak stages an3 discharges
Discharge (cfs}
Water year
DateGSTC
height (feet)
Discharge (cfs}
a Approximate.

REDWATER CREEK BASIN 181
1771.5. Redwater Creek at Brockway, Mont.
Location. Lat 47°19', long 105°45', in NW^ sec.20, T.18 N., R.47 E., at bridge on county road, a quarter of a mile northwest of Brockway.
Drainage area. 216 sq mi.
Gage.--Crest-stage gage. Altitude of gage is 2,550 ft (from topographic map).
Stage-discharge relation. Defined by current-meter measurements below 1,400 cfs.
Remarks. Only annual peaks are shown.
Peak stages and discharges
Water year
1957 1958 1959 1960
Date
July 14, 1957 July 3, 1958 Mar. 18, 1959 Mar. 20, 1960
Qage height (feet)
5.8 1.86 5.53
a6.94
Discharge (cfs)
1,220 130
1,130 bl.OOO
Water year
1961 1962 1963
Date
June 1, 1961 June 6, 1962 June 6, 1963
Qage height (feet)
2.26 5.80 5.45
Discharge (cfs)
200 1,220 1,520
a Backwater from ice. b Approximate.
1772. Tusler Creek near Brockway, Mont.
Location. Lat 47°18', long 105 "39', in SE^ sec.24, T.18 N., R.47 E., at bridge on county road, 4 miles east of Brockway.
Drainage area. 90.2 sq mi.
Gage.--Crest-stage gage. Altitude of gage is 2,570 ft (from topographic map).
Stage-discharge relation.--Defined by current-meter measurements below 340 cfs.
Remarks. Only annual peaks are shown.
Peak stages and discharges
Water year
1957 1958 1959 1960
Date
Feb. 27, 1957 July 21, 1958 Mar. 18, 1959 Mar. 20, 1960
Qage height (feet)
1.66 -.22
a2.16 1.96
Discharge (cfs)
200 14
150 280
Water year
1961 1962 1963
Date
Mar. 6, 1961 July 19, 1962 June 6, 1963
Qage height (feet)
-0.04 3.36 2.34
Discharge (cfs)
18 430 280
a Backwater from ice.
1773. Redwater Creek tributary near Brockway, Mont.
Location.--Lat 47°21', long 105°41', in NE^SE^ sec.2, T.18 N., R.47 E., at cul vert on State Highway 20, 4 miles northeast of Brockway.
Drainage area.--0.29 sq mi.
Gage. Crest-stage gage. Altitude of gage is 2,570 ft (from topographic map).
Stage-discharge relation. Defined by current-meter measurements below 10 cfs and by computation of flow through culvert at 72 and 83 cfs.
Remarks.--Only annual peaks are shown.
Peak stages and discharges __
Water year
1954
1957 1958 1959
Date
Aug. 18, 1954
July 14, 1957
Mar. 18, 1959
Qage height (feet)
7.40
9.40
b4.35
Discharge (cfs)
72
83 (a) c20
Water year
1960
1961 1962 1963
Date
Mar. 20, I960
July 29, 1961 June 6, 1962 June 3, 1963
height Discharge (feet) ( cfs >
1.17 12
1.65 16 .62 8 .60 8
a No evidence of flow during year, b Backwater from ice. c Approximate.

182 REDWATER CREEK BASIN
1773.5. South Fork Dry Ash Creek near Circle, Mont.
Location.--Lat 47°18', long 105°35', in NW£ sec.27, T.18 N., R.48 E., at bridge on county road, 9-5- miles south of Circle.
Drainage area. 5.74 sq mi.
Gage.--Crest-stage gage. Altitude of gage is 2,660 ft (from topographic map).
Stage-discharge relation. Poorly defined by current-meter measur?ments below 30 cfs.
Remarks. Only annual peaks are shown.
Peak stages and discharges
Water year
1955
1956195719581959
Date
July 12, 1955
Mar. 1, 1956Feb. 26, 1957June 3, 1958Mar. 22, 1959
Gage height (feet)
2.18
1.371.58.23
2.12
Discharge (cfs)
56
17523
79
Water year
1960
196119621963
Date
Aug. 16, 1960
_July 14, 1962June 6, 1963
Sage height (feet)
2.40
_1.12.76
Discharge (cfs)
85
(a)2210
a No evidence of flow during year.
1774. McCune Creek near Circle, Mont.
Location. Lat 47°21', long 105°35', in NW£ sec.3, T.18 N., R.48 E., near bridge on county road, 5 miles south of Circle.
Drainage area. 29.9 sq mi.
Gage. Crest-stage gage. Altitude of gage is 2,500 ft (from topographic map).
Stage-discharge relation. Defined by current-meter measurements below 200 cfs.
Remarks. Only annual peaks are shown.
Peak stages and discharges
Water year
1955
1956195719581959
Date
July 12, 1955
Mar. 20, 1956July 14, 1957June 3, 1958Mar. 22, 1959
Gage height (feet)
4.32
3.314.93.98-
Discharge (cfs)
128
52175
6(a)
Water year
1960
196119621963
Date
Mar. 20, 1960
Mar. 6, 1961July 19, 1962June 6, 1963
Gige height (fset)
5.44
1.367.266.29
Discharge (cfs)
b!50
b5235
b450
a Unknown.b Approximate.
177S. Redwater Creek at Circle, Mont.
Location.--Lat 47°25', long 105°35', in SW£ sec.11, T.19 N., R.48 E., on left bank at Circle, three-quarters of a mile upstream from Horse Creek.
Drainage area. 547 sq mi.
^.--Nonrecording prior to May 8, 1950; recording thereafter. Altitude of gage is 2,380 ft (by barometer). At site a third of a mile upstream at same datum prior to June 1, 1941, and Mar. 23, 1943, to Feb. 16, 1948. At site 200 ft upstream at datum 2.8 ft lower June 1, 1941, to Mar. 22, 1943.
Stage-discharge relation. Defined by current-meter measurements below 3,500 cfs at present site.
Remarks. Minor diversions do not materially affect peak flows. Base forpartial-duration series, 80 cfs. Only annual peaks are shown prior to 1948.

REDWATER CREEK BASIN 183
Peak stages and discharges of Redwater Creek at Circle, Mont.
Water year
19291930
1932193319341935
19361937193819391940
1941
1942194319441945
1946
1947
1948
1949
1950
1951
1952
Date
June 6, 1929Mar. 12, 1930
Apr. 23, 1932June 20, 1933June 16, 1934July 10, 1935
Mar. 10, 1936June 12, 1937July 4, 1938Mar. 19, 1939June 8, 1940
fa)Sept. 10, 1941Mar. 9, 1942Mar. 24, 1943June 17, 1944Feb. 9, 1945Mar. 11,12, 1945
Feb. 23, 1946July 17, 1946Mar. 23, 1947
Feb. 27, 1948Mar. 17, 1948June 5, 1948June 14, 1948July 15, 1948July 20, 1948Aug. 7, 1948Aug. 10, 1948
Mar. 8, 1949Mar. 22, 1949
Apr. 2, 1950Apr. 7, 1950Apr. 14, 1950
Feb. 11, 1951Feb. 16, 1951Mar. 22, 1951Apr. 30, 1951
Dec. 13, 1951Mar. 31, 1952July 20, 1952
Gage height (feet)
10.006.70
11.111.109.449.70
9.869.35
14.3311.173.78
b3.41-
4.24b!3.818.58.69-
b9.81-
14.10
-5.226.529.128.308.006.006.15
-11.1
-7.755.42
--
b9.265.98
-12.366.82
Discharge (cfs)
1,370302
1,8401,8401,1301,250
1,3301,1303,4601,880
9.5
-4.9
3411,500 ,220
-c80
-1,0904,180
(d)132335
1,040775685243268
(d)1,820
(d)612169
i d l(d)
c520240
(d)5,740
394
Water year
1953
1954
1955
1956
1957
1958
1959
1960
1961
1962
1963
Date
Mar. 31, 1953June 24, 1953June 29, 1953July 16, 1953Aug. 1, 1953Aug. 5, 1953
Feb. 6, 1954Aug. 16, 1954
Mar. 10, 1955July 7, 1955July 12, 1955July 29, 1955
Mar. 2, 1956Mar. 19, 1956Mar. 20, 1956
Feb. 28, 1957Mar. 11, 1957Mar. 22, 1957Apr. 23, 1957July 14, 1957Aug. 31, 1957Sept. 5, 1957
June 7, 1958
Mar. 19, 1959Mar. 20, 1959Mar. 22, 1959Mar. 27, 1959
Mar. 21, 1960May 24, 1960
Feb. 11, 1961
June 2, 1962June 7, 1962July 17, 1962July 19, 1962
Feb. 5, 1963Feb. 27, 1963June 6, 1963June 15, 1963
Gage height (feet)
5.4110.2810.836.456.987.19
-8.12
b9.708.506.584.93
_b8.51
-
-6.306.568.0112.775.355.40
3.85
b!2.2312.1511.426.15
12.227.05
3.65
7.0710.599.029.90
--
11.237.17
Discharge (cfs)
1561,9001,970
313420465
(d)721
c95061224097
(d)
650
(d)295342688
6,730148155
7.8
-4,3602,910
171
4,530332
2.2
3161,870899
1,360
M(d)2,500
341
a At times in February and March. b Backwater d Peak above base; discharge not determined.
c Maximum daily.
POPLAR RIVER BASIN
1780. Middle Fork Poplar River at international boundary
(International gaging station)
Location.--Lat 48°59'30", long 105°41'40", in Sfi£ sec.6, T.37 N., R.46 E., on left bank half a mile south of international boundary, ! § miles upstream from Coal Creek, and 18 miles northwest of Scobey, Mont.
Drainage area. 362 sq mi.
Gage. Recording. Altitude of gage is 2,460 ft (from topographic map).
Stage-discharge relation. Defined by current-meter measurements below 2,500 cfs and extended above on basis of slope-area measurement at 12,700 cfs.
Remarks. Station maintained jointly by the United States and Canada. No winter records for most years. Peak discharges not materially affected by few small diversions above station. Peaks are principally from snovmelt. Only annual peaks are shown.

184 POPLAR RIVER BASIN
Peak stages and discharges of Middle Pork Poplar River at International boundary
Water year
1931
19331934
1935
19361937193819391940
1941
1942
1943
1944
1945
19461947.
Date
Sept. 19, 1931
Mar. 19, 1933Mar. 14, 1934Apr. 3, 1934June 15, 1935
Apr. 12, 1936July 13, 1937Mar. 16, 1938Mar. 21, 1939Apr. 14, 1940Aug. 2, 1940
Mar. 8, 1941Mar. 26, 1941Mar. 10, 1942Apr. 4, 1942Mar. 28, 1943Mar. 30, 1943Apr. 1, 1944Apr. 2, 1944Mar. 13, 1945
Mar. 13, 1946Mar. 24, 1947Apr. 12, 1947
Gage height (feet)
3.45
a5.48a5.22
-6.32
4.535.635.278.78
a6.47-
a6.14-
a4.90-
a7.59-
a5.47-
a4,71
a4.59a5.33
-
Discharge (cfs)
173
365_186
1,650
3981,040
746b5,600
-990
-423-395-
3,120_
c300c300
227_457
Water year
19481949
1950
1951
1952
1953
19541955
1956195719581959
1960
196119621963
Date
Apr. 16, 1948Mar. 23, 1949Mar. 27, 1949Apr. 18, 1950
Apr. 7, 1951Apr. 28, May 1,
1951Apr. 7, 1952Apr. 13, 1952Mar. 28, 1953July 1, 1953Apr. 6, 1954Mar. 31, 1955Apr. 3, 1955
Mar. 27, 1956Mar. 23, 1957Mar. 30, 1958Mar. 12, 1959Mar. 22, 1959Mar. 21, 1960
Mar. 14, 1961Mar. 29, 1962June 21, 1963
Ga^e height (fe3t)
E.84a4.25
6.38
a6.45-
a8. 16
aE.48_
10.25ae.54
_
4.44be.o6.02
b4.47
7.57
bE.35bE.59£.17
Discharge (cfs)
1,210
c!751,710
-460
_3,500
76612,700
_cl,520
324ol60
1,590
c60o2,200
188755
7,410
a Backwater from ice.b About.c Maximum daily.
1785. East Poplar River at international boundary (Published as "East Fork Poplar River" prior to March If62)
(International gaging station)
Location. Lat 49°00'00", long 105°24'30", in SW£ sec.3, T.I, R.26 W., second meridian, on left bank 10 ft north of international boundary, 400 ft south west of Canadian East Poplar Port of Entry, 14 miles upstream from mouth, and 14 miles north of Scobey, Mont.
Drainage area. 534 sq mi.
Gage.--Recording. Datum of gage is 2,410.92 ft above mean sea level (Inter national Boundary Surveys datum).
Stage-discharge relation.--Defined by current-meter measurements lelow 2,100 cfs.
Remarks.--Station maintained jointly by Canada and the United States. No winter records for most years. Several diversions for irrigation above station do not materially affect peak flows. Peaks are principally from snowmelt. Only annual peaks are shown.
Peak stages and discharges
Water year
19311932
1935
1936
1937193819391940
19411942
1943
Date
Sept. 20, 1931Aug. 13, 1932
Mar. 18, 1935
Apr. 10, 1936Apr. 11, 1936July 15, 1937Mar. 15, 1938Mar. 22, 1939Apr. 15, 1940
Mar. 27, 1941Mar. 13, 1942Apr. 2, 1942Mar. 25, 1943Mar. 29, 1943
Gage height (feet)
4.5310.70
B7.90
a9.33-
4.43all. 0812.409.60
as. 87a?. 91
-ai2.8
-
Discharge (cfs)
36.92,030
b350
-20526.4
9502,760
953
752-
530-
2,050a Backwater from ice. b Maximum daily
Water year
1945
19461947
194819491950
1951
195219531954
1955
Date
Mar. 13, 1945
Mar. 14, 1946Mar. 25, 1947Apr. 11, 1947Apr. 16, 1948Mar. 27, 1949Apr. 14, 1950
Apr. 7, 1951Apr. 30, 1951Apr. 7, 1952Mar. 30, 1953Apr. 6, 1954Apr. 6, 1954Apr. 1, 1955
Gage height (feet)a?. 20
aiO. 21a 10 . 52
-11.39as. 0512.02
as. 96-
&12.10a6.91
ail. 52-
ail. 61
Discharge (cfs)
blSO
522-992
2,310t>.360
cl,790
-592
1,890250-
2,2701,650
c Maximum observed (dischargemeasurement). d About.

POPLAR RIVER BASIN 185
Water year
1956 1957 1958
1959 1960
Date
Mar. 25, 1956 Mar. 23, 1957 Mar. 28, 1958 Mar. 29, 1958 Mar. 18, 1959 Mar. 21, 1960
Gage height (feet)a6.93 a 4. 52 as. 55
a5. 68 all. 69
Discharge (cfs)
281 b45
b630 b48
dl,900
Water year
1961
1962
1963
Date
Mar. 14, 1961 May 30, 1961 Mar. 26, 1962 Mar. 27, 1962 Mar. 23, 1963
Gage height ( feet )
a5.96
a 9. 48 a9.24
Discharge (cfs)
321730
d720
a Backwater from ice. b Maximum daily. d About.
1795. West Fork Poplar River at International boundary
(International gaging station)
Location. Lat 49°00'00", long 106°22'00", In SE^ sec.5, T.I, R.3 W., third meridian, on right bank at West Poplar Canadian Customs Post, 100 ft north of International boundary, 8 miles upstream from Roanwood Coulee, and 10 miles north of Ophelm, Mont.
Drainage area. 139 sq ml.
Gage. Recording. Datum of gage Is 2,847.83 ft above mean sea level (Inter national Boundary Surveys datum).
Stage-discharge relation. Defined by current-meter measurements below 1,500 cfs and extended above on basis of contracted-opening and flow-over-road measurement at 5,450 cfs.
Remarks. Station maintained jointly by Canada and the United States. Nowinter records except water years 1936-37. No known regulation or diversion above station. Peaks are principally from snowmelt. Only annual peaks are shown.
Peak stages and discharges
Water year
1931 1932 1933
1935
1936
1937
1939 1940
1941
1942
Date
Mar. 21, 1931 Mar. 24, 1932 Mar. 18, 1933
Apr.18,19, 1935
Apr. 10, 1936 Apr. 14, 1936 Apr. 12, 1937
Mar. 23, 1939 Apr. 19, 1940
Mar. 20, 1941 Mar. 27, 1941 Mar. 14, 1942
Gage height ( feet )
1.52 3.04 3.36
b3.30 3.16 1.83
4.84 3.59
b3.78
b3.30
Discharge (cfs)
9.1 68
115
alO
388 4.6
3,750 739
194
Water year
1942 1943 1944 1945
1946 1947 1948 1949 1950
1951
1952
Date
Apr. 4, 1942 Mar. 29, 1943 Apr. 1, 1944 Mar. 13, 1945 Mar. 15, 1945
Mar. 24, 1946 Aug. 23, 1947 Apr. 16, 1948 Mar. 28, 1949 Apr. 17, 1950
Apr. 25, 1951 Apr. 26, 1951 Apr. 14, 1952
Gage height ( feet )
b4.80 b3.31 b3.99
2.87 2.96
b4.15 b2.50 b5.17
b4.71
5.15
Discharge (cfs)
72 a680 159
al75
225 291
c511 33
al,250
a655 5,450
a Maximum daily.b Backwater from ice.c Maximum observed (discharge measurement).
1800. West Fork Poplar River near Rlchland, Mont.
Location.--Lat 48°48', long 106°01', 600 ft south of northwest corner sec.7, T.35 N. , R.44 E., on Great Northern Railway bridge, a quarter of a mile up stream from Dodson Coulee and 1-| miles southeast of Rlchland.
Drainage area. 428 sq ml.
Gage. Nonrecordlng. Altitude of gage Is 2,660 ft (by barometer).
Stage-discharge relation.--Defined by current-meter measurements below 660 cfs.
Remarks.--No known diversion or regulation. Peaks are principally from snow- melt. Only annual peaks are shown.

186 POPLAR RIVER BASIN
Water year
1935
193619371938
19391940
19411942
1943
Date
July 9, 1935
Apr. 13, 1936July 17, 1937Mar. 14, 1938Mar. 17, 1938Mar. 23, 1939Aug. 2, 1940
Mar. 22, 1941Mar. 10, 1942Mar, 14, 1942Mar. 29, 1943
Gage height (feet)
4.12
4.60(a)
b6.505.50
C8.04.80
b5.26b4.41
-b8.24
Discharge (cfs)
416
70666
-1,330
03,600840
dl80-d80-
Water year
194319441945
1946
1947
1948
1949
Date
Mar. 30, 1943Apr. 1, 1944Mar. 13, 1945Mar. 15, 1945
Mar. 16, 1946Mar. 21, 1946Mar. 24, 1947Apr. 11, 1947Mar. 23, 1948Apr. 15, 1948Mar. 27, 1949Apr. 1, 1949
Gage height (feet)
7.28b-5.58bS.105.34
bi.56-
bS.404.62
b-5.805.42
b's.ee-
Discharge (cfs)
2,940d600-
1,070
_191-706-
1,210-
d310a Maximum gage height
b Backwater from ice.not determined; occurred during March
c About. d Maximum daily.(backwater from ice).
1805. Poplar River near Bredette, Mont.
Location.--Lat 48°25', long 105°12', in SW£ sec.27, T.31 N., R.50 E., 11 miles southeast of Bredette, 12 miles downstream from West Fork, and 24 miles north of Poplar.
Drainage area. 2,940 sq mi.
Gage. Nonrecording. Altitude of gage is 2,110 ft (from topographic map).
Stage-discharge relation. Defined by current-meter measurements below 4,000 cfs and extended above on basis of slope-area measurement at 40,000 cfs.
Remarks. Diversions above station do not materially affect peak flows, annual peaks are shown.
Peak stages and discharges
Only
Water year
19341935
19361937193819391940
1941
Date
Mar. 22, 1934July 18, 1935
Apr. 13, 1936July 16, 1937Mar. 15, 1938Mar. 24, 1939Apr. 14, 1940
Mar. 25, 1941Mar. 29, 1941
Gage height (feet)
6.808.40
8.008.479.7
12.609.7
alO.128.40
Discnarge (cfs)
9202,650
2,1702,7704,67011,6003,920
-2,060
Water year
19421943
19441945
19461947
Date
Mar. 17, 1942Mar. 25, 1943Mar. 26, 1943Apr. 5, 1944Mar. 14, 1945Mar. 20, 1945
July 9, 1946Mar. 23, 1947Apr. 13, 1947
Gage height (f 3et)
a8. 30a!2.812.47.51
a9.928.92
17.18alO.40
8.88
Discharge (cfs)
b800
ell, 0001,000
_2,780
40,000.
2,000
a Backwater from ice. b Maximum daily, c About.
1810. Poplar River near Poplar, Mont.
Location.--Lat 48°10'10", long 105°10'40", in NE^NE^ sec.19, T.28 N. , R.51 E., on right bank 4 miles north of Poplar and 11 miles upstream from mouth.
Drainage area. 3,174 sq mi.
Gage.--Nonrecording August 1908 to October 1924; recording thereafter. Altitude of gage is 1,970 ft (from topographic map). At site 3| miles upstream prior to May 1, 1911; at site 14 miles upstream May 1, 1911, to Oct. 4, 1913; and' at site 2 miles upstream Oct. 5, 1913, to Oct. 31, 1924; all at different datums.
Stage-discharge relation. Defined by current-meter measurements below 19,000 cfs and by slope-area measurement at 40,000 cfs made at site 20 miles up stream from present gage.
Remarks.--Diversions for irrigation of about 8,000 acres above station do not materially affect peak flows. Base for partial-duration serie", 500 cfs. Only annual peaks are shown prior to 1950.
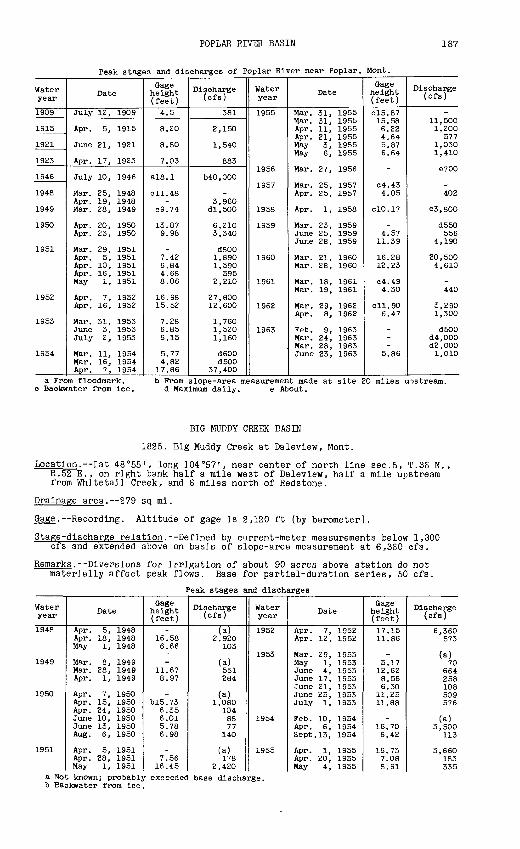
POPLAR RIVER BASIN 187
Peak stages and discharges of Poplar River near Poplar, Mont.
Water year
1909
1915
1921
1923
1946
1948
1949
1950
1951
1952
1953
1954
Date
July 12, 1909
Apr. 5, 1915
June 21, 1921
Apr. 17, 1923
July 10, 1946
Mar. 25, 1948Apr. 19, 1948Mar. 28, 1949
Apr. 20, 1950Apr. 23, 1950
Mar. 29, 1951Apr. 5, 1951Apr. 10, 1951Apr. 16, 1951May 1, 1951
Apr. 7, 1952Apr. 16, 1952
Mar. 31, 1953June 3, 1953July 2, 1953
Mar. 11, 1954Mar. 16, 1954Apr. 7, 1954
Gage height (feet)
4.5
8.20
8.80
7.03
alS.l
ell. 48-
C9.74
13.879.98
-7.426.844.688.06
16.9815.52
7.286.856.15
5.774.82
17.86
Discharge (cfs)
381
2,150
1,540
883
b40,000
-3,960
dl,500
6,2103,340
d8001,8901,590
5952,210
27,80012,600
1,7601,5201,160
d600d500
37,400
Water year
1955
1956
1957
1958
1959
1960
1961
1962
1963
Date
Mar. 31, 1955Mar. 31, 1955Apr. 11, 1955Apr. 21, 1955May 3, 1955May 6, 1955
Mar. 27, 1956
Mar. 25, 1957Apr. 25, 1957
Apr. 1, 1958
Mar. 23, 1959June 25, 1959June 28, 1959
Mar. 21, 1960Mar. 28, 1960
Mar. 18, 1961Mar. 19, 1961
Mar. 29, 1962Apr. 8, 1962
Feb. 9, 1963Mar. 24, 1963Mar. 28, 1963June 23, 1963
Gage height (feet)
clS.8715.586.224.645.876.64
-
04.434.05
clO.17
_4.57
11.39
16.2812.23
c4.494.30
ell. 906.47
---
5.86
Discharge (cfs)
11,5001,200
5771,0301,410
6700
-402
63,800
d550556
4,190
20,5004,610
-440
3,2901,300
d500d4,000d2,0001,010
a Prom floodmark. c Backwater from ice.
b Prom slope-area d Maximum daily.
measurement made at site e About.
20 miles upstream.
BIG MUDDY CREEK BASIN
1825. Big Muddy Creek at Daleview, Mont.
Location.--Lat 48°55', long 104°57', near center of north line sec.5, T.36 N. , R.52 E., on right bank half a mile west of Daleview, half a mile upstream from Whitetail Creek, and 6 miles north of Redstone.
Drainage area. 279 sq mi.
Gage.--Recording. Altitude of gage is 2,120 ft (by barometer).
Stage-discharge relation. Defined by current-meter measurements below 1,300 cfs and extended above on basis of slope-area measurement at 6,360 cfs.
Remarks. Diversions for irrigation of about 90 acres above station do not materially affect peak flows. Base for partial-duration series, 50 cfs.
Peak stages and discharges
Water year
1948
1949
1950
1951
Date
Apr. 5, 1948Apr. 18, 1948May 1, 1948
Mar. 8, 1949Mar. 28, 1949Apr. 1, 1949
Apr. 7, 1950Apr. 15, 1950Apr. 24, 1950June 10, 1950June 13, 1950Aug. 6, 1950
Apr. 5, 1951Apr. 28, 1951May 1, 1951
Gage height (feet)
-16.586.66
-11.678.97
-b!5.73
6.356.015.786.98
_7.56
16.45
Discharge (cfs)
(a)2,920
103
(a)551284
(a)1,080
1048877
140
(a)178
2,420
Water year
1952
1953
1954
1955
Date
Apr. 7, 1952Apr. 12, 1952
Mar. 29, 1953May 1, 1953June 4, 1953June 17, 1953June 21, 1953June 25, 1953July 1, 1953
Feb. 10, 1954Apr. 6, 1954Sept. 13, 1954
Apr. 1, 1955Apr. 20, 1955May 4, 1955
Gage height (feet)
17.1511.86
-5.1712.628.566.30
11.2511.88
-16.706.42
16.737.088.91
Discharge (cfs)
6,360573
(a)70
664258108509576
(a)3,500
113
3,660183335
a Not known; probably exceeded base discharge.b Backwater from Ice .

188 BIG MUDDY CREEK BASIN
Peak stages and discharges of Big.Muddy Creek near Daleview, Mont. Continued
Water year
1956
1957
1958
1959
1960
Date
Mar. 26, 1956
Mar. 23, 1957
Feb. 25, 1958Mar. 28, 1958Mar. 31, 1958
Mar. 18, 1959Mar. 22, 1959Mar. 25, 1959June 27, 1959Sept. 26, 1959
Mar. 21, 1960
Gage height (feet)
b6.03
b7.26
b7.8713.9011.56
--
5.5516.486.35
b!6.99
Discharge (cfs)
c60
c80
180897604
H(a)67
1,540101
4,590
Water year
1960
1961
1962
1963
Date
Mar. 27, 1960
Mar. 14, 1961May 31, 1961
Mar. 26, 1962Apr. 5, 1962June 6, 1962June 16, 1962July 19, 1962
Feb. 7, 1963Mar. 8, 1963Mar. 20, 1963Mar. 22, 1963
Gage height (feet)
14.49
10.3712.79
13.196.805.305.685.52
_-
b!4.10-
Discharge (cfs)
1,190
472683
864140607457
H(a)
(a)a Not known; probably exceeded base discharge.b Backwater from ice.c Maximum daily.
1830. Big Muddy Creek at Plentywood, Mont.
Location. Lat 48°46', long 104 °35', in NW£m£ sec.30, T.35 N. , R.55 E., at county road bridge half a mile southwest of Plentywood, 2 miles downstream from McCoy Creek, and 3 miles upstream from Box Elder Creek.
Drainage area. 850 sq mi.
Gage.--Nonrecordlng prior to July 1, 1948; recording July 1, 1948, to Sept. 30, 1953; and crest-stage since June 10, 1955. Altitude of gage is 1,980 ft (by barometer).
Stage-discharge relation. Defined by current-meter measurements below 2,800 cfs and extended above on basis of slope-area measurement at 7,240 cfs.
Remarks.--Diversions for irrigation of about 1,400 acres above gag<3 do not materially affect peak flows. Base for partial-duration series, 50 cfs. Only annual peaks are shown subsequent to 1953.
Peak stages and discharges
Water year
1948
1949
1950
1951
1952
Date
Apr. 19, 1948
Mar. 8, 1949Mar. 30, 1949
Apr. 6, 1950Apr. 18, 1950June 9, 1950June 13, 1950June 16, 1950Aug. 9, 1950
Apr. 3, 1951Apr. 8, 1951Apr. 30, 1951May 3, 1951June 7, 1951Aug. 30, 1951Sept. 4, 1951Sept. 7, 1951
Apr. 8, 1952July 21, 1952
Gage height (feet)15.64
-10.49
-12.27
----
_-
10.5911.383.854.113.863.16
19.003.15
Discharge (cfs)
a2,850
(b)1,020
(b)1,620
61119170105
M(b)1,1301,360
10813511155
7,24056
Water year
1953
1955
19561957195819591960
196119621963
Date
Apr. 1, 1953May 3, 1953May 14, 1953June 3, 1953June 6, 1953June 23, 1953June 30, 1953July 16, 1953Aug. 1, 1953
-
Mar. 22, 1956July 16, 195"Mar. 29, 1958June 30, 1959Mar. 22, 1960
May 30, 1961Mar. 27, 1962Mar. 22, 1963
Gage height (feet)
-3.643.09
12.488.919.44
19.405.248.82
-
d6.636.58
12.9210.61
d!7.37
6.0311.99
d!2.00
Discharge (cfs)
(b)10160
1,580824880
8,000262779
(c)
6300413
1,630945
e3,500
2601,2506750
a Annual peak only, c Below bottom of gage; e Approximate.
b Not determined; probably exceeded base discharge, discharge less than 210 cfs. d Backwater fron ice.

BIG MUDDY CREEK BASIN 189
1831. Box Elder Creek near Plentywood, Mont.
Location.--Lat 48°50' , long 104°30', in sec.34, T.36 N., R.55 E., at culverts on county road, 4 miles northeast of Plentywood.
Drainage area.--9.40 sq mi.
Gage.--Crest-stage gage. Altitude of gage is 2,190 ft (from topographic map).
Stage-discharge relation.--Defined by current-meter measurements below 50 cfs and extended above on basis of computed flow through culverts and over road at 126 and 328 cfs.
Remarks. Only annual peaks are shown.
Peak stages and discharges
Water year
1956 1957 1958 1959 1960
Date
March 1956 July 23, 1957 Mar. 30, 1958 June 26, 1959 Mar. 21, 1960
Gage height (feet)
0.25 7.24 1.88 3.89 6.24
Discharge (cfs)
0 328 22 126 265
Water year
1961 1962 1963
Date
July 30, 1961 Mar. 26, 1962 Sept. 17, 1963
Gage height (feet)
1.58 2.79 4.06
Discharge (cfs)
41 65
103
1832. Box Elder Creek at damsite, near Plentywood, Mont.
Location. Lat 48°48' , long 104°33' , in NE£ sec.17, T.35 N., R.55 E., at old damsite, ij miles north of Plentywood.
Drainage area. 19.9 sq mi.
Gage.--Crest-stage gage. Altitude of gage is 2,110 ft (from topographic map).
Stage-discharge relation.--Defined by current-meter measurements below 30 cfs, slope-area measurements at 890 and 1,400 cfs, and contracted-opening meas urement at 6,530 cfs.
Remarks. Only annual peaks are shown.
Peak stages and discharges
Water year
1953
1955
1956 1957 1958
Date
June 30, 1953
Mar. 29, 1955
July 23, 1957 Mar. 30, 1958
Gage height (feet)
6.52
2.42
3.56 .75
Discharge (cfs)
6,530
890
(a) 1,600
210
Water year
1959 1960
1961 1962 1963
Date
June 26, 1959 Mar. 22, 1960
Mar. 20, 1961 Mar. 26, 1962 Sept. 17, 1963
Gage height (feet)
1.38 2.27
1.26 1.59 .81
Discharge (cfs)
430 820
395 530 230
a No evidence of flow during year.
1833. Spring Creek near Plentywood, Mont.
Location.--Lat 48°49', long 104°27' , in SW^ sec.6, T.35 N., R.55 E., at culvert on county road, 5 miles northeast of Plentywood.
Drainage area. 7.05 sq mi.
Gage.--Crest-stage gage. Altitude of gage is 2,260 cfs (from topographic map).
Stage-discharge relation. Defined by current-meter measurements below 80 cfs and computation of flow through culvert and over road at 240 cfs.
Remarks.--Only annual peaks are shown.
219-848 O - 66 - 14

190 BIG MUDDY CREEK BASIN
Peak stages and discharges of Spring Creek near Plentywood, Mort .
Water year
1955
1956195719581959
Date
July 7, 1955
-July 23, 1957Mar. 30, 1958June 26, 1959
Gage height (feet)0.69
_2.771.491.30
Discharge (cfs)
5
(a)762520
Water year
1960
196119621963
Date
Mar. 21, 1960
July 30, 1961Mar. 26, 1962Sept. 17, 1963
Gage height ( feet )
5.19
1.201.32
b2.7
Discharge (cfs)
240
172472
a No evidence of flow during year, b Approximate.
1834. Spring Creek at Highway 16, near Plentywood, Mont.
Location.--Lat 48°46', long 104°31', in SE£ sec.21, T.35 N., R.55 E., at bridge on State Highway 16, 1^ miles east of Plentywood.
Drainage area. 16.9 sq mi.
Gage. Crest-stage gage. Altitude of gage is 2,040 ft (from topographic map).
Stage-discharge relation. Defined by current-meter measurements below 30 cfs and extended above on basis of slope-conveyance measurement at 540 cfs.
Remarks. Only annual peaks are shown.
Peak stages and discharges
Water year
1955
1956195719581959
Date
-
Apr. 3, 1956July 23, 1957Mar. 30, 195SJune 26, 1959
Gage height (feet)
-
0.743.3S2.403.70
Discharge (cfs)
(a)
454023O660
Water year
1960
196119621963
Date
May 24, 1960
Mar. 20, 1961Mar. 26, 1962Sept. 17, 1963
Gage height (feet)
3.56
1.022.853.61
Discharge (cfs)
600
10375620
a No evidence of flow during year.
1835. Big Muddy Creek at Reserve, Mont.
Location. Lat 48°36'25", long 104°27'30", on north line of NE£ sec.24, T.33 N. R.55 E., on downstream side of county road bridge at Reserve.
Drainage area. 1,044 sq mi.
Gage.--Nonrecording. At different datum prior to Oct. 31, 1924. Altitude of gage is 1,950 ft (from topographic map).
Stage-discharge relation. Defined by current-meter measurements in mainchannel.Defined by current-meter measurements below 2,900 cfs in overflow channel and extended above on basis of contracted-opening measurement at 4,540 cfs.
Remarks.--Small stock dams and diversions for irrigation of about 1,700 acres above station. Only annual peaks are shown. Peaks are combined flow in main channel and overflow channel.
Peak stages and discharges
Water year
1920
1921
1923 1924
Date
Mar. 31, 192O
June 19, 1921
July 7, 1923 Apr. 6, 1924
Gage height (feet)
13.65
13.2
8.95 12.20
Discharge (cfs)
1,2SO
1,O70
664 1,110
Water year
1950
1951 1952 1953
Date
Apr. 18, 1950
May 4, 1951 Apr. 8, 1952 July 2, 1953
Gag? height (feet)
-
Discharge (cfs)
al,520
1,3SO 6,300 2,810
a Maximum daily.

BIG MUDDY CREEK BASIN 191
1850. Big Muddy Creek near Culbertson, Mont.
Location. Lat 48°16', long 104°43', in NE^ sec.20, T.29 N., R.54 E., 11 miles upstream from mouth and 12 miles northwest of Culbertson.
Drainage area.--2 .447 sq mi.
Gage.--Nonrecording. At site 8 miles downstream at different datum prior to July 19, 1909. Altitude of gage is 1,910 ft (from topographic map).
Stage-discharge relation.--Defined by current-meter measurements.
Remarks.--No winter records collected. Several small diversions for irrigation above station should not materially affect peak flows. Only annual observed peaks are shown, except as noted.
Peak stages and discharges
Water year
1909 1910
1911 1912 1913 1914
Date
Apr. 10, 1909Mar. 13, 1910
Apr. 7, 1911 Apr. 11, 1912 Apr. 7, 1913 Apr. 4, 1914
Gage height (feet)6.17.3
5.8 10.81 7.2
10.0
Discharge (cfa)
451529
280 al,160
526 1,010
Water year
1916 1917 1918 1919 1920
1921
Date
Mar. 31, 1916 Apr. 17, 1917 Mar. 30, 1916 Apr. 6, 1919 Apr. 6, 1920
Mar. 26, 1921
Gage height (feet)11.4 11.1 9.5 9.6 9.8
8.56
Discharge (cfs)
1,550 1,460 1,070 1,100 1,150
866a Momentary maximum.
MISSOURI RIVER MAIN STEM
1855. Missouri River near Culbertson, Mont.
Location.--Lat 48°07'20", long 104°28'20", in E^NWi sec.3, T.27 N. , R.56 E.,on left bank 580 ft downstream from bridge on State Highway 16, 3 miles south east of Culbertson, and 10 miles downstream from Muddy Creek.
Drainage area. 91,557 sq mi.
Gage.--Recording, except for period Aug. 18, 1950, to Dec. 31, 1951, when non- recording was on bridge 580 ft upstream at present datum. Datum of gage is 1,883.4 ft above mean sea level, datum of 1929 (Corps of Engineers bench mark).
Stage-discharge relation. Subject to large shifts, measurements below 30,000 cfs.
Defined by current-meter
Remarks.--Diversions for irrigation of about 1,020,000 acres above station. Regulation by Port Peck Reservoir. Peak flows are materially affected. Only annual peaks are shown.
Peak stages and discharges
Water year
1942 1943 1944
1945
1946 1947
1948
1949
Date
Aug. 30, 1942 Mar. 26, 1943 Oct.1,7-9, 1943Jan. 16, 1944 Oct. 15, 1944 Jan. 11, 1945
Aug. 25, 1946 Mar. 28, 1947Aug. 14, 1947 Apr. 13, 1948 Sept. 17, 1948 Oct. 1, 1948 Oct. 15, 1948
Gage height (feet)
9.46 a!5.12
all. 22
a!2.08
10.78 a!4.83
a!2.26
11.35
Discharge (cfs)
14,800 78,200 21,OOO
19,900
20 , 400
30,400
29,300
30 , 700
Water year
1950
1951
1959
1960
1961
1962
1963
Date
Apr. 17, 1950
Mar. 26, 1951Apr. 9, 1951
Mar. 25, 1959Mar. 27, 1959Mar. 23, 1960
Dec. 28, 1960 July 3, 1961 Apr. 9, 1962 July 20, 1962 Feb. 9, 1963
Gage height (feet)
al2 . 44
al5.10
a!4.23a!9.14
all. 43
a!3.32
a!3.05
Discharge (cfs)
b23,000
_34,500
b2 1,500-
055,000
d!4,4OO
16,700 cl6,000
a Backwater from ice. b Maximum daily, maximum discharge occurred 12 p.m. Sept. 30,
c About. d Maximum peak discharge; on a rise that crested Oct. 2, 1961.

192 YELLOWSTONE RIVER BASIN
1865. Yellowstone River at Yellowstone Lake Outlet, Yellowstone National Park
Location.--Lat 44°34'00", long 110°22'50", on left bank 550 ft downstream from Pishing Bridge and a quarter of a mile downstream from outlet of Yellowstone Lake.
Drainage area.--1,006 sq ml.
Gage.--Nonrecordlng at site 550 ft upstream at datum 1.07 ft higher prior to Oct. 2, 1928; recording thereafter. Datum of gage Is 7,727.77 ft above mean sea level, datum of 1929.
Stage-discharge relation.--Defined by current-meter measurements.
Remarks. Plow regulated by natural storage In Yellowstone Lake. Peaks are principally from snowmelt. Only annual peaks are shown.
Peak stages and discharges
Water year
192319241925
19261927
1928
19291930
19311932193319341935
19361937
193819391940
19411942
Date
July 6, 1923July is, 1924July 5, 1925
June 13-16,1926June 29 to July 1,
1927May 31 to June 30,
1928July 2-5, 1929June 23, 1930
June 18, 1931July 3, 1932June 2S, 1933June 22, 1934July 1, 1935
June IS, 1936June 24 to July 2,
1937July 1, 193SJuly 2-9, 1939June 21-23,1 940
June 23-28,1941July X) -12, 1942
Gage height (feet)
4.803.67
a6.2O
3.956.3
5.4
5.25.20
4.396.245.763.745.62
5.765.11
6.544.975.30
4.735.60
Discharge (cfs)
4,6002,7607,220
3,2107,420
5,680
3,7003,870
2,4805,5704,6901,8004,520
4,6903,590
5,9503,2303,590
2,7503,960
Water year
194319441945
19461947194819491950
19511952195319541955
195619571958
19591960
196119621963
Date
July 9, 1943July 7, 1944July 17, 1945
June 24, 1946July 11, 1947June 17, 1948June 22, 1949July 11, 1950
July 7, 1951June 15, 1952July 6, 1953July 7, 1954June 29, 1955
June 21, 1956July 3, 1957June 13, 1958June 25, 1958June 28, 1959June 21, 1960
June 18,23,1961July 1, 1962June 29, 1963
Gage height (feet)
7.355.245.70
5.466.036.576.336.87
6.296.395.766.635.73
7.556.48
_5.406.605.26
5.656.856.60
Discharge (cfs)
6,9203,4903,930
3,7104,5205,6105,3106,150
5,1305,3604,2505,6104,130
7,6105,3403,520
5,6103,220
3,7805,8205,320
a Might have been higher on July 7, 1925.
1870. Yellowstone River near Canyon Hotel, Yellowstone National Park
Location.--Lat 44°42'20", long 110°30'10", on left bank 0.5 mile upstream from Upper Falls and Canyon ranger station and l£ miles south of Canyon Hotel.
Drainage area. 1,157 sq ml.
Gage. Nonrecordlng at site 900 ft upstream at different daturas prior to Oct.11, 1916; recording thereafter. Altitude of gage Is 7,620 ft (from topographic map).
Stage-discharge relation. Defined by current-meter measurements.
Remarks. No winter records collected. Natural regulation by Yellowstone Lake. Peaks are principally from snowmelt. Only annual peaks are shown.
Peak stages and discharges
Water year
1913 1914 1915
1916 1917 1918
Date
June 23,25,1913 June 22- 26,1914 July 24-26,1915
July 4-6,1916July 11, 1917 June 27, 1918
Gage height (feet)
5.35 4.1 2.9
5.04. OS 4.50
Discharge (efs)
a7,060 4,940 2,830
6.4707,220
b8,550
Water year
1921 1922 1923
1924 1925
Date
June 19, 1921 June 25, 1922 June 21-25,1923, July 4-6,1923 July 7, 1924 July 5, 1925
Gag's height (feet)
3.45 3.10 3.1
2.48 4.14
Discharge (cfs)
5,480 4,680 4,540
3,200 7,340
a Might have been higher during period of no record, b Was probably higher several days earlier.

YELLOWSTONE RIVER BASIN 193
Peak stages and discharges of Yellowstone River near Canyon Hotel, Yellovstone National Park Continued
Water year
19261927192819291930
19311932193319341935
19361937
1938
Date
Juie 11-14,1926June 30, 1927June 2-5, 1928July 2, 1929June 23-25, 1930
June 18, 1931July 3, 1932June 26, 1933June 22, 1934June 28 to July 3,
1935
June 17, 1936June 26, 1937,July 1, 1937June 30, 1938,July 1, 1938
Gage height (feet)
2.64.233.62.82.76
2.243.553.131.813.12
3.212.72
3.73
Discharge (cfs)
3,5207,8905,8403,7403,850
2,7005,6804,6801,8504,560
4,8003,660
5,960
Water year
19391940
19411942194319441945
19461947194819491950
1951
Date
July 3-9, 1939June 21, 1940
June 25, 1941July 9-13,1942July 7-10,1943July 6-8, 1944July 16-18,1945
June 20, 1946June 27, 1947June 17-2Q1948June 22, 1949July 11, 1950
July 10, 1951
Gage height (feet)
2.582.83
2.402.914.122.662.91
2.803.183.623.463.81
3.43
Discharge (efs)
3,3403,770
2,8903,9907,3503,5704,060
3,7704,7505,7905,5506,420
5,370
1875. Tower Creek at Tower Falls, Yellowstone National Park
Location.--Lat 44°54' , long 110°23', just upstream from Tower Falls, s quarter of a mile upstream from mouth and 2 miles southeast of Camp Roosevelt.
Drainage area. 50.4 sq ml.
Gage. Nonrecordlng. Altitude of gage Is 6,400 ft (from topographic map). At datum 2.22 ft lower prior to Sept. 26, 1931. At different datum Sept. 26, 1931, to July 11, 1933. At datum 0.50 ft higher July 12, 1933, to Oct. 13, 1934.
Stage-discharge relation.--Defined by cuTent-meter measurements belov 350 cfs.
Remarks. No diversions or regulation. Peaks are principally from snowmelt. Only annual maximum observed peaks or maximum dally discharges are shown. Peak discharge does not greatly exceed maximum observed.
Peak stages and discharges
Water year
1923 1924 1925
1926 1927 1928 1929 1930
1931 1932 1933
Date
June 12, 1923 May 18, 1924 May 30, 1925
May 24, 30, 1926 June 22 ,25,1927 May 28, 1928 June 15, 1929 June 11, 1930
June 3, 1931 June 16,17,1932 June 11,12,13,
1933
Gage height (feet)
5.25 5.40 6.16
5.16 6.11 6.27 5.33
-
Discharge (efs)
316 369 642
272 583 637 284
a250
a250 a275 a350
Water year
1934 1935
1936
1937 1938 1939 1940
1941 1942 1943
Date
May 7 , 8, 1934 June 12, 1935
May 31, June 1, 1936
June 16,17, 1937 June 8, 1938 May 29, 1939 June 1, 1940
May 27, 1941 June 9, 1942 June 24, 1943
Gage height (feet)
_5.60
5.55 5.25 5.08
5.30 5.90
Discharge (cfs)
alOO 425
a300
al20 405 292 243
a200 327 598
a Maximum daily.

194 YELLOWSTONE RIVER BASIN
1880. Lamar River near Tower Falls ranger station, Yellowstone National Park
Location. Lat 44°55'40", long 110 C23'35", on left bank 0.5 mile northeast of Cooke City highway, half a mile upstream from mouth, and li miles northeast of Tower Falls ranger station.
Drainage area. 660 sq ml.
Gage. Nonrecordlng prior to Sept. 16, 1925; recording thereafter. At datum 1.00 ft higher prior to July 30, 1927. Altitude of gage Is 5,910 ft (from topographic map).
Stage-discharge relation. Fairly stable. Defined by current-meter measurements below 11,000 cfs.
Remarks. Peaks are principally from snowmelt. Base for partial-duration series,
Peak stages and discharges
Water year
1923
1924
1925
1926
1927
1928
1929
1930
1931
1932
1933
1934
1935
1936
1937
1938
1939
1940
1941
1942
Date
June 12, 1923
June 15, 1924
May 30, 1925
May 21, 1926May 24, 1926
June 9, 1927June 12, 1927June 19, 1927June 24, 1927June 27, 1927
May 25, 1928
May 25, 1929June 9, 1929June 15, 1929June 29, 1929
May 30, 1930June 12, 1930
June 3, 1931
May 22, 1932June 15, 1932June 25, 1932
June 2, 1933June 12, 1933
May 9, 1934
June 13, 1935
May 15, 1936June 1, 1936
May 25, 1937May 28, 1937June 22, 1937
May 10, 1938June 2, 1938June 5, 1938June 16, 1938
May 30, 1939
May 13, 194OMay 27, 194OJune 1, 1940
May 27, 1941
May 26, 1942
Gage height (feet)
5.6
4.70
7.83
5.856.03
7.288.627.867.747.78
9.75
7.297.207.566.51
6.86.41
7.7
7.607.127.57
7.168.06
5.86
8.36
7.487.75
6.276.836.36
7.426.578.186.60
7.28
6.286.516.53
5.94
7.12
Discharge (cfs)
a6,200
a4,390
all, 500
6,8707,310
10,00013,10011,30011,00011,100
al3,600
7,4207,2108,0805,770
6,6605,820
8,650
8,4207,3108,420
7,3109,340
4,740
10,300
8,1908,880
5,6206,6605,820
7,9906,1909,8006,290
7,770
5,6206,0306,030
4,840
7,310
Water year
1942
1943
1944
1945
1946
1947
1948
1949
1950
1951
1952
1953
1954
1955
1956
1957
1958
1959
1960
Date
June 9, 1942
June 1, 1943June 14, 1943June 20, 1943June 26, 1943July 1, 1943
May 31, 1944
June 24, 1945June 27, 1945
June 6, 1946June 12, 1946
May 8, 1947June 20, 1947
May 22, 1948May 29, 1948June 4, 1948
May 17, 1949May 28, 1949June 12, 1949
June 7, 1950June 17, 1950June 22, 1950July 2, 1950
May 24, 1951May 28, 1951June 17, 1951
June 7, 1952
June 14, 1953June 19, 1953
May 22, 1954June 24, 1954
June 16, 1955June 23, 1955
June 2, 1956June 12, 1956
June 5, 1957June 13, 1957
May 24, 1958
June 7, 1959June 15, 1959
May 13, 1960
Gage height (feet)
7.80
_6.929.28f.46f.26
f.03
7.39T.54
7.10e.40e.557.28
e.oi£.82-
e.43e.58e.947.287.697.846.86
7.608.147.80
8.29
8.728.28
7.557.68
6.776.48
9.117.20
8.777.23
7.84
8.489.48
6.18
Discharge (cfs)
8,880
bll,0006,700
12,30010,3009,800
5,090
7,7208,030
7,1005,730
6,2007,680
9,94011,800
ell, 000
5,9106,1906,880
7,5508,3808,6906,720
8,1909,3408,610
9,670
10,8009,750
8,0508,340
6,6706,100
11,3008,110
10,9007,360
8,700
10,50013,000
5,550a Annual peak only.b Maximum daily discharge;c About.
estimated.

YELLOWSTONE RIVER BASIN 195
Peak stages and discharges of Lamar River near Tower Palls ranger station, Yellowstone National Park Continued
Water- year
1960
1961
1962
Date
June 3, 1960June 9, 1960June 15, 1960
June 3, 1961
June 3, 1962
Gage height (feet)
7.306.726.56
7.09
6.48
Discharge (cfs)
7,8706,6606,340
7,280
5,960
Water- year
1962
1963
Date
June 16, 1962June 27, 1962
June 2, 1963June 14, 1963
Gage height (feet)
7.506.97
7.287.30
Discharge (cfs)
8,0906,960
8,2908,330
1890. Blacktail Deer Creek near Mammoth, Yellowstone National Park
Location.--Lat 44°57', long 110°35', 0.3 mile upstream from East Fork, half a mile upstream from bridge on Mammoth-Tower Falls highway, and 6 miles south east of Mammoth.
Drainage area.--15.0 sq mi.
Gage. Recording. Altitude of gage is 6,590 ft (from topographic map).
Stage-discharge relation.--Defined by current-meter measurements below 60 cfs.
Remarks. Peaks are principally from snowmelt. Only annual peaks are shown.
Peak stages and discharges
Water year
1938
1939 1940
1941
Date
Jan. 4, 1938 June 6, 1938 May 16,17, 1939 May 13, 1940
May 26, 1941
Gage height (feet)a2.40 2.10 1.88 2.11
1.88
Discharge (cfs)
56 37 52
37
Water- year
1942
1943 1944 1945
Date
Apr. 4, 1942 June 8, 1942 June 1, 1943 June 10, 1944 June 27, 1945
Gage height (feet)
a2.61 2.29 3.17 1.97 1.97
Discharge (cfs)
68 168 48 51
a Backwater from ice.
1905. Gardner River at Mammoth, Yellowstone National Park(Published as "Gardiner River near Mammoth Hot Springs" prior to
Oct. 1, 1923, as "Gardiner River at Mammoth Hotel* Oct. 1,1923, to Sept. 30, 1937, and as "Gardiner River at Mammoth"Oct. 1, 1937, to Oct. 31, 1938)
Location. Lat 44°59', long 110°41', a quarter of a mile downstream from foot bridge on Mount Everts trail, half a mile upstream from Hot River (formerly Boiling River), 0.9 mile northeast of Mammoth, and 3f miles upstream from mouth.
Drainage area. 200 sq mi.
Gage. Nonrecording at site a quarter of a mile upstream at different datum prior to June 10, 1927, and at described site and datum June 10 to July 29, 1927; recording thereafter. Altitude of gage is 5,680 ft (from topographic map).
Stage-discharge relation. Defined by current-meter measurements below 1,500 cfs.
Remarks.--No regulation or diversions above station. Peaks are principally from snowmelt. Only annual peaks are shown.
Peak stages and discharges
Water year
1923 1924 1925
1926 1927
Date
June 12, 1923 May 18, 1924 June 22, 1925
May 24. 1926June 12, 1927
Gage height (feet)
4.22 4.10
6.503.35
Discharge (cfs)
S80 566
1,500
5501,540
Water year
1928 1929 1930
1931
Date
May 28, 1928 June 15, 1929 May 30, 1930
May 16, June 4, 1931
Gage height (feet)
3.59 2.52 2.48
2.13
Discharge (cfs)
1,790 8007S6
553

196 YELLOWSTONE RIVER BASIN
Peak stages and discharges of Gardner River at Mammoth, Yellowstone National Park Continued
Water year
1932 1933 1934 1935
Date
June 16, 1932 June 11, 1933 May 9, 1934 June 12, 1935
Gage height (feet)
2.70 2.86 2.13 2.98
Discharge (cfs)
955 1,070
547 1,200
Water year
1936 1937 1938
Date
May 15, 1936 May 29, 1937 June 6, 1938
Gase height (fe3t)
2.81 2.24 2.88
Discharge (cfs)
1,040 621
1,110
1910. Gardner River near Mammoth, Yellowstone National Park (Published as "Gardiner River near Mammoth" prior to
October 1959)
Location. Lat 44°59'35", long 110°41'25", on left bank at Wyoming-Montana State line, 400 ft upstream from highway bridge, half a mile do-«istream from Hot River (formerly Boiling River), li miles north of Mammoth, and 3 miles upstream from mouth.
Drainage area.--202 sq mi.
Gage.--Recording. Altitude of gage is 5,620 ft (from topographic map).
Stage-discharge relation. Defined by current-meter measurements balow 1,600 cfs.
Remarks. Peaks are series, 700 cfs.
principally from snowmelt. Base for partial-diration
Peak stages and discharges
Water year
1939
1940
1941
1942
1943
1944
1945
1946
1947
1948
1949
1950
1951
Date
May 17, 1939May 31, 1939
May 13, 1940
May 27, 1941
May 26, 1942June 7, 1942June 9, 1942
June 1, 1943June 20, 1943
June 9, 1944
June 7, 1945June 23, 1945June 27, 1945
Apr. 26, 1946Apr. 30, 1946May 28, 1946June 6, 1946
May 4, 1947May 10, 1947May 27, 1947June 9, 1947June 20, 1947
May 22, 1948May 29, 1948
May 17, 1949May 28, 1949June 10, 1949
May 22, 1950May 27, 1950June 7, 1950June 22, 1950
May 29, 1951
Gage height (feet)
3.313.15
3.12
2.98
3.223.34-
4.524.55
3.34
3.323.633.71
3.333.353.413.81
3.453.773.343.744.10
3.523.91
-3.583.44
3.393.413.963.93
3.73
Discharge (cfs)
835752
755
689
838-975
1,6501,660
761
717914966
741753810
1,070
9121,120
8441,1001,330
9581,210
a880948827
796808
1,1501,250
1,070
Water year
1951
1952
1953
1954
1955
1956
1957
1958
1959
1960
1961
1962
1963
Date
June 17, 1951
May 4, 1952May 14, 1952June 7, 1952
May 19, 1953May 29, 1953June 13, 1953June 18, 1953
May 22, 1954June 16, 1954June 24, 1954
June 14, 1955
June 4, 1956
May 14, 1957May 19, 1957June 5, 1957
May 26, 1958June 10, 1958
May 16, 1959June 7, 1959June 16, 1959
June 4, 1960June 15, 1960
May 28, 1961June 9, 1961
May 9, 1962May 21, 1962June 4, 1962June 16, 1962
June 4, 1963June 15, 1963
Gage height (feet)
3.65
3.723.164.02
2.873.324.204.23
3.843.213.67
3.42
4.46
3.163.154.11
3.663.12
2.623.483.87
3.072.67
2.833.20
3.733.183.534.78
3.263.36
Discharge (cfs)
974
1,110793
1,290
703968
1,5301,550
1,300926
1,200
982
2,080
786780
1,610
1,160762
7201,6802,030
1,210790
9761,250
1,200815
1,0601,300
9641,060
a Maximum daily.

YELLOWSTONE RIVER BASIN 197
1915. Yellowstone River at Corwin Springs, Mont. (Published as "at Horr" 1889-1893)
Location. Lat 45°06'40", long 110°47'40", in SE^NW^- sec.30, T.8 S., R.8 E. , on left bank 20 ft downstream from highway bridge at Corwin Springs, if miles upstream from Mol Heron Creek, and 7 miles northwest of Gardiner.
Drainage area. 2,623 sq mi.
Gage.--Nonrecording prior to Apr. 20, 1935; recording thereafter. At sites 2 miles upstream at different datums Aug. 12, 1889, to Nov. 4, 1893. Datum of gage is 5,079.09 ft above mean sea level, datum of 1929, supplementary adjustment of 1940.
Stage-discharge relation. Defined by current-meter measurements below 23,000 cfs.
Remarks. Natural storage in Yellowstone Lake. Small diversions do not affect peak flows. Peaks are principally from snowmelt. Base for partial-luration series, 12,000 cfs. Only annual observed peaks are shown prior to 1935, except as noted.
Peak stages and discharges
Water year
1890
189118921893
19111912191319141915
19161917191819191920
1921192219231924
1925
19261927192819291930
1931193219331934
1935
1936
1937
1938
1939
1940
1941
1942
Date
May 28, 1890,June 11, 1890
June 7, 1891June 21, 1892June 13, 1893
June 13, 1911June 10, 1912June 8, 1913June 4, 1914June 25, 1915
June IS, 1916June 25, 1917June 14, 1918May 29, 1919June 15, 1920
June 12, 1921June 7, 1922May 26, 1923May 26, 1924,June 15, 1924May 30, 1925
May 24,26, 1926June 27, 1927May 26, 1928June 17, 1929June 11, 1930
June 3, 1931June 25, 1932June 16, 1933May 7, 1934
June 14, 1935
May 15, 1936June 1, 1936
May 28, 1937
May 2S, 1938June 6, 1938
May 31, 1939
June 1, 1940June 14, 1940
May 27, 1941
May 27, 1942June 5, 1942June 9, 1942June 16, 1942
Gage height (feet)
8.25
6.5510.49.20
10.2S.49.67.95.4
9.89.6
11.56.9S.32
9.37.87.45.9
9.07
6.810.010.07.46.6
7.07.77.755.4
8.08
7.157.47
6.26
7.268.19
7.02
6.4Z6.30
5.70
6.286.337.846.28
Discharge (cfs)
11,900
S,98016,00013,600
25,80016,70023,20014,9007,720
24,00023,20032,00011 , 900
a!7,800
21,80014,60013,4009,030
20,800
11,60025,00025,30014,40011,700
13,00015,30015,800S,4SO
17,700
14,90015,300
12,100
15,70018,100
14,300
12,40012,100
10,300
12,10012,00016,80012,000
Water year
1943
1944
1945
1946
1947
1948
1949
1950
1951
1952
1953
1954
1955
1956
1957
1958
1959
1960
Date
May 30, 1943June 22, 1943
June 27, 1944
June 24, 1945June 27, 1945
May 28, 1946June 6, 1946June 12, 1946
May 10, 1947June 9, 1947June 20, 1947
May 22, 1948May 29, 1948June 4, 1948
May 18, 1949May 29, 1949June 12, 1949
June 7, 1950June 23, 1950July 1, 1950
May 24, 1951May 29, 1951June 17, 1951
May 4, 1952June 7, 1952
June 14, 1953June 19, 1953July 1, 1953
May 22, 1954June 16, 1954June 27, 1954
June 16, 1955
June 2, 1956June 13, 1956
June 5, 1957
May 24, 1958
June 7, 1959June 10, 1959June 15, 1959
June 4, 1960June 9, 1960
Gage height (feet)
7.659.64
6.42
7.8S.14
6.407.436.93
6.827.068.22
7.778.629.00
6.476.917.37
7.708.417.70
7.588.298.34
6.573.68
8.468.376.47
7.616.56S.16
7.11
9.398.68
8.48
7.46
8.137.639.02
7.016.52
Discharge (cfs)
15,90024,400
12,000
17,10018,300
12,00015,60013,800
13,40014,50018,700
17,00020,40022,000
12,30013,30015,500
16,30019,10016,300
16,30019,00019,200
12,60020,700
19,70019,40012,300
16,40012,60018,500
14,800
23,70020,700
19,800
15,800
18,00016,00021,600
14,20012,400
a Momentary maximum.

198 YELLOWSTONE RIVER BASIN
Peak stages and discharges of Yellowstone River at Corwin Springs, Mont. Continued
Water year
1960
1961
1962
Date
June 15, 1960
May 30, 1961 June 9, 1961
June 4, 1962
Gage height (feet)
6.53
6.71 7.20
6.60
Discharge (cfs)
12,500
13,100 14,800
13,400
Water year
1962
1963
Date
June 16, 1962
June 3, 1963 June 15, 1963
Gage height (feet)
7.93
7.45 7.98
Discharge (cfs)
18,700
15,800 17,800
1920. Mill Creek near Pray, Mont.
Location. Lat 45°21'35", long 110°37'00", in SW^NE^ sec.33, T.5 S., R.9 E., on downstream side of left abutment of private bridge a quarter of a mile down stream from Davis Creek, 3-| miles southeast of Pray, and 4-J miles upstream from mouth.
Drainage area. 148 sq mi.
Gage. Nonrecording. Altitude of gage is 5,160 ft (from topographic map).
Stage-discharge relation. Defined by current-meter measurements below 1,200 cfs.
Historical data.--Stage of May 1948 flood is highest known.
Remarks. Diversion for irrigation of about 3,500 acres materially affect peak flows. Peaks are principally from snowmelt. Only annual peaks are shown.
Peak stages and discharges
Water, year
1948
1951 1952 1953
Date
May 1948
June 17, 1951 June 6, 1952 June 13, 1953
Gage height (feet)
a6.0
2.40 3.20 2.80
Discharge (cfs)
1,160 2,300 1,550
Water year
1954 1955
1956
Date
June 23, 1954 June 22, 1955
Nov. 17, 1955 May 23, 1956
Gige height (feet)
3.20 2.70
t4.6
Discharge (cfs)
2,040 930
1,930
a About; from information by local residents, b Backwater from ice.
1925. Yellowstone River near Livingston, Mont.
Location. Lat 45°35'50", long 110°33'55", in NW^NW^ sec.12, T.3 S., R.9 E., on right bank 50 ft downstream from bridge on U.S. Highway 89, 2 miles down stream from Suce Creek, and 4 miles south of Livingston.
Drainage area. 3,551 sq mi.
Gage.--Nonrecording prior to Feb. 4, 1951; recording thereafter. At different datura May 2, 1897, to Dec. 31, 1905. Datum of gage is 4,542.49 ft above mean sea level, datum of 1929.
Stage-discharge relation. Defined by current-meter measurements.
Remarks. Natural regulation by Yellowstone Lake. Diversions for irrigation of about 24,200 acres do not materially affect peak flows. Peaks are princi pally from snowmelt. Base for partial-duration series, 13,500 cfs. Only annual observed peaks are shown prior to 1948.
Peak stages and discharges
Water year
1897 1898 1899 1900
1901 1902 1903 1904
Date
June 1, 1897 June 19, 1898 June 20, 1899 June 7, 1900
May 20, 1901 June 11, 1902 June 18, 1903 June 23, 1904
Gage height (feet)
6.9 7.7 8.6 5.0
6.1 6.6 8.5 8.94
Discharge (cfs)
28,100 23,940 26,280 16,875
26,525 30,100 21,300 20,120
Water year
1905
1929 1930
1931 1932
1938
Date
June 5, 1905
June 17, 1929 May 31, 1930
June 4, 1931 June 25, 1932
June 6, 1938
Gage height (feet)
7.4
7.42 6.61
6.31 7.76
7.60
Discharge (cfs)
13,820
19,000 15,500
14,200 20,800
18,300

YELLOWSTONE RIVER BASIN 199
Peak stages and discharges of Yellowstone River near Llvlngston, Mont. Continued
Water year
19391940
19411942194319441945
19461947
1948
1949
1950
1951
1952
Date
May 31, 1939June 2,14, 1940
May 27, 1941June 9, 1942June 20, 1943June 27, 1944June 27, 1945
June 6, 1946June 20, 1947
May 22, 1948May 29, 1948June 4, 1948
May 18, 1949May 29, 1949June 12, 1949
June 7, 1950June 23, 1950
May 24, 1951May 29, 1951June 17, 1951
May 4, 1952June 7, 1952
Gage height (feet)6.896.30
5.407.559.346.067.60
6.757.85
7.528.249.10
6.056.326.88
7.057.82
6.877.447.58
6.028.20
Discharge (cfs)
15,40013,100
10,60018,50030,60013,50020,400
15,80020,600
19,30022,60026,800
14,20015,30017,500
18,20021,400
16,90019,40020,000
13,50022,800
Water year
1953
1954
1955
1956
1957
1958
1959
1960
1961
1962
1963
Date
June 14, 1953
May 22, 1954June 27, 1954
June 16, 1955
June 2, 1956
June 5, 1957July 1, 1957
May 26, 1958
June 7, 1959June 15, 1959
June 4, 1960June 15, 1960
June 9, 1961
June 4, 1962June 16, 1962
June 3, 1963June 15, 1963
Gage height (feet)
7.75
6.867.49
6.29
8.57
7.715.85
6.64
7.718.43
6.215.97
6.47
6.117.33
6.757.32
Discharge (cfs)
21,200
17,20020,400
14,900
25,800
21,90013,800
17,100
21,00024,200
15,70014,700
15,600
14,80020,400
17,40020,200
1930. Shields River near Wilsall, Mont.
Location.--Lat 46°09', long 110°35', in SE^NW^ sec.34, T.5 N., R.9 E., on left bank 11 miles northeast of Wilsall and 12 miles upstream from Flathead Creek.
Drainage area. 87.8 sq mi.
Gage.--Nonrecording. Altitude of gage is 5,590 ft (by barometer. At site 800 ft downstream at different datum prior to Oct. 13, 1942.
Stage-discharge relation. Defined by current-meter measurements below 730 cfs.
Remarks. Diversions for irrigation of about 3,100 acres do not materially affect peak flows. Peaks are principally from snowmelt. Only annual peaks are shown.
Peak stages and discharges
Water year
1936 1937 1938 1939 1940
1941 1942 1943 1944 1945
1946
Date
May 15, 1936 May 8, 1937 May 28, 1938 May 4, 1939 May 13, 1940
June 9, 1941 May 27, 1942June 1, 1943 June 9, 1944 June 5, 1945
May 28, 1946
Gage height (feet)
2.20 1.76 3.00 1.91 2.28
2.33 3.072.60 3.20 2.30
2.40
Discharge (cfs)
523 251 850 233 400
380 615450 870 296
300
Water year
1947 1948 1949 1950
1951 1952 1953 1954 1955
1956 1957
Date
May 10, 1947 June 4, 1948 May 18, 1949 June 18, 1950
May 18, 1951 May 26, 1952 June 3, 1953 June 11, 1954 June 17, 1955
May 29, 1956 May 15, 1957
Gage height (feet)
3.20 4.8 4.0 4.13
4.20 4.21 5.15 3.90 4.08
4.32 4.05
Discharge (cfs)
662 1,770
485 579
635 674
1,350 580 641
800 650
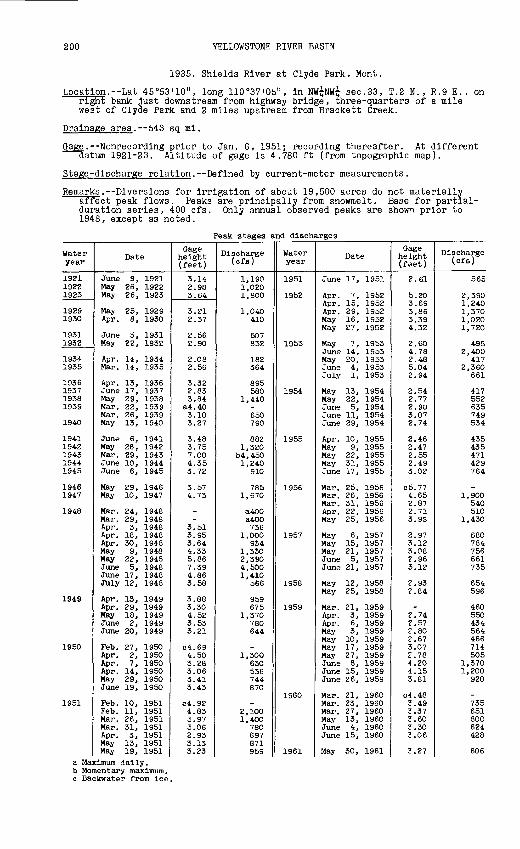
200 YELLOWSTONE RIVER BASIN
1935. Shields River at Clyde Park, Mont.
Location. Lat 45°53'10", long 110°37'05", in NW^NW^ sec.33, T.2 N. , R.9 E., on right bank just downstream from highway bridge, three-quarters of a mile west of Clyde Park and 2 miles upstream from Brackett Creek.
Drainage area. 543 sq mi.
Gage. Nonrecording prior to Jan. 6, 1951; recording thereafter. At different datum 1921-23. Altitude of gage is 4,780 ft (from topographic map).
Stage-discharge relation. Defined by current-meter measurements.
Remarks. Diversions for irrigation of about 19,500 acres do not materially affect peak flows. Peaks are principally from snowmelt. Base for partial- duration series, 400 cfs. Only annual observed peaks are shown prior to 1948, except as noted.
Peak stages and discharges
Water year
192119221923
19291930
19311932
19341935
1936193719381939
1940
19411942194319441945
19461947
1948
1949
1950
1951
Date
June 9, 1921May 26, 1922May 26, 1923
May 25, 1929Apr. 8, 1930
June 3, 1931May 22, 1932
Apr. 14, 1934Mar. 14, 1935
Apr. 13, 1936June 17, 1937May 29, 1938Mar. 22, 1939Mar. 26, 1939May 13, 1940
June 6, 1941May 26, 1942Mar. 29, 1943June 10, 1944June 6, 1945
May 29, 1946May 10, 1947
Mar. 24, 1948Mar. 29, 1948Apr. 3, 1948Apr. 18, 1948Apr. 30, 1948May 9, 1948May 22, 1948June 5, 1948June 17, 1948July 12, 1948
Apr. 13, 1949Apr. 29, 1949May 18, 1949June 2, 1949June 20, 1949
Feb. 27, 1950Apr. 2, 1950Apr. 7, 1950Apr. 14, 1950May 29, 1950June 19, 1950
Feb. 10, 1951Feb. 11, 1951Mar. 26, 1951Mar. 31, 1951Apr. 3, 1951May 13, 1951May 19, 1951
Gage height (feet)
3.142.9S3.64
3.212.37
2.562.90
2.082.56
3.322.833.84
a4.403.103.27
3.483.757.004.353.72
3.574.73
--
3.513.953.644.335.867.394.863.58
3.883.304.523.533.21
C4.694.503.283.063.413.43
04.924.833.973.062.933.133.23
Discharge (cfs)
1,1901,0201,800
1,040410
507832
182364
895580
1,440-650790
8821,320
b4,4501,240
910
7851,670
a400a400736
1,000954
1,3502,3904,5001,410
566
S59675
1,370780644
-1,300
630536744870
_2,1001,400
780697871959
Water year
1951
1952
1953
1954
1955
1956
1957
1958
1959
1960
1961
Date
June 17, 1951
Apr. 7, 1952Apr. 15, 1952Apr. 29, 1952May 16, 1952May 27, 1952
May 7, 1953June 14, 1953May 20, 1953June 4, 1953July 1, 1953
May 13, 1954May 22, 1954June 5, 1954June 11, 1954June 29, 1954
Apr. 10, 1955May 9, 1955May 22, 1955May 31, 1955June 17, 1955
Mar. 25, 1956Mar. 26, 1956Mar. 31, 1956Apr. 22, 1956May 25, 1956
May 6, 1957May 15, 1957May 21, 1957June 5, 1957June 21, 1957
May 12, 1958May 25, 1958
Mar. 21, 1959Apr. 3, 1959Apr. 6, 1959May 3, 1959May 10, 1959May 17, 1959May 27, 1959June 8, 1959June 15, 1959June 26, 1959
Mar. 21, 1960Mar. 23, 1960Mar. 27, 1960May 13, 1960June 4, 1960June 15, 1960
May 30, 1961
Gage height (feet)
2.61
5.203.693.863.394.32
2.604.782.485.042.94
2.542.772.903.072.74
2.462.472.552.493.02
C5.774.652.872.713. 93
2.973.123.08?.963.12
?.93?.84
-r.74?.57?.80?.673.07£.784.204.153.81
C4.48J.493.372.602.303.06
3.27
Discharge (cfs)
565
2,3901,2401,3701,0201,720
4952,400
4172,360
661
417552635749534
435435471429764
_1,900
540510
1,430
680784756661735
654596
460550434564466714505
1,3701,200
920
-735651800624428
606
a Maximum daily.b Momentary maximum.c Backwater from ice.
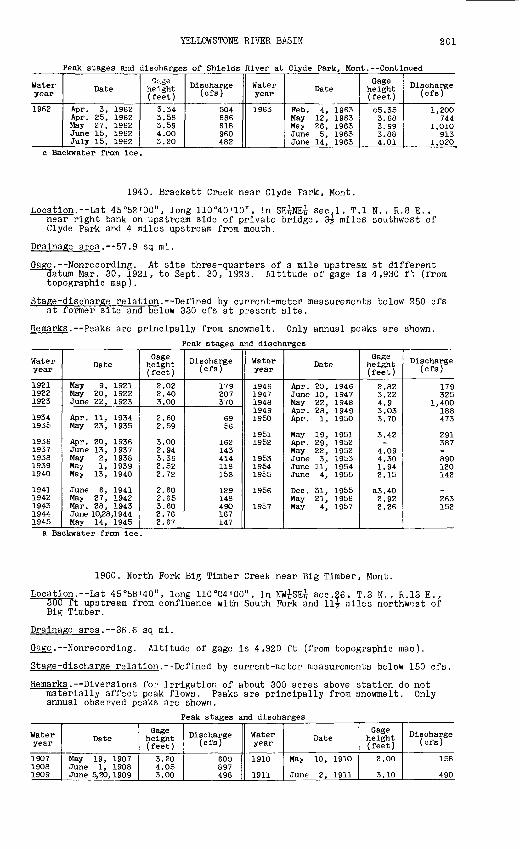
YELLOWSTONE RIVER BASIN 201
Peak stages and discharges of Shields River at Clyde Park, Mont. Continued
Water year
1962
Date
Apr. 3, 1962 Apr. 25, 1962 May 27, 1962 June 15, 1962 July 15, 1962
Gage height (feet)
3.34 3.58 3.59 4.00 3.20
Discharge (cfs)
504 686 618 960 482
Water year
1963
Date
Feb. 4, 1963 May 12, 1963 May 26, 1963 June 5, 1963 June 14, 1963
Gage height (feet)
c5.35 3.68 3.99 3.88 4.01
Discharge (cfs)
1,200 744
1,010 913
1,020c Backwater from ice.
1940. Brackett Creek near Clyde Park, Mont.
Location. Lat 45°52'00", long 110°40'10", in SE^NE^ sec.l, T.I N., R.8 E., near right bank on upstream side of private bridge, 3^ miles southwest of Clyde Park and 4 miles upstream from mouth.
Drainage area. 57.9 sq mi.
Gage. Nonrecording. At site three-quarters of a mile upstream at different datum Mar. 30, 1921, to Sept. 30, 1923. Altitude of gage is 4,930 f'-, (from topographic map).
Stage-discharge relation. Defined by current-meter measurements below 250 cfs at former site and below 330 cfs at present site.
Remarks. Peaks are principally from snowmelt. Only annual peaks are shown.
Peak stages and discharges
Water year
192119221923
19341935
19361937193819391940
19411942194319441945
Date
May 9, 1921May 20, 1922June 22, 1923
Apr. 11, 1934May 23, 1935
Apr. 20, 1936June 13, 1937May 2, 1938May 1, 1939May 13, 1940
June 6, 1941May 27, 1942Mar. 28, 1943June 10,28,1944May 14, 1945
Gage height ( feet )
2.022.403.00
2.602.59
3.002.943.362.522.72
2.602.653.602.762.67
Discharge (cfs)
179207370
6956
16214341411815S
129148490167147
Water year
19461947194819491950
19511952
195319541955
1956
1957
Date
Apr. 20, 1946June 10, 1947May 22, 1948Apr. 28, 1949Apr. 1, 1950
May 19, 1951Apr. 29, 1952May 22, 1952June 3, 1953June 11, 1954June 4, 1955
Dec. 31, 1955May 21, 1956May 4, 1957
Gage height (feet)
2.823.224.93.033.70
3.42_
4.094.301.942.15
a3.402.922.26
Discharge (cfs)
179325
1,400188473
291387_890120142
_263152
a Backwater from ice.
1960. North Pork Big Timber Creek near Big Timber, Mont.
Location.--Lat 45°58'40", long 110°04'00", in NW^SE^ sec.26, T.3 N., R.13 E., 300 ft upstream from confluence with South Pork and 11^ miles northwest of Big Timber.
Drainage area. 36.6 sq mi.
Gage.--Nonrecording. Altitude of gage is 4,920 ft (from topographic man).
Stage-discharge relation. Defined by current-meter measurements below 150 cfs.
Remarks. Diversions for irrigation of about 300 acres above station do not materially affect peak flows. Peaks are principally from snowmelt. Only annual observed peaks are shown.
Peak stages and discharges
Water year
1907 1908 1909
Date
May 19, 1907 June 1, 1908 June 5,20,1909
Gage height (feet)3.20 4.05 3.00
Discharge (cfs)
600 897 498
Water year
1910
1911
Date
May 10, 1910
June 2, 1911
Gage height (feet)
2.00
3.10
Discharge (cfs)
158
490
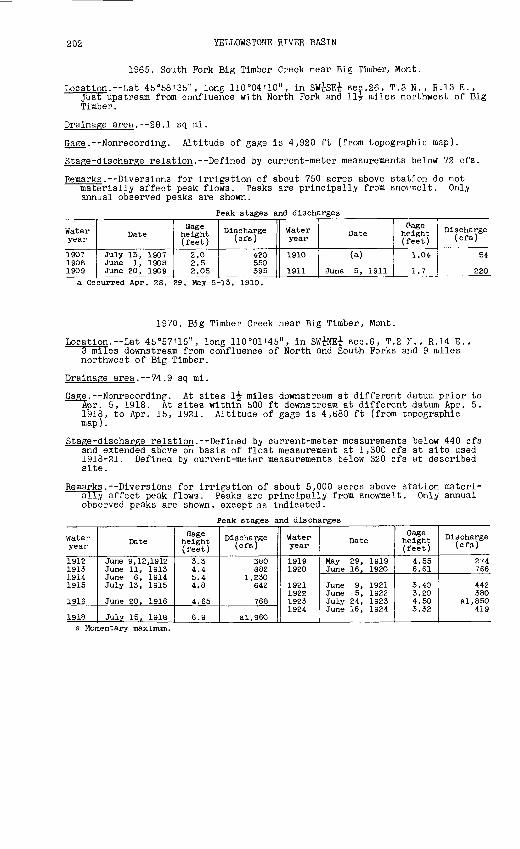
202 YELLOWSTONE RIVER BASIN
1965. South Fork Big Timber Creek near Big Timber, Mont.
Location. Lat 45°58'35", long 110°04'10", in SW^SEi;- sec.26, T.3 N., R.13 E., just upstream from confluence with North Pork and 11^ miles northwest of Big Timber.
Drainage area. 28.1 sq mi.
Gage. Nonrecording. Altitude of gage is 4,920 ft (from topographic map).
Stage-discharge relation. Defined by current-meter measurements below 72 cfs.
Remarks.--Diversions for irrigation of about 750 acres above station do not materially affect peak flows. Peaks are principally from sno\"nelt. Only annual observed peaks are shown.
Peak stages and discharges
Water year
1907 190S 1909
Date
July 13, 1907 June 1, 190S June 20, 1909
Gage height (feet)
2.0 2.5 2.05
Discharge (cfs)
420 550 395
Water year
1910
1911
Date
(a)
June 5, 1911
O-age height (feet)
1.04
1.7
Discharge (ofs)
54
220a Occurred Apr. 28, 29, May 5-13, 1910.
1970. Big Timber Creek near Big Timber, Mont.
Location.--Lat 45°57'15", long 110°01'45", in SW^NE^ sec.6, T.2 T. , R.14 E., 3 miles downstream from confluence of North and South Porks and 9 miles northwest of Big Timber.
Drainage area. 74.9 sq mi.
Gage. Nonrecording. At sites if miles downstream at different datum prior to Apr. 5, 1918. At sites within 500 ft downstream at different datum Apr. 5, 1918, to Apr. 15, 1921. Altitude of gage is 4,680 ft (from topographic map).
Stage-discharge relation. Defined by current-meter measurements below 440 cfs and extended above on basis of float measurement at 1,300 cfs at site used 1918-21. Defined by current-meter measurements below 320 cfs at described site.
Remarks.--Diversions for irrigation of about 5,000 acres above station materi ally affect peak flows. Peaks are principally from snowmelt. Only annual observed peaks are shown, except as indicated.
Peak stages and discharges
Water year
1912 1913 1914 1915
1916
1918
Date
June 9,12,1912 June 11, 1913 June 6, 1914 July 13, 1915
June 20, 1916
July 15, 1918
Gage height (feet)
3.3 4.4 5.4 4.8
4.65
6.9
Discharge (cfs)
380 882
1,230 642
768
al,960
Water year
1919 1920
1921 1922 1923 1924
Date
May 29, 1919 June 16, 1920
June 9, 1921 June 5, 1922 July 24, 1923 June 16, 1924
Gage height (feet)
4.55 6.61
3.40 3.20 4.50 3.32
Discharge (cfs)
274 766
442 380
al,850 419
a Momentary maximum.

YELLOWSTONE RIVER BASIN 203
1975. Boulder River near Contact, Mont.
Location. Lat 45°33'20", long 110°12'00", in SE^SE£ sec.23, T.3 S. , R 12 E , on left bank half a mile downstream from Boulder Falls, 3 miles nortt of Contact, 6 miles upstream from East Fork of Boulder River, and 22 miles southwest of Big Timber.
Drainage area.--226 sq mi.
Gage. Nonrecording at site 1^ miles downstream at different daturas prior to July 15, 1951; recording thereafter. Altitude of gage is 4,930 ft (from topographic map).
Stage-discharge relation. Defined by current-meter measurements below £,500 cfs at former site and below 3,400 cfs at present site.
Remarks. Small diversions above station do not materially affect peak flows Peaks are principally from snowmelt. Base for partial-duration series, 2,200 cfs. Only annual observed peaks are shown prior to 1951.
Peak stages and discharges
Water year
1910
19111912191319141915
1916
1929
1951
1952
1953
1954
1955
1956
Date
June 2, 1910
June 14, 1911June 25, 1912June 5, 1913June 4, 1914June 25, 1915
June 19,27,1916
June 14, 1929
May 24, 1951May 29, 1951June 17, 1951July 6, 1951
June 7, 1952
June 14, 1953June 19, 1953June 24, 1953July 1, 1953
May 21, 1954June 24, 1954June 27, 1954
June 16, 1955June 24, 1955
May 28, 1956
Gage height (feet)
7.3
8.87.97.96.86.3
8.4
5.60
4.904.805.824.85
6.23
5.915.884.984.89
5.055.745.94
5.225.23
5.78
Discharge (cfs)
3,660
5,1004,2104,2003,0802,630
4,750
3,170
2,3302,2403,2202,280
4,200
3,7303,6902,4802,370
2,6203,5203,800
2,8402,850
3,420
Water year
1956
1957
1958
1959
1960
1961
1962
1963
Date
June 2, 1956June 12, 1956June 16, 1956June 20, 1956
June 5, 1957July 1, 1957
May 27, 1958June 8, 1958
June 7, 1959June 10, 1959June 15, 1959
June 4, 1960June 8, 1960June 15, 1960June 20, 1960
May 30, 1961June 9, 1961
June 16, 1962June 21, 1962June 27, 1962
June 5, 1963June 16, 1963June 20, 1963June 2S, 1963
Gage height (feet)
5.845.625.504.74
5.985.27
5.324.78
5.735.456.71
5.325.325.354.85
4.775.21
5.365.365.56
4.955.785.424.78
Discharge (ofs)
3,4903,3203,2002,230
3,8502,900
2,9502,240
3,5003,1404,880
2,97O2,9703,0002,360
2,2302,740
2,9302,9503,230
2,4803,5703,1002,280
1985. West Fork Boulder River near Bruffeys, Mont.
Location.--Lat 45°34'05", long 11016'40", in SW£SW£ sec.17, T.3 S., R.12 E. , at road bridge at discontinued Bruffeys Post Office, 3 miles downstream from Davis Creek and 7 miles southwest of McLeod.
Drainage area.--91.6 sq mi.
Gage. Nonrecording. Altitude of gage is 5,470 ft (from topographic map).
Stage-discharge relation. Defined by current-meter measurements below 1,200 cfs.
Remarks. One small diversion of about 4 cfs does not affect peak flows. Peaks are principally from snowmelt. Only annual maximum observed stages and dis charges are shown.
Peak stages and discharges
Water year
1904 1905
1906
Date
June 18, 1904 June 10, 1905
June 12,15,1906
Gage height (feet)
4.00 3.9
3.55
Discharge (cfs)
1,670 1,590
1,310
Water year
1907 1908
1910
Date
July 4, 1907 June 14, 1908
June 2, 1910
Gage height (feet)
3.90 3.82
4.00
Discharge (cfs)
1,590 1,530
1,670

204 YELLOWSTONE RIVER BASIN
1990. West Pork Boulder River at McLeod, Mont.
Location.--Lat 45°39'50", long 110°07'05", in SE^NE^ sec.16, T.2 S., R.13 E., at private bridge, 600 ft upstream from highway bridge in McLeod and 1 mile upstream from mouth.
Drainage area. 135 sq mi.
Gage. Nonrecording. At datum 1.00 ft higher prior to Mar. 15, 1911. All gage heights adjusted to last used datum. Altitude of gage is 4,810 ft (from topographic map).
Stage-discharge relation. Defined by current-meter measurements below 1,500 cfs.
Remarks. Diversions for irrigation of about 800 acres above gags do not materi ally affect peak flows. Peaks are principally from snowmelt. Only annual maximum observed stages and discharges are shown.
Peak stages and discharges
Water year
1907 1908 1909 1910
Date
July 4, 1907 July 4, 1908 June 3,17, 1909 June 2, 1910
Gage height (feet)
4.5 4.4 4.6 4.0
Discharge (cfs)
1,820 1,780 1,990 1,370
Water year
1911 1912 1913 1914
Date
June 13, 1911 June 9, 1912 May 28, 1913 June 2, 1914
Gage height (feet)
4.3 4.3 4.2 4.2
Discharge (cfs)
1,670 1,500 1,420 1,460
2000. Boulder River at Big Timber, Mont.
Location. Lat 45°50'05", long 109°56'20", in NE^SE^ sec.14, T.I N., R.14 E., on left bank 1 mile east of Big Timber and 2 miles upstream from mouth.
Drainage area. 523 sq mi.
Gage. Recording. Altitude of gage is 4,060 ft (from topographic map).
Stage-discharge relation. Defined by current-meter measurements below 7,000 cfs.
Remarks. Diversions for irrigation of about 13,300 acres do not materially af fect peak flows. Peaks are principally from snowmelt. Base for partial- duration series, 3,000 cfs.
Peak stages and discharges
Water year
1947
1948
1949
1950
1951
1952
1953
1955
Date
June 20, 1947
May 22, 1948May 30, 1948June 5, 1948
May 17, 1949June 11, 1949
June 7, 1950June 17, 1950June 22, 1950July 1, 1950July 8, 195OJuly 11, 1950
May 24, 1951May 29, 1951June 17, 1951July 5, 1951
May 30, 1952June 7, 1952June 10, 1952
June 12, 1953June 14, 1953June 19, 1953June 24, 1953
June 16, 1955June 24, 1955
Gage height (feet)
6.93
5.615.677.37
5.475.00
5.436.076.055.635.275.18
5.064.865.784.84
4.916.856.21
5.686.826.315.21
5.755.73
Discharge (cfs)
a7,080
4,5504,6408,190
4,0003,620
4,2605,3605,3204,5603,9303,760
3,5503,1904,8403,150
3,2106,8205,280
4,1106,7505,7903,310
4,1904,150
Water year
1956
1957
1958
1959
1960
1961
1962
1963
Date
May 28, 1956June 2, 1956June 12, 1956
June 5, 1957June 21, 1957July 1, 1957
May 27, 1958June 8, 1958
June 7, 1959June 10, 1959June 15, 1959
June 4, 1960June 8, 1960June 15, 1960June 20, 1960
May 3O, 1961June 5, 1961June 9, 1961
June 4, 1962June 15, 1962June 21, 1962June 27, 1962
June 5, 1963June 16, 1963
Gage height (feet)
7.846.425.83
6.945.566.05
5.785.10
6.285.847.68
5.825.816.075.20
5.335.325.54
4.806.036.146.24
5.787.13
Discharge (cfs)
9,8405,7904,370
7,0503,9905,030
4,5403,350
5,4204,5408,O5O
4,9604,9405,4603,750
4,0904,0404,440
3,0204,7204,6004,740
3,9605,970
a Annual peak only.

YELLOWSTONE RIVER BASIN 205
2004. Sweet Grass Creek near Melville, Mont. (Published as "above Melville" 1907-12)
Location. Lat 46°10', long 110°10', In SW£ sec.24, T.5 N., R.12 E. , about half a mile upstream from Blackaby Creek and ll| miles northwest of Melville.
Drainage area. 46.3 sq ml.
Gage.--Nonrecordlng. At site 300 ft upstream at different datum prior to Oct. 1, 1908. Altitude of gage Is 5,730 ft (by barometer).
Stage-discharge relation.--Defined by current-meter measurements below 620 cfs.
Remarks. Small diversions for irrigation above station do not materially af- feet peak flows. Peaks are principally from snowmelt. Only annual observed peaks are shown.
Peak stages and discharges
Water year
1907
1908 1909
Date
June 23, July 4, 1907
June 1, 1908June 10, 1909
Gage height (feet)
4.0
5.655.6
Discharge (cfs)
910
1,8301,960
Water year
1910
1911
Date
May 10, 1910
June 1, 1911
Gage height (feet)
3.00
4.70
Discharge (cfs)
530
1,410
2005. Sweet Grass Creek above Melville, Mont.
Location. --Lat 46°09', long 110°05', in bank 7^ miles northwest of Melville .
Drainage area. 63.8 sq mi.
sec. 27, T.5 N., R.13 E. , on right
Gage.--Nonrecording at site 1,500 ft downstream at different datum Aug. 21, 1913, to Dec. 31, 1924; recording thereafter. At site 1,000 ft dowrstream at different datum Apr. 17, 1937, to Sept. 25, 1951. Altitude of gege is 5,490 ft (by barometer).
Stage-discharge relation. Defined by current-meter measurements below 800 cfs at present site.
Remarks . Diversions for irrigation of about 200 acres above station do not materially affect peak flows. Peaks are principally from snowmelt. Base for partial-duration series, 540 cfs. Only annual observed peaks are shown prior to 1937.
Peak stages and discharges
Water year
19141915
19161917191819191920
1921192219231924
1937
1938
1939
1940
1941
Date
June 4, 1914July 10,13,1915
June 17, 1916June 10, 1917June 11, 1918May22,30, 1919June 15,17,1920
June 9, 1921June 15, 1922May 27, 1923May 17, June 4,
1924
June 17, 1937June 22, 1937
May 29, 1938June 6, 1938June 18, 1938June 23, 1938
May 31, 1939
May 13, 1940June 14, 1940
June 9, 1941
Gage height (feet)
2.72.3
2.73.22.S51.92.59
2.322.002.802.00
3.013.00
3.432.972.803.60
2.50
2.632.70
2.96
Discharge (cfs)
940630
8721,2601,110
390848
651540
1,100620
807800
1,120780670
1,240
556
568610
879
Water year
1941
1942
1943
1944
1945
1946
1947
Date
June 27, 1941
May 26, 1942June 5, 1942June 8, 1942
May 30, 1943June 11, 1943June 19, 1943June 26, 1943July 1, 1943
May 18, 1944May 30, 1944June 5, 1944June 9, 1944June 27, 1944
June 5, 1945June 22, 1945June 27, 1945
May 28, 1946June 6, 1946June 12, 1946July 3, 1946
May 10, 1947June 9, 1947
Gage height (feet)
2.71
3.213.713.25
3.022.733.412.762.73
3.672.643.055.093.07
2.653.322.80
3.062.802.602.55
2.782.76
Discharge (cfs)
756
1,0501,3201,000
818638
1,090656638
1,160553758780768
6201,080
749
872710590562
668* 656
219-848 O - 66 - 15

206 YELLOWSTONE RIVER BASIN
Peak stages and discharges of Sweet Grass Creek above Melville, Mont. Continued
Water year
1947
1948
1949
1950
1951
1952
1953
1954
Date
June 18, 1947June 20, 1947
May 21, 1948May 28, 1948June 4, 1948June 17, 1948June 22, 1948
May 17, 1949May 29, 1949June 19, 1949
June 7, 1950June 16, 1950June 22, 1950July 1, 1950
May 24, 1951June 16, 1951
May 26, 1952May 29, 1952June 7, 1952June 27, 1952
June 14, 1953June 18, 1953June 24, 1953July 1, 1953July 15, 1953
May 22, 1954June 24, 1954June 27, 1954
Gage height (feet)
2.892.88
3.642.864.582.982.62
3.422.332.32
2.433.842.612.57
2.212.53
3.082.612.992.91
3.483.212.652.822.62
2.772.722.90
Discharge (cfs)
742736
1,330723
2,040948750
1,220606601
6301,510
792771
592734
961540863783
1,180958563674545
640581702
Water year
1955
1956
1957
1958
1959
1960
1961
1962
1963
Date
June 16, 1955
May 22, 1956May 28, 1956June 2, 1956June 5, 1956
May 13, 1957May 20, 1957June 5, 1957June 20, 1957July 1, 1957
May 30, 1958
June 7, 1959June 10, 1959June 15, 1959June 26, 1959
June 4, 1960June 15, 1960
May 27, 1961May 30, 1961June 6, 1961
June 14, 1962July 13, 1962
May 26, 1963June 2, 1963June 14, 1963June 21, 1963
Gage height (feet)
2.87
2.843.932.902.73
2.652.873.313.052.82
2.62
3.322.913.283.00
2.982.87
2.872.902.70
2.972.64
2.65-
3.062.88
Discharge (cfs)
640
7192,060
773619
568746
1,200863659
533
1,180K'4
1,140843
873737
746764589
843561
568a 700939755
a About.
2010. Sweet Grass Creek below Melville, Mont.
Location.--Lat 46°04' , long 109°51', near middle of south line sec.27, T.4 N. , R.15 E., on left bank 6 miles southeast of Melville and 19 miles upstream from East Pork.
Drainage area.--143 sq mi.
Gage.--Nonrecording prior to Apr. 15, 1941; recording thereafter. At site 2^ miles downstream at different datum May 1907 to November 1908. Altitude of gage is 4,740 ft (by barometer).
Stage-discharge relation.--Defined by current-meter measurements below 500 cfs.
Remarks. Diversions above station for irrigation of about 12,800 acres materi ally affect peak flows. Peaks are principally from snowmelt. Base for partial-duration series, 450 cfs. Only annual observed peaks are shown prior to 1941, except as noted.
Peak stages and discharges
Water year
1907 1908 1909 1910
1911 1912 1913 1914 1915
1916
1918 1919
a Ma b Mo c Ba
Date
June 23, 1907 June 1, 1908June 21, 1909 May 11, 1910
May 16, 1911 June 11, 1912 June 11, 1913 June 4, 1914 May 1, 1915
June 27, 1916
June 11, 14,1918 Mar. 8,10, 1919
Kimum daily; est nentary maximum, jkwater from ice
Gage height (feet)
3.00 3.803.55 2.45
3.90 2.55
3.86 3.18
4.2
4.06 C3.76
Lmated.
Discharge (cfs)
1,420 1,8001,170
438
1,560 595
al,190 1,330
702
bl,700
1,300
Water year
1919 1920
1921 1922 1923 1924
1937 1938 1939
1940
Date
May 30, 1919 June 12, 1920
June 9, 1921 June 5, 1922 July 26, 1923 Apr. 6, 1924
June 23, 1937 June 18, 1938 Mar. 20, 1939 June 1, 1939 Feb. 28, 1940 May 13, 1940
Gage height (feet)
3.76
3.85 3.38 6.0 3.66
3.38 5.30
C4.52
C4.00
Discharge (cfs)
512 1,040
735 564
b3,000 752
613 1,900
470
455

YELLOWSTONE RIVER BASIN 207
Peak stages and discharges of Sweet Grass Creek below Melville, Mont. Continued
Water year
1941
1942
1946
1947
1948
Date
June 5, 1941June 9, 1941
May 27, 1942June 4, 1942June 8, 1942June 16, 1942June 26, 1942
May 28, 1946
May 10, 1947June 9, 1947June 20, 1947
May 22, 1948May 29, 1948June 4, 1948June 9, 1948June 16, 1948June 21, 1948
Gage height (feet)
3.633.73
3.885.334.863.633.41
3.36
3.383.213.40
3.963.514.924.295.784.61
Discharge (cfs)
774858
8942,5001,890
606452
546
642504618
838528
1,7201,0802,730
890
Water year
1948
1949
1950
1951
1952
Date
July 3, 1948
Mar. 5, 1949May 17, 1949
June 7, 1950June 16, 1950June 22, 1950July 2, 1950July 11, 1950
Mar. 27, 1951May 24, 1951June 16, 1951
May 15, 1952May 22, 1952May 26, 1952June 7, 1952June 27, 1952
Gage height (feet)
4.22
C4.664.18
3.193.953.082.972.77
C3.912.652.76
2.733.173.363.213.07
Discharge (cfs)
574
_1,190
5651,020
625610510
_452515
490718826740664
c Backwater from ice.
2045. Rosebud Creek near Absarokee, Mont.
Location. Lat 45°29'10", long 109°27'20", in SW^NW^ sec.13, T.4 S. , R.18 E., on right bank 80 ft downstream from Smith Bridge, 0.2 mile downstream from confluence of East and West Rosebud Creeks, and 1\ miles south of Abssrokee.
Drainage area. 394 sq mi.
Gage. Nonrecording prior to July 14, 1942; recording thereafter. Altitude of gage is 4,160 ft (by barometer).
Stage-discharge relation.--Defined by current-meter measurements below 2,500 cfs.
Remarks. Diversions for irrigation of about 16,000 acres above station. Some regulation by Mystic Lake (usable capacity, 20,780 acre-ft). Diversions and regulation might affect peak flows. Peaks are principally from snowmelt. Base for partial-duration series, 1,600 cfs. Only annual peaks are sir-own prior to 1944.
Peak stages and discharges
Water year
193519361937193819391940
194119421943
1944
1945
19461947
1948
Date
June 14, 1935June 2, 1936June 22, 1937June 26, 1938May 31, 1939June 21, 1940
June 5, 1941July 8, 1942July 1, 1943
May 18, 1944June 3, 1944June 11, 1944June 17, 1944June 27, 1944July 2, 1944
June 27, 1945July 15, 1945June 24, 1946June 21, 1947July 8, 1947
May 22, 1948May 30, 1948June 3, 1948June 16, 1948June 22, 1948July 13, 1948
Gage height (feet)4.574.796.364.703.924.93
4.505.785.33
3.834.293.874.635.23-
3.663.45
2.78
3.273.33
3.083.244.453.563.673.67
Discharge (cfs)
2,2002,4604,8502,3401,3302,620
2,0703,8703,520
1,7202,2401,8802,8003,660
a3,300
2,5202,100
1,360
2,0802,030
1,6601,8804,1802,2302,4102,340
Water year
19491950
1951
1952
1953
1954
1955
1956
1957
1958
1959
Date
May 18, 1949Jan. 7, 1950June 18, 1950June 23, 1950July 5, 1950
July 21, 1951
May 22, 1952June 7, 1952July 13, 1952
June 14, 1953
June 28, 1954July 15, 1954
June 16, 1955
May 29, 1956June 16, 1956
May 12, 1957June 10, 1957June 16, 1957July 2, 1957
May 26, 1958June 8, 1958
June 27, 1959
Gage height (feet)
3.25b3.703.433.423.37
3.62
3.553.803.63
3.66
3.353.35
2.78
4.423.36
3.444.174.324.18
3.283.40
3.85
Discharge (cfs)
1,750-
2,0302,0101,930
2,250
2,2302,5402,370
2,310
1,7701,770
1,110
3,8201,780
1,7303,2303,5703,250
1,6601,850
2,560a Estimated.b Backwater from ice.

208 YELLOWSTONE RIVER BASIN
Peak stages and discharges of Rosebud Creek near Absarokee, Mont. Continued
Water year
196019611962
Date
June 20, 1960May 30, 1961Jan. 21, 1962June 15, 1962
Gage height (feet)
2.762.90
b4.053.71
Discharge (cfs)
1,1001,240
_2,250
Water year
1962
1963
Date
June 27, 1962
June 3, 1963June 10, 1963June 16, 1963
Gage 1 eight (feet)
3.58
3.863.874.25
Discharge (cfs)
2,040
2,4402,4203,080
b Backwater from ice.
2050. Stillwater River near Absarokee , Mont.
Location. Lat 45°33'04", long 109°23'12", in NE^NWi sec. 28, T.3 S. , R.19 E., on right bank 3 miles downstream from Rosebud Creek, 3j miler northeast of Absarokee, and 9 miles southwest of Columbus.
Drainage area. --975 sq mi.
Gage. Nonrecording at site 2 miles upstream at different datum? prior to 0"ct. 1, 1942; recording thereafter. Altitude of gage is 3,875 ft (from topographic map).
Stage-discharge relation. --Defined by current-meter measurement? below 5,900 cfs at former site and below 7,500 cfs at present site.
Remarks . Some regulation by Mystic Lake (usable capacity, 20,7fO acre-ft). Diversions for irrigation of about 24,300 acres. Regulation and diversions do not materially affect peak flows. Peaks are principally from snowmelt. Base for partial-duration series, 4,400 cfs. Only annual observed peaks are shown prior to 1943.
Peak stages and discharges ____________
Water year
1911191219131914
1935
19361937193819391940
19411942
1943
1944
1945
1946
1947
1948
1949
Date
June 14, 1911June 10,25,1912June 2, 1913June 3, 1914
June 14, 1935
June 2, 1936June 23, 1937June 26, 1938May 31, 1939June 14, 1940
June 5,18 , 1941June 8, 1942
Mar. 28, 1943May 30, 1943June 14, 1943June 20, 1943June 26, 1943July 1, 1943
May 18, 1944May 31, 1944June 4, 1944June 11, 1944June 17, 1944June 27, 1944July 2, 1944June 23, 1945 July 10, 1945June 6, 1946June 12, 1946
June 20, 1947July 8, 1947
May 22, 1948May 29, 1948June 3, 1948June 22, 1948
May 17, 1949June 12, 1949
Gage height (feet)
6.25.65.55.5
5.28
4.955.344.564.204.44
a4.245.54
4.964.904.605.995.726.21
4.694.654.834.715.626.445.705.63 4.924.794.53
5.575.06
4.905.066.634.75
4.824.71
Discharge (cfs)
7,2606,2406,0806,080
7,140
5,1407,4504,7204,0305,240
4,0208,520
5,4805,3404,5708,5407,6209,180
4,8204,7005,2104,8207,3209,8207,6207,470 5,3405,0804,450
7,1705,740
5,3405,77010,6005,120
5,3005,020
Water year
1950
1951
1952
1953
1954
1955
1956
1957
1958
1959
1960
1961
1962
1963
Date
June 7, 1950June 17, 1950June 22, 1950July 2, 1950
June 17, 1951July 21, 1951
May 22, 1952June 7, 1952
June 14, 1953
June 27, 1954
June 16,24,1955
May 28, 1956June 2, 1956June 16, 1956
May 13, 1957June 5, 1957June 16, 1957June 21, 1957July 1, 1957
May 26, 1958June 8, 1958
June 7, 1959 June 10, 1959 June 15, 1959June 22, 1959June 27, 1959
June 15, 1960
June 9, 1961
June 16, 1962June 27, 1962
June 3, 1963June 16, 1963
Gage height (feet)
4.705.145.474.99
4.894.48
4.745.83
5.51
5.46
4.42
6.035.424.98
4.656.165.895.315.86
5.134.65
5.04 4.74 5.715.435.51
4.35
4.47
5.465.31
5.255.88
Discharge (cfs)
4,8205,9906,9305,580
5,4804,460
4,9307,960
6,980
6,830
4,340
8,6006,7105,500
4,7308,6907,8706,2307,780
5,5804,420
5,530 4,800 7,3306,5406,760
3,840
4,160
6,7306,340
6,1807,850
a Occurred June 18.
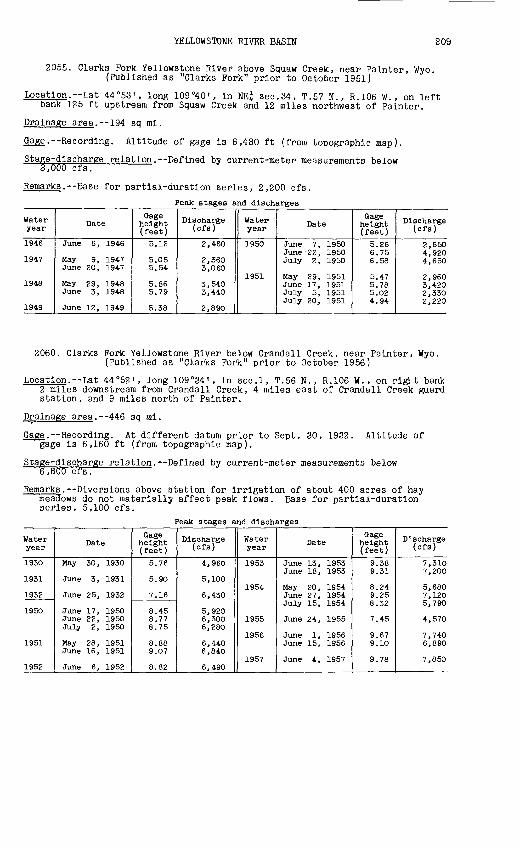
YELLOWSTONE RIVER BASIN 209
2055. Clarks Fork Yellowstone River above Squaw Creek, near Painter, Wyo. (Published as "Clarks Fork" prior to October 1951)
Location. Lat 44°53', long 109°40', in NE£ sec.34, T.57 N., R.106 W., on left bank 125 ft upstream from Squaw Creek and 12 miles northwest of Painter.
Drainage area. 194 sq mi.
Gajge.-- Recording. Altitude of gage is 6,480 ft (from topographic map).
Stage-discharge relation.--Defined by current-meter measurements below 3,000 cfs.
Remarks.--Base for partial-duration series, 2,200 cfs.
__ Peak stages and discharges
Water year
1946
1947
1948
1949
Date
June 6, 1946
May 9, 1947June 20, 1947
May 29, 1948June 3, 1948
June 12, 1949
Gage height ( feet )
5.12
5.055.54
5.865.79
5.38
Discharge (cfs)
2,460
2,3603,060
3,5403,440
2,890
Water year
D950
1951
Date
June 7, 1950June -22, 1950July 2, 1950
May 29, 1951June 17, 1951July 5, 1951July 20, 1951
Gage height (feet)
5.266.756.58
5.475.785. 024.94
Discharge (cfs)
2,6504,9204,650
2,9603,4202,3302,220
2060. Clarks Fork Yellowstone River below Crandall Creek, near Painter, Wyo. (Published as "Clarks Fork" prior to October 1956)
Location. La t 44°52', long 109°34', in sec.l, T.56 N., R.106 W., on rigl t bank 2 miles downstream from Crandall Creek, 4 miles east of Crandall Creek guard station, and 9 miles north of Painter.
Drainage area.--446 sq mi.
Gage. Recording. At different datum prior to Sept. 30, 1932. Altitude of gage is 6,160 ft (from topographic map).
Stage-discharge relation. Defined by current-meter measurements below 6,800 cfs.
Remarks. Diversions above station for Irrigation of about 400 acres of hay meadows do not materially affect peak flows. Base for partial-duration series, 5,100 cfs.
Peak stages and discharges
Water year
1930
1931
1932
1950
1951
1952
Date
May 30, 1930
June 3, 1931
June 25, 1932
June 17, 1950 June 22, 1950 July 2, 1950
May 28, 1951 June 16, 1951
June 6, 1952
Gage height (feet)
5.76
5.90
7.16
8.45 8.77 8.75
8.88 9.O7
8.82
Discharge (cfs)
4,960
5,100
6,430
5,920 6,30O 6,280
6,440 6,840
6,490
Water year
1953
1954
1955
1956
1957
Date
June 13, 1953 June 18, 1953
May 20, 1954 June 27, 1954 July 15, 1954
June 24, 1955
June 1, 1956 June 15, 1956
June 4, 1957
Gage height (feet)
9.38 9.31
8.24 9.25 8.32
7.45
9.67 9.10
9.78
D'.scharge (cfs)
7,310 7,200
5,680 7,120 5,790
4,570
7,740 6,890
7,850

210 YELLOWSTONE RIVER BASIN
2065. Sunlight Creek near Painter, Wyo.
Location.--Lat 44°45'00", long 109°30'40", in NE£ sec.16, T.55 N., R.105 W., on left bank 1^ miles downstream from Painter Gulch and 4j miles west of Painter.
Drainage area. 135 sq mi.
Gage.--Recording. Altitude of gage is 6,700 ft (by barometer).
Stage-discharge relation. Defined by current-meter measurements below 1,200 cfs.
Bankfull stage.--5 ft.
Historical data. Flood of 1918 is maximum known.
Remarks. Diversions for irrigation of about 500 acres do not materially affect peak flows. Peaks are principally from snowmelt. Base for partial-duration series, 700 cfs.
Peak stages and discharges
Water year
1918
1930
1931
1932
1946
1947
1948
1949
1950
1951
Date
-
May 30, 1930June 11, 1930June 17, 1930July 12, 1930
June 3, 1931June 7, 1931July 29, 1931
May 22, 1932June 15, 1932June 26, 1932
June 5, 1946June 15, 1946
June 20, 1947July 9, 1947
May 20, 1948June 3, 1948June 9, 1948July 2, 1948
June 11, 1949
June 6, 1950June 18, 1950July 2, 1950
May 28, 1951June 16, 1951
Gage height (feet)
5.8
2.522.872.543.07
3.022.732.44
2.732.894.31
2.722.52
2.672.60
2.563.223.032.37
2.96
2.543.053.12
3.033.18
Discharge (cfs)
a4,000
712922724
1,040
994820670
8911,0002,110
924784
889861
8121,2801,140
721
1,040
7641,1001,160
1,08O1,200
Water year
1951
1952
1953
1954
1955
1956
1957
1958
1959
1960
1961
1962
1963
Date
July 4, 1951July 20, 1951Aug. 4, 1951
June 6, 1952July 12, 1952
June 13, 1953June 18, 1953
May 22, 1954June 24, 1954
June 24, 1955July 23, 1955
June 2, 1956
June 5, 1957June 30, 1957
May 22, 1958
June 17, 1959
June 15, 1960
May 29, 1961
June 26, 1962
June 2, 1963June 15, 1963
Gage height (feet)
2.672.912.58
3.282.48
3.192.99
2.673.09
2.703.42
3.41
3.833.24
3.40
3.64
3.08
3.31
3.05
3.113.34
Discharge (cfs)
809988746
1,220700
1,1501,010
8121,080
8301,330
1,220
1,6101,250
916
1,190
968
1,130
1,000
1,0501,230
a Approximate.
2070. Clarks Pork Yellowstone River near Clark, Wyo. (Published as "Clark Pork" 1919-24)
Location. Lat 44°51'10", long 109°10'15", in sec.8, T.56 N. , R.102 W., at high way bridge 400 ft downstream from Pat O'Hara Creek, 4 miles south of Clark, and 9 miles downstream from mouth of Clarks Fork Canyon.
Drainage area. 912 sq mi.
Gage.--Nonrecording prior to Apr. 24, 1921; recording thereafter. Altitude of gage is 4,220 ft (from topographic map).
Stage-discharge relation.--Defined by current-meter measurements below 7,400 cfs.
Remarks.--Diversion above station for irrigation of about 4,000 acres does not materially affect peak flows. Base for partial-duration series, 6,500 cfs.

YELLOWSTONE RIVER BASIN 211
Peak stages and discharges of Clarks Pork Yellowstone River near Clark, W;'O.
Water year
1919
1920
1921
Date
May 29, 1919
June 14, 1920
May 28, 1921 June 12, 1921
Gage height (feet)
5.7
5.95
5.60 7.35
Discharge (cfs)
6,940
7,490
6,730 10,500
Water year
1922
1923
1924
Date
June 6, 1922
June 12, 1923
June 15, 1924
Gage height (feet)
5.93
5.75
5.40
lischarge (cfs)
7,420
7,050
6,310
2075. Clarks Fork Yellowstone River at Chance, Mont. (Published as "Clarks Pork at Chance" prior to October 1956)
Location. Lat 45°00<40", long 109°04'00", in E^NE^ sec.31, T.9 S., R.2S E., on left bank 0.4 mile upstream from Sand Coulee and three-quarters of a mile north of Wyoming-Montana State line.
Drainage area. 1,154 sq mi.
Gage. Nonrecording prior to Nov. 15, 1934; recording thereafter. At site 0.4 mile downstream at different datum prior to July 27, 1951. At d^tum 0.98 ft higher July 27, 1951, to Sept. 30, 1953. Altitude of gage is 3,980 ft (from topographic map).
Stage-discharge relation.--Defined by current-meter measurements below ?,600 cfs at former site and below 8,400 cfs at present site.
Remarks. Diversions for irrigation of about 10,000 acres above gage do not materially affect peak flows. Peaks are principally from snowmelt. Base for partial-duration series, 5,400 cfs.
Peak stages and discharges
Water year
1922
1923
1924
1925
1926
1927
1928
1929
1930
1931
1932
1933
1934
1935
1936
1937
1938
1939
Date
June 15, 1922
June 13, 1923
June 16, 1924
June 22, 1925
May 21, 1926June 7, 1926
June 27, 1927
May 26, 1928
June 15, 1929June 17, 1929
May 21, 1930
June 3, 1931
June 25, 1932
June 13, 1933
May 8, 1934May 9, 1934
June 14, 1935June 24, 1935
May 16, 1936June 2, 1936
June 12, 1937June 23, 1937
June 8, 1938June 13, 1938June 24, 1938June 27, 1938
May 31, 1939
Gage height (feet)
5.75
5.05
4.50
5.60
4.504.50
6.20
6.5
4.754.75
4.70
4.75
5.60
5.45
4.204.20
5.425.62
4.765.87
5.835.05
5.004.726.255.54
4.81
Discharge (cfs)
8,000
6,950
5,350
8,670
5,5505,550
10,000
10,900
5,8705,870
5,870
6,130
8,290
2,730
4,6004,600
7,8908,490
7,0309,700
8,4906,750
6,6505,870
10,0007,730
5,800
Water year
1940
1941
1942
1943
1944
1945
1946
1947
194S
1949
1950
1951
1952
1953
Date
May 30, 1940
June 15, 1941
June 9, 1942
May 30, 1943June 14, 1943June 20, 1943July 1, 1943
May 18, 1944June 17, 1944June 27, 1944
June 25, 1945July 12, 1945July 15, 1945
June 6, 1946June 12, 1946
June 20, 1947
May 22, 1948May 26, 1948May 31, 1948June 4, 1948
June 12, 1949
June 7, 1950June 17, 1950July 3, 1950
May 29, 1951June 17, 1951July 5, 1951July 21, 1951
June 7, 1952
June 14, 1953June 19, 1953
Gage height (feet)
4.65
4.52
5.42
4.925.206.046.02
4.804.945.30
5.814.895.45
4.955. OS
5.10
4.935.215.385.78
5.35
5.055.605.56
5.705.814.804.82
6.10
6.406.20
Discharge (cfs)
5,380
4,860
7,630
6,2107,0009,8209,640
5,8006,2507,160
8,0505,7106,970
5,8306,200
6,200
6,1907,0307,5808,890
7,350
6,0807,5107,400
7,7808,0805,4805,530
8,300
8,8208,420
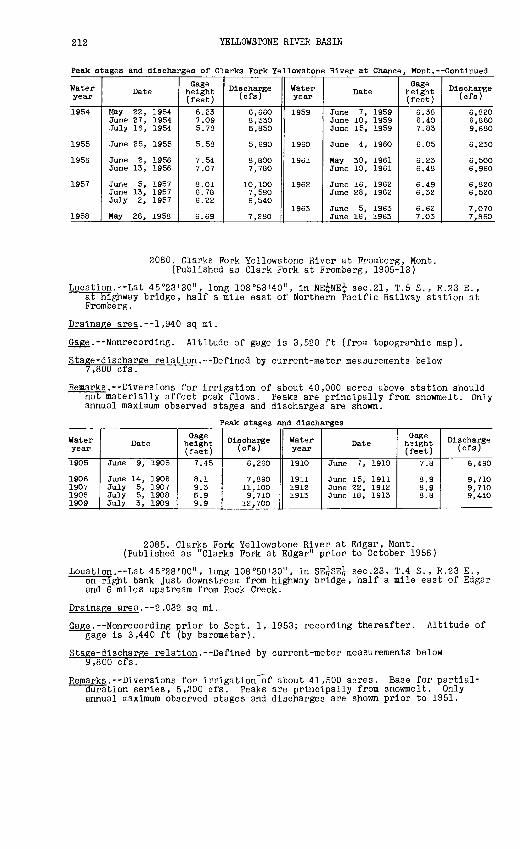
212 YELLOWSTONE RIVER BASIN
Peak stages and discharges of Clarks Fork Yellowstone River at Chance, Mont. Continued
Water year
1954
1955
1956
1957
1958
Date
May 22, 1954 June 27, 1954 July 16, 1954
June 25, 1955
June 2, 1956 June 13, 1956
June 5, 1957 June 13, 1957 July 2, 1957
May 26, 1958
Gage height (feet)
6.23 7.09 5.78
5.58
7.54 7.07
8.01 6.78 6.22
6.69
Discharge (cfs)
6,660 8,330 5,850
5,690
8,800 7,780
10,100 7,580 6,540
7,280
Water year
1959
1960
1961
1962
1963
Date
June 7, 1959 June 10, 1959 June 15, 1959
June 4, 1960
May 30, 1961 June 10, 1961
June 16, 1962 June 28, 1962
June 5, 1963 June 16, 1963
Gage height (feet)
6.38 6.40 7.83
6.05
6.23 6.48
6.49 6.32
6.62 7.03
Discharge (cfs)
6,820 6,860 9,680
6,230
6,500 6,960
6,820 6,520
7,070 7,860
2080. Clarks Pork Yellowstone River at Fromberg, Mont. (Published as Clark Pork at Promberg, 1905-13)
Location. Lat 45°23'30", long 108°53'40", In NE^NE^ sec.21, T.5 S. , R.23 E., at highway bridge, half a mile east of Northern Pacific Railway station at Fromberg.
Drainage area. 1,940 sq ml.
Gage. Nonrecordlng. Altitude of gage Is 3,520 ft (from topographic map).
Stage-discharge relation. Defined by current-meter measurements below 7,800 cfs.
Remarks.--Diversions for Irrigation of about 40,000 acres above station should not materially affect peak flows. Peaks are principally from snowmelt. Only annual maximum observed stages and discharges are shown.
Peak stages and discharges
Water year
1905
1906190719081909
Date
June 9, 1905
June 14, 1906July 5, 1907July 5, 1908July 3, 1909
Gage height (feet)
7.45
8.19.3S.99.9
Discharge (cfs)
6,260
7,89011,1009,710
12,700
Water year
1910
191119121913
Date
June 7, 1910
June 15, 1911June 22, 1912June 18, 1913
Gage height (feet)
7.8
8.98.98.8
Discharge (cfs)
6,490
9,7109,7109,410
2085. Clarks Pork Yellowstone River at Edgar, Mont. (Published as "Clarks Pork at Edgar" prior to October 1956)
Location. Lat 45°28'00", long 108 a50'30", In SE^SE^ sec.23, T.4 S., R.23 E., on right bank just downstream from highway bridge, half a mile east of Edgar and 6 miles upstream from Rock Creek.
Drainage area. 2,032 sq ml.
Gage. Nonrecordlng prior to Sept. 1, 1953; recording thereafter. Altitude of gage Is 3,440 ft (by barometer).
Stage-discharge relation. Defined by current-meter measurements below 9,800 cfs.
Remarks.--Diversions for Irrlgatlon^of about 41,500 acres. Base for partlal- duration series, 5,300 cfs. Peaks are principally from snowmelt. Only annual maximum observed stages and discharges are shown prior to 1951.

YELLOWSTONE RIVER BASIN 213
Peak stages and discharges of Clarks Pork Yellowstone River at Edgar, Mont.
Water year
1922192319241925
19261927192819291930
19311932
19341935
19361937193819391940
19411942194319441945
19461947194819491950
Date
June 16, 1922June 13, 1923June 15, 1924June 22, 1925
June 7, 1926June 27, 1927May 26, 1928June 16, 1929May 31, 1930
June 3, 1931June 8, 1932
May 9, 1934June 14, 1935
June 2, 1936June 12, 1937June 24, 1938May 31, 1939June 16, 1940
Sept. 8, 1941June 9, 1942June 20, 1943June 27, 1944June 25, 1945
June 12, 1946June 21, 1947June 4, 1948June 12, 1949June 17, 1950
Gage height (feet)
7.906.705.957.30
6.358.108.256.926.05
6.809.20
5.787.64
8.628.597.906.786.02
7.407.468.348.177.95
6.737.057.797.117.46
Discharge (cfs)
9,7006,7005,3008,310
6,17010,20010,6005,6304,390
5,60010,800
4,5508,450
10,90010,2008,4206,3504,810
7,5707,8809,1708,7708,430
5,8406,6308,4006,8207,350
Water year
1951
1952
1953
1954
1955
1956
1957
1958
1959
1960
1961
1962
1963
Date
June 17, 1951
June 7, 1952
June 14, 1953
May 22, 1954June 27, 1954
June 25, 1955
June 2, 1956June 16, 1956
June 5, 1957June 17, 1957July 1, 1957
May 26, 1958
June 10, 1959June 16, 1959
June 5, 1960
May 30, 1961June 10, 1961
June 16, 1962June 28, 1962
June 5, 1963June 16, 1963
Gage height (feet)
7.64
7.50
7.92
6.967.54
6.23
7.997.53
8.337.626.83
7.00
6.768.16
6.49
6.646.90
7.406.86
7.477.55
Discharge (ofs)
a7,710
7,950
8,340
6,8108,090
5,300
9,0808,070
9,8307,8906,770
6,950
6,4509,450
6,220
6,1906,740
7,8306,700
7,7307,910
a Annual peak only.
2095. Rock Creek near Red Lodge, Mont.
Location.--Lat 45°07'15", long 109°17'45", in NW^NW^ sec.20, T.8 S., R.20 E., on left bank at downstream side of bridge, 3 miles upstream from West Fork and 5 miles southwest of Red Lodge.
Drainage area. 124 sq mi.
Gage. Nonrecording prior to Oct. 1, 1937; recording thereafter. Datuir of gage is 6,100.52 ft above mean sea level, datura of 1929.
Stage-discharge relation. Defined by current-meter measurements below 1,300 cfs.
Remarks. Peaks are principally from snowmelt. Base for partial-duration series, 660 cfs. Only annual observed peaks are shown prior to 1938.
Peak stages and discharges
Water year
1932
19341935
19361937
1938
1939
1940
Date
May 21, June 15,24, 1932
June 16, 1934June 12, 1935
June 1, 1936June 16, 1937
May 28, 1938June 5, 1938June 8, 1938June 13, 1938June 18, 1938June 26, 1938
May 29, 1939
June 20, 1940
Gage height (feet)
3.80
3.104.40
4.104.80
3.253.243.333.133.183.41
3.01
3.12
Discharge (cfs)
955
5331,490
1,2401,930
815804903690740991
661
673
Water year
1941
1942
1943
1944
Date
May 26, 1941June 15, 1941June 17, 1941
May 26, 1942June 8, 1942June 25, 1942July 8, 1942
May 30, 1943June 19, 1943June 27, 1943July 1, 1943July 10, 1943July 23, 1943
May 15, 1944May 30, 1944June 26, 1944
Gage height (feet)
3.093.263.25
3.463.793.073.30
3.213.853.523.793.543.30
3.133.223.70
Discharge (cfs)
664780760
1,3001,840
9761,250
8902,0101,3901,8201,3701,000
710818
1,630

214 YELLOWSTONE RIVER BASIN
Peak stages and discharges of Rock Creek near Red Lodge, Mont.--Continued
Water year
1944
1945
1946
1947
1948
1949
1950
1951
1952
1953
Date
July 1, 1944
June 22, 1945July 4, 1945July 11, 1945
June 5, 1946
May 9, 1947June 20, 1947July 8, 1947July 16, 1947
May 22, 1948June 3, 1948June 9, 1948July 3, 1948
June 11, 1949
June 6, 1950June 16, 1950June 22, 1950July 1, 1950
May 24, 1951May 28, 1951June 16, 1951July 4, 1951July 21, 1951Aug. 5, 1951
May 29, 1952June 5, 1952
June 13, 1953
Gage height (feet)
3.41
3.873.253.27
3.24
3.103.243.203.12
3.393.323.383.12
3.46
3.243.383.403.47
3.203.293.543.233.643.23
3.384.18
3.52
Discharge (cfs)
1,110
1,990902946
744
675846790698
1,070962
1,060698
1,190
818916970
1,100
790916
1,330832
1,460832
1,0602,590
1,300
Water year
1954
1955
1956
1957
1958
1959
1960
1961
1962
1963
Date
June 24, 1954June 27, 1954July 17, 1954
June 23, 1955
May 28, 1956June 5, 1956June 16, 1956June 29, 1956
June 4, 1957June 20, 1957June 24, 1957June 30, 1957
May 21, 1958
June 6, 1959June 9, 1959June 15, 1959July 15, 1959
June 2, 1960
May 30, 1961June 8, 1961
June 14, 1962June 26, 1962
May 24, 1963June 4, 1963June 15, 1963July 9, 1963
Gage height (feet)
3.794.083.63
3.18
4.003.854.023.38
4.783.613.694.23
3.90
3.513.463.883.22
3.11
3.153.14
3.573.63
3.183.633.983.17
Discharge (cfs)
1,1101,570
923
578
1,4301,3101,800
842
3,110958
1,0201,840
1,250
895850
1,200674
680
751730
9641,030
680962
1,350660
2100. West Pork Rock Creek below Basin Creek, near Red Loc'ge, Mont.
Location.--Lat 45°09'00", long 109°19'30", in NW^NE^ sec.12, T.e S., R.20 E., on left bank 0.6 mile below Silver Run Creek and 4 miles southwest of Red Lodge.
Drainage area.--63.1 sq mi.
Gage.--Recording. Altitude of gage is 6,290 ft (from topographic map).
Stage-discharge relation. Defined by current-meter measurements below 590 cfs.
Remarks.--No winter records. Peaks are principally from snowmelt. Base for partial-duration series, 280 cfs.
Peak stages and discharges
Water year
1938
1939
1940
1941
1942
Date
June 8, 1938June 26, 1938
May 30, 1939
June 1, 1940June 21, 1940June 26, 1940July 3, 1940
May 26, 1941June 18, 1941June 24, 1941July 20, 1941
May 26, 1942June 8, 1942June 26, 1942July 8, 1942
Gage height (feet)
2.652.82
-
2.833.112.923.00
2.573.022.902.54
2.923.612.823.46
Discharge (cfs)
303352
280
355441382408
281473427303
435715420678
Water year
1943
1944
1945
1946
Date
May 30, 1943June 20, 1943June 30, 1943July 23, 1943Aug. 2, 1943
May 18, 1944May 31, 1944June 3, 1944June 26, 1944July 2, 1944
June 6, 1945June 22, 1945July 11, 1945Aug. 4, 1945
June 5, 1946June 11, 1946
Gage height (feet)
2.883.582.422.862.62
2.793.203.483.533.43
2.403.623.052.42
2.762.54
Discharge (cfs)
449700636422343
418576700722678
283722537313
396319

YELLOWSTONE RIVER BASIN 215
Peak stages and discharges of West Pork Rock Creek below Basin Creek, near Red Lodge,Mont. Continued
Water year
1946
1947
1948
1949
1950
1951
Date
June 23, 1946July 2, 1946
June 20, 1947June 27, 1947July 7, 1947
May 21, 1948June 3, 1948June 10, 1948June 22, 1948July 1, 1948
June 9, 1949
June 11, 1950June 17, 1950June 22, 1950July 2, 1950
June 17, 1951
Gage height (feet)2.512.67
2.652.432.62
2.892.942.992.522.56
2.66
2.472.912.732.93
2.63
Discharge (cfs)
316361
378303368
487529553340336
392
280446375454
337
Water year
1951
1952
1953
1954
1955
1956
Date
July 5, 1951July 17, 1951
May 29, 1952June 6, 1952July 6, 1952July 12, 1952
June 13, 1953July 10, 1953
May 22, 1954June 27, 1954July 12, 1954July 16, 1954
June 23, 1955
May 28, 1956June 16, 1956June 29, 1956
Gage height (feet)2.652.78
2.463.882.572.53
3.332.57
2.573.272.742.92
2.76
3.562.952.44
Discharge (cfs)
344394
287933312290
598315
315581371446
386
727472312
2105. West Pork Rock Creek near Red Lodge, Mont.
Location.--Lat 45°09', long 109°19', in SE£ sec.6, T.8 S., R.20 E., at U.S. ran ger station, 2 miles upstream from mouth and 3 miles southwest of Red Lodge.
Drainage area.--66.9 sq mi.
Gage.--Nonrecording. Altitude of gage is 6,060 ft (from topographic mar).
Stage-discharge relation. Defined by current-meter measurements below 680 cfs.
Remarks. Diversions above station for irrigation of about 3,000 acres below station materially affect peak flows. Peaks are principally from snowmelt. Only annual peaks are shown.
Peak stages and discharges
Water year
1932
1934 1935
1936 1937 1938
Date
June 24, 1932
June 16, 1934 June 13, 1935
June 1, 1936 June 22, 1937 June 26, 1938
Gage height (feet)
3.96
2.34 3.70
4.00 6.10 3.90
Discharge (cfs)
861
150 582
686 1,850
640
Water year
1939 1940
1941 1942 1943 1944
Date
May 30, 1939 June 2,17,1940
June 17, 1941 June 8, 1942 June 19, 1943 June 5, 1944
Gage height (feet)
3.30 2.98
3.60 4.50 4.22 3.78
Discharge (cfs)
390 288
505 864 734 615
2110. Red Lodge Creek above Cooney Reservoir, near Boyd, Mont.
Location. Lat 45°26'16", long 109°15'10", in SE^SE^ sec.33, T.4 S. , R.20 E., on right bank just upstream from Cooney Reservoir, 9 miles west of B^yd.
Drainage area. 143 sq ml.
Gage Recording. Datum of gage Is 4,248.0 ft above mean sea level, datum of 1929.
Stage-discharge relation.--Defined by current-meter measurements below 600 cfs.
Remarks --No winter records prior to 1963. Diversions for irrigation of about TsTTOO acres above station do not materially affect peak flows. Peaks are
principally from snowmelt. Base for partial-duration series, 140 cfs.

216 YELLOWSTONE RIVER BASIN
Peak stages and discharges of Red Lodge Creek above Cooney Reservoir, near Boyd, Mont.
Water year
1937
1938
1939
1940
1941
1942
1943
1944
1945
1946
1947
1948
1949
Date
June 5, 1937June 12, 1937
May 20, 1938June 23, 1938June 25, 1938June 28, 1938July 20, 1938
June 17, 1939
June 23, 1940
Apr. 17, 1941Apr. 23, 1941May 31, 1941June 5, 1941June 10, 1941Aug. 12, 1941Sept. 8, 1941Sept. 22, 1941Sept. 27, 1941
Oct. 5, 1941Apr. 9, 1942Apr. 14, 1942Apr. 25, 1942May 13, 1942May 14, 1942May 17, 1942May 29, 1942
Apr. 11, 1943June 3, 1943June 14, 1943
May 17, 1944June 4, 1944June 7, 1944June 11, 1944June 17, 1944June 22, 1944June 27, 1944
Apr. 19, 1945May 6, 1945May 20, 1945May 27, 1945June 6, 1945June 11, 1945June 27, 1945July 12, 1945
May 24, 1946May 28, 1946June 12, 1946June 18, 1946June 24, 1946
Apr. 15, 1947Apr. 21, 1947May 12, 1947June 21, 1947
Apr. 16, 1948May 10, 1948June 3, 1948June 16, 1948June 22, 1948July 13, 1948
May 17, 1949
Gage height (feet)
2.475.55
3.322.924.273.903.78
2.19
2.12
2.382.382.815.064.202.283.652.152.50
2.342.292.542.47--
4.896.00
5.183.905.30
5.104.293.844.896.034.56_
2.302.403.223.304.684.043.622.78
2.383.192.952.572.50
3.652.693.352.50
2.412.156.002.944.504.07
2.44
Discharge (cfs)
152900
318246500430410
135
129
161164228798558168424148201
183182216201
a800a800743
1,050
820484882
798583472743
1,050648
0>)
157180334356776596478290
210346290216202
466248404222
195155
1,150320720602
238
Water year
1949
1950
1951
1952
1953
1954
1955
1956
1957
1958
1959
1960
1961
1962
1963
Date
June 3, 1949
Apr. 2, 1950Apr. 9, 1950May 6, 1950May 10, 1950May 24, 1950May 28, 1950June 2, 1950June 18, 1950
Apr. 14, 1951Apr. 30, 1951May 13, 1951June 4, 1951July 11, 1951
Apr. 8, 1952Apr. 16, 1952May 16, 1952May 22, 1952June 25, 1952July 13, 1952
Apr. 23, 1953Apr. 29, 1953May 29, 1953June 6, 1953June 13, 1953
Apr. 5, 1954
Apr. 15, 1955Apr. 19, 1955June 6, 1955
May 29, 1956
Apr. 23, 1957May 13, 1957May 15, 1957May 21, 1957May 31, 1957June 17, 1957June 21, 1957
May 8, 1958June 20, 1958July 4, 1958
Apr. 23, 1959Apr. 27, 1959May 4, 1959June 22, 1959June 28, 1959
May 3, 1960
Sept. 19, 1961
Apr. 4, 1962Apr. 20, 1962May 15, 1962May 26, 1962June 4, 1962June 15, 1962
Apr. 28, 1963May 12, 1963June 3, 1963June 10, 1963
Gage height (feet)
1.89
2.832.192.072.792.282.282.462.58
2.172.852.152.222.71
2.932.942.775.242.082.04
2.322.262.483.062.54
2.48
2.672.322.21
3.10
2.864.924.115.133.876.564.42
3.272.932.49
2.692.632.912.242.47
1.63
2.45
2.282.042.282.952.796.10
3.663.643.515.39
Discharge (cfs)
144
297172154288188188224256
165301166177271
354343305930155149
167146189325236
224
254182161
353
294839615900550
cl,360742
417315214
272257318161208
78
204
201148195358318
1,220
550544511
1,020
a Estimated.b Peak exceeded base; discharge not determined.c Does not include some possible bypass flow.

YELLOWSTONE RIVER BASIN 217
2115. Willow Creek near Boyd, Mont.
Location. Lat 45°25'20", long 109°13'50", in SW^SW£ sec.2, T.5 S., R.20 E., on left bank half a mile upstream from Cooney Reservoir and 8 miles west of Boyd.
Drainage area. 53.3 sq mi.
Ga%e.--Recording. At site half a mile downstream at different datum prior to Apr. 23, 1948. Altitude of gage is 4,260 ft (from topographic map).
Stage-discharge relation. Defined by current-meter measurements below 200 cfs.
Remarks.--No winter records prior to 1963. Diversions for irrigation of about 1,800 acres above stations do not materially affect peak flows. Peaks are principally from snowmelt. Base for partial-duration series, 80 ofs.
Peak stages and discharges
Water year
1937 a/
1938
1939
1940
1941
1942
1943
1944
1945
Date
June 8, 1937June 10, 1937June 12, 1937
May 20, 1938June 24, 1938June 29, 1938July 6, 1938July 20, 1938
June 17, 1939
June 23, 1940July 4, 1940
June 5, 1941June 10, 1941June 16, 1941July 6, 1941July 27, 1941Aug. 31, 1941Sept. 8, 1941Sept. 21, 1941Sept. 27, 1941
Apr. 14, 1942May 6, 1942May 13, 1942May 29, 1942June 7, 1942June 24, 1942June 29, 1942
Apr. 11, 1943May 24, 1943June 4, 1943June 14, 1943Aug. 5, 1943Sept. 3, 1943
May 18, 1944June 4, 1944June 8, 1944June 11, 1944June 17, 1944June 22, 1944June 27, 1944July 11, 1944July 23, 1944July 26, 1944Sept. 2, 1944
May 2, 1945May 20, 1945May 27, 1945June 2, 1945June 6, 1945June 9, 1945June 13, 1945June 28, 1945
Gage height (feet)3.173.056.60
4.034.563.502.523.44
2.38
3.452.64
4.984.173.142.432.882.884.692.883.00
3.172.916.15
b7.245.343.082.97
5.613.014.453.282.562.74
3.845.573.803.946.984.907.174.112.763.432.89
3.274.074.163.906.54.643.923.37
Discharge (cfs)
134122450
20225816689
162
82
17096
2941949288
118118266118126
138118410350258127100
28794
1921158286
14028713614644422146915786
11591
120180188168410226168128
Water year
1945
1946
1947
1948
1949
1950
1951
1952
1953
1954
1955
1956
1957
1958
1959
Date
July 21, 1945Aug. 21, 1945
June 12, 1946June 19, 1946June 25, 1946July 4, 1946
Apr. 29, 1947May 12, 1947
Apr. 16, 1948June 3, 1948June 22, 1948July 14, 1948Aug. 10, 1948
May 17, 1949
Apr. 2, 1950Apr. 9, 1950Apr. 13, 1950May 10, 1950July 30, 1950Sept. 11, 1950
Apr. 30, 1951July 11, 1951
Apr. 8, 1952Apr. 16, 1952May 22, 1952June 28, 1952July 13, 1952Aug. 11, 1952
June 6, 1953Aug. 3, 1953
July 19, 1954
Apr. 15, 1955Apr. 19, 1955
July 7, 1956
Apr. 23, 1957May 13, 1957May 21, 1957May 31, 1957June 17, 1957
Mar. 27, 1958May 8, 1958June 20, 1958July 4, 1958July 27, 1958
July 4, 1959
Gage height (feet)
2.652.65
3.252.642.913.16
5.014.10
3.823.082.824.132.62
2.42
2.952.732.542.702.472.57
2.712.86
2.814.254.142.922.782.85
2.712.75
2.55
3.142.70
2.52
2.934.494.563.086.66
2.983.163.182.932.92
2.79
Discharge (cfs)
8686
13493
111131
262188
16217113237697
67
15211993
1158397
116138
14233837612299
110
9596
82
180109
80
152451417127848
861241289695
88
a Period June 1 to Sept. 30.b Backwater from Cooney Reservoir.

218 YELLOWSTONE RIVER BASIN
Peak stages and discharges of Willow Creek near Boyd, Mont. Continued
Water year
1960
1961
1962
Date
Aug. 17, 1960
Sept. 19, 1961
Apr. 16, 1962 May 27, 1962 June 5, 1962 June 16, 1962
Gage height (feet)
2.75
5.09 5.05 5.01 6.55
Discharge (efs)
69
e95
112 106 101 768
Water year
1962
1965
Date
July 14, 1962 Aug. 1, 1962
Apr. 28, 1965 May 12, 1965 June 5, 1965 June 11, 1965
Gage height (feet)
2.90 2.85
3.47 2.96 5.583.51
Discharge (cfs)
92 86
178 105 170 181
c Maximum daily; estimated.
2135. Rock Creek at Jollet, Mont.
Location.--Lat 45°28'30", long 108°59'50", In SE^NW^ sec.22, T.4 S., R.22 E., at bridge on U.S. Highway 312 at Joliet, 4 miles downstream f"om Red Lodge Creek and 10 miles upstream from mouth.
Drainage area.--539 sq ml.
Gage.--Recording. Altitude of gage Is 3,780 ft (from topographic map).
Stage-discharge relation. Defined by current-meter measurements below 1,500 cfs.
Remarks. Some regulation by Cooney Reservoir on Red Lodge Creek. Diversions for Irrigation of about 46,600 acres. Regulation and diversions might materially affect peak flows. Peaks are principally from sno'flnelt. Base for partial-duration series, 850 cfs.
Peak stages and discharges
Water year
1946
1947
194S
1949
Date
Feb. 1, 1946June 12, 1946
Mar. 17, 1947Mar. 20, 1947May 11, 1947June 21, 1947
Feb. 18, 1948May 22 , 1948June 10, 1948June 24, 1948July 14, 1948
Dec. 30, 1948June 8, 1949
Gage height (feet)a2.652.07
a2.972.722.482.25
a4.483.704.033.834.01
a5. 253.34
Discharge (efs)
-912
-1,1401,040
852
-1,2501,5401,3601,420
-952
Water year
1950
1951
1952
1953
Date
June 7, 1950June 17, 1950June 23, 1950July 2, 1950
Feb. 2, 1951June 17, 1951July 11, 1951July 21, 1951
Jan. 3, 1952June 6, 1952
June 14, 1953
Gage height (feet)
3.513.793.513.4S
a4.853.523.613.88
a4.894.60
3.8S
Discharge (efs)
1,0801,3301,0801,050
-1,06O1,1301,360
-1,930
1,580
a Backwater from ice.
2140. Rock Creek at Rockvale, Mont.
Location.--Lat 45°31', long 108°52', In NW^ sec. 2, T.4 S., R.23 E., 200 ft down stream from highway bridge, half a mile south of Rockvale, anl 2 miles up stream from mouth.
Drainage area. 569 sq ml.
Gage. NonrecordIng. At bridge 200 ft upstream at different datum prior to Apr. 19, 1934. Altitude of gage Is 3,470 ft (by barometer).
Stage-discharge relation.--Large shifts occur. Defined by current-meter meas- urements below 1,400 cfs at site used prior to Apr. 19, 1934, and below 2,200 cfs at described site.
Remarks.--Peak flows are materially affected by diversions for Irrigation. Peaks are principally from snowmelt. Only annual peaks are shown.

YELLOWSTONE RIVER BASIN 219
Peak stages and discharges of Rock Creek at Rockvale, Mont.
Water year
1921 1922
1932
1934 1935
Date
June 9, 1921 June 6,10, 1922
June 8, 1932
June 7, 1934 July 22, 1935
Gage height (feet)4.45 3.08
8.10
3.24 3.50
Discharge (cfs)
2,200 856
2,310
834 1,280
Water year
1936
1937 1938 1939 1940
Date
Mar. 4, 1936 June 9, 1936 June 18,22,1937 June 29, 1938 June 18, 1939 Jan. 25, 1940 June 15, 1940
Gage height (feet)
a4.24 4.04 4.52 4.30 3.52
a3.72 3.01
Discharge (cfs)
984 2,240 1,370
885
530a Backwater from ice.
2145. Yellowstone River at Billings, Mont. (Published as "near Billings" 1904-5)
Location. --Lat 45°46'25", long 108°28'30", In SW^SE^ sec. 2, T.I S., R.23 E., near left bank at city of Billings water department Intake, 1 mile east of Billings and 12 miles upstream from Pryor Creek.
At site used prior to Jan. 10, 1963,Drainage area. 11,783 sq ml. 11,795 sq ml.
Gage . Nonrecordlng at highway bridge if miles upstream at different datums prior to July 1, 1932; recording thereafter. At old diversion dam l£ miles upstream at different datum July 1, 1932, to Oct. 12, 1937. At highway bridge if miles downstream at same datum used 1928-32 for Oct. 13, 1937, to Jan. 9, 1963. Datum of gage Is 3,096.09 ft above mean sea level (city of Billings Water Department bench mark).
Stage-discharge relation. Defined by current-meter measurements.
Remarks . --Diversions for irrigation of about 350,000 acres above station. Base for partial-duration series, 25,700 cfs. Peaks are principally from snow- melt. Only annual observed peaks are shown prior to 1934.
Peak stages and discharges
Water year
19041905
19291930
193119321933
1934
1935
1936
1937
1938
1939
1940
1941
1942
1943
1944
Date
June 20, 1904June 9, 1905
June 17, 1929May 31, 1930
June 4, 1931June 26, 1932June 14, 1933
May 10, 1934
June 15, 1935
Apr. 17, 1936June 2, 1936
June 12, 1937June 23, 1937
May 30, 193SJune 7, 1938June 24, 1938
June 1, 1939
June 15, 1940
June 16, 1941
May 28, 1942June 9, 1942July 9, 1942
June 1, 1943June 21, 1943
June 4, 1944June 17, 1944June 27, 1944
Gage height (feet)10.610.00
9.107.80
8.1010.10S.50
5.00
8.70
7.008.51
8.128.34
8.298.51
10.02
7.67
7.51
6.77
8.2210.147.17
8.7412.1
8.4910.0812.5
Discharge (cfs)
32 , 60033,100
31,50026,100
27,10037.40038,300
15,200
38,300
26 , SOO35,200
32,80034,000
34,00035,60046,800
29,100
27,300
22,900
32,60046,60025,800
37,50061,200
30,80043,80064,800
Water year
1945
1946
1947
1948
1949
1950
1951
1952
1953
1954
1955
1956
Date
June 28, 1945
June 7, 1946June 12, 1946
May 11, 1947June 10, 1947June 21, 1947
May 23, 1948June 6, 194S
May 18, 1949May 30, 1949June 12, 1949
June 8, 1950June 18, 1950July 2, 1950
May 25, 1951May 29, 1951June 18, 1951
May 5, 1952May 22, 1952May 30, 1952June 7, 1952
June 15, 1953
May 23, 1954June 28, 1954
June 17, 1955June 25, 1955
May 29, 1956June 3, 1956June 16, 1956
Gage height (feet)
10.23
8.288.42
8.238.1410.05
9.6911.58
8.388.108.97
9.0210.189.37
8.328.969.64
7.718.628.6010.82
10.56
8.789.90
8.578.44
11.6511.079.45
Discharge (cfs)
44,600
30,10030,800
29,60029,30044,600
39,70054,700
30,20028,20034,300
34,60043,40037,100
28,30034,00039,100
25,70031,80031,70048,600
46,500
33,40041,300
32,00031,100
56,20050,80038,000

220 YELLOWSTONE RIVER BASIN
Peak stages and discharges of Yellowstone River at Billings, Mont. Continued
Water year
1957
1958
1959
Date
June 7, 1957 June 17, 1957 June 22, 1957 July 2, 1957
May 26, 1958
June 8, 1959 June 16, 1959
Gage height (feet)
11.65 10.77 9.57 9.24
8.77
9.52 10.83
Discharge (cfs)
56,200 48,200 38,900 36,600
32,800
38,800 52,300
Water year
1960
1961
1962
1963
Date
June 16, 1960
June 10, 1961
June 5, 1962 June 16, 1962
June 5, 1963 June 16, 1963
Gage height (feet)
7.60
7.68
7.77 9.80
8.48 9.49
Discharge (cfs)
28,000
27,000
27,500 41,400
37,100 46,100
2162. Wets Creek near Billings, Mont.
Location. Lat 45°38', long 108°24', In SW£ sec.28, T.2 S., R.27 E., at bridge on county road, 19 miles southeast of Billings.
Drainage area. 8.14 sq mi.
Gage.--Crest-stage gage. Altitude of gage is 3,520 ft (from topographic map).
Stage-discharge relation. Defined by current-meter measurements below 50 cfs.
Remarks. Only annual peaks are shown.
Peak stages and discharges
Water year
1955
1956 1957 1958 1959
Date
Aug. 25, 1955
Feb. 22, 1956 June 8, 1957 July 2, 1958 June 4, 1959
Gage height (feet)
-
3.23 1.66 .50
1.14
Discharge (cfs)
a5
65 62 14 39
Water year
1960
1961 1962 1963
Date
May 2, 1960
May 21, 1961 Mar. 9, 1962 June 8, 1963
Gage height (feet)
2.50
.40 1.92 2.7
Discharge (cfs)
-
10 76
a Approximate.
2163. West Buckeye Creek near Billings, Mont.
Location.--Lat 45°39', long 108°24', in NE^ sec.21, T.2 S., R.27 E., at bridge on county road, 17 miles southeast of Billings.
Drainage area.--1.54 sq mi.
Gage. Crest-stage gage. Altitude of gage is 3,470 ft (from topographic map).
Stage-discharge relation. Defined by current-meter measurements below 90 cfs.
Remarks. Only annual peaks are shown.
Peak stages and discharges
Water year
1955
1956195719581959
Date
Aug. 25, 1955
May 29, 1956May 12, 1957July 2, 1958June 4, 1959
Gage height (feet)
1.54
2.241.811.31.68
Discharge (cfs)
17
921858315
Water year
1960
196119621963
Date
May 2, 1960
May 24, 1961Mar. 9, 1962June 20, 1963
Gage height (feet)
1.16
.801.031.37
Discharge (cfs)
60
2244_
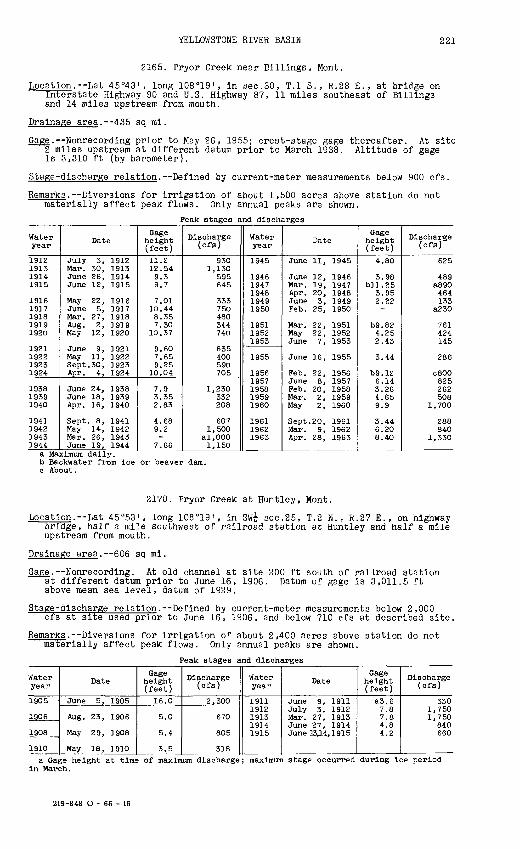
YELLOWSTONE RIVER BASIN 221
2165. Pryor Creek near Billings, Mont.
Location. Lat 45°43', long 108°19', in sec.30, T.I S., R.28 E., at bridge on Interstate Highway 90 and U.S. Highway 87, 11 miles southeast of Billings and 14 miles upstream from mouth.
Drainage area. 435 sq mi.
Gage. Nonrecording prior to May 26, 1955; crest-stage gage thereafter. At site 2 miles upstream at different datum prior to March 1938. Altitude of gage is 3,310 ft (by barometer).
Stage-discharge relation. Defined by current-meter measurements below 900 cfs.
Remarks. Diversions for irrigation of about 1,500 acres above station do not materially affect peak flows. Only annual peaks are shown.
Peak stages and discharges
Water year
1912191319141915
19161917191819191920
1921192219231924
193819391940
1941194219431944
Date
July 3, 1912Mar. 30, 1913June 26, 1914June 12, 1915
May 22, 1916June 5, 1917Mar. 27, 1918Aug. 2, 1919May 12, 1920
June 9, 1921May 11, 1922Sept. 30, 1923Apr. 4, 1924
June 24, 1938June 18, 1939Apr. 16, 1940
Sept. 8, 1941May 14, 1942Mar. 26, 1943June 19, 1944
Gage height (feet)
11.212.549.39.7
7.0110.448.357.30
10.37
9.607.659.25
10.04
7.93.352.83
4.689.2-
7.66
Discharge (cfs)
9301,130
595645
333750480344740
635400590705
1,230332208
6071,500
al,0001,150
Water year
1945
19461947194819491950
195119521953
1955
19561957195819591960
196119621963
Date
June 11, 1945
June 12, 1946Mar. 19, 1947Apr. 20, 1948June 3, 1949Feb. 25, 1950
Mar. 22, 1951May 22, 1952June 7, 1953
June 16, 1955
Feb. 22, 1956June 8, 1957Feb. 20, 1958Mar. 2, 1959May 2, 1960
Sept. 20, 1961Mar. 9, 1962Apr. 28, 1963
Gage height (feet)
4.80
3.98bll.25
3.952.22-
b9.824.252.43
3.44
b9.126.143.264.659.9
3.446.208.40
Discharge (cfs)
625
489a8 90464133
a230
761424145
286
0800825262508
1,700
288840
1,330
a Maximum daily.b Backwater from ice or beaver dam.c About.
2170. Pryor Creek at Huntley, Mont.
Location. Lat 45°53', long 108°19', in SW^ sec.25, T.2 N., R.27 E. , on highway bridge, half a mile southwest of railroad station at Huntley and half a mile upstream from mouth.
Drainage area. 606 sq mi.
Gage. Nonrecording. At old channel at site 200 ft south of railroad station at different datum prior to June 16, 1906. Datum of gage is 3,011.5 ft above mean sea level, datum of 1929.
Stage-discharge relation. Defined by current-meter measurements below 2,000 cfs at site used prior to June 16, 1906, and below 710 cfs at described site.
Remarks. Diversions for irrigation of about 2,400 acres above station do not materially affect peak flows. Only annual peaks are shown.
Peak stages and discharges
Water year
1905
1906
1908
1910
Date
June 5, 1905
Aug. 23, 1906
May 29, 1908
May 18, 1910
Gage height (feet)
16.0
5.0
5.4
3.5
Discharge (cfs)
2,300
670
805
318
Water year
1911 1912 1913 1914 1915
Date
June 9, 1911 July 3, 1912 Mar. 27, 1913 June 27, 1914 June 33,14, 1915
Gage height (feet)
a3.6 7.8 7.8 4.8 4.2
Discharge (cfs)
330 1,750 1,750
840 660
a Gage height at time of maximum discharge; maximum stage occurred during ice period in March.
219-848 O - 66 - 16

222 YELLOWSTONE RIVER BASIN
2175. Yellowstone River at Huntley, Mont.
Location.--Lat 46°54i, long 108°19 I , in Sw£ sec.24, T.2 N., R.27 E., on highway bridge, 1 mile dovmstream from Pryor Creek and Huntley.
Drainage area.--12,840 sq mi.
Gage.--Nonrecordlng. Datum of gage is 3,001 ft above mean sea level, datum of 1929.
Stage-discharge relation. Defined by current-meter measurement? .
Remarks.--Diversion for irrigation of about 375,000 acres above station. Peaks are principally from snowmelt. Only annual maximum observed stages and dis charges are shown. Maximum observed discharge does not differ materially from momentary maximum.
Peak stages and discharges
Water year
1908 1909 1910
1911 1912
Date
June 17, 190S June 5, 1909 June 2, 1910
June 14, 1911 June 10, 1912
Gage height (feet)
9.1 10.0 8.4
11.1 9.5
Discharge (cfs)
41,200 42,200 31,600
48,500 39,000
Water year
1913 1914 1915
1916
Date
June 13, 1913 June 5, 1914 June 26, 1915
June 20, 1916
Gage 1 eight (feet)
10.6 10.4 8.5
12.8
Discharge (cfs)
45,600 37,800 26,000
60,000
2185. Wind River near Dubols, Wyo.
Location. Lat 43°34'40", long 109°45i30", in NW^NE^ sec.25, T.^2 N. , R.108 W. , on left bank 2.5 miles upstream from Warm Springs Creek and 7 miles north west of Dubols.
Drainage area. 232 sq mi.
Gage. Recording. Datum of gage Is 7,188.71 ft above mean sea level (levels by Bureau of Reclamation).
Stage-discharge relation. Defined by current-meter measurement? below 1,600 cfs.
Remarks. Diversion for Irrigation of about 900 acres above station does not materially affect peak flows. Base for partial-duration series, 850 cfs.
Peak stages and discharges
Water year
1946
1947
1948
1949
1950
1951
1952
1953
1954
Date
June 6, 1946
June 20, 1947
June 3, 1948
June 13, 1949
June 7, 1950June 17, 1950
May 29, 1951June 17, 1951
Dee. 7, 1951June 7, 1952
June 14, 1953
May 22, 1954June 27, 1954
Gage height (feet)4.04
4.23
4.83
4.18
4.574.71
5.095.43
a5. 074.62
5.17
5.054.67
Discharge (cfs)
86S
958
1,270
86S
1,1001,190
1,4501,720
_1,080
1,520
1,4201,120
Water year
1955
1956
1957
1958
1959
1960
1961
1962
1963
Date
Jan. 29, 1955June 16, 1955
June 2, 1956
June 7, 1957
May 26, 1958
June 16, 1959
Mar. 15, 1960May 13, 1960
May 28, 1961
June 15, 1962
June 15, 1963
Gage 1 eight (feet)a4.974.26
5.66
5.21
4.83
4.84
a4.474.27
4.39
4.48
5.05
Discharge (cfs)
-834
1,910
1,610
1,130
1,210
_S47
930
986
1,390
a Backwater from ice.

YELLOWSTONE RIVER BASIN 223
2205. East Fork Wind River near Dubois, Wyo. (Published as "North Fork Wind River" prior to October 1953)
Location. Lat 43°27'20", long 109°27'55", In SW^NW^ sec.24, T.6 N., R.6 W., on left bank 1.1 miles upstream from mouth and 10 miles southeast of Dubols.
Drainage area. 427 sq ml.
Gage. Recording. Altitude of gage Is 6,450 ft (from topographic map).
Stage-discharge relation. Defined by current-meter measurements below 3,400 cfs.
Remarks. Diversion for Irrigation of about 2,000 acres above station does not materially affect peak flows. Base for partial-duration series, 2,500 cfs.
Peak stages and discharges
Water year
1951
1952
1953
1954
Date
May 23, 1951May 29, 1951June 17, 1951July 5, 1951
June 7, 1952
June 13, 1953
May 21, 1954
Gage height (feet)
6.526.507.516.55
7.35
7.27
6.50
Discharge (cfs)
2,6402,6005,3702,700
4,890
4,640
2,850
Water year
1954
1955
1956
1957
Date
June 24, 1954June 26, 1954
June 23, 1955
June 1, 1956
June 8, 1957June 30, 1957July 19, 1357
Gage height (feet)
6.427.72
6.16
7.92
8.919.279.22
Discharge (cfs)
2,S305,700
1,760
5,350
4,8304,7204,580
2214. Dlnwoody Creek above lakes, near Burrls, Wyo.
Location. Lat 43°20'45", long 109°24'35", In SE^SE^ sec.l, T.4 N., R.6 W. , on left bank half a mile upstream from Upper Dlnwoody Lake, 7.0 miles vest of Burrls, and 17 miles southeast of Dubols.
Drainage area. 88.2 sq ml.
Gage.--Recording. Altitude of gage Is 6,500 ft (from topographic map).
Stage-discharge relation. Defined by current-meter measurements below 670 cfs.
Remarks. Base for partial-duration series, 700 cfs.Peak stages and discharges
Water year
1958 19591960
1961
Date
May 24, 1958 June 25, 1959June 17, 1960
June 20, 1961
Gage height (feet)
4.08 4.174.05
4.05
Discharge (cfs)
737 876708
740
Water year
1962 1963
Date
June 27, 1962 June 16, 1963July 7, 1963
Gage height (feet)
4.17 4.574.08
Discharge (cfs)
868 1,270
784
2215. Dlnwoody Creek near Burrls, Wyo. (Published as "near Crowheart" 1909 and as "near Lenore" 1918-24)
Location. Lat 43°25'55", long 109°21'01", In NE^NE^ sec.9, T.5 N., R.5 W., on left bank 1,000 ft upstream from mouth and 6 miles northwest of Burrls.
Drainage area. 100 sq ml.
Gage. Nonrecordlng May 17 to Oct. 30, 1909; recording thereafter. Datum of gage is 6,196.63 ft above mean sea level, datum of 1929.
Stage-discharge relation. Defined by current-meter measurements below 1,100 cfs.
Remarks. Diversion above station for irrigation of about 1,700 acres. Natural regulation by Dlnwoody Lake (surface area, 640 acres) and other small lakes. Regulation and diversion do not materially affect peak flows. Base for partial-duration series, 700 cfs.

224 YELLOWSTONE RIVER BASIN
Peak stages and discharges of Dinwoody Creek near Burris, Vyo.
Water year
1909
1918 b/
1919
1920
1921
1922
1923
1924
1925
1926
1927
Date
July 7, 1909
June 18, 1918July 23, 1918Aug. 4, 1918
July 26, 1919
June 16, 1920
June 12, 1921June 30, 1921July 21, 1921
June 23, 1922Aug. 14, 1922Aug. 27, 1922
June 13, 1923July 13, 1923July 25, 1923
June 16, 1924July 8, 1924
July 6, 1925July 18, 1925
July 5, 1926July 10, 1926Aug. 4, 1926
June 29, 1927
Gage height (feet)
4.1
3.73--
2.85
2.75
3.482.972.75
2.822.783.03
3.003.093.75
3.163.37
3.253.23
3.163.383.14
3.47
Discharge (cfs)
al,030
1,340c782C768
742
645
1,460930710
820782
1,030
9601,0501,710
9341,070
992980
8881,020
877
1,070
Water year
1928
1929
1930 b/
1950 b/
1951
1952
1953
1954
1955
1956
1957
1958
Date
May 28, 1928July 19, 1928July 28, 1928
July 20, 1929
July 14, 1930
July 8, 1950
May 29, 1951June 17, 1951July 22, 1951July 30, 1951
June 7, 1952
June 14, 1953
June 28, 1954July 17, 1954
July 22, 1955July 26, 1955
June 6, 1956June 13, 1956
June 7, 1957July 1, 1957July 18, 1957
May 24, 1958
Gige height (feet)
3.033.352.94
2.98
3.24
2.94
2.722.703.312.86
3.01
3.17
3.422.83
3.122.82
2.982.82
3.243.103.22
2.80
Discharge (cfs)
8161,000
767
767
905
998
742720
1,250902
979
1,120
1,110720
908713
817732
988895974
682a Annual peak only, b Partial year, c Maximum daily.
2220. Wind River near Burris, Wyo.
Location.--Lat 43°25'50", long 109°20'45", in NW£ sec.10, T.5 N., R.5 W., on left bank 700 ft downstream from Dinwoody Creek and 5 miles northwest of Burris.
Drainage area. 1,236 sq mi.
Gage.--Recording. Datum of gage is 6,177.22 ft above mean sea level, datum of 1929.
Stage-discharge relation. Defined by current-meter measurements below 7,300 cfs.
Remarks. Diversion above station for irrigation of about 6,000 a?res above and 1,000 acres below station. Diversion does not materially affe?t peak flows. Peaks are principally from snowmelt. Base for partial-duration series, 5,000 cfs.
Peak stages and discharges
Water year
1947
1948
1949
1950
Date
June 20, 1947
June 8, 1948
June 13, 1949
June 7, 1950 June 17, 1950 July 4, 1950
Gage height (feet)
6.42
6.68
6.47
6.65 6.83 6.67
Discharge (cfs)
4,800
5,510
5,040
5,130 5,560 5,170
Water year
1951
1952
1953
Date
May 24, 1951 May 29, 1951 June 17, 1951
June 7, 1952
June 14, 1953
Gige height (feet)
6.70 7.42 7.72
7.11
7.68
Discharge (efs)
5,240 7,220 8,610
6,310
9,900

YELLOWSTONE RIVER BASIN 225
2225. Dry Creek near Burris, Wyo. (Published as "at Crowhearb" 1909 and as "near Lenore" 1921-24)
Location.--Lat 43°20'10", long 109°18'20", in SW£ sec.12, T.4 N., R.5 W., half a mile upstream from Dry Creek ditch and Z\ miles southwest of Burris.
Drainage area. 53.2 sq mi.
Gage. Recording. At datum 1.07 ft higher prior to Nov. 5, 1934. Altitude of gage is 6,480 ft (from topographic map).
Stage-discharge relation. Defined by current-meter measurements below 530 cfs.
Remarks. Diversions above station for irrigation of about 100 acres do not materially affect peak flows. Only annual peaks are shown.
Peak stages and discharges
Water year
1921 1922 1923 1924 1925
1926 1927
1929 1930
Date
June 12, 1921 June 23, 1922 June 13, 1923 June 16, 1924 June 30, 1925
July 9, 1926 June 28, 1927
May 25, 1929 Aug. 14, 1930
Gage height (feet)
3.9 2.17 2.6 2.65 2.32
2.71 2.49
2.05 3.16
Discharge (cfs)
1,400 317 505 582 410
691 465
272 1,000
Water year
1931 1932 1933 1934 1935
1936 1937 1938 1939 1940
Date
June 8, 1931 June 26, 1932 June 10, 1933 May 8, 1934 June 14, 1935
Aug. 3, 1936 June 21, 1937 June 23, 1938 May 30, 1939 June 19, 1940
Gage height (feet)
2.31 2.34 3.00 1.455.01
4.13 4.05 4.03 3.82 3.42
D'.scharge(Of 3)
400 448 675 135 776
340 311 278 219 124
2235. Willow Creek near Crowheart, Wyo. (Published as "at J. K. Ranch post office" 1909
and as "near Lenore" 1921-23)
Location. Lat 43°17'05", long 109°11'00", in NW£ sec.36, T.4 N. , R.4 W., 400 ft upstream from Willow Creek Canal diversion dam and 2 miles south of Crowheart.
Drainage area. 55.4 sq mi.
Gage. Nonrecording prior to Aug. 24, 1923; recording thereafter. At site 1.8 miles downstream at different datum prior to Oct. 31, 1909, and at site 800 ft upstream at different datura May 16, 1921, to Aug. 24, 1923. Altitude of gage is 6,070 ft (from topographic map).
Stage-discharge relation. Defined by current-meter measurements below 150 cfs at described site.
Remarks. Diversion above station for irrigation of about 100 acres does not appreciably affect peak flows. Only annual peaks are shown.
Peak stages and discharges
Water year
1909
192119221923
1925
19261927192819291930
Date
June 5, 1909
June 7, 1921June 12, 1922July 26, 1923
June 30, 1925
July 9, 1926July 28, 1927May 28, 1928June 17, 1929May 30, 1930
Gage height (feet)
4.5
3.651.984.50
2.13
2.24.132.642.152.37
Discharge (cfs)
408
532175750
108
1Z&518214151183
Water year
19311932193319341935
19361937193819391940
Date
June 1, 1931May 21, 1932June 12, 1933July 24, 1934June 15, 1935
June 1, 1936June 16, 1937June 8, 1938May 31, 1939Sept. 28, 1940
Gage height (feet)
2.832.563.002.052.86
1.892.471.93
a5.401.40
D'.scharge (cfs)
270209284131
a259
109194115
al,10049
a From Bureau of Indian Affairs.

226 YELLOWSTONE RIVER BASIN
2240. Bull Lake Creek above Bull Lake, Wyo. (Published as "above Bull Lake Reservoir" prior to October 1950}
Location. Lat 43"10'37". long 109°12'08", in NE£SW£ sec.2, T.2 N., R.4 W., on left bank 1^ miles upstream from high-water line of Bull Lake and 9 miles south of Crowheart.
Drainage area. 187 sq mi,of which 179 sq mi contributes directly to surface runoff.
Gage.--Recording. Altitude of gage is 5,874 ft (from topographic map).
Stage-discharge relation. Defined by current-meter measurements below 2,500 cfs.
Remarks. No diversion above station. Base for partial-duration series, 1,500 cfs.
Peak stages and discharges
Water year
1941 a/
1942
1943
1944
1945
1946
1947
Date
June 18, 1941
May 27, 1942June 9, 1942July 8, 1942
May 31, 1943June 27, 1943
May 17, 1944June 1, 1944June 27, 1944July 2, 1944
June 24, 1945July 18, 1945
June 18, 1946
June 9, 1947June 21, 1947June 27, 1947
Gage height (feet)
5.28
_5.40-
5.225.95
5.145.876.185.60
6.025.10
4.80
5.136.615.18
Discharge (cfs)
1,760
1,5401,8401,690
1,6002,180
1,5402,1202,3601,900
2,3801,620
1,270
1,5302,7601,570
Water year
1947
1948
1949
1950
1951
1952
1953
Date
July 8, 1947
May 29, 1948June 3, 1948June 9, 1948
June 19, 1949June 27, 1949
June 23, 1950July 3, 1950July 11, 1950
May 28, 1951June 17, 1951July 21, 1951Aug. 5, 1951
June 7, 1952
June 14, 1953
C-age height (feet)
5.66
5.265.315.33
5.965.45
5.585.845.77
5.845.585.455.08
6.69
6.52
Discharge (cfs)
1,960
1,6901,7301,740
2,2901,830
1,9402,1802,110
2,1801,9401,8301,520
3,030
2,860
a Partial year; listed peak is probably maximum for the year.
2250. Bull Lake Creek near Lenore, Wyo.
Location. Lat 43°14'33", long 109°01'20", in NE^NW^ sec.17, T.3 N., R.2 W., on left bank 700 ft upstream from mouth, 2f miles downstream fro*n Bull Lake, and 8-| miles southeast of Lenore.
Drainage area. 213 sq mi, of which 201 sq mi contributes directly to surface runoff.
Gage. Recording. At datum 0.86 ft higher prior to Oct. 1, 1922. At datum 2.00 ft lower Oct. 1, 1922, to Oct. 3, 1934. Altitude of gag? is 5,654 ft (from topographic map).
Stage-discharge relation. Defined by current-meter measurements below 2,000 cfs and extended above on basis of slope-area measurement at 6,200 cfs.
Remarks. Diversions above station for irrigation of about 600 acres downstream. Flow completely regulated by Bull Lake since 1938. Only annual peaks are shown.
Peak stages and discharges
Water year
1918 1919 1920
1921 1922 1923 1924 1925
Date
June 16, 1918 May 30, 1919 June 16, 1920
June 12, 1921 June 23, 1922 June 13, 1923 June 16, 1924 July 1, 1925
Sage height ( feet )
4.2 2.98 3.3
4.3 3.866.53 6.52 6.7
Discharge (cfs)
3,990 1,920 2,190
2,950 2,520 2,290 2,260 ?,560
Water year
1926 1927 1928 1929 1930
1931 1932 1933
Date
July 10, 1926 June 29, 1927 May 28, 1928 June 17, 1929 Aug. 15, 1930
June S, 1931 June 26, 1932 June 14, 1933
Sage height (feet)
6.5 7.23 6.38 5.89 6.5
5.80 6.75 6.98
Discharge (cfs)
2,280 3,340 2,110 1,430 2,450
1,260 2,880 3,270
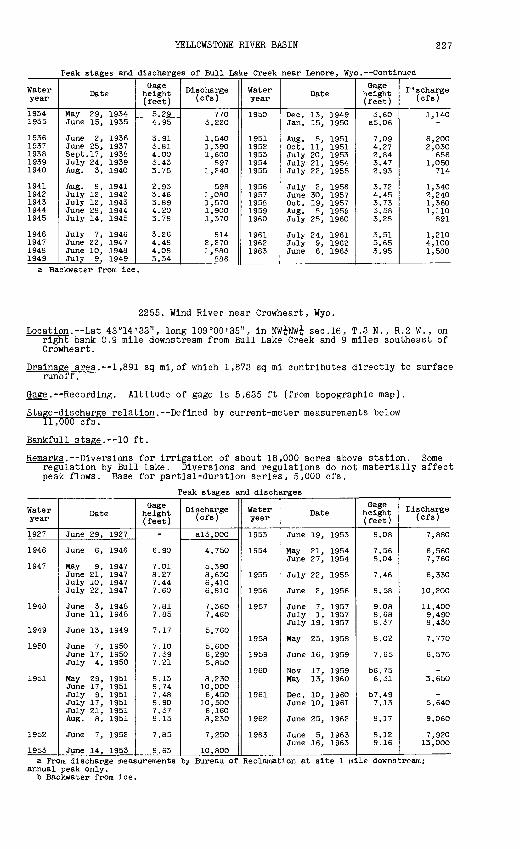
YELLOWSTONE RIVER BASIN 227
Peak stages and discharges of Bull Lake Creek near Lenore, Wyo. Continued
Water year
19341935
19361937193819391940
19411942194319441945
1946194719481949
Date
May 29, 1934June 15, 1935
June 2, 1936June 25, 1937Sept. 17, 1938July 24, 1939Aug. 3, 1940
Aug. 8, 1941July 12, 1942July 12, 1943June 28, 1944July 14, 1945
July 7, 1946June 22, 1947June 10, 1948July 9, 1949
Gage height (feet)
5.294.95
3.913.814.003.433.75
2.933.463.894.203.78
3.264.484.083.34
Discharge(Cfs)
7703,220
1,5401,3901,600
8971,240
5981,0801,5701,9001,370
8142,2701,880
886
Water year
1950
19511952195319541955
19561957195819591960
196119621963
Date
Dec. 13, 1949Jan. 15, 1950
Aug. 8, 1951Oct. 11, 1951July 20, 1953July 21, 1954July 22, 1955
July 2, 1956June 30, 1957Oct. 19, 1957Aug. 8, 1959July 28, 1960
July 24, 1961July 9, 1962June 6, 1963
Gage height (feet)
3.60a5.06
7.094.272.843.472.93
3.724.453.733.583.28
3.515.653.95
ris charge (cfs)
1,140-
6,2002,030
6561,050
714
1,3402,2401,3601,110
891
1,2104,1001,580
a Backwater from ice.
2255. Wind River near Crowheart, Wyo.
Location.--Lat 43°14'33", long 109°00'35", in NW^NWi sec.16, T.3 N., R.2 W., on right bank 0.9 mile downstream from Bull Lake Creek and 9 miles southeast of Crowheart.
Drainage area. 1,891 sq mi, of which 1,873 sq mi contributes directly to surface runoff.
Gage. Recording. Altitude of gage is 5,635 ft (from topographic map).
Stage-discharge relation. Defined by current-meter measurements below 11,000 cfs.
Bankfull stage. 10 ft.
Remarks. Diversions for irrigation of about 18,000 acres above station. Some regulation by Bull Lake. Diversions and regulations do not materially affect peak flows. Base for partial-duration series, 5,000 cfs.
Peak stages and discharges
Water year
1927
1946
1947
1948
1949
1950
1951
1952
1953
Date
June 29, 1927
June 6, 1946
May 9, 1947June 21, 1947July 10, 1947July 22, 1947
June 3, 1948June 11, 1948
June 13, 1949
June 7, 1950June 17, 1950July 4, 1950
May 29, 1951June 17, 1951July 9, 1951July 17, 1951July 21, 1951Aug. 8, 1951
June 7, 1952
June 14, 1953
Gage height (feet)
-
6.90
7.018.277.447.60
7.817.85
7.17
7.107.397.21
8.138.747.488.907.378.13
7.85
8.63
Discharge(Cfs)
a!3,000
4,750
5,3908,6306,4106,810
7,3607,460
5,760
5,6006,2905,850
8,23010,0006,45010,5006,1608,230
7,250
10,800
Water year
1953
1954
1955
1956
1957
1958
1959
1960
1961
1962
1963
Date
June 19, 1953
May 21, 1954June 27, 1954
July 22, 1955
June 2, 1956
June 7, 1957July 1, 1957July 19, 1957
May 23, 1958
June 16, 1959
Nov 17, 1959Maj 13, 1960
Dec. 10, 1960June 10, 1961
June 25, 1962
June 5, 1963June 16, 1963
Gage height (feet)
8.08
7.568.04
7.46
8.58
9.088.688.37
8.02
7.65
b6.756.31
b7.497.13
8.17
8.129.16
lischarge(Cfs)
7,880
6,5607,760
6,330
10,200
11,4009,4908,430
7,770
6,570
-3,650
-5,640
9,060
7,92013,000
a From discharge measurements by Bureau of Reclamation at site 1 mile downstream;annual peak only.
b Backwater from ice.

228 YELLOWSTONE RIVER BASIN
2280. Wind River at Riverton, Wyo.(Published as "Big Wind River near Arapahoe Agency" In 1906 and
"Big Wind River near Riverton" In 1907-8}
Location. Lat 43°00'36", long 108°22'35", In NW^NW^ sec.2, T.I S., R.4 E., on left bank at downstream side of bridge on State Highway 789, 1.1 miles south east of post office In Riverton and 1^- miles upstream from Po")o Agle River.
Drainage area.--2 ,309 sq ml.
Gage.--Nonrecording prior to Apr. 4, 1917; June 13, 1927, to Dec. 5, 1928; and Apr. 26, 1929, to Oct. 12, 1930; recording otherwise. At sites about 1 mile upstream at different daturas prior to Nov. 6, 1908. At site 600 ft down stream at different daturas May 15, 1911, to Dec. 5, 1928. Datum of gage Is 4,903.56 ft above mean sea level, datum of 1929.
Stage-discharge relation. Defined by current-meter measurements below 9,500 cfs.
Remarks. Diversion for Irrigation of about 92,000 acres above station. The main diversion began In 1926 for the Riverton project. Some regulation by Pilot Butte Reservoir beginning In 1926, and Bull Lake Reservoir beginning In 1938 (combined capacity, 182,000 acre-ft). Diversions and regulation materially affect peak flows. Only annual peaks are shown.
Peak stages and discharges
Water year
1906
1908
19111912191319141915
19161917191819191920
19211922192319241925
19261927192S19291930
19311932193319341935
1936193719381939
Date
June 14, 1906
June 15, 19O8
June 17, 1911June 8, 1912May 29, 1913June 4, 1914June 2, 1915
June 18, 1916July 1, 1917June 16, 1918May 31, 1919June 10, 1920
June 8, 1921June 10, 1922July 25, 1923June 15, 1924July 4, 1925
July 11, 1926June 29, 1927May 28, 1928May 25, 1929Aug. 13, 1930
June 8, 1931June 24, 1932June 14, 1933July 25, 1934June 15, 1935
June 2, 1936June 22, 1937June S, 1938June 1, 1939
Gage height (feet)
-
4.90
10.510.1
--
8.8
10.110.912.89.0
11.3
11.710.1511.510.4510.6
9.3211.011.46.007.40
6.436.957.205.708.15
5.996.525.255.55
Discharge (cfs)
12,300
S.800
11,1009,000
10 , 900S,8005,510
7,7509,5309,3002,2808,800
12,2007,360
11,4008,3808,900
4,5709,400
10.9004,7309,000
7,7708,7809,5105,500
13 , 300
5,7606,4503,9204,280
Water year
1940
19411942194319441945
19461947
194819491950
19511952
1953
1954
1955
1956
1957195819591960
1961
19621963
Date
Sept. 29, 1940
June 18, 1941June 10, 1942June 23, 1943June 27, 1944June 25, 1945
June 6, 1946Feb. 19, 1947June 21, 1947June 11, 1948June 13, 1949Dec. 21, 1949June 17, 1950
June 18, 1951Dec. 19, 1951June 7, 1952Dec. 28, 1952June 15, 1953Jan. 27, 1954June 27, 1954Jan. 12, 1955June 16, 1955
Dec. 23, 1955June 3, 1956June 8, 1957May 23, 1958June 16, 1959Nov. 14, 1959May 13, 1960
Dec. 8, 1960June 10, 1961June 22, 1962June 17, 1963
Gage height (feet)
5.53
6.117.187.057.496.84
6.10as. 39
_6.986.38
a7.52-
8.13a8. 17
_a8. 38
-a9.36
-a8. 29
-
a8.90-
9.178.006.58
as. 46-
a9.39-
8.319.49
Discharge (cfs)
4,240
5,4606,6206,6007,2906,070
3,940-
8,4006,0304,860
-4,760
7,680_
5,740-
7,700-
5,510-
2,720
-8,2009,5506,7404,120
-1,980
_4,3806,6609,050
a Backwater from ice.

YELLOWSTONE RIVER BASIN 229
2285. South Fork Little Wind River near Fort Washakle, Wyo. (Published as "Little Wind River" 1923-40)
Location. Lat 43°00'00", long 108°56'05", In SE£ sec.l, T.I S., R.2 W., 500 ft upstream from Ray Canal, 2$ miles west of Fort Washakle, and 3.4 miles up stream from North Fork.
Drainage area. 118 sq ml.
Gage.--RecordIng. At datum 1.30 ft higher prior to Oct. 1, 1926. Altitude of gage Is 5,720 ft (from topographic map).
Stage-discharge relation. Defined by current-meter measurements below 1,100 cfs.
Remarks.--Flow regulated by Washakle Reservoir (capacity, 7,800 acre-ft). Nat ural flow of stream affected by transbasln diversions from North Fork and diversions for Irrigation above station. Diversions and regulation materi ally affect peak flows. Only annual peaks are shown.
Peak stages and discharges
Water year
19211922192319241925
19261927192819291930
Date
June 12, 1921June 22, 1922June 13, 1923June 16, 1924July 1, 1925
July 9, 1926June 28, 1927May 28, 1928June 17, 1929Aug. 14, 1930
Gage height (feet)
5.84.154.254.43.35
7.595.54.944.504.76
Discharge (cfs)
2,2SO1,33O1,4201,500
908
5,2201,6701,3301,0801,220
Water year
19311932193319341935
19361937193819391940
Date
June 8, 1931May 22, 1932June 14, 1933May 8, 1934June 14, 1935
June 1, 1936June 21, 1937June 10, 1938May 31, 1939July 2, 1940
Gage height (feet)
3.944.145.58-
4.46
3.904.523.603.363.66
lischarge (cfs)
7851.06O2,080
4801,310
9301,340
706575742
2290. North Fork Little Wind River at Fort Washakle, Wyo.
Location. Lat 43°00'40", long 108°53'10", In SE^SW^ sec.33, T.I N., R.I W., a quarter of a mile upstream from South Fork and half a mile north of Fort Washakle.
Drainage area. 127 sq ml.
Gage.--RecordIng. Altitude of gage is 5,540 ft (from topographic map).
Stage-discharge relation. Defined by current-meter measurements below 1,100 cfs and extended above by logarithmic plotting.
Remarks. Natural flow of stream affected by diversions for Irrigation of about 1,000 acres and by transbasln diversions above station to Pevah Creek (trib utary to Sage Creek) and South Fork. Diversions materially affect peak flows. Only annual peaks are shown.
Peak stages and discharges
Water year
19211922192319241925
19261927192819291930
Date
June 6, 1921June 22, 1922June 13, 1923June 16, 1924May 31, 1925
July 9, 1926June 28, 1927May 28, 1928June 17, 1929Aug. 14, 1930
Gage height (feet)
4.12.853.704.022.62
4.853.683.593.003.23
Discharge (cfs)
2,O301.08O1,8501,960
878
2,6401,3701,300
8901,040
Water year
19311932193319341935
19361937193819391940
Date
June 8, 1931May 22, 1932June 14, 1933May 8, 1934June 14, 1935
June 1, 1936June 18, 1937May 29, 1938May 31, 1939May 29, 1940
Gage height (feet)
2.70-
3.782.124.78
2.773.332.842.421.92
lischarge (cfs)
710a8201,350
4102,380
7321,190
890598328
a Maximum daily discharge.
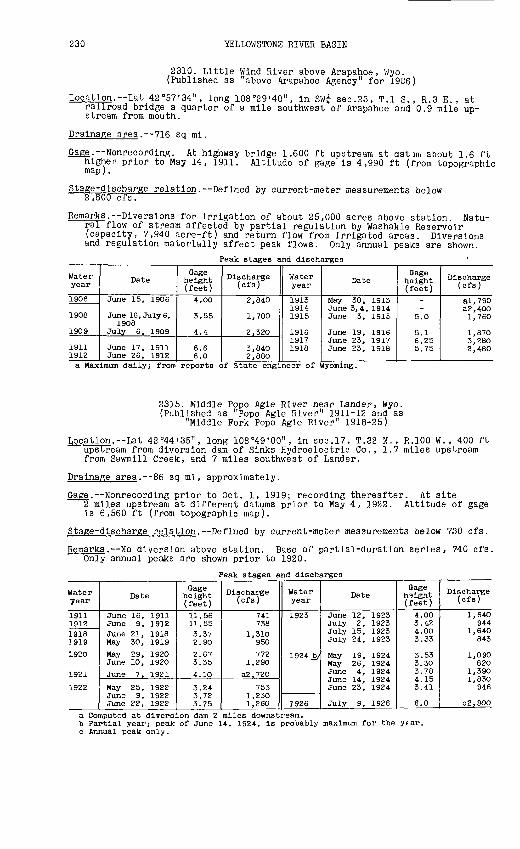
230 YELLOWSTONE RIVER BASIN
2310. Little Wind River above Arapahoe, Wyo. (Published as "above Arapahoe Agency" for 1906)
Location. Lat 42°57'34", long 108°29'40", in SW^ sec.23, T.I S., R.3 E., at railroad bridge a quarter of a mile southwest of Arapahoe and 0.9 mile up stream from mouth.
Drainage area.--716 sq mi.
G§£e.--Nonrecording. At highway bridge 1,600 ft upstream at datim about 1.6 ft higher prior to May 14, 1911. Altitude of gage is 4,990 ft (from topographic map).
Stage-discharge relation. Defined by current-meter measurements below 2,800 cfs.
Remarks.--Diversions for irrigation of about 25,000 acres above station. Natu ral flow of stream affected by partial regulation by Washakie Reservoir (capacity, 7,940 acre-ft) and return flow from irrigated areas. Diversions and regulation materially affect peak flows. Only annual peaks are shown.
Peak stages and discharges
Water year
1906
1908
1909
1911 1912
Date
June 15, 1906
June 16, July 6, 1908
July 6, 1909
June 17, 1911 June 26, 1912
Gage height (feet)4.00
3.55
4.4
6.6 6.0
Discharge (cfs)
2,840
1,700
2,320
3,840 2,880
Water year
1913 1914 1915
1916 1917 1918
Date
May 30, 1913 June 3,4, 1914 June 3, 1915
June 19, 1916 June 23, 1917 June 23, 1918
Gage height (feet)
5.0
5.1 6.25 5.75
Discharge (cfs)
al,790 a2 , 400 1,760
1,870 3,280 2,480
a Maximum daily; from reports of State engineer of Wyoming.
2315. Middle Popo Agie River near Lander, Wyo. (Published as "Popo Agie River" 1911-12 and as
"Middle Fork Popo Agie River" 1918-25)
Location. Lat 42°44'35", long 108°49'00", in sec.17, T.32 N., R.100 W. , 400 ft upstream from diversion dam of Sinks Hydroelectric Co., 1.7 miles upstream from Sawmill Creek, and 7 miles southwest of Lander.
Drainage area.--86 sq mi, approximately.
Gage. Nonrecording prior to Oct. 1, 1919; recording thereafter. At site2 miles upstream at different daturas prior to May 4, 1922. Altitude of gage is 6,560 ft (from topographic map).
Stage-discharge relation. Defined by current-meter measurements below 730 cfs.
Remarks. No diversion above station. Base of partial-duration series, Only annual peaks are shown prior to 1920.
Peak stages and discharges
740 cfs.
Water year
19111912191819191920
1921
1922
Date
June 16, 1911June 9, 1912June 21, 1918May 30, 1919May 29, 1920June 10, 1920June 7, 1921
May 25, 1922
June 22, 1922
Gage height (feet)11.5611.55
3.372.90
2.673.35
4.10
3.24
3.75
Discharge (cfs)
741738
1,310950
7721,290
a2 , 720
753
1,260
Water year
1923
1924 b/
1926
Date
June 12, 1923July 2, 1923
May 19, 1924May 26, 1924June 4, 1924
June 23, 1924
July 9, 1926
Gage h3ight (feet)
4.003.42
3.533.303.78
3.41
6.0
Discharge (cfs)
1,640944
1,090820
1,390
946
02,900
a Computed at diversion dam 2 miles downstream.b Partial year; peak of June 14, 1924, is probably maximum for the year.c Annual peak only.

YELLOWSTONE RIVER BASIN 231
2320. North Popo Agie River near Milford, Wyo.
Location.--Lat 42°51'50", long 108°54'25", in SW^NE^ sec.3, T.33 N., R.101 W., on right bank at Pine Bar Ranch, 2^ miles dovmstream from Paradise Creek, 6-J- miles southwest of Milford, and 8| miles northwest of Lander.
Drainage area. 98.4 sq mi.
Gage.--Recording. At datum 2.0 ft higher prior to Oct. 1, 1946. Altitude of gage is 6,190 ft (from topographic map).
Stage-discharge relation. Defined by current-meter measurements below 1,700 cfs and extended above on basis of slope-area measurement at 4,500 cfs.
Remarks. Two small diversions above station for irrigation of hay meadows do not materially affect peak flows. Base of partial-duration series, fOO cfs.
Peak stages and discharges
Water year
1946
1947
1948
1949
1950
1951
1952
Date
June 5, 1946
May 11, 1947June 9, 1947June 20, 1947July 4, 1947
May 20, 1948May 26, 1948May 29, 1948June 3, 1948June 9, 1948
May 16, 1949May 30, 1949June 13, 1949June 19, 1949July 4, 1949
June 6, 1950June 25, 1950July 2, 1950July 11, 1950
May 28, 1951June 17, 1951July 5, 1951
May 4, 1952
Gage height (feet)
4.52
5.426.336.735.75
4.844.394.835.224.71
4.304.255.526.674.23
4.975.975.624.74
5.375.664.32
4.40
Discharge (cfs)
628
8641,2401,420
997
759607756903714
650635
1,0901,600
629
8041,2401,100
851
9631,150
656
680
Water year
1952
1953
1954
1955
1956
1957
195S
1959
1960
1961
1962
1963
Date
June 7, 1952June 24, 1952
June 13, 1953
May 26, 1954June 27, 1954
June 14, 1955
June 5, 1956
June 6, 1957June 30, 1957
May 26, 1958
June 16, 1959
June 4, 1960
May 30, 1961
June 21, 1962
June 5, 1963June 16, 1963
Gage height (feet)
6.594.27
6.33
5.325.19
4.25
5.92
6.456.33
5.70
5.05
3.54
4.71
-
-9.44
Tlscharge (cfs)
2,060641
1,810
1,0701,000
675
1,460
1.9SO1,900
1,380
960
520
778
a900
a9004,500
a Estimated.
2325. North Popo Agie River near Lander, Wyo. (Published as "North Fork Popo Agie River" 1938-43)
Location. Lat 42°52'59", long 108°47'16", in SE^SW^ sec.17, T.2 S., R.I E., 120 ft downstream from bridge on U.S. Highway 287, 4-| miles northwest of post office in Lander, and 7 miles upstream from mouth.
Drainage area. 134 sq mi.
Gage.--Nonrecordlng prior to Sept. 22, 1938; recording thereafter. Datum of gage is 5,498.08 ft above mean sea level, datum of 1929.
Stage-discharge relation. Defined by current-meter measurements below 1,600 cfs.
Remarks. Diversions above station for irrigation of about 3,000 acres do not materially affect peak flows. Base for partial-duration series, 500 cfs.
Peak stages and discharges
Water year
1938
1939
1940 a An
Date
June 7, 1938
June 1, 1939
May 28, 1940 uial peak only.
Gage height (feet)
3.47
3.12
3.20
Discharge (efs)
a662
460
470
Water year
1941
Date
May 13, 1941 May IS, 1941 May 27, 1941 June 10, 1941 June 18, 1941
Gage height (feet)
3.83 3.4S 3.94 3.59 4.05
liseharge (efs)
744 520 832 584 920

232 YELLOWSTONE RIVER BASIN
Peak stages and discharges of North Popo Agle River near Lander, Wyo. Continued
Water year
1942
1943
1944
1945
1946
1947
Date
May 27, 1942June 8, 1942June 16, 1942
May 30, 1943June 12, 1943June 26, 1943
May 17, 1944May 23, 1944June 1, 1944June 17, 1944June 27, 1944July 2, 1944
June 13, 1945June 24, 1945July 11, 1945
June 6, 1946June 10, 1946June 18, 1946
May 11, 1947June 9, 1947June 20, 1947July 4, 1947
Gage height (feet)
4.434.393.63
4.193.854.66
3.954.494.824.104.513.92
3.524.684.12
3.943.733.60
4.014.415.184.25
Discharge (cfs)
1,1701,140
630
989772
1,340
8241,1901,390
8641,230
838
5801,380
961
831694610
8371,1301,7801,010
Water year
1948
1949
1950
1951
1952
1953
Date
May 20, 1948May 29, 1948June 3, 1948June 9, 1948
May 16, 1949May 30, 1949June 13, 1949June 19, 1949
June 2, 1950June 7, 1950June 25, 1950July 2, 1950July 11, 1950
May 29, 1951June 17, 1951July 5, 1951
May 4, 1952June 8, 1952June 27, 1952
June 14, 1953
Gage height (feet)
3.823.753.923.61
3.643.514.155.22
3.543.914.794.483.97
4.784.693.58
3.775.393.52
5.54
Discharge (cfs)
713670778590
594525925
1,820
540714
1,3801,120
750
1,4201,340
565
6651,830
540
1,900
2330. Little Popo Agie River near Lander, Wyo.
Location. Lat 42°43'00", long 108°38'34", in NE^SE^ sec.27, T.3£ N., R.99 W., on left bank 700 ft downstream from bridge on State Highway 2F, 2^ miles downstream from Red Canyon Creek, and 9f miles southeast of pest office in Lander.
Drainage area. 125 sq mi.
Gage. Recording. Datum of gage is 5,436.49 ft above mean sea level, datum of 1929.
Stage-discharge relation. Defined by current-meter measurements below 2,100 cfs.
Remarks. Diversions for irrigation of about 600 acres above station andslight regulation by Christina Lake (capacity, 3,860 acre-ft). Diversions and regulation do not materially affect peak flows. Base for partial- duration series, 350 cfs.
Peak stages and discharges
Water year
1946
1947
1948
1949
1950
1951
1952
Date
June 6, 1946
May 11, 1947June 9, 1947June 21, 1947
June 3, 1948
May 16, 1949May 30, 1949June 13, 1949June 19, 1949
May 24, 1950June 2, 1950June 7, 1950June 17, 1950June 23, 1950
May 29, 1951June 18, 1951
May 4, 1952
Gage height (feet)
4.21
4.365.375.80
4.79
4.604.574.924.95
4.304.584.895.405.05
4.624.51
4.16
Discharge (cfs)
344
421767922
493
402391507518
373500638920760
591553
450
Water year
1952
1953
1954
1955
1956
1957
1958
1959
Date
May 16, 1952June 7, 1952June 24, 1952
June 14, 1953
May 22, 1954June 27, 1954July 14, 1954July 16, 1954
Feb. 10, 1955June 14, 1955
Dec. 16, 1955May 29, 1956
June 7, 1957June 30, 1957
May 26, 1958
Feb. 10, 1959
Gage height (feet)
3.805.833.63
4.87
4.593.764.324.12
S3. 943.23
£4.884.56
5.084.54
4.67
f.4.30
Discharge (cfs)
3541,160
425
780
682390587512
-234
-671
870688
734
-
a Backwater from Ice.
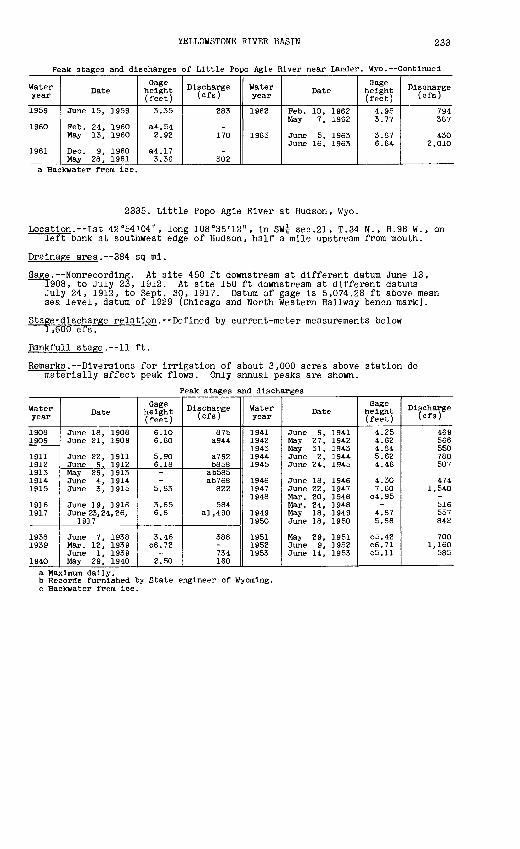
YELLOWSTONE RIVER BASIN 233
Peak stages and discharges of Little Popo Agie River near Lander, Wyo.--Continued
Water year
1959
1960
1961
Date
June 15, 1959
Feb. 24, 1960 May 13, 1960
Dec. 9, 1960 May 28, 1961
Gage height (feet)3.35
a4.54 2.92
a4.17 3.36
Discharge (ofs)
283
170
302
Water year
1962
1963
Date
Feb. 10, 1962 May 7, 1962
June 5, 1963 June 16, 1963
Gage height (feet)
4.95 3.77
3.87 6.64
Discharge (cfs)
794 387
430 2,010
a Backwater from ice.
2335. Little Popo Agie River at Hudson, Wyo.
Location.--Lat 42°54'04", long 108°35'12", in SW£ sec.21, T.34 N., R.98 W., on left bank at southwest edge of Hudson, half a mile upstream from mouth.
Drainage area. 384 sq mi.
Gage. Nonrecording. At site 450 ft downstream at different datum June 13, 1908, to July 23, 1912. At site 150 ft downstream at different datuns July 24, 1912, to Sept. 30, 1917. Datum of gage is 5,074.28 ft above mean sea level, datum of 1929 (Chicago and North Western Railway bench mark).
Stage-discharge relation. Defined by current-meter measurements below 1,600 cfs.
Bankfull stage. 11 ft.
Remarks. Diversions for irrigation of about 3,000 acres above station do materially affect peak flows. Only annual peaks are shown.
Peak stages and discharges
Water year
1908 1909
1911 1912 1913 1914 1915
1916 1917
1938 1939
1940
Date
June 18, 1908 June 21, 1909
June 22, 1911 June 9, 1912May 29, 1913 June 4, 1914 June 3, 1915
June 19, 1916 June 23, 24, 2 6,
1917
June 7, 1938 Mar. 12, 1939 June 1, 1939 May 29, 1940
Gage height (feet)
6.10 6.60
5.90 6.18
5.83
3.65 6.6
3.46 C6.72
2.50
Discharge (ofs)
875 a944
a792 b858ab585 ab768
822
584 al,490
388
734 160
Water year
1941 1942 1943 1944 1945
1946 1947 1948
1949 1950
1951 1952 1953
Date
June 9, 1941 May 27, 1942 May 31, 1943 June 2, 1944 June 24, 1945
June 18, 1946 June 22, 1947 Mar. 20, 1948 Mar. 24, 1948 May 18, 1949 June 18, 1950
May 29, 1951 June 9, 1952 June 14, 1953
Gage height (feet)
4.25 4.62 4.84 5.62 4.46
4.30 7.60
C4.95
4.87 5.86
cS.42 C6.71 c5.ll
Discharge (cfs)
469 566 550 780 507
474 1,540
516 557 842
700 1,160
585
a Maximum daily.b Records furnished by State engineer of Wyoming.c Backwater from ice.

234 YELLOWSTONE RIVER BASIN
2340. Little Wind River below Arapahoe, Wyo. (Published as "below Arapahoe Agency" 1906 and as
"Popo Agie River" 1910, 1916-18)
Location. Lat 42°57'20", long 108°29'15", in SE£ sec.23, T.I S., R.3 E., 25 ft downstream from former site of timber bridge, 600 ft downstream from Popo Agie River, and half a mile south of Arapahoe.
Drainage area.--1.530 sq mi, approximately.
Gage. Nonrecording. At datum 0.17 ft lower Mar. 15, 1908, to Nov. 27, 1909. Altitude of gage is 4,990 ft (from topographic map).
Stage-discharge relation. Defined by current-meter measurements below 7,000 cfs.
Bankfull stage. 8 ft.
Remarks. Diversions above station for irrigation of about 47,000 acres materi ally affect peak flows. Only annual peaks are shown.
Peak stages and discharges
Water year
1906
1908 1909
1911 1912
Date
June 14, 1906
June 15, 1908 June 6, 1909
June 17, 1911 June 9, 1912
Gage height (feet)
7.5
5.8 7.15
8.6 7.6
Discharge (cfs)
6,950
4,460 6,310
9,660 6,780
Water year
1915
1916 1917 1918
Date
June 2, 1915
June 19, 1916 June 24, 1917 June 22, 1918
Page height (feet)
5.95
6.2 9.3 6.7
Discharge (cfs)
4,040
4,400 11,500 5,340
2355. Little Wind River near Riverton, Wyo. (Published as "Popo Agie River" prior to October 1958)
Location. Lat 42°59'51", long 108°22'29", in N|NW£ sec.11, T.I S. , R.4 E., on right bank if miles upstream from mouth and 1.9 miles southeast of Riverton.
Drainage area. 1,851 sq mi.
Gage. Recording. At site 600 ft downstream prior to Sept. 19, 1956. Datum of gage is 4,901.84 ft above mean sea level, datum of 1929.
Stage-discharge relation. Defined by current-meter measurements below 13,000 cfs.
Remarks. Diversions for irrigation of about 43,000 acres above station materi- ally affect peak flows. Base for partial-duration series, 3,200 cfs. Only annual peaks are shown prior to 1948.
Peak stages and discharges
Water year
19411942194319441945
19461947
1948
1949
1950
1951
1952
1953
Date
June 8, 1941May 27, 1942June 22, 1943June 2, 1944June 25, 1945
June 6, 1946June 22, 1947
June 3, 1948
June 13, 1949June 20, 1949
June 8, 1950June 23, 1950July 3, 1950
May 29, 1951June 17, 1951
June 8, 1952
June 15, 1953
Gage height (feet)
5.665.766.096.876.27
5.13S.57
5.26
6.006.33
5.476.125.74
6.305.92
7.69
6.49
Discharge (cfs)
3,7104,1204,7106,1505,190
3,1609,820
3,380
4,5305,160
3,5804,7604,050
5,1004,380
7,520
5,360
Water year
1954
1955
1956
1957
1958
1959
1960
1961
1962
1963
Date
May 22, 1954June 28, 1954
June 13, 1955
June 6, 1956
May 15, 1957June 8, 1957July 1, 1957
May 26, 1958
June 16, 1959
June 11, 1960
June 2, 1961
Feb. 11, 1962June 15, 1962
June 3, 1963June 17, 1963
Gage height (feet)
5.555.32
4.41
6.53
6.318.597.81
7.82
6.15
4.15
6.04
10.136.68
6.3510.85
Discharge (cfs)
3,9203,470
2,080
5,430
3,3207,4105,890
6,160
3,140
1,170
3,330
10,3003,820
3,27014,700

YELLOWSTONE RIVER BASIN 235
2390. Muskrat Creek near Shoshoni, Wyo.
Location. Lat 43°08'55", long 108°09'30", in NW^SW^ sec.15, T.2 N. , R.6 E. , on right bank 2 miles upstream from mouth and 7 miles southwest of Shoshoni.
Drainage area. 733 sq mi.
Gage.--Recording. Altitude of gage is 4,770 ft (from topographic map).
Stage-discharge relation. Defined by current-meter measurements below 2,600 cfs and extended above on basis of slope-area measurement at 13,300 cfs.
Remarks. Diversion for irrigation of about 230 acres above station. Some small reservoirs for sediment control and flood detention above station. Diversions and reservoirs do not materially affect peak flows. Base for partial- duration series, 100 cfs.
Peak stages and discharges
Water year
1923
1951
1952
1953
1954
1955
1956
1957
Date
July 24, 1923
July 22, 1951
June 24, 1952
May 28, 1953
-
June 17, 1955July 11, 1955July 23, 1955July 24, 1955
Dec. 23, 1955May 25, 1956May 29, 1956
Apr. 23, 1957May 13, 1957May 25, 1957
Gage height (feet)
-
3.82
2.20
2.72
-
3.192.583.374.90
2.522.703.22
2.72-
2.50
Discharge (cfs)
a6,400
3,100
20
b3
0
629147844
3,600
123748
1,450
408270245
Water year
1957
1958
1960
1961
1962
1963
Date
May 30, 1957May 31, 1957June 1, 1957June 11, 1957
June 24, 1958Aug. 23, 1958
July 5, 1960
June 2, 1961
Feb. 10, 1962July 31, 1962Sept. 21, 1962
June 1, 1963June 16, 1963Aug. 11, 1963Aug. 31, 1963Sept. 21, 1963
Gage height (feet)
2.572.472.342.76
2.382.81
2.98
4.02
6.441.00.93
1.221.721.851.441.39
D'scharge (cfs)
290228136444
180490
412
1,800
13,300132109
212645720292132
a Annual peak only, from slope-area measurement, b Estimated.
2445. Fivemile Creek above Wyoming Canal, near Pavillion, Wyo,
Location. Lat 43°18'04", long 108°42'04", in NW^NE^ sec.25, T.4 N., R.I E., on right bank 1,400 ft upstream from Wyoming Canal siphon and 4 miles no"th of Pavillion.
Drainage area. 118 sq mi.
Gage. Recording. At site a quarter of a mile downstream at different datum prior to Mar. 29, 1950. Altitude of gage is 5,495 ft (from topographic map).
Stage-discharge relation. Defined by current-meter measurements below 350 cfs.
Remarks. Bureau of Indian Affairs has a reservoir system in headwaters which materially affects peak flows. Only annual peaks are shown.
Peak stages and discharges
Water year
1948
1950
19511952195319541955
1956
Date
Septemberl948
Sept. 20, 1950
Sept. 6, 1951Aug. 3, 1952July 29, 1953July 17, 1954Feb. 17, 1955July 22, 1955
Mar. 15, 1956May 28, 1956
Gage height (feet)
6.10
4.97
5.603.503.033.03
a2.72-
a3.l7-
Discharge (cfs)
2,600
1,450
1,750440314174-46
-87
Water year
19571958
19591960
1961
1962
1963
Date
June 30, 1957Feb. 19, 1958July 29, 1958June 15, 1959Dec. 6, 1959July 13, 1960
Dec. 13, 1960Sept. 19, 1961Mar. 3, 1962Sept. 23, 1962Sept. 8, 1963
Gage height (feet)
3.02a3.32
-3.76
a3.64-
a3.76-
a3.84-
3.20
Discharge (cfs)
138 40
372-39
-70-56
155
a Backwater from ice.

236 YELLOWSTONE RIVER BASIN
2500. Fivemile Creek near Riverton, Wyo.
Location. Lat 43°12'14", long 108°23'54", in SW^SW^ sec.27, T.3 N. , R.4 E. , on right bank 12^ miles north of Riverton and 13 miles upstream from mouth.
Drainage area.--356 sq mi, of which 224 sq mi is probably contributing.
Gage.--Nonrecording prior to Apr. 4, 1951: recording thereafter. Altitude of gage is 5,020 ft (from topographic map).
Stage-discharge relation. Defined by current-meter measurements below 1,100 cfs and extended above on basis of velocity-area study and logarithmic plotting.
Remarks.--Natural flow of stream affected by return flow from Riverton irri gation project and by the Bureau of Indian Affairs reservoir system in head waters. Return flow and regulation materially affect peak flows. Only annual peaks are shown.
Peak stages and discharges
Water year
1950
1951 1952
1953
1954
1955
1956
Date
July 25, 1950
Sept. 6, 1951 Dec. 11, 1951 Aug. 3, 1952 Dec. 10, 1952 July 29, 1953 Dec. 24, 1953 July 17, 1954 July 23, 1955
Feb. 2, 1956 May 31, 1956
Gage height (feet)
11.0
9.44 a8.35
aa.28
a7.05
10.15
a7.58
Discharge (cfs)
1.69O
1,090
645
510
327 1,440
42O
Water year
1957
1958
1960
1961
1962 1963
Date
Dec. 24, 1956 May 30, 1957 Jan. 6, 1958 June 14, 1958
Feb. 12, 1960 June 9, 1960
Feb. 12, 1961 June 2, 1961 June 15, 1962 June 15, 1963
Gage height (feet)
a7.78
a7.15
a7.48
a7.63
9.71 10.04
Discharge (cfs)
302
274
333
334 1,220 1,440
a Backwater from ice.
2515. Sand Gulch near Shoshoni, Wyo.
Location.--Lat 43°11'38", long 108°18'50", in NE^SW^ sec.32, T.c N., R.5 E. , on left bank half a mile upstream from mouth and 10f miles southwest of Shoshoni.
Drainage area.--18.6 sq mi.
Gage.--Recording. Altitude of gage is 4,910 ft (from topographic map).
Stage-discharge relation. Defined by current-meter measurement? below 110 cfs.
Remarks. Natural flow of stream affected by diversions for irrigation, return flow from irrigated areas, and waste water from Riverton project. Peak flows are materially affected. Only annual peaks are shown.
Peak stages and discharges
Water year
1949 1950
1951
Date
June 11, 1949 July 25, 1950
July 25, 1951
Gage height (feet)3.18 3.36
3.02
Discharge (cfs)
161 203
153
Water year
1952 1953
Date
July 1, 1952 Aug. 5, 1953
Gage h eight (feet)
2.81 2.72
Discharge (cfs)
121 111

YELLOWSTONE RIVER BASIN 237
2530. Pivemile Creek near Shoshoni, Wyo.
Location.--Lat 43°13'20", long 108°13'06", in NW£sw£ sec.19, T.3 N., R.6 E., on right bank lij- miles upstream from normal high-water line of Boysen Reservoir at elevation 4,725 ft and 5 miles west of Shoshoni.
Drainage area. 418 sq mi, of which 285 sq mi is probably contributing.
Gage. Nonrecording at site 1 mile downstream at different datum prior to Oct. 1, 1942; recording thereafter. Altitude of gage is 4,750 ft (from topographic map).
Stage-discharge relation.--Defined by current-meter measurements below 2,500 cfs and extended above on basis of logarithmic plotting.
Remarks. Plow is mainly return flow and waste water from Riverton irrigation project. Peak flows are materially affected. Only annual peaks are shown.
Peak stages and discharges
Water year
1923
19411942
19481949
1950
195119521953
1954
1955
Date
July 24, 1923
Aug. 7, 1941Aug. 14, 1942Sept. 12, 1942
Sept. 19, 194SJune 12, 1949Aug. 20, 1949Sept. 20, 1950
July 21, 1951Aug. 4, 1952Nov. 29, 1952July 29, 1953Dec. 23, 1953June 26, 1954Dec. 27, 1954
Gage height (feet)
-
8.03-
t>3.69
8.28-
b5.377.49
6.965.13
cS.52-
08.09-
C9.61
Discharge (cfs)
a3,500
3,200232-
2,500722-
2,570
1,910735-552-504-
Water year
1955
1956
1957
1958
1959
1960
1961
19621963
Date
July 24, 1955
Dec. 23, 1955Mar. 3, 1956Dec. 6, 1956Aug. 17, 1957Dec. 24, 1957July 30, 1958Jan. 3, 1959July 18, 1959Jan. 1, 1960June 10, 1960
Feb. 8, 1961June 2, 1961June 15, 1962Dec. 25, 1962June 15, 1963
Gage height (feet)
-
C7.50-
C6.58-
C8.85-
C6.90-
C7.60-
C6.40-
7.85C7.85
-
Discharge (cfs)
2,850
_968-780-474-576-394
-447
3,390-
2,070a Estimated by Bureau of Reclamation, b Backwater from debris. c Backwater from ice.
2560. Badwater Creek at Lybyer Ranch, near Lost Cabin, Wyo.
Location.--Lat 43°21'02", long 107°33'22", in SE^NE^ sec.18, T.39 N., R.89 W., on right bank 2,000 ft downstream from Sioux Creek, 1 mile northwest of Lybyer Ranch, and 6 miles northeast of Lost Cabin.
Drainage area. 131 sq mi.
Gage.--Recording. Datum of gage is 5,715.42 ft above mean sea level, datum of 1929.
Stage-discharge relation.--Defined by current-meter measurements below 280 cfs and extended above by float-velocity measurement at 400 cfs.
Bankfull stage.--8 ft.
Remarks.--Diversions above station for irrigation of about 350 acres do not materially affect peak flows. Base for partial-duration series, 150 cfs.
Peak stages and discharges
Water year
1949
1950
1951
1952
1953
Date
July 8, 1949July 13, 1949
May 18, 1950
Feb. 3, 1951Apr. 28, 1951
Mar. 30, 1952July 12, 1952
Aug. 16, 1953
Gage height (feet)
7.356.46
6.12
a7.166.01
a8.8S5.60
5.S7
Discharge (cfs)
445197
142
-126
-71
110
Water year
1954
1955
1956
1957
1958
Date
Jan. 25, 1954Apr. 28, 1954
Apr. 6, 1955May 7, 1955
Mar. 22, 1956May 26, 1956
May 25, 1957
June 20, 1958
Gage height (feet)
a6.875.29
a7.156.20
a6.306.20
5.54
6.15
Discharge (cfs)
-43
_154
-154
63
156a Backwater from ice.
219-848 O - 66 - 17

238 YELLOWSTONE RIVER BASIN
Peak stages and discharges of Badwater Creek at Lybyer Ranch, near Lost Cabin, Wyo. Con.
Water year
1958
1959
1960
Date
July 24, 1958 July 25, 1958
Mar. 19, 1959 May 16, 1959
Apr. 24, 1960
Gage height (feet)6.65 6.88
a6.60 5.49
5.15
Discharge (cfs)
232285
59
27
Water year
1961
1962
1963
Date
June 5, 1961
Apr. 17, 1962 June 11, 1962
Aug. 30, 1963
Gage height (feet)
5.79
7.01 7.60
6.10
Discharge (cfs)
95
324 275
149
a Backwater from ice.
2570. Badwater Creek at Bonneville, Wyo.
Location.--Lat 43°16<09", long 108°04'46", In NW^NE^ sec.14, T.J8 N. , R.94 W., on right bank 0.4 mile west of Bonneville and 3 miles upstresm from normal high-water line of Boysen Reservoir at elevation 4,725 ft.
Drainage area. £ sq ml.
Gage.--Nonrecording prior to June 27, 1947; recording thereafter. Datum of gage Is 4,774.17 ft above mean sea level, datum of 1929.
Stage-discharge relation. Poorly defined by current-meter measurements below 1,100 cfs and extended above on basis of slope-area measurement at 7,260 cfs.
Remarks.--Diversions above station for Irrigation of 800 acres do not materially affect peak flows. Only annual peaks are shown.
Peak stages and discharges
Water year
1923
1947 1948 1949
1951 1952 1953 1954 1955
Date
July 24, 1923
July 22, 1947 July 14, 1948 July 14, 1949
Sept. 7, 1951 Aug. 3, 1952 June 5, 1953 June 26, 1954 July 24, 1955
Gage height (feet)
6.27 4.97 4.50
4.36 4.05 4.21 5.52 4.21
Discharge (cfs)
18,600
4,690 1,440 1,140
641 605 750
2,550 1,080
Water year
1956 1957 1958 1959 1960
1961 1962 1963
Date
May 25, 1956 May 25, 1957 July 25, 1958 Mar. 23, 1959 July 5, 1960
June 3, 1961 June 12, 1962 June 15, 1963
Gage Tc eight (feet)
6.6 3.45 4.25 3.28 3.72
4.10 5.64 6.30
Discharge (cfs)
7,260 210
1,450 311 742
1,980 4,400 4,800
2575. Muddy Creek near Pavllllon, Wyo.
Location.--Lat 43°21'46", long 108°36'08", In NW^SWi sec.35, T.5 N., R.2 E., on left bank 600 ft upstream from Wyoming Canal siphon, 4 1/8 miles downstream from Sheep Creek,'and 9^ miles northeast of Pavillion.
Drainage area.--267 sq mi.
Gage. Recording. At site 1 1/8 miles upstream at different datum prior to Oct. 16, 1956. Altitude of gage is 5,350 ft (from topographic map).
Stage-discharge relation. Defined by current-meter measurements below 720 cfs and extended above on basis of float-velocity measurement at 1,020 cfs and slope-area measurement at 2,300 cfs.
Remarks. Diversions above station for irrigation of about 3,900 acres and some small reservoirs for sediment control and flood detention above station. Di versions and reservoirs do not materially affect peak flows. Base for partial-duration series, 1,000 cfs.

YELLOWSTONE RIVER BASIN 239
Peak stages and discharges of Muddy Creek near Pay1111on, Wyo.
Water year
1949 a/
1950
1951
1952
1953
1955
1956
Date
June 5, 1949 July 11, 1949 July 12, 1949
July 4, 1950
July 21, 1951
Mar. 23, 1952 Aug. 4, 1952
July 19, 1953
Aug. 7, 1955
May 29,, 1956^
Gage height (feet)
9.70 7.80 7.70
6.70
8.45
b8.13 6.21
7.15
7.31
6.96
Discharge (cfs)
2,300 1,200 1,060
1,200
1,620
638
995
1,060
919
Water year
1957
1958
1960
1961
1962
1963
Date
June 30, 1957
Feb. 17, 1958 July 21, 1958
Mar. 11, 1960 June 9, 1960
Sept. 19, 1961
Mar. 10, 1962 Sept. 22, 1962
Sept. 1, 1963
Gage height (feet)
3.50
b4.63 4.30
b3.07 2.79
3.62
b2.81 2.62
6.96
Ilscharge (cfs)
340
600
163
421
159
1,840
a Partial year.b Backwater from ice.
2580. Muddy Creek near Shoshoni , Wyo.
Location. Lat 43°17'10", long 108°16'30", in NE^NW^ sec.34, T.4 N., R.5 E., on left bank 2^ miles upstream from normal high-water line of Boysen Ressrvoir at elevation 4,725 ft and 9 miles northwest of Shoshoni.
Drainage area.--332 sq mi.
Gage.--Recording. At different datum prior to May 13, 1949. Altitude of gage is 4,780 ft (from topographic map).
Stage-discharge relation. Defined by current-meter measurements below 910 cfs and extended above on basis of slope-area measurement at 1,430 cfs.
Remarks. Bureau of Indian Affairs has a reservoir system In the headwaters. Plow regulated by operation of Wyoming Canal spillway. Extent of effect on peak flows not known. Base for partial-duration series, 500 cfs.
Peak stages and discharges
Water year
1923
1949 b/
1950
1951
1952
1953
1954
1955
Date
July 24, 1923
June 6, 1949July 12, 1949July 13, 1949
July 5, 1950Sept. 10, 1950
July 22, 1951
Oct. 4, 1951Aug. 5, 1952
July 20, 1953
May 11, 1954
July 24, 1955Aug. 8, 1955
Cage height (feet)
-
7.607.796.58
7.546.40
7.50
6.075.72
5.56
5.01
7.105.31
Discharge (cfs)
al6,300
1,1401,220
753
1,100720
1,430
730510
530
318
1,320530
Water year
1956
1957
1958
1959
1960
1961
1962
1963
Date
May 30, 1956
June 11, 1957
Feb. 20, 1958July 22, 1958
Feb. 26, 1959June 30, 1959
Mar. 21, 1960June 10, 1960
Feb. 20, 1961Sept. 19, 1961
Feb. 15, 1962June 15, 1962
June 15, 1963
Gage height (feet)
6.78
4.32
C5.654.62
C5.754.20
C5.895.01
06.944.50
06.486.37
7.10
Discharge (ofs)
1,040
194
-230
-131
-332
-214
_785
1,410a Annual peak only, from slope-area measurement.b Partial year.c Backwater from Ice.

240 YELLOWSTONE RIVER BASIN
2595. Bighorn River at Thermopolis, Wyo. (Published as "near Thermopolis" prior to 1911)
Location. Lat 43°39', long 108°12', in sec.36, T.43 N., R.95 W., on left bank 200 ft downstream from Park Street Bridge at Thermopolis and a quarter of a mile downstream from Thermopolis Creek.
Drainage area. 8,020 sq mi.
Gage. Nonrecording prior to Oct. 25, 1934, and from Oct. 1, 1950, to Apr. 30, 1952; recording otherwise. At several sites within 350 ft of present site at various daturas prior to Oct. 25, 1934. At site half a mile downstream at datum 3.69 ft lower Oct. 25, 1934, to Sept. 30, 1936, and at datum 4.69 ft lower Oct. 1, 1936, to Sept. 30, 1950. At site a quarter of a mile upstream at datum 2.89 ft higher Oct. 1, 1950, to Apr. 30, 1952. Datum of gage is 4,305.18 ft above mean sea level, datum of 1929, supplementary adjustment of
Stage-discharge relation.--Defined by current-meter measurements below 18,000 cfs.
Remarks.--Diversions for irrigation of about 141,000 acres above station have substantial effect on peak flows. Flow completely regulated by Boysen Reser voir beginning Oct. 11, 1951. Only annual peaks are shown.
Peak stages and discharges
Water year
1900_§/
19011902190319041905
19111912191319141915
19161917191S19191920
19211922192319241925
1926192719281929
Date
June 8, 1900
May 21, 1901June 12, 1902June 19, 1903June 22, 1904June 7, 1905
June 19, 1911June 11, 1912May 21, 1913June 5, 1914June 3, 1915
June 21, 1916June 24, 1917June 17, 1918June 1, 1919June 12, 1920
June 10, 1921June 11, 1922July 24, 1923Apr. 6, 1924July 5, 1925
July 11, 1926June 30, 1927May 29, 1928Mar. 11, 1929
Gage height (feet)
6. SO
8.205.06.608.006.70
_10.3
--
7.8
9.2513.413.34.79.7
13.4S.2
16.211.07.3
7.259.79.99.25
Discharge (cfs)
14,500
17,9009,8909,920
14,50011,600
b!8,00019,50015,300
013,30011,300
13,00019,40019,2005,00013,800
20,70012 , 10029,80017,30010,000
10,20014,80015,20014,000
Water year
1930
19311932193319341935
19361937193819391940
19411942194319441945
19461947194S19491950
195119521953
Date
Aug. 16, 1930
June 9, 1931June 26, 1932June 15, 1933July 25, 1934June 16, 1935
June 5, 1936July 12, 1937June 24, 1938June 2, 1939Sept. 30, 1940
Aug. 11, 1941May 28, 1942June 29, 1943June 28, 1944June 23, 1945
June 19, 1946June 23, 1947June 4, 1948June 14, 1949June 24, July 5 ,
1950
June 19, 1951June 11, 1952July 30, 1953
Gage height (feet)
9.41
6.518.169.884.8011.75
7.9811.77.689.088.02
9.719.48
10.1110.559.84
7.8112.658.328.689.43
8.024.074.06
Discharge (cfs)
14,500
8,70011,30015,5004,73018,700
10,50015,4007,7109,9407,440
10,4009,760
11,00011,90012,200
7,96017,2008,7308,9609,460
11,8004,3504,330
a Partial year. t> Maximum dally, c Estimated.
2600. South Fork Owl Creek near Anchor, Wyo.
Location. Lat 43°40', long 108°52', in sec.28, T.43 N. , R.100 W., on left bank 1 mile upstream from Middle Fork, 2| miles upstream from Anchor Dam, 3 miles south of Anchor, and 33 miles west of Thermopolis.
Drainage area.--86.3 sq ml.
Gage.--Nonrecording prior to June 1, 1932; recording thereafter. At datum 1.00 ft higher prior to Sept. 30, 1943. Datum of gage is 6,£04.47 ft above mean sea level, datum of 1929.
Stage-discharge relation. Defined by current-meter measurements below 330 cfs.
Bankfull stage. 6? ft.
Remarks.--Base for partial-duration series, 250 cfs.
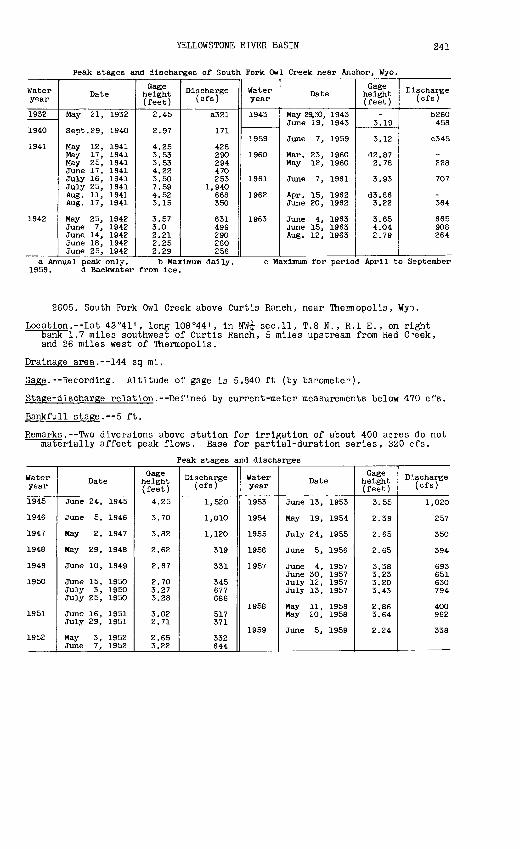
YELLOWSTONE RIVER BASIN 241
Peak stages and discharges of South Fork Owl Creek near Anchor, Wyo.
Water year
1932
1940
1941
1942
Date
May 21, 1932
Sept. 29, 1940
May 12, 1941May 17, 1941May 25, 1941June 17, 1941July 16, 1941July 25, 1941Aug. 11, 1941Aug. 17, 1941
May 25, 1942June 7, 1942June 14, 1942June 18, 1942June 25, 1942
Gage height (feet)
2.45
2.97
4.253.533.534.223.507.594.523.15
3.573.02.212.252.29
Discharge (cfs)
a321
171
428290294470253
1,940668350
631499290280256
Water year
1943
1959
1960
1961
1962
1963
Date
May 29,50, 1943June 19, 1943
June 7, 1959
Mar. 23, 1960May 12, 1960
June 7, 1961
Apr. 15, 1962June 20, 1962
June 4, 1963June 15, 1963Aug. 12, 1963
Gage height (feet)
-3.19
3.12
d2.872.78
3.93
d3.863.22
3.654.042.79
I ischarge (cfs)
b260458
c345
-228
707
-364
665908264
a Annual peak only. b Maximum dally. c Maximum" for period April to September 1959. d Backwater from Ice.
2605. South Fork Owl Creek above Curtis Ranch, near Theimopolis, Wyo.
Location. Lat 43°41', long 108°44', in NW^ sec.11, T.8 N., R.I E., on right bank 1.7 miles southwest of Curtis Ranch, 5 miles upstream from Red C^eek, and 26 miles west of Thermopolis.
Drainage area. 144 sq mi.
Gage. Recording. Altitude of gage is 5,840 ft (by barometer).
Stage-discharge relation. Defined by current-meter measurements below 470 cfs.
Bankfull stage.--5 ft.
Remarks. Two diversions above station for irrigation of about 400 acres do not materially affect peak flows. Base for partial-duration series, 320 cfs.
Peak stages and discharges
Water year
1945
1946
1947
1948
1949
1950
1951
1952
Date
June 24, 1945
June 5, 1946
May 2, 1947
May 29, 1948
June 10, 1949
June 15, 1950July 3, 1950July 25, 1950
June 16, 1951July 29, 1951
May 3, 1952June 7, 1952
Gage height (feet)
4.25
3.70
3.82
2.62
2.67
2.703.273.28
3.022.71
2.653.22
Discharge (cfs)
1,520
1,O10
1,120
319
331
345677686
517371
332644
Water year
1953
1954
1955
1956
1957
1958
1959
Date
June 13, 1953
May 19, 1954
July 24, 1955
June 5, 1956
June 4, 1957June 30, 1957July 12, 1957July 13, 1957
May 11, 1958May 20, 1958
June 5, 1959
Gage height (feet)
3.55
2.39
2.65
2.65
3.383.233.203.43
2.863.64
2.24
Discharge (cfs)
1,020
257
350
394
693651630794
400962
338

242 YELLOWSTONE RIVER BASIN
2610. South Fork Owl Creek at Curtis Ranch, near Thermopolis, Wyo.
Location. Lat 43°43', long 108°42', in sec.11, T.43 N., R.99 W., 6th Principal Meridian, at Curtis Ranch, 300 ft downstream from County highway bridge and 25 miles west of Thermopolis.
Drainage area. 149 sq mi.
Gage. Nonrecording prior to July 12, 1940; recording thereafter. At site 300 ft upstream at different datum prior to Sept. 30, 1932. Altitude of gage is 5,700 ft (estimated from nearby level line).
Stage-discharge relation. Defined by current-meter measurement? below 270 cfs.
Bankfull stage.--6 ft.
Remarks.--Diversions above station for irrigation of about 1,000 acres materi- ally affect peak flows. Only annual peaks are shown.
Peak stages and discharges
Water year
1932
1938 1939 1940
Date
May 22, 1932
May 27, 1938 May 30, 1939 June 14, 1940
Gage height (feet)
2.42
3.88 3.21 3.50
Discharge (cfs)
618
202 110 132
Water year
1941 1942 1943
Date
Aug. 11, 1941 May 26, 1942 June 23, 1943
Gage I eight (feet)
6.16 5.79 5.54
Discharge (cfs)
1,070 760 472
2620. North Pork Owl Creek near Anchor, Wyo.
Location.--Lat 43°42'., long 108°55', in sec.12, T.43 N. , R.101 W., on left bank half a mile upstream from Cup Creek and 4f miles west of Anchor.
Drainage area.--54.8 sq mi.
Gage. Recording. Aug. 29, 1948.
At site half a mile downstream at different datum prior to Altitude of gage is 6,720 ft (by barometer).
Stage-discharge relation. Defined by current-meter measurements below 390 cfs and extended above on basis of slope-area measurement at 3,200 cfs. Defined by current-meter measurements below 280 cfs at previous site.
Remarks.--Diversion above station for irrigation of hay meadow does not materi ally affect peak flows. Base for partial-duration series, 165 cfs.
Peak stages and discharges
Water year
19411942
1943
1944
1945
1947
1948
1949
1950
19511952
Date
Aug. 10, 1941May 9, 1942May 25, 1942June 4, 1942June 7, 1942
May 27, 1943
May 15, 1944May 28, 1944June 11, 1944Apr. 21, 1945June 7, 1945June 24, 1945
May 2, 1947
June 22, 1948
June 7, 1949
July 3, 1950July 24, 1950May 22, 1951Apr. 27, 1952May 28, 1952
Gage height (feet)
4.483.664.503.483.28
2.86
3.702.843.582.573.153.42
3.10
3.22
2.45
3.784.433.423.953.41
Discharge (cfs)
a940337
1,080445360
167
308230466
180268349
274
-
165
43071287
354181
Water year
19521953
1954
1955
1956
1957
1958
1959
1960
1961
1962
Date
May 31, 1952May 28, 1953June 11, 1953Aug. 15, 1953
July 19, 1954
July 23, 1955
May 28, 1956Aug. 17, 1956June 2, 1957July 13, 1957
May 19, 1958June 24, 1958July 29, 1958
June 6, 1959
June 11, 1960
June 2, 1961
Apr. 20, 1962June 1, 1962June 15, 1962
Gage height (feet)
3.463.933.683.55
3.49
8.0
4.844.86
5.537.29
6.906.437.42
5.56
5.67
6.41
6.225.925.83
Discharge (cfs)
196367264197
156
3,200
226277
9282,340
410262619
112
60
198
276192170
a. Maximum during period May to September- Note^.--Only annual peaks listed for 1941
fragmentary and other peaks above base may
1941.1943, 1947, and 1948; gage-height record
have occurred during periods of no record.

YELLOWSTONE RIVER BASIN 243
Location.--Lat 43°41< at MeCumber Ranch, of Thermopolis.
2640. Owl Creek near Thermopolis, Wyo.
long 108°18', In sec.19, T.43 N. , R.95 W., on right bank if miles downstream from Mud Creek and 6 miles northwest
Drainage area. 478 sq ml.
Gage.--Nonrecordlng prior to Oct. 10, 1938; recording thereafter. At site a quarter of a mile upstream at different datum prior to Apr. 7, 1914. At various sites within 50 ft of present site at various datums Apr. 8, 1914, to Nov. 30, 1917. Altitude of gage Is 4,560 ft (by barometer).
Stage-discharge relation.--Defined by current-meter measurements below 1,900 cfs and extended above on basis of contracted-opening measurement at 7,030 cfs.
Bankfull stage.--6 ft.
Remarks. Diversions above station for Irrigation of about 14,000 acres materi ally affect peak flows. Only annual peaks are shown.
Peak stages and discharges
Water year
19111912
1915
19161917
1932
193619391940
194119421943
19441945
194619471948
Date
June 15, 1911July 4, 1912
June 10, 1915
June le, 1916June 17, 1917
June 17, 1932
June 26, 1938June 1, 1939Sept. 21, 1940
July 27, 1941May 24, 1942Mar. 19, 1943June 22, 1943June 4, 1944June 25, 1945
June 6, 1946May 3, 1947Feb. 18, 1948
Gage height (feet)
3.003.8
7.6
3.796.8
3.25
1.962.882.75
4.514.71
a3.81-
5.614.24
2.175.42
a6.02
Discharge (cfs)
197315
1,160
209980
450
154285278
702860-256
1,190787
2571,180
-
Water year
194819491950
195119521953
1954
1955
1956195719581959
1960
196119621963
Date
June 22, 1948June 8, 1949July 4, 1950
July 21, 1951Apr. 28, 1952Mar. 4, 1953June 14, 1953Feb. 2, 1954May 10, 1954July 23, 1955
May 29, 1956June 7, 1957May 21, 195SFeb. 21, 1959Mar. 24, 1959Mar. 9, 1960June 9, 1960
Sept. 19, 1961June 16, 1962June 15, 1963
Gage height (feet)
_2.564.28
4.164.68
a4.17-
a2.63-
3.77
2.154.683.87
a2.47-
a3.00-
3.122.928.73
D'.s charge (cfs)
883230669
631802-501-101517
215673558-31
-82
379324
7,030
a Backwater from ice.
2645. Owl Creek near Lucerne, Wyo.
Location.--Lat 43°43', long 108°11', In sec.7, T.43 N., R.94 W. , near center of span on upstream side of bridge on U.S. Highway 20, 1 mile upstream from mouth and ij miles south of Lucerne.
Drainage area. 505 sq ml.
Gage.--NonrecordIng. At datum 1.48 ft higher prior to Sept. 30, 1932; at datum "(J.98 ft higher Oct. 1, 1932, to Feb. 28, 1933; and at datum 2.00 ft higher
May 11, 1938, to July 12, 1944. Datum of gage Is 4,305.33 ft above mean sealevel, datum of 1929, supplementary adjustment of 1940.
Stage-discharge relation.--Defined by current-meter measurements below 630 cfs.
Remarks. Diversions above station for Irrigation of about 18,000 acres materi ally affect peak flows. Only annual maximum observed stages and discharges are shown.
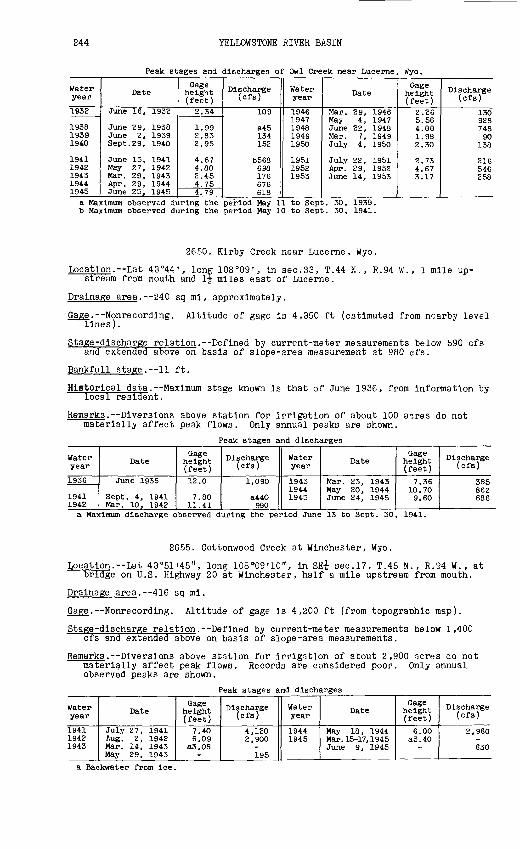
244 YELLOWSTONE RIVER BASIN
Peak stages and discharges of Owl Creek near Lucerne, Wyo.
Water year
1932 J
193819391940
19411942194319441945
Date
June 16, 1932
June 29, 1938June 2, 1939Sept. 29, 1940
June 15, 1941May 27, 1942Mar. 29, 1943Apr. 29, 1944June 25, 1945
Gage height (feet)2.34
1.992.832.95
4.674.802.454.754.79
Discharge (of 8)
109
a45134152
b568698176676618
Water year
19461947194819491950
195119521953
Date
Mar. 29, 1946May 4, 1947June 22, 1948Mar. 7, 1949July 4, 1950
July 22, 1951Apr. 29, 1952June 14, 1953
Gage height (feet)
2.265.564.881.982.30
2.734.673.17
Discharge (cfs)
13092874890
138
216546258
a Maximum observed during the period May 11 to Sept. 30, 1938. b Maximum observed during the period May 10 to Sept. 30, 1941.
2650. Kirby Creek near Lucerne, Wyo.
Location.--Lat 43°44', long 108°09', in sec.33, T.44 N., R.94 W., 1 mile up- stream from mouth and ij miles east of Lucerne.
Drainage area.--240 sq mi, approximately.
Gage.--Nonrecordlng. Altitude of gage is 4,350 ft (estimated from nearby level lines).
Stage-discharge relation.--Defined by current-meter measurements below 590 cfs and extended above on basis of slope-area measurement at 980 cfs.
Bankfull stage.--11 ft.
Historical data. Maximum stage known is that of June 1936, from information by local resident.
Remarks. Diversions above station for irrigation of about 100 aores do not materially affect peak flows. Only annual peaks are shown.
Peak stages and discharges
Water year
1936
1941 1942
Date
June 1936
Sept. 4, 1941 Mar. 10, 1942
Gage height (feet)12.0
7.80 11.41
Discharge (cfs)
1,090
a440 980
Water year
1943 1944 1945
Date
Mar. 23, 1943 May 20, 1944 June 24, 1945
Gage height (feet)
7.36 10.70 9.60
Discharge (cfs)
385 862 686
a Maximum discharge observed during the period June 13 to Sept. 30, 1941.
2655. Cottonwood Creek at Winchester, Wyo.
Location. Lat 43°51'45", long 108°09'10", in SE^ sec.17, T.45 N., R.94 W., at bridge on U.S. Highway 20 at Winchester, half a mile upstream from mouth.
Drainage area.--416 sq mi.
Gage. Nonrecording. Altitude of gage is 4,200 ft (from topograohic map).
Stage-discharge relation. Defined by current-meter measurements below 1,400 cfs and extended above on basis of slope-area measurements.
Remarks. Diversions above station for irrigation of about 2,900 acres do not materially affect peak flows. Records are considered poor. Only annual observed peaks are shown.
Peak stages and discharges
Water year
1941 1942 1943
Date
July 27, 1941 Aug. 2, 1942 Mar. 14, 1943 May 29, 1943
Gage height (feet)
7.40 6.09
a3.08
Discharge (cfs)
4,120 2,900
195
Water year
1944 1945
Date
May 18, 1944 Mar. 15-17, 1945 June 9, 1945
Gage height (feet)
6.00 a3.40
Discharge (cfs)
2,960
630
a Backwater from ice.
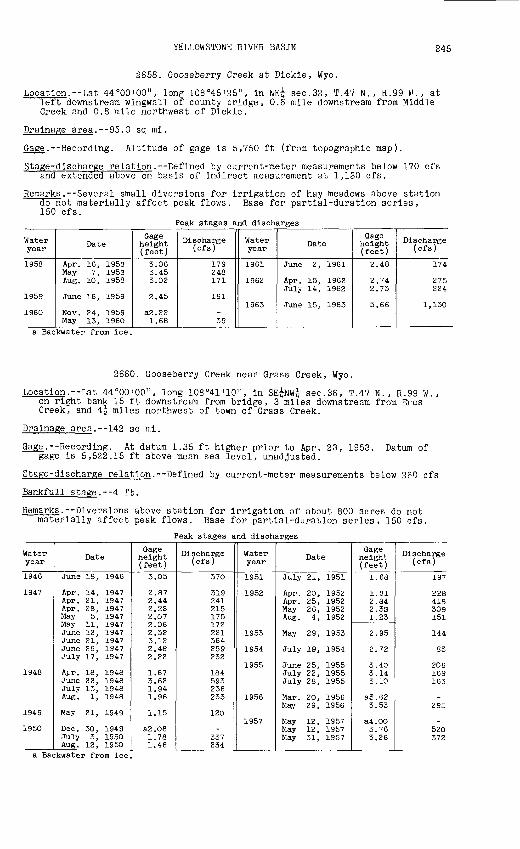
YELLOWSTONE RIVER BASIN 245
2658. Gooseberry Creek at Dickie, Wyo.
Location. Lat 44°00'00", long 108°45'25", in NE^ sec.32, T.47 N. , R.99 V'., at left downstream wingwall of county bridge, 0.6 mile downstream from Middle Creek and 0.8 mile northwest of Dickie.
Drainage area.--95.0 sq mi.
Gage. Recording. Altitude of gage is 5,750 ft (from topographic map).
Stage-discharge relation.--Defined by current-meter measurements below 170 cfs and extended above on basis of indirect measurement at 1,130 cfs.
Remarks.--Several small diversions for irrigation of hay meadows above station do not materially affect peak flows. Base for partial-duration series, 150 cfs.
Peak stages and discharges
Water year
1958
1959
1960
Date
Apr. 16, 195SMay 1, 195SAug. 10, 1958
June 16, 1959
Nov. 24, 1959May 13, 1960
Gage height (feet)
3.063.453.02
2.45
a2.221.68
Discharge (cfs)
179248171
161
-39
Water year
1961
1962
1963
Date
June 2, 1961
Apr. 15, 1962July 14, 1962
June 15, 1963
Gage height (feet)
2.48
2.742.73
5.66
Discharge (cfs)
174
275224
1,130
a Backwater from ice.
2660. Gooseberry Creek near Grass Creek, Wyo.
Location.--Lat 44°00'00", long 108°41'10", in SE^NW^ sec.36, T.47 N. , R.99 W. , on right bank 15 ft downstream from bridge, 3 miles downstream from Eros Creek, and 4-| miles northwest of town of Grass Creek.
Drainage area. 142 sq mi.
Gage.--Recording. At datum 1.35 ft higher prior to Apr. 23, 1953. Datum of gage is 5,522.15 ft above mean sea level, unadjusted.
Stage-discharge relation.--Defined by current-meter measurements below 260 cfs
Bankfull stage.--4 ft.
Remarks.--Diversions above station for irrigation of about 800 acres do not materially affect peak flows. Base for partial-duration series, 150 cfs.
Peak stages and discharges
Water year
1946
1947
1948
1949
1950
Date
June 18, 1946
Apr. 14, 1947Apr. 21, 1947Apr. 2S, 1947May 5, 1947May 11, 1947June 12, 1947June 21, 1947June 26, 1947July 17, 1947
Apr. 18, 1948June 22, 1948July 13, 1948Aug. 1, 1948
May 21, 1949
Dec. 30, 1949July 3, 1950Aug. 12, 1950
Gage height (feet)
3.05
2.872.442.2S2.072.062.323.122.482.22
1.673.621.941.96
1.15
a2.081.781.46
Discharge (cfs)
370
319241215175172221364259232
184593236233
120
-337234
Water year
1951
1952
1953
1954
1955
1956
1957
Date
July 21, 1951
Apr. 20, 1952Apr. 25, 1952May 26, 1952Aug. 4, 1952
May 29, 1953
July 19, 1954
June 25, 1955July 22, 1955July 28, 1955
Mar. 20, 1956May 29, 1956
May 12, 1957May 12, 1957May 31, 1957
Gage height (feet)
1.68
LSI2.842.3S1.23
2.95
2.72
3.403.143.10
a3.623.53
a4.003.763.26
Discharge (cfs)
197
228418309151
144
83
206169163
-295
-520372
a Backwater from ice.

246 YELLOWSTONE RIVER BASIN
2670. Gooseberry Creek at Neiber, Wyo. (Published as "at Pulliam")
Location. Lat 43°55'22", long 108°03'48", in SE^ sec.30, T.46 N., R.93 W., at Neiber, three-quarters of a mile upstream from mouth.
Drainage area. 361 sq mi.
Gage.--Recording. At two sites within a quarter of a mile upstream at differ ent datums prior to Sept. 30, 1944. At datum 1.01 ft higher Oct. 1, 1945, to Sept. 4, 1948. Datum of gage is 4,140.44 ft above mean ssa level, datum of 1929, supplementary adjustment of 1940.
Stage-discharge relation.--Defined by current-meter measurements below 540 cfs.
Remarks. Diversions for irrigation of about 3,000 acres above station materi ally affect peak flows. Badly shifting channel. Only annual peaks are shown.
Peak stages and discharges
Water year
1941 a/ 1942 1943 1944
1946 1947 1948
Date
June 10, 1941 May 25, 1942 Apr. 4, 1943 May 18, 1944
June 20, 1946 Mar. 18, 1947 June 22, 1948
Gage height (feet)
4.54 3.50 1.65 7.13
1.12 2.56 2. SO
Discharge (cfs)
S23 500 97
1,650
175 371 735
Water year
1949 1950
1951
1952 1953
Date
Mar. 22, 1949 Mar. 5, 1950
Mar. 16, 1951 Mar. 27, 1951 May 22, 1952 Mar. 8, 1953 July 29, 1953
Gage height (feet)
04.17
3.07 C3.03
Discharge (cfs)
b55 b55
42 429
S3a Partial year.b Maximum daily.c Backwater from ice.
2685. Fifteen Mile Creek near Worland, Wyo.
Location.--Lat 44°01'14" J long 108°00'42", in M^NE^- sec.27, T.47 N. , R.93 W., on left bank 300 ft upstream from Bighorn Canal spillway, 1^ miles upstream from mouth, and 2f miles west of Worland.
Drainage area.--518 sq mi.
Gage. RecordIng. At site 400 ft upstream at datum 5.52 ft higher prior to Oct. 1, 1956. Altitude of gage is 4,080 ft (by barometer).
Stage-discharge relation. Defined by current-meter measurements below 2,700 cfs.
Remarks. Bureau of Land Management has extensive spreader systems on some of the tributaries above station which do not materially affect peak flows. Base for partial-duration series, 400 cfs.
Peak stages and discharges
Water year
1951 a/
1952
1953
1954
1955
Date
June 2, 1951July 11, 1951Aug. 5, 1951Aug. 7, 1951
Oct. 4, 1951Apr. 16, 1952May 16, 1952May 22, 1952May 26, 1952
June 8, 1953July 29, 1953
June 26, 1954June 29, 1954July 16, 1954
Apr. 9, 1955June 3, 1955June 16, 1955
Gage height (feet)
2.223.4S3.234.02
3.663.642.725.772.96
2.405.17
5.023.953.42
2.112. OS3.86
Discharge (cfs)
4181,030
8961,340
1,1501,130
6353,300
755
4902,490
2,3201,3801,060
404412
1,330
Water year
1955
1956
1957
195S
1959
Date
June 25, 1955July 29, 1955Aug. 15, 1955
Dec. 24, 1955Sept. 13, 1956
May 14, 1957May 15, 1957June 10, 1957June 17, 1957Aug. 18, 1957
June 4, 1958June 12, 1958July 31, 1958Aug. 16, 1958Sept. 10, 1958
Mar. 11, 1959May 4, 1959
Gage height (feet)
2.853.053.11
-2.28
2.983.884.003.312. 8S
2.973.953.032.482.88
C3.802.75
Discharge (cfs)
750858890
b490492
6861,0901,150
834642
6821,130
762554738
-654
a Period March to September 1951. b Estimated. c Backwater from ice.

YELLOWSTONE RIVER BASIN 247
Peak stages and discharges of Fifteen Mile Creek near Worland, Wyo. Continued
Water year
1959
1960
1961
Date
June 17, 1959June 30, 1959Aug. 20, 1959
Oct. 16, 1959Mar. 14, 1960June 10, 1960Sept. 15, 1960
May 25, 1961July 7, 1961Sept. 11, 1961Sept. 12, 1961
Gage height (feet)
2.882.752.54
2.32C3.622.422.79
3.123.104.674.14
Discharge (cfs)
703654506
411-470578
749785
1,240947
Water year
1961
1962
1963
Date
Sept. 20, 1961
Oct. 10, 1961Mar. 9, 1962May 26, 1962July 13, 1962
Apr. 28, 1963Way 26, 1963June 3, 1963June 15, 1963Sept. 22, 1963
Gage height (feet)
6.32
3.42_
3.763.85
4.804.304.193.544.02
Discharge (cfs)
2,180
568bSOO876
1,270995934577841
b Estimated. c Backwater from ice.
2690. Bighorn River near Manderson, Wyo.
Location.--Lat 44°12', long 107°55', in sec.28, T.4of a mile w
mile Creek, and 6 miles southeast of Manderson.
Drainage area. 11,020 sq mi.
___ _ .ec.28, T.49 N., R.92 W., on left tank at bridge a quarter of a mile west of Rairdon, 1-jj- miles downstream fro-n Five-
Gage. Nonrecording prior to June 2, 1953; recording thereafter. Datum of gage is 3,924.39 ft above mean sea level, datum of 1929, supplementary adjustment of 1940.
Stage-discharge relation. Defined by current-meter measurements below 11,000 cfs.
Bankfull stage.--12 ft.
Remarks. Diversions for irrigation of about 213,000 acres above station. Flow largely regulated by Boysen Reservoir beginning on Oct. 11, 1951. DiV3rsions materially affect peak flows. Only annual peaks are shown.
Peak stages and discharges
Water year
1948 1949 1950
1951
Date
Feb. 19, 1948 June 15, 1949 June 25, 1950
June 1, 1951
Gage height (feet)
al6.45 9.47 9.72
10.15
Discharge (cfs)
9,500 8,040 8,580
10,600
Water year
1952 1953
1956
Date
May 22, 1952 July 30, 1953
Feb. 6, 1956 Feb. 24, 1956
Gage height (feet)
8.27 6.25
all. 10
Discharge (cfs)
5,810 2,390
4,940a Backwater from ice.
2695. Bighorn River at Manderson, Wyo.
Location.--Lat 44°16', long 107°59', in sec.36, T.50 N., R.93 W., at bridge on U.S. Highway 20, near west edge of Manderson and 1 mile upstream from Nowood Creek.
Drainage area. 11,048 sq mi.
Gage. Nonrecording. Datum of gage is 3,881.74 ft above mean sea level, datum of 1929.
Stage-discharge relation. Defined by current-meter measurements below 18,000 cfs.
Remarks. Diversions above station for irrigation of about 213,000 acres materi ally affect peak flows. Only annual peaks are shown.
Peak stages and discharges
Water year
1941 1942 1943 1944 1945
Date
June 9, 1941 May 29, 1942 June 24, 1943 June 4, 1944 June 24, 1945
Gage height (feet)
8.99 9.37
10.12 12.60 11.67
Discharge (cfs)
10,500 10,400 10,900 17,900 13,700
Water year
1946 1947 194S
1949
Date
June 24, 1946 June 23, 1947 Feb. 19, 1948 Feb. 19, 1948 June 15, 1949
Gage height (feet)
11.88 12.97
bl5. 00
Discharge (cfs)
14,200 17,700 a9,620
c7,950a Result of current-meter measurement. b Backwater from ice. c Maximum daily.

248 YELLOWSTONE RIVER BASIN
2700. Nowood Creek near Tensleep, Wyo.
Location. Lat 44°00'50", long 107°25'40", in sec.27, T.47 N., R.88 W., on right bank 2 miles upstream from Tensleep Creek and 2 miles southeast of Tensleep.
Drainage area. 803 sq mi.
Gage.--Nonrecordlng at site 300 ft downstream at different datum prior to Oct. 1, 1943; recording thereafter. Altitude of gage Is 4,410 ft (by barometer^.
Stage-discharge relation. Defined by current-meter measurements below 720 cfs and extended above on basis of slope-area measurement at 3,330 cfs. Defined below 1,400 cfs at former site.
Remarks.--Diversions above station for irrigation of about 4,000 acres do not materially affect peak flows. Base for partial-duration series, 500 cfs.
Peak stages and discharges
Water year
1938 a/
1939
1940
1941
1942
1943
1950 a/
1951
Date
June 28, 1938Sept. 2, 1938
Mar. 13, 1939
June 20, 1940
May 5, 1941
Mar. 13, 1942
Mar. 25, 1943
May 18, 1950
Feb. 28, 1951
Gage height (feet)
9.005.82
-
9.00
7.66
8.11
8.51
3.86
b5.52
Discharge (cfs)
2,1101,030
850
2,110
1,580
1,750
2,010
587
-
Water year
1951
1952
1953
1954
1955
Date
May 1, 1951
June 27, 1952Aug. 11, 1952
Mar. 9, 1953May 29, 1953June 7, 1953
Feb. 14, 1954Aug. 7, 1954
May 3, 1955May 16, 1955June 16, 1955June 17, 1955
Gage 1 eight (feet)
3.06
5.884.02
b6.135.454.70
b3.553.25
4.015.10
12.35.25
Discharge (cfs)
394
1,160635
_1,040
820
_412
586890
3,330885
a Partial year.b Backwater from ice.
2705. Canyon Creek near Tensleep, Wyo.
Location.--Lat 44°03'45", long 107°22'55", in NW£ sec.12, T.47 N., R.88 W., 50 ft upstream from a small unnamed tributary, 300 ft upstream from mouth, and 4.4 miles northeast of Tensleep.
Drainage area.--66.3 sq mi.
Gage.--Nonrecording. Datum of gage is 4,706.25 ft above mean sea level, datum of 1929.
Stage-discharge relation. Defined by current-meter measurements below 150 cfs.
Bankfull stage.--6 ft.
Remarks. Diversions for irrigation of about 810 acres above station do not materially affect peak flows. Only annual observed maximum stages and dis charges are shown.
Peak stages and discharges
Water year
1939 1940
1941
Date
June 1, 1939 July 3, 1940
May 14, 1941
Gage height (feet)
2.24 2.38
3.09
Discharge (cfs)
a75 80
196
Water year
1942 1943 1944
Date
Apr. 21, 1942 June 12, 1943 May 18, 1944
Gage 1 Right (feet)
3.32 2.86 3.44
Discharge (cfs)
231 166 248
a Maximum observed during the period May to September 1939.
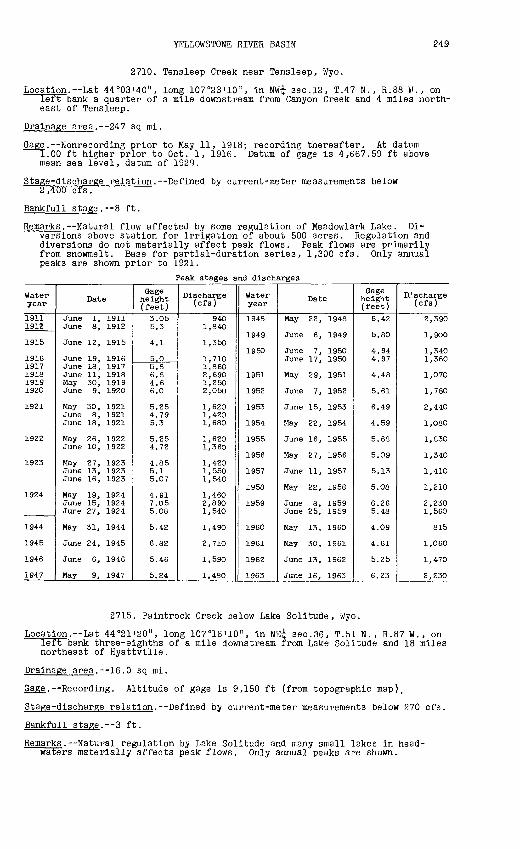
YELLOWSTONE RIVER BASIN 249
2710. Tensleep Creek near Tensleep, Wyo.
Location. Lab 44°03'40", long 107°23'10", in NW£ sec.12, T.47 N., R.88 V., on left bank a quarter of a mile downstream from Canyon Creek and 4 miles north east of Tensleep.
Drainage area. 247 sq mi.
Gage. Nonrecording prior to May 11, 1918; recording thereafter. At datum 1.00 ft higher prior to Oct. 1, 1916. Datum of gage is 4,667.59 ft above mean sea level, datum of 1929.
Stage-discharge relation. Defined by current-meter measurements below 2,400 cfs.
Bankfull stage.--8 ft.
Remarks. Natural flow affected by some regulation of Meadowlark Lake. Di versions above station for irrigation of about 500 acres. Regulation and diversions do not materially affect peak flows. Peak flows are primarily from snowmelt. Base for partial-duration series, 1,300 cfs. Only annual peaks are shown prior to 1921.
Peak stages and discharges
Water year
19111912
1915
19161917191819191920
1921
1922
1923
1924
1944
1945
1946
1947
Date
June 1, 1911June 8, 1912
June 12, 1915
June 19, 1916June 18, 1917June 11, 1918May 30, 1919June 9, 1920
May 30, 1921June 8, 1921June 18, 1921
May 26, 1922June 10, 1922
May 27, 1923June 13, 1923June 16, 1923
May 19, 1924June 15, 1924June 27, 1924
May 31, 1944
June 24, 1945
June 6, 1946
May 9, 1947
Gage height (feet)3.055.3
4.1
5.05.86.84.66.0
5.254.795.3
5.254.72
4.855.15.07
4.917.055.08
5.42
6.82
5.46
5.24
Discharge (cfs)
9401,840
1,350
1,7101,8602,6901,2502,050
1,6201,4201,680
1,6201,360
1,4201,5501,540
1,4602,8901,540
1,490
2,710
1,590
1,480
Water year
1948
1949
1950
1951
1952
1953
1954
1955
1956
1957
1958
1959
1960
1961
1962
1963
Date
May 22, 1948
June 6, 1949
June 7, 1950June 17, 1950
May 29, 1951
June 7, 1952
June 15, 1953
May 22, 1954
June 16, 1955
May 27, 1956
June 11, 1957
May 22, 1958
June 8, 1959June 25, 1959
May 13, 1960
May 30, 1961
June 13, 1962
June 16, 1963
Gage height (feet)
6.42
5.80
4.944.97
4.48
5.61
6.49
4.59
5.68
5.09
5.13
5.08
6.265.48
4.09
4.61
5.25
6.23
Discharge (cfs)
2,390
1,900
1,3401,360
1,070
1,780
2,440
1,080
1,830
1,340
1,410
1,210
2,2301,560
815
1,060
1,470
2,230
2715. Paintrock Creek below Lake Solitude, Wyo.
Location. Lat 44°21'20", long 107°16'10", in NE£ sec.36, T.51 N., R.87 W., on left bank three-eighths of a mile downstream from Lake Solitude and 18 miles northeast of Hyattville.
Drainage area. 16.0 sq mi.
Gage. Recording. Altitude of gage is 9,150 ft (from topographic map).
Stage-discharge relation. Defined by current-meter measurements below 270 cfs.
Bankfull stage.--3 ft.
Remarks. Natural regulation by Lake Solitude and many small lakes in head- waters materially affects peak flows. Only annual peaks are shown.

250 YELLOWSTONE RIVER BASIN
Peak stages and discharges of Paintrock Creek below Lake Solitude, Wyo.
Water year
1947 1948 1949 1950
Date
June 20, 1947 May 1948
June 19, 1949 June 25, 1950
Gage height (feet)4.64 4.69 4.40 4.86
Discharge (cfs)
321 328 286 341
Water year
1951 1952 1953
Date
June 17, 1951 June 7, 1952 June 11, 1953
Gage height (feet)
4.52 5.50 6.0
Discharge (cfs)
300 452 543
2725. Paintrock Creek near Hyattville, Wyo.
Location. Lat 44°17', long 107°30', in sec.25, T.50 N., R.89 W., on downstream side of bridge near left bank, 0.6 mile upstream from Luman Creek and 6 miles northeast of Hyattville.
Drainage area. 164 sq mi.
Gage. Recording prior to June 15, 1953; nonrecording thereafter. At several nearby sites at different daturas prior to Sept. 4, 1948. At site 400 ft up stream at different datum Sept. 4, 1948, to June 14, 1953. Altitude of gage is 5,070 ft (by barometer).
Stage-discharge relation. Defined by current-meter measurements below 530 cfs at present site and below 1,900 cfs at site 400 ft upstream.
Remarks.--Some natural regulation by Lake Solitude and many small lakes in head waters does not materially affect peak flows. Base for partial-duration series, 1,600 cfs.
Peak stages and discharges
Water year
1921
1922
1923
1924
1925
1926
1941
1942
1943
Date
May 28, 1921
May 28, 1922June 6, 1922
May 26, 1923June 3, 1923June 12, 1923July 24, 1923
June 14, 1924June 26, 1924
May 21, 1925May 30, 1925
May 23, 1926
May 25, 1941
May 26, 1942
June 20, 1943
Gage height (feet)
5.20
4.624.90
4.364.344.797.2
6.1-
5.64.90
4.94
5.20
6.54
6.15
Discharge (cfs)
2,560
1,S902,200
1,6201,6002,0804,960
3,300al,750
2,5201,820
1,860
1,170
2,150
1,900
Water year
1944
1945
1946
1947
1948
1949
1950
1951
1952
1953
Date
May 31, 1944
June 24, 1945
June 6, 1946
June 8, 1947
May 21, 1948
June 6, 1949
June 6, 1950June 16, 1950
May 2S, 1951
June 6:, 1952
June 11, 1953
Gage height (feet)
5.89
9.80
5.20
4.55
4.50
6.48
6.106.80
6.40
7.5
8.32
Discharge (cfs)
1,590
8,200
1,910
1,540
2,600
2,050
1,7002,380
1,750
2,930
3,950
a Maximum daily
2730. Medicine Lodge Creek near Hyattville, Wyo.
Location.--Lat 44°18', long 107°33', in NW£ sec.22, T.50 N., R.89 W., on left bank a quarter of a mile downstream from North Fork and 4^ iriles northeast of Hyattville.
Drainage area. 86.8 sq mi.
Gage.--Nonrecording at different datum prior to June 24, 1943; recording there after. Altitude of gage is 4,770 ft (by barometer).
Stage-discharge relation. Defined by current-meter measurements below 570 cfs.
Bankfull stage.--3 ft.
Remarks. Small diversion above station for irrigation of hay rreadow does not materially affect peak flows. Base for partial-duration series, 350 cfs.
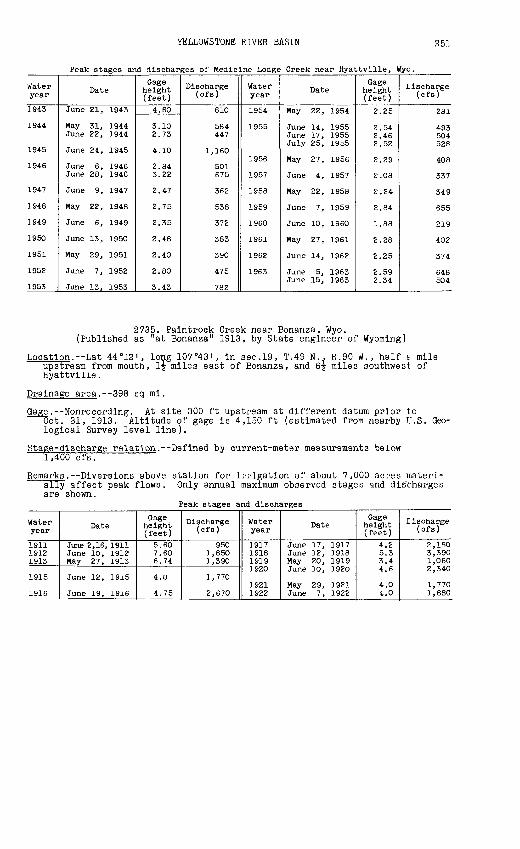
YELLOWSTONE RIVER BASIN 251
Peak stages and discharges of Medicine Lodge Creek near Hyattville, Wye.
Water year
1943
1944
1945
1946
1947
1948
1949
1950
1951
1952
1953
Date
June 21, 1943
May 31, 1944 June 22, 1944
June 24, 1945
June 6, 1946 June 28, 1946
June 9, 1947
May 22, 1948
June 6, 1949
June 13, 1950
May 29, 1951
June 7, 1952
June 13, 1953
Gage height (feet)
4.60
3.10 2.73
4.10
2.84 3.22
2.47
2.75
2.35
2.48
2.40
2.80
3.43
Discharge (cfs)
610
584 447
1,160
501 675
362
538
372
383
390
475
782
Water year
1954
1955
1956
1957
1958
1959
1960
1961
1962
1963
Date
May 22, 1954
June 14, 1955 June 17, 1955 July 25, 1955
May 27, 1956
June 4, 1957
May 22, 1958
June 7, 1959
June 10, 1960
May 27, 1961
June 14, 1962
June 5, 1963 June 15, 1963
Gage height (feet)
2.25
2.54 2.46 2.52
2.29
2.08
2.24
2.84
1.88
2.28
2.25
2.59 2.34
I is charge (cfs)
281
493 504 528
408
337
349
655
219
402
374
648 504
2735. Paintrock Creek near Bonanza, Wyo. (Published as "at Bonanza" 1913, by State engineer of Wyoming)
Location.--Lat 44°12', long 107°43', in sec.19, T.49 N., R.90 W., half z mile upstream from mouth, \\ miles east of Bonanza, and 6^ miles southwest of Hyattville.
Drainage area.--398 sq mi.
Gage. Nonrecording. At site 300 ft upstream at different datum prior toOct. 31, 1913. Altitude of gage is 4,150 ft (estimated from nearby U.S. Geo logical Survey level line).
Stage-discharge relation.--Defined by current-meter measurements below 1,400 cfs.
Remarks. Diversions above station for irrigation of about 7,000 acres materi ally affect peak flows. Only annual maximum observed stages and discharges are shown.
Peak stages and discharges
Water year
1911 1912 1913
1915
1916
Date
June 2,16, 1911 June 10, 1912 May 27, 1913
June 12, 1915
June 19, 1916
Gage height (feet)
5.60 7.60 6.74
4.0
4.75
Discharge (cfs)
950 1,850 1,390
1,770
2,670
Water year
1917 1918 1919 1920
1921 1922
Date
June 17, 1917 June 12, 1918 May 20, 1919 June 10, 1920
May 29, 1921 June 7, 1922
Gage height (feet)
4.2 5.3 3.4 4.6
4.0 4.0
lischarge (cfs)
2,180 3,390 1,060 2,340
1,770 1,880

252 YELLOWSTONE RIVER BASIN
of miles
2740. Nowood Creek at Bonanza, Wyo. (Published as "near Bonanza" 1913-14)
Location.--Lat 44°13', long 107°45', in sec.24, T.49 N., R.91 W., a quarter a mile north of Bonanza, 1 mile downstream from Paintrock Creek, and 1\ i southwest of Hyattville.
Drainage area.--1,790 sq mi, approximately.
Gage.--Nonrecording. Altitude of gage is 4,120 ft (estimated from nearby U.S. Geological Survey level line).
Stage-discharge relation. Defined by current-meter measurements below 3,800 cfs.
Remarks. Records for 1913-14 furnished by State engineer of Wyoning. Di versions above station for irrigation of atout 13,000 acres, some of which are below station, materially affect peak flows. Only annual maximum observed stages and discharges are shown.
Peak stages and discharges
Water year
19111912191319141915
19161917191819191920
Date
June 16, 1911July 2, 1912May 27, 1915May 28, 1914June 13, 1915
June 19, 1916June IS, 1917June 12,13,1918May 20, 1919June 11, 1920
Gage height (feet)
5.708.3--
6.8
7.57.57.85.427.7
Discharge (cfs)
2,1004,5402,7003,9402,930
3,7803,7804,0801,7603,980
Water year
19211922192319241925
1926192719Z8
Date
June 19, 1921May 29, 1922Sept. 29, 1923June 15, 1924May 22, 1925
May 25, 1926June 28, 1927July 7, 1928
Cage height (feet)
6.56.67.358.097.0
6.37.467.03
Discharge (cfs)
2,9503,0504,1105,1603,600
2,8004,2603,760
2745. Greybull River near Pitchfork, Wyo.
Location. Lat 44°06'31", long 109°09'36", in SE£ sec.24, T.48 N. , R.103 W., on left bank at downstream side of Z Bar T Ranch bridge, 0.1 mile upstream from Rose Creek and 4 miles west of Pitchfork.
Drainage area.--282 sq mi.
Gage. Recording. At site 300 ft downstream at different datum prior to May 9, 1951. Datum of gage is 6,709.33 ft above mean sea level, datum of 1929.
Stage-discharge relation. Defined by current-meter measurements below 2,900 cfs and extended above on basis of slope-area measurement at 8,610 cfs.
Remarks.--Diversions above station for irrigation of about 1,000 acres do not materially affect peak flows. Base for partial-duration series, 1,200 cfs.
Peak stages and discharges
Water year
1946
1947
1948
1949
1951 b/
1952
1953
1954
1955
Date
June 5, 1946
June 19, 1947
Dec. 12, 1947June 7, 1948
June 5, 1949June 12, 1949
June 16, 1951July 4, 1951July 16, 1951
Apr. 27, 1952June 6, 1952
June 13, 1953
May 20, 1954June 27, 1954
June 15, 1955
Gage height (feet)
3.56
3.89
a4.963.90
4.574.13
5.585.165.05
5.176.10
5.73
4.895.68
4.82
Discharge (cfs)
1,230
1,360-
1,240
-1,540
2,4601,4401,230
1,4804,000
3,190
1,4303,060
1,290
Water year
1955
1956
1957
1958
1959
1960
1961
1962
1963
Date
June 21, 1955
June 4, 1956
June 5, 1957June 29, 1957July 19, 1957
May 22, 1958
June 6, 1959June 16, 1959
June 17, 1960
June 9, 1961
June 26, 1962
June 4, 1963June 15, 1963June 21, 1963
Page height (feet)
4.82
5.57
6.986.135.21
5.13
4.624.80
4.22
5.49
5.51
5.157.684.34
Discharge (cfs)
1,290
2,120
5,7003,2701,510
2,020
1,2601,500
800
2,230
2,300
1,7608,6102,410
a Backwater from ice. b Period May to September 1951.
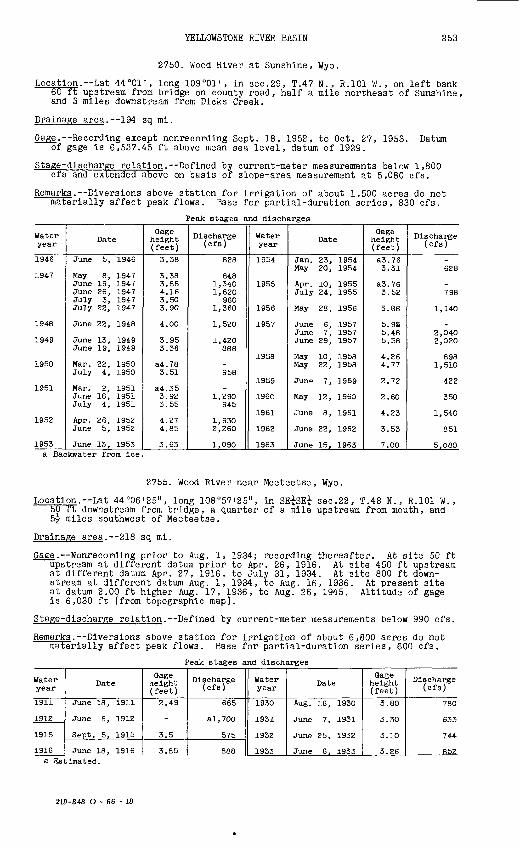
YELLOWSTONE RIVER BASIN 253
2750. Wood River at Sunshine, Wyo.
Location.--Lat 44°01', long 109°01', in sec.29, T.47 N. , R.101 W., on left bank 60 ft upstream from bridge on county road, half a mile northeast of Sunshine, and 3 miles downstream from Dicks Creek.
Drainage area. 194 sq mi.
Gage.--Recording except nonrecording Sept. 18, 1952, to Oct. 27, 1953. Datum of gage is 6,537.45 ft above mean sea level, datum of 1929.
Stage-discharge relation. Defined by current-meter measurements below 1,800 cfs and extended above on basis of slope-area measurement at 5,080 cfs.
Remarks. Diversions above station for irrigation of about 1,500 acres do not materially affect peak flows. Base for partial-duration series, 830 cfs.
Peak stages and discharges
Water year
1946
1947
1948
1949
1950
1951
1952
1953
Date
June 5, 1946
May 8, 1947June 19, 1947June 26, 1947July 3, 1947July 22, 1947
June 22, 1948
June 13, 1949June 19, 1949
Mar. 22, 1950July 4, 1950
Mar. 2, 1951June 16, 1951July 4, 1951
Apr. 26, 1952June 5, 1952
June 13, 1953
Gage height (feet)
3.38
3.383.884.163.503.90
4.00
3.953.36
a4.783.51
a4.353.923.55
4.274.85
3.63
Discharge (cfs)
828
8481,3401,620
9601,360
1,520
1,420888
-958
-1,290
945
1,9302,260
1,090
Water year
1954
1955
1956
1957
1958
1959
1960
1961
1962
1963
Date
Jan. 23, 1954May 20, 1954
Apr. 10, 1955July 24, 1955
May 28, 1956
June 6, 1957June 7, 1957June 29, 1957
May 10, 1958May 22, 1958
June 7, 1959
May 12, 1960
June 8, 1961
June 22, 1962
June 15, 1963
Gage height (feet)
a3.763.31
a3.763.52
3.88
5.955.485.58
4.264.77
2.72
2.60
4.23
3.53
7.00
Discharge (cfs)
_628
-798
1,140
_2,0402,020
8981,510
422
350
1,540
851
5,080a Backwater from ice.
2755. Wood River near Meeteetse, Wyo.
Location.--Lat 44°06'25", long 108°57'25", in SE^SE^ sec.22, T.48 N., R.101 W. , 50 ft downstream from bridge, a quarter of a mile upstream from mouth, and 5^ miles southwest of Meeteetse.
Drainage area. 218 sq mi.
Gage. Nonrecording prior to Aug. 1, 1934; recording thereafter. At site 50 ft upstream at different datum prior to Apr. 26, 1916. At site 450 ft upstream at different datum Apr. 27, 1916, to July 31, 1934. At site 800 ft down stream at different datum Aug. 1, 1934, to Aug. 16, 1936. At present site at datum 2.00 ft higher Aug. 17, 1936, to Aug. 26, 1945. Altitude of gage is 6,030 ft (from topographic map).
Stage-discharge relation. Defined by current-meter measurements below 990 cfs.
Remarks. Diversions above station for irrigation of about 6,800 acres do not materially affect peak flows. Base for partial-duration series, 600 cfs.
Peak stages and discharges
Water year
1911
1912
1915
1916
Date
June 18, 1911
June 8, 1912
Sept. 5, 1915
June 18, 1916
Gage height (feet)
2.49
3.5
3.85
Discharge (cfs)
665
al,700
575
888
Water year
1930
1931
1932
1933
Date
Aug. 16, 1930
June 7, 1931
June 25, 1932
June 6, 1933
Gage height (feet)
3.80
3.30
3.10
3.26
Discharge (cfs)
780
633
744
852a Estimated.
219-848 O - 66 - 18

254 YELLOWSTONE RIVER BASIN
Peak stages and discharges of Wood River near Meeteetse, Wyo.--Continued
Water year
1935
1936
1937
1938
1939
1940
1941
1942
1943
1944
Date
June 14, 1935
July 12, 1936
June 17, 1937June 20, 1937
May 27, 1938
May 29, 1939
July 1, 1940
May 13, 1941May 26, 1941June 15, 1941July 25, 1941Aug. 11, 1941
May 22, 1942May 26, 1942June 4, 1942June 8, 1942June 26, 1942
May 29, 1943June 21, 1943
May 14, 1944
Gage height (feet)
6.17
4.51
3.063.06
2.31
1.86
1.95
2.48-
2.622.323.36
3.033.053.233.302.48
2.562.86
2.97
Discharge (cfs)
1,550
a400
9921,020
615
412
407
812b760
1,170614
1,350
1,2101,2101,2601,330
756
8231,050
1,320
Water year
1944
1945
1946
1947
1948
1949
Date
May 31, 1944June 11, 1944June 17, 1944June 22, 1944June 27, 1944
June 22, 1945June 24, 1945July 4, 1945July 9, 1945
June 5, 1946June 18, 1946June 22, 1946
May 3, 1947June 19, 1947June 27, 1947July 4, 1947
May 21, 1948May 29, 1948June 3, 1948June 7, 1948June 22, 1948
June 12, 1949June 19, 1949
Cage height (feet)
2.452.332.442.642.90
3.183.05.94
1.00
3.362.833.40
3.1---
3.133.303.253.304.24
4.523.88
Discharge (cfs)
1,010936
1,0401,2201,450
-2,150
740821
1,110652
1,160
1,080bl,160bl,280
b720
7851,020
930900
1,600
1,370753
a Estimated.b Maximum daily.
2765. Greybull River at Meeteetse, Wyo.
Location.--Lat 44°09'20", long 108°52'35", In sec.4, T.48 N., R.100 W. , on right bank at Meeteetse, 1,700 ft upstream from bridge on State Highway 120 and 3 miles upstream from Meeteetse Creek.
Drainage area. 681 sq ml.
dage. Recording. At different datum prior to July 25, 1926. At site 600 ft downstream at different datum July 26, 1926, to Apr. 14, 1929. At site 2,200 ft downstream at different datum Apr. 15, 1929, to July 29, 1934. At site 1,700 ft downstream at different datum July 30, 1934, to Apr. 27, 1938. At site 100 ft upstream on left bank at datum 2.00 ft higher A-r. 28, 1938, to May 24, 1961. Datum of gage Is 5,739.42 ft above mean sea level, datum of 1929, supplementary adjustment of 1943.
Stage-discharge relation. Defined by current-meter measurements below 6,500 cfs.
Remarks. Diversions above station for irrigation of about 6,000 acres. Slight regulation by Sunshine Reservoir (capacity, 53,000 acre-ft) beginning May 1940. Diversions and regulation materially affect peak flows. Only annual peaks are shown.
Peak stages and discharges
Water year
1921 1922 1923 1924 1925
1926 1927 1928 1929 1930
1931 1932 1933
Date
June 6, 1921 June 22, 1922 June 12, 1923 June 16,17, 1924 June 22, 1925
July 9, 1926June 27, 1927
(bjJune 6, 1929 Aug. 14, 1930
June 7, 1931 June 22, 1932 June 15, 1933
Gage height (feet)
5.4 4.7 7.44
6.55
8.355.48 6.696.37 8.20
7.14 6.69 6.42
Discharge (cfs)
4,970 3,320 4,280
a4,600 3,020
6,3502,010 3,3504,000 7,320
5,030 3,940 4,550
Water year
1934 1935
1936 1937 1938 1939 1940
1941 1942 1943 1944 1945
Date
May 7. 1934June 12, 1935
July 20, 1936 June 20, 1937June 23, 1938 May 30, 1939 June 5, 1940
Aug. 11, 1941 May 25, 1942 June 23, 1943 June 26, 1944 June 22, 1945
Gage height (feet)
5.176.90
6.55 7.474.63 4.40 3.85
7.56 6.33 4.96 5.59 6.32
Discharge (cfs)
1.6909,000
8,000 10.5002,200 1,740 1,080
10,400 7,400 2,780 4,530 5,960
a Maximum daily; estimated. b Occurred May 27 or June 27, 1928.

YELLOWSTONE RIVER BASIN 255
Peak stages and discharges of Greybull River at Meeteetse, Wyo. Continued
Water year
1946 1947 1948 1949 1950
1951 1952 1953 1954
Date
June 23, 1946 June 19, 1947 June 22, 1948 June 12, 1949 Jan. 21, 1950 June 7, 1950
June 17, 1951 June 7, 1952 June 13, 1953 July 15, 1954
Gage height (feet)5.03 5.56 4.91 5.12
C4.27 4.03
5.13 6.36 5.12 4.54
Discharge (cfs)
2,410 2,780 2,400 2,730
1,580
3,380 5,490 3,340 2,600
Water year
1955
1956 1957 1958 1959 1960
1961 1962 1963
Date
July 28, 1955
June 5, 1956 June 6, 1957 May 20, 1958 June 16, 1959 June 18, 1960
June 8, 1961 June 27, 1962 June 15, 1963
Gage height (feet)
3.91
4.20 6.78 5.17 2.70 2.37
4.72 4.71 9.20
Discharge (cfs)
1,810
2,290 7,710 3,920 1,110
933
2,480 2,800 13,600
c Backwater from Ice.
2775. Greybull River near Basin, Wyo.
Location. Lat 44°25', long 108°11', in NW^ sec.8, T.51 N., R.94 W., or left bank 250 ft downstream from bridge on State Highway 130, 2 miles upstream from Dorsey Creek, and 8 miles west of Basin.
Drainage area. 1,115 sq mi.
Gage. Nonrecording prior to Sept. 20, 1934; recording thereafter. At datum 2.92 ft higher Apr. 14 to Sept. 30, 1930. At datum 1.92 ft higher Oct. 1, 1930, to Apr. 14, 1936. At site 200 ft upstream at present datum Apr. 15, 1936, to Aug. 13, 1951. Altitude of gage is 3,990 ft (by barometer .
Stage-discharge relation. Defined by current-meter measurements below 8,200 cfs and extended above on basis of slope-area measurement at 19,400 cfs.
Bankfull stage.--5 ft.
Remarks. Diversions above station for irrigation of about 39,000 acres.Slight regulation by upper Sunshine Reservoir beginning May 1940 (capacity, 53,000 acre-ft). Diversions and regulation materially affect peak flows. Only annual peaks are shown.
Peak stages and discharges
Water year
1930
19311932193319341935
1936193719381939
1940
194119421943
19441945
1946194719481949
Date
Aug. 15, 1930
June 8, 1931May 22, 1932June 10, 1933Apr. 7, 1934June 13, 1935
Aug. 4, 1936June 21, 1937July 25, 1938Mar. 13, 1939June 1, 1939June 5, 1940
Aug. 12, 1941May 24, 1942Mar. 26, 1943June 26, 1943June 27, 1944June 23, 1945
June 23, 1946June 27, 1947June 26, 1948Mar. 5, 1949
Gage height (feet)4.90
6.405.805.43.315.58
5.606.937.66
a5.94-
6.98
8.487.43
a8. 60-
7.627.82
6.507.717.35
a8.06
Discharge (cfs)
3,270
4,1003,5002,920
8345,270
1,9204,2205,340
-1,2804,050
5,3904,510
-2,7203,2004,050
1,6502,8902,530
-
Water year
19491950
1951
1952195319541955
1956
1957
19581959
1960
19611962
1963
Date
June 12, 1949July 4, 1950
Feb. 27, 1951Aug. 5, 1951June 7, 1952June 14, 1953July 16, 1954Mar. 30, 1955June 25, 1955
Dec. 24, 1955July 13, 1956June 4, 1957June 4, 1957May 21, 1958Jan. 12, 1959June 22, 1959Mar. 21, 1960Mar. 28, 1960
Sept. 19, 1961Feb. 12, 1962June 23, 1962June 16, 1963
Gage height (feet)
-5.17
a7.29-
6.895.595.24
34.92_
a5.16-
6.035.905.04
34.34-
35.75-
5.1134.96
-8.83
Discharge (cfs)
2,390376
-3,4204,9202,5901,880
-1,110
-1,250
-9,3003,390
-1,240
-397
3,680-
2,33019,400
a Bsckwster from Ice.

256 YELLOWSTONE RIVER BASIN
2780. Dry Creek at Greybull, Wyo.
Location.--Lat 44°30', long 108°03', in sec.5, T.52 N., R.93 W. , on left bank half a mile north of Greybull and half a mile upstream from mouth.
Drainage area. 433 sq mi.
Gage.--Recording. At site 1 mile upstream at different datum prior to Nov. 12, 1952. Altitude of gage is 3,780 ft (by barometer).
Stage-discharge relation. Defined by current-meter measurements below 980 cfs.
Remarks. Diversions above station for irrigation of about 800 acres. Part of flow is return flow from lands irrigated by the Farmers Canal diverting water from Greybull River. Diversions and return flow do not materially af fect peak flows. Base for partial-duration series, 350 cfs.
Peak stages and discharges
Water year
1951a/
1952
1953
1956
1957
Date
July 17, 1951 Aug. 5, 1951 Aug. 8, 1951
Mar. 9, 1952 May 22, 1952
Feb. 4, 1953 June 15, 1953
Mar. 19, 1956 Mar. 19, 1956
May 5, 1957 May 15, 1957 May 20, 1957 May 31, 1957
Gage height (feet)
4.06 3.86 3.33
b4.70 3.77
b5.44 5.38
b6.84 b6.78
6.67 7.09 6.49 7.46
Discharge (cfs)
860 773 547
734
246
360
590 746 526 894
Water year
1957
1958
1959
1960
1961
Date
June 7, 1957 June 10, 1957 June 17, 1957
June 9, 1958 July 5, 1958 July 20, 1958 July 21, 1958 July 25, 1958 July 31, 195S
June ^0, 1959
Mar. 9, 1960 Mar. 10, 1960
Sept. 19, 1961
Gige height (feet)
7.72 6.48 7.41
6.30 6.54 6.70 6.48 6.95 6.72
6.92
b3.12
Discharge (efs)
998 448 845
410 491 575 487 680 600
668
C250
d7,200a Partial year,
nual peak only.b Backwater from ice. c Maximum dally; estimated.
2783. Shell Creek above Shell Creek Reservoir, Wyo.
Location. Lat 44°30', long 107°24', in sec.l, T.52 N. , R.88 W., on right bank 1 mile downstream from Buckley Creek, 6 miles southeast of Shell ranger station, and 19 miles east of Shell. Station is above Shell C">eek Reservoir.
Drainage area. 23.1 sq mi.
Gage. Recording. Altitude of gage is 9,050 ft (from topographic map).
Stage-discharge relation. Defined by current-meter measurements below 410 cfs and extended above on basis of area-velocity study.
Remarks.--Base for partial-duration series, 400 cfs.
Peak stages and discharges
Water year
1957
1958
1959
1960
Date
June 4, 1957
May 21, 1958
June 7, 1959
June 3, 1960June 10, 1960
Gage height (feet)
5.98
5.75
6.23
4.645.20
Discharge (cfs)
764
695
845
438578
Water year
1961
1962
1963
Date
May 29, 1961
June 3, 1962June 12, 1962
June 4, 1963June 15, 1963
Gege height (feet)
6.18
4.855.77
6.317.84
Discharge (cfs)
870
465722
9451,870

YELLOWSTONE RIVER BASIN 257
2785. Shell Creek near Shell, Wyo.
Location. Lat 44°34<, long 107°42<, in sec.17, T.53 N., R.90 W., on right bank li miles upstream from White Creek and 5 miles northeast of Shell.
Drainage area. 145 sq mi.
Gage.--Recording. Datum of gage is 4,367.20 ft above mean sea level (U.S. Bu reau of Public Roads bench mark).
Stage-discharge relation. Defined by current-meter measurements below 1,600 cfs.
Bankfull stage.--5 ft.
Remarks. Diversions above station for irrigation of about 100 acres. Some reg ulation by two small reservoirs (capacity, 3,650 acre-ft). Diversions and regulation do not materially affect peak flows. Base for partial-duration series, 750 cfs.
Peak stages and discharges
Water year
1941
1942
1943
1944
1945
1946
1947
1948
1949
Date
May 13, 1941May IS, 1941May 25, 1941
May 26, 1942June 5, 1942
May 30, 1943June 12, 1943June 20, 1943
May 24, 1944May 31, 1944June 16, 1944June 22, 1944June 25, 1944
May 31, 1945June 6, 1945June 24, 1945
May 28, 1946June 6, 1946
May 9, 1947June 9, 1947June 20, 1947June 27, 1947
May 22, 1948May 27, 1948June 2, 1948
May 16, 1949May 29, 1949June 6, 1949June 12, 1949
Gage height (feet)
4. SI4.764.79
5.335.84
4.485.125.39
4.845.554.524.834.69
4.584.6S7.49
4.605.77
4.555.204.754.45
5.614.604.60
4.524.754.905.06
Discharge (cfs)
1,020990
1,000
1,2001,280
8361,1401,280
9701,320
824965900
900950
3,020
9051,480
8681,190
965822
1,420910910
870985
1,0601,160
Water year
1950
1951
>95?
1953
1954
1955
1956
1957
195S
1959
1960
1961
1962
1963
Date
June 6, 1950June 13, 1950June 25, 1950
May 23, 1951May 28, 1951June 17, 1951
May 3, 1952June 7, 1952
June 11, 1953
May 22, 1954
May 15, 1955May 21, 1955June 15, 1955
June 1, 1956
June 7, 1957
May 24, 1958
June 8, 1959
June 10, 1960
May 30, 1961
June 4, 1962June 13, 1962
June 5, 1963June 15, 1963
Gage height (feet)
5.135.294.50
4.835.334.98
5.135.69
6.49
4.72
4.224.275.67
4.88
4.72
5.02
5.37
4.24
4.63
4.254.58
5.526.09
Discharge (cfs)
1,1701,260810
9561,2601,040
1,0801,510
2,130
1,080
812842
1,770
1,190
1,240
1,320
1,610
82S
1,300
8701,100
1,7902,320

258 YELLOWSTONE RIVER BASIN
2790. Shell Creek at Shell, Wyo.
Location. Lat 44°33', long 107°48', in sec.26, T.53 N., R.91 W., at Shell, 450 ft upstream from headgate of Shell Canal and half a mile downstream from Trapper Creek.
Drainage area.--256 sq mi.
Gage.--Nonrecording. At datum 2.80 ft lower prior to Oct. 1, 1918. Altitude of gage is about 4,200 ft (estimated from nearby Geological Survey level line).
Stage-discharge relation. Defined by current-meter measurements below 1,200 cfs.
Remarks.--Diversion above station for irrigation of about 4,000 acres. Flow partly regulated by Adelaide Lake (capacity, 1,410 acre-ft). Diversions and regulation materially affect peak flows. Only annual peaks are shown.
Peak stages and discharges
Water year
191319141915
191619171918
Date
May 26, 27, 1913May 24, 1914Apr. 30, 1915
June 10, 1916June 17, 1917June 11, 1918
height (feet)
7.57-
7.1
7.57.758.35
Discharge (cfs)
al,390al,3801,110
1,3601,5001,910
Water year
19191920
192119221923
Date
May 21, 1919June 10, 1920
May 29, 1921June 7, 1922June 13, 1923
height (feet)
3.94.85
4.734.524.57
Discharge (cfs)
9701,520
1,4901,3101,320
a Maximum dally; data furnished by State engineer of Wyoming.
2795. Bighorn River at Kane, Wyo.
Location.--Lat 44°45', long 108°12', in sec.9, T.55 N., R.94 W., on right bank 2 miles upstream from Five Springs Creek and 6-| miles south of Kane.
Drainage area.--15,765 sq mi. Area at sites used prior to May 17, 1956, 15,846 sq mi.
Gage. Nonrecording prior to Apr. 25, 1932; recording thereafter. At site 12-| miles downstream on highway bridge at different datum prior to Apr. 25, 1932. At site 150 ft upstream from bridge 12i miles downstrea-n at different datum Apr. 25, 1932, to Nov. 25, 1943. At site 26 ft downstream from bridge 12^ miles downstream at different datum Nov. 26, 1943, to May 16, 1956. Al titude of gage is 3,660 ft (from Pairchild Aerial Survey map made for Bureau of Reclamation).
Stage-discharge relation.--Defined by current-meter measurements below 24,000 cfs.
Bankfull stage.--9 ft.
Historical data. Maximum stage known is that of Sept. 30, 1923.
Remarks.--Diversions above station for irrigation of about 275,00") acres. Some regulation by Boysen Reservoir since October 1951. Diversions and regula tion materially affect peak flows. Only annual peaks are shown.
Peak stages and discharges
Water year
1923
1929 1930
1931 1932 1933 1934 1935
1936 a Sit
Date
Sept. 30, 1923
Mar. 11, 1929 Aug. 17, 1930
May 28, 1931June 25, 1932 June 16, 1933 July 26, 1934 June 16, 1935
June 7, 1936 ,e and datum usec
Gage height ( feet )
a!4.8
b!2.6 7.68
7.269.02 9.39 6.58
11.10
7.45 1932-56.
Discharge (efs)
-
16,200
12,20018,100 19,300 9.OOO
25,200
12,000 b Backv
Water year
1937 1938 1939 1940
1941 1942
1943 1944 1945
»ater fro
Date
July 12, 1937 June 25, 1938 June 2, 1939 June 6, 1940
June 10, 1941 Mar. 12, 1942 May 27, 1942 June 25. 1943June 5, 1944 June 25, 1945
m Ice.
Gage height (f^et)
9.57 8.19 9.73 8.38
8.74 b!2.88
9.549.67
10.33
Discharge (cfs)
19,300 15,000 19,900 15,000
15,900
18,100 16.80021,200 21.900

YELLOWSTONE RIVER BASIN 259
Peak stages and discharges of Bighorn River at Kane, Wyo. Continued
Water year
194619471948
1949
1950
19511952
19531954
Date
June 25, 1946June 25, 1947Feb. 21, 1948 May 30, 1948Mar. 18, 1949June 13, 1949June 19, 1950
June 2, 1951Jan. 7, 1952June 8, 1952June 15, 1953Mar. 7, 1954June 27, 1954
Gage height (feet)
9.0810.14
bll.64
b9.09-
8.05
8.61b7.61
-7.27
b6.46-
Discharge (cfs)
17,20020,600
11,700-
12,50012,400
14,500-
9,23010,300
-4,750
Water year
1955
1956195719581959
1960
196119621963
Date
Jan. 5, 1955June 17, 1955
May 27, 1956June 7, 1957May 24, 1958Jan. 9, 1959June 30, 1959June 11, 1960
May 30, 1961Feb. 14, 1962June 17, 1963
Gage height (feet)
b9.71
3.807.244.72
b5.59_
6.02
3.639.33
10.62
Discharge (cfs)
_7,740
4,95014,2007,160
8,77011,300
4,61016,20024,200
b Backwater from Ice.
2800. North Pork Shoshone River near Wapiti, Wyo.
Location.--Lat 44°29', long 109°21', in sec.15, T.52 N. , R.104 W. , 1 mile up- stream from high-water line of Buffalo Bill Reservoir and 4 miles east of Wapiti.
Drainage area. 800 sq mi, approximately.
Gage.--Recording. Altitude of gage is 5,450 ft (estimated from nearby Geologi cal Survey level line).
Stage-discharge relation.--Defined by current-meter measurements below 440 cfs.
Remarks. Diversions above station for irrigation of about 1,800 acres do not materially affect peak flows. Only annual peaks are shown.
Peak stages and discharges
Water year
1921 1922 1923 1924
Date
June 11, 1921 June 8, 1922 July 22, 1923 June 16, 1924
Gage height (feet)
7.2
Discharge (cfs)
a7,390 a4,270 3,100 4,480
Water year
1925
1926
Date
June 23, 1925
June 6,7, 1926
Gage height (feet)
6.88
5.56
Discharge (cfs)
9,250
5,430
a Maximum daily.
2803. South Pork Shoshone River near Valley, Wyo.
Location. Lat 44°12'30", long 109°33'15", in NE£ sec.24, T.49 N. , R.106 W. , on left bank 75 ft downstream from U.S. Forest Service bridge, 0.4 mile down stream from Boulder Creek, 3.2 miles northeast of Valley, and 33.5 iriles southwest of Cody.
Drainage area.--297 sq mi.
Gage.--Recording. Altitude of gage is 6,200 ft (from topographic map).
Stage-discharge relation. Defined by current-meter measurements below 3,300 cfs and extended above on basis of slope-area measurement at 6,610 cfs.
Remarks. Base for partial-duration series, 2,500 cfs.
Peak stages and discharges
Water year
1957
1958
1960
Date
June 6, 1957 June 29, 1957
May 22, 195S
June 17, 1960
Gage height (feet)
7.05 6.69
6.26
5.83
Discharge (cfs)
4,580 4,140
3,520
2,620
Water year
1961
1962
1963
Date
June 9, 1961 July 5, 1961
June 26, 1962
June 15. 1963
Gage height (feet)
6.415.76
6.66
8.83
Discharge (cfs)
3,800 2,830
4,850
6,610

260 YELLOWSTONE RIVER BASIN
2805. South Pork Shoshone River near Ishawooa, Wyo. (Published as "Shoshone River" 1916-24)
Location. Lat 44°22', long 109°20', in SW£ sec.23, T.51 N., R.104 W. , 500 ft downstream from private bridge, lj miles upstream from Bull Creek, and lj miles northeast of Ishawooa.
Drainage area. 532 sq mi.
Gage. Nonrecording. At site half a mile upstream at different datum prior to May 23, 1918. At site 500 ft .upstream at different datum May 24, 1918, to July 23, 1921. Altitude of gage is 5,700 ft (estimated from nearby Geologi cal Survey level line).
Stage-discharge relation. Defined by current-meter measurements below 4,500 cfs.
Remarks.--Diversions above station for irrigation of about 2,100 acres do not materially affect peak flows. Only annual maximum observed stages and dis charges are shown.
Peak stages and discharges
Water year
1915
1916 1917 1918 1919
Date
June 25, 1915
June 18, 1916 July 5, 1917June 14, 1918 May 28, 1919
Gage height (feet)4.6
5.9 5.957.0 4.1
Discharge (cfs)
2,970
4,760 4.4207,740 2,870
Water year
1920
1921 1922 1923
Date
June 3, 1920
June 12, 1921June 19, 1922 June 13, 1923
C-age height (feet)
4.94
6.04.25 5.0
Discharge (cfs)
3,900
4 r 9003,440 4,890
2810. South Pork Shoshone River above Buffalo Bill Reservoir, Wyo.(Published as "at Marquette", 1903, 1905-8, and as Shoshone
River above Shoshone Reservoir, 1921-26)
Location.--Lat 44°26', long 109°15', in sec.33, T.52 N., R.103 W. , at highway bridge 1 mile upstream from high-water line of Buffalo Bill Reservoir and 12 miles southwest of Cody.
Drainage area. 674 sq mi.
Gage. Nonrecording prior to Oct. 1, 1908; recording thereafter. At sites with- in 6 miles downstream at different datutns prior to Oct. 1, 1908. Altitude of gage is 5,420 ft (from topographic map).
Stage-discharge relation. Defined by current-meter measurements below 4,200 cfs.
Remarks. Diversions above station for irrigation of about 11,000 acres do not materially affect peak flows. Only annual peaks are shown.
Peak stages and discharges
Water year
1903
1905
1906 1907
1921
Date
June 17, 1903
June 27, 1905
June 13, 1906 July 4, 1907
June 12, 1921
Gage height (feet)
3.8
3.9
5.1
-
Discharge (cfs)
3,380
3,490
4,560 5,300
a4,440
Water year
1922 1923 1924 1925
1926
Date
June 20, 1922 June 13, 1923 June 17, 1924 June 20, 1925
June 7, 1926
Gage height (feet)
3.85 5.00
3.87
Discharge (cfs)
a3,190 a3,080 2,260 4,200
2,430
a Maximum daily.

YELLOWSTONE RIVER BASIN 261
2825. Shoshone River at Cody, Wyo. (Published as "near Cody" 1902-6)
Location. Lat 44°32'05", long 109°03'40", in NE£ sec.31, T.53 N. , R.101 W,, at old bridge at north city limits of Cody, 700 ft downstream from Dry C'eek.
Drainage area.--1,600 sq mi, approximately.
Gage.--Nonrecording. Altitude of gage is 4,800 ft (from topographic map).
Stage-discharge relation.--Defined by current-meter measurements below 10,000 cfs.
Remarks.--Diversions above station for irrigation of about 35,000 acres materi ally affect peak flows. Only annual maximum observed stages and discharges are shown.
Peak stages and discharges
Water year
1902 1903 1904 1905
Date
June 10,11,1902 June 29, 19O3 June 19,20,1904 June 5, 19O5
Gage height (feet)
7.0 7.0 7.0
Discharge (cfs)
12.OOO 12.OOO 12,000 7,850
Water year
1906 1907 19O8 1909
Date
June 13, 19O6 July 4, 19O7 July 4, 1908 July 3, 19O9
Gage height (feet)
7.4 8.0 6.9 9.1
Discharge (cfs)
12,600 15,800 10,4OO 22,200
2830. Shoshone River at Corbett Dam, Wyo.
Location.--Lat 44°35', long 108°56' , in NW£ sec.7, T.53 N., R.100 W., at Corbett Dam, 7 miles northeast of Cody.
Drainage area.--1,740 sq mi, approximately.
Gage.--Nonrecording prior to 1921; recording thereafter. Altitude of gage is 4,700 ft (estimated from nearby U.S. Coast and Geodetic Survey level line).
Stage-discharge relation. Defined by current-meter measurements below 2,800 cfs and by computation of flow over dam and through sluice gates and tunnel.
Remarks. Natural flow of stream affected by diversions above station fcr irri gation, return flow from irrigated areas and storage in Buffalo Bill Reser voir (capacity, 456,600 acre-ft) beginning in 1909. Figures herein represent flow above diversion dam. Diversions and regulation materially affect peak flows. Only annual peaks are shown.
Peak stages and discharges
Water year
19091910
19111912191319141915
1916
Date
July 4, 1909May 13, 14, 1910
July 31, 1911June 3, 1912June 30, 1913June 4, 1914June 26, 1915
June 20, 1916
Gage height (feet)
5.151.92
1.602.202.802.92.30
3.40
Discharge (cfs)
17,4004,210
4,2905,2007,22O7,73O5,450
1O,2OO
Water year
1917191819191920
19211922192319241925
Date
June 20, 1917June 15, 1918June 9, 1919July 5, 1920
June 13, 1921June 22, 1922June 28, 1923June 17, 1924June 24, 1925
Gage height (feet)
3.245.001.182.90
3.212.662.50-
3.37
Tischarge (cfs)
9,73018,7002,220
a8,O4O
10,8008,0506,9108,82O
12,OOOa Does not include flow through Corbett tunnel sluices. Note. Gage heights represent height of river.

262 YELLOWSTONE RIVER BASIN
2845. Bitter Creek near Garland, Wyo.
Location.--Lat 44°45', long 108°36', in SW^ sec.7, T.55 N. , R.97 W., on left bank three-quarters of a mile upstream from mouth, 4 miles southeast of Gar land, and 5 miles southwest of Byron.
Drainage area. 80.5 sq mi.
Gage.--Recording. Altitude of gage is 4,080 ft (by barometer).
Stage-discharge relation.--Defined by current-meter measurement? below 390 cfs.
Remarks.--Flow is mainly return flow from Garland Canal system of Shoshone irri gation project. Only annual peaks are shown.
Peak stages and discharges
Water year
1950
1951 1952
1953
Date
Aug. 12, 1950
July 10, 1951 Jan. 30, 1952 May 21, 1952 May 29, 1953
Gage height (feet)3.42
3.23 a3.72
2.95
Discharge (cfs)
723
666
529516
Water year
1954
1958 1959 1960
Date
Oct. 22, 1953
June 8, 1958 Aug. 21, 1959 June 10, 1960
Gage height (feet)
2.68
3.77 2.68 4.48
Discharge (cfs)
b400
766 360
1,510
a Backwater from ice.b Maximum for the period October to December 1954.
2850. Shoshone River at Byron, Wyo.
Location.--Lat 44°47', long 108°31', in sec.35, T.56 N., R.97 W., on left bank at Byron, 450 ft downstream from highway bridge and three-quarters of a mile downstream from Coon Creek.
Drainage area. 2,345 sq mi.
Gage.--Nonrecordlng prior to Apr. 23, 1932; recording thereafter. At site450 ft upstream at bridge prior to Apr. 23, 1932. Altitude cf gage is 3,960 ft (by barometer).
Stage-discharge relation. Defined by current-meter measurements below 9,500 cfs and extended above on basis of logarithmic plotting and velocity-area study.
Remarks. Diversions above station for irrigation of about 133,000 acres. Plow regulated by Buffalo Bill Reservoir. Diversions and regulation materially affect peak flows. Only annual peaks are shown.
Peak stages and discharges
Water year
1929
1930
1931193219331934
1935
1936
1937
193819391940
19411942194319441945
1946
Date
(a)Mar. 6, 1929June 12, 1930
June 9, 1931June 25, 1932June 20, 1933Dec. 28, 1933Aug. 10, 1934June 14, 1935
Feb. 2, 1936June 2, 1936Jan. 4, 1937June 23, 1937June 26, 1938May 24, 1939Jan. 27, 1940Sept. 30, 1940
Oct. 4, 1940June 25, 1942June 27, 1943June 27, 1944July 16, 1945
June 17, 1946
Gage height (feet)
-. b 6 . 30
5.90
5.606.454.91
b4.77-
5.45
b6.40-
b5.0-
C5.424.40
b3.63-
5.023.295.264.403.29
3.81
Discharge (cfs)
6,420-
6,920
6,19013,9008,060
-4,0309,720
-8,200
-7,890
11,1006,940
-2,970
10,1004,27011,4007,4004,990
6,650
Water year
194719481949
1950
1951
195219531954
1955
1956195719581959
1960
196119621963
Date
June 21, 1947June 10, 1948Jan. 29. 1949June 23, 1949July 12, 1950
Feb. 4, 1951July 10, 1951May 22, 1952May 29, 1953Jan. 24, 1954July 7, 1954Feb. 19, 1955June 24, 1955
June 21, 1956June 16, 1957June 12, 1958Oct. 20, 1958Jan. 6, 1959June 10, 1960
Sept. 19, 1961June 28, 1962June 22, 1963
Gage height (feet)
4.675.43
b8.12-
4.78
b5.65-
4.782.95
b5.98-
b3.23-
4.625.684.55-
b6.422.80
7.575.756.59
Discharge (cfs)
9,2409,530
-3,6806,530
-5,3306,5301,600
-5,420
-1,710
5,8808,4005,2702,020
-1,420
16,0007,8809,970
a Occurred June 16, 30, July 1, 1929. b Backwater from ice. c Gage height was higher during period of ice effect and no gage-height record, Nov. 29 to Feb. 16.

YELLOWSTONE RIVER BASIN 263
2855. Sage Creek near Lovell, Wyo.
Location.--Lat 44°51', long 108°27', in sec.8, T.56 N., R.96 W., on rigVt bank 200 ft downstream from bridge on-U.S. Highway 310, 1-| miles upstream from mouth, and 3 miles west of Lovell.
Drainage area. 381 sq mi.
Gage. Recording. Altitude of gage is 3,870 ft (by barometer).
Stage-discharge relation. Defined by current-meter measurements below 510 cfs and extended above on basis of slope-area measurement at gage height 6.30 ft.
Remarks. Flow is mostly return flow from land irrigated by canals diverting water from Shoshone River. Only annual peaks are shown.
Peak stages and discharges
Water year
1951 1952 1953 1954 1955
Date
July 10, 1951 Aug. 10, 1952 May 29, 1953 Oct. 22, 1953 June 6, 1955
Gage height (feet)
5.00 3.86 3.75 3.43 3.57
Discharge (cfs)
769 404 360 280 284
Water year
1956 1957 1958 1959 1960
Date
June 21, 1956 June 17, 1957 July 31, 1958 June 29, 1959 Aug. 16, 1960
Gage height (feet)
4.04 4.68 6.43 3.44 4.10
Discharge (cfs)
491 654
1,290 316 446
2862. Shoshone River at Kane, Wyo.
Location. Lat 44°52' , long 108°13', in E£ sec.6, T.56 N., R.94 W. , on right pier of county bridge, 1 mile north of Kane and l| miles upstream from mouth.
Drainage area. 2,989 sq mi.
Gage.--Recording. Datum of gage is 3,635.35 ft above mean sea level, d?tum of 1929.
Stage-discharge relation. Defined by current-meter measurements.
Remarks. Peak flows materially affected by transbasin diversions, storage res ervoirs, power developments, and diversions for irrigation. Major regula tion by Buffalo Bill Reservoir (capacity, 456,600 acre-ft). Peaks are prin cipally from snowmelt. Only annual peaks are shown.
Peak stages and discharges
Water year
1958 1959 1960
1961
Date
June 8, 1958 Oct. 20, 1958 Aug. 16, 1960
Sept. 19, 1961
Gage height (feet)
7.30 6.02 6.04
10.34
Discharge (cfs)
5,020 2,720 3,090
13,200
Water year
1962 1963
Date
June 16, 1962 Jan. 19, 1963 June 22, 1963
Gage height (feet)
8.48 a9.45
Discharge (cfs)
10,000
8,510
a Backwater from ice.
2870. Bighorn River near St. Xavier, Mont.
Location.--Lat 45°19', long 107°55', in NW^NE^ sec.16, T.6 S., R.31 E., on right bank 1 mile downstream from Grapevine Creek, 2^ miles downstream from Yellowtail Dam, and 14 miles southwest of St. Xavier.
Drainage area.--19,667 sq mi.
Gage. Recording. At site 1-J- miles upsteam at altitude of 3,170 ft (by baro meter) prior to Apr. 16, 1963. Datum of gage is mean sea level (levels by Bureau of Reclamation).
Stage-discharge relation. Defined by current-meter measurements below 32,000 cfs.
Remarks. Regulation by 14 reservoirs with combined usable storage of about 1,400,000 acre-ft and diversions for irrigation of about 375,000 acres above station materially affect peak flows. Peaks are principally from snowmelt. Only annual peak discharges are shown.

264 YELLOWSTONE RIVER BASIN
Peak stages and discharges of Bighorn River near St. Xavie-, Mont.
Water year
1935
19361937193819391940
19411942194319441945
1946194719481949
Date
June 16, 1935
June 3, 1936June 24, 1937June 25, 1938June 2, 1939July 3, 1940
June 19, 1941June 11, 1942June 24, 1943June 28, 1944June 26, 1945
June 25, 1946June 22, 1947June 12, 1948June 16, 1949
Gage height (feet)
-
_----
_----
_---
Discharge (cfs)
37,400
19,70023,70022,60014,40012,200
12,40020,50025,80023,90021,600
20,70028,30018,30015,000
Water year
1950
19511952195319541955
19561957195819591960
196119621963
Date
June 26, 1950
June 3, 1951May 22, 1952June 16, 1953June 28, 1954June 26, 1955
June 22, 1956July 2, 1957June 26, 1958July 1, 1959June 11, 1960
Sept. 20, 1961Feb. 14, 1962June 18, 1963
Gage t eight (feet)
-
_----
_----
_--
Discharge (cfs)
13,700
16,40010,7009,2006,9008,400
8,82019,4008,19010,50013,000
15,00017,20025,000
2875. Soap Creek near St. Xavier, Mont.
Location.--Lat 45°20<, long 107°46', in NE^ sec.10, T.6 S., R.32 E., on left bank 6 miles upstream from mouth and 9 miles southwest of St. Xavier.
Drainage area. 98.3 sq mi.
Gage. Recording. Altitude of gage is 3,290 ft (by barometer).
Stage-discharge relation.--Defined by current-meter measurements below 580 cfs and extended above on basis of slope-area measurement at 1,300 cfs.
Remarks.--Diversions for irrigation of about 1,100 acres above g*ge do not materially affect peak flows. Base for partial-duration series, 200 cfs.
Peak stages and discharges
Water year
1939
1940
1941
1942
1943
1944
1945
Date
June 2, 1939
Apr. 22, 1940
Sept. 7, 1941Sept. 27, 1941
May 5, 1942May 13, 1942May 17, 1942
Mar. 25, 1943Mar. 29, 1943June 12, 1943
June 4, 1944June 7, 1944June 13, 1944June 15, 1944June 18, 1944June 28, 1944
May 21, 1945May 27, 1945June 1, 1945
Gage height (feet)
5.70
6.80
5.515.43
6.3713.47.18
8.86.506.83
11.107.577.398.8413.0010.57
5.426.185.89
Discharge (cfs)
228
319
220213
2871,300
355
527303328
679292278392
1,020603
213271248
Water year
1945
1946
1947
1948
1949
1950
1951
1952
1953
Date
June 13, 1945
Mar. 27, 1946
Mar. 16, 1947Mar. 17, 1947June 10, 1947June 21, 1947
Mar. 23, 1948Apr. 19, 1948
Mar. 8, 1949Mar. 23, 1949
Jan. 21, 1950June 13, 1950
Mar. 15, 1951Mar. 26, 1951
Mar. 30, 1952
June 4, 1953
Gage height (feet)
6.44
5.89
_bll.50
7.8810.21
5.2810.34
-b7.02
b7.265.01
(bd)4.20
6.80
3.35
Discharge (cfs)
295
255
a350-
426707
209727
(o)240
_186
-140
319
85
a Maximum daily.b Backwater from ice.c Not determined; exceeded base discharge.d Above 6 ft.

YELLOWSTONE RIVER BASIN 265
2877. Soap Creek near mouth, near St. Xavier, Mont. (Published as "Soap Creek near St. Xavier" April 1914 to September 1?24)
Location.--Lat 45°23', long 107°48', in SW^ sec.20, T.5 S., R.32 E., 1 mile up stream from mouth and 7 miles southwest of St. Xavier.
Drainage area. 110 sq mi.
Gage.--Nonrecordlng. At site half a mile upstream at different datum prior to July 8, 1915. Altitude of gage is 3,110 ft (from topographic map).
Stage-discharge relation.--Defined by current-meter measurements below 81 cfs at described site.
Remarks. Diversions for irrigation of about 800 acres above station do rot materially affect peak flows. Only annual maximum observed stages and dis charges are shown.
Peak stages and discharges
Water year
1914 1915
1916
1918
Date
May 11, 1914 June 12, 1915
May 15, 1916
May 9, 1918
Gage height (feet)
12.8 12.0
7.27
8.44
Discharge (cfs)
440 400
252
395
Water year
1920
1921 1922 1923 1924
Date
May 11, 1920
May 8, 1921 Mar. 15, 1922 Sept. 25, 1923 Apr. 3, 1924
Gage height (feet)
11.2
7.65 7.70 6.98 7.90
Discharge (cfs)
750
305 271 224 270
2885. Bighorn River near Hardin, Mont. (Published as "at Port Custer" prior to 1907)
Location.--Lat 45°44'20", long 107°34'20", in NW£ sec.19, T.I S. , R.34 E., at highway bridge half a mile upstream from Little Bighorn River, 2 miles east of Hardin.
Drainage area.--20,722 sq ml.
Gage.--Nonrecording. At railroad bridge 100 ft upstream at different datum prior to Dec. 1, 1917. Altitude of gage is 2,900 ft (from topographic map).
Stage-discharge relation. Defined by current-meter measurements below 34,000 cfs.
Remarks.--Diversions for irrigation of about 35,000 acres above station. Only annual maximum observed stages and discharges are shown. Momentary maxima should not greatly exceed maxima observed.
' Peak stages and discharges
Water year
1904 1905
1906 1907 1908 1909 1910
1911 1912 1913 1914 1915
1916
Date
June 24, 1904 June 10, 1905
June 15, 1906 June 9,23,1907 June 17, 1908 June 2O, 19O9 June 4, 1910
June 22, 1911 June 15, 1912 June 2, 1913 June 6, 1914 June 13, 1915
June 21, 1916
Gage height (feet)
5.69 5.6
8.0 7.3 9.8 9.35 6.0
7.6 S.4 7.2 8.3 8.0
9.1
Discharge (cfs)
25,300 24,500
26,800 21,300 40,800 33,800 11,600
22,400 29,500 20,600 28,300 26,100
31,400
Water year
1917 1918 1919 1920
1921 1922 1923 1924
1929 1930
1931 1932 1933
Date
June 26, 1917June 17, 1918 June 3, 1919 June 18, 1920
June 14, 1921 June 16, 1922 July 27, 1923 Oct. 1, 1923
Mar. 11, 1929 Aug. 17, 1930
June 10, 1931 June 9, 1932 June IS, 1933
Gage height (feet)
9.910.1 5.15 8.21
9.35 7.95 9.01
10.65
11.1 8.60
7.80 9.53 9.18
D'.scharge (cfs)
36 , 70033,200 5,420
25,500
33,600 22,600
a30,000 42,300
45,900 26,300
19,600 31,500 27 , 400
a Maximum peak discharge observed; maximum discharge observed, 35,900 cfs Sept. 30, 1923, stage rising.

266 YELLOWSTONE RIVER BASIN
2890. Little Bighorn River at State line, near Wyola, Mont. (Published as "Little Horn River" prior to October 1940)
Location. Lat 45°01', long 107°37', in SW£NW£ sec.36, T.9 S., R.33 E., on right bank half a mile north of Montana-Wyoming State line, 1 mile down stream from West Pork, and 13 miles southwest of Wyola.
Drainage area. 193 sq mi.
Gage. Recording. Altitude of gage is 4,450 ft (from topographic map).
Stage-discharge relation. Defined by current-meter measurements below 800 cfs.
Remarks. Peaks are principally from snowmelt. Base for partial-duration series, 510 cfs.
Peak stages and discharges
Water year
1939
1940
1941
1942
1943
1944
1945
1946
1947
1948
1949
1950
Date
June 2, 1939
May 29, 1940
May 17, 1941May 26, 1941
May 26, 1942June 4, 1942
May 30, 1943June 18, 1943July 3, 1943
May 17, 1944May 23, 1944May 30, 1944June 3, 1944June 9, 1944
May 31, 1945June 5, 1945June 21, 1945
May 27, 1946June 5, 1946June 14, 1946
May 9, 1947May 17, 1947June 8, 1947June 27, 1947
May 20, 1948
May 13, 1949June 7, 1949June 13, 1949
June 6, 1950June 12, 1950
Gage height (feet)
-
2.59
3. OS2.88
3.923.29
3.203.283.01
3.533.153.554.87
b5.93
4.004.283.99
3.914.213.69
4.053.714.184.54
4.38
3.413.673.55
3.643.66
Discharge (cfs)
a700
507
840604
2,1601,160
802883630
1,120758
1,1402,730
-
685825690
635901635
710544775972
1,420
511686595
662678
Water year
1950
1951
1952
1953
1954
1955
1956
1957
1958
1959
1960
1961
1962
1963
Date
June 14, 1950June 17, 1950
May 19, 1951May 23, 1951May 28, 1951June 16, 1951
May 4, 1952May 26, 1952
June 2, 1953June 12, 1953
May 21, 1954May 25, 1954June 27, 1954
May 15, 1955May 22, 1955June 15, 1955
May 28, 1956
June 2, 1957June 21, 1957
May 23, 1958
June 10, 1959
June 10, 1960
May 29, 1961
May 9, 1962June 3, 1962June 16, 1962
June 5, 1963June 15, 1963
Gage height (feet)
3.713.74
3.463.713.843.47
3.603.54
3.604.10
3.413.193.13
3.223.443.32
3.64
3.913.87
3.63
3.76
3.10
3.61
3.193.233.49
4.184.15
Discharge (cfs)
719746
574800960607
662606
5981,350
74S588546
6097726SO
936
1,1301,120
927
1,080
460
922
528559692
1,5501,380
a Maximum daily discharge for period Mar. 24 to Sept. 3O, 1939. b Backwater from logjam.

YELLOWSTONE RIVER BASIN 267
2895. Little Bighorn River near Wyola, Mont. (Published as "Little Horn River* 1915-24)
Location. Lat 45°06', long 107°26', in SE^sec.29, T.8 S., R.35 E., 2^ miles upstream from Pass Creek and 3 miles southwest of Wyola.
Drainage area. 251 sq mi.
Gage.--Nonrecording. At site 900 ft downstream at different datum prior to June 6, 1923. At site 300 ft downstream at different datum June 6, 1923, to May 18, 1924. Altitude of gage is 3,880 ft (from topographic map).
Stage-discharge relation.--Defined by current-meter measurements below 1,100 cfs.
Remarks.--Diversions for irrigation of about 5,000 acres above station should not materially affect peak flows. Peaks are principally from snowmelt. Only annual maximum observed stages and discharges are shown.
Peak stages and discharges
Water year
19121913 1914 1915
1916 1917 1918
Date
June 10, 1912 May 30, 1913 May 24, 1914 June 11, 1915
June 18, 1916 June 22, 1917 June 12,14, 1918
Qage height (feet)
6.9 6.7 6.4 6.6
6.37.1 7.0
Discharge (cfs)
1,400 1,260 1,010 1,130
950 1,580 1,480
Water year
1919 1920
1921 1922 1923 1924
Date
May 20, 1919 June 10,12,1920
May 29, 1921 June 9, 1922 May 27-30, 1923June 16, 1924
Qage height (feet)
5.26 6.03
5.50 5.80 6.15.00
T'.scharge (cfs)
420 748
560 710 890
1,610
2900. Pass Creek near Wyola, Mont.
Location.--Lat 45°03', long 107°21', in NE£ sec.13, T.9 S., R.35 E., on right bank 100 ft upstream from highway bridge, 1 mile downstream from Twin Creek, 5 miles south of Wyola, and 6 miles upstream from mouth.
Drainage area.--Ill sq mi.
Gage.--Nonrecording at site 100 ft downstream prior to Dec. 21, 1950; recording at present site thereafter. Altitude of gage is 3,860 ft (from topographic map).
Stage-discharge relation. Defined by current-meter measurements below 500 cfs.
Remarks.--Diversions for irrigation of about 2,500 acres above station should not materially affect peak flows. Base for partial-duration series, 100 cfs. Only annual peaks are shown prior to 1952.
Peak stages and discharges
Water year
1935
1936193719381939
1940
194119421943
19441945
1946194719481949
Date
June 7, 1935
Mar. 1, 1936June 14, 1937May 20, 1938Mar. 19, 1939June 2, 1939Jan. 27, 1940,Feb. 29, 1940Apr. 27, 1940
Apr. 13, 1941May 15, 1942Mar. 25, 1943Mar. 26, 1943June 4, 1944Feb. 8, 1945June 12, 1945
Mar. 28, 1946June 20, 1947Feb. 18, 1948Jan. 14, 1949Apr. 14, 1949
Qage height (feet)
2.18
a6.022.343.00
a3.68-
a2.64
-
3.304.08a6.22
-4.822.99-
3.04.60-
a2.94-
Discharge (cfs)
182
-182360-180-
91
463785-412
1,150-395
4511,120b400-
clOO
Water year
1951
1952
1953
1954
1955
1956
Date
Mar. 24, 1951Mar. 26, 1951
Mar. 29, 1952Apr. 5, 1952Apr. 29, 1952May 22, 1952
June 6, 1953June 15, 1953
Feb. 1, 1954Apr. 6, 1954
Apr. 11, 1955Apr. 15, 1955Apr. 19, 1955May 25, 1955
Mar. 19, 1956May 22, 1956May 29, 1956
Gage height (feet)a4.01
-
a5.232.491.752.12
1.802.66
a2.561.80
a2.882.132.001.98
a3.871.682.34
Discharge (cfs)
-274
(o)307110196
118361
_131
-199163158
_106247
a Backwater from ice determined.
b Maximum daily. o "Peak exceeded base; discharge not

268 YELLOWSTONE RIVER BASIN
2905. Little Bighorn River below Pass Creek, near Wyola, Mont. (Published as "Little Horn River" prior to October 1940)
Location. Lat 45°10', long 107°23', in WiSW£ sec.35, T.7 S., R.35 E., on right bank 3^ miles north of Wyola and 4 miles downstream from Pass Creek.
Drainage area. 428 sq mi.
Gage. Recording. Altitude of gage is 3,600 ft (from topographic map).
Stage-discharge relation. Defined by current-meter measurements below 1,600 cfs.
Remarks.--Diversions for Irrigation of about 7,700 acres above station do not materially affect peak flows. Peaks are principally from smwmelt. Base for partial-duration series, 580 cfs.
Peak stages and discharges
Water year
1939a/
194U
1941
1942
1943
1944
1945
1946
1947
1948
1949
Date
May 18, 1939May 24, 1939June Z, 1939
Feb. 18, 1940June 8, 1940
Apr. 14, 1941May 14, 1941May 18, 1941May 25, 1941
May 13, 1942May 27, 1942June 5, 1942
Mar. 25, 1943Mar. 28, 1943May 31, 1943June 13, 1943
May 19, 1944June 4, 1944June 8, 1944June 18, 1944June 27, 1944
May 20, 1945June 13, 1945June 23, 1945
Mar. 28, 1946May 23, 1946May 29, 1946June 6, 1946June 12, 1946June 18, 1946
Mar. 17, 1947May 10, 1947June 10, 1947June 22, 1947
Mar. 24, 1948Apr. 19, 1948May 22, 1948June 24, 1948
June 8, 1949
Gage height (feet)
3.023.233.83
b3.202.97
3.113.223.453.25
4.535.124.38
5.063.653.833.92
4.657.005.975.414.27
3.354.563.94
3.073.194.004.084.093.80
4.833.783.735.60
3.113.944.253.23
3.32
Discharge (cfs}
592700972
-571
624668780690
1,3601,6901,280
1,690869969994
1,4503,2002,3601,9201,110
7021,27O
968
599635995
1,0401,040
905
1,400905882
1,900
603968
1,100623
685
Water year
1949
1950
1951
1952
1953
1954
1955
1956
1957
1958
1960
1961
1962
1963
Date
June 14, 1949
Feb. 25, 1950June 18, 1950
Feb. 11, 1951Mar. 26, 1951May 29, 1951June 19, 1951
Jan. 26, 1952Mar. 28, 1952May 5, 1952May 26, 1952
June 16, 1953
May 22, 1954
May 16, 1955May 22, 1955June 1, 1955June 16, 1955
Mar. 17, 1956May 29, 1956
Apr. 23, 1957May 13, 1957May 22, 1957June 4, 1957June 18, 1957
May 24, 1958June 13, 1958
Mar. 18, 1960
May 30, 1961
Feb. 3, 1962June 5, 1962June 16, 1962
Feb. 6, 1963Apr. 28, 1963May 12, 1963June 5, 1963June 14, 1963
Gage height (feet)
3.19
b4.873.53
b5.203.333.513.23
b3.853.623.703.52
4.49
3.44
3.413.643.143.32
3.174.41
4.133.693.414.446.21
3.763.57
4.64
3.48
b5.693.264.00
_6.253.875.837.43
Discharge (cfs)
634
-749
-671754625
-805749708
1,240
721
708815586666
5981,200
1,060815671
1,1702,490
875781
1,370
731
-584940
01,0002,600
9522,2903,630
a Records for period Mar. 27 to Sept. 30. b Backwater from ice. c About.

YELLOWSTONE RIVER BASIN 269
2910. Owl Creek near Lodgegrass, Mont.
Location.--Lat 45°16', long 107°18', in NE^SW^ sec.33, T.6 S., R.36 E., 1 mile downstream from Sioux Pass Creek and 5 miles southeast of Lodgegrass.
Drainage area. 161 sq mi.
Gage. Recording. Altitude of gage is 3,470 ft (from topographic map).
Stage-discharge relation. Defined by current-meter measurements below 890 cfs.
Remarks. Diversions for irrigation of about 400 acres above station do not maTerially affect peak flows. Base for partial-duration series, 70 cfs.
Peak stages and discharges
Wateryear
1939
1940
1941
1942
1943
1944
Date
May 25, 1939June 2, 1939
June 6, 1940
Apr. 14, 1941
May 14, 1942May 18, 1942June 4, 1942
Feb. 10, 1943Mar. 28, 1943
Mar. 18, 1944
Gage height (feet)
5.027.88
4.31
6.84
7.574.4710.31
a9.24-
a!4.50
Discharge (cfs)
96322
64
222
29070
572
-bllO
-
Water year
1944
1945
Date
Mar. 24, 1944Mar. 31, 1944May 4, 1944May 19, 1944June 3, 1944June 18, 1944June 28, 1944July 7, 1944
Mar. 13, 1945Mar. 14, 1945Mar. 25, 1945May 21, 1945June 2, 1945
Gage height (feet)
8.518.034.6413.81
-14.185.995.27
a9.22--
5.695.23
Discharge (cfs)
34229770
939b4001,020
12786
-c200c8811590
a Backwater from ice.b Maximum daily; estimated.c Maximum daily.
2915. Lodgegrass Creek above Willow Creek diversion, near Wyola, Mcnt.
Location.--Lat 45°07', long 107°36', in wiNW^ sec.19, T.8 S., R.34 E., en left bank half a mile upstream from Willow Creek diversion canal, 1^ miles down stream from Spring Creek, and 10 miles west of Wyola.
Drainage area. 80.7 sq mi.
. Recording. Altitude of gage is 4,360 ft (from topographic map).
Stage-discharge relation. Subject to large shifts. Defined by current-meter measurements below 400 cfs.
Remarks.--Diversions for irrigation of about 400 acres do not materially af- feet peak flows. Base for partial-duration series, 270 cfs.
Peak stages and discharges
Water year
1939
1940
1941
1942
1943
1944
Date
May 24, 1939June 1, 1939
June 14, 1940
Apr. 13, 1941May 18, 1941May 25, 1941
May 13, 1942May 27, 1942June 5, 1942
May 31, 1943June 13, 1943
May 18, 1944June 4, 1944June 8, 1944June 17, 1944
Gage height (feet)
3.714.51
3.55
3.874.323.93
5.025.284.95
4.194.05
4.845.684.854.64
Discharge (cfs)
286429
262
308324276
456570455
330330
626972706626
Water year
1944
1945
1946
1947
1948
Date
June 27, 1944
May 27, 1945May 31, 1945June 6, 1945June 13, 1945June 22, 1945
May 29, 1946June 6, 1946June 12, 1946June 18, 1946
May 11, 1947June 10, 1947June 21, 1947June 27, 1947
May 22, 1948May 30, 1948
Gage height (feet)
3.87
3.674.294.304.523.60
3.673.923.603.27
3.723.835.003.85
4.174.02
D' s charge (cfs)
388
341494494566319
388452364298
364388722388
351328
219-848 O - 66 - 19

270 YELLOWSTONE RIVER BASIN
Peak stages and discharges of Lodgegrass Creek above Willow Creek diversion, near Wyola, Mont. Continued
Water year
1949
1950
1951
1952
1953
1954
1955
1956
1957
Date
Mar. 23, 1949May 17, 1949
Feb. 5, 1950 June 15, 1950
May 29, 1951
Jan. 25, 1952May 26, 1952
June 14, 1953
May 21, 1954
May 25, 1955
May 29, 1956
Apr. 24, 1957
Gage height (feet)
a3.913.05
a3.88 3.26
3.32
a3.823.18
4.35
3.25
3.53
4.45
4.07
Discharge (ofs)
_185
268
297
_237
412
228
273
427
479
Water year
1957
1958
1959
1960
1961
1962
1963
Date
June 3, 1957June 17, 1957
May 24, 1958 June 13, 1958
June 8, 1959 June 15, 1959
Mar. 19, 1960
May 30, 1961
Jan. 16, 1962
Apr. 28, 1963 May 12, 1963 June 5, 1963 June 16, 1963
Gage height (feet)
4.174.71
4.22 3.44
4.26 4.32
4.00
3.60
4.15
5.02 3.83 5.42 4.94
Discharge (cfs)
523680
521 302
532546
459
333
428
722 333 804 614
a Backwater from ice.
2925. Lodgegrass Creek near Lodgegrass, Mont.
Location.--Lat 45°16', long 107°27', in NW£ sec.32, T.6 S., R.35 E., half a mile upstream from headgate of Lodgegrass ditch No. 1 and 5|- miles south west of Lodgegrass.
Drainage area.--143 sq mi.
Gage. Nonrecording. At site a quarter of a mile downstream at different datum prior to Dec. 4, 1916. Altitude of gage is 3,630 ft (from topographic map).
Stage-discharge relation. Defined by current-meter measurements below 310 cfs.
Remarks.--Diversions for irrigation of about 800 acres above station do not materially affect peak flows. Only annual maximum observed stages and dis charges are shown.
Peak stages and discharges
Water year
1912 1913 1914 1915
Date
June 11, 1912 June 1-6, 1913 June 3-9,1914 June 13^, 1915 .
Gage height (feet)
6.20 6.8 4.7 7.0
Discharge (cfs)
508 628 211 695
Water year
1921 1922 1923 1924
Date
May 7, 1921 Aug. 4, 1922 Sept. 29, 1923 Apr. 7, 1924
Gage height ( feet )
2.47 2.65 4.38 7.25
Discharge (ofs)
148 176 462
1,000
2930. Lodgegrass Creek at Lodgegrass, Mont.
Location.--Lat 45°18', long 107°22', in s| sec.13, T.6 S., R.35 E., 600 ft up stream from Chicago, Burlington and Quincy Railroad bridge and a quarter of a mile south of Lodgegrass.
Drainage area.--170 sq mi.
Gage.--Nonrecording. Altitude of gage is 3,300 ft (from topographic map).
Stage-discharge relation.--Defined by current-meter measurements below 380 cfs.
Remarks.--Diversions for irrigation of about 2,500 acres above stationmaterially affect peak flows. Only annual maximum observed stages and dis charges are shown.

YELLOWSTONE RIVER BASIN 271
Peak stages and discharges of Lodgegrass Creek at Lodgegrass, Mont.
Water year
1916 1917 1918
Date
June 20, 1916 Apr. 9, 1917 June 15, 1918
Qage height (feet)
3.6 4.2 4.1
Discharge (cfs)
355 619 624
Water year
1919
1920
Date
Dec. 7, 1918 May 25, 1919 Mar. 23, 1920
Gage height (feet)a3.5
4.0
Eischarge (cfs)
60 525
a Backwater from ice.
2935. Little Bighorn River near Crow Agency, Mont. (Published as "Little Horn River" October 1914 to September 1940)
Location.--Lat 45°34', long 107°27', in E^SE^ sec.13, T.3 S., R.34 E., en right bank at Chicago, Burlington & Quincy Railroad Bridge, 2 miles south cf Crow Agency and 17 miles upstream from mouth.
Drainage area.--1,181 sq mi.
Gage.--Nonrecording prior to Oct. 1, 1918, and Oct. 1, 1930, to Dec. 5, 1932, and Apr. 1, 1938, to May 6, 1947; recording during remainder of period. Datum of gage is 3,045.00 ft above mean sea level, datum of 1929.
Stage-discharge relation. Defined by current-meter measurements below 3,600 cfs.
Remarks.--Diversions for irrigation of about 13,700 acres above station. Some regulation by Willow Creek Reservoir (capacity, 23,000 acre-ft) since 1940. Peaks are principally from snowmelt. Base for partial-duration series, 920 cfs. Only annual peaks are shown prior to 1948.
Peak stages and discharges
Water year
1912
19141915
19161917191819191920
1921192219231924
19291930
19311932
193819391940
19411942194319441945
19461947
1948
Date
July 4, 1912
July 25, 1914June 14, 1915
June 20, 1916Apr. 6, 1917June 19, 1918May 21, 1919May 11, 1920
May 9, 1921July 31, 1922July 23, 1923Apr. 8, 1924
Mar. 11, 1929Mar. 12, 1930
June 4, 7, 1931Feb. 27, 1932May 23, 1932
May 21, 1938Mar. 21, 1939June 15, 1940
May 15, 1941June 6, 1942Mar. 26, 1943June 6, 1944Mar. 14, 1945June 9, 1945
June 13, 1946Mar. 16, 1947
Feb. 28, 1948Mar. 30, 1948Apr. 20, 1948
Gage height (feet)8.6
6.911.0
6.6510.88.65.46
11.69
7.17.85
14.011.22
9.196.11
5.74all. 21
-
6.85alO.52
5.70
6.329.76
a!3.0111.84a8.54
_
_-
a8.526.807.78
Discharge (ofs)
3,380
2,5004,020
1,3603,9302,500
4674,480
1,4601,9006,2004,150
3,080930
713-
bl,880
1,3703,310
687
9702,7404,9704,400
-1,780
bl,600b4,000
_1,1901,730
Water year
1948
1949
1950
1951
1952
1953
1954
1955
1956
1957
1958
1959
1960
Date
May 24, 1948
Mar. 1, 1949Mar. 28, 1949
Feb. 27, 1950June 19, 1950
Feb. 10, 1951Mar. 26, 1951
Mar. 28, 1952Mar. 20, 1952
June 16, 1953
May 23, 1954
Apr. 15, 1955Apr. 19, 1955June 28, 1955
Mar. 22, 1956May 30, 1956
Feb. 27, 1957Apr. 24, 1957May 23, 1957June 7, 1957June 19, 1957
June 14, 1958
Mar. 2, 1959Mar. 18, 1959June 17, 1959
Mar. 19, 1960Mar. 21, 1960
Gage height (feet)
6.70
a6.18-
aS.Ol5.70
a8.63-
a7.737.67
7.32
6.00
6.987.016.50
8.337.59
alO.698.076.588.649.84
6.43
a8.17-
6.95
all. 029.56
D'.scharge (cfs)
1,140
.b600
.630
-b650
_1,550
1,470
765
1,3601,350
990
1,9601,590
bl,5001,9801,1002,1302,750
952
_bl,3001,210
_2,850
a Backwater from ice. b Maximum daily.
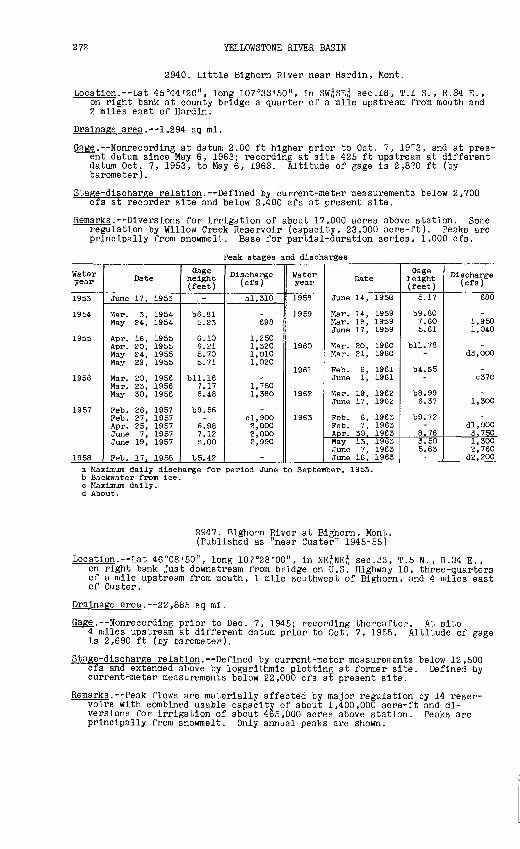
272 YELLOWSTONE RIVER BASIN
2940. Little Bighorn River near Hardin, Mont.
Location. Lat 45°44'20", long 107°33'50", in SW£SE£ sec.18, T.I S., R.34 E., on right bank at county bridge a quarter of a mile upstream from mouth and 2 miles east of Hardin.
Drainage area. 1,294 sq mi.
Gage. Nonrecording at datum 2.00 ft higher prior to Oct. 7, 19"3, and at pres ent datum since May 6, 1963; recording at site 425 ft upstream at different datum Oct. 7, 1953, to May &, 1963. Altitude of gage is 2,8?0 ft (by barometer).
Stage-discharge relation. Defined by current-meter measurements below 2,700 cfs at recorder site and below 2,400 cfs at present site.
Remarks. Diversions for irrigation of about 17,000 acres above station. Some regulation by Willow Creek Reservoir (capacity, 23,000 acre-ft). Peaks are principally from snowmelt. Base for partial-duration series, 1,000 cfs.
Peak stages and discharges
Water year
1953
1954
1955
1956
1957
1958
Date
June 17, 1953
Mar. 3, 1954May 24, 1954
Apr. 16, 1955Apr. 20, 1955May 24, 1955May 29, 1955
Mar. 20, 1956Mar. 23, 1956May 30, 1956
Feb. 26, 1957Feb. 27, 1957Apr. 25, 1957June 7, 1957June 19, 1957
Feb. 17, 1958
Gage height (feet)
-
b6.815.23
6.106.215.705.71
bll.167.176.48
b9.56_6.987.12S.OO
b5.42
Discharge (cfs)
al,310
.698
1,2501,3201,0101,020
-1,7801,380
-cl,9002,0002,0002,990
-
Water year
1958
1959
1960
1961
1962
1963
Date
June 14, 1958
Mar. 14, 1959Mar. IS, 1959June 17, 1959
Mar. 20, 1960Mar. 21, 1960
Feb. 6, 1961June 1, 1961
Mar. 19, 1962June 17, 1962
Feb. 6, 1963Feb. 7, 1963Apr. 30, 1963May 13, 1963June 7, 1963June 16, 1963
Gage I- eight (feet)
5.17
b9.807.605.61
bll.78-
b4.S5-
b8.996.37
b9.72-
8.763.505.63-
Discharge (cfs)
680
_1,9501,040
-d3,000
-C370
-1,300
-dl.OOO3,7501,3002,760
d2,200
a Maximum dally discharge for period June to September, 1953. b Backwater from Ice. c Maximum dally, d About.
2947. Bighorn River at Bighorn, Mont. (Published as "near Ouster" 1945-55)
Location.--Lat 46°08'50", long 107°28'00", in NE^NE^ sec.33, T.5 N., R.34 E., on right bank just downstream from bridge on U.S. Highway 10, three-quarters of a mile upstream from mouth, 1 mile southwest of Bighorn, and 4 miles east of Ouster.
Drainage area. 22,885 sq mi.
Gage.--Nonrecording prior to Dec. 7, 1945; recording thereafter. At site4 miles upstream at different datum prior to Oct. 7, 1955. Altitude of gage is 2,690 ft (by barometer).
Stage-discharge relation.--Defined by current-meter measurements below 12,500 cfs and extended above by logarithmic plotting at former site. Defined by current-meter measurements below 22,000 cfs at present site.
Remarks.--Peak flows are materially affected by major regulation by 14 reser voirs with combined usable capacity of about 1,400,000 acre-ft and di versions for irrigation of about 465,000 acres above station. Peaks are principally from snowmelt. Only annual peaks are shown.
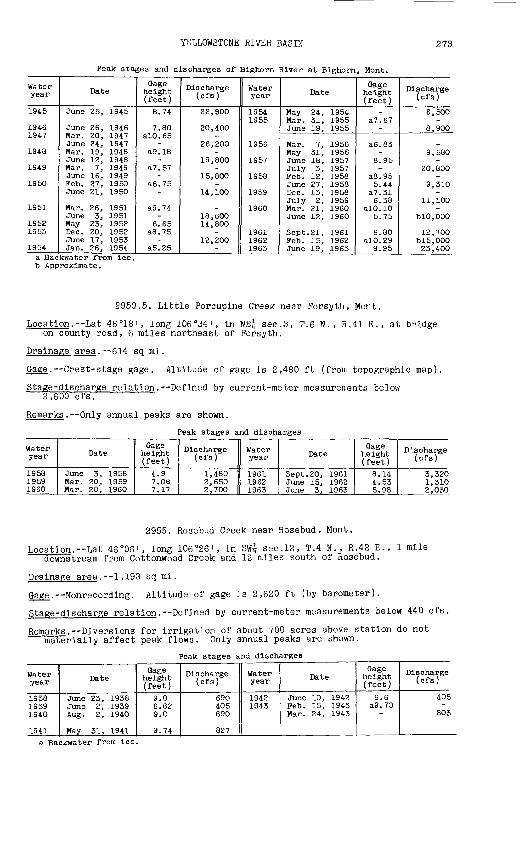
YELLOWSTONE RIVER BASIN 273
Peak stages and discharges of Bighorn River at Bighorn, Mont.
Water year
1945
19461947
1948
1949
1950
1951
19521953
1954
Date
June 25, 1945
June 26, 1946Mar. 20, 1947June 24, 1947Mar. 19, 1948June 12, 1948Mar. 7, 1949June 16, 1949Feb. 27, 1950June 21, 1950
Mar. 26, 1951June 3, 1951May 23, 1952Dec. 20, 1952June 17, 1953Jan. 26, 1954
Gage height (feet)
8.74
7.80alO.65
-a9.18
-a7.57
-a6.75
-
a9.74-
6.65a8.75
-a5.25
Discharge (cfs)
22,900
20,400-
26,200-
19,800-
15,800-
14,100
-18,60014,800
-12,200
-
Water year
19541955
1956
1957
1958
1959
1960
196119621963
Date
May 24, 1954Mar. 31, 1955June 19, 1955
Mar. 7, 1956May 31, 1956June 18, 1957July 3, 1957Feb. 12, 1958June 27, 1958Dec. 13, 1958July 2, 1959Mar. 21, 1960June 12, 1960
Sept. 21, 1961Feb. 15, 1962June 19, 1963
Gage height (feet)
-a7.67
-
a6.83-
8.95-
a8.955.44
a7.316.38
alO.105.75
6.80alO.29
9.95
Discharge (cfs)
6,500-
8,900
_9,580
-20,800
-9,310
-11,100
-blO, 000
12,700blS.OOO23,400
a Backwater from ice b Approximate.
2950.5. Little Porcupine Creek near Forsyth, Mont.
Location. Lat 46°18', long 106°34', in NE£ sec.3, T.6 N., R.41 E., at b-idge on county road, 6 miles northeast of Forsyth.
Drainage area. 614 sq mi.
Gage. Crest-stage gage. Altitude of gage is 2,480 ft (from topographic map).
Stage-discharge relation. Defined by current-meter measurements below 2,600 cfs.
Remarks. Only annual peaks are shown.
Peak stages and discharges
Water year
1958 1959 1960
Date
June 3, 1958 Mar. 20, 1959 Mar. 20, 1960
Gage height (feet)
4.9 7.08 7.17
Discharge (cfs)
1,480 2,650 2,700
Water year
1961 1962 1963
Date
Sept. 20, 1961 June 15, 1962 June 3, 1963
Gage height (feet)
8.14 4.53 5.98
D'.scharge (cfs)
3,320 1,310 2,030
2955. Rosebud Creek near Rosebud, Mont..
Location. Lat 46°06', long 106°26', in SW£ sec.12, T.4 N., R.42 E., 1 mile downstream from Cottonwood Creek and 12 miles south of Rosebud.
Drainage area.--1.193 sq mi.
Gage.--Nonrecording. Altitude of gage is 2,620 ft (by barometer).
Stage-discharge relation. Defined by current-meter measurements below 440 cfs.
Remarks. Diversions for irrigation of about 700 acres above station do not materially affect peak flows. Only annual peaks are shown.
Peak stages and discharges
Water year
193819391940
1941
Date
June 23, 1938June 2, 1939Aug. 2, 1940
May 31, 1941
Gage height (feet)
9.06.629.0
9.74
Discharge (cfs)
690405690
827
Water year
19421943
Date
June 10, 1942Feb. 15, 1943Mar. 24, 1943
Gage height (feet)
6.6a9.70
-
Discharge (cfs)
405-
803
a Backwater from ice.

274 YELLOWSTONE RIVER BASIN
296C
Location. Lat 46°11'50 :right bank 5 miles upstream from mouth and 10 miles southeast of Forsyth.
Drainage area. 1,260 sq
Stage-discharge relation
Remarks. Diversions for
. Rosebud Creek near Forsyth, Mont,
long 106°28'25", in SW£ sec.9, T.5 N., R.42 E., on
mi.
Gage. Recording. Altitude of gage is 2,540 ft (by barometer).
. Defined by current-meter measurements.
irrigation of about 1,200 acres above station. Basefor partial-duration series, 300 cfs. Only annual peaks are shown after 1953.
Peak stages and discharges
Water year
1948
1949
1950
1951
Date
June 4, 1948 June 6, 1948 July 15, 1948 July 21, 1948 July 25, 1948
Mar. 5, 1949 Mar. 8. 1949 Mar. 22, 1949
Feb. 26, 1950 June 9, 1950
Sept. 1, 1951
Q6 he;(f£
E £
alC t £
a£
£
ge ght et)
.90
.76
.40
.41
.03
.72
.96
.71
.41
.90
.42
Discharge (cfs)
344 334 310 382 357
418 373
250
280
Water year
1952
1953
1956 1957
1959
1961 1962 1963
Date
Feb. 10, 1952 Mar. 29, 1952
May 30, 1953
March 1956 June 17, 1957
Mar. 3, 1959
Sept. 10, 1961 June 7, 1962 June 16, 1963
Gage height (feet)
a9.65 7.81
10.27
8.78 8.78
9.58 9.16 6.58
Discharge (cfs)
269
596
350 342
570
435 378 182
a Backwater from ice.
2965. Not-th Fork Tongue River near Dayton, Wyo.
Location.--Lat 44°45'25", long 107°37'20", in sec.7, T.55 N., R.89 W., on left bank half a mile downstream from Hideout Creek and 19^ miles southwest of Dayton.
Drainage area.--32.4 sq mi.
Gage. Recording. At si be 300 ft downstream at datum 5.80 ft lo'ver prior to
Stage-discharge relation
Gage.-Sept. 28, 1950. Datum of gage is 8,146.70 ft above mean sea level, datum of 1929 (Bureau of Reclamation bench mark).
.--Defined by current-meter measurements below 350 cfs.
Remarks.--Base for partial-duration series, 150 cfs.
Peak stages and discharges
Water year
1946
1947
1948
1949
1950
1951
Date
May 27, 1946 June 5, 1946
June 8, 1947June 20, 1947June 27, 1947
May 21, 1948
May 29, 1949 June 11, 1949
June 12, 1950
May 23, 1951
Gage height (feet)
2.14 2.37
1.961.881.82
2.55
1.71 1.73
2.00
3.44
Discharge (cfs)
395 546
274233204
560
151 154
254
237
Water year
1951
1952
1953
1954
1955
1956
1957
Date
May 28, 1951 June 15, 1951
May 3, 1952
June 13, 1953
May 21, 1954
May 22, 1955 June 14, 1955
June 4, 1956
June 4, 1957
Gage height (feet)
3.78 3.06
3.64
4.12
2.75
3.03 2.87
3.27
2.95
Discharge (cfs)
281 188
263
378
147
209168
207
174

YELLOWSTONE RIVER BASIN 275
2970. South Pork Tongue River near Dayton, Wyo.
Location. Lat 44°47'10", long 107°28'00", in sec.33, T.56 N. , R.88 W. , on left bank 60 ft downstream from Johnson Creek and 12 miles southwest of Dayton.
Drainage area. 85.0 sq mi.
Gage. Recording. Datum of gage is 7,621.78 ft above mean sea level, datum of 1929 (Bureau of Reclamation bench mark).
Stage-discharge relation.--Defined by current-meter measurements below 7^0 cfs and extended above by logarithmic plotting.
Historical data. Maximum stage known, about 6.36 ft, from floodmarks (date unknown).
Remarks. Base for partial-duration series, 650 cfs.
Peak stages and discharges
Water year
1946
1947
1948
1949
1950
1951
1952
1953
1954
Date
June 5, 1946
May 9, 1947June 20, 1947
May 21, 1948
June 13, 1949
June 6, 1950June 12, 1950June 20, 1950June 25, 1950
May 28, 1951
May 3, 1952
June 15, 1953
May 22, 1954
Qage height (feet)
5.18
5.445.23
5.61
4.67
4.734.744.654.65
4.72
4.82
5.52
4.56
Discharge (cfs)
812
916832
1,070
666
702706670670
698
770
1,070
636
Water year
1955
1956
1957
19 5S
1959
1960
1961
1962
1963
Date
May 15, 1955June 15, 1955
May 28, 1956
June 18, 1957
May 24, 1958
June 7, 1959
June 10, 1960
May 29, 1961
June 16, 1962
June 3, 1963June 15, 1963
Qage height (feet)
4.835.31
5.62
4.89
5.06
5.17
3.94
4.78
4.98
5.606.24
Discharge (cfs)
7451,020
1,120
785
840
925
399
750
850
1,1601,670
2980. Tongue River near Dayton, Wyo.
Location.--Lat 44°51'00", long 107°18'10", in sec.11, T.56 N., R.87 W., on left bank a quarter of a mile downstream from intake of Highline ditch, l| miles upstream from Amsden Creek, and 2? miles southwest of Dayton.
Drainage area. 204 sq mi.
Gage.--Recording. Altitude of gage is 4,060 ft (from topographic map).
Stage-discharge relation. Defined by current-meter measurements below 1,300 cfs.
Remarks.--Small diversions above station for Dayton municipal supply, in versions above station for irrigation of about 2,000 acres. Diversions do not materially affect peak flows. Base for partial-duration series, 980 cfs.
Peak stages and discharges
Water year
1919
1920
1921
1922
1923
1924
Date
May 20, 1919
May 30, 1920June 10, 1920
May 30, 1921
May 25, 1922June 8, 1922
May 29, 1923
May 19, 1924
Qage height (feet)
3.4
3.944.35
3.27
4.153.72
4.45
4.72
Discharge (cfs)
690
1,2901,700
714
1,6601,130
1,730
1,780
Water year
1924
1925
1926
1927
Date
June 7, 1924June 15, 1924
May 15, 1925May 22, 1925May 31, 1925
Apr. 21, 1926Apr. 30, 1926May 25, 1926
May 17, 1927May 27, 1927
Gage height (feet)
4.825.57
4.024.824.22
3.804.504.72
5.074.19
D'.s charge (cfs)
1,8602,460
1,2201,8601,380
1,0101,5601,740
2,0301,310

276 YELLOWSTONE RIVER BASIN
Peak stages and discharges of Tongue River near Dayton, Wyo. Continued
Water year
1927
1928
1929
1941
1942
1943
1944
1945
1946
1947
1948
1949
Date
June 9, 1927
May 8, 1928May 26, 1928June 14, 1928July 1, 1928July 7, 1928
May 25, 1929June 2, 1929June 9, 1929
May 13, 1941May 18, 1941
Apr. 21, 1942May 26, 1942June 5, 1942
May 31, 1943June 12, 1943
May 17, 1944June 3, 1944
June 6, 1945June 24, 1945
May 28, 1946June 6, 1946
May 8, 1947June 9, 1947June 20, 1947
May 19, 1948June 22, 1948
June 13, 1949
Gage height (feet)
4.78
4.954.964.063.994.21
5.295.305.03
4.344.11
4.185.304.60
4.284.02
5.556.45
4.415.43
4.274.62
4.724.144.53
5.124.01
3.94
Discharge (efs)
1,780
1,9301,9401,2101,1501,320
2,1502,1601,940
1,3601,180
1,2302,1001,570
1,3101,110
2,4503,400
1,4102,330
1,2801,600
1,6901,1701,520
2,0501,070
1,050
Water year
1950
1951
1952
1953
1954
1955
195"
1957
1958
1959
1960
1961
1962
1963
Date
May 17, 1950May 22, 1950June 7, 1950June 13, 1950
May 24, 1951May 28, 1951
Apr. 28, 1952
May 31, 1953June 15, 1953
May 22, 1954
May 16, 1955May 22, 1955June 15, 1955
May 28, 1956
June 18, 1957
May 11, 1958May 24, 1958
June 8, 1959
May 12, 1960
May 30, 1961
June 16, 1962
June 5, 1963June 15, 1963
Gage height (feet)
4.113.914.034.01
4.044.09
4.62
3.974.84
4.00
4.294.014.34
4.90
4.56
4.084.45
4.50
3.55
4.17
4.60
5.015.42
Discharge (cfs)
1,2001,0401,1301,120
1,1901,200
1,640
1,0901,840
1,060
1,3401,1201,390
1,790
1,450
1,0601,340
1,460
730
1,180
1,500
2,0202,630
2985. Little Tongue River near Dayton, Wyo.
Location. Lat 44°48'45", long 107°17'00", in sec.24, T.56 N., R.87 W., on right bank a quarter of a mile downstream from entrance of main tributary and 4.5 miles south of Dayton.
Drainage area. 25.1 sq mi.
Gage.--Recording. Altitude of gage is 4,380 ft (from topographic map).
Stage-discharge relation. Defined by current-meter measurements below 170 cfs.
Remarks. Diversion for irrigation of about 106 acres does not materially af fect peak flows. Base for partial-duration series, 100 cfs.
Peak stages and discharges
Water year
1951
1952
1953
1955
1956
1957
Date
July 10, 1951
May 23, 1952
June 15, 1953
May 22, 1955
May 28, 1956
June 20, 1957
Qage height (feet)
1.58
2.09
1.72
1.64
2.01
2.31
Discharge (cfs)
83
181
114
84
161
263
Water year
1958
1959
1960
1961
1962
1963
Date
May 23, 1958
May 27, 1959
May 19, 1960
May 27, 1961
June 16, 1962
May 27, 1963
Gage height (feet)
1.84
1.48
1.27
1.65
1.65
2.17
Discharge (cfs)
117
42
24
76
74
192
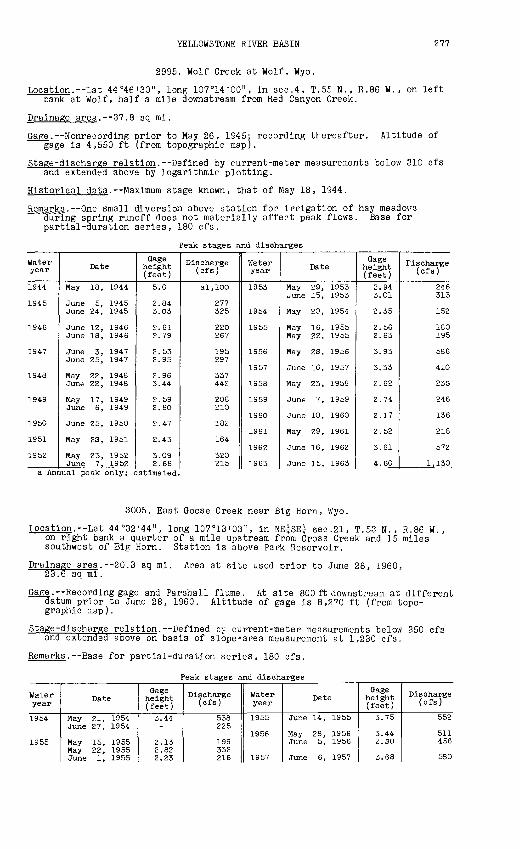
YELLOWSTONE RIVER BASIN 277
2995. Wolf Creek at Wolf, Wyo.
Location. Lat 44°46'30", long 107°14'00", in sec.4, T.55 N. , R.86 W., on left bank at Wolf, half a mile downstream from Red Canyon Creek.
Drainage area. 37.8 sq mi.
Gage. Nonrecording prior to May 26, 1945: recording thereafter. Altitude of gage is 4,550 ft (from topographic map).
Stage-discharge relation. Defined by current-meter measurements below 310 cfs and extended above by logarithmic plotting.
Historical data. Maximum stage known, that of May 18, 1944.
Remarks. One small diversion above station for irrigation of hay meadoi's during spring runoff does not materially affect peak flows. Base for partial-duration series, 180 cfs.
Peak stages and discharges
Water year
1944
1945
1946
1947
1948
1949
1950
1951
1952
Date
May 18, L944
June 5, 1945June 24, 1945
June 12, 1946 June 18, 1946
June 3, 1947 June 25, 1947
May 22, 1948 June 22, 1948
May 17, 1949 June 6, 1949
June 25, 1950
May 2S, 1951
May 23, 1952 June 7, 1952
Gage height (feet)
5.0
2.843.03
2.61 2.79
2.53 2.95
2.96 3.44
2.59 2.60
2.47
2.43
3.09 2.66
Discharge (cfs)
al,100
277325
220267
195 297
337 442
208 210
182
164
320215
Water year
1953
1954
1955
1956
1957
1958
1959
1960
1961
1962
1963
Date
May 29, 1953 June 15, 1953
May 20, 1954
May 16, 1955 May 22, 1955
May 2S, 1956
June 16, 1957
May 23, 1958
June 7, 1959
June 10, 1960
May 29, 1961
June 16, 1962
June 15, 1963
Gage height (feet)
2.94 3.01
2.35
2.56 2.63
3.93
3.33
2.62
2.74
2.17
2.52
3.61
4.60
Tls charge (cfa)
246 313
152
180 195
586
410
23S
246
136
218
572
1,130a Annual peak only; estimated.
3005. East Goose Creek near Big Horn, Wyo.
Location. Lat 44°32'44", long 107°13'03", in NE^SE^ sec.21, T.53 N., R.86 W., on right bank a quarter of a mile upstream from Cross Creek and 15 miles southwest of Big Horn. Station is above Park Reservoir.
Drainage area.--20.3 sq mi. Area at site used prior to June 28, 1960, 23.6 sq mi.
Gage.--Recording gage and Parshall flume. At site 800 ft downstream at different datum prior to June 28, 1960. Altitude of gage is 8,270 ft (from topo graphic map).
Stage-discharge relation.--Defined by current-meter measurements below 350 cfs and extended above on basis of slope-area measurement at 1,230 cfs.
Remarks.--Base for partial-duration series, 180 cfs.
Peak stages and discharges
Water year
1954
1955
Date
May 21, 1954 June 27, 1954
May 15, 1955 May 22, 1955 June 1, 1955
Gage height (feet)3.44
2.13 2.82 2.23
Discharge (cfs)
538 225
199 332 216
Water year
1955
1956
1957
Date
June 14, 1955
May 28, 1956 June 5, 1956
June 6, 1957
Gage height (feet)3.75
3.44 2. SO
3.68
Discharge (cfs)
552
511 456
580
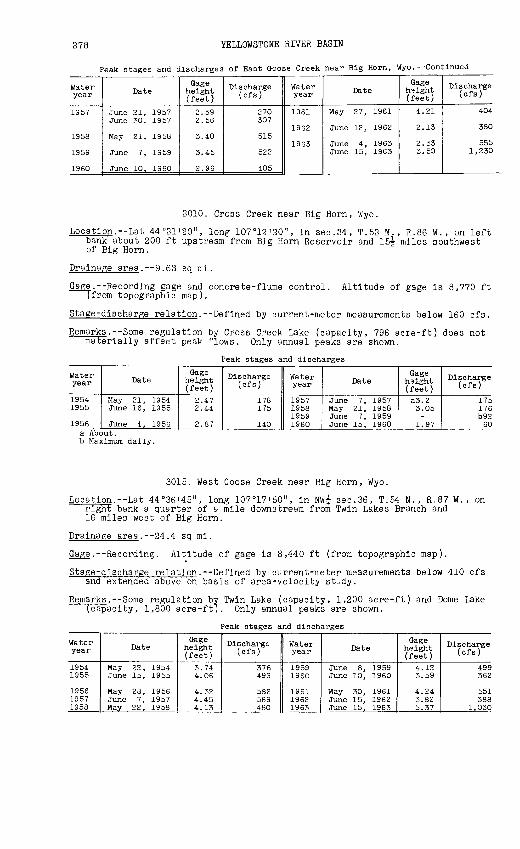
278 YELLOWSTONE RIVER BASIN
Peak stages and discharges of East Goose Creek near Big Horn, Wyo.--Continued
Water year
1357
1358
1359
1960
Date
June 21, 1957 June 30, 1357
May 21, 1358
June 7, 1353
June 10, 1360
Gage height (feet)
2.33 2.56
3.40
3.45
2.96
Discharge (cfs)
270 307
515
522
405
Water year
1361
1962
1963
Date
May 27, 1961
June 12, 1962
June 4, 1963 June 15, 1363
Gage height (feet)
4.21
2.13
2.33 3.59
Discharge (cfs)
404
380
555 1,230
3010. Cross Creek near Big Horn, Wyo.
Location. Lat 44°31'20", long 107°12'20", in sec.34, T.53 N., R.86 W., on left bank about 200 ft upstream from Big Horn Reservoir and 15? miles southwest of Big Horn.
Drainage area. 9.63 sq mi.
Gage.--Recording gage and concrete-flume control. Altitude of gage is 8,770 ft [from topographic map).
Stage-discharge relation. Defined by current-meter measurements below 160 cfs.
Remarks.--Some regulation by Cross Creek Lake (capacity, 796 acre-ft) does not materially affect peak flows. Only annual peaks are shown.
Peak stages and discharges
Water year
1954 1955
1956
Date
May 21, 1354 June 16, 1355
June 4, 1956
Gage height (feet)
2.47 2.44
2.87
Discharge (cfs)
178 175
140
Water year
1957 1958 1959 1960
Date
June 7, 1957 May 21, 1958 June 7, 1959 June 15, 1960
Gage height (feet)a3.2 3.05
1.97
Discharge (cfs)
175 176 b92 60
a About.b Maximum daily.
3015. West Goose Creek near Big Horn, Wyo.
Location. Lat 44°36'45", long 107°17'50", in NWij- sec.36, T.54N., R.87W., on right bank a quarter of a mile downstream from Twin Lakes Branch and 16 miles west of Big Horn.
Drainage area.--24.4 sq mi.
Gage.--Recording. Altitude of gage is 8,440 ft (from topographic map).
Stage-discharge relation.--Defined by current-meter measurements below 410 cfs and extended above on basis of area-velocity study.
Remarks.--Some regulation by Twin Lake (capacity, 1,200 acre-ft) and Dome Lake (capacity, 1,800 acre-ft). Only annual peaks are shown.
Peak stages and discharges
Water year
1954 1955
1956 1957 1958
Date
May 22, 1954 June 15, 1955
May 28, 1956 June 7, 1957 May 22, 1958
Gageheight (feet)
3.74 4.06
4.32 4.45 4.13
Discharge (cfs)
376 493
582 563 460
Water year
1959 1960
1961 1962 1963
Date
June 8, 1959 June 10, I960
May 30, 1961 June 15, 1962 June 15, 1963
Gage height (feet)
4.12 3.59
4.24 3.82 5.37
Discharge (cfs)
499362
551 388
1,030

YELLOWSTONE RIVER BASIN 279
3020. Goose Creek near Sheridan, Wyo.
Location. Lat 44°42', long 107°11', in sec.35, T.55 N. , R.86 W., on rightbank half a mile upstream from Cave Creek and 14 miles southwest of Sheridaa
Drainage area. 120 sq mi.
Gage.--Recording. Altitude of gage is 4,530 ft (from topographic map).
Stage-discharge relation. Defined by current-meter measurements below 1,700 cfs and extended above by logarithmic plotting.
Remarks. Diversions above station for irrigation of about 11,000 acres.Natural flow of stream affected by nine storage reservoirs (combined capac ity, 13,740 acre-ft), transbasin diversions to Little Goose Creek, ard di versions for Sheridan municipal supply and Veterans Administration Hospital. Diversions and regulation materially affect peak flows. Only annual peaks are shown.
Peak stages and discharges
Water year
1930
19311932193319341935
19361937193819391940
19411942194319441945
1946
Date
June 1, 1930
June 3, 1931May 22, 1932June 3, 1933May 8, 1934June 14, 1935
June 1, 1936June 18, 1937May 30, 1938May 31, 1939June 3, 1940
May 13, 1941May 27, 1942June 12, 1943June 3, 1944June 25, 1945
June 18, 1946
Gage height (feet)
3.28
3.944.644.552.664.7O
4.284.893.943.953.60
3.523.933.934.734.23
3.75
Discharge (cfs)
566
1,0901,6401,560
3291,730
1,3701,9001,1001,12O
860
8O41,0901,0601,7301,370
958
Water year
1947194819491950
19511952195319541955
19561957195819591960
196119621963
Date
June 9, 1947June 23, 1948June 13, 1949June 18, 1950
June 19, 1951June 7, 1952June 15, 1953May 22, 1954June 15, 1955
May 28, 1956June 11, 1957May 24, 1958June 8, 1959June 10, 1960
May 30, 1961June 16, 1962June 15, 1963
Gage height (feet)
3.663.463.953.72
3.364.574.653.254. 02
4.654.113.543.912.75
3.624.425.83
Discharge (cfs)
902762
1,130867
5981,5001,560
615981
1,6301,170
7241,020
373
7731,4503,160
3035. Little Goose Creek in canyon, near Big Horn, Wyo.
Location. Lat 44°35'46", long 107°02'22", in NE^ sec.l, T.53 N., R.85 V., on left bank 100 ft upstream from headgate of Lower Peralta ditch and 6? miles southwest of Big Horn.
Drainage area.--55 sq mi, approximately.
Gage.--Recording. Altitude of gage is 4,860 ft (from topographic map).
Stage-discharge relation.--Defined by current-meter measurements below 870 cfs and extended above by logarithmic plotting.
Remarks.--Two small diversions above station for irrigation. Diversions into drainage basin above station from East Goose Creek basin diverted below station for irrigation. Three small reservoirs above station (combined capacity, 720 acre-ft), two of which store some of the imported water. Di versions and regulation do not materially affect peak flows. Base for partial-duration series, 420 cfs.
Peak stages and discharges
Water year
1941a/
1942
1943
Date
May 13, 1941 May 26, 1941
May 26, 1942 June 4, 1942
May 30, 1943
Gage height (feet)
4.31 4.44
4.87 4.67
4.O9
Discharge (cfs)
507 543
568 514
429
Water year
1944
1945
1946
Date
May 18, 1944 June 3, 1944
June 6, 1945 June 24, 1945
June 5, 1946
Gage height (feet)
5.00 5.87
4.60 5.04
4.55
r'.scharge (cfs)
719 928
534 669
574a Partial year.
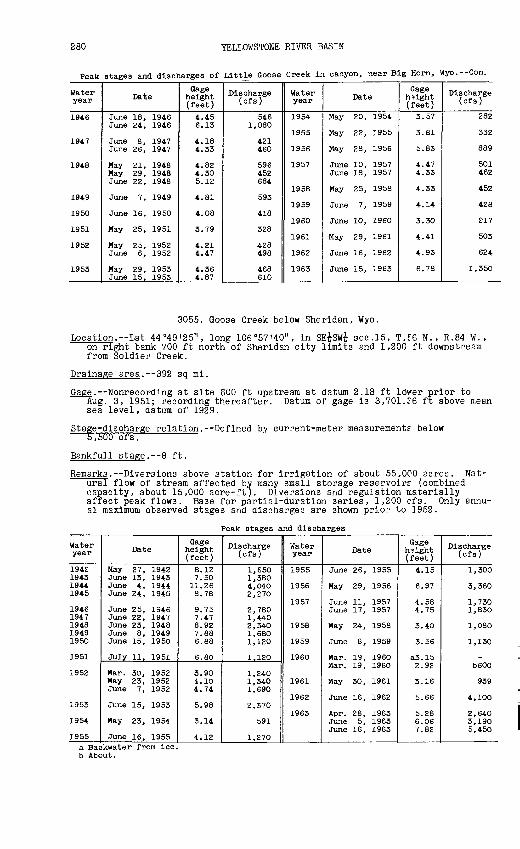
280 YELLOWSTONE RIVER BASIN
Peak stages and discharges of Little Goose Creek in canyon, near Big Horn, Wyo. Con.
Water year
1946
1947
1948
1949
1950
1951
1952
1953
Date
June 18, 1946June 24, 1946
June 8, 1947June 26, 1947
May 21, 1948May 29, 1948June 22, 1948
June 7, 1949
June 16, 1950
May 25, 1951
May 25, 1952June 6, 1952
May 29, 1953June 15, 1953
Qage height (feet)
4.456.13
4.184.33
4.824.305.12
4.81
4.08
3.79
4.214.47
4.364.87
Discharge (cfs)
5461,080
421460
596452684
593
418
328
428498
468610
Water year
1954
1955
1956
1957
1958
1959
1960
1961
1962
1963
Date
May 20, 1954
May 22, 1955
May 28, 1956
June 10, 1957June 18, 1957
May 25, 1958
June 7, 1959
June 10, 1960
May 29, 1961
June 16, 1962
June 15, 1963
Gage height (feet)
3.57
3.81
5.83
4.474.33
4.33
4.14
3.30
4.41
4.93
6.78
Discharge (cfs)
282
332
889
501462
452
428
217
503
624
1,350
3055. Goose Creek below Sheridan, Wyo.
Location.--Lat 44°49'25", long 106°57'40", In SE^SVfi sec.15, T.£6 N., R.84 W., on right bank 700 ft north of Sheridan city limits and 1,200 ft downstream from Soldier Creek.
Drainage area. 392 sq ml.
Gage. Nonrecordlng at site 600 ft upstream at datum 2.18 ft lo'wer prior to Aug. 3, 1951; recording thereafter. Datum of gage Is 3,701.T6 ft above mean sea level, datum of 1929.
Stage-discharge relation. Defined bj current-meter measurements below 5,500 cfs.
Bankfull stage.--8 ft.
Remarks. Diversions above station for Irrigation of about 55,000 acres. Nat ural flow of stream affected by many small storage reservolrr (combined capacity, about 15,000 acre-ft). Diversions and regulation materially affect peak flows. Base for partial-duration series, 1,200 cfs. Only annu al maximum observed stages and discharges are shown prior to 1952.
Peak stages and discharges
Water year
1942194319441945
19461947194819491950
1951
1952
1953
1954
1955
Date
May 27, 1942June 13, 1943June 4, 1944June 24, 1945
June 25, 1946June 22, 1947June 23, 1948June 8, 1949June 15, 1950
July 11, 1951
Mar. 30, 1952May 23, 1952June 7, 1952
June 15, 1953
May 23, 1954
June 16, 1955
Qage height ( feet )
8.127.50
11.268.78
9.757.478.927.886.88
6.80
3.904.104.74
5.98
3.14
4.12
Discharge (cfs)
1,6501,3804,0402,270
2,7801,4402,3401,6801,120
1.120
1,2401,3401,690
2,370
591
1,270
Water year
1955
1956
1957
1958
1959
1960
1961
1962
1963
Date
June 26, 1955
May 29, 1956
June 11, 1957June 17, 1957
May 24, 1958
June 8, 1959
Mar. 19, 1960Mar. 19, 1960
May 30, 1961
June 16, 1962
Apr. 28, 1963June 5, 1963June 16, 1963
Gage height (feet)
4.15
6.97
4.584.75
3.40
3.56
a3.152.92
3.16
5.66
5.286.067.82
Discharge (cfs)
1,300
3,360
1,7301,830
1,080
1,130
_b600
939
4,100
2,6403,1905,450
a Backwater from ice. About.

YELLOWSTONE RIVER BASIN 281
3060. Tongue River near Acme, Wyo.
Location. Lat 44°56'40", long 106°56'20", In sec.l, T.57 N., R.84 W., on right bank just upstream from Ash Creek, 400 ft downstream from highway bridge and 3.2 miles northeast of Acme.
Drainage area. 894 sq ml.
Gage. Recording. Altitude of gage Is 3,530 ft (from topographic map).
Stage-discharge relation. Defined by current-meter measurements below 6,300 cfs.
Remarks. Diversion above station for irrigation of about 52,000 acres. Some regulation by 12 mountain reservoirs (combined capacity, 14,600 acre-ft) as result of storage during spring runoff and release for Irrigation during summer. Diversions and regulation materially affect peak flows. Only annu al peaks are shown.
Peak stages and discharges
Water year
19391940
1941 1942 19431944 1945
1946 19471948
Date
June 2, 1939June 6, 1940
May 14, 1941 May 27, 1942 June 1, 1943June 4, 1944 June 24, 1945
June 19, 1946 June 22, 1947Apr. 19, 1948
Oage height (feet)
6.924.93
6.08 7.60 6.55
10. 5O 7.42
6.97 6.906.72
Discharge (cfs)
3,3401,360
2,520 4,350 3,1009,110 4,430
3,840 3,7503,850
Water year
19491950
1951 1952 19531954 1955
1956 1957
Date
June 14, 1949June 19, 1950
July 11, 1951 May 24, 1952 June 16, 1953May 23, 1954 June 27, 1955
May 29, 1956 June 18, 1957
Gage height (feet)
5.S75.25
5.34 5.86 7.56
5.75
8.24 7.34
Discharge (cfs)
2,7102,O2O
2,OSO 2,700 4,870
al,8OO 2,580
6,280 4,700
a Estimated.
3065. Tongue River near Decker, Mont.
Location. --Lat 45°01'50", long 106°48'50", In SE^ sec. 22, T.9 S., R.4C E., at bridge a quarter of a mile northeast of Decker, 2 miles north of Wyoming- Montana State line, and 3 miles upstream from high-water line of Tcngue River Reservoir.
At datum Altitude of gage Is 3,430 ft (from
Drainage area. 1,610 sq ml.
Gage. Nonrecordlng prior to Sept. 11, 1934; recording thereafter. "1.00 ft higher prior to Sept. 11, 1934.
River Basin Survey map ) .
Stage-discharge relation. Defined by current -meter measurements below 3,600 cfs.
Remarks . Diversions above station for Irrigation of about 58,000 acres. Some regulation by 12 mountain reservoirs (combined capacity, 15,000 acre-ft) as result of storage during spring runoff and release for Irrigation during summer. Diversions and regulation materially affect peak flows. Cnly annu al peaks are shown.
Peak stages and discharges
Water year
1928 1929 1930
1931 1932 1933
Date
May 28, 192S June 2, 1929 June 2, 1930
May 17, 1931 May 23, 1932 June 3, 1933
Gage height (feet)5.25 8.25 3.26
5.14 6.2S 6.55
Discharge (cfs)
3,730 7,220 1,410
3,640 4,820 5, ISO
Water year
1934 1935
1936 1937 1938
Date
May 10, 1934 June 14, 1935
June 2, 1936 June 19, 1937 June 25, 193S
Gage height (feet)
2.126.45
6.47 6.91 7.45
Discharge (cfs)
596 4,100
4,140 4,330 5,160

282 YELLOWSTONE RIVER BASIN
3069.5. Leaf Rock Creek near Kirby, Mont.
Location. Lat 45°11', long 106°55', in center sec.35, T.7 S., R.39 E., at cul vert on county road, 10 miles south of Kirby.
Drainage area. 6.04 sq mi.
Gage.--Crest-stage gage. Altitude of gage is 3,940 ft (from topographic map).
Stage-discharge relation.--Defined by computation of flow throug^ culvert, using head as indicated by crest-stage gage.
Remarks. Only annual peaks are shown.
Peak stages and discharges
Water year
1958
1960
Date
June 7, 1958
Mar. 19, 1960
Oage height (feet)
6.77
5.03
Discharge (cfs)
222
168
Water year
1961 1962 1963
Date
June 16, 1962 June 15, 1963
Oage height (feet)
6.37 6.77
Discharge (cfs)
(a) 216 222
a No evidence of flow during year.
3082. Basin Creek tributary near Volborg, Mont.
Location.--Lat 45°53<, long 105°40', in NW^ sec.31, T.2 N. , R.49 E., at culvert on county road, 3-| miles north of Volborg.
Drainage area.--0.14 sq mi.
Gage. Crest-stage gage. Altitude of gage is 2,900 ft (from topographic map).
Stage-discharge relation. Defined by computation of flow through culvert using head as indicated by crest-stage gage.
Remarks. Only annual peaks are shown.
Peak stages and discharges
Water year
1955
1956195719581959
Date
July 29, 1955
_-
July 2, 1958March 1959
Oage height (feet)0.24
_-
6.96-
Discharge (cfs)
20
H(a)390b2
Water year
1960
196119621963
Date
Mar. 21, 1960
_June 17, 1962June 22, 1963
Gage height (feet)0.97
_2.769.38
Discharge (cfs)
12
(a)3694
a No evidence of flow during year. b Approximate.
3083. Basin Creek near Volborg, Mont.
Location.--Lat 45°53', long 105°39', in NW^ sec.32, T.2 N., R.4S E., at bridge on U.S. Highway 212, 4 miles north of Volborg.
Drainage area. 10.9 sq mi.
Gage. Crest-stage gage. Altitude of gage is 2,880 ft (from topographic map).
Stage-discharge relation. Poorly defined by current-meter measurements below 10 cfs and by slope-area measurement at 953 cfs.
Remarks. Only annual peaks are shown.
Peak stages and discharges
Water year
1955
19561957195S1959
Date
July 29, 1955
Aug. 27, 1956Apr. 24, 1957July 2, 1958Mar. 11, 1959
Gage height (feet)
1.1
5.763.455.791.87
Discharge (cfs)
20
95330096575
Water year
1960
196119621963
Date
Mar. 21, 1960
Sept. 10, 1961Feb. 11, 1962June 22, 1963
Oage height (feet)
5.26
1.043.185.69
Discharge (cfs)
770
18250920

YELLOWSTONE RIVER BASIN 283
3085. Tongue River at Miles City, Mont. (Published as "near Miles City" April 1938 to April 1942)
Location.--Lat 46°21', long 105°48', in SE£ sec.23, T.7 N., R.47 E., on right bank 4 miles south of Miles City and 8 miles upstream from mouth.
Drainage area. 5,379 sq mi.
Gage. Nonrecording at site 8 miles upstream at different datum prior tc April 1942; recording at present site and datum since April 1946. Altitude of gage is 2,370 ft (by barometer).
Stage-discharge relation. Large shifts occur. Defined by current-metermeasurements below 3,200 cfs at present site and extended above on besis of float measurement at 12,000 cfs. Defined below 1,700 cfs at former rite.
Remarks. Diversions for irrigation of about 90,000 acres above station. Flow regulated by Tongue River Reservoir (present usable capacity, 68,040 acre-ft), and many small reservoirs in Wyoming (combined capacity, about 15,000 acre-ft). Peak flows are materially affected. Only annual peaks are shown,
Peak stages and discharges
Water year
193819391940
1941
19461947
194819491950
19511952
1953
Date
June 1, 1938Mar. 23, 1939July 28, 1940
May 30. 1941
June 12, 1946Mar. 20, 1947Mar. 21, 1947June 5, 1948Mar. 6, 1949Apr. 2, 1950June 25, 1950
Sept. 2, 1951Mar. 29, 1952Mar. 30, 1952June 20, 1953
Gage height (feet)
6.105.846.58
7.20
4.94a9.65
-7.92
all. 8a6.76
-
4.55all. 70
-5.16
Discharge (cfs)
2,8002,5603,420
3,650
3,140-
b4,8007,470
C12.000-
1,640
2,680-
7,5203,100
Water year
19541955
1956
1957
19581959
1960
196119621963
Date
Aug. 17, 1954May 4, 1955
Mar. 23, .1956June 3, 1956Mar 1, 1957Apr 24, 1957July 3, 1958Mar 10, 1959Mar 13, 1959Mar 19, 1960Mar 20, 1960
July 30, 1961June 15, 1962Feb. 6, 1963June 22, 1963
Gage height (feet)
4.925.53
a9.00-
a6.33-
7.59a7.30
-a!2.27
-
2.6011.33a7.55
-
rj.scharge (cfs)
2,7803,810
-3,080
-4,9806,970
-5,400
-6,820
1,09013,300
-5,090
a Backwater from ice.b Maximum daily mean; estimatec Result of float measurement.
3090. Yellowstone River at Miles City, Mont.
Location. --Lat 46°25', long 105°51', in SW^NWi sec. 28, T.8 N. , R.47 E. , on left bank 350 ft upstream from bridge on State Highway 22 at Miles City aid three- quarters of a mile downstream from Tongue River.
Drainage area. --48, 253 sq mi.
Gage . Nonrecording prior to Oct. 1, 1931; recording thereafter. At punping plant 1-5- miles downstream at different datums prior to May 6, 1929, and Nov. 11, 1937, to Sept. 30, 1946. Datum of gage is 2,330.20 ft abov3 mean sea level (State Highway Department bench mark).
Stage-discharge relation. --Well defined by current -meter measurements at both sites.
Remarks. Some regulation by reservoirs on tributary streams. Diversions for irrigation of about 1,100,000 acres above station. Peak flows might be materially affected. Base for partial-duration series, 36,700 cfs. Only annual peaks are shown prior to 1932.

284 YELLOWSTONE RIVER BASIN
Peak stages and discharges^of Yellowstone River at Miles City, Mont.
Water year
1923
19291930
1931
1932
1933
1934
1935
1936
1937
1938
1939
1940
1941
1942
1943
1944
1945
1946
1947
Date
June 15, 1923
June 18, 1929June 2, 1930
June 11, 1931
June 28, 1932
June 19, 1933
Mar. 10, 1934May 11, 1934
June 17, 1935
June 4, 1936
June 25, 1937
June 26, 1938July 5, 1938
Mar. 22, 1939June 4, 1939
June 10, 1940
Mar. 23, 1941June 12, 1941
May 29, 1942June 12, 1942
Mar. 26, 1943June 4, 1943June 26, 1943
Mar. 20, 1944May 21, 1944June 19, 1944June 30, 1944
June 8, 1945June 28, 1945
June 14, 1946
Mar. 22, 1947May 13, 1947June 12, 1947June 23, 1947
Gage height (feet)
8.80
11.209.08
9.49
12.17
11.62
all. 025.85
12.22
10.76
11.10
10.5010.10
all. 378.34
7.35
a7.827.70
9.6210.55
a!4.0010.1011.76
b!2.910.3512.7414.05
8.4210.57
9.11
10.6710.4810.5712.42
Discharge (eta)
53,300
60,30042,000
45,000
65,200
60,800
-20,100
66,400
51 , 600
51,600
74,20067,600
-42,300
34,900
-36,700
54,50067,700
-62,70083,700
-48,00096,30082,800
44,10067,700
50, 100
48,90047,30048,10064,800
Water year
1948
1949
1950
1951
1952
1953
1954
1955
1956
1957
1958
1959
1960
1961
1962
1963
Date
June 8, 1948
Mar. 26, 1949June 1, 1949June 15, 1949
Apr. 6, 1950June 9, 1950June 25, 1950
Mar. 26, 1951May 31, 1951June 20, 1951
Mar. 29, 1952May 24, 1952June 10, 1952
June 17, 1953
June 29, 1954
June 19, 1955
Mar. 26, 1956June 1, 1956
May 23, 1957June 10, 1957June 19, 1957June 23, 1957July 4, 1957
Feb. 21, 1958May 27, 1958
Mar. 13, 1959June 10, 1959June 18, 1959
Mar. 19, 1960June 13, 1960
June 1, 1961June 12, 1961
Feb. 17, 1962June 6, 1962June 18, 1962
June 6, 1963June 19, 1963
G-ige height (feet)
13.05
alO.308.7910.08
a!3.809.8411.47
a!2.8010.0510.86
10.429.56
11.46
11.60
9.90
9.07
a!2.4212.08
9.1512.8612.3911.9611.72
alO.839.90
a!2.9010.1111.53
a!5.508.49
8.30-
a!4.849.5311.91
11.9912.81
Discharge (cfs)
70,500
_37,70046,100
-45,70057,300
-46,10052,000
48,90042,00054,400
58,400
44,200
37,600
-60, 700
37,30067,90063,50059,60057,500
-40,300
-42,70054,200
-32,900
_30, 500
-39,40057,100
54,20061,300
a Backwater from Ice. b Backwater from Ice: gage height, 21.7 ft, present site and datum, from floodmark.
3095. Middle Pork Powder River above Kaycee, Wyo.
Location. Lat 43°39 T , long 106 C49', in SW£ sec. 34, T.43 N. , R.8c W., on right bank 680 ft upstream from county highway bridge , 2 miles upstream from Red Pork, 2 miles downstream from Beaver Creek, and 10 miles southwest of Kaycee.
Drainage area.--45Q sq mi, approximately.
Gage. --Recording. Datum of gage is 4,874.76 ft above mean sea level, datum of
Stage-discharge relation. Defined by current-meter measurements below 680 cfs and extended above by logarithmic plotting.
Bankfull stage.--? ft.
Historical data. --Maximum stage known, about 11.7 ft, date unknown.
Remarks . --Diversions above station for irrigation of about 9,500 acres materi ally affect peak flows. Base for partial-duration series, 300 cfs.

YELLOWSTONE RIVER BASIN 285
Peak stages and discharges of Middle Fork Powder River above Kaycee, Wyo.
Water year
1949a/
1950
1951
1952
1953
1954
1955
1956
1957
Date
Apr. 30, 1949May 4, 1949June 9, 1949Aug. 10, 1949
May 18, 1950
Apr. 30, 1951May 6, 1951May 13, 1951Sept. 6, 1951
Apr. 29, 1952May 22, 1952
May 29, 1953July 29, 1953
May 13, 1954
May 15, 1955June 2, 1955June 14, 1955
May 27, 1956July 2, 1956
May 14, 1957May 30, 1957June 7, 1957
Gage height (feet)
3.743.764.504.11
5.68
3.663.713.884.21
4.283.58
4.043.57
3.57
4.984.025.07
3.853.78
3.793.773.82
Discharge (cfs)
319326586452
1,020
312327380487
566307
437303
287
730424792
367322
374346374
Water year
1957
1958
1959
1960
1961
1962
1963
Date
June 16, 1957June 20, 1957June 30, 1957
May 13, 1958June 13, 1958July 3, 1958July 21, 1958
May 17, 1959Aug. 12, 1959Aug. 19, 1959
June 10, 1960
May 23, 1961
Apr. 26, 1962May 25, 1962June 15, 1962June 24, 1962June 30, 1962July 14, 1962
May 10, 1963June 15, 1963July 7, 1963Aug. 13, 1963Sept. 21, 1963
Gage height ( feet )
3.854.605.22
5.504.235.204.16
4.914.724.12
3.80
5.00
4.844.045.764.824.344.31
4.958.455.845.184.52
Tlscharge (cfs)
370620860
933494840470
644672464
370
755
567350932567425418
6342,4801,010
729514
a Partial year.
3100. Red Pork near Barnum, Wyo.
Location. Lat 43°39', long 106°46', In sec.35, T.43 N., R.83 W., on right bank 800 ft upstream from mouth and 6.5 miles east of Barnum.
Drainage area. 142 sq mi.
Gage. Nonrecording prior to June 3, 1950; recording thereafter. At datum 1.52 ft higher May 24, 1929, to June 30, 1932, and at datum 0.49 ft Mgher, Mar. 20 to June 2, 1950. Datum of gage is 4,835.80 ft above mean sea level (State Highway Department bench mark).
Stage-discharge relation. Defined by current-meter measurements below 360 cfs.
Bankfull stage.--6 ft.
Historical data. Maximum stage known, 10.3 ft (present datum) in April 1927, from floodmarks, from information by local resident.
Remarks. Diversions for irrigation of about 3,100 acres above station do not materially affect peak flows. Only annual peaks are shown prior to 1950. Base for partial-duration series, 120 cfs.
Peak stages and discharges
Water year
1927
1929 1930
1931 1932
1950
Date
April 1927
May 25, 1929 Aug. 11, 1930
June 9, 1931 May 14, 1932
Apr. 17, 1950 Apr. 23, 1950
Gage height (feet)
alO.3
3.57 3.17
2.40 3.63
3.04 3.12
Discharge (cfs)
754 625
370 768
182 195
Water year
1950
1951
1952
1953
Date
May 18, 1950
May 13, 1951 Sept. 7, 1951
Jan. 24, 1952 Apr. 29, 1952
May 29, 1953 July 29, 1953
Gage height (feet)
5.66
2.94 5.29
b5.44 4.24
3.00 5.15
D'scharge (cfs)
649
158 583
386
150 527
a Present datum.b Backwater from ice.
219-848 O - 66 - 20

286 YELLOWSTONE RIVER BASIN
3110. North Fork Powder River near Hazelton, Wyo.
Location Lat 44°01'20", long 107°04'00", in SE^ sec.21, T.47 N., R.85 W., on right bank three-quarters of a mile upstream from bridge, 3 miles upstream from Twin Creek, 7.5 miles southwest of Hazelton, and 19 miles northwest of Mayoworth.
Drainage area. 25.0 sq mi.
Gage.--Recording. Altitude of gage is 8,120 ft (from topographic map).
Stage-discharge relation.--Defined by current-meter measurements below 120 cfs and extended above on basis of slope-area measurement at gage height 4.3 ft.
Remarks.--Base for partial-duration series, 190 cfs.
Peak stages and discharges
Water year
1947
1948
1949
1950
1951
1952
1953
1954
1955
Date
May 5, 1947
May 20, 1948
June 6, 1949June 12, 1949
May 23, 1950
May 18, 1951
May 3, 1952June 3, 1952
May 29, 1953June 15, 1953
May 10, 1954
May 14, 1955June 15, 1955
Gage height (feet)
3.44
3.14
3.403.97
3.27
2.62
3.182.95
3.254.34
2.94
2.963.42
Discharge (cfs)
396
290
361242
332
171
302237
325886
234
240388
Water year
1956
1957
1958
1959
1960
1961
1962
1963
Date
May 20, 1956May 24, 1956May 27, 1956
June 10, 1957
May 7, 1958May 17, 1958
June 3, 1959June 22, 1959
Apr. 23, 1960
May 10, 1961
May 8, 1962
June 1, 1963
GTge height (feet)
2.813.133.01
2.98
3.122.77
2.552.58
2.54
3.40
3.17
3.20
Discharge (cfs)
202287253
247
284200
146-
166
380
284
308
3115. North Pork Powder River near Mayoworth, Wyo.
Location. Lat 43°54', long 106°53', in sec.6, T.45 N., R.83 W., on right bank 2 miles downstream from Pass Creek and 6 miles northwest of Mayoworth.
Drainage area.--106 sq mi.
Gage.--Recording. At site 300 ft downstream at datum 4.43 ft lower prior to May 12, 1948. Altitude of gage is 5,590 ft (from topographic map).
Stage-discharge relation. Defined by current-meter measurements below 370 cfs.
Remarks. Two small diversions above station for irrigation of 223 acres on Hat Ranch do not materially affect peak flow. Base for partial-duration series, 330 cfs.
Peak stages and discharges
Water year
1941
1942
1943
1944
1945
1946
1947
Date
May 1, 1941Aug. 11, 1941
Apr. 14, 1942
June 12, 1943
May 17, 1944May 24, 1944
May 6, 1945
Apr. 18, 1946
May 3, 1947May 11, 1947
Gage height (feet)
5.747.64
5.45
4.97
5.325.06
4.61
4.74
6.865.38
Discharge (cfs)
5621,270
552
411
507405
306
353
1,030448
Water year
1948
1949
1950
1951
1952
1953
1954
Date
May 20, 1948
June 6, 1949
May 17, 1950May 22, 1950
May 19, 1951
Apr. 27, 1952
May 29, 1953June 15, 1953
May 10, 1954
Gage height (feet)4.37
4.49
5.244.62
3.57
4.83
4.495.77
4.06
Discharge (cfs)
364
406
608414
171
475
387715
274

YELLOWSTONE RIVER BASIN 287
Peak stages and discharges of North Pork Powder River near Mayoworth, Wyo. Continued
Water year
1955
1956
1957
1958
1959
Date
June 15, 1955
June 14, 1956 June 18, 1956
June 11, 1957
May 7, 1958
June 4, 1959June 22, 1959
Oage height (feet)
4.46
4.89 4.52
4.00
4.62
3.443.43
Discharge (cfs)
370
486 394
251
400
139
Water year
1960
1961
1962
1963
Date
Apr. 24, 1960
May 11, 1961
Apr. 24, 1962 May 9, 1962
June 2, 1963 Sept. 21, 1963
Gage height (feet)
3.89
4.26
5.17 4.69
4.48 4.80
Ilscharge (cfs)
230
314
554 444
384464
3125. Powder River near Kaycee, Wyo. (Published as "Middle Fork Powder River" prior to October 1961)
Location.--Lat 43°42', long 106°31', in sec.13, T.43 N., R.81 W., on left bank at Jay Bar U Ranch 450 ft downstream from headgate of Sahara Canal, 1^ miles downstream from North Fork Powder River, and 6 miles east of Kaycee.
Drainage area. 980 sq mi, approximately.
Gage. Nonrecording prior to Nov. 16, 1940; recording thereafter. Datun of gage is 4,533.76 ft above mean sea level, datum of 1929.
Stage-discharge relation. Defined by current-meter measurements below1,900 cfs and extended above on basis of slope-area measurements at gage heights 8.98, 11.17, and 12.57 ft.
Historical data. Maximum stage known, that of Sept. 30, 1923, from information by local resident.
Remarks. Diversions above station for irrigation of about 27,000 acres materi ally affect peak flows. Only annual peaks are shown prior to 1949. Base for partial-duration series, 930 cfs.
Peak stages and discharges
Water year
1923
1934 1935
1936
193819391940
19411942194319441945
194619471948
1949
1950
1951
1952
Date
Sept. 30, 1923
June 6, 1934 May 31, 1935
June 1936
May 1, 1938June 1, 1939Sept. 30, 1940
Aug. 11, 1941Apr. 15, 1942June 12, 1943May 19, 1944June 11, 1945
July 2, 1946May 6, 1947Feb. 18, 1948May 21, 1948
Feb. 25, 1949Apr. 30, 1949
May 18, 1950
Sept. 7, 1951
Mar. 29, 1952May 22, 1952
Gage height (feet)
18
8.84 5.92
14.3
6.205.626.20
12.577.927.80
11.158.09
8.229.57
a6.27-
a5.473.66
6.34
7.57
4.815.10
Discharge (cfs)
-
2,160 1,040
_
1,140974
1,130
5,2301,7301,6903,8601,940
2,0003,280
-1,360
-614
1,570
2,060
9981,100
Water year
1953
1954
1955
1956
1957
1958
1959
1960
1961
1962
1963
Date
June 6, 1953June 15, 1953
May 11, 1954
May 15, 1955
Mar. 4, 1956May 10, 1956
June 21, 1957
May 13, 1958
May 17, 1959
Mar. 9, I960Apr. 24, 1960
May 25, 1961
Apr. 26, 1962May 26, 1962June 1, 1962June 13, 1962June 15, 1962July 14, 1962
Oct. 6, 1962Apr. 28, 1963June 3, 1963June 15, 1963
Gage height (feet)
5.655.33
3.34
5.63
a3.593.20
5.07
5.35
4.65
a4.663.19
4.66
5.895.909.306.138.528.74
5.245.845.235.98
Discharge (cfs)
1,2901,180
461
1,210-402
980
1,160
S42
-389
839
1,2401,2402,8001,3302,4102,520
9521,220
9721,270
a Backwater from ice.

288 YELLOWSTONE RIVER BASIN
3130. South Pork Powder River near Kaycee, Wyo.
Location. Lat 43°37', long 106°34', in SE£ sec.9, T.42 N., R.81 W., on right bank 300 ft upstream from bridge on U.S. Highway 87, ij miles upstream from Murphy Creek, 6.6 miles southeast of Kaycee, and 7 miles upstream from mouth.
Drainage area. 1,150 sq mi, approximately.
Gage. Nonrecording prior to June 30, 1940; recording thereafter. At site 300 ft upstream prior to Dec. 4, 1956. At datum 0.77 ft lower prior to June 30, 1940, and at datum 1.13 ft higher May 1, 1950, to Dec. 3, 1956. Altitude of gage is 4,650 ft (estimated from nearby U.S. Coast and Geodetic Survey level line ).
Stage-discharge relation. Defined by current-meter measurements below 3,800 cfs and extended above on basis of slope-area measurement at 35,500 cfs.
Remarks. Diversions above station for irrigation of about 4,350 acres. Natu ral flow of stream affected by storage in many small reservoirs (combined capacity, 1,300 acre-ft) above station. Diversions and storage do not materially affect peak flows. Base for partial-duration series, 1,000 cfs.
Peak stages and discharges
Water year
1938
1939
1940
1950
1951
1952
1953
1954
1955
Date
July 26, 1938
Mar. 12, 1939June 1, 1939
Feb. 27, 1940Apr. 18, 1940
May 9, 1950
Sept. 7, 1951
May 22, 1952
June 15, 1953July 16, 1953July 18, 1953July 29, 1953
July 17, 1954
Mar. 10, 1955Mar. 10, 1955Mar. 30, 1955June 24, 1955
Oage height (feet)
8.80
a5.295.08
a4.203.88
-
5.05
7.87
2.302.753.502.80
7.20
a5.63.953.552.52
Discharge (cfs)
12,400
_2,810
_957
b450
4,380
14,400
1,2501,5802,7201,580
12,100
-2,1202,4601,280
Water year
1955
1956
1957
1958
1959
1960
1961
1962
1963
Date
July 23, 1955
Mar. 19, 1956May 27, 1956
July 19, 1957
July 25, 1958
Mar. 2, 1959Sept. 24, 1959
Mar. 10, 1960June 10, 1960
July 8, 1961
May 22, 1962
Oct. 6, 1962Apr. 29, 1963May 26, 1963June 1, 1963Sept. 22, 1963
Gage height (feet)
4.28
3.603.55
2.84
3.77
a4.663.21
a5.983.76
5.40
13.17
5.803.202.892.987.35
Discharge (cfs)
3,920
2,5502,470
558
1,090
-795
_880
2,000
035,500
7,6801,2301,0001,120
12,000
a Backwater from ice. b Maximum daily. c Annual peak only.
3135. Powder River at Sussex, Wyo.
Location.--Lat 43°42', long 106°17', in sec.13, T.43 N., R.79 W., on left bank at Sussex, 100 ft downstream from bridge on county road and 3j miles down stream from Salt Creek.
Drainage area.--3,090 sq mi, approximately.
Gage.--Nonrecording prior to June 30, 1940; recording thereafter. At site TOO ft upstream at datum 1.07 ft higher Apr. 10, 1938, to Jun? 30, 1940. Datum of gage is 4,362.16 ft above mean sea level, datum of 1929 (Bureau of Reclamation bench mark).
Stage-discharge relation. Defined by current-meter measurements below 2,700 cfs and extended above on basis of slope-area measurement at 32,500 cfs.
Bankfull stage.--10 ft.
Historical data.--Maximum stage known, that of Sept. 30, 1923, from information by local resident.
Remarks. Diversions above station for irrigation of about 37,50") acres. Natu ral flow is regulated by many small reservoirs (combined capacity, 5,820 acre-ft). Diversions and regulation do not materially affect peak flows. Base for partial-duration series, 2,000 cfs.

YELLOWSTONE RIVER BASIN 289
Peak stages and discharges of Powder River at Sussex, Wyo.
Water year
1923
1938
1939
1940
1950
1951
1952
Date
Sept. 30, 1923
July 16, 1938 July 26, 1938
Mar. 12, 1939 June 1, 1939
Feb. 27, 1940 Apr. 19, 1940
Feb. 8, 1950 May 18, 1950
Sept. 7, 1951
May 9, 1952
Gage height (feet)
a!3.6
7.41 8.73
b9.22 b5.50
b5.43 4.47
b6.30 5.42
7.00
6.45
Discharge (cfs)
-
8,710 9,390
3,630
1,610
1,680
5,270
4,160
Water year
1952
1953
1954
1955
1956
1957
Date
May 23, 1952
Aug. 3, 1953
July 17, 1954
Mar. 10, 1955 Mar. 30, 1955 Apr. 10, 1955 June 17, 1955 June 26, 1955
Mar. 4, 1956 May '28, 1956
June 11, 1957
Gage height (feet)
12.6
4.94
7.66
6.15 6.62 5.35 9.50 5.52
b6.065.45
5.75
Discharge (cfs)
32,500
2,080
8,680
3,080 5,490 2,270
16,600 2,420
1,660
2,400
a Annual peak only; present datum, b Backwater from ice.
3140. North Fork Crazy Woman Creek near Buffalo, Wyo.
Location. Lat 44°11'20", long 106°49'50", In sec.27, T.49 N. , R.83 W.,lj miles upstream from Spring Draw, 3^ miles upstream from Elgin Creek:, and 13 miles southwest of Buffalo.
Drainage area. 44.9 sq mi.
Gage. Recording. Altitude of gage is 5,900 ft (from topographic map).
Stage-discharge relation.--Defined by current-meter measurements below 180 cfs and extended above on basis of slope-area measurement at 611 cfs at site 3^ miles downstream.
Remarks. Records for 1944 furnished by Bureau of Reclamation. Base for partial-duration series, 160 cfs.
Peak stages and discharges
Water year
1944
1945
1946
Date
May 18, 1944 May 24, 1944 June 17, 1944
June 6, 1945 June 24, 1945
June 6, 1946
Gage height (feet)
3.42 3.53 3.64
3.56 4.40
3.32
Discharge (cfs)
213 239 266
200 426
156
Water year
1947
1948
1949
Date
May 3, 1947 May 11, 1947
May 29, 1948 July 14, 1948
June 6, 1949 June 12, 1949
Gage height (feet)
3.57 3.35
3.35 3.41
5.56 4.25
D'.scharge (cfs)
222170
170 188
611 297
3145. North Fork Crazy Woman Creek below Spring Draw, near Buffalo, Wyo.
Location. Lat 44°11'50", long 106°46'25", in NW^NW^ sec.30, T.49 N., R.82 W., on right bank if miles upstream from Spring Draw and II miles southwest of Buffalo.
Drainage area. 51.7 sq mi.
Gage.--Recording. Altitude of gage is 5,320 ft (from topographic map).
Stage-discharge relation.--Defined by current-meter measurements below 180 cfs and extended above on basis of slope-area measurement at 1,020 cfs.
Bankfull stage. 6 ft.
Remarks.--Diversions above station for irrigation of about 870 acres do not materially affect peak flows. Base for partial-duration series, 160 cfs.

290 YELLOWSTONE RIVER BASIN
Peak stages and discharges of North Pork Crazy near Buffalo, Wyo
Woman Creek below Spring Draw,
Water year
1949
1950
1951
1952
1953
1954
1955
1956
1957
Date
June 6, 1949
May 16, 1950
May 29, 1951
May 25, 1952
June 15, 1953
May 22, 1954
June 16, 1955
May 28, 1956
June 10, 1957June 16, 1957
Gage height (feet)
5.42
4.54
3.88
4.29
4.96
3.73
4.43
4.09
4.574.42
Discharge (cfs)
610
294
97
197
446
82
259
166
299244
Water year
1958
1959
1960
1961
1962
1963
Date
Jan. 1, 1958May 11, 1958
June 8, 1959June 22, 1959
Dec. 31, 1959May 13, I960
Jan. 28, 1961May 30, 1961
June 12, 1962June 16, 1962
June 2, 1963June 15, 1963
C-age height (feet)
a4.114.05
4.124.28
a3.803.74
a4.053.88
4.574.76
4.895.83
Discharge (cfs)
155
167282
-62
-92
314390
4451,020
a Backwater from ice.
3150. North Pork Crazy Woman Creek near Greub, Wyo.
Location. Lat 44"04'50", long 106°39'40", in SW£ sec.36, T.48 N., R.82 W., on left bank 1 mile upstream from Middle Pork, 5 miles northeast of Greub, and 18 miles south of Buffalo.
Drainage area.--174 sq mi.
Gage. Nonrecording prior to Sept. 13, 1950; recording thereafter. Altitude of gage is 4,650 ft (from topographic map).
Stage-discharge relation. Defined by current-meter measurements below 260 cfs and extended above on basis of slope-area measurements at gage heights 7.00 and 9.05 ft, and slope-conveyance study.
Remarks.--Storage in 5 small reservoirs (combined capacity, 730 acre-ft) and diversions for irrigation of about 11,500 acres materially affect peak flows. Base for partial-duration series, 180 cfs.
Peak stages and discharges
Water year
1949
1950
1951
1952
1953
1954
1955
1956
1957
1958
Date
June 7, 1949
May 18, 1950
Sept. 7, 1951
May 26, 1952
June 15, 1953
June 27, 1954
June 16, 1955
May 27, 1956
May 29, 1957June 10, 1957June 16, 1957
May 6, 1958
Gage height (feet)
6.45
4.12
2.86
3.10
7.00
4.98
5.36
3.20
4.424.325.15
2.79
Discharge (cfs)
a580
344
124
170
619
404
446
199
332320412
134
Water year
1959
1960
1961
1962
1963
Date
June 30, 1959
Mar. 10, 1960June 30, 1960
May 22, 1961
Oct. 10, 1961May 26, 1962May 28, 1962June 13, 1962June 17, 1962June 29, 1962July 12, 1962
Apr. 27, 1963June 3, 1963June 16, 1963Sept. 21, 1963
Cage height (feet)
3.13
1:3.192.78
2.57
3.614.826.609.057.277.924.71
3.355.587.056.09
Discharge (cfs)
180
_138
102
243367582
1,0506S6784356
212455632516
a Annual peak only, b Backwater from ice.

YELLOWSTONE RIVER BASIN 291
3155. Middle Pork Crazy Woman Creek near Greub, Wyo.
Location.--Lat 44°03'40", long 106°48'00", in sec. 11, T.47 N., R.83 W. , on left bank a quarter of a mile downstream from Poison Creek, 2^ miles west of Greub, and 21 miles southwest of Buffalo.
Drainage area. 82.7 sq mi.
Gage. Nonrecording prior to 1944; recording thereafter. At datum 0.67 ftlower prior to June 7, 1952. Altitude of gage is 5,190 ft (from topographic map).
Stage-discharge relation. Defined by current-meter measurements below 200 cfs and extended above by logarithmic plotting.
Remarks.--Records for 1942-44 furnished by Bureau of Reclamation. Diversions above station for irrigation of about 340 acres do not materially affect peak flows. Base for partial-duration series, 140 cfs.
Peak stages and discharges
Water year
1942
1943
1944
1945
1946
1947
1948
1949
1950
Date
Apr. 14, 1942
June 12, 1943
May 9, 1944May 18, 1944May 24, 1944May 31, 1944June 4, 1944June 9, 1944June 17, 1944
May 1, 1945June 6, 1945June 14, 1945June 24, 1945July 12, 1945
Mar. 29, 1946
Apr. 29, 1947May 2, 1947May 11, 1947May 27, 1947May 31, 1947June 12, 1947June 21, 1947
Apr. 17, 1948May 30, 1948
June 6, 1949June 8, 1949June 12, 1949June 19, 1949
Apr. 14, 1950May 16, 1950
Gage height (feet)
2.94
3.75
2.863.452.952.803.253.173.31
3.132.902.772.972.53
2.33
4.805.77-
2.222.332.112.27
2.282.37
3.282.652.842.44
2.823.46
Discharge (cfs)
169
37S
260409282246357336373
350278240299174
128
2,5504,520
206176209148191
194221
564264400242
390788
Water year
1950
1951
1952
1953
1954
1955
1956
1957
1958
1959
1960
1961
1962
1963
Date
June S, 1950
Apr. 28, 1951
Apr. 19, 1952May 22, 1952
June 15, 1953
June 26, 1954
June 15, 1955
May 28, 1956
May 13, 1957June 11, 1957June 16, 1957
Apr. 17, 1958May 3, 1958
June 22, 1959
Mar. 26, 1960Mar. 26, 1960
July 7, 1961
Apr. 15, 1962May 26, 1962June 16, 1962June 29, 1962
Apr. 27, 1963June 15, 1963Sept. 21, 1963
Gage height (feet)
2.17
2.25
3.832.44
2.68
2.72
2.30
2.28
2.412.262.43
3.733.01
2.12
a2.822.74
2.47
3.172.452.732.68
2^862.844.78
Discharge (cfs)
168
191
635175
285
295
192
215
258188230
503271
93
-208
155
331184254206
235251
1,030
a Backwater from debris.

292 YELLOWSTONE RIVER BASIN
3165. Crazy Woman Creek near Arvada, Wyo.
Location. Lat 44°29' , long 106°09', in NW£ sec. 16, T.52 N., R.77 W., on left bank 200 ft upstream from county highway bridge, 1 mile upstream from mouth, and ll*r miles south of Arvada.
Drainage area. 956 sq mi.
Gage.--Nonrecording prior to Jan. 1, 1944; recording thereafter. At site half a mile upstream at different datum prior to Dec. 31, 1943. latum of gage is 3,737.07 ft above mean sea level, datum of 1929.
Stage-discharge relation. Defined by current-meter measurements below 1,700 cfs.
Remarks.--Diversions above station for irrigation of about 30,OCO acres materi ally affect peak flows. Only annual peaks are shown.
Peak stages and discharges
Water year
1940
1941 1942 1943
1950
1951 1952
1953 1954
Date
June 6, 1940
July 13, 1941 June 4, 1942 Mar. 25, 1943 Mar. 26, 1943
May 20, 1950
Sept. 7, 1951 Apr. 21, 1952 May 24, 1952 June 14, 1953 Aug. 17, 1954
Qage height (feet)
5.98
9.46 6.90
a7.92 7.02
5.07
5.9 5.75
bSTOT 9.7 8.90
Discharge (cfs)
804
1,850 1,080
1,010
488
619 393
1,670 1,430
Water year
1955
1956
1957 1958 1959 1960
1961
1962 1963
Date
Mar. 30, 1955 Aug. 7, 1955
Mar. 20, 1956 Mar. 20, 1956 June 6, 1957 July 3, 1958 June 25, 1959 June 10, 1960
Feb. 9, 1961 July 31, 1961 July 14, 1962 June 15, 1963
Qage hslght (feet)all. 32 10.39
all. 45 9.13
11.05 7.75 7.50 9.93
a5.42 4.84
12.79 9.50
Discharge (cfs)
1,890
0900 2,130
989 936
1,690
323 2,900 1,560
a Backwater from ice. b Backwater, e About.
3170. Powder River at Arvada, Wyo.
Location. Lat 44°39', long 106°08', in NE^NW^- sec.21, T.54 N., R.77 W. , on left bank 2,500 ft upstream from highway bridge, half a mile southwest of Arvada, and three-quarters of a mile upstream from Wild Horse Creek.
Drainage area. 6,050 sq mi, approximately.
Gage. Nonrecording at bridge 2,500 ft downstream at datum 0.14 ft lower prior to Oct. 24, 1938; recording thereafter. Datum of gage is 3,632.01 ft above mean sea level, datum of 1929.
Stage-discharge relation. Defined by current-meter measurements below 32,000 cfs.
Bankfull stage.--11 ft.
Remarks. Many small storage reservoirs above station for livestock, irrigation, and oil production (combined capacity, 7,900 acre-ft per year). Diversions above station for irrigation of about 75,000 acres. Storage and diversions materially affect peak flows. Only annual peaks are shown prior to 1949. Base for partial-duration series, 2,200 cfs.
Peak stages and discharges
Water year
19191920
19211922
19231924
1925
Date
Aug. 3, 1919June 19, 1920
June 3, 1921Mar. 16, 1922Aug. 3, 1922Sept. 29, 1923Oct. 1, 1923Apr. 5, 1924June 16, 1925
Qage height (feet)
3.678.25
6.9a5.885.83
23.7-
10. e16.6
Discharge (cfs)
2,46010,700
6,010-
6,030b 100, 000e46,50024,60050,000
Water year
19261927192819291930
1931193219331934
Date
July 10, 1926Aug. 15, 1927Oct. 2, 1927Mar. 7, 1929Aug. 13, 1930
July 18, 1931May 7, 1932Aug. 29, 1933July 26, 1934
Gage height (feet)
7.006.505.20
a8.805.40
5.755.907.605.13
Discharge (efs)
11,60010,2007,000
10,3007,500
8,3808,750
13,4006,560
a Backwater from ice. b About. c Maximum dally.
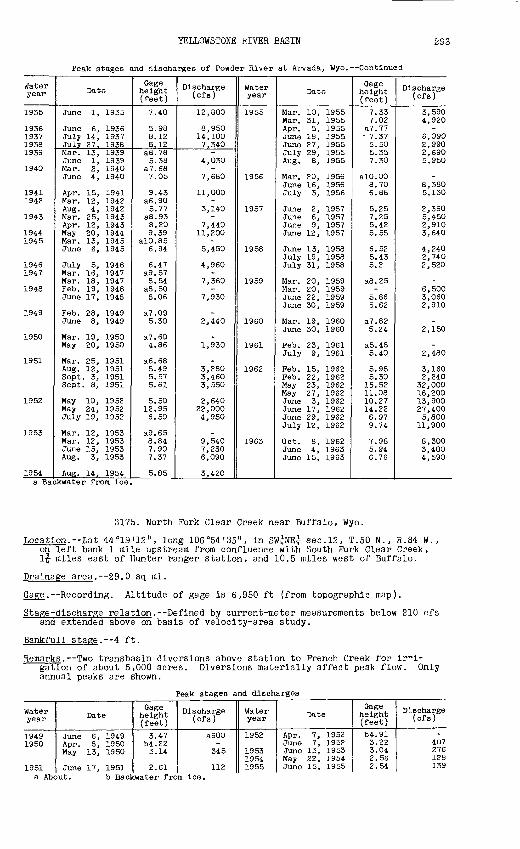
YELLOWSTONE RIVER BASIN 293
Peak stages and discharges of Powder River at Arvada, Wyo. Continued
Water year
1935
1936193719381939
1940
19411942
1943
19441945
19461947
1948
1949
1950
1951
1952
1953
1954
Date
June 1, 1935
June 6, 1936July 14, 1937July 27. 1938Mar. 13, 1939June 1, 1939Mar. 2, 1940June 4, 1940
Apr. 15, 1941Mar. 12, 1942Aug. 4, 1942Mar. 25, 1943Apr. 12, 1943May 20, 1944Mar. 13, 1945June 6, 1945
July 5, 1946Mar. 16, 1947Mar. 18, 1947Feb. 19, 1948June 17, 1948
Feb. 28, 1949June 8, 1949
Mar. 19, 1950May 20, 1950
Mar. 25, 1951Aug. 12, 1951Sept. 3, 1951Sept. 8, 1951
May 10, 1952May 24, 1952July 19, 1952
Mar. 12, 1953Mar. 12, 1953June 15, 1953Aug. 3, 1953
Aug. 14, 1954
Gage height (feet)
7.40
5.988.125.12
a8.785.38
a7.687.05
9.43a6.905.77
a8.938.209.39
alO.856.94
6.47a9.578.54
a8.508.06
a7.095.30
a7.604.86
a6.685.495.575.61
5.5012.956.50
a9.658.847.907.37
5.85
Discharge(Of 8)
12,800
8,95014,1007,340
-4,030
-7,680
11,000-
3,140-
7,44011,200
-5,450
4,960-
7,360-
7,930
-2,440
-1,930
-3,2803,4603,550
2,64022,0004,950
-9,5407,2306,090
3,420
Water year
1955
1956
1957
1958
1959
1960
1961
1962
1963
Date
Mar. 10, 1955Mar. 31, 1955Apr. 5, 1955June 18, 1955June 27, 1955July 29, 1955Aug. 8, 1955
Mar. 20, 1956June 16, 1956July 3, 1956
June 2, 1957June 6, 1957June 9, 1957June 12, 1957
June 13, 1958July 19, 1958July 31, 1958
Mar. 20, 1959Mar. 20, 1959June 22, 1959June 30, 1959
Mar. 19, 1960June 30, 1960
Feb. 23, 1961July 9, 1961
Feb. 15, 1962Feb. 22, 1962May 23, 1962May 27, 1962June 3, 1962June 17, 1962June 29, 1962July 12, 1962
Oct. 8, 1962June 4, 1963June 15, 1963
Gage height (feet)
7.337.02
a7.77- 7.375.505.357.30
alO.OO8.706.88
5.257.255.425.55
6.525.435.2
a8.25-
5.865.62
a7.825.24
a5.485.40
5.985.30
15.5211.0810.2714.226.979.74
7.985.946.76
Discharge (cfs)
3,5904,920
-6,0902,9902,6905,950
-8,3805,130
2,3605,4502,9103,640
4,2402,7402,520
-6,5003,0602,910
-2,150
-2,480
3,1602,240
32,00016,20013,90027,4005,800
11,900
8,3003,4004,590
a Backwater from ice.
3175. North Fork Clear Creek near Buffalo, Wyo.
Location. Lat 44 "19 "12", long 106°54'35", in SW^NE^ sec.12, T.50 N., R.84 W., on left bank 1 mile upstream from confluence with South Fork Clear Creek, if miles east of Hunter ranger station, and 10.5 miles west of Buffalo.
Drainage area. 29.0 sq mi.
Gage. Recording. Altitude of gage is 6,950 ft (from topographic map).
Stage-discharge relation. Defined by current-meter measurements below 210 cfs and extended above on basis of velocity-area study.
Bankfull stage. 4 ft.
Remarks. Two transbasin diversions above station to French Creek for ir-i- gation of about 5,000 acres. Diversions materially affect peak flow. Only annual peaks are shown.
Peak stages and discharges
Water year
19491950
1951
Date
June 6, 1949Apr. 8, 1950May 13, 1950
June 17, 1951
Gage height (feet)
3.47b4.223.14
2.61
Discharge (cfs)
a 600-
345
112
Water year
1952
195319541955
Date
Apr. 7, 1952June 7, 1952June 13, 1953May 22, 1954June 15, 1955
Gage height (feet)
b4.913.223.042.562.54
Discharge (cfs)
-407276128139
a About. b Backwater from ice.

294 YELLOWSTONE RIVER BASIN
Peak stages and discharges of North Fork Clear Creek near Buffalo, Wyo.--Continued
Water year
1956 1957 1958
1959 1960
Date
June 5, 1956 June 6, 1957 Apr. 17, 1958 May 21, 1958 June 7, 1959 Mar. 21, 1960
Qage height (feet)
2.51 2.99
b3.40 2.62 2.63
b3.02
Discharge (cfs)
129 246
156 154
Water year
1960
1961
1962 1963
Date
June 8, 1960
Jan. 4, 1961 May 29, 1961 June 16, 1962 June 15, 1963
Qage height (feet)
2.34
b4.02 2.58 3.24 3.95
Discharge (cfs)
100
144 333 675
b Backwater from ice.
3185. Clear Creek near Buffalo, Wyo. (Published as "at Buffalo" 1897-98)
Location.--Lat 44°20'00", long 106°46'10", in sec.6, T.50 N., R.82 W., on left bank at mouth of canyon, 500 ft upstream from Pacific Power and Light Co.'s powerplant and 4 miles west of Buffalo.
Drainage area.--120 sq mi, approximately.
Gage.--Nonrecording June 16, 1917, to Oct. 31, 1927, and Apr. 8 to Sept. 30, 1938; recording before and after. At site 1 mile upstream at different datum prior to Dec. 31, 1899. At site 160 ft downstream at different datum June 16, 1917, to Oct. 31, 1927. At datum 2.00 ft higher Apr. 8 to Sept. 30, 1938. Datum of gage is 5,184.83 ft above mean sea level, datum of 1929.
Stage-discharge relation. Defined by current-meter measurements below 900 cfs and extended above on basis of area-velocity study.
Remarks.--Records for 1894, 1896-99, furnished by State engineer of Wyoming. Transbasin diversion above station from North Fork to French Creek for irri gation of about 5,000 acres. Diversions above station for irrigation of about 600 acres in Clear Creek basin. Since 1914 an average daily flow of about 7 cfs has been diverted ij miles above station into Pacific Power and Light Co.'s pipeline. Diversions materially affect peak flows. Only annual peaks are shown prior to 1949. Base for partial-duration series, 380 cfs.
Peak stages and discharges
Wateryear
1894
1896189718981899
1917191819191920
1921192219231924
1925
19261927
193819391940
19411942194319441945
Date
June 3, 1894
June 3, 1896June 1, 1897May 29, 1898June 19(21, 1S99
June 18, 1917June 10, 1918May 21, 1919June 11, 1920
June 8, 1921May 26, 1922June 16, 1923Dec. 31, 1923June 3, 1924May 22, 1925
May 27, 1926June 2S, 1927
May 30, 1938May 31, 1939June 3, 1940
May 3, 1941May 27, 1942June 12, 1943May 24, 1944June 24, 1945
a Maximum daily.
Qage height (feet)
-
----
4.23.72.83.9
3.63.583.62
b4.44-
3.44
3.664.78
3.644.473.61
4.214.044.414.895.35
Discharge (cfs)
a853
a 504a657
al,060a77S
1,120850433910
7S5780770-880690
8021,380
814723356
5294626S3910
1,280
Water year
194619471948
1949
1950
1951
1952
1953
1954
1955
1956
1957
1958
Date
June 6, 1946May 11, 1947May 19, 194S
June 6, 1949June 12, 1949
May 16, 1950June 7, 1950June 18, 1950June 25, 1950
May 29, 1951
Apr. 29, 1952June 7, 1952July 13, 1952
June 15, 1953
May 22, 1954
June 17, 1955
May 27, 1956
June 11, 1957July 1, 1957
May 11, 1958May 25, 1958
Qage height (feet)3.934.304.46
5.404.60
3.833.S63.783.84
3.86
3.884.853.9S
4.46
3.79
3.77
3.83
4.663.78
3.994.36
Discharge (cfs)
427705719
1,310816
414427392418
427
414961483
880
360
380
462
836413
387514
b Backwater from ice.

YELLOWSTONE RIVER BASIN 295
Peak stages and discharges of Clear Creek near Buffalo, Wyo. Continued
Water year
1959
1960
1961
Date
Dec. 1, 1958June 8, 1959
Jan. Z, 1960June 10, 1960
May 30, 1961
Gage height (feet)b4.214.08
b4.093.65
4.02
Discharge (cfs)
_470
-345
426
Water year
1962
1963
Date
June 16, 1962
June 2, 1963June 15, 1963
Gage height (feet)
5.29
5.246.19
T'.scharge (cfs)
1,380
1,6503,420
b Backwater from ice.
3200. Rock Creek near Buffalo, Wyo.
Location. Lat 44°27'20", long 106°52'30", In NW£ sec.29, T.52 N., R.83 W., on left bank 300 ft downstream from confluence of North and South Porks and 11.5 miles northwest of Buffalo.
Drainage area. 60.0 sq ml.
Gage. Recording. Altitude of gage Is 5,260 ft (from topographic map).
Stage-discharge relation. Defined by current-meter measurements below 450 cfs and extended above on basis of slope-area measurement at 1,860 cfs.
Remarks. Diversions above station for Irrigation of about 1,250 acres. Water Imported from South Plney Creek to Rock Creek above station for Irrigation of about 6,500 acres. Diversions materially affect peak flows. Only annual peaks are shown prior to 1949. Base for partial-duration series, 440 cfs.
Peak stages and discharges
Water year
1941 1942 1943 1944 1945
1946 1947 1948
1949
1950
1951
1952
1953
Date
May 12, 1941 May 26, 1942 May 29, 1943 June 2, 1944 June 24, 1945
June 5, 1946 May 11, 1947 May 19, 194S
June 6, 1949
June 6, 1950
May 28, 1951
May 25, 1952
June 10, 1953
Gage height (feet)
7.56 7.60
5.95 6.33 6.60
6.77
6.09
5.31
5.84
5.74
Discharge (cfs)
a633 a602 a652 1,770 1,810
430 694 910
1,020
518
216
368
338
Water year
1954
1955
1956
1957
1958
1959
1960
1961
1962 1963
Date
May 22, 1954
June 17, 1955
May 28, 1956
June 16, 1957
May 26, 1958
June 17, 1959
June 17, 1960
May 30, 1961
June 16, 1962 June 3, 1963 June 15, 1963
Gage height (feet)
4.99
5.26
5.72
5.86
5.45
6.14
4.85
5.78
7.58 6.40 7.98
Discharge (cfs)
146
208
324
409
253
650
124
326
1,340 720
1,360a Maximum daily discharge, from files of U.S. Bureau of Reclamation and Geological
Survey .

296 YELLOWSTONE RIVER BASIN
3205. South Piney Creek at Willow Park, Wyo.
Location. Lat 44°28'03", long 107°01'55", in NW^NE^ sec.24, T.52 N., R.85 W., on left bank about 400 ft downstream from Willow Park Dam, 1.4 miles up stream from Kearney Creek, and 10 miles southwest of Story.
Drainage area.--33.6 sq mi.
Gage. Recording. At site 600 ft upstream at different datum prior to Oct. 1, 1957. Altitude of gage is 8,540 ft (from topographic map).
Stage-discharge relation. Defined by current-meter measurements below 370 cfs and extended above on basis of slope-area measurement at 1,620 cfs.
Remarks.--Some regulation by Cloud Peak Reservoir (capacity, 2,720 acre-ft), storage of which is diverted into Rock Creek just below station by Rock Creek and Piney Reservoir and Ditch Co.'s canal. Some regulation by Willow Park Reservoir (capacity, 4,457 acre-ft), beginning April 1959. Regulation does not materially affect peak flows prior to Willow Park Reservoir com pletion. Only annual peaks shown for 1946"and 1960-63. Base for partial-duration series, 200 cfs.
Peak stages and discharges
Water year
1946
1948
1949
1950
1951
Date
June 5, 1946
May 22, 1948May 30, 1948June 22, 1948July 14, 1948
May 16, 1949June 6, 1949June 11, 1949June 19, 1949July 11, 1949
June 7, 1950June 12, 1950June 18, 1950June 25, 1950July 2, 1950
May 24, 1951May 28, 1951July 21, 1951
Gage height (feet)4.45
4.293.733.383.39
.4.653.373.793.52
---
4.073.20
3.253.503.36
Discharge (cfs)
500
438315242244
a230604258346288
b360b350b340409224
234284256
Water year
1952
1953
1954
1955
1956
1957
1960
196119621963
Date
June 7, 1952July 13, 1952
June 2, 1953June 15, 1953Aug. 2, 1953
May 21, 1954June 27, 1954
June 26, 1955
May 28, 1956
June 10, 1957
May 25, 1960
June 11, 1961June 16, 1962June 15, 1963
Gage height (feet)4.774.28
-4.653.31
3.333.39
3.52
3.71
4.79
2.11
2.583.054.68
Discharge (cfs)
642492
b270604246
251264
288
340
649
181
295416
1,620
a Estimated.b Daily mean, estimated.
3210. South Piney Creek near Story, Wyo.
Location. Lat 44°33'25", long 106°56'10", in NE£ sec.23, T.53 N., R.84 W., on left bank 2.3 miles southwest of Story and 3.3 miles upstream from conflu ence with North Piney Creek.
Drainage area. 70.5 sq mi.
Gage. Nonrecording at site 500 ft upstream at different datum prior to Oct. 1, 1951; recording thereafter. Altitude of gage is 5,700 ft (from topographic map).
Stage-discharge relation. Defined by current-meter measurements below 1,100 cfs.
Remarks. Some regulation by Kearney Lake (capacity, 1,860 acre-ft), Cloud Peak Reservoir (capacity, 3,385 acre-ft), and Willow Park Reservoir (capacity, 4,457 acre-ft). Storage of Cloud Peak Reservoir is diverted above station into Rock Creek for irrigation by Rock Creek and Piney Reservoir and Ditch Co.'s canal. Diversion for irrigation of about 6,500 acres above station into Rock Creek by Rock Creek and Piney Reservoir and Ditch C?.'s canal. Diversions and storage materially affect peak flows. Base fo^ partial- duration series, 250 cfs. Only annual peaks are shown for 19"! and 1959-63.

YELLOWSTONE RIVER BASIN 297
Peak stages and discharges of South Piney Creek near Story, Wyo.
Water year
1951
1952
1953
1954
1955
Date
July 22, 1951
May 4, 1952June 7, 1952June 27, 1952July 13, 1952
June 2, 1953June 15, 1953
May 20, 1954June 28, 1954
June 17, 1955June 26, 1955
Gage height (feet)2.50
3.264.362.833.61
3.58-
3.002.73
2.923.00
Discharge (ofs)
a322
5191,260
350826
526bl,100
471320
416460
Water year
1956
1957
1958
19591960
196119621963
Date
May 28, 1956
June 10, 1957June 30, 1957
May 21, 1958May 31, 1958
June 16, 1959June 12, 1960
May 30, 1961June 16, 1962June 15, 1963
Gage height (feet)
3.43
4.002.38
3.473.08
3.032.51
3.123.54
05.30
Discharge (ofs)
805
1,350476
728656
484239
475638
2,090
a Maximum observed during period June to September.b About.o Backwater from slide.
3215. North Piney Creek near Story, Wyo.
Location. Lat 44°34'50", long 106°55'55", in NW&SW£ sec.12, T.53 N., R.84 W., on left bank 2.1 miles west of Story and 3.2 miles upstream from confluence with South Piney Creek.
Drainage area.--37.7 sq mi.
Gage. Nonrecording prior to Sept. 14, 1951; recording thereafter. Altitude of gage is 5,290 ft (from topographic map).
Stage-discharge relation. Defined by current-meter measurements below 1,000 cfs.
Remarks. Base for partial-duration series, 200 cfs.
Peak stages and discharges
Water year
1952
1953
1954
1955
1956
1957
Date
Apr. 28, 1952May 22, 1952
May 29, 1953June 15, 1953
May 20, 1954
May 16, 1955May 22, 1955June 5, 1955
May 28, 1956
May 14, 1957June 2, 1957
Gage height (feet)2.742.86
3.303.02
2.65
2.873.002.45
4.57
2.322.59
Discharge (cfs)
346394
530470
311
378430247
1,230
225297
Water year
1957
1958
1959
1960
1961
1962
1963
Date
June 10, 1957June 18, 1957
May 21, 1958
June 7, 1959
May 13, 1960
May 29, 1961
May 8, 1962June 16, 1962
June 3, 1963June 15, 1963
Gage height (feet)2.692.79
3.06
2.64
2.17
2.72
2.653.53
3.115.04
Tischarge (cfs)
348398
482
331
176
354
335706
4641,820

298 YELLOWSTONE RIVER BASIN
3230. Piney Creek at Kearney, Wyo. (Published as "near Kearneyr' 1913)
Location.--Lat 44°32'10", long 106°49'20", in sec.26, T.53 N., F.83 W., on right bank 1,000 ft south of Kearney and half a mile upstream from Little Piney Creek.
Drainage area. 106 sq mi.
Gage. Nonrecording prior to Sept. 30, 1923; recording thereafter. At dif ferent datum prior to June 30, 1906. Datum of gage is 4,655.11 ft above mean sea level, datum of 1929.
Stage-discharge relation. Defined by current-meter measurements below 1,800 cfs and extended above by logarithmic plotting.
Bankfull stage.--6 ft.
Remarks.--Records for 1910, 1913 furnished by State engineer of Wyoming. Some regulation by Cloud Peak Reservoir and Kearney Lake (combined capacity, 4,580 acre-ft). Diversions above station for irrigation of about 26,800 acres located in Piney Creek, Prairie Dog Creek, and Rock Creek basins. Regulation and diversions materially affect peak flows. Only annual peaks are shown prior to 1948. Base for partial-duration series, 750 cfs.
Peak stages and discharges
Water year
190319041905
1906
19111912191319141915
19161917
19191920
192119221923
19411942194319441945
19461947
1948
1949
Date
June 16, 1903May 23, 1904June 4, 1905
May 24, 1906
May 15, 1911June 9, 1912May 26, 1913May 24, 1914May 14, 1915
June 10, 1916June 17, 1917
May 20, 1919June 9, 1920
June 7, 1921May 28, 1922Sept. 30, 1923
May 27, 1941May 26, 1942June 12, 1943June 3, 1944June 24, 1945
June 6, 1946May 11, 1947
May 20, 1948May 30, 1948June 22, 194S
June 6, 1949
Gage height (feet)3.053.453.80
3.97
3.604.60--
4.05
4.004.70
3.304.50
3.924.254.80
4.234.683.965.324.70
4.094.05
4.533.924.42
4.17
Discharge (cfs)
S351,1401,640
1,910
6351,240a843
al,260943
9111,220
4501,130
7961,0201,260
1,1801,700
9142,5701,790
1,0701,020
1,590890
1,450
1,230
Water year
1950
1951
1952
1953
1954
1955
1956
1957
1958
1959
1960
1961
1962
1963
Date
June 7, 1950June 12, 1950
May 29, 1951
May 4, 1952June 7, 1952July 13, 1952
May 29, 1953June 15, 1953
May 21, 1954
May 22, 1955
May 2S, 1956
June 10, 1957June 17, 1957
May 21, 195S
June 16, 1959
Feb. 15, 1960Mar. 19, 1960
May 28, 1961
June 16, 1962
June 5, 1963June 15, 1963
Gage 1- eight (feet)
3.963.78
3.31
3.854.203.98
4.034.27
3.54
3.44
4.95
4.623.97
4.42
3.42
b3.212.95
3.55
4.74
4.496.05
Discharge (cfs)
1,010833
491
8981,2601,030
1,1701,480
712
610
1,840
1,450854
1,250
520
-314
582
1,610
1,3903,410
a Maximum daily mean, b Backwater from ice.

YELLOWSTONE RIVER BASIN 299
3235. Piney Creek at Ucross, Wyo.
Location. Lat 44°33'45", long 106°32'25", in SW^ sec.18, T.53 N., R.80 W., on left bank at Ucross, 190 ft upstream from bridge on U.S. Highways 14 and 16, and 1 mile upstream from mouth.
Drainage area. 267 sq mi.
Gage. Nonrecording at different datum prior to Sept. 30, 1923; recording thereafter. Datum of gage is 4,066.83 ft above mean sea level, datum of 1929.
Stage-discharge relation. Defined by current-meter measurements below 1,700 cfs.
Historical data. Maximum stage known, that of June 1, 1929, from floodmarks, from information by local resident.
Remarks.--Natural flow of stream affected by storage and some regulation for irrigation by Lake De Smet (capacity, 32,250 acre-ft), Cloud Peak Reservoir (capacity, 3,385 acre-ft), Kearney Lake (capacity, 1,860 acre-ft), an1 Willow Park Reservoir (capacity, 4,457 acre-ft) and diversions for irri gation of 33,500 acres above station. Only annual peaks are shown fo*1 1917-23. Base for partial-duration series, 750 cfs.
Peak stages and discharges
Wateryear
1917191819191920
192119221923
1929
1950
1951
1952
1953
1954
Date
June 20, 1917June 11, 1918May 21, 1919June 10, 1920
June 8, 1921June 9, 1922Sept. 28, 1923
June 1, 1929
June 8, 1950
July 11, 1951
May 5, 1952June 7, 1952July 13, 1952
May 29, 1953June 15, 1953
May 21, 1954
Qage height (feet)
4.225.003.20.4.30
3.404.406.00
10.9
4.26
3.70
4.424.694.80
4.674.92
3.98
Discharge (cfs)
1,0701,900
4601,140
5601,2602,580
-
890
420
9361,1501,240
1,0501,340
587
Water year
1955
1956
1957
1958
1959
1960
1961
1962
1963
Date
May 22, 1955
May 23, 1956May 28, 1956
June 10, 1957June 17, 1957
May 22, 1958
Jan. 9, 1959June 17, 1959
Mar. 19, 1960June 11, 1960
May 28, 1961
June 16, 1962
June 5, 1963June 16, 1963
Gage height (feet)3.97
4.665.88
5.505.18
5.31
a3.853.79
a4.203.17
3.54
6.17
5.877.33
D'.scharge (cfs)
535
8461,640
1,2201,040
1,240
-374
-180
277
1,800
1,6903,570
a Backwater from ice.
3240. Clear Creek near Arvada, Wyo.
Location.--Lat 44°52'18", long 106°04'56", in SE^ sec.36, T.57 N., R.77 W., on right bank 600 ft downstream from Cabin Creek, 1.8 miles upstream froti mouth, and 16 miles north of Arvada.
Drainage area. 1,110 sq mi, approximately.
Gage.--Nonrecording prior to Jan. 15, 1951; recording thereafter. At different datum prior to May 1, 1919. At aite a quarter of a mile upstream at differ ent datum Apr. 15, 1928, to May 26, 1929. Datum of gage is 3,506.51 ft above mean sea level, datum of 1929.
Stage-discharge relation. Defined by current-meter measurements below 6,000 cfs.
Remarks. Some regulation by Lake De Smet (capacity, 32,250 acre-ft), Cloud Peak Reservoir (capacity, 3,385 acre-ft), and Kearney Lake (capacity, 1,860 acre-ft). Diversions above station for irrigation of about 70,000 acres in Clear Creek basin. Diversions above station from North and South Forks of Piney Creek into Prairie Dog Creek (Tongue River basin) for irrigation of about 16,800 acres. Peaks for 1928 and 1929 do not include flow froir Cabin Creek because the gage was located above Cabin Creek. Diversions and regulation materially affect peak flows. Only annual peaks are showr.

300 YELLOWSTONE RIVER BASIN
Peak stages and discharges of Clear Creek near Arvada, Wyo.
Water year
191619171918
19281929
1940
194119421943
19441945
19461947
19481949
Date
June 20, 1916June 18, 1917June 8, 1918
July 17, 1928May 30, 1929
June 22, 1940
Aug. 6, 1941June 26, 1942Mar. 25, 1943Mar. 26, 1943June 22, 1944June 25, 1945
June 25, 1946Mar. 17, 1947May 12, 1947June 23, 1948June 7, 1949
Gage height (feet)
7.148.238.40
7.17all. 00
5.28
5.0010.17b9.70
-10.076.50
4.88b8.65
-5.555.97
Discharge (cfs)
1,4102,6302,840
4,5108,600
2,110
2,1609,000
-03,1008,8303,140
1,750-
2,2902,2402,500
Water year
1950
19511952
195319541955
1956
195719581959
1960
196119621963
Date
June 8, 1950
Sept. 2, 1951Mar. 29, 1952July 14, 1952June 15, 1953Aug. 5, 1954June 26, 1955
Mar. 21, 1956Mar. 21, 1956June 7, 1957June 8, 1958Mar. 18, 1959Mar. 18, 1959Mar. 20, 1960
May 30, 1961June 17, 1962June 17, 1963
a From high-water mark. l
Gage height (feet)
4.26
4.22b7.82
6.2310.456.00
blO.18
5.636.82
b7.34
5.00
3.197.889.79
Discharge (cfs)
1,380
1,280
1,7402,7009,6002,520
8,5602,3103,310
C2.8001,710
6234,9006,150
b Backwater from ice.c Maximum daily.
3245. Powder River at Moorhead, Mont.
Location.--Lat 45°04', long 105°51', in sec.8, T.9 S., R.48 E., on left bank 400 ft downstream from discontinued post office at Moorhead and 6^ miles upstream from Buffalo Creek.
Drainage area. 8,088 sq mi.
Gage.--Nonrecording prior to Aug. 28, 1931, and Mar. 22 to Sept. 12, 1956; re cording during remainder of period of record. At site a quarter of a mile upstream at different datum prior to Aug. 28, 1931. Aug. 28, 1931, to Mar. 21, 1956, at site three-quarters of a mile upstream at different datum. Mar. 22 to July 24, 1956, at site a quarter of a mile downstream at differ ent datum. Datum of gage is 3,334.6 ft above mean sea level, datum of 1929.
Stage-discharge relation. Large shifts occur. At site used 1931 to 1956, defined by current-meter measurements below 4 ,000 cfs and extended above on basis of slope-area measurement at 15,300 cfs. At present site, defined by current-meter measurements below 7,000 cfs.
Remarks.--Diversions for irrigation of about 50,000 acres. Some regulation by three reservoirs in Wyoming, with combined usable capacity of 36,800 acre-ft. Base for partial-duration series, 3,700 cfs. Only annual peaks are shown prior to 1939.
Peak stages and discharges
Water year
1923
19291930
1931193219331934
1935
193619371938
1939
Date
Sept. 30, 1923
June 3, 1929July 14, 1930
May 6, 1931June 8, 1932Aug 30, 1933Mar. 3, 1934June 16, 1934June 1, 1935
Mar. 2, 1936July 14, 1937Mar. 5, 1938May 30, 1938
Mar. 14, 1939Mar. 16, 1939June 2, 1939
Gage height (feet)
a!9
7.905.86
6.756.21
10.85d6.58
_7.58
d!5.1010.20d7.44
d7.726.257.17
Discharge (cfs)
-
b8,610b4,040
06.0403,55014,800
-1,9208,140
9,24014,500
-5,720
-4,860 7,200
Water year
1940
1941
1942
1943
Date
Mar. 3, 1940 June 4, 1940
Oct. 2, 1940Apr. 15, 1941May 6, 1941May 15, 1941May 27, 1941July 13, 1941July 28, 1941Aug. 6, 1941Aug. 13, 1941Aug. 31, 1941
Mar. 12, 1942June 5, 1942June 26, 1942
Mar. 25, 1943Mar. 26, 1943
Gage height (feet)d7.60 7.00
7.387.346.745.655.987.407.536.337.725.55
d8.435.656.17
dll.197.94
4-r,
Discharge (cfs)
6,820
7,6607,4406,0903,8004,5007,7007,8005,2408,3603,760
-3,8005,070
-8,800
a At site and datum used 1931-56, from information observed; may have been exceeded during period of no d Backwater from ice.
by local residents.record. c Maximum observed.

YELLOWSTONE RIVER BASIN 301
Peak stages and discharges of Powder River at Moor-head, Mont. Continued
Water year
1943
1944
1945
1946
1947
1948
1949
1950
1951
1952
1953
Date
Apr. 13, 1943June 13, 1943
Mar. 17, 1944Mar. 18, 1944May 20, 1944June 18, 1944June 22, 1944
Mar. 14, 1945June 6, 1945June 27, 1945
Feb. 25, 1946June 11, 1946July 6, 1946
Mar. 17, 1947Mar. 19, 1947May 13, 1947
Mar. 18, 1948June 17, 1948June 23, 1948June 28, 1948July 15, 1948July 19, 1948
Mar. 1, 1949Mar. 6, 1949June 8, 1949
Mar. 4, 1950May 19, 1950
Mar. 27, 1951Sept. 9, 1951
Mar. 25, 1952July 20, 1952
Mar. 13, 1953June 7, 1953
Gage height (feet)
6.786.87
dlO.105.658.468.378.15
d!2.736.585.82
d8.096.476.25
d!5.64-5.67
_8.16.576.155.855.78
-8.155.68
d5.334.83
d9.184.60
10.676.04
d8.906.01
Discharge (ofs)
6,1606,600
_e4,22010,7009,9709,510
_6,1904,620
_5,7205,200
_e9,3003,980
e4,5009,3205,9805,0704,3804,240
(f)9,3604,060
-2,620
_2,020
15,3004,700
-4,550
Water year
1953
1954
1955
1956
1957
1958
1959
1960
1961
1962
1963
Date
June 15, 1953Aug. 3, 1953
Aug. 6, 1954
Mar. 12, 1955June 18, 1955Aug. 8, 1955
Mar. 20, 1956Mar. 21, 1956June 16, 1956
June 7, 1957June 9, 1957June 12, 1957
June 8, 1958June 12, 1958July 19, 1958
Mar. 18, 1959Mar. 19, 1959
Mar. 19, 1960Mar. 20, 1960
Feb. 21, 1961May 30, 1961
May 24, 1962May 28, 1962June 4, 1962June 11, 1962June 17, 1962June 30, 1962July 14, 1962
Oct. 8, 1962June 5, 1963June 15, 1963June 17, 1963June 20, 1963
Gage height (feet)
7.986.37
8.39
d9.836.616.31
-d!7.7
7.00
5.935.705.48
5.495.605.16
d7.505.96
d7.626.27
d3.783.76
9.928.528.14
11.7512.776.958.05
6.106.577.187.046.05
Discharge (cfs)
8,5905,320
9,740
-5,6105,350
e6,200-
c7,200
5,6005,0904,630
4,6504,9004,060
-5,740
-6,200
-1,320
14,60010,7009,660
20,00023,0006,8609,430
5,1405,7407,0106,7104,720
c Maximum observed.d Backwater from ice.e Maximum daily meanj estimated.f Peak probably exceeded base; discharge not determined.
3247. Sand Creek near Broadus, Mont.
Location.--Lat 45°26', long 105°26', in SEv sec.5, T.5 S., R.51 E., at culverts on Moorhead road, 1.8 miles southwest of Broadus.
Drainage area. 10.6 sq mi.
Gage. Crest-stage gage. Altitude of gage is 3,090 ft (from topographic map).
Stage-discharge relation. Defined by computation of flow through culverts and over road using head as indicated by crest-stage gage.
Remarks.--Only annual peaks are shown.
Peak stages and discharges
Water year
1955
1956 1957 19581959
Date
-
Mar. 16, 1956 Aug. 28., 1957 June 7, 1958Mar. 18, 1959
Gage height (feet)
-
1.75 1.55 3.954.79
Discharge (cfs)
(a)
19 15 93
236
Water year
1960
1961 1962 1963
Date
Mar. 20, 1960
June 11, 1962 Feb. 5, 1963
Gage height (feet)b4.78
2.85 2.00
Discharge (cfs)
c!50
(a) 50 23
a No evidence of flow during year. b Backwater from ice. c Approximate.
219-848 O - 66 - 21

302 YELLOWSTONE RIVER BASIN
3255. Little Powder River near Broadus, Mont.
Location. Lat 45°23', long 105°18', in NW^NE^ sec.21, T.5 S., R.52 E., on left bank 1 mile downstream from East Pork of Little Powder River, 5 miles up stream from mouth, and 5-| miles southeast of Broadus.
Drainage area. 1,974 sq mi.
Gage.--Recording. At site three-quarters of a mile upstream at differentdatum prior to Dec. 10, 1962. Altitude of gage is 3,020 ft (by barometer).
Stage-discharge relation.--Large shifts occur. Defined by current-meter measurements below 1,300 cfs at site used prior to Dec. 10, 1962.
Remarks. Base for partial-duration series, 400 cfs.
Peak stages and discharges
Water year
1947
1948
1949
1950
1951
1952
Date
June 23, 1947
War. 16, 1948War. 25, 1948June 4, 1948June 18, 1948June 25, 1948June 27, 1948
War. 5, 1949War. 21, 1949June 4, 1949July 12, 1949
Apr. 3, 1950Apr. 7, 1950Way 11, 1950Aug. 14, 1950
Way 14, 1951Aug. 14, 1951Aug. 17, 1951Aug. 30, 1951Sept. 6, 1951
War. 18, 1952War. 18, 1952Mar. 31, 1952
Oage height (feet)3.57
blO.594.594.615.87--
b7.445.634.505.76
6.163.783.844.67
4.094.064.033.704.43
b7.21b6.59b6.91
Discharge (cfs)
a476
cSOO782788
1,220d520d450
dl,6001,140
8271,220
1,320539527755
626623614515734
-1,300(e)
Water year
1953
1956
1957
1958
1959
1960
1961
1962
1963
Date
June 15, 1953June 22, 1953
July 2, 1956
June 11, 1957July 22, 1957Aug. 29, 1957
June 4, 1958June 5, 1958June 8, 1958
War. 18, 1959Mar. 22, 1959June 26, 1959
Mar. 19, 1960
July 25, 1961
Feb. 14, 1962Mar. 20, 1962June 21, 1962
May 29, 1963June 6, 1963June 8, 1963June 18, 1963
Oage height (feet)
8.946.67
3.10
4.524.095.45
5.883.726.20
6.253.716.14
b9.36
4.77
7.756.404.87
4.704.854.204.87
Discharge (cfs)
2,3401,370
287
640520922
1,070470
1,180
1,220480
1,160
dl,700
788
1,8501,290
751
589632453637
a Maximum for period May to September, d About. e Not known.
b Backwater from ice. c Daily mean.
3265. Powder River near Locate, Mont.
Location.--Lat 46°26', long 105°18', in NE£ sec.26, T.8 N., R.51 E., on right bank 50 ft upstream-from bridge on U.S. Highway 12, at present site of Locate (5 miles west of former site), 3 miles upstream from Locate Creek, and 25 miles east of Miles City.
Drainage area.--13,189 sq mi.
Gage. Nonrecording prior to July 11, 1947; recording thereafter. Altitude of gage is 2,400 ft (by barometer).
Stage-discharge relation. Large shifts occur. Defined by current-meter measurements below 17,000 cfs.
Remarks.--Diversions for irrigation of about 52,000 acres above station. Some regulation by three reservoirs in Wyoming, with combined usable capacity of 36,800 acre-ft. Base for partial-duration series, 5,000 cfs. Only annual peaks are shown prior to 1947.

YELLOWSTONE RIVER BASIN 303
Peak stages and discharges of Powder River near Locate, Mont.
Water year
193819391940
19411942194319441945
1946
1947
1948
1949
1950
1951
1952
Date
Sept. 7, 1938Mar. 22, 1939July 27, 1940
Oct. 4, 1940June 6, 1942Feb. 19, 1943Mar. 19, 1944Mar. 13, 1945June 8, 1945
July 8, 1946
Mar. 22, 1947
Feb. 23, 1948Feb. 28, 1948Mar. 16, 1948Mar. 18, 1948Mar. 19, 1948Mar. 22, 1948June 19, 1948
Mar. 8, 1949Mar. 23, 1949
Feb. 27, 1950Apr. 3, 1950
Mar. 29, 1951Aug. 25, 1951
Nov. 9, 1951Mar. 29, 1952Mar. 30, 1952May 26. 1952
Oage height (feet)6.996.996.47
6.395.8
11.2310.6a7.25
-
6.55
8.45
----
a6.92_-
7.256.18
a6.94-
a5.134.98
5.58all. 01
9.536.44
Discharge (ofs)
10,60010,6007,610
7,2805,620
31,00028,000
-b5,500
9,010
17,200
7,2006,8008,7808,7009,9409,1406,790
12,0007,320
-b3,000
_4,210
5,140-
23,9008.230
Water year
1953
1954
1955
1956
1957
1958
1959
1960
1961
1962
1963
Date
Mar. 14, 1953June 17, 1953
Sept. 6, 1954
Apr. 2, 1955
Mar. 23, 1956
June 22, 1957
June 10, 1958July 3, 1958
Mar. 18, 1959Mar. 22, 1959
Mar. 19, 1960Mar. 21, 1960
Mar. 2, 1961June 2, 1961
Feb. 16, 1962May 26, 1962May 30, 1962June 5, 1962June 13, 1962June 15, 1962June 20, 1962July 15, 1962
June 6, 1963June 19, 1963
Gage height (feet)a8.616.49
5.75
5.65
a!2.3
5.17
5.585.71
a8.317.95
a9.107.45
a3.453.03
_6.847.236.645.926.858.757.63
8.306.58
Eischarge (cfs)
-8,860
6,130
5,800
24,000
4,380
5,8006,440
b!2,20015,600
-12,900
-697
12,0009,26011,7009,8607,280
11,00019,40013,600
12,3007,030
a Backwater from Ice. b Maximum dally.
3275. Yellowstone River at Glendive , Mont.
Location. --Lat 47°06', long 104 °43', in N| sec. 35, T.16 N., R.55 E. , at high way bridge at Glendive.
Drainage area . 66,788 sq mi.
Gage. Nonrecording. Altitude of gage is 2,040 ft (from topographic map).
Stage -discharge relation. Defined by current -meter measurements.
Remarks . Diversions for irrigation of about 1,200,000 acres above station. Some regulation on tributary streams. Only annual maximum observed stages and discharges are shown. Maximum observed discharge should not differ materially from momentary maximum.
Peak stages and discharges
Water year
1903 1904
1905
1906 1907 1908
Date
June 20, 1903 Apr. 1, 1904 June 23, 1904 June 8, 1905
June 8, 1906 June 24, 1907 June 4,18,1908
Gage height (feet)
9.0 all. 9 10.2 9.4
10.3 11.0 10.6
Discharge (cfs)
62,300
77,900 67,800
82,200 92,000 86,400
Water year
1909 1910
1932
1933 1934
Date
June 8, 1909 June 9, 1910
Mar. 23, 1932 June 29, 1932 June 20, 1933 Jan. 7, 1934 May 12, 1934
Gage height (feet)
12.7 8.0
al4.60
10.97 a6.83
D'.scharge (cfs)
118,000 49,400
65, 100 64,800
21,200a Backwater from Ice.
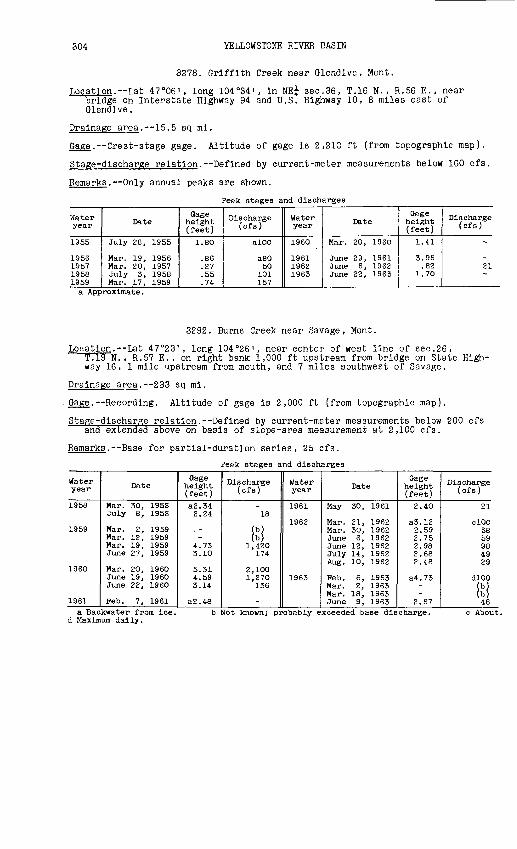
304 YELLOWSTONE RIVER BASIN
3278. Griffith Creek near Glendive, Mont.
Location.--Lat 47°06', long 104°34' , in NE^ sec.36, T.16 N. , R.56 E., near bridge on Interstate Highway 94 and U.S. Highway 10, 8 miles east of Glendive.
Drainage area.--15.5 sq mi.
Gage.--Crest-stage gage. Altitude of gage is 2,210 ft (from topographic map).
Stage-discharge relation. Defined by current-meter measurements below 160 cfs.
Remarks. Only annual peaks are shown.
Peak stages and discharges
Water year
1955
1956195719581959
Date
July 28, 1955
Mar. 19, 1956Mar. 20, 1957July 3, 1958Mar. 17, 1959
height (feet)
1.80
.86
.27
.55
.74
Discharge (cfs)
alOO
a8050
101157
Water year
1960
196119621963
Date
Mar. 20, 1960
June 29, 1961June 6, 1962June 22, 1963
_height (feet)
1.41
3.96.82
1.70
Discharge (cfs)
-
_21-
a Approximate.
3292. Burns Creek near Savage, Mont.
Location.--Lat 47°23', long 104°26', near center of west line of sec.26,T.19 N., R.57 E., on right bank 1,000 ft upstream from bridge on State High way 16, 1 mile upstream from mouth, and 7 miles southwest of Savage.
Drainage area. 233 sq mi.
Gage.--Recording. Altitude of gage is 2,000 ft (from topographic map).
Stage-discharge relation. Defined by current-meter measurements below 200 cfs and extended above on basis of slope-area measurement at 2,100 cfs.
Remarks. Base for partial-duration series, 25 cfs.
Peak stages and discharges
Water year
1958
1959
1960
1961
Date
Mar. 30, 195SJuly 8, 195S
Mar. 2, 1959Mar. 12, 1959Mar. 19, 1959June 27, 1959
Mar. 20, 1960June 19, 1960June 22, 1960
Feb. 7, 1961
Qage height (feet)a2.342.24
. --
4.733.10
5.314.593.14
a2.48
Discharge (cfs)
-18
0>)M
1,420174
2,1001,270
136
-
Water year
1961
1962
1963
Date
May 30, 1961
Mar. 21, 1962Mar. 30, 1962June 6, 1962June 12, 1962July 14, 1962Aug. 10, 1962
Feb. 6, 1963Mar. 2, 1963Mar. 18, 1963June 9, 1963
Gage height (feet)2.40
a3.122.592.752.982.682.48
a4.73--
2.67
Discharge (cfs)
21
clOo3859984929
dlOO(b)(b)48
a Backwater from ice. d Maximum dally.
b Not known; probably exceeded base discharge.
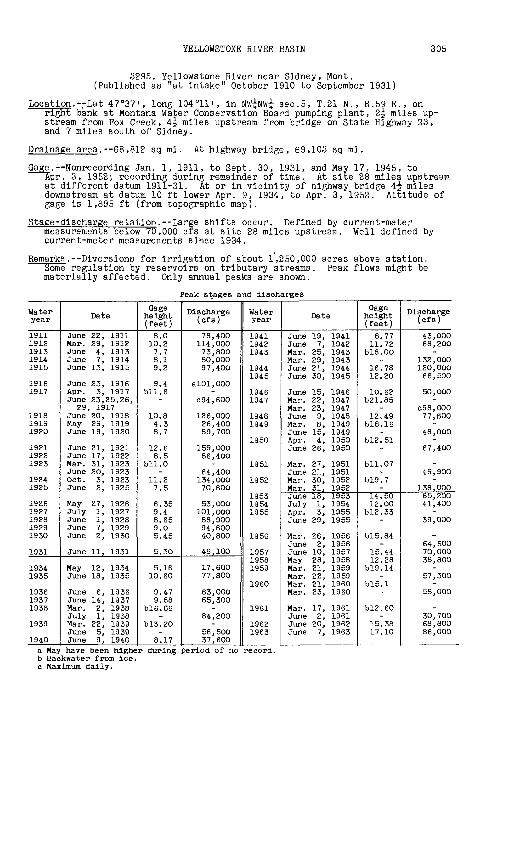
YELLOWSTONE RIVER BASIN 305
3295. Yellowstone River near Sidney, Mont. (Published as "at intake" October 1910 to September 1931)
Location.--Lat 47°37', long 104°11', in NW^NW^ sec.5, T.21 N., R.59 E., on right bank at Montana Water Conservation Board pumping plant, 2f miles up stream from Fox Creek, 4^ miles upstream from bridge on State Highway 23, and 7 miles south of Sidney.
Drainage area.--68,812 sq mi. At highway bridge, 69,103 sq mi.
Gage. Nonrecording Jan. 1, 1911, to Sept. 30, 1931, and May 17, 1945, toApr. 3, 1952; recording during remainder of time. At site 28 miles upstream at different datum 1911-31. At or in vicinity of highway bridge 4| miles downstream at datum 10 ft lower Apr. 9, 1934, to Apr. 3, 1952. Altitude of gage is 1,895 ft (from topographic map).
Stage-discharge relation.--Large shifts occur. Defined by current-meter measurements below 70,000 cfs at site 28 miles upstream. Well defined by current-meter measurements since 1934.
Remarks. Diversions for irrigation of about 1,250,000 acres above station. Some regulation by reservoirs on tributary streams. Peak flows might be materially affected. Only annual peaks are shown.
Peak stages and discharges
Water year
19111912191319141915
19161917
191819191920
192119221923
19241925
19261927192819291930
1931"
19341935
19361937193S
1939
1940
Date
June 22, 1911Mar. 29, 1912June 4, 1913June 7, 1914June 13, 1915
June 23, 1916Apr. 3, 1917June 23,25,26,
29, 1917June 20, 1918May 29, 1919June 19, 1920
June 21, 1921June 17, 1922Mar. 31, 1923June 2O, 1923Oct. 3, 1923June 2, 1925
May 27, 1926July 1, 1927June 1, 192SJune 7, 1929June 2, 1930
June 11, 1931
May 12, 1934June 18, 1935
June 6, 1936June 14, 1937Mar. 2, 193SJuly 1, 1938Mar. 22, 1939June 5, 1939June 9, 1940
Qage height (feet)
8.010.27.78.19.2
9.4bll.6
-
10.84.38.7
12.68.5
bll.O-
11.27.5
6.359.48.659.05.45
5.30
5.1610.60~
9.479.88
b!6.66-
b!3.20-
8.17
Discharge (cfs)
78,400114,00073,80080,00097,400
a!01,000-
094,600
126,00026,40089,700
159,OOO86,4OO
-64,40O
134,OOO70,60O
53,OOO101,OOO88,90094,60040, 800
46,100
17,60077,300" ~ ~
63,00065,300
-84,200
-56,5OO37,600
Water year
194119421943
19441945
19461947
19481949
1950
1951
1952
195319541955
1956
195719581959
1960
1961
19621963
Date
June 19, 1941June 7, 1942Mar. 25, 1943Mar. 29, 1943June 21, 1944June 30, 1945
June 15, 1946Mar. 22, 1947Mar. 23, 1947June 9, 1948Mar. S, 1949June 15, 1949Apr. 4, 1950June 26, 1950
Mar. 27, 1951June 21, 1951Mar. 30, 1952Mar. 31, 1952June 18, 1953July 1, 1954Apr. 3, 1955June 29, 1955
Mar. 26, 1956June 2, 1956June 10, 1957May 28, 1958Mar. 21, 1959Mar. 22, 1959Mar. 21, 1960Mar. 23, 1960
Mar. 17, 1961June 2, 1961June 20, 1962June 7, 1963
Gage height (feet)
8.7711.72
blS.OO-
16.7312.20
1O.62b21.85
-12.49
bl8.16-
b!2.51-
bll.07_
b!9.7-
14.5012.OO
b!2.33-
b!5.84-
15.4412.28
b!9.14-
blS.l-
b!2.60-
15.3817.10
Discharge (cfs)
43,00068,2OO
-132,000120,00066,500
50,OOO-
c98,00077,300
-48,OOO
-67,400
-49,900
-138,00065,20041,400
-39,OOO
-64,60070,00038,800
-57,300
-58,000
-30,70068,80086,000
a May have been higher during period of no record, b Backwater from ice. c Maximum daily.

306 PAINTED WOODS CREEK BASIN
3297. Painted Woods Creek tributary near Williston, N. Dak.
Location.--Lat 48°12', long 103°53', in SE^NE^ sec.35, T.155 N., R.103 W. , at culvert on county highway, 13 miles west of Williston.
Drainage area.--0.35 sq mi.
Gage .--Crest-stage gage."
Stage-discharge relation. Defined by current-meter measurements below 5 cfs and by Indirect measurement at 47.8 cfs. Subject to change owing to ice effect.
Bankfull stage. Not subject to overflow.
Remarks.--Only annual peaks are shown.
Peak stages and discharges
Water year
1955
1956 1957 1958 1959
Date
Mar. 28, 1955
Mar. 19, 1956 March 1957 March 1958 June 26, 1959
Gage height (feet)
a3.45
1.95
1.58 4.36
Discharge (cfs)
15
7 bl.5 1
47.8
Water year
1960
1961 1962 1963 1964
Date
March 1960
March 1961 March 1962 July 10, 1963 July 1964
Gage height (feet)a8.76
a2.57 a7.1 2.10 1.71
Discharge (cfs)
29
bl 28 2.0 1.0
a Backwater b Estimated.
3299. Painted Woods Creek tributary No. 2 near Willistcn, N. Dak.
Location.--Lat 48°13', long 103°49', in SW^SW^ sec.21, T.155 N., R.102 W., at culvert on county highway, 10|- miles northwest of Williston.
Drainage area. 8.30 sqmi.
Gage. Crest-stage gage.
Stage-discharge relation.--Defined by current-meter measurements below 15 cfs and extended above by logarithmic plotting; Subject to change owing to Ice effect.
Remarks.--Only annual peaks are shown.
Peak stages and discharges
Water year
1955
1956195719581959
Date
Mar. 13, 1955
Mar. 19, 1956-
April 1958Mar. 19, 1959
Gage height (feet)
4.09
a2.671.654.067.96
Discharge (cfs)
61
15.5
60207
Water year
1960
1961196219631964
Date
March 1960
March 1961-
July 10, 1963Apr. 1, 1964
Gage height (feet)
3.22
3.23-
5.12.7
Discharge (cfs)
26
290
10011
a Backwater from ice or snow.
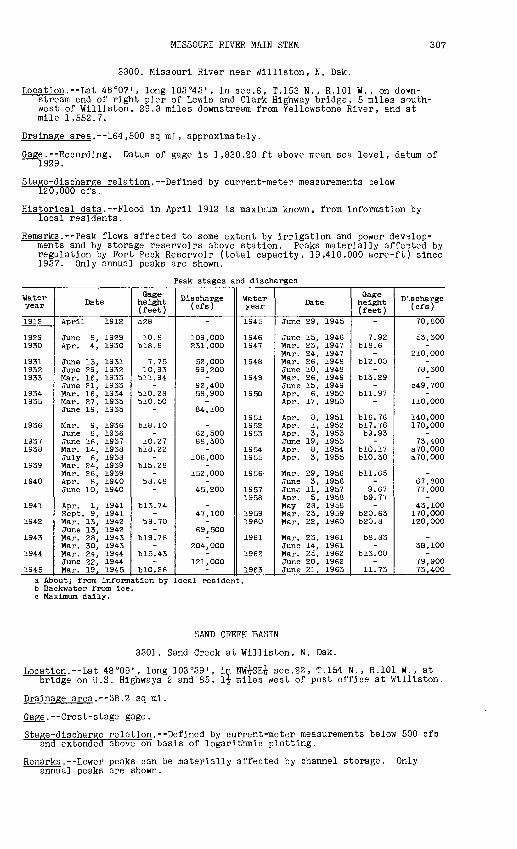
MISSOURI RIVER MAIN STEM 307
3300. Missouri River near Williston, N. Dak.
Location.--La t 48°07', long 103°43', in sec.6, T.153 N., R.101 W., on do'vn- stream end of right pier of Lewis and Clark Highway bridge, 5 miles south west of Williston, 29.3 miles downstream from Yellowstone River, and at mile 1,552.7.
Drainage area.--164,500 sq mi, approximately.
3.--R [929.
Gage.--Recording. Datum of gage is 1,830.20 ft above mean sea level, datum of
Stage-discharge relation.--Defined by current-meter measurements below 120,000 cfs.
Historical data. Flood in April 1912 is maximum known, from information by local residents.
Remarks. Peak flows affected to some extent by irrigation and power develop ments and by storage reservoirs above station. Peaks materially affected by regulation by Fort Peck Reservoir (total capacity, 19,410,000 acre-ft) since 1937. Only annual peaks are shown.
Peak stages and discharges
Water year
1912
19291930
193119321933
19341935
1936
19371938
1939
1940
1941
1942
1943
1944
1945
Date
April 1912
June 8, 1929Apr. 4, 1930
June 13, 1931June 29, 1932Mar. 16, 1933June 21, 1933Mar. 16, 1934Mar. 27, 1935June 19, 1935
Mar. 9, 1936June 6, 1936June 16, 1937Mar. 14, 1938July 6, 1938Mar. 24, 1939Mar. 26, 1939Apr. 8, 1940June 10, 1940
Apr. 1, 1941Sept. 9, 1941Mar. 13, 1942June 13, 1942Mar. 28, 1943Mar. 30, 1943Mar. 24, 1944June 22, 1944Mar. 19, 1945
Gage height (feet)a28
10.8b!8.6
7.7510.93
bll.94-
blO.28blO.50
-
blS.10-
10.27bl8.22
-b!5.28
-b8.48
-
b!3.74-
b9.70-
b!9.78-
b!5.43-
blO.26
Discharge (cfs)
-
109,000231,000
52,00099,200
-92,40058,900
-84,100
-62 , 50088,300
-106,000
-152,000
-45,200
-47,100
-69,500
-204,000
-121,000
-
Water year
1945
19461947
1948
1949
1950
195119521953
19541955
1956-
19571958
19591960
1961
1962
1963
Date
June 29, 1945
June 15, 1946Mar. 23, 1947Mar. 24, 1947Mar. 26, 1948June 10, 1948Mar. 26, 1949June 15, 1949Apr. 6, 1950Apr. 17, 1950
Apr. 8, 1951Apr. 1, 1952Apr. 3, 1953June 19, 1953Apr. 8, 1954Apr. 3, 1955
Mar. 29, 1956June 3, 1956June 11, 1957Apr. 5, 1958May 28, 1958Mar. 23, 1959Mar. 22, 1960
Mar. 23, 1961June 14, 1961Mar. 25, 1962June 20, 1962June 21, 1963
Gage height (feet)
-
7.92bl8.6
-b!2.00
-b!3.29
-bll.97
-
b!6.76b!7.76b9.93
-blO.17blO.30
bll.65-
9.67b9.77
-b20.63b20.8
b8.83-
b!3.00-
11.73
D'.scharge (cfs)
70 , 800
53,300-
210,000-
78,300-
C49.700-
110,000
140,000170,000
-73,400
a 70, 000a70,000
-67,80077,000
-43,100170,000120,000
-38,100
-79,90073,400
a About; from information by local resident, b Backwater from ice. c Maximum daily.
SAND CREEK BASIN
3301. Sand Creek at Williston, N. Dak.
Location. Lat 48°09', long 103°39', in NW^SE^ sec.22, T.154 N., R.101 W. , at bridge on U.S. Highways 2 and 85, lj miles west of post office at Williston.
Drainage area.--38.2 sq mi.
Gage.--Crest-stage gage.
Stage-discharge relation.--Defined by current-meter measurements below 500 cfs and extended above on basis of logarithmic plotting.
Remarks.--Lower peaks can be materially affected by channel storage. Only annual peaks are shown.

308 SAND CREEK BASIN
Peak stages and discharges of Sand Creek at Williston, N. Dak.
Water year
1955
195619571958 1959
Date
Mar. 28, 1955
March 1956March 1957March 1958 Mar. 19, 1959
Gage height (feet)
4.66
3.10-
5.00 6.5
Discharge (cfs)
161
37alO207 900
Water year
1960
196119621963 1964
Date
March 1960
March 1961Mar. 21, 1962July 10, 1963 July 5, 1964
Gage t^ight (feet)
9.00
b4.40b6.45.702.8
Discharge (cfs)
-
10350330 10
b Backwater.
LITTLE MUDDY CREEK BASIN
3310. Little Muddy Creek below Cow Creek,near Williston, N. Dak.
Location.--Lat 48°17'04", long 103°34'21", in NE^NW^ sec.5, T.155 N., R.100 W. , on left bank 37 ft downstream from center line of highway, 1 mile downstream from Cow Creek, 4 miles upstream from Camp Creek, 10 miles northeast of Williston, and 13 miles upstream from mouth.
Drainage area.--875 sq mi, of which about 775 sq mi contributes directly to surface runoff.
Gage. Recording. 1929.
Datum of gage is 1,863.18 ft above mean sea level, datum of
Stage discharge relation.--Defined by current-meter measurement? below 3,500 cfs.
Bankfull stage.--8 ft.
Historical data. See records for station 3315.
Remarks.--Some small diversions for irrigation. Some regulatior by Lake Zahl, Fish and Wildlife Reservoir. Base for partial-duration series, 250 cfs.
Peak stages and discharges
Water year
1955
1956 1957 195S 1959
Date
Mar. 13, 1955 Mar. 30, 1955
Mar. 21, 1956 Feb. 28, 1957 Mar. 28, 1958 Mar. 19, 1959
Gage height (feet)
a8.02 12.15
aeTzea8.63
alO.53 11.81
Discharge (cfs)
400 3,750
b400 b320 b500 2,470
Water year
1960
1961 1962
1963
Date
Mar. 27, 1960
Mar. 14, 1961 Mar. 26, 1962 June 12, 1962 Mar. 23, 1963 July 11, 1963
Gage 1- eight (feet)
13.57
8.22 611.6
8.10 a8.35 10.71
Discharge (cfs)
6,910
371 1,900
300 450
2,140a Backwater from ice or snow, b About.

LITTLE MUDDY CREEK BASIN 309
3315. Little Muddy Creek near Williston, N. Dak. (Published as "Little Muddy River" prior to 1946)
Location.--Lat 48°11'40", long 103°35'50", on line between sec.31, T.155 N., R.100 W. , and sec.6, T.154 N. , R.100 W. , on upstream side of highway bridge, 2.5 miles downstream from Camp Creek, 4 miles northeast of Williston, and 6 miles upstream from mouth.
Drainage area.--1,010 sq ml, approximately, of which 910 sq ml contributes directly to surface runoff.
Gage. Nonrecordlng. At site 2^- miles upstream, above Camp Creek, at different 3atum 1904-09. At site half a mile upstream at different datum 1932-33. Al titude of gage Is 1,850 ft (by Interpolation between known altitudes along river channel).
Stage-discharge relation.--Defined by current-meter measurements below 900 cfs for the 1904-9 site, below 330 cfs for the 1932-33 site, and below 2,300 cfs for the 1946-54 site.
Bankfull stage. 13 ft, present site and datum.
Historical data.--A stage of about 13 ft, present site and datum, was reached In 1904 and a stage of approximately 12 ft, present site and datum, was reached in years 1911, 1916, 1925, 1929, and 1935.
Remarks. Some small diversions above station for irrigation. Some regulation by Lake Zahl, Fish and Wildlife Service Reservoir. The station was discontinued in October 1954 and a new station was established 6^ miles upstream. The records are not equivalent. The 1955 maximum discharge for the old site was computed by multiplying the maximum discharge for the new site by a factor of 0.97. Only annual peaks are shown.
Peak stages and discharges
Water year
1906 1907 1908
1933
1947 1948 1949
Date
June 7, 1906 Apr. 17, 1907 Apr. 5, 1908
Mar. 9, 1933
Mar. 23, 1947 Mar. 23, 1948 Mar. 28, 1949
Gage height (feet)
7.0 6.2 6.8
all. 54
a!3.8 a!2.6 a!2.0
Discharge (cfs)
1,800 1,310 1,670
798
b2,500 1,950
Water year
1949
1950
1951 1952 1953 1954 1955
Date
Mar. 28, Apr. 3, 1949
Apr. 7, 1950
Apr. 4, 1951 Apr. 6, 1952 June 24, 1953 Feb. 10, 1954 Mar. 30, 1955
Gage height (feet)
all. 36
11.92 12.52 13.0 a9.85
Discharge (cfs)
1,300
1,330
2,330 2,590 2,820 1,200 3,640
a Backwater from ice. b About.
WHITE EARTH RIVER BASIN
3320. White Earth River at White Earth, N. Dak.
Location.--Lat 48°23', long 102°46', In SE^SW^- sec.36, T.157 N., R.94 W., 35 ft upstream from bridge on county road, a quarter of a mile east of White Earth.
Drainage area.--490 sq ml, approximately, of which about 320 sq mi contributes directly to surface "unoff.
Gage.--Nonrecordlng at site a quarter of a mile upstream at datum 1.64 ft higher prior to Oct. 23, 1959; recording thereafter. Datum of gage is 2,070.00 ft above mean sea level, datum of 1929.
Stage-discharge relation. Defined by current-meter measurements below 1,700 cfs.
Historical data.--Flood of 1929 reached a stage of 21.8 ft (former site and datum) from information by local residents.
Remarks. Base for partial-duration series, 150 cfs.

310 WHITE EARTH RIVER BASIN
Peak stages and discharges of White Earth River at White Earv,h, N. Dak.
Water year
1929
1955
1956
1957
1958
1959
Date
-
Mar. 30, 1955
Mar. 21, 1956Mar. 25, 1956Apr. 1, 1956Apr. 4, 1956
Mar. 20, 1957
Mar. 28, 1958Mar. 31, 1958
Mar. 18, 1959Mar. 21, 1959
Gage height (feet)21.8
5115.2
a9.0alO.Oa9.710.1
a7.19
alO.410.25
al2.06all. 13
Discharge (cfs)
_
1,270
350440460504
120
-540
-530
Water year
1960
1961
1962
1963
1964
Date
Mar. 28, 1960
Mar. 15, 1961
Mar. 26, 1962May 30, 1962June 12, 1962June 14, 1962July 6, 1962
Mar. 22, 1963June 8, 1963
Apr. 2, 1964
Gage height (feet)al8.02
a4.51
all. 948.02
14.279.035.55
a9.498.09
-
Discharge (cfs)
2,300
110
736313
1,350394154
220388
360
a Backwater from ice.
LITTLE MISSOURI RIVER BASIN
3329. North Creek near Alzada, Mont.
Location.--Lat 45°04', long 104°31', in SE^NW^ sec.7, T.9 S., R.59 E. , 8 miles northwest of Alzada.
Drainage area. 0.68 sq mi.
Gage.--Recording. Altitude of gage is 3,480 ft (by barometer).
Stage-discharge relation. Defined by computation of flow over sharp-crested weir.
Remarks.--Only annual peaks are shown.
Peak stages and discharges
Water year
1951
1956 1957 19581959
Date
June 17, 1951
July 2, 1956 Aug. 28, 1957 June 3, 1958June 30, 1959
Gage height (feet)5.18
4.32 4.32 4.663.21
Discharge (cfs)
260
276 276 41758
Water year
1960
1961 1962 1963
Date
Aug. 17, 1960
Sept. 18, 1961 May 21, 1962 June 14, 1963
Gage height (feet)3.77
4.05 5.47 5.23
Discharge (cfs)
142
203 1,100
3340. Little Missouri River near Alzada, Mont.
Location.--Lat 45°05', long 104°24', in NE^SW^ sec.6, T.9 S., R.60 E. , on right bank 1.9 miles downstream from Thompson Creek and 4 miles north of Alzada.
Drainage area. 904. sq mi.
Gage.--Nonrecording prior to June 14, 1947; recording thereafter. At site 300 ft upstream at datum 2.07 ft higher Apr. 4, 1912, to June 13, 1947. Datum of gage is 3,367 ft above mean sea level (river-profile survey).
Stage-discharge relation.--Defined by current-meter measurements below 2,500 cfs. Large shifts occur.
Remarks.--Several diversions of floodwaters for irrigation of hay meadows above station do not materially affect peak flows. Base for partial-duration series, 1,100 cfs. Only annual peaks are shown prior to 1948.
Peak stages and discharges
Water year
1912 1913 1914 1915
1916
Date
Apr. 6, 1912 Apr. 1, 1913 Aug. 3, 1914 June 13, 1915
Mar. 12, 1916
Gage height (feet)15.3 14.7 11.33 13.4
8.18
Discharge (cfs)
4,550 4,250 2,630 3,600
1,490
Water year
1917 1918 1919 1920
1921
Date
Apr. 11, 1917 Mar. 15, 1918 July 30, 1919 May 12, 1920
June 29, 1921
Gage height (feet)13.18 11.97 7.70
6.07
Discharge (cfs)
3,250 2,770 1,360
al,740
915a Daily mean.

LITTLE MISSOURI RIVER BASIN 311
Peak stages and discharges of Little Missouri River near Alzada, Mont. Continued
Water year
1922192319241925
19291930
19311932
1935
19361937193819391940
19411942194319441945
19461947
1948
1949
1950
Date
June 16, 1922Sept. 30, 1923Apr. 8, 1924June 17, 1925
May 30, 1929Feb. 21, 1930Feb. 23, 1930May 28, 1931Apr. 24, 1932
July 22, 1935
Mar. 7, 1936June 14, 1937May 31, 1938Mar. 24, 1939Aug. 19, 1940
June 11, 1941June 6, 1942Mar. 27, 1943Apr. 4, 1944Mar. 14, 1945
May 24. 1946June 23, 1947
Mar. 27, 1948June 18, 1948
Mar. 7, 1949Mar. 22, 1949
Apr. 4, 1950Apr. 12, 1950
Qage height (feet)
14.714.6815.2815.5
14.50b!2.10
-3.43
14.9
6.79
7.2812.055.557.99.6
12.5412.9011.81
-b8.94
13.0114.42
9.8316.08
b!4.4112.85
10.9411.82
Discharge (cfs)
4,1004,0904,4204,540
4,000-
2,160164
4,210
cl,080
1,3202,780
7941,4201,600
2,8203,0002,500
a6,000bl,100
3,0402,850
1,2003,690
(d)2,230
1,5501,860
Water year
1950
1951
1952
1953
1954
1955
1956
1957
1958
1959
1960
1961
1962
1963
Date
May 10, 1950
June 17, 1951
Mar. 31, 1952Apr. 1, 1952
May 29, 1953June 18, 1953
Apr. 6, 1954
Apr. 13, 1955May 19, 1955
Mar. 22, 1956
June 24, 1957
Apr. 30, 1958
Mar. 20, 1959
Mar. 24, 1960June 11, 1960Aug. 19, 1960
Sept. 23, 1961
May 20, 1962May 23, 1962May 27, 1962June 4, 1962
June 8, 1963June 17, 1963
Gage height (feet)
10.43
5.89
bll.0910.51
11.3410.74
8.28
9.1211.23
b9.50
6.63
6.60
7.95
12.038.428.79
5.80
10.3514.9215.108.43
9.129.35
Discharge (cfs)
1,380
490
-1,400
1,6301,590
792
1,2701,780
el, 000
639
670
929
2,1301,1001,190
475
1,6002,8902,9401,100
1,2601,320
a Maximum daily mean. b Backwater from ice. c Maximum for period Mar. 29 to Sept. 30, 1935. d Not known; probably exceeded base discharge. e About.
3341. Wolf Creek near Hammond, Mont.
Location.--Lat 45°10', long 104°45', in SE£ sec.5, T.8 S., R.57 E., at culvert on U.S. Highway 212, 8 miles southeast of Hammond.
Drainage area. 9.09 sq mi.
Gage.--Crest-stage gage. Altitude of gage is 3,580 ft (from topographic map).
Stage-discharge relation. Defined by current-meter measurements below 70 cfs and extended above on basis of computation of flow through culvert at 298 and 550 cfs.
Remarks.--Only annual peaks are shown.
Peak stages and discharges
Water year
1955
1956 1957 1958 1959
Date
July 11, 1955
Mar. 22, 1956 Aug. 29, 1957 June 3, 1958 Mar. 19, 1959
Gage height (feet)
4.08
3.45 4.58 5.76 3.32
Discharge (cfs)
298
175 365 550 154
Water year
1960
1961 1962 1963
Date
Mar. 21, 1960
Sept. 18, 1961 May 21, 1962 Aug. 3, 1963
Gage height (feet)
5.26
2.31 5.62 3.54
Discharge (cfs)
485
30 540 190

312 LITTLE MISSOURI RIVER BASIN
3342. Willow Creek near Alzada, Mont.
Location. Lat 45°06', long 104"35', in center of sec.27, T.8 S., R.58 E., near bridge on U.S. Highway 212, 11 miles northwest of Alzada.
Drainage area.--123 sq mi.
Gage.--Crest-stage gage. Altitude of gage is 3,470 ft (from topographic map).
Stage-discharge relation.--Defined by current-meter measurements below 550 cfs. Large shifts occur.
Remarks. Only annual peaks are shown.
Peak stages and discharges
Water year
195S 1959 1960
Date
June 5, 1958 Mar. 19, 1959 Mar. 23, 1960
Gage height (feet)
7.54 7.31
11.19
Discharge (cfs)
455 548
1,350
Water year
1961 1962 1963'
Date
Sept. 18, 1961 May 21, 1962 Aug. 3, 1963
Gage height (feet)
1.77 11.98 7.28
Discharge (cfs)
40 1,700 480
3345. Little Missouri River at Camp Crook, S. Dak.
Location. --Lat 45°33', long 103°58', in SW| sec. 2, T.18 N., R.I E., on left bank 15 ft upstream from bridge on State Highway 8 at east elge of Camp Crook.
Drainage area. 1,970 sq mi, approximately.
Gage. Wonre cord ing prior to Oct. 9, 1957; recording thereafter. Datum of gage is 3,110.98 ft above mean sea level, datum of 1929.
Stage-discharge relation Defined by current-meter measurements below 7,600 cfs.
Remarks . Base for partial-duration series, 1,000 cfs.
Peak stages and discharges
Water year
1952
1956
1957
1958
1959
1960
Date
-
July 5, 1956
June 24, 1957Aug. 31, 1957
June 9, 1958July 3, 1958
Mar. 21, 1959
Mar. 22, I960June 11, 1960Aug. 20, 1960
Gage height (feet)a!6
8.8
5.306.95
4.945.17
7.70
9.277.464.88
Discharge (cfs)
-
b3,210
1,3502,080
1,1201,200
2,350
3,3602,3401,040
Water year
1961
1962
1963
Date
Sept. 24, 1961
Mar. 24, 1962May 28, 1962June 6, 1962
Feb. 12, 1963Mar. 3, 1963May 29, 1963June 6, 1963June 9, 1963June 16, 1963June 23, 1963Sept. 5, 1963
Gage height (feet)
2.65
S.3513.075.60
8.269.275.225.766.219.254.294.52
Discharge (cfs)
359
2,9807,6001,410
1,0801,2101,4301,6701,8703,4201,0901,080
a About, from information by local resident, b Maximum for period May 25 to Sept. 3O, 1956.
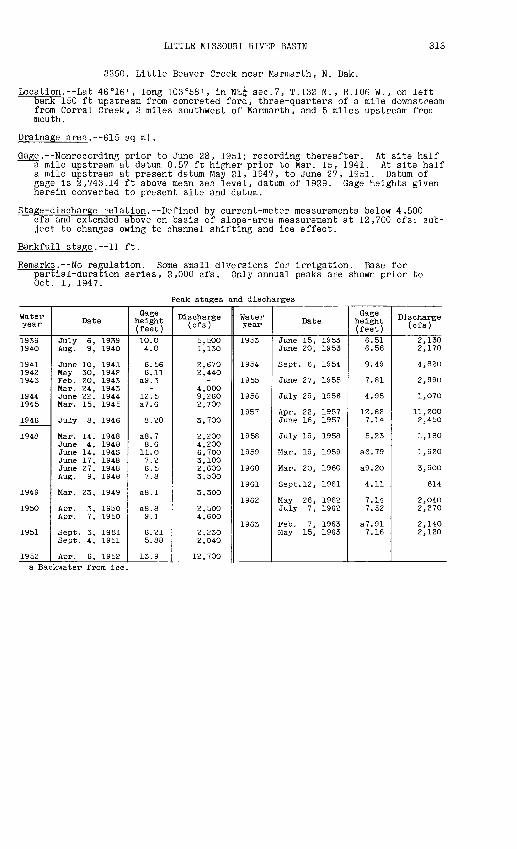
LITTLE MISSOURI RIVER BASIN 313
3350. Little Beaver Creek near Marmarth, N. Dak.
Location.--Lat 46°16 I , long 103°58', in NEi;- sec.7, T.132 N., R.106 W., or left bank 150 ft upstream from concreted ford, three-quarters of a mile downstream from Corral Creek, 3 miles southwest of Marmarth, and 5 miles upstreatr from mouth.
Drainage area.--615 sq mi.
_.--Nonrecording prior to June 28, 1951; recording thereafter. At site half a mile upstream at datura 0.57 ft higher prior to Mar. 15, 1941. At site half a mile upstream at present datum May 21, 1947, to June 27, 1951. Datum of gage is 2,743.14 ft above mean sea level, datum of 1929. Gage heights given herein converted to present site and datum.
Stage-discharge relation. Defined by current-meter measurements below 4,500 cfs and extended above on basis of slope-area measurement at 12,700 cfs; sub ject to changes owing to channel shifting and ice effect.
Bankfull stage. 11 ft.
Remarks.--No regulation. Some small diversions for irrigation. Base for partial-duration series, 2,000 cfs. Only annual peaks are shown prior to Oct. 1, 1947.
Peak stages and discharges
Water year
19391940
194119421943
19441945
1946
1948
1949
1950
1951
1952
Date
July 6, 1939Aug. 9, 1940
June 10, 1941May 30, 1942Feb. 20, 1943Mar. 24, 1943June 22, 1944Mar. 15, 1945
July 8, 1946
Mar. 14, 1948June 4, 1948June 14, 194SJune 17, 1948June 27, 1948Aug. 9, 1948
Mar. 23, 1949
Apr. 3, 1950Apr. 1, 1950
Sept. 3, 1951Sept. 4, 1951
Apr. 6, 1952
Gage height (feet)
10.04.0
6.566.11
a9.3-
12.5a7.6
8.20
a8.78.611.07.26.57.8
a8.1
a8.89.1
6.215.88
13.9
Discharge (cfs)
5,5001,130
2,6702,440
-4,0009,2602,700
3,700
2,2004,2006, 7OO3,1002,6003,500
3,300
2,5004,6OO
2,2302,040
12,700
Water year
1953
1954
1955
1956
1957
1958
1959
1960
1961
1962
1963
Date
June 15, 1953June 20, 1953
Sept. 6, 1954
June 27, 1955
July 29, 1956
Apr. 22, 1957June 16, 1957
July 19, 1958
Mar. 19, 1959
Mar. 20, 1960
Sept. 12, 1961
May 26, 1962July 7, 1962
Feb. 1, 1963May 15, 1963
Gage height (feet)
6.516.56
9.49
7.81
4.98
12.827.14
5.23
a6.79
a9.20
4.11
7.147.52
a7.917.16
Discharge (cfs)
2,1302,170
4,820
2,990
1,070
11,2002,450
1,180
1,920
3,900
614
2,0402,270
2,1402,120
a Backwater from ice.

314 LITTLE MISSOURI RIVER BASIN
3355. Little Missouri River at Marmarth, N. Dak.
Location. Lat 46°18' r long 103°54', in SE£ sec.30, T.133 N. , R.105 W., on up stream side of highway bridge in Marmarth, l| miles downstream from Little Beaver Creek.
Drainage area. 4,570 sq mi, approximately.
Gage.--Nonrecording prior to Sept. 3, 1957; recording thereafter. Datum of gage is 2,686.32 ft above mean sea level, datum of 1929.
Stage-discharge relation. Defined by current-meter measurements below 25,000 cfs.
Bankfull stage.--18 ft.
Historical data. According to local residents, the highest kncwn flood oc curred in June 1907. Other major floods occurred in March 1913, May 1929, and March 1920 and reached stages of about 21.5, 20.2, and 19.7 ft, respec tively. (These stages are not comparable to stages during period of record, owing to construction of levees.)
Remarks. Some small diversions above station for irrigation. Base for partial- duration series, 3,000 cfs. Only annual peaks "re shown prior to 1958.
Peak stages and discharges
Water year
19391940
19411942194319441945
19461947194819491950
19511952195319541955
19561957
Date
July 7, 1939July 28, 1940
June 11, 1941May 30, 1942Feb. 20, 1943Apr. 5, 1944Mar. 13, 1945
June 23, 1946Mar. 23, 1947Mar. 15, 1948Mar. 24, 1949Apr. 7, 1950
July 29, 1951Mar. 31, 1952June 19, 1953Sept. 6, 1954June 27, 1955
Mar. 23, 1956Apr. 22, 1957
Gage height (feet)
9.709.77
11.17.21
a!9.517.8011.35
11.0021.7
a!3.4911.214.2
8.05a23.410.446.255. SO
6.058.66
Discharge (cfs)
7,7107,710
9,9904,160
36,00029,60010,400
10,80045,00015,00011,70018,500
4,94041,30010,0003,4002,550
2.S106,890
Water year
1958
1959
1960
1961
1962
1963
Date
June 10, 1958
Mar. 24, 1959
Mar. 25, 1960June 13, 1960
Sept. 13, 1961
Mar. 25, 1962May 22, 1962May 28, 1962June 12, 1962July 3, 1962July 7, 1962July 17, 1962
Feb. 1, 1963Mar. 2, 1963June 9, 1963June 15, 1963June 17, 1963
Gage height (feet)
8.12
8.33
9.506.94
3.85
a9.256.9111.355.989.237.347.61
a6.626.337.567.466.57
Discharge (cfs)
6,080
5,570
7,4303,920
902
3,5003,890
12,4003,2007,9605,0605,620
3,5003,5005,2405,3904,190
a Backwater from Ice
3357. Deep Creek near Bowman, N. Dak.
Location. Lat 46°14', long 103°22', in NW^NW^ sec.30, T.132 N., R.101 W. , at culvert on U.S. Highway 85, 3^ miles north of Bowman.
Drainage area. 0.20 sq mi.
Gage.--Crest-stage gage.
Stage-discharge relation. Defined by current-meter measurements below 5 cfs and extended above on basis of culvert measurement at 57.0 cfs.
Remarks. Only annual peaks are shown.

LITTLE MISSOURI RIVER BASIN 315
Peak stages and discharges of Deep Creek near Bowman, N. Dak.
Water year
1955
1956
195719581959
Date
June 26, 1955
Mar. 1, 1956Aug. 6, 1956June 21, 1957February 1958March or April
1959
Gage height (feet)
8.90
a4.473.914.584.734.10
Discharge (cfs)
57.0
_4.213156.8
Water year
1960
1961196219631964
Date
March 1960
_August 1962February 1963
June 1964
Gage height (feet)
4.16
.5.48
a5.894.66
lischarge (cfs)
7.5
0251014
a Backwater from ice or snow.
3360. Little Missouri River at Medora, N. Dak.
Location. Lat 46°55', long 103°32', in NE£ sec.27, T.140 N., R.102 W., on left bank 600 ft downstream from bridge on U.S. Highway 10, a quarter of a mile northwest of Medora, and 1 mile upstream from Andrews Creek.
Drainage area. 6,190 sq ml, approximately.
Gage. Monrecording prior to Aug. 23, 1951; recording thereafter. Nonrecording gages used interchangeably at sites 950 ft and 750 ft upstream at datum about 1 ft lower 1904-16. At site 600 ft upstream at datum about 1 f: lower Oct. 11, 1921, to Sept. 30, 1924. At site about 600 ft upstream within 0.2 ft of present datum Aug. 31, 1928, to Sept. 30, 1934. At site 600 ft upstream at present datum Oct. 1, 1945, to Aug. 22, 1951. Datum of gage is 2,246.75 ft above mean sea level, datum of 1929.
Stage-discharge relation. Defined by current-meter measurements below 43,000 cfs; subject to changes owing to channel shifting and Ice effect.
Bankfull stage.--15 ft.
Historical data. Since the turn of the century, in addition to floods listed in the table, a flood occurred In 1913 of approximately 15-18 ft gage height, present datum, from information by local residents.
Remarks.--Some small diversions above station for irrigation. Records for the period 1909-12, 1914-16 were computed using the gage height record published by the U.S. Weather Bureau and an open-water rating based on one discharge measurement made In 1912 and ratings used for the period 1903-08. Base for partial-duration series, 4,000 cfs. Only annual peaks are shown prior to 1946.
Peak stages and discharges
Water year
19041905
19061907190819091910
19111912
19141915
1916
1924
19291930
1931193219331934
Date
June 9, 1904July 2, 1905
June 8, 1906June 24, 1907June 6, 1908May 31, 19O9Mar. 16, 191O
May 17, 1911July 8, 1912
Apr. 3, 1914June 16, 1915
Mar. 16, 1916
Apr. 4, 1924
June 7, 1929Feb. 25, 1930Sept. 13, 1930
June 22, 1931Apr. 28, 1932May 24, 1933June 12, 1934
Gage height (feet)
11.210.2
12.016.010.711.59.5
8.68.7
6.314.1
9.1
13.8
17.2a8.4
-
4.529.66
12.444.50
Discharge (cfs)
11,6008,500
13,90029,00010,80012,4007,550
5,5405,750
1,85024,700
6,630
18,500
38,700-
4,700
1,61012,50020,8001,850
Water year
1946
1947
1948
1949
1950
1951
1952
Date
June 24, 1946
Feb. 18, 1947Feb. 23, 1947Mar. 23, 1947Apr. 12, 1947June 24, 1947
Feb. 19, 1948Mar. 16, 1948Mar. 20, 1948Mar. 23, 1948
Mar. 9, 1949Mar. 21, 1949Mar. 27, 1949
Mar. 6, 1950Apr. 3, 1950Apr. 3, 1950Apr. 16, 1950May 11, 1950
Mar. 22, 1951Mar. 22, 1951
Apr. 1, 1952
Gage height (feet)
8.75
-9.7
20.58.48.73
a8.5a8. 78.113.5
a8.1a!3.011.2
8.1alO.513.012.67.0
a9.0a8.5
a!8.35
D'.s charge (cfs)
9,310
5,500-
65,0008,9109,340
6,7007,6007,900
24,100
5,20012,60014,600
7,9706,560
25,60020,8005,610
_5,200
36,900a Backwater from ice.

316 LITTLE MISSOURI RIVER BASIN
Peak stages and discharges of Little Missouri River at Medora, N. Dak. Continued
Water year
1952
1953
1954
1955
1956
1957
1958
Date
Apr. 8, 1952
Mar. 19, 1953June 21, 1953
Apr. 7, 1954
June 27, 1955
Mar. 20, 1956Mar. 27, 1956
June 22, 1957
July 4, 1958
Qage height (feet)
17.32
a6.58.21
5.99
13.90
a4.764.05
7.45
5.9
Discharge (cfs)
42,500
4,8008,820
4,320
25,600
-2,030
7,900
5,050
Water year
1959
1960
1961
1962
1963
Date
Mar. 20, 1959
Mar. 22, 1960June 20, 1960
May 24, 1961
May 27, 1962May 30, 1962July 5, 1962
Feb. 7, 1963Mar. 3, 1963Mar. 3, 1963June 7, 1963
Gage t eight (feet)
a7.47
a8.726.12
5.22
9.479.856.59
a6.25a!4.3
-7.07
Discharge (cfs)
6,650
8,1004,690
3,540
10,10010,8005,350
4,550-
bll,0005,210
a Backwater from ice. b About.
3361. Sheep Creek tributary near Medora, N. Dak.
Location. Lat 46°55', long 103°26 r , in NW-fSE^r sec.29, T.140 N. , R.101 W. , at culvert on U.S. Highway 10, 3.6 miles east of Medora.
Drainage area. 0.29 sq mi.
Gage.--Crest-stage gage. Altitude of gage is 2,470 ft (from topographic map).
Stage-discharge relation. Defined by current-meter measurement below 1.3 cfs and extended above on basis of culvert measurement at 147 cfi?.
Remarks.--Only annual peaks are shown.
Peak stages and discharges
Water year
1955
195619571958
1959
Date
June 26, 1955
August 1956-
February 1958(b)
February orMarch 1959
Qage height (feet)
3.85
3.663.32
a3.583.482.69
Discharge (cfs)
28
2215-205
Water year
1960
196119621963
1964
Date
June 20, 1960
June 29, 1961July 18, 1962June or July
1963June 1964
Gage 1-eight (feet)6.55
3.984.023.01
3.62
Discharge (cfs)
147
305520
40
a Backwater from ice or snow. b Unknown.
3362. Sheep Creek tributary No. 2 near Medora, N. Dak.
Location.--Lat 46°56', long 103°28', near center of sec.19, T.1^0 N. , R.101 W. , at culvert on Theodore Roosevelt National Park Highway, 2f miles east of Medora.
Drainage area. 0.42 sq mi.
Gage.--Crest-stage gage. Altitude of gage is 2,460 ft (from topographic map).
Stage-discharge relation. Defined by culvert measurements at 85.7 and 139 cfs.
Remarks.--Only annual peaks are shown. Gage will not record below 3.00 ft.
Peak stages and discharges
Water year
1955
1956 1957 1958 1959 1960
Date
February 1958
June 20, 1960
Qage height (feet)
(a)
H (a)3.20
5.40
Discharge (cfs)
(b)
W (b) 2 0
139
Water year
1961 1962 1963
1964
Date
May 23, 1961 March 1962 June or July
1963 March 1964
Gage height (feet)
4.01 C2.90 3.26
Discharge (cfs)
85.7 2
53
d.2
a Below 3.00 ft. b Less than 1 cfs. c Backwater from ice or snow, d Estimated.
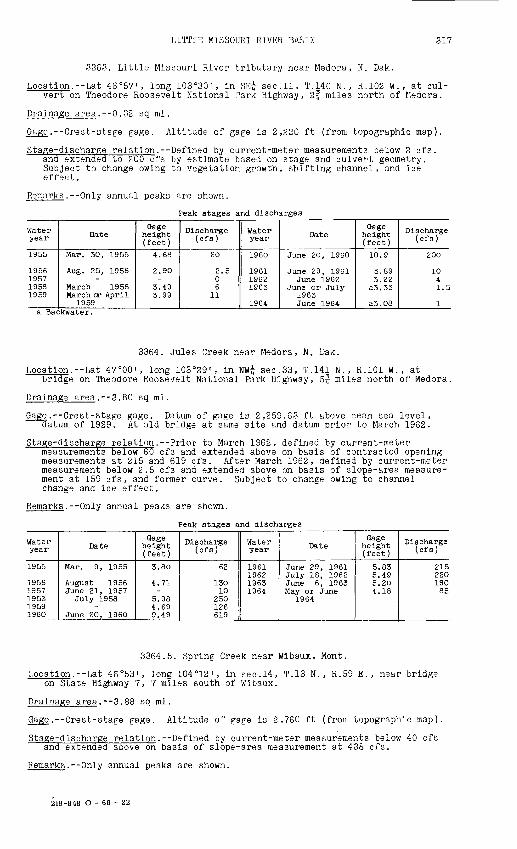
LITTLE MISSOURI RIVER BASIN 317
3363. Little Missouri River tributary near Medora, N. Dak.
Location. Lat 46°57', long 103°30', in SE^ sec.11, T.140 N. , R.102 W. , at cul vert on Theodore Roosevelt National Park Highway, 2f miles north of fledora.
Drainage area.--0.32 sq mi.
Gage. Crest-stage gage. Altitude of gage is 2,220 ft (from topographic map).
Stage-discharge relation. Defined by current-meter measurements below 2 cfs. and extended to 200 cfs by estimate based on stage and culvert geometry. Subject to change owing to vegetation growth, shifting channel, and ice effect.
Remarks. Only annual peaks are shown.
Peak stages and discharges
Water year
1955
1956195719581959
Date
Mar. 30, 1955
Aug. 25, 1956-
March 1958March or April
1959
Gage height (feet)
4.68
2.90-
3.493.99
Discharge (cfs)
20
2.506
11
Water year
1960
196119621963
1964
Date
June 20, 1960
June 29, 1961June 1962
June or July1963June 1964
Gage height (feet)
10.9
3.893.22
a3.33
a3.08
Discharge (cfs)
200
1041.5
1a Backwater.
3364. Jules Creek near Medora, N. Dak.
Location.--Lat 47°00' , long 103°29' , in NW£ sec.33, T.141 N., R.101 W. , atbridge on Theodore Roosevelt National Park Highway, 5f miles north of Medora.
Drainage area. 3.80 sq mi.
Gage.--Crest-stage gage. Datum of gage is 2,259.63 ft above mean sea level, datum of 1929. At old bridge at same site and datum prior to March 1962.
Stage-discharge relation.--Prior to March 1962, defined by current-metermeasurements below 60 cfs and extended above on basis of contracted opening measurements at 215 and 619 cfs. After March 1962, defined by current-meter measurement below 2.5 cfs and extended above on basis of slope-area measure ment at 159 cfs, and former curve. Subject to change owing to channel change and ice effect.
Remarks.--Only annual peaks are shown.
Peak stages and discharges
Water year
1955
19561957195S19591960
Date
Mar. 9, 1955
August 1956June 21, 1957
July 1958-
June 20, I960
Gage height (feet)
3.80
4.71-
5.984.699.49
Discharge (cfs)
62
13010
250126619
Water year
1961196219631964
Date
June 29, 1961July 18, 1962June 6, 1963May or June
1964
Gage height (feet)
5.835.495.204.18
Discharge (cfs)
21522019085
3364.5. Spring Creek near Wibaux, Mont.
Location.--Lat 46°53', long 104°12 ', in sec.14, T.13 N., R.59 E., near bridge on State Highway 7, 7 miles south of Wibaux.
Drainage area.--3.88 sq mi.
Gage. Crest-stage gage. Altitude of gage is 2,760 ft (from topographic map),
Stage-discharge relation. Defined by current-meter measurements below 40 cfs and extended above on basis of slope-area measurement at 438 cfs.
Remarks.--Only annual peaks are shown.
219-848 O -
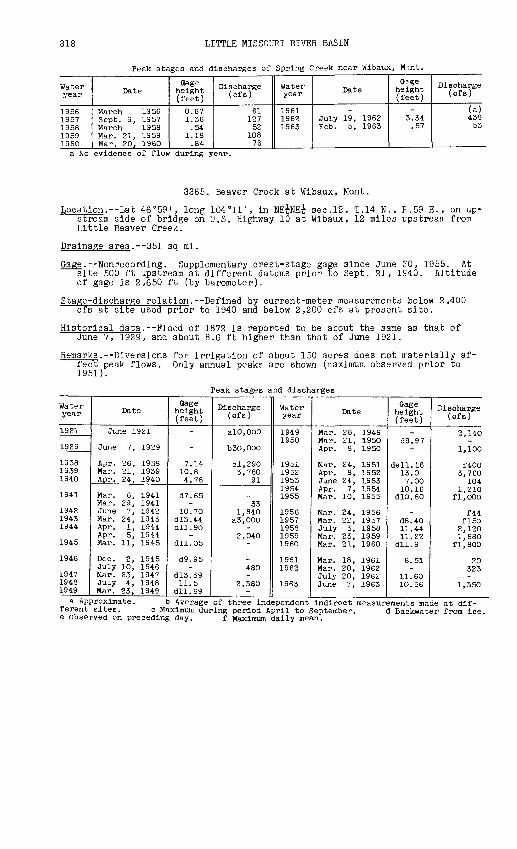
318 LITTLE MISSOURI RIVER BASIN
Peak stages and discharges of Spring Creek near Wibaux, Mint.
Water year
1956 1957 1958 1959 1960
Date
March 1956 Sept. 9, 1957 March 1958 Mar. 21, 1959 Mar. 20, 1960
Qage height (feet)
0.67 1.36 .54
1.18 .84
Discharge (cfs)
61 127 52
108 76
Water year
1961 1962 1963
Date
July 19, 1962 Feb. 5, 1963
G">tre height (feet)
3.34 .57
Discharge (of a)
(a)438 53
a No evidence of flow during year.
3365. Beaver Creek at Wibaux, Mont.
Location. Lat 46°59', long 10411', in NE^NE^ sec.12, T.14 N. , F .59 E., on up stream side of bridge on U.S. Highway 10 at Wibaux, 12 miles upstream from Little Beaver Creek.
Drainage area. 351 sq mi.
Gage. Nonrecording. Supplementary crest-stage gage since June cO, 1955. At site 500 ft upstream at different daturns prior to Sept. 21, 1F40. Altitude of gage is 2,650 ft (by barometer).
Stage-discharge relation. Defined by current-meter measurements below 2,400 cfs at site used prior to 1940 and below 2,200 cfs at present site.
Historical data. Flood of 1872 is reported to be about the same as that of June 7, 1929, and about 8.6 ft higher than that of June 1921.
Remarks. Diversions for irrigation of about 150 acres does not iraterially af fect peak flows. Only annual peaks are shown (maximum observed prior to 1951).
Peak stages and discharges
Water year
1921
1929
193819391940
1941
194219431944
1945
1946
194719481949
Date
June 1921
June 7, 1929
Apr. 26, 1938Mar. 21, 1939Apr. 24, 1940
Mar. 6, 1941Mar. 29, 1941June 7, 1942Mar. 24, 1943Apr. 1, 1944Apr. 5, 1944Mar. 11, 1945
Dec. 2, 1945July 10, 1946Mar. 23, 1947July 4, 1948Mar. 23, 1949
Qage height (feet)
-
-
7.1410.84.78
d7.65-
10.70d!3.44dll.90
-dll.05
d9.95-
d!3.3911.5
dll.69
Discharge (cfs)
alO.OOO
b30,000
cl,2903,780
91
-33
1,840a3,000
-2,040
-
_480-
2,380-
Water year
19491950
19511952195319541955
19561957195819591960
19611962
1963
Date
Mar. 28, 1949Mar. 21, 1950Apr. 8, 1950
Mar. 24, 1951Apr. 8, 1952June 24, 1953Apr. 7, 1954Mar. 10, 1955
Mar. 24, 1956Mar. 22, 1957July 3, 1958Mar. 23, 1959Mar. 21, 1960
Mar. 18, 1961Mar. 20, 1962July 20, 1962June 7, 1963
Qage height (feet)
_d9.97
dell. 1613.07.00
10.16dlO.80
_d8.4011.4411.22
dll.9
6.51
11.6010.56
Discharge (cfs)
2,140
1,100
f4003,760
1041,210
f 1,000
f44f!50
2,1201,680
f 1,800
20323
1,350
a Approximate. b Average of three independent indirect measurements made at different sites. c Maximum during period April to September. d Backwater from ice.e Observed on preceding day. f Maximum daily mean.
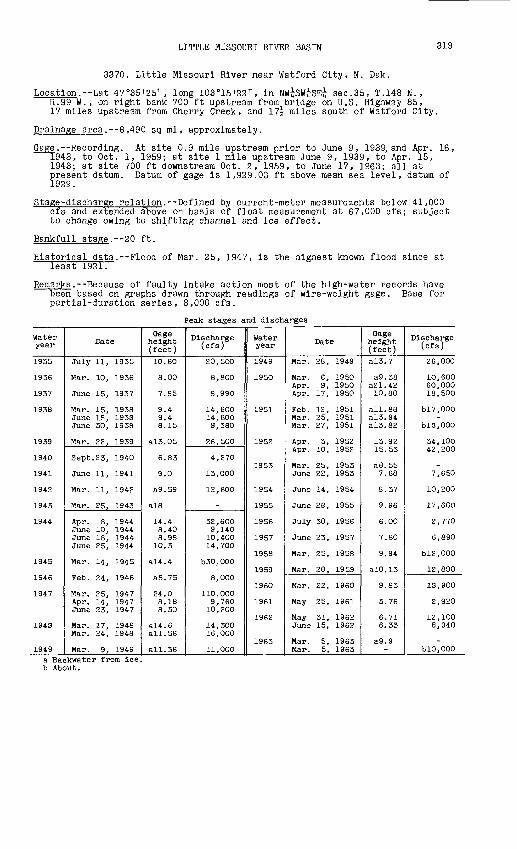
LITTLE MISSOURI RIVER BASIN 319
3370. Little Missouri River near Watford City, N. Dak.
Location.--Lat 47°35'25", long 103°15'22", in NW^SW^SE^ sec.35, T.148 N.,R.99 W., on right bank 700 ft upstream from bridge on U.S. Highway 85,17 miles upstream from Cherry Creek, and 17^ miles south of Watford City.
Drainage area.--8,490 sq mi, approximately.
Gage.--Recording. At site 0.9 mile upstream prior to June 9, 1939, and Apr. 16, 1943, to Oct. 1, 1959; at site 1 mile upstream June 9, 1939, to Apr. 15, 1943; at site 700 ft downstream Oct. 2, 1959, to June 17, 1963; all at present datum. Datum of gage is 1,929.03 ft above mean sea level, datum of 1929.
Stage-discharge relation.--Defined by current-meter measurements below 41,000 cfs and extended above on basis of float measurement at 67,000 cfs; subject to change owing to shifting channel and ice effect.
Bankfull stage.--20 ft.
Historical data.--Flood of Mar. 25, 1947, is the highest known flood since at least 1921.
Remarks. Because of faulty intake action most of the high-water records have been based on graphs drawn through readings of wire-weight gage. Base for partial-duration series, 8,000 cfs.
Peak stages and discharges
Water year
1935
1936
1937
1938
1939
1940
1941
1942
1943
1944
1945
1946
1947
194S
1949
Date
July 11, 1935
Mar. 10, 1936
June 15, 1937
Mar. 15, 1938June 18, 193SJune 30, 1938
Mar. 22, 1939
Sept. 23, 1940
June 11, 1941
Mar. 11, 1942
Mar. 25, 1943
Apr. 8, 1944June 10, 1944June 18, 1944June 25, 1944
Mar. 14, 1945
Feb. 24, 1946
Mar. 25, 1947Apr. 14, 1947June 23, 1947
Mar. 17, 1948Mar. 24, 1948
Mar. 9, 1949
Qage height (feet)10. 6O
8.00
7.85
9.49.48.15
a!3.05
6.83
9.0
a9.59
a!8
14.48.408.98
10.3
a!4.4
a8.75
24.08.188.30
a!4.6all. 56
all. 36
Discharge (cfs)
20,5OO
8,800
8,990
14,60014,60O9,380
26,500
4,270
13,000
12,600
-
32,6009,14010,40014,700
b 30, 000
8,000
110,0009,76010,200
14,30016,000
11,000
Water year
1949
195O
1951
1952
1953
1954
1955
1956
1957
1958
1959
1960
1961
1962
1963
Date
Mar. 28, 1949
Mar. 6, 1950Apr. 9, 1950Apr. 17, 1950
Feb. 12, 1951Mar. 25, 1951Mar. 27, 1951
Apr. 3, 1952Apr. 10, 1952
Mar. 25, 1953June 22, 1953
June 14, 1954
June 28, 1955
July 30, 1956
June 23, 1957
Mar. 25, 1958
Mar. 20, 1959
Mar. 22, 1960
May 25, 1961
May 31, 1962June 15, 1962
Mar. 5, 1963Mar. 5, 1963
Gage height (feet)a!3.7
a9.38a21.4210.80
all. 88a!3.94a!3.82
13.9215.53
a8.557.68
8.37
9.96
6.00
7.80
9.94
alO.13
9.83
3.76
6.716.33
a9.9-
Discharge (cfs)
26,000
10, 60060,00018,50O
b!7,OOO-
blS,OOO
34,10042,200
-7,650
10,200
17,60O
2,770
6,890
b!2,000
12,800
13,900
2,920
12,1008,940
-blO,000
a Backwater from ice. b About.

320 MISSOURI RIVER MAIN STEM
3375. Missouri River near Elbowoods, N. Dak.
Location. Lat 47°34', long 102°12' , in NE^NE^ sec.12, T.147 N., R.91 W., on downstream side of right span of bridge on State Highway 8, 2 miles down stream from Little Missouri River, 2j miles west of Elbowoods, and at mile 1,504.0.
Drainage area.--179.800 sq mi, approximately.
Gage. Nonrecording prior to Apr. 19, 1940, and after Nov. 8, 1945; recording Apr. 19, 1940, to Nov. 8, 1945. Datum of gage is 1,720.55 ft above mean sea level, datum of 1929.
Stage-discharge relation. Defined by current-meter measurements.
Remarks.--See remarks for station near Williston, N. Dak. (statioi 3300). Only annual peaks are shown.
Peak stages and discharges
Water year
1940
1941194219431944
1945
19461947
Date
June 10, 1940
Apr. 10, 1941June 8,1$ 1942Mar. 31, 1943Apr. 5, 1944June 25, 1944Mar. 20, 1945June 30, 1945
June 15, 1946Mar. 26, 1947
Oage height (feet)8.84
9.0alO.12b21.08b!7.2
-b!2.97
-
10.45b23.2
Discharge (cfs)
38,900
65,00074,000
241,000-
116,000-
70,200
58,800c260,000
Water year
1948
1949
1950
1951
19521953
Date
Mar. 25, 1948June 10, 1948Apr. 3, 1949Apr. 5, 1949Apr. 10, 1950Apr. 15, 1950
Apr. 6, 1951Apr. 11, 1951Apr. 5, 1952June 20, 1953June 23, 1953
Gage height (feet)
b!5.14-
bl?.05-
b!7.30-
bl6.03-
2^, 2010.92
-
Discharge (cfs)
-77,000
-c!70,000
-161,000
-94,000
360,000-
75,900a Occurred June 15, 1942. b Backwater from ice. c About.
DOUGLAS CREEK BASIN
3376. East Branch Douglas Creek tributary near Garrison, N. Dak.
Location. Lat 47°38'37", long 101°31'09", in SW^NE^NW^ sec.16, T.148 N. , R.85 W., at culvert on State Highway 37, 5 miles west of Garrison.
Drainage area. 1.39 sq mi.
Gage. Crest-stage gage.
Stage-discharge relation. Defined by current-meter measurements below 9 cfs and extended above on the basis of culvert measurement at 76 cfs.
Remarks.--Only annual peaks are shown.
Peak stages and discharges
Water year
1957
1959 1960
Date
July 1957
March 1959 April 1960
Gage height (feet)
8.54
4.2 8.18
Discharge (cfs)
76
a5 66
Water year
1961 1962 1963 1964
Date
March 1961 June 1962 June 1963
Apr. 27, 1964
Ga^e height (fe.t)
5.48 6.83 7.54 4.82
Discharge (cfs)
17 41 53 S
a Estimated.

SNAKE CREEK BASIN 321
3379. Snake Creek tributary near Garrison, N. Dak.
Location. Lat 47°37'55", long 101°21'00", on south line sec.14, T.148 N. ,R.84 ¥., at culvert on county highway, 1 mile south of State Highway 37and 3 miles southeast of Garrison.
Drainage area. 1.22 sq mi.
Gage. Crest-stage gage.
Stage-discharge relation. Defined by current-meter measurement below 8 cfs.
Remarks. Only annual peaks are shown.
Peak stages and discharges
Water year
1959 1960
1961
Date
March 1959 April 1960
March 1961
Oage height (feet)
1.88 6.18
2.97
Discharge (cfs)
3
11
Water year
1962 1963 1964
Date
Mar. 21, 1962 Mar. 19, 1963
Oage height (feet)
Discharge (cfs)
a3.89 14 2.77 8 2.53 5.5
a Backwater from ice or snow; occurred on preceding day.
KNIFE RIVER BASIN
3395. Knife River near Golden Valley, N. Dak.
Location. Lat 47°09', long 102°03', in SE£ sec.34, T.143 N., R.90 W., on left bank 6 ft downstream from county highway bridge, 4^ miles downstream from Elm Creek, and 9 miles south of Golden Valley.
Drainage area. 1,230 sq mi, approximately.
Gage. Nonrecording prior to May 1, 1946; recording thereafter. Datum of gage is 1,847.13 ft above mean sea level, datum of 1929 (levels by Corps of Engineers).
Stage-discharge relation. Defined by current-meter measurements below 9,000 cfs and extended above on basis of estimated velocity of flow in overflow section.
Bankfull stage.--20 ft.
Historical data. Flood of Mar. 26, 1943, is the highest known in the period 1903-55, according to streamflow records for period 1903-24 , and information by local residents.
Remarks. Base for partial-duration series, 1,500 cfs. Only annual peaks are shown prior to Oct. 1, 1946.
Peak stages and discharges
Water year
1943L944
1947
L948
L949
1950
1951
1952
Date
Mar. 26, 1943Apr. 2, 1944
Feb. 17, 1947Mar. 23, 1947Apr. 12, 1947June 24, 1947
Mar. 20, 1948Mar. 23, 1948Mar. 30, 1948June 5, 1948
Apr. 4, 1949
Mar. 26, 1950Apr. 8, 1950Apr. 16, 1950
Mar. 28, 1951Apr. 4, 1951
Apr. 7, 1952
Oage height (feet)
26.718.75
a!4.85a20.0812.3821.30
a!6.77a!9.012.0014.50
a22.9
a!6.52able. 5
26.37
a25,6816.05
25.63
Discharge (cfs)
11,5004,460
1,6003,5001,7006,020
3,0004,3701,6402,420
6,400
1,7001,90010,900
7,2003,020
9,740
Water year
1953
1954
1955
1956
1957
1958
1959
1960
1961
1962
1963
Date
June 4, 1953
Apr. 7, 1954
Mar. 13, 1955
Mar. 20, 1956Mar. 20, 1956
June 24, 1957
Mar. 27, 1958July 4, 1958
Mar. 23, 1959
Mar. 22, 1960
Mar. 3, 1961
May 30, 1962
June 9, 1963
Gage height (feet)
12.49
a!7.60
alO.37
a!9.55a!9.4
12.47
a!5.5613.30
a21.73
a!8.14
a5.42
17.12
9.52
Discharge (cfs)
1,510
3,320
750
-b2,300
1,490
2,0001,760
b5,000
2,830
117
3,080
779a Backwater from ice. b About.

322 KNIFE RIVER BASIN
3400. Spring Creek at Zap, N. Dak.
9 miles upstream from mouth.
Drainage area. --545 sq mi.
Gage . --Nonre cord ing prior to Oct. 1, 1947; recording thereafter. At site ~^T50 ft upstream prior to Oct. 1, 1948. At datum about 7 ft lower prior to
Oct. 1, 1945, and 1.12 ft higher Oct. I, 1945, to Sept. 30, 1947. Datum of gage is 1,819.39 ft above mean sea level, datum of 1929 (levels by Corps of Engineers). Gage heights given herein for 1947 are converted1 to present site and datum.
Stage-discharge relation . --Defined by current-meter measurements below 55 cfs in 1924 and below 5,900 cfs for the period 1945-63.
Bankfull stage. --14 ft.
Historical data .--Maximum stage known occurred about 1902, from ice jam. Floods of February 1913 and March 1943 reached stages of about 20 ard 19.5 ft,
respectively, according to local residents.
Remarks. --Flow regulated by Ilo Lake (capacity, 7,130 acre-ft); effect on flood peaks minor. Base for partial-duration series, 1,000 cfs.
Peak stages and discharges
Water year
1924
1947
1948
1949
1950
1951
1952
1953
1954
Date
June 27, 1924
Mar. 23, 1947June 24, 1947
Mar. 24, 1948Mar. 29, 1948Apr. 4, 1948June 3, 1948
Apr. 7, 1949
Mar. 25, 1950Apr. 17, 1950
Apr. 5, 1951June 7, 1951
Apr. 7, 1952
June 14, 1953
Apr. 5, 1954
Gage height (feet)
a!6.3
b!3.312.6
bll.8211.5311.1011.67
16.0
12.3518.80
bl8.3813.21
20.03
15.18
12.80
Discharge (cfs)
a878
1,2001,530
1,3801,3801,2801,430
2,890
1,6004,580
3,9001,720
6,130
2,360
1,610
Water year
1955
1956
1957
1958
1959
1960
1961
1962
1963
Date
Apr. 20, 1955
Mar. 19, 1956
Feb. 28, 1957
Mar. 29, 1958
Mar. 23, 1959
Mar. 27, 1960
Feb. 21, 1961
May 30, 1962June 15, 1962June 21, 1962July 18, 1962
June 8, 1963
Gage height (feet)
8.79
b!3.57
b!2.28
b9.75
b!3.20
18.58
b5.22
13.8016.1214.1915.76
10.85
Discharge (cfs)
664
1,650
1,200
726
1,420
4,640
130
1,5202,2301,6302,100
862
a Annual maximum observed only, b Backwater from ice.

KNIFE RIVER BASIN 323
3405. Knife River at Hazen, N. Dak.
Location.--Lat 47°17', long 101°37', in SE^ sec.18, T.144 N., R.86 W., on right bank at upstream side of county highway bridge, 0.5 mile south of Eszen and 2 miles upstream from Antelope Creek.
Drainage area. 2,350 sq mi, approximately.
Gage. Nonrecording prior to Sept. 25, 1947; recording thereafter. Datum of gage is 1,712.35 ft above mean sea level, datum of 1929.
Stage-discharge relation. Defined by current-meter measurements below 17,000 el's and extended above on basis of contracted-opening and flow-over-road measurements at 23,000 cfs.
Bankfull stage. 21 ft.
Historical data.--Floods of 1943, 1950, and 1952 are the only major floods known since at least 1884.
Remarks. Some diversions above station. Minor regulation by Ilo Lake (capac- ity, 7,130 acre-ft). Base for partial-duration series, 1,500 cfs. Only annual peaks are shown prior to Oct. 1, 1945.
Peak stages and discharges
Water year
1930
193119321933
193819391940
19411942194319441945
1946
1947
1948
1949
1950
Date
Feb. 21, 1930
Sept. 22, 1931June 14, 1932Mar. 8, 1933Mar. 17, 1933
July 5, 1938Mar. 24, 1939July 29, 1940
June 9, 1941June 7, 1942Mar. 26, 1943Apr. 3, 1944Mar. 15, 1945
Mar. 3, 1946
Feb. 18, 1947Mar. 25, 1947Apr. 4, 1947Apr. 13, 1947June 25, 1947
Mar. 24, 1948Mar. 30, 1948Apr. 4, 1948June 6, 1948
Apr. 3, 1949Apr. 6, 1949
Mar. 26, 1950Apr. 8, 1950
Oage height (feet)a23.2
11.611.10
a!5.6-
23.0024.4710.92
20.2317.126.323.3923.99
a!9.30
a!6.77a21.95a!4.7014.2021.70
a23.62IS. 2619.6213.25
a24.123.3
al8.61al6.10
Discharge (cfs)
b3,100
1,4501,300
-2,200
7,5409,3001,150
4,1103,120
26,5008,0108,690
3,500
1,7603,6601,5807,4606,000
7,0704,3204,7602,290
-7,760
2,7202,220
Water year
1950
1951
1952
1953
1954
1955
1956
1957
1958
1959
1960
1961
1962
1963
Date
Apr. 17, 1950
Mar. 30, 1951Apr. 5, 1951Aug. 29, 1951
Apr. 7, 1952
June 3, 1953June 14, 1953
Apr. 8, 1954
Mar. 13, 1955
Mar. 21, 1956
Mar. 1, 1957
Mar. 28, 195S
Mar. 24, 1959
Mar. 27, 1960
Mar. 2, 1961Mar. 3, 1961
May 31, 1962June 16, 1962June 22, 1962July 6, 1962July 19, 1962
June 10, 1963
Oage height (feet)25.93
a25.36a23.6711.77
25.83
16.0117.31
18.06
11.35
a23.76
a!2.49
a!9.82
20.14
a23.13
a9.72a9.62
17.4813.4012.9111.3613.72
9.63
Discharge (cfs)
22,700
9,0007,6001,580
20,200
2,8603,440
3,880
bl,400
6,630
1,590
3,500
4,930
7,230
_488
3,8602,2302,0601,5302,340
1,050a Backwater from ice b About.

324 TURTLE CREEK BASIN
3414. Turtle Creek near Turtle Lake, N. Dak.
Location.--Lat 47°27'30", long 100°55'15", on north line sec.19, T.146 N., R.80 W. , on downstream end of twin culverts on State Highway 7, 2-| miles downstream from Lake Ordway and 4 miles southwest of Turtle Lake.
Drainage area.--310 sq mi, approximately, of which about 115 sq mi contributes directly to surface runoff.
Gage. Recording. Altitude of gage is 1,805 ft (from topographic map).
Stage-discharge relation. Defined by current-meter measurement below 34 cfs.
Remarks.--Peak flows probably materially affected by storage in Lake Ordway. Base for partial-duration series, 30 cfs.
Peak stages and discharges
Water year
1957
1958
1959
Date
Feb. 27, 1957 July 28, 1957
Mar. 26, 1958
Mar. 10, 1959Mar. L4, 1959
Gage height (feet)
4.86 4.10
4.50
a4.22E4.16
Discharge (cfs)
91 34
53
.25
Water year
1960
1961
1962
1963
Date
Mar. 26, 1960
Feb. 22, 1961
July 6, 1962
Aug. 2, 1963
C-age height (feet)ab5.04
a3.83
a4.51
4.01
Discharge (cfs)
82
5.0
22
20a Backwater from ice.b Occurred on preceding day.
PAINTED WOODS CREEK BASIN
3418. Painted Woods Creek near Wilton, N. Dak.
Location.--Lat 47°16'30", long 100°47'30", in SW^-SW^ sec.23, T.144 N., R.80 W. , on right bank 600 ft upstream from county highway bridge, 7 miles upstream from Yanktonai Creek, and 8 miles north of Wilton.
Drainage area.--427 sq mi, of which about 117 sq mi contributes directly to surface runoff.
Gage.--Recording. Altitude of gage is 1,760 ft (from topographic map).
Stage-discharge relation.--Defined by current-meter measurement below 640 cfs.
Remarks. Base for partial-duration series, 30 cfs.
Peak stages and discharges
Water year
1958
1959
1960
1961
Date
Mar. 26, 1958
Mar. 15, 1959Mar. 21, 1959
Mar. 27, 1960
Mar. 3, 1961
Gage height (feet)6.22
5.225.13
a7.44
4.68
Discharge (cfs)
271
-46
650
12
Water year
1962
1963
1964
Date
Mar. 27, 1962May 17, 1962
June 6, 1963July 26, 1963Aug. 11, 1963
Aug. 3, 1964
Gage height (feet)
6.625.66
5.136.814.99
4.97
Discharge (cfs)
438126
5947543
40a Backwater from ice.

SQUARE BUTTE CREEK BASIN 325
3420.5. Square Butte Creek at Center, N. Dak.
Location.--Lat 47°06'40", long 101°17'55", at section corner 14, 15, 22, 23, T.124 N., R.84 W. , at bridge on State Highway 25 in Center.
Drainage area.--56.8 sq mi.
Gage. Crest-stage gage.
Stage-discharge relation.--Defined by current-meter measurement below 140 cfs.
Remarks.--Only annual peaks are shown.
Peak stages and discharges
Water year
1956 1957 1958 1959 1960
Date
Mar. 21, 1956 July 22, 1957 March 1958 Mar. 22, 1959 Mar. 28, 1960
Qage height (feet)
a4.1 4.43 4.54
a4.48 a7.00
Discharge (cfs)
90
215
Water year
1961 1962
1963 1964
Date
Feb. 22, 1961 Mar. 22, 1962 May 29, 1962 March 1963 June 21, 1964
Qage height (feet)
3.10 a3.70 3.66 1.70 3.89
Fischarge (cfs)
86
200 13
a Backwater from ice or snow.
3421. Square Butte Creek tributary No. 2 near Center, N. Dak.
Location. Lat 47°07', long 101°15', at south line sec.13, T.142 N., R.84 W., at culvert on State Highway 25, 1.9 miles east of Center.
Drainage area. 13.0 sq mi.
Gage. Crest-stage gage.
Stage-discharge relation.--Defined by current-meter measurements below 570 r-fs.
Remarks.--Only annual peaks are shown.
Peak stages and discharges
Water year
1955
19561957195819591960
Date
March 1955
March 1956July 16, 1957March 1958Mar. 22, 1959Mar. 26, 1960
aage height (feet)4.74
a6.187.98
a5.285.557.20
Discharge (cfs)
125
1702,500
230300
1,350
Water year
1961
1962
19631964
Date
Feb. 21, 1961March 1961July or August
1962June 1963
Mar. 31, 1964
Gage height (feet)
a4.504.085.74
4.544.47
Tischarge (cfs)
-53
370
10090
a Backwater from ice or snow.
3421.5. Square Butte Creek tributary near Center, N. Dak.
Location.--Lat 47°07', long 101°16' , at south line sec.13, T.142 N. , R.84 W., at culvert on State Highway 25, 1.7 miles east of Center.
Drainage area.--0.19 sq mi.
Gage. Crest-stage gage.
Stage-discharge relation. Defined by current-meter measurements below 9 cfs and extended above on basis of culvert measurement at 50.8 cfs.
Remarks.--Gage heights listed are for tailwater gage. Only annual peaks are shown.

326 SQUARE BUTTE CREEK BASIN
Peak stages and discharges of Square Butte Creek tributary near Certer, N. Dak.
Water year
1955
1956195719581959
Date
July or August
Mar. 16, 1956July 16, 1957March 1958Mar. 22, 1959
Oage height (feet)
3.98
3.996.344.63-
Discharge (cfs)
11
1250.8227
Water year
1960
1961196219631964
Date
Mar. 26, 1960
March 1961-
June 1963March 1964
Gage height (feet)
4.40
-b4.58
-
Discharge (of a)
18
a About.b Backwater from ice or snow.
3422.5. Square Butte Creek tributary No. 3 near Center, N. Dak.
Location. Lat 47°07', long 101°11', in SE^ sec.15, T.142 N., R.83 W. , at cul vert on State Highway 25, 5f miles east of Center.
Drainage area. 1.68 sq mi.
Gage. Crest-stage gage.
Stage-discharge relation. Defined by current-meter measurements below 14 cfs and extended above on basis of culvert measurements at 39.8 and 86 cfs.
Remarks. Only annual peaks are shown.
Peak stages and discharges
Water year
1955
19561957195819591960
Date
March 1955
Mar. 20, 1956March 1957March 1958Mar. 19, 1959Mar. 26, 1960
Gage height (feet)
a5.85
a4.294.206.61
a3.25a5.10
Discharge (cfs)
_
b4048862540
Water year
1961
1962
19631964
Date
Feb. 22, 1961Mar. 2, 1961March 1962May 29, 1962
June 1963March 1964March 1964
Cage height (feet)a3.20
-a3.81
a4.51
Discharge (of s)
-
-
-
a Backwater from ice or snow, b About.
BURNT CREEK BASIN
3423. Burnt Creek tributary near Baldwin, N. Dak.
Location.--Lat 47°01'25", long 100°47'30", 0.2 mile south of section corner 14, 15, 22, 23, T.141 N., R.80 W., at culvert on U.S. Highway 83, 2 miles west of Baldwin.
Drainage area.--2.98 sq mi.
Gage. Crest-stage gage.
Stage-discharge relation.--Defined by current-meter measurement below 90 cfs and extended above on basis of culvert measurements at 256 and 966 cfs.
Remarks. Only annual peaks are shown.
Peak stages and discharges
Water year
1956
1957 1958 1959
1960
Date
Mar. 21, 1956 July 7, 1956 July 16, 1957 Mar. 25, 1958 Mar. 13, 1959 Mar. 19, 1959 Mar. 26, 1960
Gage height (feet)a7.25 2.78 3.76 3.15
a3.10 2.20 a4.98
Discharge (cfs)
73.4 256 130
17 200
Water year
1961
1962 1963 1964
Date
Feb. 21, 1961 Feb. 21, 1961 Mar. 17, 1962 June 6, 1963 May 6, 1964
Gage height (feet)= 2.12 al.97 a5.80 3.05 7.85
Discharge (cfs)
4.2 25 50
966
a Backwater from ice or snow.

BURNT CREEK BASIN 327
3423.5. Burnt Creek tributary No. 2 near Baldwin, N. Dak.
Location.--Lat 46°59'05", long 100°47'25", in SW^SW^ sec.35, T.141 N. , R.80 W., at culvert on U.S. Highway 83, 3^ miles southwest of Baldwin.
Drainage area.--2.12 sq mi.
Gage. Crest-stage gage.
Stage-discharge relation.--Defined by current-meter measurements below 50 cfs and extended above on basis of culvert measurements at 247, 380, and 645 cfs.
Remarks. Only annual peaks are shown.
Peak stages and discharges
Water year
1956 1957 1958 1959 1960
Date
June 30, 1956 July 16, 1957 June 4, 1958 Mar. 19, 1959 Mar. 26, 1960
Qage height (feet)
5.23 5.95 3.67 2.60
a4.28
Discharge (cfs)
373 476 150 17
b200
Water year
1961 1962 1963 1964
Date
Feb. 21, 1961 Mar. 21, 1962
June 1963 May 6, 1964
Gage height (feet)a2.51 a4.2 a2.947.18
Discharge (cfs)
7.0 20 10
652
a Backwater from Ice or snow, b About.
MISSOURI RIVER MAIN STEM
3425. Missouri River at Bismarck, N. Dak.
Location.--Lat 46°48'51", long 100°49'12", in SE^Nl^SE^ sec.31, T.139 N. ,R.80 W., on left bank 40 ft upstream from Bismarck city water-filter plant, 2,100 ft downstream from Northern Pacific Railway bridge, 1.6 miles north west of Bismark post office, 3.5 miles upstream from Heart River, and at mile 1,314.5.
Drainage area. 186,400 sq mi, approximately.
Gage.--Nonrecording prior to Oct. 17, 1928, and July 24 to Sept. 30, 1£37; re cording during remainder of time. At site 2,100 ft upstream at datum 4.24 ft higher prior to Oct. 17, 1928. At present site at datum 4.24 ft higher Oct. 17, 1928, to Sept. 30, 1934, and at present datum Oct. 1, 1934, to Apr. 9, 1936. At site 2,000 ft downstream at datum 0.47 ft lower Apr. 10, 1936, to Sept. 30, 1937. Datum of gage is 1,618.38 ft above mean sea level, datum of 1929.
Stage-discharge relation. Defined by current-meter measurements.
Historical data.--Stage of Mar. 31, 1881, is highest known.
Remarks.--Peak flows affected to some extent by irrigation and power develop ments and by storage reservoirs above station. Peaks materially affected by regulation of Fort Peck Reservoir (total capacity, 19,410,000 acre-ft) since 1937, and by Garrison Reservoir (total capacity, 24,790,000 acre-ft) since 1953. Only annual peaks are shown.
Peak stages and discharges
Water year
1881
1929
1930
1931 1932 1333
1934 1935
1936
1937 1938 a Pre
Date
Mar. 31, 1881
Mar. 17, 1929 June 10, 1929 Mar. 6, 1930 Apr. 5, 1930
June 10, 1931 June 13, 1932 Mar. 21, 1933 June 21, 1933 Mar. 20, 1934 July 13, 1935
Mar. 20, 1936Apr. 15, 1936 June 18, 1937Mar. 19, 1938
sent site and da
Qage height (feet)
ab31.6
b!7.8
bll.38
5.31 8.33
b9.53
7.4113.15
b!6.50
12.6519.60
;um.
Discharge (cfs)
-
122,000
78,000
47,200 118,000
88,800 79,200
116,000
117,000 98,900190,000
b Backwater
Water year
1939 1940
1941
1942 1943
1944 1945
1946
1947 1948
'rom ice
Date
Mar. 28, 1939 June 11, 1940
June 22, 1941 June 11, 1941, Sept. 10, 1941 June 16, 1942 Apr. 1, 1943 Apr. 3, 1943 Apr. 7, 1944 Mar. 18, 1945 June 30, 1945
Mar. 27, 1946 Mar. 28, 1946 Mar. 29, 1947 Apr. 1, 1948 June 12, 1948
Gage height (feet)
21.45 10.19
10.00
12.5 22.2
b!6.90 b!4.5
blO.93
21.80 b!5.84
Discharge (cfs)
222,000 56.6OO
51,600
77,400
282,000 136,000
73,400
59,600 262,000
76,400

328 MISSOURI RIVER MAIN STEM
Peak stages and discharges of Missouri River at Bismarck, N. Dak.--Continued
Water year
1949
1950
1951
19521953
19541955
1956
Date
Apr. 3, 1949Apr. 6, 1949Apr. 17, 1950
Apr. 4, 1951Apr. 5, 1951Apr. 6, 1952June 21, 1953June 24, 1953Aug. 17, 1954May 14, 1955
Apr. 2, 1956June 17, 1956
Oage height (feet)
b!8.15-
18.72
b!6.30-
27.9011.13
_9.739.08
blO.70-
Discharge (cfs)
_157,000192,000
_130,000500,000
-78,20040,60048 , 100
-38,200
Water year
1957
1958
1959
1960
19611962
1963
Date
Dec. 10, 1956May 13, 1957Mar. 30, 1958June 23, 1958Dec. 3, 1958Sept. 8, 1959Mar. 27, 1960
Apr. 2, 1961Jan. 26, 1962June 13, 1962Jan. 25, 1963Apr. 25, 1963
Gage height (feet)
b8.71-
b9.27-
blO.49-
b!3.27
7.87bll.51
-bll.52
-
Discharge (cfs)
-26,700
-33,100
-23,70035,000
24,800-
31,900-
30,200
b Backwater from ice.
HEART RIVER BASIN
3430. Heart River near South Heart, N. Dak. (Published as Heart River near Dickinson prior to June 1, 1947)
Location. Lat 46°52', long 102°57', in SWi sec.8, T.139 N., R.97 W., on left bank half a mile downstream from North Creek and 2 miles east of South Heart.
Drainage area. 315 sq mi.
Gage. Nonrecording prior to June 1, 1947; recording thereafter. At bridge 6 miles downstream at different datum prior to June 1, 1947. Datum of gage is 2,429.45 ft above mean sea level, datum of 1929 (levels by Corps of Engineers).
Stage-discharge relation. Defined by current-meter measurements below 3,800 cfs.
Bankfull stage.--18 ft.
Remarks. Base for partial-duration series, 200 cfs.
Peak stages and discharges
Water year
1947
1948
1949
1950
1951
1952
1953
1954
Date
Feb. 17, 1947Mar. 24, 1947Mar. 30, 1947Apr. 12, 1947June 23, 1947July 1, 1947
Mar. 16, 1948Mar. 20, 1948Mar. 23, 1948Mar. 29, 1948June 3, 1948
Mar. 31, 1949
Mar. 7, 1950Mar. 23, 1950Apr. 16, 1950May 11, 1950
Feb. 22, 1951Mar. 26, 1951
Apr. 1, 1952
June 22, 1953Aug. 20, 1953
Apr. 6, 1954
Qage height (feet)
a!3.33a!7.0a9.014.516.0911.30
a8.3614.7815.158.2713.56
17.75
a9.20a!2.5521.676.87
a8.03a!7.09
20.05
7.3212.46
21.73
Discharge (cfs)
8402,200
3271,7201,860
886
2361,5501,640
4501,310
2,400
450630
4,970281
3002,100
3,300
3341,120
5,030
Water year
1955
1956
1957
1958
1959
1960
19611962
1963
1964
Date
Mar. 14, 1955Apr. 21, 1955June 28, 1955
Mar. 21, 1956July 31, 1956
Apr. 23, 1957June 18, 1957June 23, 1957July 4, 1957
Mar. 26, 1958July 11, 1958
Mar. 20, 1959
Mar. 22, 1960June 22, 1960
June 30, 1961May 31, 1962
Mar. 3, 1963May 14, 1963June 7, 1963June 16, 1963
June 10, 1964
Gage height (feet)
s6.356.5216.12
-6.38
9.569.2721.798.12
12.079.60
17.42
14.729.70
4.717.14
a7.158.197.915.74
10.42
Discharge (cfs)
210263
1,910
b200251
642588
5,090430
994571
2,290
1,580692
115349
270446447202
814
a Backwater from ice. b About.

HEART RIVER BASIN 329
3432. Heart River tributary near South Heart, N. Dak.
Location.--Lat 46°53', long 102°55 r , in SE^ sec.4, T.139 N., R.97 W., at cul vert on U.S. Highway 10, 3.5 miles northwest of South Heart.
Drainage area . 0.13 sq mi.
Gage.--Crest-stage gage.
Stage-discharge relation. Defined by culvert measurements at 38.1 and 61.6 cfs.
Remarks. Only annual peaks are shown.Peak stages and discharges
Water year
1955
1956
19571958
Date
June 26, 1955
July or August1956
June 21, 1957March 1958Aug. 21, 1958
Gage height (feet)12.37
10.80
9.82a!2.22
8.82
Discharge (cfs)
62
33
14-1.5
Water year
19591960
1961196219631964
Date
June 20, 1959March 1960
June 29, 1961March 1962May 12, 1963
May 1964
Gage height (feet)10.099.49
11.09a9.3011.459.26
Discharge (cfs)
209.0
38bl454.8
a Backwater from ice or snow, b Estimated.
3442. Heart River tributary near Dickinson, N. Dak.
Location. Lat 46°50'21", long 102°47'22", in NW^SWi sec.22, T.139 N., R.96 W., at culvert on State Highway 22, 3 miles south of Dickinson.
Drainage area. 1.72 sq mi.
Gage.--Crest-stage gage.
Stage-discharge relation.--Defined by current-meter measurements.
Remarks.--Only annual peaks are shown.Peak stages and discharges
Water year
1955
19561957 1958 19591960
Date
June 26, 1955
Mar. 1, 1956June 21, 1957 July 3, 1958 March 1959March 1960
Gage height (feet)
5.85
3.88
5.09 3.834.20
Discharge (cfs)
90
16.2
621529
Water year
1961196219631964
Date
---
May or June , 1964
Gage height (feet)
---
3.53
E is charge (cfs)
0006
3445. Heart River at Lehigh, N. Dak.
Location. La t 46°52', long 102°43', in NE^- sec.7, T.139 N. , R.95 W., on up- stream side of county highway bridge in Lehigh, 150 ft downstream frcm Northern Pacific Railway bridge, 10 miles downstream from Dickinson lam, and 10 miles upstream from Green River.
Drainage area. 443 sq mi.
Gage. Nonrecording. Datum of gage is 2 328.39 ft above mean sea level, datum of 1929 (levels by Corps of Engineers).
Stage-discharge relation. Defined by current-meter measurements below 4,900 cfs.
Remarks. Regulated by Dickinson Reservoir since May 23, 1950. Several small diversions above station for irrigation and municipal and industrial use. Peaks for water years 1953-55 computed by multiplying maximum discharge for station below Dickinson Dam by factor of 1.05. Base for partial-duration series, 600 cfs. Only annual peaks are shown for 1943, 1950-55.

330 HEART RIVER BASIN
Peak stages and discharges of Heart River at Lehigh, N. Dak.
Water year
1943
1944
1945
1946
1947
Date
Mar. 25, 1943
Apr. 2, 1944June 20, 1944June 28, 1944
Mar. 13, 1945Mar. 27, 1945
Mar. 4, 1946June 26, 1946
Feb. 17, 1947Mar. 24, 1947Apr. 12, 1947June 24, 1947
Gage height (feet)17.7
10.2410.5210.87
a!7.79.74
a7.063.95
all. 3015.711.2011.16
Discharge (cfs)
5,420
1,1801,2801,420
4,500932
-20
9504,0401,6801,660
Water year
1947
1948
1949
1950
19511952195319541955
Date
July 2, 1947
Mar. 21, 1948Mar. 24, 1948June 4, 1948
Apr. 2, 1949
Apr. 15, 1950
Mar. 26, 1951Apr. 3, 1952Aug. 21, 1953Apr. 7, 1954June 29, 1955
Gage height (feet)
8.62
a!2.2a!2.1
8.94
a!4.9
17.90
a!5.014.30
---
Discharge (cfs)
811
1,5201,640
895
3,800
5,980
2,6003,520
5004,2001,500
a Backwater from ice.
3450. Green River near Gladstone, N. Dak.
Location.--Lat 46°53', long 102°37', in SW£ sec.36, T.140 N., R.95 W., on right bank half a mile upstream from bridge on U.S. Highway 10, 3^ miles northwest of Gladstone, 3^ miles upstream from mouth, and 8 miles downstream from Spring Creek.
Drainage area. 356 sq mi.
Gage.--Nonrecordlng prior to June 27, 1953; recording thereafter. At datum 4.15 ft lower prior to June 27, 1953. On former Highway 10 bridge over former channel, 700 ft east of next site Oct. 1, 1945, to July 5, 1949. On Highway 10 bridge half a mile downstream from present site July 6, 1949, to June 26, 1953. Altitude of gage is 2,320 ft (by barometer).
Stage-discharge relation. Defined by current-meter measurements below 4,500 cfs prior to 1954 and below 2,800 cfs thereafter.
Bankfull stage.--13 ft, present site and datum.
Historical data. Maximum stage known, that of March 1943, site and datum used prior to June 27, 1953.
Remarks.--A few small diversions above station for irrigation of hay meadows, and washing of sand and gravel. Base for partial-duration series, 500 cfs. Only annual peaks are shown prior to Oct. 1, 1947.
Peak stages and discharges
Water year
1943
1946
1947
1948
1949
1950
1951
1952
1953
1954
Date
March 1943
Feb. 28, 1946Mar. 5, 1946Mar. 25, 1947
Mar. 24, 1948Mar. 29, 1948June 4, 1948
Apr. 5, 1949
Mar. 24, 1950Apr. 15, 1950
Mar. 27, 1951
Apr. 3, 1952
June 14, 1953
Apr. 7, 1954
Gage height (feet)
a20
b5.42b4.32b!5.44
b!2.7b9.910.8
16.9
b8.418.3
b!6.7
15.7
7.70
15.93
Discharge (of a)
-
140140
2,300
1,7701,1601,520
3,780
5205,260
3,800
3,440
847
4,290
Water year
1955
1956
1957
1958
1959
1960
1961
1962
1963
Date
Mar. 15, 1955Apr. 22, 1955
Mar. 19, 1956
Apr. 24, 1957June 23, 1957
Mar. 27, 1958Mar. 29, 1958
Mar. 24, 1959
Mar. 22, 1960June 23, 1960
June 30, 1961
July 4, 1962
Mar. 6, 1963 June 8, 1963
Gage 1- eight (feet)b4.82b4.52
-
6.328.05
b6.766.36
9.70
b9.658.31
3.60
3.65
b5.06 4.46
Discharge (cfs)
280
a250
7811,180
-838
1,640
1,5001,150
200
218
347
a About.b Backwater from ice.

HEART RIVER BASIN 331
3451. Antelope Creek near Dickinson, N. Dak.
Location. Lat 46°43' , long 102°47' in NW^SW^ sec.34, T.138 N., R.96 W., at bridge on State Highway 22, 11 miles south of Dickinson.
Drainage area. 69.2 sq mi.
Gage.--Crest-stage gage.
Stage-discharge relation. Defined by current-meter measurement below 1,100 cfs and extended above on basis of contracted-opening measurement at 6,100 cfs.
Remarks. Only annual peaks are shown.Peak stages and discharges
Water year
1955
1956
1957
1958
Date
Mar. 9, 1955June 26, 1955
July 30 or 31,1956
June 21 or 22,1957
March 24or 25,1958
Gage height (feet)
a5.52-
5.21
11.98
6.95
Discharge (cfs)
_200
210
6,100
920
Water year
19591960
1961196219631964
Date
March 1959March 1960April 1960
-May 29, 1962June 5, 1963
June 1964
Gage height (feet)
alO . 30a6.0
-
-4.836.593.58
I is charge (cfs)
1,500-280
055
6005
a Backwater from ice or snow.
3452. Antelope Creek tributary near New England, N. Dak.
Location. Lat 46°40', long 102°47', in SW^NW^ sec.22, T.137 N., R.96 W., at culvert on State Highway 22, 9-| miles northwest of New England.
Drainage area. 13.0 sq mi.
Gage. Crest-stage gage.
Stage-discharge relation. Defined by current-meter measurement below 28 cfs and extended above on basis of culvert measurements at 1,080 and 1,360 cfs.
Remarks. Only annual peaks are shown.Peak stages and discharges
Water year
1955
1956195719581959
Date
June 26, 1955
June 29, 1956June 21, 1957Mar. 25, 1958
May 1959
Gage height (feet)
6.26
3.918.93a4.642.92
Discharge (cfs)
602
1791,08024017
Water year
1960
1961196219631964
Date
June 12, 1960
_May 29, 1962June 5, 1963
June 1964
Gage height (feet)
10.93
_a3.024.862.92
Discharge (cfs)
1,360
011.7
35017
a Backwater from ice or snow.
3453. Antelope Creek tributary (site No. 2) near New England, N. Dak.
Location. Lat 46°41', long 102°47', in SW^SWy sec.10, T.137 N., R.96 W., at culvert on State Highway 22, 11 miles northwest of New England.
Drainage area . 22.4 sq mi.
Gage.--Crest-stage gage.
Stage-discharge relation. Defined by current-meter measurement below 140 cfs and extended above on basis of culvert measurements made at 675, 1,090, and 1,200 cfs.
Remarks.--Only annual peaks are shown.

332 HEART RIVER BASIN
Peak stages and discharges of Antelope Creek tributary (site NT. 2) near New England, N. Dak.
Water year
1955
1956
195719581959
Date
June 26, 1955
July or August1956
June 21, 1957Mar. 24, 1958March 1959
Oage height (feet)
4.49
5.72
6.54a5.55a4.00
Discharge (cfs)
675
441
1,200100-
Water year
19591960
1961196219651964
Date
March 1959June 12, 1960
_May 29, 1962June 5, 1963June 21, 1964
Gage 1 eight (feet)
_6.55
_2.954.14
al.52
Discharge (cfs)
b201,120
210567
2.0a Backwater from ice. b At least this high.
3455. Heart River near Richardton, N. Dak.
Location. Lat 46°44 I 46", long 102°18'27", in NE^ sec.29, T.138 N., R.92 W., on right bank 10 ft upstream from bridge on State Highway 8, half a mile down stream from Blacktail Creek, and 9-|- miles south of Richardton.
Drainage area.--1,240 sq mi, approximately.
Gage.--Monrecordlng prior to July 8, 1947; recording thereafter. At old bridge 3"00 ft downstream at datum 2.77 ft lower 1905-10. At site 1 mile downstream at different datum 1911 (gage set to read same as gage used 1905 to 1910). At site 500 ft below the 1911 staff gage (set to read 20 ft higher than 1911 staff gage) 1912-21. During the period 1912-21, the 1905-10 chain gage (with 20.00 ft added to readings) was used interchangeably with the canti lever chain gage. At present site and datum since 1943. The 1938 maximum gage height is referred to present site and datum. Datum of present gage is 2,153.67 ft above mean sea level, datum of 1929.
Stage-discharge relationship.--Defined by current-meter measureirents below 19,000 cfsT
Bankfull stage.--20 ft.
Remarks. Flow regulated by Dickinson Reservoir since May 1950. Regulation is only minor at high discharges. Base for partial-duration series, 1,500 cfs. Only annual peaks are shown prior to Oct. 1, 1945.
Peak stages and discharges
Water year
1905
19061907190819091910
19111912191319141915
1916
1917
191819191920
1921
1938
19431944
Date
July 5, 1905
June 10, 1906Mar. 22, 1907May 24, 1908June 2, 1909Mar. 14, 1910
Mar. 19, 1911Mar. 31, 1912Apr. 2, 1913June 29, 1914June 15, 1915
Feb. 23, 1916Apr. 4, 1916Mar . 30, Apr . 1 ,
1917Apr. 1-3, 1917Aug. 22, 1918Apr. 1, 1919Mar. 25, 1920Mar. 29, 1920
June 19, 1921
July 5, 1938
Mar. 25, 1943June 18, 1944
Gage height (feet)
10.0
25.914.510.518.0
a!9.4
5.73.1)4:2:! . 9a42.l31.732.6
a35.7
a33.7
-54.129.6
a32.4-
28.6
26.0
24.215.6
Discharge (cfs)
1,000
10,5002,5001,1304,2504,600
2004,5005,5001,5501,820
_2,470
-
1,8502,200
966-
1,500
714
16,000
11,7004,470
Water year
1945
1946
1947
1948
1949
1950
1951
1952
1953
Date
Mar. 14, 1945
Mar. 2, 1946Mar. 5, 1946
Feb. 17, 1947Mar. 23, 1947Apr. 2, 1947 June 24, 1947
Mar. 15, 1948Mar. 20, 1948Mar. 24, 1948Mar. 30, 1948June 5, 1948July 21, 1948
Mar. 28, 1949Apr. 6, 1949
Mar. 6, 1950Mar. 24, 1950Apr. 16, 1950
Mar. 27, 1951
Apr. 3, 1952Aug. 27, 1952
June 15, 1953
Gage height (feet)
22.57
a8.80a8.86
a!5 . 73aZl.O 13 . 8215.55
12.98a!4.72alS.OO10.411.616.5
a!5.3818.8
alO.95a!4.2828.05
19.52
20.4310.66
12.97
Discharge (cfs)
9,920
900"
7,500 3 4404*44-0
2,5003,6603,7601,7402,1905,010
4,1006,540
1,87023,400
7,900
7,9901,590
2,880
a Backwater from ice.b Occurred on preceding day.

HEART RIVER BASIN 333
Peak stages and discharges of Heart River near Richardton, N. Dak.--Con.
Water year
1954
1955
1956
1957
1958
1959
Date
Apr. 7, 1954
June 29, 1955
Mar. 20, 1956
June 22, 1957
Mar. 27, 1958
Mar. 19, 1959
Gage height (feet)
19.65
10.28
ab!2 . 92
17.38
15.23
a!6.42
Discharge (cfs)
7,390
1,420
c500
5,680
4,060
-
Water year
1959
1960
1961
1962
1963
Date
Mar. 21, 1959
Mar. 24, 1960
July 10, 1961
May 29, 1962
May 30, 1963
Gage height (feet)
16.17
a!4.62
8.17
10.39
11.76
D'scharge (cfs)
4,600
3,800
371
1,070
1,980
a Backwater from ice.b Occurred on preceding day.c About.
3457. Government Creek near Richardton, N. Dak.
Location.--Lat 46°48', long 102°18', in NE^NE^ sec.5, T.138 N., R.92 W., at bridge on county highway, 5.4 miles south of Richardton.
Drainage area.--33.4 sq mi.
. orest stage gage.
Stage-discharge relation.--Defined by current-meter measurement below 280 cfs and extended above on basis of contracted-opening measurement at 4,300 cfs.
Remarks.--Only annual peaks are shown.
Peak stages and discharges
Water year
1950
1955
1956 1957 1958
Date
Apr. 16, 1950
Mar. 11, 1955
March 1956 June 22, 1957 Mar. 25, 1958
Gage height (feet)
15.05
a5.44
a7.26 5.84 5.93
Discharge (cfs)
4,300
50
400 184 203
Water year
1959 1S60
1961 1962 1963 1964
Date
Mar. 18, 1959 March 1960
June 1962 May 31, 1963 June 18, 1964
Gage height (feet)
7.90 4.88
a4.76 all. 77
6.23
D'.scharge (cfs)
755 50
0 20
1,500 273
a Backwater from ice, snow, or vegetation.
3465. Heart River below Heart Butte Dam, near Glen Ullin, N. Dak. (Published as "near Glen Ullin" prior to Oct. 1, 1949)
Location.--Lat 46°35'50", long 101°48'05", in NE^ sec.13, T.136 N., R.89 W., on right bank 0.5 mile downstream from Heart Butte Dam, 10 miles upstream from
Heart Butte Creek, 14 miles south of Glen Ullin, and 14 miles north of Elgin.
Drainage area.--1,710 sq mi, approximately.
Gage.--Nonrecording prior to Aug. 24, 1943; recording thereafter, except for the water years 1945-47, when the recorder was not functioning at the time of the
maximum discharge. At site 4 miles upstream at different datum prior to June 1, 1947. Datum of gage is 1,998.87 ft above mean sea level, datum of 1929 (levels by Corps of Engineers).
Stage-discharge relation.--At upstream site, defined by current-meter measure- merits below 7,800 cfs and extended on basis of float measurement at 18,000
cfs and slope-area measurement at 20,000 cfs. At lower site in 1947, defined by current-meter measurements below 3,700 cfs and extended above on basis of later measurements and ratings. After 1947, at lower site defined by current-meter measurements below 6,900 cfs.
Historical data.--Flood of Mar. 24, 1947, is the highest known since at least 1904.
Remarks.--Flow regulated by Heart Butte Reservoir (usable capacity, 421,250 acre-ft) since Sept. 29, 1949. Only annual peaks are shown.
219-848 O - 66 - 23

334 HEART RIVER BASIN
Peak stages and discharges of Heart River below Heart Butte Dam, near Glen Ullin, N. Dak.
Water year
1943 1944 1945
1946 1947 1948 1949
Date
Mar. 25, 1943 Apr. 1, 1944 Mar. 14, 1945
Mar. 3, 1946 Mar. 24, 1947Mar. 19, 1948 Mar. 28, 1949
Gage height (feet)
18.77 13.2615.45
a21.5bll.48 blO.78
Discharge (ofs)
20,000 7,280
11,500
(a)25,000c9,900 7,300
Water year
1950
19511952 1953 1954 1955
Date
Apr. 17, 1950 Apr. 19, 1950
Mar. 29, 1951 Apr. 9, 1952 June 16, 1953 Apr. 10, 1954 July 14, 1955
Gage height (feet)
b7.55 6.92
6.42 6.99 3.18 6.08 2.14
Discharge (ofs)
3,840
3,4404,100
699 3,270
176a Probably less than 1,000 cfs.b Backwater from ice.c Release of water when ice Jam broke.
3470. Antelope Creek near Carson, N. Dak.
Location.--Lat 46°32', long 101°38', in NW^NE^ sec.8, T.135 N., R.87 W., on right bank 8 ft upstream from county highway bridge, 4 miles upstream from mouth, and 8 miles northwest of Carson.
Drainage area. 221 sq mi.
Gage.--Monrecording at site 800 ft downstream prior to May 23, 1958; recording thereafter. Altitude of gage is 1,974 ft (by barometer).
Stage-discharge relation. Defined by current-meter measurements below 1,500 cfs and extended on basis of slope-area measurement at 11,100 cfs; subject to changes owing to channel shifting and ice effect.
Bankfull stage. 15 ft.
Historical data.--The flood of Mar. 25, 1943, is the highest known prior to 1950.
Remarks.--Base for partial-duration series, 200 cfs. Only annual peaks prior £o~0~ct. 1, 1950.
Peak stages and discharges
Water year
1943
19491950
1951
1952
1953
1954
1955
1956
Date
Mar. 25, 1943
Mar. 28, 1949Apr. 16, 1950
Mar. 27, 1951
Apr. 3, 1952June 29, 1952Aug. 26, 1952Aug. 30, 1952
June 16, 1953
Apr. 7, 1954
June 2, 1955July 2S, 1955
Mar. 20, 1956
Gage height (feet)
17.1
a!3.8417.95
a!5.5
a!5.7b8.5
bll15.05
13.06
5.90
7.507.15
a!2.03
Discharge (cfs)
_
1,30011,100
2,900
3,280b500b9003,300
1,540
252
377365
-
Water year
1956
1957
1958
1959
1960
1961
1962
1963
Date
Mar. 20, 1956
June 23, 1957
June 11, 1958
Mar. 14, 1959
Mar. 21, 1960June 10, 1960
June 14, 1961
May 23, 1962May 30, 1962
June 15, 1963July 27, 1963July 31, 1963
Gage height (feet)
all . 50
8.44
6.47
10.11
all. 507.00
a9.32
8.279.77
7.457.519.56
Discharge (cfs)
870
480
213
250
725271
531
450621
344340593
a Backwater from ice. b About.

HEART RIVER BASIN 335
3475. Muddy Creek near Almont, N. Dak.
Location. Lat 46°42', long 101°28', in SW£ sec.7, T.137 N., R.85 W., on right bank 450 ft downstream from county highway bridge, 2 miles downstream from Hailstone Creek, 3 miles southeast of Almont, and 12 miles upstream from mouth.
Drainage area. 456 sq mi.
Gage. Nonrecording prior to Sept. 5, 1952; recording thereafter. Altitude of gage is 1,864 ft (by barometer).
Stage-discharge relation. Defined by current-meter measurements below 3,100 cfs and extended above on basis of slope-area measurement at 20,200 cfs.
Bankfull stage.--22 ft.
Historical data.--Flood of Apr. 17, 1950, is the highest known since at least 1895.Flood of June 26, 1914, and the spring flood of 1943 were about 4 ft lower than the 1950 flood, from information obtained from local residents.
Remarks.--Base for partial-duration series, 200 cfs.
Peak stages and discharges
Water year
1946
1947
1948
1949
1950
1951
1952
1953
Date
Mar. 3, 1946June 30, 1946
Feb. 18, 1947Mar. 23, 1947Apr. 12, 1947Apr. 18, 1947June 23, 1947
Mar. 24, 1948Mar. 29, 1948Apr. 5, 194SJuly 14, 1948
Apr. 1, 1949May 29, 1949
Mar. 26, 1950Apr. 9, 1950Apr. 17, 1950May 12, 1950June 9, 1950
Mar. 30, 1951Apr. 5, 1951
Apr. 8, 1952June 29, 1952Aug. 31, 1952
Mar. 18, 1953May 2, 1953June 4, 1953June 17, 1953
Qage height (feet)
a!2.89.08
a!2a!7.17all.O
6.9512.9
a!9.20a!3.9612.07.70
15.418.50
alO.62all. 2530.712.048.47
a!9.519.0
21.8616.214.0
alO.287.867.58
12.60
Discharge (cfs)
750405
4001,600
410206
1,020
2,2501,180
992337
1,400330
_250
20,200780263
1,8002,050
3,3501,7001,200
360218205836
Water year
1953
1954
1955
1956
1957
1958
1959
1960
1961
1962
1963
Date
June 21, 1953Sept. 3, 1953
Feb. 5, 1954Mar. 20, 1954Apr. 6, 1954
Mar. 12, 1955June 2, 1955July 9, 1955
Mar. 21, 1956Mar. 27, 1956June 30, 1956
June 24, 1957
Mar. 28, 1958June 3 , 1958July 25, 1958
Mar. 24, 1959
Mar. 27, 1960June 10, 1960
Mar. 23, 1961
Mar. 22, 1962May 23, 1962May 31, 1962July 7, 1962
July 26, 1963
Gage height (feet)
9.387.96
8.578.93
14.07
all. 6812.497.59
a!8.8712.1512.98
7.18
a!3 . 027.847.72
14.19
17.9716.76
a3.66
a8.1610.0016.3111.35
-
Discharge (cfs)
396242
301312
1,170
560864239
2,190790956
205
810275266
1,230
2,0501,760
8.4
265490
1,660692
630
a Backwater from ice.

336 HEART RIVER BASIN
3480. Heart River near Lark, N. Dak.
Location. Lat 46°36'37", long 101°22'45", in NW£tJW£sw£ sec.9, T.136 N., R 85 W on right bank 20 ft downstream from bridge on State Highway 31, 1 mile down stream from Muddy Creek, and 10 miles north of Lark.
Drainage area.--2.750 sq ml, approximately.
Gage. Nonrecordlng prior to Nov. 16, 1948; recording thereafter. Datum of gage is 1,802.83 ft above mean sea level, datum of 1929 (levels bv Corns of Engineers}. *
Stage-discharge relation. Defined by current-meter measurements below 11,000 cfs and extended above on basis of contracted-opening measurement at{jJf£\)(j CIS*
Remarks.--Peak flows materially affected by regulation of Lake Tschida since storage began Sept. 29, 1949. Only annual peaks are shown.
__ Peak stages and discharges
Water year
1947194819491950
19511952195319541955
1956
Date
Mar. 25, 1947Mar. 24, 1948Mar. 29, 1949Apr. 17, 1950
Mar. 26, 1951Apr. 7, 1952June 15, 1953Apr. 10, 1954Mar. 12, 1955
Mar. 20, 1956
Gage height (feet)
a!5.85a!3.9914.7220.70
a!4.915.6211.539.60
a9.23
a!6.27
Discharge (cfs)
10,4007,5009,810
29,200
b9,00011,8005,4403,5001,110
b!2,000
Water year
195719581959
1960
196119621963
Date
June 27, 1957Mar. 27, 1958Mar. 19, 1959Mar. 24, 1959Mar. 22, 1960Mar. 26, 1960
June 15, 1961June 15, 1962July 26, 1963
Gage height (feet)
6.98a9.78a!3.5
alO.66
4.828.967.32
Discharge (cfs)
1,3401,220
3,800_
3,600
3982,7301,540
a Backwater from ice. b About.
3485. Sweetbriar Creek near Judson, N. Dak.
Location.--Lat 46°51', long 101"15', In SW^ sec.14, T.139 N. , R.84 W., on right bank 80 ft downstream from bridge on U.S. Highway 10, two miles northeast of Judson, and 16 miles upstream from mouth.
Drainage area. 157 sq mi.
Gage. Nonrecording prior to July 20, 1955; recording thereafter. Altitude of gage is 1,886 ft (by barometer).
Stage-discharge relation.--Defined by current-meter measurements below 2,000 cfs and extended above on basis of contracted-opening measurement at 5,910 cfs.
Bankfull stage.--10 ft.
Remarks.--Base for partial-duration series, 200 cfs.
Peak stages and discharges
Water year
1950
1952
1953
1954
1955
1956
Date
Apr. 17, 1950
Apr. 7, 1952June 29, 1952
June 16, 1953
Feb. 4, 1954Mar. 19, 1954Apr. 5, 1954
Mar. 11, 1955June 2, 1955
Mar. 21, 1956
Gage height (feet)
12.5
9.554.45
8.48
as. 2a5. 87.8
a5.2811.11
a8.10
Discharge (cfs)
5,910
2,300254
1,450
300440
1,100
2403,400
1,300
Water year
1956
1957
1958
1959
1960
1961
1962
Date
Mar. 26, 1956June 22, 1956
July 17, 1957
Mar. 27, 1958
Mar. 23, 1959
Mar. 27, 1960June 7, 1960
Mar. 4, 1961
May 23, 1962
Gage t eight (feet)
6.305.08
6.19
7.75
7.17
a9.116.79
3.52
4.66
Discharge (cfs)
580349
709
990
866
bl,600946
59
295a Backwater from ice. b About.

HEART RIVER BASIN 337
Peak stages and discharges of Sweetbriar Creek near Judson, N. Dak. Continued
Water year
1962
1963
Date
Hay 30, 1962 July 6, 1962
July 26, 1963
Gage height (feet)
7.01 5.41
5.58
Discharge (cfs)
1,130 541
514
Water year
1963
Date
July 29, 1963 Aug. 1, 1963 Aug. 8, 1963
Gage height (feet)
4.96 5.73 5.51
Discharge (cfs)
325 566 491
3490. Heart River near Mandan, N. Dak.
Location. Lat 46°50'02", long 100°58'27", in NW^NEi sec. 25, T.139 N. , R.82 W. on left bank near downstream wingwall bridge on U.S. Highway 10, 3 miles west of Mandan and 4 miles downstream from Sweetbriar Creek.
Drainage area. --3, 310 sq mi, approximately.
Ga t . Nonrecording prior to Sept. 13, 1948; recording thereafter. On old ighway bridge near present site at datum 2.79 ft lower in 1924, and at
present datum March 1928 to Mar. 27, 1943; on Northern Pacific Railway bridge 300 ft upstream and at present datum Apr. 9, 1943, to Mar. 16, 1948. Datum of gage is 1,638.70 ft above mean sea level, datum of 1929. Gage heights given herein converted to present site and datum.
Stage-discharge relation.--Defined by current-meter measurements.
Bankfall stage. 18 ft.
Remarks.--Plow regulated by Heart Butte Reservoir (usable capacity, 421,250 acre-ft) since Sept. 29, 1949. Only annual peaks are shown.
Peak stages and discharges
Water year
1924
1929
1930
193119321933
19381939 19401941
1942194319441945
19461947
Date
Apr. 7, 1924June 19, 1924
Mar. 20, 1929June 3, 1929Mar.17A8.1930
June 30, 1931Feb. 28, 1932Mar. 3, 1933Mar. 19, 1933
July 7, 1938Mar. 23, 1939 May 2, 1940Mar. 27, 1941June 11, 1941June 10, 1942Mar. 27, 1943Apr. 4, 1944Mar. 14, 1945
Mar. 3, 1946Mar. 27, 1947
Qage height (feet)
_10.86
all. 8-
a20. 40
5.7011.55
a!7.6-
16.9ac23.4
11.07a!6.72
-11.924.7a22.75
ac22.3
13.9922.16
Discharge (cfs)
3,300-
-2,750(b)
2093,400
-2,5307,320
10,600 3,700
_7,4803,35021,400
d!2,00014,800
(b)(b)
Water year
1948
19491950
1951
1952195319541955
1956 1957195819591960
1961
19621963
Date
Mar. 21, 1948Mar. 23, 1948Mar. 29, 1949Apr. 19, 1950
Mar. 28, 1951Apr. 3, 1951Apr. 4, 1952June 16, 1953Apr. 10, 1954Mar. 13, 1955June 2, 1955
Mar. 21, 1956 June 28, 1957Mar. 27, 1958Mar. 25, 1959Mar. 27, 1960
Mar. 3, 1961June 17, 1961June 1, 1962July 28, 1963Aug. 2, 1963
Qage height (feet)
a23.3122.02
a21.9523.64
a24.35-
a25.7511.359.52
a9.36
ae21.6 7.78
a!2.08all. 28ac!9.50
a6.17-
9.987.21-
D'.s charge (cfs)
-16,100
die, ooo30,500
-d!4,000d30,000
6,2003,720-
1,350
d!2,000 1,3802,5004,1004,700
-170
2,480915915
a Backwater from ice.b Not determined.c Occurred on previous day.d Release of water when ice jam broke.e Occurred on following day.
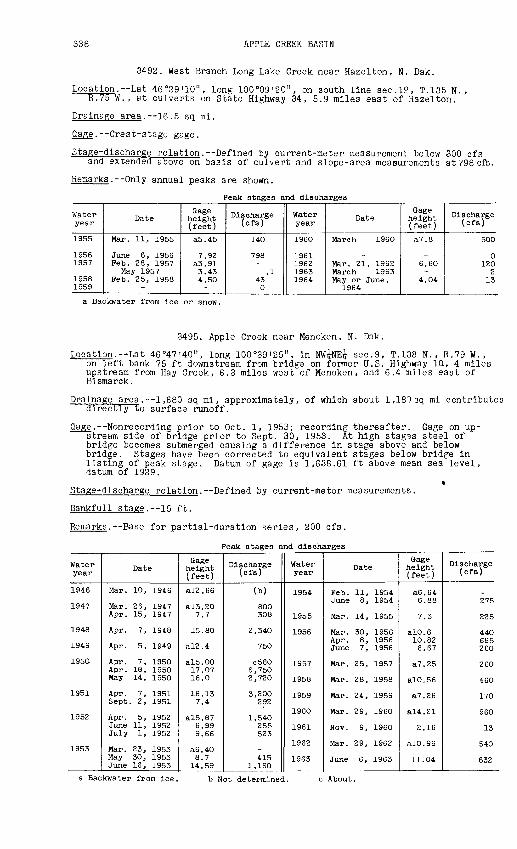
338 APPLE CREEK BASIN
3492. West Branch Long Lake Creek near Hazelton, N. Dak.
Location. Lat 46°29'10", long 100°09'20", on south line sec.IP, T.135 N. , R.75 W. , at culverts on State Highway 34, 5.9 miles east of Hazelton.
Drainage area.--16.5 sq ml.
Gage.--Crest-stage gage.
Stage-discharge relation.--Defined by current-meter measurement below 300 cfs and extended above on basis of culvert and slope-area measurements at 798 cfs.
Remarks.--Only annual peaks are shown.
Peak stages and discharges
Water year
1955
19561957
19581959
Date
Mar. 11, 1955
June 6, 1956Feb. 28, 1957
May 1957Feb. 25, 1958
-
Gage height (feet)
a5.45
7.92a3.913.434.50-
Discharge (cfs)
140
798-
.1430
Water year
1960
1961196219631964
Date
March 1960
_Mar. 21, 1962March 1963May or June ,
1964
Gage height (feet)
a7.8
_6.60-
4.04
Discharge (cfs)
500
0120
213
a Backwater from Ice or snow.
3495. Apple Creek near Menoken, N. Dak.
Location.--Lat 46°47'40", long 100°39'25", in NW^NE^- sec.9, T.138 N., R.79 W., on left bank 75 ft downstream from bridge on former U.S. Highway 1Q, 4 miles upstream from Hay Creek, 6.3 miles west of Menoken, and 6.4 miles east of Bismarck.
Drainage area. 1,680 sq ml, approximately, of which about l.lSOsq ml contributes directly to surface runoff.
Gage. Nonrecordlng prior to Oct. 1, 1953; recording thereafter. Gage on up stream side of bridge prior to Sept. 30, 1953. At high stages steel of bridge becomes submerged causing a difference in stage above and below bridge. Stages have been corrected to equivalent stages below bridge in listing of peak stage. Datum of gage is 1,638.61 ft above mean sea level, datum of 1929.
Stage-discharge relation. Defined by current-meter measurements.
Bankfull stage.--15 ft.
Remarks. Base for partial-duration series, 200 cfs.
Peak stages and discharges
Water year
1946
1947
1948
1949
1950
1951
1952
1953
Date
Mar. 10, 1946
Mar. 26, 1947Apr. 15, 1947
Apr. 7, 1948
Apr. 5, 1949
Apr. 7, 1950Apr. 18, 1950May 14, 1950
Apr. 7, 1951Sept. 2, 1951
Apr. 5, 1952June 11, 1952July 1, 1952
Mar. 23, 1953May 30, 1953June 16, 1953
Gage height (feet)
a!2.66
a!3.207.7
15.80
a!2.4
alS.OO17.0716.0
16.137.4
a!5.876.999.66
a6.408.714.59
Discharge (cfs)
(b)
800308
2,340
750
C5606,7502,720
3,200292
1,540255523
-415
1,160
Water year
1954
1955
1956
1957
1958
1959
1960
1961
1962
1963
Date
Feb. 11, 1954June 8, 1954
Mar. 14, 1955
Mar. 30, 1956Apr. 8, 1956 June 7, 1956
Mar. 25, 1957
Mar. 28, 1958
Mar. 24, 1959
Mar. 29, 1960
Nov. 9, 1960
Mar. 29, 1962
June 6, 1963
Gage height (feet)
a6.646.88
7.3
alO.610.82 6.67
a7.25
alO.56
a7.26
a!4.21
2.16
alO.96
11.04
Discharge (cfs)
_275
225
440665 260
260
460
170
960
13
540
632
a Backwater from ice. b Not determined.
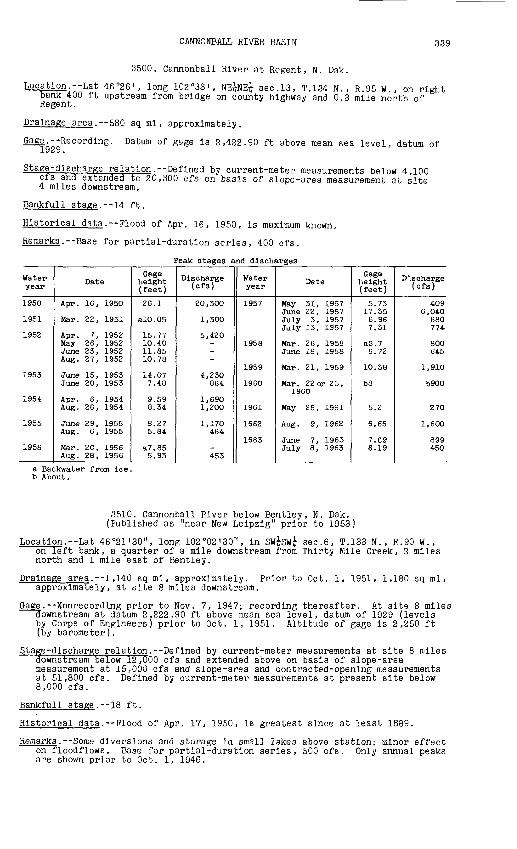
CANNONBALL RIVER BASIN 339
3500. Cannonball River at Regent, N. Dak.
Location. Lat 46°26', long 102 °33', NE^NE^ sec. 13, T.134 N. , R.95 W., on right bank 400 ft upstream from bridge on county highway and 0.3 mile north of Regent.
Drainage area.--580 sq ml, approximately.
Gage.--RecordIng. Datum of gage Is 2,422.90 ft above mean sea level, datum of -Ly^j y.
Stage-discharge relation.--Defined by current-meter measurements below 4,100 crs and extended to 20,300 cfs on basis of slope-area measurement at site 4 miles downstream.
Bankfull stage.--14 ft.
Historical data.--Flood of Apr. 16, 1950, Is maximum known.
Remarks.--Base for partial-duration series, 400 cfs.
Peak stages and discharges
Water year
1950
1951
1952
1953
1954
1955
1956
Date
Apr. 16, 1950
Mar. 22, 1951
Apr. 7, 1952May 26, 1952June 23, 1952Aug. 27, 1952
June 15, 1953June 20, 1953
Apr. 6, 1954Aug. 26, 1954
June 29, 1955Aug. 6, 1955
Mar. 20, 1956Aug. 28, 1956
Gage height (feet)
26.1
alO.05
15.7710.4011.8510.78
14.077.48
9.598.34
8.275.84
a7.855.93
Discharge (cfs)
20,300
1,300
5,420---
4,230864
1,6901,200
1,170464
-453
Water year
1957
1958
1959
1960
1961
1962
1963
Date
May 31, 1957June 22, 1957July 3, 1957July 13, 1957
Mar. 26, 1958June 16, 1958
Mar. 21, 1959
Mar. 22 or 25,1960
May 26, 1961
Aug. 9, 1962
June 7, 1963July 8, 1963
Gage height (feet)
5.7317.356.967.31
as. 76.72
10.38
b8
5.2
9.65
7.696.19
D'. s charge (cfs)
4096,040
680774
800645
1,910
b900
270
1,600
899450
a Backwater from ice. b About.
3510. Cannonball River below Bentley, N. Dak. (Published as "near New Leipzig" prior to 1953)
Location.--Lat 46°21'30", long 102°02'30", In SW£-SW£ sec.6, T.133 N., R.90 W., on left bank, a quarter of a mile downstream from Thirty Mile Creek, 2 miles north and 1 mile east of Bentley.
Drainage area.--1,140 sq ml, approximately. Prior to Oct. 1, 1951, 1,180 sq ml, approximately, at site 8 miles downstream.
Gage. Nonrecordlng prior to Nov. 7, 1947; recording thereafter. At site 8 miles downstream at datum 2,222.90 ft above mean sea level, datum of 1929 (levels by Corps of Engineers) prior to Oct. 1, 1951. Altitude of gage Is 2,250 ft (by barometer).
Stage-discharge relation. Defined by current-meter measurements at site 8 miles downstream below 12,000 cfs and extended above on basis of slope-area measurement at 15,000 cfs and slope-area and contracted-opening measurements at 51,800 cfs. Defined by current-meter measurements at present site below 8,000 cfs.
Bankfull stage.--18 ft.
Historical data.--Flood of Apr. 17, 1950, Is greatest since at least 1889.
Remarks. Some diversions and storage in small lakes above station; minor effect on floodflows. Base for partial-duration series, 500 cfs. Only annual peaks are shown prior to Oct. 1, 1946.

340 CANNONBALL RIVER BASIN
Peak stages and discharges of Cannonball River below Bentley, H. Dak.
Water year
194319441945
1946
1947
1948
1949
1950
1951
1952
1953
Date
Mar. 25, 1943Apr. 7, 1944Mar. 14, 1945
July 4, 1946
Feb. 17, 1947Mar. 24, 1947Apr. 12, 1947June 23, 1947
Mar. 1, 1948Mar. 16, 1948Mar. 20, 1948
Mar. 9, 1949Mar. 28, 1949Mar. 30, 1949Aug. 21, 1949
Mar". 27, 1950Apr. 17, 1950May 12, 1950June 8, 1950
Feb. 26, 1951Mar. 25, 1951
Apr. 7, 1952June 25, 1952June 28, 1952
June 3, 1953June 17, 1953
Gage height (feet)
26.919.116.70
6.70
a!3.920.5012.714.9
a8.52a!7.21a!2.16
a8.15a!8.317.410.10
alO.6334.08.728.20
a9.2418.99
19.816.907.22
5.8415.05
Discharge (cfs)
15,0006,6004,370
231
1,0708,0002,2803,390
-2,5001,900
--
5,3501,250
-51,800
655538
b6006,320
7,930763851
5034,300
Water year
1953
1954
1955
1956
1957
1958
1959
1960
1961
1962
1963
Date
June 22, 1953
Apr. 7, 1954Apr. 8, 1954Aug. 28, 1954
Mar. 12, 1955June 30, 1955
Mar. 6, 1956Mar. 20, 1956
June 24, 1957July 4, 1957July 14, 1957
Mar. 27, 1958June 4, 1958June 10, 1958June 17, 1958
Mar. 20, 1959
Mar. 23, 1960
Aug. 2, 1961
May 22, 1962May 29, 1962June 16, 1962Aug. 10, 1962
June 8, 1963July 26, 1963
Gage 1- eight (feet)
7.47
ell. 1110.906.72
6.167.48
9.5012.29
18.806.896.16
a!2 . 507.037.687.35
12.58
all. 64
6.82
7.2110.376.787.21
7.037.65
Discharge (cfs)
922
-2,250
717
_905
900bl,400
6,550747567
1,800670839766
2,910
b2,000
b!60
6671,840
530667
613789
a Backwater from ice. b About.
3520. Cedar Creek near Haynes, N. Dak.
Location.--Lat 46°09', long 102°28', In Wf sec.20, T.131 N., R.94 W., on left bank 30 ft downstream from new bridge on State Highway 8 and 12^ miles north of Haynes.
Drainage area. 553 sq mi.
Gage.--Nonrecording on former bridge 400 ft upstream, at same datum prior to May 20, 1951; recording thereafter. Altitude of gage is 2,470 ft (by barometer).
Stage-discharge relation. Defined by current-meter measurements below 7,200 cfs and extended above on basis of slope-area measurement at 26,900 cfs at site 9 miles upstream.
Bankfull stage.--14 ft.
Remarks. Maximum discharge of 1950 determined at site 9 miles upstream and converted to station site on basis of a drainage-area relation. Base for partial-duration series, 400 cfs.
Peak stages and discharges
Water year
1950
1951
1952
1953
1954
Date
Apr. 16, 1950
Mar. 27, 1951
Apr. 7, 1952
May 29, 1953June 16, 1953June 21, 1953
Apr. 9, 1954Aug. 26, 1954
Gage height (feet)
a23
b!4.2
21.25
15.1916.8415.19
11.0412.61
Discharge (cfs)
27,400
1,000
7,870
1,4802,1401,480
696946
Water year
1955
1956
1957
1958
Date
July 29, 1955
Mar. 18, 1956
June 25, 1957July 26, 1957
June 5, 1958June 10, 1958June 16, 1958June 18, 1958
Gage t eight (feet)
9.40
b9.60
17.3012.29
11.411.615.1013.09
Discharge (cfs)
435
350
2,390859
750780
1,4501,020
a About.b Backwater from ice.

CANNONBALL RIVER BASIN 341
Peak stages and discharges of Cedar Creek near Haynes, N. Dak. Continued
Water year
1959
1960
1961
Date
Mar. 20, 1959
Mar. 25, 1960 Mar. 26, 1960
June 14, 1961
Gage height (feet)
13.07
b8.30 b7.12
5.78
Discharge (ofs)
900
200
116
Water year
1962
1963
Date
Aug. 12, 1962
June 9, 1963
Gage height (feet)
7.53
7.90
D'.soharge (ofs)
255
308
b Backwater from ice.
3525. Cedar Creek near Pretty Rock, N. Dak.
Location. Lat 46°02', long 101°49', in S^ sec.33, T.130 N., R.89 W., on left bank on downstream side of county highway bridge, 7 miles north of Keldron, S. Dak., lO^r miles south of abandoned town site of Pretty Rock, and 15 miles downstream from Timber Creek.
Drainage area.--1,340 sq mi, approximately.
Gage.--Nonrecording prior to Oct. 17, 1947; recording thereafter. Daturr of is 2,155.17 ft above mean sea level (levels by Corps of Engineers).
Stage-discharge relation. Defined by current-meter measurements below 7,800 cfs and extended above on basis of slope-area measurement at 48,000 cfs.
Bankfull stage.--16 ft.
Remarks. Some small diversions for irrigation upstream from gage do not materi- ally affect peak flows. Base for partial-duration series, 500 cfs. Only annual peaks are shown prior to Oct. 1, 1945.
Peak stages and discharges
Water year
194319441945
1946
1947
1948
1949
1950
1951
1952
1953
Date
Mar. 24, 1943Apr. 10, 1944Mar. 15, 1945
June 24, 1946
Feb. 17, 1947Feb. 21, 1947Mar. 24, 1947Apr. 3, 1947Apr. 14, 1947June 23, 1947
Mar. 15, 1948Mar. 20, 1948
Mar. 8, 1949Apr. 2, 1949
Apr. 17, 1950June 8, 1950
Mar. 26, 1951June 6, 1951
Apr. 4, 1952Apr. 9, 1952
May 29, 1953
Gage height (feet)21.814.9
a!2,71
4.95
alO.78a9.15
a!7.50a5.859.12
12.7
a!4.00a!2.76
alO.60alS.O
26.55.98
a20.897.5
a20.9119.31
11 . 1CL
Discharge (ofs)
14,3004,4501,700
349
1,040533
3,300564
1,7603,280
2,0001,930
9803,800
48,000657
7,6001,160
-9,720
2,440
Water year
1953
1954
1955
1956
1957
1958
1959
196019611962
1963
Date
May 31, 1953June 3, 1953June 18, 1953June 22, 1953
Apr. 11, 1954Aug. 30, 1954
June 30, 1955
Mar. 20, 1956
June 27, 1957July 28, 1957
June 7, 1958June 12, 1958June 18, 1958June 20, 1958
Mar. 23, 1959
Mar. 28, 1960
June 14, 1961May 23, 1962May 29, 1962
June 27, 1963
Gage height (feet)
7.889.62
10.3410.77
5.755.75
4.25
alO.79
9.425.86
5.445.716.976.63
a9.67
5.03
3.425.7210.18
4.13
Discharge (ofs)
1,2901,8302,0502,270
588588
221
1,400
1,790621
513593995883
1,240
324
57608
2,180
143a Backwater from ice.
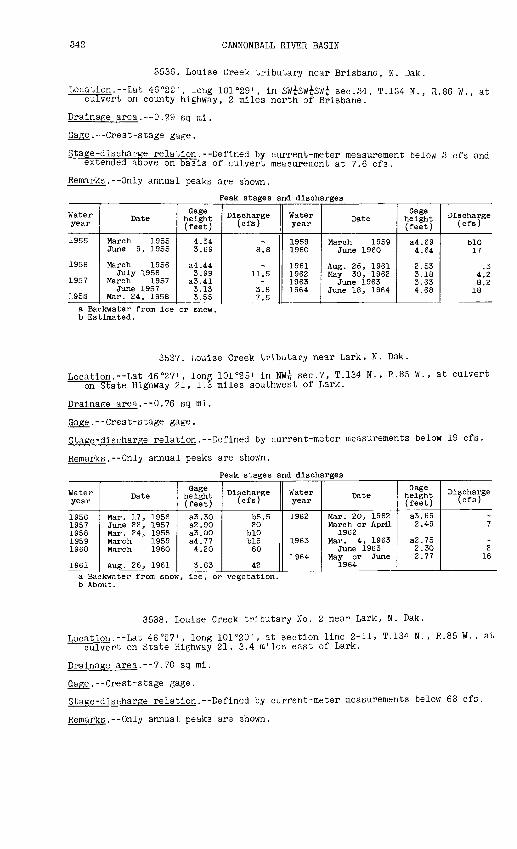
342 CANNONBALL RIVER BASIN
3536. Louise Creek tributary near Brisbane, N. Dak.
Location.--Lat 46°22', long 101°29', in SW£sw£sw£ sec.34, T.134 N., R.86 W., at culvert on county highway, 2 miles north of Brisbane.
Drainage area. 0.29 sq mi.
Gage. Crest-stage gage.
Stage-discharge relation.--Defined by current-meter measurement below 3 cfs and extended above on basis of culvert measurement at 7.6 cfs.
Remarks.--Only annual peaks are shown.
Peak stages and discharges
Water year
1955
1956
1957
195S
Date
March 1955June 9, 1955
March 1956July 1956
March 1957June 1957
Mar. 24, 1958
Gage height (feet)
4.343.69
a4.443.99
a3.413.133.55
Discharge (cfs)
_8.8
_11.5
_3.87.5
Water year
19591960
1961196219631964
Date
March 1959June 1960
Aug. 26, 1961May 30, 1962
June 1963June 18, 1964
Gage height (feet)
a4.694.64
2.533.183.634.68
Discharge (cfs)
blO17
.34.28.2
18
a Backwater from Ice or snow, b Estimated.
3537. Louise Creek tributary near Lark, N. Dak.
Location.--Lat 46°27', long 101°25' in NW£ sec.7, T.134 N., R.85 W., at culvert on State Highway 21, 1.3 miles southwest of Lark.
Drainage area. 0.76 sq mi.
Gage.--Crest-stage gage.
Stage-discharge relation.--Defined by current-meter measurements below 19 cfs.
Remarks. Only annual peaks are shown.
Peak stages and discharges
Water year
19561957195819591960
1961
Date
Mar. 17, 1956June 22, 1957Mar. 24, 1958March 1959March 1960
Aug. 26, 1961
Gage height (feet)
a3.30a2.90a3.00a4.774.20
3.63
Discharge (cfs)
b5.520
blOb!560
42
Water year
1962
1963
1964
Date
Mar. 20, 1962March or April
1962Mar. 4, 1963
June 1963May or June
1964
Gage height ( feet )
a3.692.49
a2.752.302.77
Discharge (cfs)
-7
-2
16
a Backwater from snow, ice, or vegetation. b About.
3538. Louise Creek tributary No. 2 near Lark, N. Dak.
Location.--Lat 46°27', long 101°20', at section line 2-11, T.13* N., R.85W., at culvert on State Highway 21, 3.4 miles east of Lark.
Drainage area. 7.70 sq mi.
Gage.--Crest-stage gage.
Stage-discharge relation.--Defined by current-meter measurements below 63 cfs.
Remarks. Only annual peaks are shown.

CANNONBALL RIVER BASIN 343
Peak stages and discharges of Louise Creek tributary No. 2 near Lark, N. Dik.
Water year
1956 1957 1958 1959 1960
Date
March 1956 June 1957
April 1958 Mar. 25-24,1959 March 1960
Gage height (feet)
1.84 1.26 1.22 1.21 5.50
Discharge (cfs)
108 10.5 8.0 7.5
Water year
1961 1962
1965 1964
Date
May or June 1962
July 51, 1965 July 1964
Gage height (feet)
2.07
1.44 1.28
Discharge (cfs)
0 165
2912
3539. Louise Creek above Flasher, N. Dak.
Location. Lat 46°27', long 101 °15', in SW^NE^- sec.4, T.134 N., R.84 W. , at bridge on Northern Pacific Railway, 0.7 mile west of Flasher.
Drainage area.--110 sq mi.
Gage. Crest-stage gage.
Stage-discharge relation. Defined by current-meter measurements below 770 cfs.
Remarks.--Only annual peaks are shown.
Peak stages and discharges
Water year
1955
195619571958
Date
Mar. 11, 1955
Mar. 50, 1956June 23, 1957Mar. 26, 1958March 1959
Gage height (feet)
3.49
10.40a5.406.614.46
Discharge (cfs)
45
94627
26689
Water year
1960
1961196219651964
Date
Mar. 21, 1960
June 14, 1962June 25, 1965June 10, 1964
Gage height (feet)
a9.55
5.96a5.5a7.57
Discharge (cfs)
600
40580
a Backwater due to ice or vegetation.
3540. Cannonball River at Breien, N. Dak. (Published as "at or near Stevenson" prior to 1928 and as
"near Timmer" 1928-34)
Location.--Lat 46°23', long 100°56', in sec.36, T.134 N., R.82 W., on right bank 600 ft upstream from bridge on State Highway 6, 950 ft downstream frou Louise Creek, and 0.5 mile south of Breien.
Drainage area.--4.1QQ sq mi, approximately. At site used prior to 1935, 3,670 sq mi, approximately.
_.--Nonrecording 1906-08, 1916-18, 1922, 1924, 1928-34, at site 7| miles upstream at altitude 1,710 ft. Nonrecording 1912-1915 at site 8f miles up stream; gage read about 10 ft higher than gage 1 mile downstream. Gage heights prior to 1935 given herein converted to site and datum used prior to 1912 and 1916-34. Recording at present site since 1935. Datum of gage is 1,676.54 ft above mean sea level, datum of 1929.
Stage-discharge relation.--Prior to 1935, defined by current-meter measurements below 3,900 cfs and extended to 11,000 cfs on basis of slope-area and con tracted-opening measurements at 94,800 cfs. Subsequent to 1934, defined by current-meter measurements below 20,000 cfs and extended above on basis of slope-area and contracted-opening measurement at 94,800 cfs.
Bankfull stage. 11 ft.
Historical data.--Flood of Apr. 19, 1950, is the greatest known since at least 1900.
Remarks. Some diversions and storage in several small lakes above station. Discharges given herein converted to present site by a drainage-area relationship. Base for partial-duration series, 2,000 cfs. Only annual peaks prior to Oct. 1, 1934.
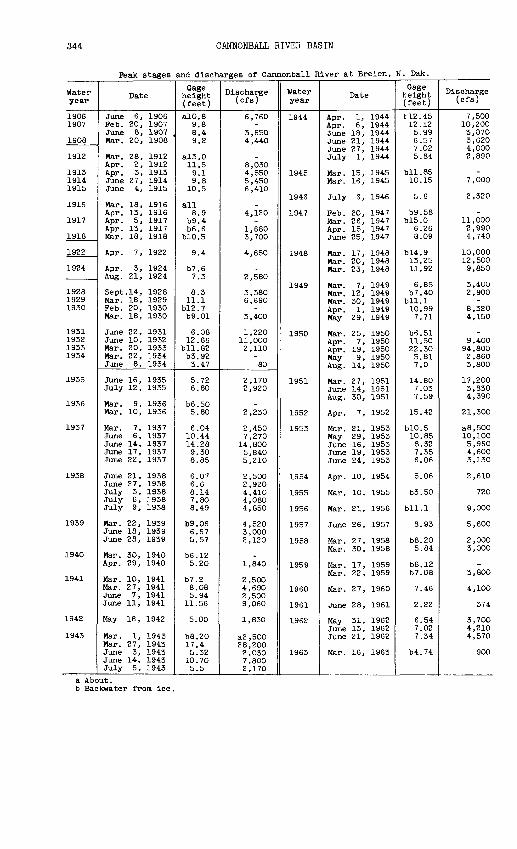
344 CANNONBALL RIVER BASIN
Peak stages and discharges of Cannonball River at Breien, N. Dak.
Water year
19061907
1908
1912
191319141915
1916
1917
1918
1922
1924
192819291930
1931193219331934
1935
1936
1937
1938
1939
1940
1941
1942
1943
Date
June 6, 1906Feb. 20, 1907June 8, 1907 ,Mar. 20, 1908
Mar. 28, 1912Apr. 2, 1912Apr. 3, 1913June 27, 1914June 4, 1915
Mar. 18, 1916Apr. 13, 1916Apr. 5, 1917Apr. 13, 1917Mar. 18, 1918
Apr. 7, 1922
Apr. 3, 1924Aug. 21, 1924
Sept. 14, 1928Mar. 18, 1929Feb. 20, 1930Mar. 18, 1930
June 22, 1931June 10, 1932Mar. 20, 1933Mar. 22, 1934June 8, 1934
June 16, 1935July 12, 1935
Mar. 9, 1936Mar. 10, 1936
Mar. 7, 1937June 6, 1937June 14, 1937June 17, 1937June 22, 1937
June 21, 1938June 27, 1938July 3, 1938July 6, 1938July 9, 1938
Mar. 22, 1939June 18, 1939June 28, 1939
Mar. 30, 1940Apr. 29, 1940
Mar. 10, 1941Mar. 27, 1941June 7, 1941June 11, 1941
May 18, 1942
Mar. 1, 1943Mar. 27, 1943June 3, 1943June 14, 1943July 5, 1943
Gage height (feet)
alO.89.88.49.2
a!3.011.59.19.8
10.5
all8.9
b9.4b6.6blO.5
9.4
b7.67.3
8.311.1
b!2.7b9.01
6.0812.66
bll.82b3.923.47
5.726.80
b6.505.80
6.0410.4414.289.308.85
6.076.68.147.808.49
b9.066.675.57
b6.125.20
b7.28.085.94
11.56
5.00
b8. 2017.45.3210.705.5
Discharge (cfs)
6,760-
3,6504,440
-8,0304,5505,4506,410
-4,120
-1,6803,700
4,650
-2,580
3,3806,890
-3,400
1,22011,0002,110
-80
2,1702,920
-2,230
2,4507,270
14,8005,8405,210
2,5002,9204,4104,0804,850
4,5203,0002,120
-1,840
2,5004,6902,5009,060
1,830
a2,50028,2002,0307,8002,170
Water year
1944
1945
1946
1947
1948
1949
1950
1951
1952
1953
1954
1955
1956
1957
1958
1959
1960
1961
1962
1963
Date
Apr. 1, 1944Apr. 6, 1944June 18, 1944June 21, 1944June 27, 1944July 1, 1944
Mar. 15, 1945Mar. 16, 1945
July 6, 1946
Feb. 20, 1947Mar. 26, 1947Apr. 15, 1947June 25, 1947
Mar. 17, 1948Mar. 20, 1948Mar. 23, 1948
Mar. 7, 1949Mar. 12, 1949Mar. 30, 1949Apr. 1, 1949May 29, 1949
Mar. 25, 1950Apr. 7, 1950Apr. 19, 1950May 9, 1950Aug. 14, 1950
Mar. 27, 1951June 14, 1951Aug. 30, 1951
Apr. 7, 1952
Mar. 21, 1953May 29, 1953June 16, 1953June 19, 1953June 24, 1953
Apr. 10, 1954
Mar. 10, 1955
Mar. 21, 1956
June 26, 1957
Mar. 27, 1958Mar. 30, 1958
Mar. 17, 1959Mar. 22, 1959
Mar. 27, 1960
June 28, 1961
May 31, 1962June 13, 1962June 21, 1962
Mar. 16, 1963
Gage height (feet)
112.4512.125.996.577.025.84
bll.8510.15
5.6
b9.58b!5.0
6.268.09
b!4.913.2511.92
6.85b7.40bll.l10.997.71
b6.5111.5022.305.817.0
14.807.037.59
15.42
blO.510.858.327.356.06
5.06
b3.50
bll.l
8.93
b8.205.84
b8.12b7.08
7.46
2.22
6.547.027.34
b4.74
Discharge (cfs)
7,50010,2003,0703,6204,0002,890
-7,000
2,320
-11,0002,9904,740
10,00012 , 5009,850
3,4002,900
-8,3204,150
_9,400
94,8002,8603,800
17,2003,8304,390
21,300
a8,50010,1005,9604,6003,130
2,610
720
9,000
5,600
2,0003,000
-3,800
4,100
374
3,7004,2104,570
900
a About.b Backwater from ice.
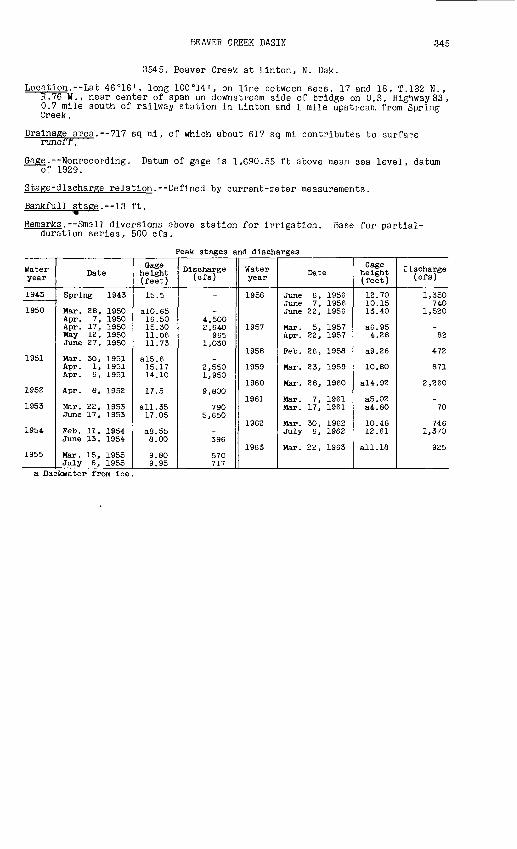
BEAVER CREEK BASIN 345
3545. Beaver Creek at Linton, N. Dak.
Location. Lat 46°16', long 100°14', on line between sees. 17 and 18, T.132 N., R.76 W., near center of span on downstream side of bridge on U.S. Highway 83 , 0.7 mile south of railway station in Linton and 1 mile upstream from Spring Creek.
Drainage area.--717 sq mi, of which about 617 sq mi contributes to surface runoff.
Gage. Nonrecording. Datum of gage is 1,690.55 ft above mean sea level, datum of 1929.
Stage-discharge relation. Defined by current-meter measurements.
Bankfull stage. 13 ft.
Remarks.--Small diversions above station for irrigation. Base for partial- duration series, 500 cfs.
Peak stages and discharges
Water year
1943
1950
1951
1952
1953
1954
1955
Date
Spring 1943
Mar. 28, 1950Apr. 7, 1950Apr. 17, 1950May 12, 1950June 27, 1950
Mar. 30, 1951Apr. 1, 1951Apr. 6, 1951
Apr. 8, 1952
Mar. 22, 1953June 17, 1953
Feb. 11, 1954June 13, 1954
Mar. 15, 1955July 6, 1955
Gage height (feet)
15.5
alO.6516.5015.3011.0611.73
a!5.615.1714.10
17.5
all. 3517.05
a8.558.00
9.809.95
Discharge (cfs)
_
_4,5002,640
9651,030
_2,5501,950
9,800
7905,650
-396
570717
Water year
1956
1957
1958
1959
1960
1961
1962
1963
Date
June 6, 1956June 7, 1956June 22, 1956
Mar. 5, 1957Apr. 22, 1957
Feb. 26, 1958
Mar. 23, 1959
Mar. 28, 1960
Mar. 7, 1961Mar. 17, 1961
Mar. 30, 1962July 6, 1962
Mar. 22, 1963
Gage height (feet)
12.7010.1513.40
a6.954.28
a9.26
10.80
a!4.92
a5.02a4.80
10.4812.61
all. 18
tischarge (cfs)
1,350740
1,520
-82
472
871
2,260
-70
7461,370
925
a Backwater from ice.

346 BEAVER CREEK BASIN
3547. Spring Creek near Linton, N. .Dak.
Location. Lat 46°18'40", long 100°13'50", in NE^NE^ sec.28, T.133 N., R.76 W., at bridge on county highway, 3 miles north of Linton.
Drainage area.--22.9 sq mi.
Gage. Crest-stage gage.
Stage-discharge relation.--Defined by current-meter measurement? below 900 cfs and extended above on basis of contracted-opening measurement at 2,790 cfs.
Remarks. Only annual peaks are shown.
Peak stages and discharges
Water year
1955
19561957
1958
Date
Mar. 10, 1955June or July
1955
June 6, 1956Feb. 27, 1957March 1957Feb. 25, 1958Mar. 24, 1958
Gage height (feet)
a5.904.42
8.18a4.34a4.77a5.074.52
Discharge (cfs)
_72
2,79018
-_82
Water year
19591960
1961196219631964
Date
Mar. 19, 1959Mar. 26, 1960
Apr. 19, 1961May 22, 1962Mar. 20, 1963May or June
1964
Gage height (feet)
a5.87.05
1.607.06
a6.505.20
' Discharge (cfs)
1301,180
1.01,190
200145
a Backwater from ice.
3548. Sand Creek near Temvik, N. Dak.
Location. Lat 46°22'20", long 100°20'40", on north line sec.3, T.133 N. , R.77 W., at bridge on county highway, 4.2 miles west of Temvik.
Drainage area. 23.3 sq mi.
Gage. Crest-stage gage.
Stage-discharge relation. Defined by current-meter measurements below 240 cfs and extended above on basis of culvert measurement at 1,030 cfs.
Remarks. Only annual peaks are shown.
Peak stages and discharges
Water year
1955
1956
19571958
Date
Mar. 8, 1955
May or June1956
March 1957Feb. 25, 1958Mar. 24, 1958
Gage height (feet)
2.38
2.20
a2.012.682.70
Discharge (cfs)
96
65
28165-
Water year
19591960
1961196219631964
Date
Mar. 22, 1959Mar. 26, 1960
-June 18, 1962Mar. 19, 1963Mar. 30, 1964
Gage height (feet)
a5.654.40
-4.422.671.56
Discharge (efs)
301,030
01,670
16217
a Backwater from ice.
GRAND RIVER BASIN
3549. Spring Creek near Bowman, N. Dak.
Location.--Lat 46°08', long 103°24', in NW^SW^ sec.35, T.131 N. , R.102 W. , at bridge on U.S. Highway 85, 4 miles south of Bowman.
Drainage area. 51.2 sq mi.
Gage.--Crest-stage gage.
Stage-discharge relation. Defined by current-meter measurements below 240 cfs.
Remarks. Only annual peaks are shown.

GRAND RIVER BASIN 347
Peak stages and discharges of Spring Creek near Bowman, N. Dak.
Water year
1955
1956195719581959
Date
June 28, 1955
_June 21, 1957June 9, 1958Mar. 18, 1959
Gage height (feet)
2.61
_4.344.034.50
Discharge (cfs)
9
09075
100
Water year
1960
1961196219631964
Date
Mar. 20, 1960
_May 1962June 1963
June 18, 1964
Gage height (feet)
5.22
_-
b4.455.80
Tlscharge (cfs)
155
0a295
265a About.b Backwater from vegetation.
3549.5. Spring Creek tributary near Bowman, N. Dak.
Location. Lat 46°09', long 103°24', in SW£sw£ sec.23, T.131 N. , R.102 V'., at bridge on U.S. Highway 85, 2.3 miles south of Bowman.
Drainage area.--11.4 sq mi.
Gage. Crest-stage gage.
Stage-discharge relation.--Defined by current-meter measurements below 33 cfs.
Remarks. Only annual peaks are shown.
Peak stages and discharges
Water year
1955
1956
195719581959
Date
June 28, 1955
March or April1956
June 21, 1957July 1958
Mar. 19, 1959
Gage height (feet)
6.29
5.80
b6.506.58
b6.06
Discharge (cfs)
50
alO
a708030
Water year
1960
1961196219631964
Date
June 12, 1960
_May 1962May 1963
June 18, 1964
Gage height (feet)
5.95
_b5.906.086.78
Discharge (cfs)
22
0143578
a Estimated, b Backwater.
3550. North Pork Grand River at Haley, N. Dak.
Location.--Lat 45°57', long 103°07', in southwest corner sec.30, T.129 F., R.99 W., on left bank 10 ft downstream from county highway bridge, 300 ft south of post office at Haley, and 1 mile north of the South Dakota State line.
Drainage area. 509 sq mi.
G§£e.--Nonrecording prior to June 19, 1951; recording thereafter. At detum 3 ft higher prior to September 1917. Altitude of gage is 2,664 ft (l-f barometer). Gage heights given herein converted to present site and datum.
Stage-discharge relation. Poorly defined by current-meter measurements below 5,800 cfs for 1912-17. Defined by current-meter measurements below 4,500 cfs for 1946-63. Extended on basis of slope-area measurement at 11,?00 cfs for 1946-52; since 1952, extended on the basis of one discharge measurement at 8,100 cfs, 50 percent of which was a current-meter measurement an<? 50 percent was by indirect measurement of flow over roadway outside of main channel.
Bankfull staple. 12 ft.
Remarks. Base for partial-duration series, 400 cfs, shown prior to Oct. 23, 1945.
Only annual peaks are

348 GRAND RIVER BASIN
Peak stages and discharges of North Pork Grand River at Haley, N. Dak.
Water year
1912191319141915
1917
1946
1947
1948
1949
1950
1951
Date
Mar. 29, 1912Mar. 31, 1913June 21, 1914June 13, 1915
Apr. 7, 1917Apr. 7, 1917
June 29, 1946
Feb. 16, 1947Mar. 23, 1947Apr. 11, 1947June 23, 1947
Feb. 18, 1948Mar. 16, 1948
Mar. 24, 1949Mar. 28, 1949
Mar. 6, 1950Apr. 8, 1950Apr. 15, 1950 May 8, 1950May 10, 1950
Mar. 25, 1951July 30, 1951
Gage height (feet)
10.413.515.013.3
a9.25a8.85
5.40
alO . 3014.4012.2810.00
a9.40a!2
a!4.0all.O
all. 41a!2.8917.10 7.599.27
alO.2212.81
Discharge (cfs)
1,4008,1006,5004,000
-650
72
9305,6402,9201,250
b500b2,000
1,7001,770
1,7101,830
11,300 428931
7752,680
Water year
1952
1953
1954
1955
1956
1957
1958
1959
1960
19611962
1963
Date
Apr. 7, 1952
May 29, 1953June 15, 1953June 20, 1953July 20, 1953
Apr. 7, 1954
July 28, 1955
Mar. 16, 1956Aug. 27, 1956
June 9, 1957June 23, 1957
June 11, 1958
Mar. 19, 1959
Mar. 21, 1960June 10, 1960May 23, 1961June 15, 1962July 3, 1962
Mar. 3, 1963
Gage height (feet)
17.03
8.5912.2312.589.38
9.07
8.38
a6.185.57
9.0212.11
7.27
9.97
9.4911.618.269.45
10.17
a9.20
Discharge (cfs)
14,100
5782,2102,510
789
711
608
_60
6811,940
261
940
7811,980
436723940
400a Backwater from ice b About.
3552. Buffalo Creek tributary near Buffalo Springs, N. Dak.
Location. Lat 46°11', long 103°16', in NE^NW^ sec.14, T.131 N., R.101 W. , at culvert on U.S. Highway 12, 2 miles west of Buffalo Springs.
Drainage area.--3.39 sq mi.
Gage.--Crest-stage gage.
Stage-discharge relation. Defined by current-meter measurement below 4 cfs and extended above on basis of culvert measurement at 389 cfs.
Remarks. Only annual peaks are shown.
Peak stages and discharges
Water year
1955
1956
1957
1959
Date
June 26, 1955
Mar. 1, 1956Aug. 6, 1956 Spring 1957June 9, 1958 March 1959March 1959
Gage height (feet)
0.68
al.311.00
a2.116.17
al.921.49
Discharge (cfs)
0.1
_1
33389
10
Water year
1960
19611962 1963
1964
Date
Mar. 20, 1960
_June 15, 1962 Feb. 4, 1963March 1963 June 18, 1964
Cage height ( feet )
1.75
a3.80 al.861.77 2.01
Discharge (cfs)
18
150
19
a Backwater from snow, ice, or vegetation.

GRAND RIVER BASIN 349
3555. North Fork Grand River near White Butte, N. Dak.
Location. Lat 45°48'10", long 102"21'35", near line between sees.10 and 11, T.21 N., R.14 E., on left bank 100 ft upstream from county highway bridge, a quarter of a mile upstream from nearest tributary, and 9f miles south of White Butte.
Drainage area. 1,190 sq mi, approximately.
Gage.--Nonrecording Nov. 28, 1945, to Aug. 28, 1947, and Apr. 17, 1950, to June 11, 1951; recording Aug. 29, 1947, to Apr. 16, 1950, and after June 11, 1951. Altitude of gage is 2,275 ft (by barometer).
Stage-discharge relation.--Prior to 1952, defined by current-meter measurements below 4,300 cfs and Extended above on basis of slope-area measurement at 30,900 cfs. Since 1952, defined by current-meter measurements below 19,000 cfs.
Bankfull stage. 14 ft.
Remarks.--Base for partial-duration series, 400 cfs.
Peak stages and discharges
Water year
1946
1947
1948
1949
1950
1951
1952
Date
July 2, 1946
Feb. 17, 1947Mar. 24, 1947Apr. 13, 1947June 23, 1947
Feb. 21, 194SFeb. 27, 1948Mar. 16, 1948Mar. 17, 1948
Mar. 8, 1949Mar. 25, 1949Mar. 23, 1949
Mar. 7, 1950Apr. 7, 1950Apr. 10, 1950Apr. 16, 1950May 12, 1950Aug. 13, 1950
Mar. 23, 1951Mar. 27, 1951July 31, 1951
Apr. 8, 1952
Gage height (feet)
3.44
a7.02a!2.35
6.17.0
a5.78a6.36
alO.267.47
a8.26all.la8.46
a8.50a6.58
alO.820.06.36.09
a7.206.586.97
17.0
Discharge (cfs)
72
4807,0401,2601,700
5006OO-
2,000
930-
2,600
1,700800
2,00030,900
915764
_1,1901,450
21,500
Water year
1952
1953
1954
1955
1956
1957
1958
1959
1960
1961
1962
1963
Date
May 27, 1952
May 29, 1953June 16, 1953June 21, 1953July 22, 1953
Apr. 8, 1954Aug. 26, 1954
July 8, 1955
Mar. 20, 1956
June 24, 1957
June 13, 1958
Mar. 21, 1959
Mar. 23, 1960June 11, 1960
May 28, 1961
July 4, 1962
June 25, 1963
Gage height (feet)
5.67
7.908.828.926.80
5.555.17
4.20
a5.67
7.32
4.53
6.69
6.016.33
2.95
5.83
6.50
Discharge (cfs)
440
2,8504,2704,4301,460
689405
61
310
2,170
206
1,670
9891,320
21
844
1,340a Backwater from ice.
3560. South Fork Grand River at Buffalo, S. Dak.
Location. Lat 45°34'35", long 103°32'45", on east line sec.30, T.19 N., R.5 E., on upstream side of bridge on U.S. Highway 85, 0.3 mile south of Buffalo.
Drainage area. 148 sq mi.
Gage. Nonrecording and crest-stage gage. Datum of gage is 2,839.60 ft above mean sea level, datum of 1929.
Stage-discharge relation. Defined by current-meter measurements below £40 cfs and extended above on basis of slope-area measurement at 2,780 cfs.
Bankfull stage. 5 ft.
Remarks. Base for partial-duration series, 100 cfs.
219-848 O - 66 - 24

350 GRAND RIVER BASIN
Peak stages and discharges of South Fork Grand River at Buffalo, S. Dak.
Water year
1956
1957
1958
1959
1960
1961
Date
July 5, 1956Aug. 12, 1956
Nov. 6, 1956June 22, 1957Aug. 8, 1957
June 9, 1958
Mar. 9, 1959June 30, 1959
Mar. 20, 1960May 25, 1960June 9, 1960Sept. 8, 1960
Aug. 17, 1961
Gage height (feet)
5.86.26
a5.554.055.35
5.68
a5.274.14
a5.604.757.545.62
a6.33
Discharge (cfs)
738968
-114480
404
-104
320173
1,020312
375
Water year
1962
1963
1964
Date
Mar. 19, 1962May 15, 1962May 19, 1962May 22, 1962May 26, 1962May 29, 1962July 17, 1962
Feb. 4, 1963Apr. 6, 1963Apr. 27, 1963May 11, 1963June 14, 1963June 17, 1963
June 9, 1964
Gage height (feet)
a5.54.216.626.005.604.555.10
a5.544.605.105.099.018.02
6.88
Discharge (cfs)
170112665450322143207
140172254254
2,7801,750
1,080
a Backwater fro^i ice.
3560.5. Wide Sandy Creek near Buffalo, S. Dak.
Location.--Lat 45°31' , long 103°33', in NW£ sec.20, T.18 N., R.5 E. , at bridge on U.S. Highway 85, 4| miles south of Buffalo.
Drainage area.--38.8 sq mi.
Gage. Crest-stage gage.
Stage-discharge relation.--Defined by current-meter measurement below 62 cfs.
Remarks.--Only annual peaks are shown.
Peak stages and discharges
Water year
1956
1958 1959 1960
Date
August 1956
June 8, 1958 June 25, j.959
June 1960
Gage height (feet)
a4.10
4.92 5.25 5.35
Discharge (cfs)
23
150 200 220
Water year
1961 1962 1963 1964
Date
September 1961 June 1962 June 1963
June 9, 1964 June 18, 1964
Page height (feet)
4.15 6.66 6.08 5.34 4.95
Discharge (cfs)
90 400 320
60Note. Backwater from ice or vegetation on all peaks.
3565. South Pork Grand River near Cash, S. Dak.
Location.--Lat 45°38'55", long 102°38'45", in NE^SW^SE^ sec.33, T.20 N. , R.12 E., on downstream end of left pier of county highway bridge, 1 mile upstream from Little Nasty Creek, 4 miles north of Cash, 10 miles south of Lodgepole, 12 miles northwest of Bison, and 16 miles downstream from Big Nasty Creek.
Drainage area. 1,350 sq mi, approximately.
Gage. Nonrecording prior to Oct. 25, 1946; recording and nonrecording thereafter. Altitude of gage is 2,416 ft (by barometer).
Stage-discharge relation.--Defined by current-meter measurements below 14,000 cfs and extended above on basis of slope-area measurement at £7,000 cfs.
Bankfull stage.--12 ft.
Remarks.--Base for partial-duration series, 500 cfs.

GRAND RIVER BASIN 351
Peak stages and discharges of South Pork Grand River near Cash, S. Dak.
Water year
1946
1947
1948
1949
1950
1951
1952
Date
Feb. 26, 1946May 25, 1946June 13, 1946
Feb. 17, 1947Mar. 22, 1947Mar. 23, 1947Mar. 25, 1947Mar. 28, 1947Apr. 1, 1947Apr. 11, 1947June 21, 1947June 24, 1947June 27, 1947
Feb. 18, 1948Mar. 14, 1948Mar. 19, 1948May 25, 1948June 19, 1948July 16, 1948
Mar. 8, 1949Mar. 23, 1949Mar. 28, 1949
Mar. 7, 1950Apr. 7, 1950Apr. 15, 1950May 3, 1950May 10, 1950
Mar. 25, 1951July 30, 1951
Feb. 14, 1952Apr. 2, 1952Apr. 6, 1952
Gage height (feet)
a5.115.54.95
a8.6a!4.3511.25.94.754.96.15.407.345.75
aS.la!3.1all.O
5.065.024.63
a7.157.485.58
a6.7710.8715.405.285.77
a6.345.25
a!5.811.5713.59
Discharge (cfs)
_1,040
686
1,120-
8,0001,380
576657
1,570971
3,0001,240
2,0002,5001,000
746715523
2,3003,2001,120
1,9007,000
27,000528
1,190
1,000575
-4,690
15,600
Water year
1953
1954
1955
1956
1957
1958
1959
1960
1961
1962
1963
Date
Mar. 14, 1953May 29, 1953June 16, 1953June 20, 1953July 21, 1953
Apr. 7, 1954
Mar. 11, 1955June 29, 1955
Mar. 19, 1956July 4, 1956
June 24, 1957Aug. 2, 1957Aug. 8, 1957
June 15, 1958
Mar. 19, 1959
Mar. 22, 1960June 10, 1960June 14, 1960
July 25, 1961
Mar. 21, 1962May 20, 1962May 23, 1962July 18, 1962Aug. 9, 1962
Mar. 3, 1963June 16, 1963June 19, 1963June 25, 1963
Gage height (feet)
a6.316.116.367.027.11
5.30
a5.555.30
5.755.03
5.245.017.28
4.73
5.47
a6.978.135.56
4.29
5.385.725.475.666.40
a6.78.195.945.09
Discharge (cfs)
-1,3601,5802,1602,240
752
-700
1,040512
638500
2,420
400
758
1,6103,1901,040
199
8141,2201,2501,0401,710
1,4503,2001,130
694a Backwater from ice.
3575. Grand River at Shadehill, S. Dak.
Location.--Lat 45°45', long 102°12', in NW^NW^ sec.30, T.21 N., R.16 E., a quarter of a mile downstream from Shadehill Dam, 1 mile southwest of Shadehill, and 12 miles southwest of Lemmon.
Drainage area. 3,120 sq mi, approximately.
Gage. Nonrecording prior to Sept. 1, 1947; recording thereafter. At sitethree-quarters of a mile downstream at datum 6.02 ft lower prior to Oct. 25, 1958. Datum of gage is 2,192.48 ft above mean sea level, datum of 1929.
Stage-discharge relation. Defined by current-meter measurements.
Bankfull stage. 12 ft, at site three-quarters of a mile downstream.
Remarks. Flow completely regulated by Shadehill Reservoir (usable capacity, 350,769 acre-ft) since July 1, 1950. Only annual peaks are shown.
Peak stages and discharges
Water year
1943 1944 1945
1946 1947 1948 1949 1950
1951
1952
Date
Feb. 20, 1943 Apr. 7, 1944 Mar. 12, 1945 Mar. 14, 1945
May 25, 1946 Mar. 23, 1947 Mar. 16, 1948 Mar. 28, 1949 Apr. 16, 1950
Mar. 22, 1951 Aug. 30, 1951 Apr. 9, 1952
Gage height (feet)
18.7 17.2
b!5.5
5.75 blS.O
be 13. 5 blO.60 d21.0
b4.85
10.45
Discharge (cfs)
(a) 18,000
8,680
637 16,100 6,800 4,800 58,000
71 5,150
Water year
1953 1954 1955
1956 1957 1958 1959 1960
1961 1962
1963
Date
June 22, 1953 Apr. 10, 1954 Sept. 20, 1955
Mar. 29, 1956 June 26, 1957 June 18, 1958Mar. 26, 1959 June 16, 1960
Oct. 16, 1960 Dec. 7, 1962 Aug. 26, 1962 Sept. 18, 1963
Gage height (feet)
8.43 4.25 3.62
4.02 5.15 3.884.45 4.70
4.25 W.99
4.07
Discharge (cfs)
2,830 252 29
169 542 137362 499
266
125 210
a Not determined. b Backwater from ice. d From floodmark upstream from bridge.
c Occurred on preceding day.

352 GRAND RIVER BASIN
3580. Grand River near Wakpala, S. Dak.
Location. La t 45°39'40", long 100 038'20", in SE^Swi sec. 26, T.20 N., R.28 E., on upstream side of bridge on U.S. Highway 12, 5 miles west of Wakpala, 8 miles upstream from Deep Bank Creek, and 21 miles upstream from mouth.
Drainage area. --5. 510 sq mi, approximately.
Gage . Honrecordlng prior to Mar. 12, 1937; Mar. 31, 1944, to June 29, 1948; and subsequent to June 26, 1960. At site 12 miles downstream at different datum prior to Mar. 18, 1918. At site 17 miles downstream at different datum Aug. 26, 1928, to Mar. 30, 1944. Datum of gage is 1,582.87 ft above mean sea level, datum of 1929.
Stage-discharge relation. Defined by current -meter measurements below 3,200 cfs for the period 1914-16; below 9,000 cfs for the period 1928-43; below 19,000 cfs for the period 1944-49; and below 80,000 cfs for the period 1950-55.
Bankfull stage. 17 ft, present site and datum.
Remarks . --Regulated by Shadehill Reservoir (usable capacity, 350,769 acre-ft) since July 1, 1950. Records are equivalent at the three site" used during the period of record. Base for partial-duration series, 1,401 cfs. Only annual peaks are shown prior to Oct. 1, 1936, and subsequent to Sept. 30,1950.
Peak stages and discharges
Water year
19141915
1916
1929
1930
193119321933
19341935
1936
1937
1938
1939
1940
1941
1942
Date
June 15, 1914June 18, 1915
Apr. 20, 1916
Mar. 12, 1929Mar. 14, 1929Mar. 14, 1930
June 12, 1931June 11, 1932Mar. 19, 1933May 27, 1933Mar. 23, 1934July 24, 1935
Mar. 10, 1936
Mar. 7, 1937Apr. 8, 1937Apr. 16, 1937June 8, 1937June 15, 1937June 21, 1937July 15, 1937
(d)June 29, 1938July 3, 1938July 7, 1938Sept. 6, 1938
Mar. 24, 1939July 8, 1939
Mar. 31, 1940Mar. 31, 1940Apr. 30, 1940July 30, 1940
Mar. 10, 1941June 8, 1941June 13, 1941
Apr. 5, 1942May 3, 1942May 19, 1942June 4, 1942June 30, 1942July 30, 1942
Gage height (feet)
12.418.8
10.6
a!9.012.3
a20.5
5.9412.0c9.08.30
* 7.269.08
7.63
7.007.439.41
11.8714.989.906.88
a6.510.0613.9212.7012.10
a!4.6010.37
all. 608.997.539.40
aS.OO11.5313.49
7.848.97
10.439.617.618.85
Discharge (cfs)
4,0007,600
3,260
_7,630(b)
8437.230(b)
2,1401,3603,800
2,010
1,9602,3604,5108,060
13,7005,1601,850
-5,7309,1107,5206,740
7,0004,600
_2,9701,4003,420
1,4006,0309,100
1,7003,0804,8403,6601,4602,900
Water year
1943
1944
1945
1946
1947
1948
1949
1950
19511952
1953
Date
Feb. 23, 1943Mar. 25, 1943Mar. 26, 1943June 5, 1943June 9, 1943 June 16, 1943July 5, 1943Sept. 4, 1943
Apr. 9, 1944June 19, 1944June 23, 1944June 28, 1944July 10, 1944
Mar. 11, 1945Mar. 15, 1945Mar. 27, 1945June 8, 1945
July 4, 1946
Mar. 25, 1947Apr. 14, 1947June 8, 1947June 23, 1947June 29, 1947
Mar. 18, 1948Mar. 19, 1948Mar. 23, 1948June 19, 1948
Mar. 8, 1949Mar. 25, 1949Mar. 28, 1949May 2, 1949May 30, 1949
Mar. 11, 1950Mar. 26, 1950Apr. 8, 1950Apr. 18, 1950May 10, 1950Aug. 14, 1950
Mar. 26, 1951Apr. 1, 1952Apr. 2, 1952June 17, 1953
Gage h3ight (feet)
15.8a!7.717.26.706 . 46
10.666.407.55
19.513.3612.611.37.35
a!7.3al8.37
8.658.77
6.44
17.07.158.5511.88.72
a!2.1a!4.0
9.17.6
a!2.66a!5.111.97.07.2
a7.41a9.3814.1922.758.618.95
all. 28a!4.012.8215.96
Discharge (cfs)
13,000-
15,8001,7801 CQC\
t D J*J
5,7901,5402,500
32,00011,5009,9507,4101,840
-10,0003,2803,540
1,000
19,0002,0903,55012,4004,390
7,700-
4,2502,410
8,3009,500
10,2001,6601,950
1,7003,60013,30082,2006,0104,580
10,000-
17,90032,000
a Backwater from ice.period Feb. 28 to Mar. 5, 1938.
b Not determined. c At least this high. d During

GRAND RIVER BASIN 353
Peak stages and discharges of Grand River near Wakpala, S. Dak. Continued
Water year
19541955
1956
19571958
Date
June 7 , 1954Sept. 23 , 1955
Mar. 18, 1956Mar. 20, 1956May 26, 1957Mar. 26, 1958
Gage height (feet)
8.737.25
alO.95-
8.469.38
Discharge (cfs)
3,410755
_6,2602,7404,510
Water year
19591960
1961
19621963
Date
Mar. 12, 1959Mar. 23, 1960
Mar. 2, 1961Sept. 14, 1961June 14, 1962Aug. 29, 1963
Gage height (feet)
8.15a9.31
a8.49-
11.79.75
Discharge (cfs)
1,6603,890
_665
8,3603,700
a Backwater from ice.
3584. Claymore Creek tributary No. 2 near Trail City, S. Dak.
Location. Lat 45°29', long 100°35' , in NE^ sec.31, T.18 N., R.29 E., at culvert on old State Highway 8, ?| miles east of Trail City.
Drainage area. 0.11 sq mi.
Gage. Crest-stage gage.
Stage-discharge relation. Defined by current-meter measurements below 1.1 cfs and extended on basis of estimate of peak flow of 12.5 cfs based on culvert geometry.
Remarks. Only annual peaks are shown.
Peak stages and discharges
Water year
1956
1957 1958
1959
Date
May or June 1956
June 24, 1957 March 1958 Mar. 24, 1958 March 1959 Mar. 10, 1959
Gage height (feet)
3.61
3.24 a4.60 3.70
a2.48 2.27
Discharge (cfs)
24
18
25
2.5
Water year
1960
1961 1962 1963 1964
Date
Mar. 21, 1960
Spring 1961 May 18, 1962 Mar. 19, 1963 May 5, 1964
Gage height (feet)
a3.5
2.67 4.61
a2.24 2.94
Discharge (cfs)
b5
4.5
1.0 b!2.5
a Backwater from ice or snow, b Estimated.
DEADMAN CREEK BASIN
3585.2. Deadman Creek tributary near Mobridge, S. Dak.
Location. Lat 45°28', long 103°30', in NW£ sec.l, T.17 N., R.29 E., at culvert on county highway, 6 miles southwest of Mobridge.
Drainage area. 0.31 sq mi.
Gage. Crest-stage gage.
Stage-discharge relation. Defined by current-meter measurements below 12 cfs and extended above on basis of culvert measurements at 60.3 and 180 cfs.
Remarks. Only annual peaks are shown.
Peak stages and discharges
Water year
1956 1957 1958 1959 1960
Date
Mar. 18, 1956 May 1957
Mar. 24, 1958 March 1959 Mar. 21, 1960
Gage height (feet)
4.76 6.69 5.42 4.00
a4.94
Discharge (cfs)
4.0 48 8 1.0 4.5
Water year
1961 1962
1963 1964
Date
March 1961 Feb. 6, 1962 Mar. 20, 1962
May 1963 June 17, 1964
Gage height (feet)
4.63 5.98
a7.9 4.12
a!2.07
Discharge (cfs)
3.5 23
1.2 180
a Backwater.

354 MOREAU RIVER BASIN
3587.5. North Pork Moreau River tributary near Redlg, S. Dak.
Location.--Lat 45°20', long 103°33', in SE^ sec.19, T.16 N., R.5 E., at culvert onUTS. Highway 85, 5 miles north of Redig and l?f miles south of Buffalo.
Drainage area.--4.00 sq mi.
Gage.--Crest-stage gage.
Stage-discharge relation.--Defined by current-meter measurements below 23 cfs.
Remarks.--Only annual peaks are shown.
Peak stages and discharges
Water year
1956
1958 1959 1960
Date
June or July 1956
Mar. 17, 1959 Mar. 20, I960
Gage height (feet)
3.45
3.15 4.00 4.20
Discharge (cfs)
14
10 20 22.6
Water year
1961 19621963 1964
Date
May 1962June 1963 June 1964
Gage height (feet)
5.955.40 4.56
Discharge (cfs)
0
-
3590. Moreau River at Bixby, S. Dak.
Location. Lat 45°08'32", long 102°33'38", in SE^SW^ sec.29, T.14 N., R.13 E., on right bank 0.3 mile downstream from county highway bridge, 0.4 mile south of Bixby, and 3^- miles downstream from proposed Bixby damsite.
Drainage area. 1,570 sq mi, approximately.
Gage.--Nonrecordlng Apr. 17 to June 24, 1948, and Oct. 1, 1950, to Oct. 11, 1952; recording June 25, 1948, to Sept. 30, 1950, and after Oct. 11, 1952. At bridge a quarter of a mile upstream Apr. 17 to June 24, 1948, and Oct. 1, 1950, to Sept. 9, 1952. At site 300 ft below bridge June 25, 1948, to Sept. 30, 1950, and at present site and datum since Sept. 10, 1952. Datum of gage is 2,431.02 ft above mean sea level, datum of 1929 (Bureau of Reclamation bench mark).
Stage-discharge relation. Prior to 1953, defined by current-meter measurements below 12,000 cfs and extended above on basis of slope-area measurement at 15,300 cfs. Since 1953, defined by current-meter measurements below 2,000 cfs and extended above on basis of slope-area measurement at 15,300 cfs.
Bankfull stage.--17 ft.
Remarks. Base for partial-duration series, 700 cfs.
Peak stages and discharges
Water year
1949
1950
1951
1952
1953
1955
Date
Mar. 10, 1949Mar. 23, 1949Mar. 28, 1949Apr. 7, 1949
Apr. 3, 1950Apr. 7, 1950Apr. 16, 1950May 5, 1950May 7, 1950May 11, 1950
Mar. 29, 1951Aug. 13, 1951
Feb. 11, 1952Apr. 1, 1952
Mar. 17, 1953May 29, 1953June 15, 1953June 17, 1953June 21, 1953
Sept. 21, 1955
Gage height (feet)
a7.8011.07.555.25
a!3.5312.7414.655.245.286.38
a5.15.60
alO.3417.8
a7.084.766.368.035.47
4.56
Discharge (cfs)
, 7205,4202,530
872
3,5007,610
10,500867889
1,520
-1,060
2,50015,500
1,500722
1,6702,9801,110
632
Water year
1956
1957
1958
1959
1960
1961
1962
Date
Mar. 21, 1956July 5, 1956Aug. 5, 1956Aug. 13, 1956
Aug. 10, 1957
June 10, 1958June 18, 1958July 3, 1958
Mar. 14, 1959
Mar. 22, I960May 1960
June 16, 1960
June 16, 1961
Mar. 22, 1962May 19, 1962May 24, 1962May 28, 1962May 31, 1962June 23, 1962
Gage height (feet)
a7.396.605.625.17
4.98
7.625.848.46
5.81
8.725.684.96
5.49
a8.238.148.638.137.765.08
Discharge (cfs)
-1,8401,160
935
700
2,7501,4103,520
1,310
3,6201,230
840
1,110
1,0003,3203,7903,3102,980
934a Backwater from ice.

MOREAU RIVER BASIN 355
Bsak stages and discharges of Moreau River at Bixby, S. Dak.--Continue!
Water year
1963
Date
Mar. 2, 1963 June 4, 1963 June 8, 1963
Gage height (feet)
a8.68 5.15 4.99
Discharge (cfs)
1,600 950 862
Water year
1963
Date
June 16, 1963 June 24, 1963
Gage height (feet)
9.26 5.40
Discharge (cfs)
4,390 1,110
a Backwater from ice.
3595. Moreau River near Faith, S. Dak.
Location. Lat 45°11'51" > long 102°09'12", in NE^NW^ sec.10, T.14 N., R.16 E., 500 ft downstream from bridge on State Highway 73, 2-jj- miles downstream from Rabbit Creek, and 13£ miles northwest of Faith.
Drainage area. 2,660 sq mi, approximately.
Gage. Nonrecording at site a third of a mile upstream prior to Oct. 5, 1949; nonrecording and crest-stage gage at site 500 ft upstream Oct. 5, 1949, to July 16, 1959; recording thereafter. At datum 1.0 ft higher prior to July 17, 1959. Datum of gage is 2,238.68 ft above mean sea level, datum of 1929.
Stage-discharge relation. Prior to 1950, defined by current-meter measurements below 5,300 cfs and extended above on basis of slope-area measurement at 26,000 cfs. Since 1950, defined by current-meter measurements.
Bankfull stage.--16 ft.
Remarks. Base for partial-duration series, 700 cfs.
Peak stages and discharges
Water year
1944
1945
1946
1947
1948
1949
1950
1951
Date
Apr. 9, 1944June e, 1944June 14, 1944June 18, 1944June 24, 1944July 13, 1944
Mar. 15, 1945June 9, 1945
May 26, 1946June 2, 1946June 15, 1946June 21, 1946June 27, 1946June 30, 1946
Oct. 8, 1946Feb. 16, 1947Mar. 23, 1947Mar. 23, 1947Apr. 2, 1947Apr. 12, 1947June 21, 1947June 24, 1947July 11, 1947
Mar. 16, 1948Mar. 19, 1948June 20, 1948June 25, 1948
Mar. 8, 1949Mar. 23, 1949Apr. 3, 1949
Apr. 4, 1950Apr. 7, 1950Apr. 17, 1950May 8, 1950May 12, 1950
Mar. 26, 1951Aug. 13, 1951
Gage height (feet)
20.96.76.35
19.69.07.15
11.015.4
6.75.95.37.15.25.5
5.05a!4.4a!3.07a!2.5
5.25.59.19.956.0
all.OalO.3
6.455.1
a8.311.05.5
10.113.518.04.875.62
a4.836.50
Discharge (cfs)
26,0002,0101,710
23,0004,2002,500
6,2801,040
2,0101,460
9842,370
9261,110
1,0105,600
_7,930
9841,1704,3005,1601,610
1,9001,9002,0101,040
2,5006,2801,300
6,40011,00023,0001,3401,970
1,0802,300
Water year
1952
1953
1954
1955
1956
1957
1958
1959
1960
1961
Date
Feb. 14, 1952Mar. 30, 1952Apr. 2, 1952June 22, 1952June 28, 1952July 3, 1952
Mar. 19, 1953May 3, 1953May 30, 1953June 15, 1953June 18, 1953June 21, 1953July 27, 1953
Apr. 7, 1954May 24, 1954May 29, 1954June 4, 1954June 7 , 1954June 11, 1954
Sept. 22, 1955
Mar. 21, 1956July 5, 1956Aug. 6, 1956Aug. 13, 1956
May 25, 1957Aug. 11, 1957
June 11, 1958June 19, 1958July 4, 1958
Mar. 14, 1959
Mar. 22, 1960May 26, 1960June 17, 1960Aug. 17, 1960
June 17, 1961
Gage height (feet)
a6.72a20.317.24.85.54.1
a6.855.04.8
14.69.08.34.0
4.45.35.024.386.10-4.22
4.08
4.706.2S4.834.64
4.314.29
6.555.037.22
a4.47
alO.O5.985.616
4.92
Discharge (cfs)
1,700-
25,0001,4401,900
970
2,5001,6001,460
12 , 7005,1104,360
905
1,0501,6601,4701,0802,460
980
826
1,2002,5201,3401,220
987973
2,3401,1802,900
830
3,5001,2501,0601,000
743a Backwater from ice.

356 MOREAU RIVER BASIN
Peak stages and discharges of Moreau River near Faith, S. Dak. Continued
Water year
1962
1963
Date
Mar. 23, 1962May 20, 1962May 23, 1962May 29, 1962June 24, 1962
Mar. 3, 1963
Gage height (feet)
6.208.2210.8510.575.90
a9.48
Discharge (cfs)
1,1502,8705,3805,080
975
3,000
Water year
1963
Date
June 3, 1963June 5, 1963June 9, 1963June 18, 1963June 24, 1963
Gage 1- eight (feet)
5.865.425.258.956.26
Discharge (cfs)
1,4501,1901,0903,5501,540
a Backwater from ice.
3600. Moreau River near Eagle Butte, S. Dak.
Location.--Lat 45°11'20", long 101°13'05", in NW^NW^SW^ sec.8, T.14 N., R.24 E., on right bank at downstream side of bridge on State Highway 63, 4 miles downstream from Meadow Creek and 13 miles north of Eagle Butte.
Drainage area. 4,320 sq mi, approximately.
Gage. Nonrecording prior to June 19, 1947; recording thereafter. Altitude of gage is 1,792 ft (by barometer).
Stage-discharge relation. Defined by current-meter measurements.
Remarks. Base for partial-duration series, 1,100 cfs.
Peak stages and discharges
Water year
1944
1945
1946
1947
1948
1949
1950
Date
Apr. 9, 1944June 7, 1944June 16, 1944June 19, 1944June 26, 1944July 14, 1944
Mar. 14, 1945Mar. 17, 1945June 9, 1945
May 27, 1946June 4, 1946June 23, 1946June 29, 1946July 2, 1946
Feb. 16, 1947Feb. 17, 1947Mar. 22, 1947Mar. 24, 1947Apr. 6, 1947Apr. 11, 1947June 22 , 1947
Mar. 15, 1948Mar. 17, 1948Apr. 24, 1948June 22, 1948July 20, 1948
Mar. 9, 1949Mar. 28, 1949
Apr. 8, 1950Apr. 18, 1950
Gage height (feet)
23.09.77.1
17.19.87.5
a!3.110.56.8
7.06.06.55.85.7
alS.Oa!2.6a!7.8614.367.36.4
13.2
a!2.50a8.245.716.036.1
a9.112.62
14.4220.23
Discharge (cfs)
27,0005,1902,380
16,9005,3002,780
_6,2902,290
2,4701,5902,0201,4301,360
-6,840
-10,8002,4701,760
10,600
_3,4201,3601,5901,930
3,7009,400
12,50022,200
Water year
1950
1951
1952
1953
1954
1955
1956
1957
1958
Date
May 9, 1950
Mar. 27, 1951June 8, 1951Aug. 14, 1951Aug. 31, 1951
Feb. 14, 1952Apr. 4, 1952June 29, 1952
Mar. 18, 1953Mar. 22, 1953May 2, 1953June 9, 1953June 15, 1953June 22, 1953Aug. 21, 1953
May 25, 1954May 29, 1954June 5, 1954June 8, 1954June 11, 1954
Sept. 25, 1955
Mar. 18, 1956Mar. 20, 1956July 6, 1956
May 26, 1957
June 12, 1958June 20, 1958July 5, 1958
Gage height (feet)
8.68
all. 505.657.507.40
alO.521.75.68
alO.910.546.647.07
22.019.525.58
5.305.174.876.726.96
3.73
a9.2-5.85
7.5
7.05.486.45
Discharge (cfs)
4,100
4,2001,3103,0402,920
4,07027,4001,440
8,1607,8802,7303,04030,3006,9801,650
1,4601,3601,1202,9903,090
452
-b4,5001,980
3,400
2,1801,1201,870
a Backwater from ice. b About.

MOREAU RIVER BASIN 357
3605. Moreau River near Whltehorse, S. Dak.
Location. Lat 45°15'21", long 100°50'33", in SW^SE^ sec.17, T.15 N., R.27 E., on left bank 30 ft downstream from bridge, 2| miles southeast of Whitehorse, 8 miles downstream from Little Moreau River, and 17 miles southeast of Timber Lake.
Drainage area.--4,880 sq ml, approximately.
Ga_ge.--Nonrecording prior to Nov. 23, 1954; recording thereafter. Datum of gage is 1,661.48 ft above mean sea level, datum of 1929.
Stage-discharge relation.--Defined by current-meter measurements.
Bankfull stage.--21 ft.
Remarks.--Base for partial-duration series, 1,000 cfs.
Peak stages and discharges
Water year
1953
1955
1956
1957
1958
1959
1960
Date
June 1953
Mar. 9, 1955
Mar. 18, 1956Mar. 21, 1956July 1, 1956
May 25, 1957May 29, 1957Sept. 2, 1957
Mar. 27, 195SJune 13, 1958June 21, 1958July 5, 1958
Mar. 12, 1959
Mar. 25, 1960
Gage height (feet)
E26.2
6.49
b!2.67blO.90
7.63
15.78.706.69
6.697.526.988.97
7.40
b9.8
Discharge (cfs)
-
530
-5,0001,800
10,1002,8401,180
1,1801,9601,4703,360
1,780
3,610
Water year
1960
1961
1962
1963
Date
May 25, 1960June 20, 1960
May 17, 1961June 14, 1961July 29, 1961
Mar. 21, 1962May 22, 1962May 31, 1962June 7, 1962June 9, 1962June 13, 1962June 17, 1962Aug. 10, 1962
June 7, 1963June 20, 1963June 24, 1963June 27, 1963
Gage height (feet)
13.099.36
6.3412.816.61
bll.0921.012.76.879.37
14.814.011.8
6.09.156.106.58
Eischarge (cfs)
6,0803,550
1,0505,7201,190
3,00017,5005,3901,5803,0507,3406,5404,690
1,1003,1301,1401,340
a About; probably exceeded by flood in 1947. b Backwater from ice.

358 MOREAD RIVER BASIN
3610. Moreau River at Promise, S. Dak.
Location. Lat 45°20' , long 100°36' , in sec.17, T.16 N. , R.29 E. , on upstream side of highway bridge, 170 ft downstream from Chicago, Milwaukee, St. Paul Pacific Railraod bridge, 0.5 mile downstream from Virgin Creek, and three- quarters of a mile north of Promise.
Drainage area. 5.223 sq mi.
Gage. Nonrecording 1928 to Nov. 7, 1934, July 21, 1944, to July 11, 1948, and since May 21, 1953; recording Nov. 8, 1934, to July 20, 1944, and July 12, 1948, to May 20, 1953. Datum of gage is 1,587.01 ft above mean sea level, datum of 1929.
Stage-discharge relation.--Defined by current-meter measurements.
Bankfull stage. 17 ft.
Remarks.--Base for partial-duration series, 1,300 cfs.
Peak stages and discharges
Water year
1929
1930
1931
1932
1933
1934
1935
1936
1937
1938
1939
1940
1941
Date
Mar. 14, 1929Mar. 24, 1929Mar. 28, 1929May 31, 1929June 2, 1929June 7, 1929
Feb. 24, 1930Apr. 19, 1930May 9, 193OJune 24, 1930
Apr. 2, 1931
Mar. 2, 1932Mar. 24, 1932Apr. 28, 1932May 3, 1932June 2, 1932June 4, 1932June 8, 1932June 12, 1932June 18, 1932June 29, 1932Aug. 18, 1932
Apr. 24, 1933May 15, 1933May 26, 1933
June 26, 1934
June 6, 1935July 10, 1935July 22, 1935
June 8, 1936
Mar. 6, 1937Apr. 7, 1937Apr. 15, 1937June 7, 1937June 16, 1937July 15, 1937July 18, 1937
May 23, 1938June 24, 1938July 8, 1938Sept. 6, 1938Sept. 10, 1938
Mar. 24, 1939June 27, 1939
May 3, 1940June 9, 1940
Apr. 30, 1941June 1, 1941
Gage height (feet)
11.511.568.S8.08.37.3
_5.95.49.06
5.30
7.5b8.68.59.15.57.55.3
11.47.57.3
10.0
6.75.316.80
3.60
9.458.805.92
5.12
8.305.376.16
12.5715.8011.6011.25
5.9510.326.169.466.52
b7.677.22
4.554.58
5.708.81
Discharge (cfs)
5,7805,8503,7503,8704,2902,990
al,4001,6401,3903,980
1,370
2,8702,2403,5703,9901,5302,8701,4105,6002,6702,7304,620
2,3101,4109,960
630
4,2003,7801,770
1,310
3,1601,3801,8306,3009,1005,5005,190
1,6004,5001,7103,9201,950
2,1302,320
1,0601,060
1,7103,420
Water year
1941
1942
1943
1944
1945
1946
1947
1948
1949
1950
1951
Date
June 4, 1941June 8, 1941June 13, 1941
May 1, 1942May 17, 1942June 6, 1942July 2, 1942July 29, 1942Aug. 2, 1942
Feb. 23, 1943Mar. 1, 1943Mar. 24, 1943Mar. 28, 1943June 14, 1943July 7, 1943
Apr. 11, 1944June 8, 1944June 20, 1944June 27, 1944July 15, 1944
Mar. 14, 1945Mar. 17, 1945June 7, 1945
May 29, 1946June 5, 1946June 24, 1946June 28, 1946June 30, 1946July 3, 1946
Feb. 16, 1947Feb. 18, 1947Mar. 25, 1947Mar. 30, 1947Apr. 6, 1947Apr. 11, 1947Apr. 15, 1947June 23, 1947
Mar. 19, 1948Apr. 25, 1948June 23, 1948
Mar. 9, 1949Mar. 26, 1949Mar. 29, 1949
Mar. 26, 1950Apr. 8, 1950Apr. 19, 1950May 8, 1950
Mar. 28, 1951Mar. 28, 1951June 20, 1951
Gage height (feet)
6.6414.3620.04
12.7315.4317.08.95
10.377.88
20.010.44IS. 3017.6518.4313.0
23.210.3418.75
--
b!>1.08b!3.710.7
6.456.26.946.66.16.2
b!2.5bS1.424.4b9.69.77.16.116.0
b!9.798.46.4
bll.30b22.05b!6.20
bll.318.021.813.1
b!2 . 78bll.33
7.43
Discharge (cfs)
1,9507,180
12,900
5,6108,1309,7302,6403,6901,880
12,9004,100
11,00010,30011,2006,100
22,8004,S60
12,800
H(c)-
6,5005,200
1,8201,6602,2201,9801,5901,660
6,000-
29,5004,0604,6902,3801,590
11,700
a9,0002,8101,450
a5,000-
11,300
3,20013,60020,9007,470
-a3,6001,970
a About. b Backwater from ice. c Not determined; probably exceeded base discharge

MOREAU RIVER BASIN 359
Peak stages and discharges of Moreau River at Promise, S. Dak. Continued
Water year
1951
1952
1953
1954
Date
Aug. 14, 1951Aug. 30, 1951
Feb. 16, 1952Apr. 5, 1952
Mar. 23, 1953May 2, 1953June 10, 1953June 15, 1953June 21, 1953
June 12, 1954
Gage height (feet)
7.89.02
D12.824.16
13.598.95
10.0623.8011.54
9.60
Discharge (cfs)
a2,3003,440
a5,70036,900
8,7303,7004,810
34,3006,400
4,350
Water year
1955
1956
1957
1958
Date
Mar. 10, 1955
Mar. 21, 1956July 8, 1956
May 21, 1957May 25, 1957
Mar. 26, 1958June 13, 1958July 6, 1958
Gage height (feet)
b6.90
blO.858.4
8.118.5
7.806.728.30
Discharge (cfs)
700
5,5403,160
2,46015,000
2,3701,5703,050
About, b Backwater from ice.
CHEYENNE RIVER BASIN
3860. Lance Creek at Spencer, Wyo.
Location.--Lat 43°22', long 104°16', in sec.14, T.39 N., R.62 W., on rigl t bank three-eighths of a mile north of Spencer, 1 mile upstream from mouth, and 34 miles south of Newcastle.
Drainage area.--2,070 sq mi, approximately.
Gage. Nonrecording prior to Aug. 14, 1948; recording thereafter. Altitude of gage is 3,750 ft (from map prepared by Army Map Service, Corps of Engineers).
Stage-discharge relation.--Defined by current-meter measurements below <*,500 cfs.
Bankfull stage.--8 ft.
Remarks. Diversions above station for irrigation of about 5,700 acres. Natural flow of stream affected by storage in 2,120 small stock and irrigation reser voirs (total capacity, about 12,800 acre-ft). Diversions and storage materi ally affect peak flows. Base for partial-duration series, 750 cfs.
Peak stages and discharges
Water year
1948a/
1949
1950
1951
1952
1953
1954
Date
June 23, 1948July 11, 1948July 18, 1948Aug. 14, 1948
Aug. 18, 1949
June 18, 1950July 12, 1950July 22, 1950
June 19, 1951June 23, 1951July 2, 1951July 28, 1951July 31, 1951Aug. 11, 1951Sept. 4, 1951Sept. 7, 1951
May 23, 1952June 28, 1952July 12, 1952Aug. 12, 1952Aug. 21, 1952
June 20, 1953
July 14, 1954Aug. 5, 1954
Gage height (feet)
6.405.405.084.46
4.51
6.365.155.18
4.685.126.86.636.74.937.145.30
6.288.35.424.305.17
3.92
5.645.44
Discharge (cfs)
2,6701,5501,280
792
786
2,6201,3401,360
1,0401,3403,1902,9703,0601,2103,6301,480
2,5105,2501,580
8351,380
695
1,9301,770
Water year
1957
1958
1959
1960
1961
1962
1963
Date
May 17, 1957May 25, 1957May 31, 1957June 11, 1957June 22, 1957July 20, 1957Aug. 17, 1957
June 21, 1958July 3, 1958July 11, 1958July 19, 1958
June 18, 1959
June 9, I960July 7, 1960
June 14, 1961Aug. 20, 1961
May 23, 1962June 12, 1962May 26, 1962June 17, 1962
June 3, 1963June 7, 1963July 25, 1963Sept. 2, 1963
Gage height (feet)
4.466.904.985.524.395.176.62
4.594.856.936.82
3.71
5.174.51
5.255.56
6.475.966.685.93
5.434.454.704.49
Discharge (cfs)
9563,8201,3301,630
8061,3103,400
1,030922
3,2502,990
506
1,210784
1,1901,570
2,5802,5903,5802,590
1,740965
1,160993
a Period May to September 1948.

360 CHEYENNE RIVER BASIN
3865. Cheyenne River near Spencer, Wyo. (Published as "South Pork Cheyenne River" October 1949
to September 1951)
Location.--Lat 43°25', long 104°08', in Nj sec.25, T.40 N., R.61 W. , on right bank Just downstream from old highway bridge, if miles downstream from Robbers Roost Creek, 7? miles northeast of Spencer, and 30 miles south of Newcastle.
Drainage area.--5,270 sq mi, approximately.
Gage.--Nonrecording prior to Aug. 22, 1948; recording thereafter. At site 400 ft upstream Aug. 22, 1948, to Oct. 17, 1955. At site 2 ,£00 ft upstream Oct. 18, 1955, to Aug. 1, 1961. At site 2,200 ft upstream Aug. 2, 1961, to Aug. 22, 1962. Altitude of gage is 3,600 ft (from map by Army Map Service, Corps of Engineers).
Stage-discharge relation. Defined by current-meter measurements below 14,000cfs.
Remarks. Diversions above station for irrigation of about 17,5CO acres.Natural flow of stream affected by 5,400 small reservoirs (total capacity, about 33,900 acre-ft) above station. Diversions and storage materially af fect peak flows. Base for partial-duration series, 2,000 cfs.
Peak stages and discharges
Water year
1949
1950
1951
1952
1953
1954
1955
Date
Feb. 24, 1949
June 18, 1950July 22, 1950
June 19, 1951June 23, 1951July 28, 1951Aug. 1, 1951Sept. 4, 1951Sept. 8, 1951
May 23, 1952June 28, 1952
May 29, 1953
Aug. 6, 1954
Apr. 12, 1955Apr. 15, 1955June 3, 1955Aug. 8, 1955
Gage height (feet)
5.33
6.266.29
4.55.05.86.06.365.58
8.08.6
4.85
5.23
5.545.305.23S.15
Discharge (cfs)
1,S10
3,5103,570
2,1402,9504,0404,2304,3702,630
7,7509,840
1,630
1,860
2,8502,3502,2108,110
Water year
1956
1957
1958
1959
1960
1961
1962
1963
Date
June 18, 1956
May 25, 1957June 11, 1957Aug. 17, 1957
July 11, 1958July 19, 1958July 31, 1958
June 23, 1959
June 9, I960
Aug. 20, 1961
May 23, 1962May 27, 1962June 17, 1962
June 7, 1963Sept. 2, 1963
Gage height (feet)
4.85
5.254.715.09
5.666.145.57
4.16
3.6
3.65
6.528.747.95
6.255.62
Discharge (cfs)
3,030
3,4802,8403,110
4,6205,7703,960
1,390
955
1,420
7,46016,00012,100
3,7802,280
3940. Beaver Creek near Newcastle, Wyo.
Location.--Lat 43°32'05", long 104°07'00", in NW£ sec.18, T.41 N., R.60 W., at highway bridge, 2^ miles downstream from Sheep Creek and 23 miles south of Newcastle.
Drainage area. 1,320 sq mi, approximately.
Gage.--Nonrecording prior to Nov. 1, 1945; recording thereafter. Altitude of gage is 3,660 ft (from topographic map).
Stage-discharge relation.--Defined by current-meter measurements below 1,900 cfs.
Remarks.--Natural flow of stream affected by 1,350 small reservoirs above station used for storage of stock and irrigation water (total capcity, about 11,000 acre-ft). Diversions above station for irrigation of about 6,000 acres. Diversions and storage materially affect peak flows. Only annual peaks are shown.

CHEYENNE RIVER BASIN 361
Peak stages and discharges of Beaver Creek near Newcastle, Wyo.
Water year
1943
1945
19461947
194819491950
195119521953
Date
Mar. 27, 1943
June 30, 1945
July 7, 1946Feb. 18, 1947June 21, 1947June 17, 1948June 6, 1949Apr. 12, 1950
Sept. 7, 1951May 24, 1952June 22, 1953
Gage height (feet)
14.00
6.66
11.76a9.00
-12.1812.107.08
6.908.97
12.98
Discharge (cfs)
1,840
529
1,390-740
1,4801,460
574
554869
1,640
Water year
19541955
1956195719581959
1960
196119621963
Date
Aug. 8, 1954May 19, 1955
Feb. 25, 1956June 11, 1957July 31, 1958Mar. 21, 1959June 23, 1959Mar. 22, 1960June 9, 1960
July 8, 1961June 16, 1962June 13, 1963
Gage height (feet)
7.1312.48
9.6711.4111.16a7.97
_a7.53
11.1019.9811.78
I is charge (efs)
5991,630
6531,4401,370
494
579
1,36011,9001,470
a. Backwater from Ice.
3950. Cheyenne River at Edgemont, S. Dak.
Location. Lat 43°18'20", long 103°49'15", In SW^SE^SE^ sec.36, T.8 S., R.2 E. near right bank on downstream side of pier of bridge on U.S. Highway 18 at Edgemont, 300 ft downstream from Chicago, Burlington & Qulncy Railroad bridge, and 600 ft upstream from Cottonwood Creek.
Drainage area. 7,143 sq ml.
Gage. Nonrecording prior to October 1947, and since January 1961; recording October 1947 to January 1961. At datum 2.7 ft lower prior to 1907; gege heights given herein converted to present datum. Datum of gage Is 3,416.56 ft above mean sea level, datum of 1929.
Stage-discharge relation.--Defined by current-meter measurements.
Bankfull stage.--6 ft.
Historical data. Maximum stage known, that of May 1, 1922.
Remarks. Base for partial-duration series, 1,500 cfs. Only annual peaks are shown prior to 1948.
Peak stages and discharges
Water year
1905
1920
1922
19291930
19311932
1947
1948
1949
1950
1951
1952
Date
July 30, 1905
May 12, 1920
May 1, 1922
June 3, 1929Aug. 18, 1930
Oct. 4, 1930June 18, 1932
June 22, 1947
June 18, 1948June 23, 1948July 18, 1948
June 7, 1949
June 19, 1950July 22, 1950
June 19, 1951June 23, 1951July 3, 1951July 30, 1951Aug. 1, 1951Sept. 5, 1951Sept. 8, 1951
May 24, 1952June 4, 1952
Gage height (feet)
8.5
11.0
12.0
7.865.00
4.85.70
4.70
5.154.244.60
3.82
4.003.81
4.274.495.444.355.324.564.20
6.34.96
Discharge (cfs)
13,000
_
_
10,5004,090
3,6905,560
2,800
3,4902,2302,370
1,510
1,8201,550
2,1602,5104,0002,4403,9102,5802,090
a6,7003,820
Water year
1952
1953
1954
1955
1956
1957
1958
1959
1960
1961
1962
Date
June 28, 1952
May 31, 1953
May 22, 1954Aug. 6, 1954
Apr. 12, 1955Apr. 15, 1955May 18, 1955June 4, 1955Aug. 8, 1955
May 29, 1956June 19, 1956
May 25, 1957June 11, 1957Aug. 17, 1957
July 11, 1958July 20, 1958July 31, 1958
June 24, 1959
June 10, 1960
June 14, 1961July 9, 1961
May 23, 1962May 27, 1962
Gage height (feet)
7.29
3.75
5.573.62
4.294.193.943.696.02
3.564.12
7.054.824.28
5.315.715.68
3.47
3.35
3.753.50
7.459.17
riseharge (cfs)
8,940
2,050
5,1501,520
2,3602,2201,8501,5205,660
1,5602,820
7,9803,2902,480
4,1905,1605,120
1,450
1,320
-1,260
9,12012,900
a About.
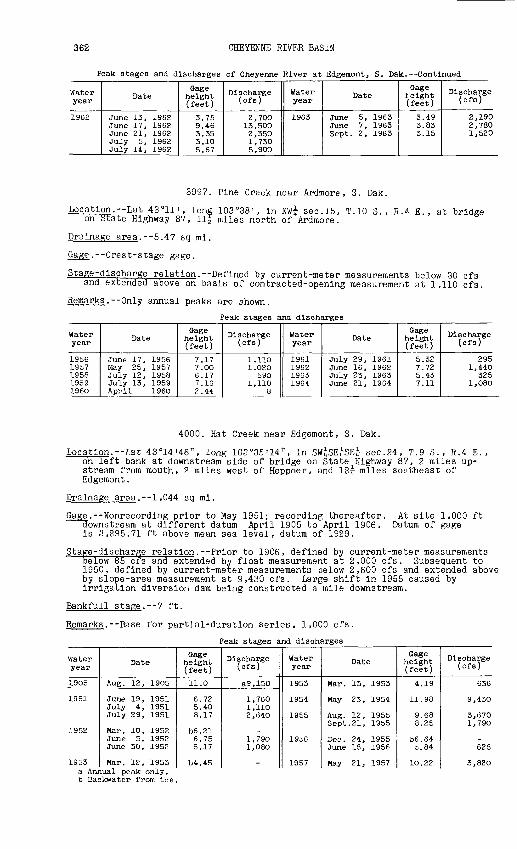
362 CHEYENNE RIVER BASIN
Peak stages and discharges of Cheyenne River at Edgemont, S. Dak. Continued
Water year
1962
Date
June 13, 1962 June 17, 1962 June 21, 1962 July 5, 1962 July 14, 1962
Gage height (feet)
3.75 9.46 3.35 3.10 5.67
Discharge (cfs)
2,700 13,500 2,350 1,730 5,900
Water year
1963
Date
June 5, 1963 June 7, 1963 Sept. 2, 1963
Gage I eight ( feet )
3.49 3.83 3.15
Discharge (cfs)
2,190 2,780 1,520
3997. Pine Creek near Ardmore, S. Dak.
Location.--Lat 43°11', long 103°38', Ln NW£ sec.15, T.IO S., R.* E., at bridge on State Highway 87, llf miles north of Ardmore.
Drainage area.--5.47 sq mi.
Gage.--Crest-stage gage.
Stage-discharge relation.--Defined by current-meter measurements below 30 cfs and extended above on basis of contracted-opening measurement at 1,110 cfs.
Remarks.--Only annual peaks are shown.
Peak stages and discharges
Water year
1956 1957 1958 1959 1960
Date
June 17, 1956 May 25, 1957 July 12, 1958 July 13, 1959 April 1960
Gage height ( feet )
7.17 7.00 6.17 7.16 2.44
Discharge (cfs)
1,110 1,020
590 1,110
8
Water year
1961 1962 1963 1964
Date
July 29, 1961 June 16, 1962 July 23, 1963 June 21, 1964
Gage height (feet)
5.32 7.72 5.43 7.11
Discharge (cfs)
295 1,440
325 1,080
4000. Hat Creek near Edgemont, S. Dak.
Location. Lat 43°14'46", long 103°35'14", in SW^SE^SE^ sec.24, T.9 S., R.4 E. , on left bank at downstream side of bridge on State Highway 87, 2 miles up stream from mouth, 2 miles west of Heppner, and 12^ miles southeast of Edgemont.
Drainage area.--1,044 sq mi.
Gage. Nonrecording prior to May 1951; recording thereafter. At site 1,000 ft downstream at different datum April 1905 to April 1906. Datum of gage is 3,295.71 ft above mean sea level, datum of 1929.
Stage-discharge relation. Prior to 1906, defined by current-meter measurements below 85 cfs and extended by float measurement at 2,000 cfs. Subsequent to 1950, defined by current-meter measurements below 2,600 cfs and extended above by slope-area measurement at 9,430 cfs. Large shift in 1955 caused by irrigation diversion dam being constructed a mile downstream.
Bankfull stage.--? ft.
Remarks.--Base for partial-duration series, 1,000 cfs.
Peak stages and discharges
Water year
1905
1951
1952
1953
Date
Aug. 12, 1905
June 19, 1951July 4, 1951July 29, 1951
Mar. 10, 1952June 5, 1952June 30, 1952
Mar. 12, 1953
Gage height (feet)
11.0
6.725.408.17
b6.216.755.17
b4.45
Discharge (cfs)
a9,150
1,7601,1102,640
-1,7901,080
-
Water year
1953
1954
1955
1956
1957
Date
Mar. 13, 1953
May 23, 1954
Aug. 12, 1955Sept. 21, 1955
Dec. 24, 1955June 18, 1956
May 21, 1957
Gage height (feet)
4.19
11.98
9.688.25
b6.645.84
10.22
Discharge (cfs)
636
9,430
3,6701,790
_628
3,820a Annual peak only.b Backwater from ice.

CHEYENNE RIVER BASIN 363
Peak stages and discharges of Hat Creek near Edgemont, S. Dak. Continued
Water year
1957
1958
1959
1960
Date
May 26, 1957
July 21, 1958
June 19, 1959
Mar. 22, 1960June 21, 1960
Gage height (feet)
11.65
5.60
8.22
2.76C5.85
Discharge (cfs)
5,820
747
1,740
133-
Water year
1961
1962
1963
Date
Mar. 21, 1961
June 12, 1962June 18, 1962
June 16, 1963
Gage height (feet)
C7.95
7.407.97
6.22
lischarge (cfs)
d200
1,1201,400
734
c Backwater from temporary dam. d About.
4005. Cheyenne River near Hot Springs, S. Dak.
Location. Lat 43°18'19", long 103°33'43", in SE^SE^ sec.31, T.8 S., R.5 E. , near right bank on downstream side of bridge on State Highway 87, a quarter of a mile downstream from Cascade Creek and 10 miles southwest of Hot Springs.
Drainage area. 8,710 sq mi, approximately.
Gage.--Recording September 1914 to March 1915 and after June 1954; nonreoording April 1915 to September 1920 and March 1943 to June 1954. At site 3 miles downstream at different datum prior to September 1920. Datum of gage is 3,190.89 ft above mean sea level, datum of 1929.
Stage-discharge relation. Prior to 1920, defined by current-meter measurements below 19,000 cfs and extended above by slope-area measurement at 114,000 cfs. Subsequent to 1943, defined by current-meter measurements throughout.
Bankfull stage.--20 ft.
Remarks. Base for partial-duration series, 2,000 cfs. shown prior to 1948.
Peak stages and discharges
Only annual peaks are
Water year
1915
19161917191819191920
194319441945
19461947
1948
1949
1950
1951
1952
Date
June 12, 1915
June 21, 1916May 22, 1917July 14, 1918July 5, 1919May 12, 1920
June 14, 1943July 11, 1944June 7, 1945
June 19, 1946June 22, 1947
Mar. 16, 1948Mar. 20, 1948June 18, 1948June 24, 1948July 19, 1948
Feb. 27, 1949Mar. 2, 1949Mar. 5, 1949
June 19, 1950
June 19, 1951June 24, 1951July 3, 1951July 30, 1951Aug. 1, 1951Sept. 5, 1951Sept. 9, 1951
May 24, 1952June 4, 1952
Gage height (feet)
19.7
7.210.812.08.8
29.2
10.6611.09.0
9.8610.50
7.967.949.058.788.25
7.938.548.20
7.92
9.009.12
10.0310.49.908.958. SO
10.799.57
Discharge (cfs)
39,200
6,14016,10019,00010 , 300
114,000
9,1409,0003,750
5,7707,430
2,3602,2103,7503,0202,520
2,0702,8502,220
1,930
3,4203,6105,4006,2505,1903,4203,050
6,9504,290
Water year
1952
1953
1954
1955
1956
1957
1958
1959
1960
1961
1962
1963
Date
June 28, 1952
May 31, 1953
May 23, 1954
Apr. 12, 1955Apr. 16, 1955May 18, 1955Aug. 9, 1955Aug. 12, 1955
June 19, 1956
May 21, 1957May 25, 1957June 12, 1957Aug. 18, 1957
July 11, 1958July 20, 1958July 31, 1958
June 24, 1959
June 10, 1960
July 10, 1961
May 24, 1962May 28, 1962June 3, 1962June 13, 1962June 18, 1962July 13, 1962
June 8, 1963
Gage height (feet)
11.72
7.57
10.90
8.498.798.1110.158.52
8.59
9.7712.789.718.49
9.5710.7610.29
7.67
7.28
7.91
12.6015.459.309.92
16.3511.72
9.56
D' scharge (cfs)
9,450
1,620
7,380
2,7503,1202,2905,1502,580
2,870
4,7109,8704,0902,260
4,5705,6104,930
1,550
1,160
1,030
7,51013,5002,1202,95015,5005,870
2,460

364 CHEYENNE RIVER BASIN
4020. Pall River at Hot Springs, S. Dak.
Location. Lat 43°25'50", long 103°28<35", in NW£ sec.24, T.7 S., R.5 E., on left bank 30 ft downstream from Seventh Street Bridge in Hot Springs and 6 miles upstream from mouth.
Drainage area.--137 sq mi.
Gage. Nonrecordlng at site one block upstream at datum 3.00 ft higher November 1937 to June 2,1939; recording thereafter. Datum of gage is 3,413.20 ft above mean sea level, datum of 1929.
Stage-discharge relation. Defined by current-meter measurements below 50 cfs and extended above by weir formula and slope-area measurements at 560, 2,060, 8,000, and 13,100 cfs. Change in relation occurred owing to channel improve ments after 1947 flood.
Bankfull stage.--13 ft.
Remarks.--Regulated by Cold Brook Reservoir (capacity, 6,000 acre-ft) since April 1953. Base for partial-duration series, 135 cfs. Only annual peaks are shown prior to 1940.
Peak stages and discharges
Water year
19381939
1940
1941
1942
1943
1944
1945
1946
1947
1948
Date
Sept. 4, 1938June 15, 1939
Apr. 27, 1940 July 11, 1940July 16, 1940 Sept. 23, 1940Sept. 30, 1940
Apr. 13, 1941 Aug. 6, 1941
June 2, 1942June 4, 1942
Mar. 23, 1943May 29, 1943June 13, 1943
May 24, 1944June 12, 1944
June 10, 1945July 26, 1945
May 2, 1946 July 17, 1946
June 20, 1947July 10, 1947July 16, 1947July 22, 1947
Aug. 13, 1948
Gage height (feet)18.41.97
3.47 3.442.16 2.232.15
3.20 9.13
2.292.66
3.132.132.50
2.302.65
2.652.64
2.75 2.54
11.122.842.392.15
5.57
Discharge (cfs)
13,100103
691 677157 179154
569 4,700
199339
538146274
198234
286266
314 232
8,300439256172
1,720
Water year
1949
1950
1951
1952
1953
1954
1955
1956
1957
1958
1959
1960
1961
1962
1963
Date
Aug. 17, 1949
July 5, 1950
Aug. 14, 1951
May 18, 1952
Sept. 1, 1953
May 22, 1954
Sept. 19, 1955
May 26, 1956June 17, 1956
June 6, 1957
July 2, 1958
June 22, 1959
June 11, 1960
June 13, 1961 July 7, 1961July 30, 1961
May 21, 1962July 13, 1962
June 6, 1963
Gage height (feet)
1.96
2.57
2.72
2.15
2.44
2.24
3.19
2.252.27
2.23
3.21
2.5S
2.14
3.68 5.904.36
2.502.96
3.73
Discharge (cfs)
132
141
a200
46
119
65
558
46-
51
558
188
36
755 2,0601,140
148392
805
a About.

CHEYENNE RIVER BASIN 365
4025. Beaver Creek near Buffalo Gap, S. Dak.
Location. Lat 43°28'00", long 103°18'20", in NEySE^ sec.5, T.7 S., R.7 E., on left bank 1^ miles south of Buffalo Gap and 4-| miles upstream from mouth.
Drainage area. 130 sq mi, approximately.
Gage. Nonrecording November 1937 to June 1939; recording thereafter. At site three-quarters of a mile downstream at different datum prior to June 1939. Altitude of gage is 3,150 ft (from topographic map).
Stage-discharge relation. Defined by current-meter measurements below 11 cfs and extended to 11,700 cfs by slope-area measurement at site three-quarters of a mile downstream. Defined by current-meter measurements below 20 cfs and extended by drift velocity-area measurement at 500 cfs and slope-area measurement at 2,750 cfs at present site.
Bankfull stage.--? ft.
Historical data.--Flood of 1927 is greatest known, from information by local residents.
Remarks. Diversions for irrigation above station may appreciably affect low peaks. Base for partial-duration series, 24 cfs. Only annual peaks are shown prior to 1940.
Peak stages and discharges
Water year
1927
19381939
1940
1941
1942
1943
1944
1945
1946
1947
1948
1949
1950
Date
_
Sept. 4, 1938June 21, 1939
Jan. 26, 1940Apr. 27, 1940July 16, 1940
Apr. 13, 1941Apr. 17, 1941June 9, 1941June 15, 1941Aug. 7, 1941
Jan. 8, 1942June 2, 1942June 4, 1942July 18, 1942July 27, 1942
Mar. 17, 1943Mar. 25, 1943Apr. 10, 1943June 7, 1943June 13, 1943June 27, 1943June 30, 1943July 4, 1943
Jan. 30, 1944May 25, 1944
Jan. 1, 1945June 11, 1945
Feb. 6, 1946May 2, 1946
Jan. 3, 1947June 20, 1947June 30, 1947July 11, 1947July 22, 1947
Feb. 12, 1948July 14, 1948
Jan. 20, 1949July 14, 1949
Feb. 2, 1950
Cage height (feet)
18.0
16.46a4.90
b4.224.444.45
6.413.983.613.804.07
b4.173.953.874.444.14
b3.774.053.994.164.313.793.783.87
b3.703.61
b3.813.97
b3.564.25
b3.867.364.103.845.28
b3.673.36
b4.453.34
b4.30
Discharge (cfs)
_
11,70065
_116102
85668314370
_52419162
_81728096302935
-23
-64
_102
_1,240
8759
330
_25
_21
-
Water year
1950
1951
1952
1953
1954
1955
1956
1957
1958
1959
1960
1961
1962
1963
Date
Aug. 13, 1950
Feb. 14, 1951June 23, 1951Sept. 7, 1951
Jan. 1, 1952May 23, 1952June 3, 1952
Jan. 16, 1953-
Jan. 25, 1954Aug. 20, 1954
Feb. 19, 1955Aug. 10, 1955Sept. 20, 1955
Dec. 23, 1955Feb. 1, 1956
May 25, 1957June 13, 1957June 16, 1957June 27, 1957
July 3, 1958July 18, 1958July 30, 1958
Aug. 2, 1959
Dec. 24, 1959Mar. 3, 1960
Nov. 17, 1960Dec. 4, 1960
May 21, 1962May 28, 1962June 17, 1962July 4, 1962July 13, 1962
June 3, 1963June 7, 1963June 15, 1963July 6, 1963July 14, 1963
Cage height (feet)
3.81
b4.O43.854.68
b4.774.013.67
b4.16-
b4.506.25
b3.7410.154.57
3.39b3.73
4.085.594.053.82
5.764.846.06
4.45
3.67b4.17
3.79b4.37
4.474.824.644.866.54
4.768.365.994.496.99
D'.scharge (ofs)
38
_2585
-5126
-ell
-670
-2,750
121
13_
484324726
27974
381
83
21-
16-
34664871
601
621,440
39340
829
a Backwater from downstream tributary.b Backwater from ice.c Maximum daily discharge; occurred on many days.
219-848 O - 66 - 25

366 CHEYENNE RIVER BASIN
4060. Battle Creek at Hermosa, S. Dak.
Location. Lat 43°49'40", long 103°11'40", In NE^SW^SW^ sec.32, T.2 S., R.8 E. ; on right bank 130 ft downstream from Chicago and North Western Railway Co. bridge, three-quarters of a mile south of Hermosa, and Zj miles downstream from Grace Coolldge Creek.
Drainage area. 178 sq ml.
Gage. Nonrecordlng July 1949 to December 1961; recording thereafter. At site half a mile upstream at different datum July 1949 to November 1950. At site 120 ft downstream at present datum November 1950 to December 1961. Altitude of gage Is 3,290 ft (from topographic map).
Stage-discharge relation. Defined by current-meter measurements.
Bankfull stage. 8 ft.
Remarks. Base for partial-duration series, 50 cfs. shown prior to 1961.
Peak stages and discharges
Only annual peaks are
Water year
1950
1951195219531954
1955
19561957195819591960
1961
Date
July 2, 1950
June 24, 1951May 22, 1952June 19, 1953Mar. 14, 1954Aug. 26, 1954June 17, 1955
July 2, 1956July 28, 1957May 4, 1958June 29, 1959May 27, 1960
June 13, 1961July 6, 1961July 19, 1961
Gage height (feet)
3.01
2.8514.005.56
al.551.201.37
7.9012.162.942.004.02
2.962.703.25
Discharge (cfs)
149
1632,950
519-
716
8691,950
15334
262
159130190
Water year
1962
1963
Date
May 22, 1962May 26, 1962May 28, 1962June 17, 1962June 20, 1962June 24, 1962July 1, 1962July 13, 1962July 24, 1962July 26, 1962Aug. 1, 1962
Apr. 28, 1963June 3, 1963June 6, 1963June 16, 1963June 21, 1963July 7, 1963
Gage height (feet)
6.475.556.108.553.859.606.85
12.442.502.502.58
3.892.584.477.924.042.55
Discharge (cfs)
624467558978240
1,170688
1,820616171
26871
34889126073
a Backwater from ice.
4067.5. Sunday Gulch near Hill City, S. Dak.
Location. --Lat 43°53'25", long 103°35 I 20", In NE^-NE^SW^ sec. 12, T.2 S. , R.4 E., at culvert on U.S. Highways 16 and 85A, 3 miles south of Hill City.
Drainage area. 5.72 sq ml.
Gage. Crest-stage gage.
Stage-discharge relation. Defined by current-meter measurement? below 17 cfs.
Remarks . Only annual peaks are shown.
Peak stages and discharges
Water year
1956 1957 1958 1959 1960
Date
April 1957 August 1958
July 11, 1960
Gage height (feet)
3.55 2.70
2.36
Discharge (cfs)
(a)
17 (a)
7
Water year
1961 1962 1963 1964
Date
May 1961 June 16, 1962 Apr. 10, 1963 June 9, 1964
Gage height (feet)
2.46 2.65 3.32 2.88
Discharge (cfs)
915
24
a Discharge less than 1 cfs.

CHEYENNE RIVER BASIN 367
4085. Spring Creek near Hermosa, S. Dak.
Location. --Lat 43°56'35", long 103°09'10", in SE^SE . . . , . ., on right bank 150 ft upstream from highway bridge, a quarter of a mile up stream from Chicago and North Western Railway Co. bridge, and 7i miles north
sec. 21, T.I S. , R.8 E.
of Hermosa.
Drainage area.--199 sq mi.
Gage. Nonrecordlng. Datum of gage is 3,278.30 ft above mean sea level, datum of 1929.
Stage-discharge relation . --Defined by current-meter measurements below 110 cfs and extended above by logarithmic plotting.
Bankfull stage. 4 ft.
Remarks. --Considerable loss in sinkholes in reach 10 to 15 miles upstream from station. Plow regulated by Lake Sheridan (capacity , 12,657 acre-ft), 24 miles upstream. Only annual peaks are shown.
Peak stages and discharges
Water year
1950
1951
1952195319541955
19561957
Date
Aug. 12, 1950
Mar. 9, 1951June 19, 1951May 23, 1952June 19, 1953Aug. 12, 1954
(b)Mar. 30, 1955
July 3, 1956May 25, 1957
Gage height (feet)
1.54
al.26
4.562.503.52.42
.802.96
Discharge (cfs)
69
_2.0
580205378
c.5
3.8302
Water year
1958
1959
1960
1961196219631964
Date
Feb. 22, 1958June 13, 1958Feb 21,22 ,Mar. 1,
1959May 30, 1959Mar. 19, 1960
July 8, 1961July 13, 1962June 15, 1963June 20, 1964
Gage height (feet)aO.82
-al.10
-a2.25
.604.103.221.24
Discharge (cfs)
-4.1-
1.94
1.350035035
a Backwater from ice. b Many days. c Estimated.
4090. Castle Creek above Deerfield Reservoir, near Hill City, S. Dak. (Published as "above Deerfield Reservoir near Deerfield prior
to October 1953}
Location.--Lat 44°00'50", long 103°49'25", in SW^ sec.25, T.I N., R.2 E., on right bank 50 ft downstream from highway bridge, 250 ft downstream from South Pork Castle Creek, 600 ft upstream from high-water line or Deerfield Reservoir, 2^ miles southwest of Deerfield Dam, and 14 miles northwest of Hill City.
Drainage area. 83 sq mi, approximately.
Gage. Nonrecording at site 50 ft upstream at datum 2.05 ft higher June to August 1948; recording thereafter. Altitude of gage is 5,910 ft (fron reservoir elevation).
Stage-discharge relation. Defined by current-meter measurements.
Bankfull stage. 5 ft.
Remarks. Base for partial-duration series, 50 cfs.

368 CHEYENNE RIVER BASIN
Peak stages and discharges of Castle Creek above Deerfield Reservoir, near Hill City, S. Dak.
Water year
1949
1950
1951
1952
1953
1954
1955
1956
Date
Dec. 22, 1948June 2, 1949
Mar. 8, 1950Apr. 7, 1950Apr. 14, 1950Aug. 11, 1950
Feb. 10, 1951Apr. 6, 1951
May 22, 1952
Dec. 30, 1952Aug. 15, 1953
Jan. 23, 1954May 23, 1954
Apr. 10, 1955Apr. 16, 1955
Mar. 24, 1956May 28, 1956
Gage height (feet)
a3.382.56
a2.973.283.382.74
a3.462.64
5.81
a3.222.42
a3.662.18
a4.642.87
a3.252.30
Discharge (cfs)
_48
_10010862
_55
615
_37
_27
-58
_32
Water year
1957
1958
1959
1960
1961
1962
1963
1964
Date
Jan. 18, 1957Aug. 27, 1957
Jan. 22, 1958July 18, 1958
Jan. 7, 1959Apr. 16, 1959
Mar. 22, 1960Mar. 28, 1960
Jan. 31, 1961June 13, 1961
Apr. 15, 1962
Feb. 2, 1963June 5, 1963June 15, 1963
June 9, 1964
0-age height (feet)
a2.982.49
a2.852.04
a2.722.13
a3.122.96
a2.952.24
3.21
a4.123.532.93
3.52
Discharge (cfs)
_40
_20
-20
-68
-25
92
-12466
114
a Backwater from ice.
4105. Rapid Creek above Pactola Reservoir, at Silver City, S. Dak.
Location.--Lat 44°05'05", long 103°34'45", in SW£SE£ sec.36, T.2 N., R.4 E., on right bank 0.8 mile west of Silver City and 3 miles downstream from Slate Creek.
Drainage area. 292 sq mi.
Gage.--Recording. Datum of gage is 4,620.00 ft above mean sea level (Bureau of Reclamation bench mark).
Stage-discharge relation. Defined by current-meter measurements below 980 cfs.
Remarks. Maximum discharges probably not appreciably affected by regulation at Deerfield Reservoir (usable capacity, 15,143 acre-ft). Base for partial- duration series, 120 cfs.
Peak stages and discharges
Water year
1954
1955
1956
1957
1958
1959
1960
Date
May 23, 1954
Apr. 11, 1955July 28, 1955
Mar. 21, 1956Mar. 24, 1956May 28, 1956
May 25, 1957Aug. 16, 1957
May 31, 1958
Mar. 19, 1959Sept. 25, 1959
Mar. 22, 1960
Gage height (feet)
5.64
5.808.90
a7.32a6.856.48
5.965.83
5.61
a6.505.79
a6.21
Discharge (cfs)
106
1461,520
_175146
181152
113
-146
-
Water year
1960
1961
1962
1963
1964
Date
Mar. 23, 1960
Mar. 7, 1961July 7, 1961
May 26, 1962June 3, 1962June 15, 1962
Mar. 29, 1963Apr. 29, 1963June 7, 1963June 11, 1963June 16, 1963
June 9, 1964
0-age height (feet)
6.14
a6.715.43
6.105.996.62
5.796.276.326.457.37
7.16
Discharge (cfs)
117
-96
218189390
144268298341715
b635
a Backwater from ice. b Annual peak only.

CHEYENNE RIVER BASIN 369
4115. Rapid Creek below Pactola Dam, S. Dak.(Published as "near Pactola" 1929-31, 1947-53, and as "at Big Bsnd"
1932-42}
Location. Lat 44°04'35", long 103°28'55", in SW^NE^ sec.2, T.I N., R.5 E., on right bank 2,000 ft downstream from Pactola Dam, 4 miles upstream from Deer Creek, and 13 miles west of Rapid City.
Drainage area.--320 sq mi, approximately; at site used 1929-31, 319 sq mi; at site used 1932-42, 332 sq mi; and at site used 1947-52, 315 sq mi.
Gage.. Nonrecording April 1929 to March 1932, July 1946 to August 1947; recording April 1932 to December 1942, and after August 1947. At sites 3,500 f 1; up stream 1929-31; 7 miles downstream 1932-42; and 2 miles upstream 1946-53; all at different daturas. Datum of gage is 4,406.00 ft above mean sea level (Bureau of Reclamation bench mark). Discharges given herein converted to present site by drainage-area relationship.
Stage-discharge relation. Defined by current-meter measurements below 200 cfs 1929-31; below 800 cfs 1932-42; and throughout after 1947.
Bankfull stage. 7 ft.
Historical data. Flood of May 12, 1920, reached a stage of 7.75 ft at 1932-42 site and datum.
Remarks. Plow at 1929-31 site affected by power flume, which diverted waterfrom Rapid Creek three-quarters of a mile upstream from gaging station. Peak discharges probably not appreciably affected by regulation at powerplant upstream 1932-39, or by Deerfield Reservoir since 1947. Plow completely regulated by Pactola Reservoir since August 1956. Only annual peaks are shown.
Peak stages and discharges
Water year
1920
19291930
1931193219331934
1935
1936
19371938
19391940
19411942
19471948
Date
May 12, 1920
June 3, 1929Apr. 9, 1930
Apr. S, 1931Apr. 24, 1932May 24, 1933Feb. 1, 1934Feb. 11, 1934June I, 1935
Apr. 10, 1936Apr. 13, 1936July 12, 1937Jan. 22, 1938Apr. 16, 1938Apr. 24, 1939Feb. 6, 1940Aug. 27, 1940
June 11, 1941May 16, 1942
June 23, 1947June 22, 1948
Gage height (feet)
7.75
--
-3.305.20
b2.04-
2.65
b3.84-
1.51bl.72
-1.30
b2.70-
3.343.03
5.903. SO
Discharge (cfs)
-
a794a!94
a!55682
1,540-117437
-10084
-8662
-245
540409
954248
Water year
19491950
195119521953
1954
1955
1956
1957
1958
1959
1960
1961
1962
1963
Date
June 2, 1949Apr. 15, 1950
June 14, 1951May 22, 1952June 15, 1953Aug. 1, 1953Mar. 13, 1954May 23, 1954July 29, 1955
Dec. 25, 1955Mar. 25, 1956Mar. 14, 1957Aug. 9, 1957June 2, 1958Sept. 30, 1958Oct. 15-20, 1958Aug. 21, 1959July 20, 1960
June 11, 1961July 20, 1961May 18, 1962Aug. 24, 1962June 30, 1963
Gage height (feet)
3.593.55
2.676.74-
d6.52b4.86
-7.36
d7.36--
e4.42-
e5.30e5.23
-5.12
_e5.70
-e5.228.16
Discharge (cfs)
233233
972,190cl60--94
378
_17855
-84
--90
112
111-67
-184
^ _ __ ____ _ ___ _ ____ __..__ __ _ .. __. _ ___ . b Back water from ice. c Estimated. d Backwater from temporary construction fill downstream. e Backwater from vegetation.

370 CHEYENNE RIVER BASIN
4125. Rapid Creek above Canyon Lake, near Rapid City, S. Dak.
Location.--Lat 44°03'05", long 103°18'50", in NE^NE^ sec.18, T.I N., R.7 E., on right bank at bridge on State Highway 40, 1 mile southwest of city limits of Rapid City and 2f miles downstream from Victoria Creek.
Drainage area. 371 sq mi.
Gage. Nonrecording July 1946 to October 1947; recording thereafter. Datum of gage is 3,407.39 ft above mean sea level (levels by Corps of Engineers).
Stage-discharge relation.--Defined by current-meter measurement below 1,300 cfs.
Bankfull stage.--? ft.
Remarks. Peaks prior to 1957 probably not affected appreciably by regulation by Deerfield Reservoir (usable capacity, 15,153 acre-ft); flow regulated by Pactola Reservoir (conservation and flood storage capacity, 99,000 acre-ft) since August 1956. Base for partial-duration series, 230 cfs. Only annual peaks are shown after 1956.
Peak stages and discharges
Water year
1947
1948
1949
1950
1951
1952
1953
1954
Date
Apr. 1, 1947June 23, 1947
June 22, 1948July 13, 1948
Mar. 19, 1949June 3, 1949Aug. 15, 1949
Mar. 30, 1950Apr. 15, 1950
Mar. 27, 1951June 15, 1951
Mar. 24, 1952May 23, 1952
Mar. 12, 1953June 16, 1953
Jan. 31, 1954
Gage height (feet)
a3.595.82
3.433.43
a4.433.363.63
a4.373.33
a3.812.62
a5.008.08
a2.942.65
a3.22
Discharge (cfs)
-950
245233
_230290
-209
-77
-2,600
-152
-
Water year
1954
1955
1956
19571958
1959
1960
1961
196219631964
Date
Aug. 12, 1954
Mar. 18, 1955July 9, 1955July 29, 1955
Jan. 20, 1956May 29, 1956
July 14, 1957Mar. 13, 1958May 30, 1958Mar. 15, 1959June 30, 1959Mar. 18, 1960July 16, 1960
Feb. 3, 1961July 1, 1961July 13, 1962June 6, 1963June 11, 1964
Gage I eight (feet)
2.53
a3.813.313.44
a3.042.49
3.84a2.70
-a4.11
-a3.47
-
a3.47-
6.023.914.09
Discharge (cfs)
140
-294326
_130
433-81
-82
-82
-100
1,310191268
a Backwater from ice.
4140. Rapid Creek at Rapid City, S. Dak.
Location. Lat 44°05'10", long 103°14'25", in SW^SE^ sec.35, T.2 N., R.7 E., on right bank 200 ft downstream from Oskosh Street Bridge in Rapid City and 3.7 miles downstream from Canyon Lake.
Drainage area. 410 sq mi, approximately.
Gage.--Nonrecording June 1903 to November 1906; recording since July 1942. At site 1 mile downstream at different datum prior to 1907. Datum of gage is 3,230.8 ft above mean sea level, datum of 1929 (levels by Corps of Engineers).
Stage-discharge relation. Defined by current-meter measurements below 1,400 cfs and extended above on basis of slope-area measurement at 3,300 cfs.
Bankfull stage. 9 ft.
Remarks. Peaks prior to 1957 probably not affected appreciably by regulation by Deerfield Reservoir (usable capacity, 15,153 acre-ft) or Canyon Lake (regulated occasionally for recreational purposes); flow regulated by Pac tola Reservoir (conservation and flood storage capacity, 99,000 acre-ft) since August 1956. Base for partial-duration series, 180 cf3. Only annual peaks are shown prior to 1943 and after 1956.

CHEYENNE RIVER BASIN 371
Peak stages and discharges of Rapid Creek at Rapid City, S. Dak.
Water year
1905
1906
1920
1943
1944
1945
1946
1947
1948
Date
July 26, 1905
Aug. 2, 1906
May 12, 1920
Mar. 26, 1943Mar. 30, 1943Apr. 11, 1943June 8, 1943June 13, 1943June 26, 1943July 9, 1943
May 11, 1944May 24, 1944June 12, 1944June 17, 1944
June 9, 1945July 11, 1945July 22, 1945Aug. 1, 1945Aug. 4, 1945
May 3, 1946June 2, 1946June 19, 1946July 7, 1946July 18, 1946
Apr. 1, 1947June 18, 1947June 24, 1947July 23, 1947
June 22, 1948July 13, 1948Aug. 13, 1948
Gage height (feet)
4.65
3.5
13.6
2.452.322.932.173.502.392.03
2.222.152.302.10
2.242.152.272.562.20
3.192.833.302.764.24
2.052.473.752.23
2.292.232.67
Discharge (ofs)
2,500
980
_
387329625266936356206
232204270184
215180228381198
592395564362
1,000
187306
1,170272
294283472
Water year
1949
1950
1951
1952
1953
1954
1955
1956
1957195819591960
1961196219631964
Date
June 3, 1949July 5, 1949Aug. 15, 1949
Apr. 9, 1950Apr. 16, 1950Apr. 20, 1950
Oct. 9, 1951
Apr. 8, 1952May 23, 1952June 27, 1952July 9, 1952
May 9, 1953June 14, 1953June 19, 1953
Jan. 10, 1954June 10, 1954
July 9, 1955July 29, 1955Aug. 10, 1955
Oct. 15, 1955Feb. 2, 1956
July 14, 1957July 19, 1958Dec. 11, 1958June 20, 1960
June 14, 1961July 13, 1962June 5, 1963June 13, 1964
Gage height (feet)
2.272.212.89
2.132.202.07
1.89
1.996.202.382.40
2.462.663.85
a2.482.23
3.372.744.03
2.32a2.48
3.872.942.232.71
2.078.372.702.35
Tischarge (ofs)
276286563
221246209
143
1832,540
198208
216276824
_172
550285878
182_
784362141290
1153,300
418426
a Backwater from ice
4215. Rapid Creek near Farmingdale, S. Dak.
Location. Lat 43°56'30", long 102°51'15", in SW^SW^SW^ sec.19, T.I S., R.ll E., on right bank at downstream side of highway bridge, 2 miles southeast of Farmingdale and 4f miles downstream from Antelope Creek.
Drainage area. 602 sq mi.
Gage. Nonrecording July 1946 to September 1947; recording thereafter. Altitude of gage is 2,700 ft (from topographic map).
Stage-discharge relation.--Defined by current-meter measurements.
Bankfull stage.--10 ft.
Remarks.--Diversions for irrigation of about 10,000 acres above station. Flow regulated by Pactola Reservoir (flood storage capacity, 43,300 acre-ft) since August 1956. Base for partial-duration series, 180 cfs.
Peak stages and discharges
Water year
1947
1948
1949
Date
June 21, 1947
Feb. 16, 1948June 17, 1948June 22, 1948Aug. 12, 1948
Mar. 21, 1949June 3, 1949Aug. 16, 1949
Gage height (feet)
8.4
b4.125.805.074.16
b6.974.543.60
Discharge (cfs)
a2,640
-885572285
C500419208
Water year
1950
1951
1952
Date
Feb. 8, 1950Apr. 1, 1950Apr. 16, 1950May 9, 1950Sept. 20, 1950
Mar. 15, 1951June 23, 1951
Jan. 30, 1952
Gage height (feet)t>4.93b4.124.004.033.87
b4.743.62
b5.02
Discharge (cfs)
-c200285268217
-161
-
a Annual peak only, b Backwater from ice. c About.

372 CHEYENNE RIVER BASIN
Peak stages and discharges of Rapid Creek near Farmlngdale, S. Dak.--Continued
Water year
1952
1953
1954
1955
1956
1957
1958
Date
May 22, 1952May 24, 1952June 28, 1952
Apr. 30, 1953June 16, 1953June 20, 1953Aug. 2, 1953
Aug. 11, 1954
Mar. 4, 1955July 11, 1955Aug. 11, 1955Sept. 21, 1955
July 4, 1956Aug. 10, 1956
May 20, 1957May 25, 1957June 10, 1957June 22, 1957July 15, 1957
June 9, 1958
Gage height (feet)
6.308.193.74
4.053.816.388.35
3.89
b4.124.154.924.50
4.883.89
7.429.393.934.275.14
5.25
Discharge (cfs)
9301,770
191
246195962
1,790204
_267461302
449220
1,0901,900
188248452
465
Water year
1958
1960
1961
1962
1963
Date
June 15, 1958July 19, 1958
Mar. 22, 1960May 27, 1960Aug. 14, 1960
July 1, 1961May 21, 1962May 28, 1962June 3, 1962June 16, 1962June 25, 1962July 1, 1962July 4, 1962July 15,, 1962
Mar. 23, 1963Apr. 28, 1963May 31, 1963June 7, 1963June 16, 1963June 21, 1963
Gage t eight (feet)
5.347.01
5.084.073.90
5.40
9.778.915.155.857.756.385.069.13
5.325.054.665.116.364.29
Discharge (cfs)
496939
439230199
516
2,0301,580
237481
1,140661231
1,730
365313244324599185
b Backwater from ice.
4235. Cheyenne River near Wasta, S. Dak.
Location. Lat 44°04'48", long 102°24'00", in NE^NE^NW^ sec.2, T.I N., R.14 E., on downstream side of second pier from left bank of bridge or U.S. Highway 16, 200 ft downstream from Chicago and North Western Railway Co. bridge, 3 miles east of Wasta, and 7 miles downstream from Box Elder Creek.
Drainage area. 12,800 sq mi, approximately.
Gage.--Nonrecording prior to 1941; recording thereafter. Datum of gage is 2,262.78 ft above mean sea level, datum of 1929.
Stage-discharge relation.--Prior to 1928, defined below 32,000 cfs by current- meter measurements made by South Dakota State Engineer's office. After 1928, defined by current-meter measurements below 11,000 cfs and extended above on basis of an incomplete discharge measurement at gage height 8.65 ft. Large change occurred at high stages between 1915 and 1928.
Bankfull stage. 14 ft.
Historical data. Flood in May 1920 reached a stage of about 16 ft, from in- formation and photographs by local residents.
Remarks. Plow regulated by Angostura Reservoir (capacity, 194,200 acre-ft) since October 1949. Base for partial-duration series, 3,300 cfs. Only annual peaks are shown prior to 1941.
Peak stages and discharges
Water year
1915
1920
19291930
19311932
19341935
Date
June 13, 1915
M^rl920
June 2, 1929Feb. 21, 1930Apr. 17, 1930
Oct. 6, 1930May 6, 1932
July 27, 1934June 1, 1935_
Gage height (feet)
12.5
b!6
8.00c5.5
-
4.2011.28
5.5010.60
Discharge (cfs)
a34,200
_
16,800_
5,000
2,56046,300
5,30043,000
Water year
19361937193819391940
1941
Date
Mar. 4, 1936July 14, 1937Sept. 7, 1938May 25, 1939Feb. 29, 1940Apr. 28, 1940
Apr. 14, 1941Apr. 16, 1941June 10, 1941June 12, 1941July 3, 1941July 14, 1941
Gage t eight (feet)
C5.288.206.706.90
C5.55
6.415.508.006.625.236.65
Discharge (cfs)
1,680b20,000
9,50010,700
3,720
7,6304,780
18,2008,5504,200
11,400a Maximum discharge observed during period Oct. 1 to July 2.
c Backwater from ice.

CHEYENNE RIVER BASIN 373
Peak stages and discharges of Cheyenne River near Wasta, S. Dak. Continued
Water year
1942
1943
1944
1945
1946
1947
1948
1949
1950
1951
Date
Oct. 26, 1941Apr. 25, 1942May 1, 1942May 4, 1942May 7, 1942May 12, 1942May 13, 1942May 18, 1942June 2, 1942June 6, 1942
Mar. 26, 1943Mar. 27, 1943May 30, 1943June 7, 1943June 10, 1943June 16, 1943
Apr. 3, 1944May 25, 1944June 12, 1944July 12, 1944
Mar. 13, 1945Mar. 25, 1945Aug. 4, 1945
May 2, 1946May 24, 1946June 18, 1946
June 10, 1947June 18, 1947June 22, 1947June 30, 1947
Mar. 18, 1948June 17, 1948June 22, 1948June 26, 1948 Aug. 13, 1948
Mar. 5, 1949 Mar. 6, 1949 Mar. 23, 1949 May 1, 1949
May 9, 1950
June 19, 1951June 23, 1951Sept. 2, 1951
Gage height (feet)
5.725.938.237.077.23
10.810.86.616.117.44
C6.824.855.415.436.066.50
C5.084.788.56.00
C4.515.304.87
8.717.147.34
5.924.59
10.256.49
4.905.205.485.28 5.03
cS.91 C6.60 4.23 4.94
5.55
5.244.734.36
Discharge (ofs)
5,3006,420
20,20011,70012,90044,00044,00010,8007,000
14,200
_3,8505,4806,3608,870
11,000
-4,230
24,3008,640
-5,8304,380
26,10014,70016,000
8,1803,660
40,10011,100
b4,5005,4906,9205,830 5,000
8,600 3,310 4,860
6,760
5,7404,3403,420
Water year
1952
1953
1954
1955
1956
1957
1958
1959
1960
19611962
1963
Date
Mar. 29, 1952May 22, 1952May 26, 1952June 4, 1952
Mar. 10, 1953Mar. 12, 1953May 1, 1953June 20, 1953Aug. 3, 1953
June 7, 1954
June 10, 1955Aug. 11, 1955Sept. 20, 1955
Dec. 24, 1955May 28, 1956Aug. 7, 1956
May 17, 1957May 20, 1957May 25, 1957May 28, 1957June 11, 1957June 13, 1957June 16, 1957
June 16, 1958July 20, 1958July 31, 1958
May 5, 1959
Mar. 19, 1960Mar. 22, 1960
June 11, 1961May 17, 1962 May 22, 1962May 26, 1962 May 30, 1962 June 17, 1962 June 21, 1962 June 24, 1962July 1, 1962 July 14, 1962May 31, 1963June 7, 1963June 16, 1963
Gage height (feet)
c6.008.544.836.22
C6.45c4.785.126.005.10
3.66
4.525.409.45
09.554.344.17
4.529.50
10.426.364.144.204.85
5.845.564.64
6.38
C4.83C4.47
3.80
4.95 9.554.92 7.35
10.61 7.82 4.964.40 6.544.956.798.50
Discharge (cfs)
4,20024,7004,5509,580
-4,0106,0509,4806,310
2,410
4,0406,010
24,300
5,0003,7403,320
4,04021,20026,90010,6003,4603,5805,020
7,7606,8004,570
8,710
-3,400
2,600
3,460 20,3003,420 10,100 25,400 15,100 5,5903,940
10,2005,09011,00018 , 100
b About.c Backwater from ice
4255. Elk Creek near Elm Springs, S. Dak.
Location.--Lat 44°14'50", long 102°29'55", in NE^SW^ sec.l, T.3 N., R.13 E., near center of span on downstream side of highway bridge, 2 miles dowrstream from small tributary, 5 miles southeast of Elm Springs, and 7 miles ur- stream from mouth.
Drainage area.--540 sq mi, approximately.
Gage . --Nonrecording: supplementary crest-stage gage since Sept.29, 1954. Datum of gage is 2,304.49 ft above mean sea level, datum of 1929.
Stage-discharge relation.--Defined by current-meter measurements below 5,100 cfs.
Bankfull stage. 6 ft.
Remarks. Base for partial-duration series, 400 cfs.

374 CHEYENNE RIVER BASIN
Peak stages and discharges of Elk Creek near Elm Springs, S. Dak.
Water year
1920
1950
1951
1952
1953
1954
1955
Date
May 1920
Apr. 1, 1950Apr. 15, 1950May 9, 1950
Sept. 2, 1951
Mar. 21, 1952Mar. 29, 1952May 23, 1952May 25, 1952
Mar. 13, 1953May 1, 1953May 3, 1953June 19, 1953
June 10, 1954
Sept. 20, 1955
Gage height (feet)
a!7
5.406.105.60
4.9
b8.510.615.816.19
5.545.836.839.86
6.25
5.10
Discharge (cfs)
-
521852656
328
-8,540434586
453540
1,1605,250
838
270
Water year
1956
1957
1958
1959
1960
1961
1962
1963
Date
July 3, 1956
May 21, 1957May 26, 1957
June 16, 1958
May 29, 1959
June 30, 1960
-
May 21, 1962May 29, 1962June 17, 1962July 13, 1962
June 17, 1963
Gage height (feet)
4.00
7.668.29
6.27
3.55
6.78
-
10.6011.008.505.94
6.42
Discharge (cfs)
48
2,1702,690
616
16
796
0
6,3207,0403,120
470
698
a Annual peak only (approximate); from information by local resident!, b Backwater- from ice.
4260. Belle Fourche River near Moorcroft, Wyo.
Location. Lat 44°16'30", long 104°58'35", in sec. 36, T.50 N., R.68 W. , at high- way bridge , 1^ miles northwest of Moorcroft and 2 miles upstream from Donkey Creek.
Drainage area. --1,380 sq mi, approximately.
Gage . Nonrecordlng . Datum of gage is 4,133.47 ft above mean sea level, datum oi
Stage -discharge relation. Defined by current-meter measurements below 5,800 cfs.
Remarks .--Diversions for irrigation of about 200 acres above station do not materially affect peak flows. Only annual peaks are shown.
Peak stages and discharges
Water year
1908
1924 1925
1926 1927
Date
June 1908
Apr. 7, 1924 Aug. 11, 1925
July 1, 1926 Aug. 14, 1927
Gage height (feet)
a!5.0
7.8
6.70 8.85
Discharge (cfs)
b!2,500 4,750
3,200 6,420
Water year
1928 1929 1930
1931 1932
Date
July 19, 1928 Apr. 5, 1929 Feb. 19, 1930
Oct. 2, 1930 July 2, 1932
Gage height (feet)
8.50 12.36 5.06
2.02 6.30
Discharge
5,770 9,060 1,140
221 1,500
a About.b Estimated.
4265. Belle Fourche River below Moorcroft, Wyo.
Location.--Lat 44°18', long 104°58', in SW£ sec.24, T.50 N., R.68 W., on left bank 100 ft upstream from Trail Creek, three-quarters of a mile downstream from Donkey Creek, and 2.8 miles northwest of Moorcroft.
Drainage area.--1,670 sq mi, approximately.
Gage.--Nonrecording prior to Mar. 28, 1947; recording thereafter. At site 5"a miles downstream at different datum prior to Jan. 17. 1951. Datum of gage is 4,118.4 ft above mean sea level, datum of 1929 (Bureau of Reclama tion bench mark).
Stage-discharge relation.--Defined by current-meter measurements below 1,700 cfs.
Remarks.--Diversions above station for irrigation of about 5,000 acres. Natural flow of stream affected by numerous small storage reservoirs above station. Diversion and storage probably materially affect peak flows. Only annual peaks are shown prior to 1948. Base for partial-duration series, 360 cfs.

CHEYENNE RIVER BASIN 375
Peak stages and discharges of Belle Fourche River below Moorcroft, Wyo.
Water year
19441945
1946
1947
1948
1949
1950
1951
1952
1953
1954
1955
Date
Apr. 3, 1944Mar. 14, 1945Mar. 22, 1945
May 29, 1946June 1, 1946Mar. 18, 1947Mar. 18, 1947
Mar. 20, 1948June 18, 1948June 24, 1948June 29, 1948July 17, 1948
Mar. 6, 1949June 4, 1949July 11, 1949
May 7, 1950May 10, 1950
Sept. 5, 1951
May 23, 1952
June 16, 1953June 20, 1953Aug. 2, 1953Aug. 4, 1953
June 21, 1954
Mar. 11, 1955Mar. 31, 1955Apr. 2, 1955Apr. 10, 1955May 18, 1955May 22, 1955June 3, 1955
Gage height (feet)
9.43a9.42 '
-
_9.51-
alO.2
alO.607.668.188.197.09
alO.955.957.29
7.067.28
9.94
12.30
10.0611.339.978.89
10.33
11.0811.936.948.3311.956.429.75
Discharge (cfs)
1,240-352
bl.100-
b600-
-740878898592
-370662
561581
817
1,800
9431,250
834630
852
8801,420
448615
1,430392815
Water year
1955
1956
1957
1958
1959
1960
1961
1962
1963
Date
June 18, 1955June 29, 1955Aug. 7, 1955
Mar. 21, 1956June 17, 1956Aug. 12, 1956
May 26, 1957June 1, 1957June 4, 1957June 22, 1957
June 15, 1958July 5, 1958July 19, 1958
July 1, 1959Aug. 2, 1959
Mar. 10, 1960Mar. 21, 1960 July 1, I960Aug. 19, I960
June 11, 1961
Feb. 11, 1962May 18, 1962May 27, 1962June 18, 1962July 14, 1962July 28, 1962Aug. 1, 1962Aug. 24, 1962
Apr. 30, 1963May 27, 1963June 4, 1963June 12, 1963
Gage height (feet)
9.2710.756.90
7.688.129.09
7.066.427.736.99
7.788.056.06
7.289.87
9.129.84 8.479.46
3.86
13.3610.2214.3314.119.089.238.227.19
7.577.85
12.3810.82
Discharge (cfs)
7401,000
444
576591717
453376540444
505581356
419789
634746 417526
46
2,850805
4,4204,000
613637491363
404450
1,800977
a Backwater from ice b Maximum daily.
4280. Belle Fourche River at Hulett, Wyo.
Location. Lat 44°41'00", long 104°35'40", in sec.12, T.54 N., R.65 W., nsar right bank on downstream side of pier of bridge at Hulett, 2 miles downstream from Blacktail Creek.
Drainage area.--2,800 sq mi, approximately.
Gage.--Nonrecording prior to Jan. 11, 1950; recording thereafter. Datum of gage is 3,742.04 ft above mean sea level, datum of 1929.
Stage-discharge relation.--Defined by current-meter measurements below 4,700 cfs.
Bankfull stage. 16 ft.
Historical data. Maximum stage known since 1882, that of Apr. 8, 1924, f->om I'loodmarks , from information by local resident.
Remarks.--Diversions for irrigation of about 13,500 acres above station.Numerous small stockwater and soil conservation reservoirs in drainage basin above station. Only annual observed maximum stages and discharges are shown, except as noted.

376 CHEYENNE RIVER BASIN
Peak stages and discharges of Belle Fourche River at Hulett, Wyo.
Water year
1924
1929a/1930
1931 1932
1938a/ 1939 1940
1941 1942
Date
Apr. 8, 1924
May 31, 1929 June 11, 1930
Oct. 4, 1930 Apr. 24, 1932
Sept. 9, 1938 Mar. 21, 1939 July 14, 1940
June 11, 1941 May 18, 1942
Gage height ( feet )
18.7
8.90 8.67
3.33 6.44
3.60 b7.75 5.25
7.51 5.44
Discharge (cfs)
6,230 6,160
544 3,280
582 (c)
1,640
4,000 1,800
Water year
1943 1944 1945
1946 1947
1948
1949 1950
1951
Date
Mar. 26, 1943 Apr. 4, 1944 Mar. 25, 1945
Sept. 9, 1946 Feb. 18, 1947 Mar. 22, 1947 Mar. 19, 1948 Mar. 24, 1948 Mar. 22, 1949 Apr. 11, 1950 May 11, 1950
Sept. 5, 1951
Gage height (feet)
8.75 8.14 4.63
5.79 b5.83 5.06
b7.55 5.48 7.78
b5.23 5.17
5.42
Discharge (cfs)
6,320 5,190 1,250
1,950
1,420
1,850 4,570
dl,730
dl,810a Partial year,
occurred during periodb Backwater from ice
of ice effect. dMaximum discharge not determined;
Momentary maximum.
4285. Belle Fourche River at Wyoming-South Dakota State line
Location. Lat 44°45'00", long 104°02'45", in NE^NW^NW^ sec.18, T.9 N., R.I E., on left bank a quarter of a mile downstream from State line, 3^ miles down stream from Oak Creek, and 11 miles northwest of Belle Fourche, S. Dak.
Drainage area.--3.280 sq mi, approximately.
Gage.--Recording. Datum of gage Is 3,095.7 ft above mean sea level, datum of TT929.
Stage-discharge relation. Defined by current-meter measurements.
Bankfull stage.--14 ft.
Remarks.--Flow regulated by Keyhole Reservoir (usable capacity, 199,900 acre-ft) since March 1952. Base for partial-duration series, 1,000 cfs. Only annual peaks are shown after 1951.
Peak stages and discharges
Water year
1947
1948
1949
1950
Date
Mar. 22, 1947Mar. 23, 1947Apr. 2, 1947June 18, 1947June 23, 1947
Mar. 20, 1948Mar. 20, 1948Mar. 26, 1948June 18, 1948July 11, 1948
Mar. 20, 1949Mar. 25, 1949Mar. 29, 1949Apr. 8, 1949June 5, 1949
Apr. 2, 1950Apr. 7, 1950Apr. 13, 1950
Gage height (feet)
a!4.339.898.277.46
12.51
a!2.369.409.369.987.85
all. 009.837.237.497.01
a7.868.109.20
Discharge (cfs)
-2,2301,5201,2103,620
-2,0002,0002,2801,320
_2,1801,0301,1401,030
-1,4401,820
Water year
1950
19511952195319541955
1956
1957195819591960
196119621963
Date
May 10, 1950May 12, 1950
Sept. 6, 1951Mar. 31, 1952Aug. 5, 1953Apr. 6, 1954Apr. 12, 1955
Mar. 9, 1956Mar. 24, 1956Mar. 1, 1957Apr. 27, 1958Mar. 23, 1959Mar. 23, 1960
July 5, 1961June 18, 1962Feb. 5, 1963Apr. 28, 1963
Gage height (feet)
9.518.56
8.479.69
12.685.198.71
a7.12-
a8.456.527.159.64
3.7515.59a8.15
-
Discharge (cfs)
2,0001,610
1,4802,0303,170
3891,490
_509
1,350728927
1,660
1404,400
_985
a Backwater from ice.

CHEYENNE RIVER BASIN 377
4305. Redwater Creek at Wyoming-South Dakota State line (Published as "near Beulah, Wyo." 1929-31, 1936-37)
Location. Lat 44°34'30", long 104°02'50", in NW^NW^ sec.18, T.7 N., R.I E., on left bank 800 ft downstream from State line, 3 miles upstream from Crow Creek, and 12 miles southwest of Belle Fourche, S. Dak.
Drainage area. 471 sq rni.
Gage. Nonrecording at site 2 miles upstream at different datums prior to July TT954; recording thereafter. Altitude of gage is 3,410 ft (from topographic map).
Stage-discharge relation. Defined by current-meter measurements below 320 cfs and extended above on basis of slope-area measurement at 2,340 cfs.
Remarks. Base for partial-duration series, 150 cfs. Only annual peaks are shown prior to 1955.
Peak stages and discharges
Water year
19291930
1931
19361937
1955
1956
1957
1958
Date
May 26, 1929June 9 , 1930
JulylS, 14, 1931
July 13, 1936July 17, 1937
June 11, 1955
Feb. 2, 1956July 7, 1956
Jan. 31j 1957Aug. 21, 1957
July 19, 1958
Gage height (feet)
6.205.30
4.94
7.7211.5
3.87
a3.723.70
a4.584.01
3.85
Discharge (cfs)
515162
68
6502,000
194
-123
-108
186
Water year
1959
1960
1961
1962
1963
1964
Date
Dec. 9, 1958June 25, 1959
Mar. 22, 1960
Jan. 16,17,1961Jan. 26, 1961
May 23, 1962May 26, 1962June 16, 1962June 20, 1962July 12, 1962
Apr. 29, 1963
June 23, 1964
Gage height (feet)
a3.362.73
4. IS
2.75a4.33
5.104.60
11.956.034.36
4.30
7.04
Ilscharge (cfs)
-37
273
28-
419324
2,340596280
267
b798a Backwater from ice. b Annual peak only.
4315. Spearfish Creek at Spearfish, S. Dak.
Location. La t 44°29'00", long 103°51'15", in SE^NW^ sec.15, T.6 N., R.2 E., on right bank in city park in Spearfish, 300 ft downstream from fish hatchery and nearest tributary and 12 miles upstream from mouth.
Drainage area. 168 sq mi.
Gage. Recording. Altitude of gage is 3,640 ft (from topographic map).
Stage-discharge relation. Defined by current-meter measurements.
Bankfull stage. 9 ft.
Historical data. Flood of June 5, 1904, reached a stage of 7.00 ft, site and datum of former gage near Spearfish, 1 mile upstream (drainage area, 157 sq mi); discharge, about 5,000 cfs.
Remarks. Regulation by hydroelectric plant and fish hatchery half a mile up- stream causes diurnal fluctuation, but since storage capacity is small, daily flows and peak discharges are not affected appreciably. Base for partial-duration series, 125 cfs.

378 CHEYENNE RIVER BASIN
Peak stages and discharges of Spearflsh Creek at Spearfish, S. Dak.
Water year
1947
1948
1949
1950
1951
1952
1953
1954
1955
Date
June 22, 1947
June 14, 1948June 24, 1948
Feb. 13, 1949May 6, 1949
Jan. 5, 1950May 22, 1950
Feb. 1, 1951June 17, 1951
Jan. 24, 1952Apr. 27, 1952May 22, 1952
May 9, 1953May 21, 1953May 28, 1953June 15, 1953June 19, 1953
Jan. 17, 1954May 30, 1954
Feb. 24, 1955
Gage height (feet)
6.73
5.705.89
a5.705.32
a6.675.09
a6.615.37
a7.295.036.81
5.265.075.405.095.56
a6.395.15
a5.54
Discharge (cfs)
891
336417
_176
_116
-215
-126947
194146252144301
-147
-
Water year
1955
1956
1957
1958
1959
1960
1961
1962
1963
1964
Date
June 11, 1955
Feb. 2, 1956July 16, 1956
Jan. 25, 1957July 14, 1957
July 3, 1958
Jan. 6, 1959May 4, 1959
Nov. 14, 1959May 10, 1960
Nov. 15, 1960Jan. 28, 1961
Jan. 23, 1962May 22, 1962June 15, 1962
Jan. 14, 1963Apr. 29, 1963June 16, 1963 June 9, 1964
Gage height (feet)
5.20
a5.865.61
a6.945.22
6.23
a7.274.95
a5.925.02
5.07a5.15
a7.136.645.73
a7.406.475.99
7.97
Discharge (cfs)
181
_300
-158
571
-83
-86
100-
-830216
-662344
bl,920
a Backwater from ice. b Annual peak only.
4322.a Miller Creek near Whltewood, S. Dak.
Location. Lat 44°29', long 103°44', In SE£ sec.15, T.6 N., R.3 E., at culvert on U.S. Highway 14-85, 5 miles west of Whltewood.
Drainage area. 6.72 sq ml.
Gage . Crest-stage gage.
Stage-discharge relation. Defined by current-meter measurements below 130 cfs and extended above on basis of Indirect measurement at 275 cfs.
Remarks. Only annual peaks are shown.
Peak stages and discharges _
Water year
1956 1957 1958 1959 1960
Date
July 2, 1958
Gage height (feet)
2.90
Discharge (cfs)
0 0
127 0 0
Water year
1961 1962 1963 1964
Date
May 22, 1962 Apr. 29, 1963 June 9, 1964
Gage height (feet)
3.10 2.63 3.48
Discharge (cfs)
0 180 64
275

CHEYENNE RIVER BASIN 379
4330. Redwater River above Belle Fourche, S. Dak. (Published as "Redwater Creek" prior to 1960)
Location. Lab 44°40'05", long 103°49'55", in NW^SE^ sec.11, T.8 N., R.2 E., on right bank at upstream side of bridge on U.S. Highway 212 in Belle Fourche,a quarter of a mile upstream from Hay Creek and half a mile upstream from mouth.
Drainage area. 920 sq mi.
Gage. Nonrecording October 1945 to December 1946; recording thereafter. Altitude of gage is 3,000 ft (from topographic map).
Stage-discharge relation. Defined by current-meter measurements below 1,800 cfs and extended above on basis of slope-area measurement at 16,400 cfs.
Bankfull stage. 10 ft.
Remarks. Base for partial-duration series, 500 cfs.
Peak stages and discharges
Water year
1946
1947
1948
1949
1950
1951
1952
1953
1954
Date
May 2, 1946May 24, 1946May 31, 1946June 11, 1946June 18, 1946July 3, 1946
Feb. 8, 1947Mar. 17, 1947June 22, 1947
Feb. 13, 1948July 11, 1948
Feb. 24, 1949Mar. 4, 1949Mar. 21, 1949
Feb. 2, 1950Apr. 6, 1950
Jan. 31, 1951June 14, 1951
Jan. 23, 1952Mar. 28, 1952May 23, 1952
Mar. 2, 1953May 29, 1953June 20, 1953
(c)
Gage height (feet)
6.36.248.557.357.405.75
b6.646.138.98
b7.065.73
b7.116.295.49
b6.214.83
b5.614.63
b6.275.606.62
b5.455.936.13
b9.45
Discharge (cfs)
al,3001,2602,5501,6401,640
740
-834
2,800
-672
-985587
_340
_269
-590
1,120
-748852
-
Water year
1954
1055
1956
1957
1958
1959
1960
1961
1962
1963
Date
May 31, 1954
June 11, 1955
Dec. 23, 1955
Feb. 8, 1957June 25, 1957
June 15, 1958July 4, 1958
Jan. 4, 1959Mar. 1, 1959
Mar. 4, I960Mar. 21, 1960
Jan. 26, 1961July 27, 1961
May 23, 1962May 25, 1962May 29, 1962June 16, 1962June 21, 1962July 4, 1962July 12, 1962
Feb. 1, 1963Apr. 30, 1963June 16, 1963
Gage height (feet)
4.72
5.35
b8.35
b6.695.28
5.615.44
b5.844.56
b5.775.50
b5.624.28
7.086.416.14
11.696.026.466.16
b7.366.426.10
Eischarge (cfs)
270
483
480
-453
608516
-246
-516
_178
1,4701,020
87416,400
7941,040
868
-1,010831
a About.b Backwater from ice.c Occurred between Jan. 22 and Feb. 1, 1954.
4335. Hay Creek at Belle Fourche, S. Dak.
Location.--Lat 44°40'05", long 103°50'25", in NW£sw£ sec. 11, T.8 N., R.2 E., on right bank at intersection of Tenth Avenue and Jackson Street in Belle Fourche, half a mile upstream from mouth.
Drainage area. 121 sq mi.
Gage. Recording. Datum of gage is 3,005.18 ft above mean sea level (city of Belle Fourche bench mark).
Stage-discharge relation. Defined by current-meter measurements below 100 cfs and extended above by logarithmic plotting.
Remarks. Base for partial-duration series, 50 cfs.

380 CHEYENNE RIVER BASIN
Peak stages and discharges of Hay Creek at Belle Fourche, S. Dak.
Water year
1954
1955
1956
1957
1958
1959
Date
Apr. 6, 1954
Apr. 9, 1955
Dec. 23 , 1955July 16, 1956
June 22, 1957June 25, 1957Sept. \, 1957
Apr. 1 , 1958
Jan. 22, 1959Feb. 15, Mar. 2,
1959
Gage height (feet)
3.55
3.77
a3.893.52
4.114.464.49
4.18
a4.43-
Discharge (cfs)
18
29
_15
51132117
63
_b2.0
Water year
1960
1961
1962
1963
1964
Date
Mar. 20, 1960
July 5, 1961
May 22, 1962May 27, 1962May 29, 1962June 16, 1962July 4, 1962July 12, 1962
June 18, 1963
June 22, 1964
Gage height (feet)
4.24
3.87
5.155.375.656.515.274.98
4.66
7.05
Discharge (cfs)
42
8.9
9712516634811177
40
c530
a Backwater from ice. b Maximum daily, c Annual peak only.
4355. Belle Fourche River near Belle Fourche, S. Dak.
Location.--Lat 44°41'30", long 103°49i30", in sec.2, T.8 N., R.2 E., at di version dam of Belle Fourche irrigation project, \\ miles dovmstream from Belle Fourche.
Drainage area. 4,310 sq mi, approximately.
Gage. Nonrecording. Altitude of gage is 3,000 ft (from topographic map).
Stage-discharge relation. Discharge computed as sum of flow over diversion dam, from weir formula, and flow through Inlet Canal, from rsted diversion gate openings.
Remarks. Records furnished by Bureau of Reclamation. Diversior above station for irrigation. Records of peak flow include flow diverted ft Belle Fourche diversion dam through Inlet Canal to Belle Pourche Reservoir. Only annual maximum observed discharges are shown.
Peak stages and discharges
Water year
1924
1927192S19291930
1931193219331934
Date
Apr. 9, 1924
May 13, 1927Mar. 12, 1928Apr. 8, 1929June 9, 1930
June 11, 1931Apr. 24, 1932May 25, 1933June 10, 1934
Gage height (feet)
-
_-__
-_--
Discharge (cfs)
22,400
8,2509,660
15,0002,060
8486,3105,090
596
Water year
1935
19361937193819391940
194119421943
Date
June 2 , 1935
Mar. 5, 1936July 17, 1937June 28, 1938Mar. 23, 1939June 4, 1940
June 10, 1941May 14, 1942May 2S, 1943
Gage \ eight (feet)
-
_----
---
Discharge (cfs)
1,090
1,4405,350
5901,0702,700
8,9603,7405,520

CHEYENNE RIVER BASIN 381
4360. Belle Fourche River near Fruitdale, S. Dak.
Location.--Lat 44°41'25", long 103°44'15", in NW^NE^ sec.3, T.8 N., R.3 E., near right bank on downstream side of pier of bridge on U.S. Highway 212, Z\ miles northwest of Fruitdale and 8f miles downstream from point of diversion to Belle Fourche Reservoir.
Drainage area. 4,540 sq mi, approximately.
Gage.--Nonrecording prior to Apr. 9, 1947, and Dec. 31, 1958, to Sept. 23, 1959; recording during remainder of period. Altitude of gage is 2,925 ft (from topographic map).
Stage-discharge relation.--Defined by current-meter measurements below 3,800 cfs and extended above by logarithmic plotting.
Bankfull stage.--12 ft.
Remarks. Peak flows materially affected by diversion to Fourche Reservoir and other smaller diversions. Total diversions for irrigation of about 60,000 acres above station. Only annual peaks are shown.
Peak stages and discharges
Water year
1946 1947 1948 1949
1950
1951 1952 1953 1954
Date
June 1, 1946 June 23, 1947 June 18, 1948 Mar. 5, 1949 Mar. 25, 1949 Apr. 6, 1950 May 10, 1950
Sept. 7, 1951 Mar. 51, 1952 Aug. 6, 1955 Nov. 26, 1955
Gage height (feet)
9.7 11.05 6.98
a9.74
a6.78
5.66 6.10 7.85 5.50
Discharge (cfs)
5,710 7,460 2,720
2,280
1,550
1,680 2,280 4,070
110
Water year
1955
1956 1957 1958
1960
1961 1962 1965
Date
Apr. 12, 1955
Dec. 25, 1955 Sept. 1, 1957 June 16, 1958
Mar. 24, 1960
Sept. 21, 1961 June 16, 1962 Apr. 50, 1965
Gage height (feet)
4.44
a4.56 5.92 5.95
ac6.58
5.64 11.25 5.72
Discharge (cfs)
597
b520 144 185
2,550
7 7,840 1,580
a Backwater from ice.b About.c Occurred on preceding day.
4370. Belle Fourche River near Sturgis, S. Dak.
Location. Lat 44°30'50", long 103°07'50", in SW^NE^ sec.3, T.6 N., R.8 E., near right bank on downstream side of pier of bridge on State Highway 34, half a mile upstream from Bear Butte Creek and 20 miles northeast of Sturgis,
Drainage area. 5,870 sq mi, approximately.
Gage. Nonrecording October 1945 to October 1946; recording thereafter. Datum of gage is 2,526.13 ft above mean sea level, datum of 1929.
Stage-discharge relation.--Defined by current-meter measurements below 11,000 cfs and extended above by logarithmic plotting.
Remarks.--At a point 70 miles above station, water is diverted to Belle Fourche Reservoir (usable capacity, 185,200 acre-ft) through Inlet Canal. Base for partial-duration series, 1,500 cfs.
219-848 O -

382 CHEYENNE RIVER BASIN
Peak stages and discharges of Belle Fourche River near Sturgis, S. Dak.
Water year
1946
1947
1948
1949
1950
1951
1952
1953
Date
May 24, 1946
Oct. 6, 1946Oct. 9, 1946 Feb. 19, 1947 Mar. 18, 1947Mar. 21, 1947Mar. 31, 1947Apr. 5, 1947June 23, 1947
Mar. 21, 1948Mar. 22, 1948June 19, 1948June 22, 1948
Mar. 6, 1949Mar. 23, 1949
Apr. 5, 1950Apr. 8, 1950Apr. 15, 1950May 11, 1950
June 20, 1951
Mar. 28, 1952Mar. 30, 1952May 23, 1952
May 29, 1953June 16, 1953June 20, 1953Aug. 4, 1953Aug. 6, 1953
Gage height (feet)
13.86
6.676.73
8.239.465.917.13
12.53
C9.467.777.616.53
C12.30-
clO.358.278.126.53
5.70
ell. 978.926.20
7.989.18.977.227.69
Discharge (cfs)
a!7,900
2,7302,730
b3,000 5,5307,8302,1303,77014,400
_4,2204,0602,520
b3,500b5,500
_5,1704,8202,330
1,330
-6,3001,850
4,6206,6406,3903,3504,120
Water year
1954
1955
1956
1957
1958
1959
1960
1961
1962
1963
Date
May 23, 1954June 6, 1954June 21, 1954Mar. 10, 1955 July 24, 1955July 4, 1956
Feb. 13, 1957May 21, 1957
June 8, 1958June 16, 1958
Mar. 4, 1959July 16, 1959
Mar. 22, 1960
June 29, 1961
May 19, 1962May 22, 1962May 26, 1962May 30, 1962June 16, 1962June 19, 1962June 25, 1962July 4, 1962July 15, 1962
Apr. 30, 1963June 8, 1963June 16, 1963June 23, 1963
Gage height (feet)
7.086.555.89
cf .73 f.24e.72
ce.255.62
e.35e.26
ce.155.83
cT.20
6.81
7.8811.571C. 1011.2314.32S.147.968.008.06
7.616.948.806.86
Discharge (cfs)
3,1602,3701,610
848
2,580
-1,230
1,9501,850
-1,380
2,800
2,720
2,9107,7605,7007,280
11,9004,4203,0003,0403,110
2,4002,0004,0001,970
a Annual peak only.b Estimated.c Backwater from ice.
4371. Boulder Creek near Deadwood, S. Dak.
Location. Lat 44°23', long 103°39', in SW£ sec.17, T.5 N., R.4 E., at culvert on U.S. Highway 14, 3^ miles east of Deadwood.
Drainage area. 1.69 sq mi.
Gage.--Crest-stage gage.
Stage-discharge relation. Defined by current-meter measurements bslow 30 cfs and extended above on basis of culvert computations at 139 and 210 cfs.
Remarks. Only annual peaks are shown.
Peak stages and discharges
Water year
1956 1957 1958 1959 1960
Date
May 25, 1957 July 2, 1958
March 1960
Gage height (feet)
4.50 7.22
4.13
Discharge (cfs)
(a) 24
139 (a)
10
Water year
1961 1962 1963
Date
June 15, 1962 Apr. 29, 1963
Gage height (feet)
8.46 4.76
Discharge (cfs)
0 210 34
a Peak stage did not reach bottom of gage; less than 0.5 cfs.

CHEYENNE RIVER BASIN 383
4375. Bear Butte Creek near Sturgis, S. Dak.
Location. Lat 44°28'50", long 103°16'30", in NW^SE^ sec.16, T.6 N., R.7 E., on left bank 1 mile downstream from Spring Creek, 12| miles northeast of Sturgis, and 17 miles upstream from mouth.
Drainage area. 192 sq mi.
Gage. Nonrecording at site 1 mile downstream at datum 11.79 ft lower prior to June 25, 1962; recording thereafter. Datum of gage is 2,779.91 ft above mean sea level, datum of 1929.
Stage-discharge relation.--Defined by current-meter measurements below 2,400 cfs and extended above on basis of indirect measurement at 12,700 cfs.
Bankfull stage. 9 ft.
Historical data. Flood of May 20, 1883 (maximum known), and one in 19C9, were greater than flood of June 16, 1962, from information by local residents.
Remarks. Only annual peaks are shown prior to 1962. series, 200 cfs.
Peak stages and discharges
Base for partial-duration
Water year
194619471948
1949
1950
1951195219531954 1955
1956
Date
May 24, 1946June 22, 1947Mar. 15, 1948June 23, 1948Mar. 21, 1949May 28, 1949Apr. 5, 1950Apr. 15, 195O
May 13, 1951May 23, 1952June 20, 1953June 7, 1954 Apr. 11, 1955
May 29, 1956
Gage height (feet)12.0710.20a5.26
-all. 8
-a6.45
-
5.928.307.054.90 3.62
2.73
Discharge (cfs)
---263-636-249
352701560215 88
20
Water year
1957195819591960
1961
1962
1963
1964
Date
May 25, 1957July 5, 1958July 16, 1958Mar. 19, 1960
-
May 22, 1962May 26, 1962May 30, 1962June 16, 1962July 14, 1962
Apr. 30, 1963 June 16, 1963
June 9, 1964
Gage height (feet)
7.952.883.914.85
-
9.016.925.9012.456.7O
7.35 6.98
10.00
Discharge (cfs)
64529106204
0
807483338
12,700445
549 494
b2,360a Backwater from ice b Annual peak only.
4380. Belle Fourche River near Elm Springs, S. Dak.
Location. Lat 44°22'10", long 102°33'55", in NE^NE^ sec.29, T.5 N., R.13 E., near right bank on downstream side of pier of highway bridge, 4^ miles north west of Elm Springs and 5^ miles downstream from Hay Creek.
Drainage area.--7,210 sq mi, approximately.
Gage. Nonrecording prior to July 28, 1939; recording thereafter. Datum of gage is 2,171.60 ft above mean sea level, datum of 1929.
Stage-discharge relation. Defined by current-meter measurements below 27,000 cfs.
Bankfull stage.--15 ft.
Historical data.--Maximum stage known, that of May 1927.
Remarks.--At a point 130 miles above station, water is diverted to Belle Pourche Reservoir through Inlet Canal. Base for partial-duration series, 3,500 cfs. Only annual peaks are shown prior to 1940.

384 CHEYENNE RIVER BASIN
Peak stages and discharges of Belle Fourche River near Elm Springs, S. Dak.
Water year
1927
19291930
1931193!!19331934193!i
193(5
193V19301939
1940
1941
1942
1942.
1944
1945
1946
1947
Date
May 1927
June 3, 1929June 25, 1930
July3 d-4,1931Apr. 25, 1932Spring 1933June 9, 1934June 1, 1935
Mar. 6, 1936July 26, 1936July 13, 1937June 24, 1938Mar. 21, 1939
Apr. 29, 1940June 5, 1940
Apr. 15, 1941June 2, 1941June 7, 1941June 10, 1941
May 1, 1942May 14, 1942May 18, 1942June 6, 194ZJune 28, 1942
Mar. 29, 1943June 10, 1943June 14, 1943
Mar. 28, 1944Apr. 6, 1944May 20, 1944June 5, 1944June 9, 1944June 13, 1944June 18, 1944June 23, 1944July 9, 1944
Mar. 15, 1945Mar. 25, 1945June 10, 1945June 14, 1945
May 2, 1946May 24, 1946June 1, 1946June 19, 1946
Oct. 7, 1946Mar. 17, 1947Mar. 19, 1947Apr. 5, 1947June 23, 1947
Gage height (feet)
21.8
11.305.26
8.47.90
a202.3811.15
b5.40
12.35.79
b4.03
4.635.38
8.509.309.54
14.3
6.656.879.006.424.87
6.525.96
11.1
b!3.7510.34.936.884.968.46
11.27.755.60
8.976.957.085.63
8.5812.5610.6811.22
4.861)9.595.425.99
10.71
Discharge (cfs)
.
25,5005,480
15,10014,400
-595
24,800
_4,890
29,3006,9101,740
3,5305,510
12,90015,50016,20035,700
7,6008,340
14,5007,1203,670
7,3606,180
21,900
_19,0003,6708,3403,880
12,90022,20011,4005,600
13,3008,0008,2104,710
12,20025,50018,50022,200
3,680_
4,8406,180
20,40O
Water year
1948
1949
1950
1951
1952
1953
1954
1955
1956
1957
1958
1959
1960
1961
1962
1963
Date
Mar. 22, 1948Mar. 22, 1948June 20, 1948June 23, 1948Aug. 9, 1948
Mar. 7, 1949Mar. 23, 1949Mar. 23, 1949Mar. 27, 1949Apr. 7, 1949
Apr. 4, 1950Apr. 7, 1950Apr. 15, 1950May 9, 1950Aug. 11, 1950
June 20, 1951
Apr. 1, 1952
Mar. 12, 1953May 3, 1953May 29, 1953June 17, 1953June 21, 1953Aug. 7, 1953
May23or24J.954June 7, 1954June 10, 1954
July 9, 1955
Mar. 19, 1956July 5, 1956
May 25, 1957
June 9, 1958June 15, 1958
Mar. 7, 1959July 16, 1959
Mar. 21, 1960Mar. 23, 1960June 30, 1961
May 19, 1962May 21, 1962May 26, 1962May 28, 1962June 15, 1962June 19, 1962June 25, 1962
June 16, 1963June 22, 1963
Gage height (feet)
b7.106.885.294.796.72
b9.47b9.298.307.184.93
b8.26.666.745.006.04
3.40
9.5
b5.155.095.946.237.415.37
-5.018.09
4.57
b7.344.22
f.55
5.336.16
b3.352.48
b6. 785.664.09
S.0111.089.57
14.3112.516.535.72
6.786.36
Discharge (cfs)
-8,2804,7003,6307,760
6,000-
12,8009,3504,170
(o)6,9807,2403,7605,580
1,930
14,400
-3,9905,3105,9008,7404,270
(c)3,70010,500
3,090
_2,600
6,380
3,7905,470
-693
-3,7602,090
11,70020,20012 , 70037,90027,5005,2603,660
6,9605,930
a About; from floodmarks.b Backwater from Ice.c Unknown; greater than 3,500 cfs.

CHEYENNE RIVER BASIN 385
4385. Cheyenne River near Plainview, S. Dak.
Location. Lat 44°31'25", long 101°59'30", in NE£SW£ sec.31, T.7 N., R.18 E., on downstream side of third pier from right end of bridge on State Highway 73, if miles downstream from Ash Creek and 10 miles southeast of Plainview.
Drainage area. 21,600 sq mi, approximately.
Page. Nonrecording prior to Mar. 22, 1951; recording thereafter, gage is 1,877.65 ft above mean sea level, datum of 1929.
Datum of
Stage-discharge relation. Defined by current-meter measurements below 24,000 cfs and extended above by logarithmic plotting.
Bankfull stage.--13 ft.
Historical data. Maximum stage known, that of May 1920.
Remarks. Base for partial-duration series, 4,500 cfs.
Peak stages and discharges
Water year
1920
1927
1951
1952
1953
1954
1955
1956
1957
Date
May 1920
May 1927
June 20., 1951June 24, 1951
Mar. 29, 1952Mar. 30, 1952May 23, 1952May 26, 1952June 4, 1952
Mar. 11, 1953Mar. 12, 1953May 1, 1953May 4, 1953May 30, 1953June 18, 1953June 20, 1953Aug. 5, 1953
June 10, 1954
Mar. 12, 1955Aug. 12, 1955Sept. 21, 1955
Mar. 20, 1956May 29, 1956
May 21, 1957
Gage height (feet)
a!7.5
a!4
5.825.82
blO.6210.558.996.337.32
b7.226.527.027.386.576.688.976.64
7.68
b7.206.389.53
b6.925.48
9.36
Discharge (cfs)
-
-
4,3404,34O
-41,40018,8005,4708,260
-5,9307,6308,9405,7805,710
15,7006,220
9,710
-5,84021,000
_4,220
19,200
Water year
1957
1958
1959
1960
1961
1962
1963
Date
May 26, 1957May 28, 1957June 12, 1957June 14, 1957June 17, 1957
June 4, 1958June 9, 1958June 16, 1958July 20, 1958July 31, 1958
May 6, 1959
Mar. 20, 1960Mar. 22, 1960
July 27, 1961
May 20, 1962May 22, 1962May 27, 1962May 29, 1962June 18, 1962June 26, 1962July 5, 1962July 15, 1962
June 7, 1963June 16, 1963June 23, 1963
Gage height (feet)10.968.616.576.186.85
6.036.507.816.806.24
7.35
b9.23b7.52
6.88
8.2011.659.61
11.4710.907.897.318.92
8.579.777.45
Discharge (cfs)
41,70012,5005,4804,7706,000
4,4705,3308,5305,9204,880
7,280
-6,600
5,670
9,80038,60016,30036,30030,4006,5805,230
11,800
9,60018,0005,240
a Annual peak only (about); from information by local residents, b Backwater from ice.
4390. Cherry Creek near Plainview, S. Dak.
Location. Lat 44°44'35", long 102°03'10", in SW^NE^ sec.16, T.9 N. , R.17 E., on left bank 5 ft downstream from bridge on State Highway 73, a quarter of a mile downstream from small tributary, 6^ miles downstream from Red Owl Creek, and 11 miles northeast of Plainview.
Drainage area. 1,190 sq mi, approximately.
Page.--Nonrecording November 1945 to June 1948; recording thereafter. Datum of gage is 2,158.06 ft above mean sea level, datum of 1929.
Stage-discharge relation.--Defined by current-meter measurements.
Bankfull stage. 15 ft.
Remarks.--Base for partial-duration series, 1,000 cfs. Only annual p3aks are shown prior to 1948.

386 CHEYENNE RIVER BASIN
Peak stages and discharges of Cherry Creek near Plainview, S. Dak.
Water year
1946
1947
1948
1949
1950
1951
1952
1953
Date
May 26, 1946
Feb. 16, 1947June 25, 1947
June 5, 1948
Mar. 27, 1949
Apr. 8, 1950Apr. 17, 1950
Sept. 7, 1951
Feb. 13, 1952Apr. 1, 1952
Mar. 22, 1953May 4, 1953June 1, 1-953June 16, 1953June 20, 1953Aug. 7, 1953
Gage height (feet)
9.05
a!4.25_
9.2
12.88
12.9012.45
8.29
alO.1322.63
12.248.96
10.2216.9114.588.74
Discharge (cfs)
1,180
_2,540
1,280
2,980
2,9802,760
996
_
17,500
2,3801,0301,5705,9603,8801,030
Water year
1954
1955
1956
1957
1958
1959
196019611962
1963
Date
June 12, 1954
Mar. 11, 1955
Mar. 18, 1956
Hay 26, 1957
June 9, 1958
July 3, 1959
Mar. 24, 1960_
May 22, 1962May 29, 1962June 2, 1962June 18, 1962June 28, 1962July 5, 1962
June 17, 1963
Gage height (feet)
10.89
8.03
a9.53
7.74
8.39
6.00
9.00_
If. 8610.7111.1612.66P. 86
10.11
9.00
Discharge (cfs)
1,800
771
940
692
900
164
1,1200
6,2401,8002,0302,9201,4001,510
1,030a Backwater from ice.
4390.8. Cherry Creek tributary No. 3 near Avance, S. Dak.
Location.--Lat 44°51', long 102"03', in SW£ sec.3, T.10 N. , R.17 E., at bridge on State Highway 73, 11 miles southeast of Avance.
Drainage area.--4.58 sq mi.
Gage.--Crest-stage gage.
Stage-discharge relation. Defined by current-meter measurements below 65 cfs and by indirect measurement at 2,280 cfs.
Remarks.--Only annual peaks are shown.
Peak stages and discharges
Water year
1956 1957 1958 1959 1960
Date
March 1956 May 25, 1957
June 1958
Mar. 21, 1960
Gage height (feet)a4.51 4.32 2.30
3.53
Discharge (cfs)
20
1.0 0
Water year
1961 1962 1963 1964
Date
March 1961 May 21, 1962 July 26, 1963 June 8, 1964
Gage height (feet)
2.12 6.96 2.58 3.63
Discharge (cfs)
(b) 2,280
S.O
a Backwater from ice. b Less than 0.5 cfs.
4391. Beaver Creek near Faith, S. Dak.
Location.--Lat 44°56', long 102°03', in SW£ sec.3, T.ll N., R.17 E., at bridge on State Highway 73, 6 miles south of Faith.
Drainage area.--37.1 sq mi.
Gage. Crest-stage gage.
Stage-discharge relation. Defined by current-meter measurements below 60 cfs and at 3,000 cfs.
Remarks.--Only annual peaks are shown.

CHEYENNE RIVER BASIN 387
Peak stages and discharges of Beaver Creek near Faith, S. Dak.
Water year
19561957 1958 1959 1960
Date
March 1956 Aug. 21, 1957 June 8, 1958 Mar. 10, 1959 Mar. 21, 1960
Sage height (feet)
a7.21 5.97 6.63
a4.67 a8.15
Discharge (cfs)
70 225 390 35
400
Water year
1961 1962 1963 1964
Date
March 1961 May 21, 1962 June 15, 1963 June 8, 1964
Sage height (feet)
a2.25 11.85 7.09 7.19
Discharge (cfs)
1 3,080
535 575
a Backwater from ice.
4395. Cheyenne River near Eagle Butte , S. Dak.
Location. Lat 44 "41'40", long 101°13'05", in NE^SE^ sec.32, T.9 N., R.24 E., on downstream side of fourth pier from left abutment of bridge on State Highway 63, 0.5 mile upstream from Hermaphrodite Creek and 21 miles south of Eagle Butte.
Drainage area. 24,500 sq mi, approximately.
Oase.Gage.--Nonrecording prior to Nov. 23, 1934; recording thereafter. 1,601.57 ft above mean sea level, datum of 1929.
DatuTi of gage
Stage-discharge relation.--Defined by current-meter measurements below 30,000 cfs and extended above by logarithmic plotting.
Bankfull stage.--16 ft.
Remarks. Base for partial-duration series, 5,500 cfs. shown prior to 1935.
Peak stages and discharges
Only annual peaVs are
Water year
1920
1927
19291930
1931193219331934
1935
1936
1937
1938
1939
1940
1941
1942
Date
May 13, 1920
May 9, 1927
June 3, 1929Feb. 24, 1930
July 4, 1931May 7, 1932May 24, 1933July 28, 1934
Apr. 27, 1935May 21, 1935May 23, 1935May 30, 1935June 2, 1935
Mar. 7, 1936
Mar. 16, 1937June 13, 1937June 15, 1937June 19, 1937July 13, 1937July 18, 1937
Mar. 1, 1938June 24, 1938Sept. 7, 1938
May 23, 1939May 26, 1939July 3, 1939
Mar. 29, 1940Apr. 29, 1940
Apr. 16, 1941June 3, 1941June 8, 1941June 11, 1941July 15, 1941
Apr. 26, 1942
Sage height (feet)
18.9
18.1
10.125.95
5.8010.915.004.48
5.655.775.405.6710.80
a7.05
a6.106.615.817.14
11.797.53
a5.407.285.55
6.236.945.28
a6.804,95
7.357.527.99
12.25.73
5.38
Discharge (cfs)
-
-
49,6006,260
8,60053,000104,0003,080
6,7707,5306,1107,150
51,600
blO,000
-10,9007,150
14,20064,40018,200
-16,3006,770
10,40014,5006,400
-5,100
16,20014,70017,70059,0006,480 '
5,760
Water year
1942
1943
1944
1945
1946
1947
Date
Apr. 29, 1942May 2, 1942May 7, 1942May 14, 1942May 18, 1942June 6, 1942
Feb. 23, 1943Mar. 30, 1943June 11, 1943June 15, 1943
Apr. 2, 1944Apr. 3, 1944Apr. 7, 1944June 6, 1944June 10, 1944June 13, 1944June 19, 1944June 22, 1944June 24, 1944July 10, 1944July 13, 1944
Mar. 14, 1945Mar. 16, 1945Mar. 26, 1945June 11, 1945June 15, 1945
May 3, 1946May 25, 1946June 2, 1946June 15, 1946June 20, 1946June 24, 1946June 27, 1946July 18, 1946
Feb. 17, 1947Mar. 20, 1947Mar. 24, 1947Apr. 6, 1947June 11, 1947June 23, 1947
Sage height (feet)
5.279.857.39
10.359.808.67
6.136.757.859.70
alO.O7.608.916.346.228.449.427.817.806.436.42
a8.968.467.777.316.64
9.1110.479.147.05
10.168.477.756.84
a8.03a6.96.936.696.54
12.3
Discharge (cfs)
5,76037,60016,40037,60031,60022,400
7,05010,70016,40030,700
_14,80024,0007,7006,260
21,40028,00015,20015,2006,1806,130
_20,20015,20014,4008,520
25,40038,50025,4008,210
35,50017,80011,6007,370
b8,500b7,0007,8307,1406,020
50,000a Backwater from ice.b About.

388 CHEYENNE RIVER BASIN
Peak stages and discharges of Cheyenne River near Eagle Butte, S. Dak. Continued
Water year
1947
1948
1949
1950
1951
1952
1953
1954
Date
July I, 1947
Mar. 19, 1948Mar. 21, 1948Mar. 23, 1948June 23, 1948June 28, 1948
Mar. 7, 1949Mar. 24, 1949
Apr. 1, 1950Apr. 5, 1950Apr. 8, 1950Apr. 16, 1950May 10, 1950
Mar. 27, 1951Mar. 28, 1951
Feb. 10, 1952Apr. 2, 1952May 23, 1952June 5, 1952
Mar. 12, 1953Mar. 22, 1953May 3, 1953June 17, 1953June 21, 1953
June 11, 1954
Gage height (feet)
8.26
39.567.166.546.716.09
9.728.85
6.707.257.537.377.34
a9.46a7.32
a7.5911.367.646.09
a9.707.367.166.838.45
6.83
Discharge (cfs)
14,300
-10,4006,9008,8505,600
31,80024,000
8,25012,40014,50013,80013,100
_b9,400
_38,50015,1005,760
23,20012,40011,2008,040
19,000
9,350
Water year
1955
1956
1957
1958
1959
1960
1961
1962
1963
Date
Mar. 12, 1955Sept. 22, 1955
Mar. 19, 1956Mar. 22, 1956
May 21, 1957May 26, 1957May 29, 1957June 11, 1957
June 17, 1958
May 6, 1959
Mar. 21, 1960Mar. 22, 1960
July 28, 1961
Mar. 21, 1962May 23, 1962May 27, 1962May 30, 1962June 19, 1962June 27, 1962July 6, 1962July 16, 1962
June 8, 1963June 17, 1963June 23, 1963
Page height (feet)
a6.468.55
a8.426.55
8.1411.198.096.51
6.66
5.85
all. 737.90
5.10
7.1912.179.45
12.1511.626.868.018.12
7.128.995.59
Discharge (cfs)
_17,600
_6,870
12,80031,50012,6006,380
7,460
6,380
-10,200
3,140
7,56036,30017,90036,20032,4008,660
12,40012,100
9,08016,2005,740
a Backwater from ice
MISSOURI RIVER MAIM STEM
4400. Missouri River at Pierre, S. Dak.
Location.--Lat 44 022'25", long 100°22'20", in SE^ sec.21, T.5 N., R.31 E., near right bank on downstream side of pier of Chicago and North Western Railway Co. bridge at Pierre, 1.3 miles upstream from Bad River, 5.8 miles downstream from Oahe Dam, and at mile 1,066.5.
Drainage area. 243,500 sq mi, approximately.
Gage. Nonrecording at datum 2.00 ft higher prior to Mar. 11, 1932; recording at present datum thereafter. Datum of gage is 1,414.26 ft above mean sea level, datum of 1929. All gage heights adjusted to present datum.
Stage-discharge relation. Defined by current-meter measurements.
Bankfull stage. 15 ft.
Remarks. Many diversions above station for irrigation. Plow regulated by Port Peck Reservoir (usable capacity, 18,800,000 acre-ft) sine? November 1937, by Garrison Reservoir (capacity, 23,000,000 acre-ft) since November 1953, and by Oahe Reservoir (capacity, 23,630,000 acre-ft) since Augast 1958. Only annual peaks are shown.
Peak stages and discharges
Water year
1930
193119321933
1934
1935
1936
Date
Mar. 12, 1930Apr. 7, 1930
June 12, 1931June 15, 1932May 28, 1933June 25, 1933Feb. 28, 1934June 19, 1934July 14, 1935
Mar. 19, 1936Apr. 17, 1936
Gage height (feet)
a8.81-
8.5810.96
-10.40
alO.65-
12.25
alO.90-
Discharge (cfs)
-74,600
46,400121,000119,000
--
50,900131,000
_104,000
Water year
1937193819391940
19411942194319441945
19461947
Date
June 20, 1937Mar. 22, 1938Mar. 31, 1939June 13, 1940
June 13, 1941June 11, 1942Apr. 6, 1943Apr. 9, 1944Mar. 20, 1945
June 20, 1946Apr. 1, 1947
Gage height (f ;et)
12.0012.9514.209.46
12.9410.9519.6515.5810.50
10.0516.50
Discharge (cfs)
120,000171,000197,00060,800
132,00091,900
281,000191,000108,000
83,000241,000
a Backwater from ice.

MISSOURI RIVER MAIN STEM 389
Peak stages and discharges of Missouri River at Pierre, S. Dak. Continued
Water year
194819491950
19511952195319541955
1956
Date
Mar. 24, 1948Apr. 5, 1949Apr. 21, 1950
Apr. 8, 1951Apr. 10, 1952June 22, 1953Oct. 29, 1953May 29, 1955
Mar. 24, 1956
Gage height (feet)
a!4.0715.0018.44
12.2625.3512.438.058.77
11.11
Discharge (cfs)
154,000187,000269,000
127,000440,000112,00046,60048 , 800
73,900
Water year
1957195819591960
1961
19621963
Date
May 27, 1957Mar. 29, 1958Mar. 29, 1959Aug. 9, 1960Aug. 25, 1960
Dec. 21, 1960May 7, 1961May 10, 1962Apr. 23, 1963Aug. 8, 1963
Gage height (feet)
10.0111.047.20-
7.50
a7.46-
6.1412.10
-
Eischarge (cfs)
66 , 40065,20034,60031,800
-
-30,90030,700
-40,500
a Backwater from ice.
BAD RIVER BASIN
4405. North Pork Bad River at Philip, S. Dak.
Location. Lat 44°02', long 101 °41', in SW£sw£ sec.14, T.I N., R.20 E., near center of span on downstream side of highway bridge, half a mile west of Philip and 1^- miles upstream from confluence with Cottonwood Creek.
Drainage area. 164 sq mi, approximately.
Gage. Nonrecording. Datum of gage is 2,154.19 ft above mean sea level, datum of 1929.
Stage-discharge relation. Defined by current-meter measurements below 1,100 cfs.
Bankfull stage. 15 ft.
Remarks. Only annual peaks are shown.
Peak stages and discharges
Water year
1927
1939 1940
1941
Date
May 1927
May 25, 1939 Apr. 3O, 194O
May 1, 1941
Gage height (feet)
18.2
10.5 2.15
-
Discharge (cfs)
1,000 3.6
762
Water year
1941 1942 1943 1944
Date
June 11, 1941 June 4, 1942 June 14, 1943 Apr. 7, 1944
a Backwater from Cottonwood Creek.
Gage height (feet)
alO.2 14.7 13.72 6.40
T1 scharge (cfs)
1,640 1,470
352
4410. Bad River near Midland, S. Dak.
Location Lat 44°04'05", long_ 101°07'45", in SE^SE^ sec.5, T.I N., R.25 E., on>ank near downstream side of highway bridge* three-fifths"of''sTirile'
, lij miles east of Midland, and 2^ mites downstreamdownstream from Ash Creek from Mitchell Creek.
Drainage area. 1.500 sq mi, approximately.
Gage. Nonrecording prior to Feb. 21, 1961; recording thereafter. Datum of gage is 1,833.42 ft above mean sea level, datum of 1929.
Stage-discharge relation.--Defined by current-meter measurements.
Bankfull stage. 15 ft.
Remarks. Base for partial-duration series, 500 cfs. Only annual peaks are shown prior to 1948.

390 BAD RIVER BASIN
Peak stages and discharges of Bad River near Midland, S. Pak.
Water year
1946
1947
1948
1949
1950
1951
1952
1953
1954
1955
Date
June 20, 1946
June 24, 1947
Mar. 16, 1948May 10, 1948June 17, 1948June 21, 1948June 24, 1948
Mar. 10, 1949Mar. 24, 1949
Mar. 25, 1950Apr. 1, 1950May 6, 1'950
Mar. 28, 1951June 8, 1951Sept. 4, 1951
Feb. 14, 1952Apr. 2, 1952Apr. 5, 1952Apr. 7, 1952May 24, 1952June 4, 1952June 28, 1952
Mar. 14, 1953Mar. 18, 1953Mar. 21, 1953May 3, 1953June 15, 1953Aug. 3, 1953Aug. 5, 1953
May 25, 1954
Mar. 9, 1955
Gage height (feet)
5.74
6.15
a5.004.5010.58.906.75
a6.307.05
9.3811.008.60
3.845.504.51
a4.8714.0013.6012.105.006.649.12
9.388.439.40
10.166.457.54.95
5.04
a7.03
Discharge (cfs)
1,020
1,480
_640
5,0803,6601,840
1,0001,970
4,0405,5703,300
5421,200
793
55011,20010,3007,560
8361,8903,840
5,3804,2505,4006,3402,3803,3301,050
1,050
-
Water year
1955
1956
1957
1958
1959
1960
1961
1962
1963
Date
Mar. 9, 1955May 29, 1955Sept. 23, 1955
Mar. 2, 1956Mar. 20, 1956July 4, 1956
May 22, 1957May 26, 1957June 12, 1957
Apr. 27, 1958June 3, 1958June 14, 1958June 18, 1958
May 7, 1959May 28, 1959May 31, 1959July 14, 1959Sept. 1, 1959
Mar. 23, 1960Mar. 26, 1960June 21, 1960
June 14, 1961
Mar. 28, 1962May 21, 1962May 24, 1962June 1, 1962June 18, 1962July 16, 1962
May 26, 1963May 31, 1963June 8, 1963June 18, 1963
C-age height (feet)
a6.565.595.5
a5.626.715.20
6.818.809.40
4.134.224.984.08
4.843.863.985.954.98
11.046.825.40
7.70
6.203.534.484.487.685.46
3.75'6.016.646.93
Discharge (cfs)
2,2001,4401,120
5702,4601,170
2,4404,6805,400
603719
1,060643
1,030636684
1,7301,110
7,4802,5501,330
3,290
1,940512861861
3,4301,380
5601,5602,0902,370
a Backwater from ice.
4415. Bad River near Fort Plerre, S. Dak.
Location. Lat 44°19'4Q", long 100°23'00", In NW£ sec.10, T.4 N., R.31 E., on right bank on downstream side of pier of highway bridge, 2^ miles south of Fort Pierre, 4f miles downstream from Willow Creek, and 5 miles upstream from mouth.
Drainage area. 3,107 sq ml.
Gage.--Nonrecording prior to July 10, 1951; recording thereafter. Datum of gage Is 1,427.83 ft above mean sea level, datum of 1929.
Stage-discharge relation. Defined by current-meter measurements below 33,000 cfs.
Bankfull stage.--16 ft.
Historical data.--Flood in April 1927 reached at stage of 30.89 ft, from flood- mark (discharge, about 50,000 cfs}. From House Document 189, flood In July 1905 reached a stage about 2 ft higher than that of 1927. Roughly estimated discharge for 1905 flood is 70,000 cfs. Floods in 1915 and June 1920 reached stages of 29.6 and 27.4 ft, respectively.
Remarks. Base for partial-duration series, 1,100 cfs. shown prior to 1948.
Only annual peaks are

BAD RIVER BASIN 391
Peak stages and discharges of Bad River near Fort Pierre, S. Dak.
Water year
1905
1915
1920
1927
19291930
19311932
19341935
1936193719381939
1940
194119421943
19441945
19461947
1948
1949
1950
1951
1952
Date
July 1905
-
June 1920
April 1927
Apr. 25, 1929Aug. 19, 1930
Jan. 30, 1931May 7, 1932
July 26, 1934Apr. 26, 1935
Mar. 11, 1936June 13, 1937Sept. 8, 1938Mar. 20, 1939Aug. 27, 1939Apr. 1, 1940
June 11, 1941May 1, 1942Mar. 23, 1943June 14, 1943Apr. 1, 1944Mar. 2, 1945June 13, 1945
July 2, 1946Mar. 21, 1947June 22, 1947
Feb. 26, 1948Mar. 15, 1948Mar. 19, 1948May 10, 1948June 18, 1948June 21, 1948June 24, 1948July 20, 1948Aug. 9, 1948
Mar. 8, 1949Mar. 22, 1949Mar. 27, 1949Apr. 10, 1949June 1, 1949
Oct. 11, 1949Mar. 5, 1950Mar. 17, 1950Mar. 25, 1950Apr. 2, 1950May 8, 1950Sept. 21, 1950
Mar. 27, 1951June 8, 1951June 24, 1951July 3, 1951
Oct. 4, 1951Apr. 1, 1952Apr. 7, 1952June 5, 1952June 23, 1952June 29, 1952
Gage height (feet)
a32.9
29.6
27.4
30.89
21.1820.20
8.4017.24
9.9812.60
5.1121.8517.6b9.80
-5.83
11.2227.816.04
-10.75
blO.72
12.53bll.4
-
1)7.38blS.OblO.95
9.4513.9712.0012.00S.52
15.96
7.6bll.610.816.917.75
7.909.00
15.1521.2023.4016.9519.80
12.6319.509.62
15.60
15.13b27.2427.0311.388.3012.55
Discharge (cfs)
a70,000
-
-
a50,000
11,80010,200
2,3007,350
3,1004,480
84412,4008,700_
2,7201,070
4,10034,2006,9306,9303,930_
1,240
4,600-
2,290
1,1002,6002,7002,3505,3803,8303,8301,8007,180
1,360-
3,3501,1001,620
1,540h(c)12,70016,7008,120
10,800
4,42010,5002,3306,680
6,260_
28,1003,4101,6204,260
Water year
1953
1954
1955
1956
1957
1958
1959
1960
1961
1962
1963
Date
Mar. 14, 1953Mar. 21, 1953May 2,3, 1953June 15, 1953Aug. 2, 1953Aug. 5, 1953
June 11, 1954
Mar. 10, 1955Mar. 14, 1955June 1, 1955June 4, 1955June 28, 1955
Mar. 4, 1956Mar. 17, 1956Mar. 17, 1956Mar. 20, 1956Mar. 27, 1956July 6, 1956Aug. 12, 1956
Apr. 20, 1957May 17, 1957May 21, 1957May 23, 1957May 27, 1957May 31, 1957June 11, 1957June 16, 1957Aug. 30, 1957
Apr. 5, 1958June 3, 1958June 13, 1958
May 30, 1959
Mar. 27, 1960Apr. 4, 1960May 26, 1960June 21, 1960Aug. 19, 1960Aug. 25, 1960
May 17, 1961June 14, 1961
Mar. 28, 1962May 17, 1962May 19, 1962May 21, 1962May 29, 1962June 17, 1962June 19, 1962June 25, 1962July 5, 1962July 15, 1962July 18, 1962
May 12, 1963May 31, 1963June 2, 1963June 7, 1963June 9, 1963June 19, 1963July 7, 1963Sept. 4, 1963
Gage height (feet)
19.7818.8819.8011.259.37
11.19
23.35
b22.90b8.6713.6811.169.43
7.71b!2.25bll.0310.417.457.507.27
10.509.48
11.389.47
12.077.50
15.267.918.62
10.418.687.33
8.06
23.368.638.0517.008.60
20.38
21.9320.21
11.988.018.10
19.707.4614.009.55
12.4515.576.777.21
7.826.686.647.108.078.527.81
11.88
Discharge (cfs)
10,10010,50011,7003,0202,1103,260
16,600
-1,6205,1203,2402,170
1,460-
2,3003,0501,3301,4401,330
3,1002,3503,4602,3503,9301,2906,3901,4201,770
3,0502,0401,280
1,640
16,6001,9501,5707,9401,90011,600
12,80010,600
3,8701,6801,730
10,5001,4205,2202,3604,2006,5201,1101,300
1,5901,2701,2501,2501,7201,9401,5603,800
a About.b Backwater from ice.c Unknown; greater than 1,100 cfs.

392 MUSH CREEK BASIN
4416.5. Mush Creek near Pierre, S. Dak.
Location. Lat 44"SO 1 , long 100°13', in NE£ sec.16, T.110 N., R.78 W., at bridge on State Highway 34, 7| miles east of Pierre.
Drainage area.--14.6 sq mi.
Gage.--Crest-stage gage.
Stage-discharge relation. Defined by current-meter measurement? below 50 cfs and extended above on basis of slope-area measurements at 68f and 3,620 cfs.
Remarks. Only annual peaks are shown.
Peak stages and discharges
Water year
1956 195719581959 1960
Date
Aug. 10, 1956 Nov. 2, 1956March 195SJuly 14, 1959 May 18, 1960
Gage height (feet)
7.49 2.14
a2.322.7S 6.30
Discharge (cfs)
3,620 8020210
2,070
Water year
1961 196219631964
Date
July 25, 1961 June 15, 1962June 6, 1963May 2, 1964
Gage height (feet)
1.75 5.824.203.15
Discharge (cfs)
75 1,560
686275
a Backwater from ice.
UNNAMED MISSOURI RIVER TRIBUTARIES
4416."V. Missouri River tributary near Pierre, 3. Dak.
Location. Lat 44°20', long 100°12', in NE^ sec.15, T.110 N., R.78 W., at cul- vert on State Highway 34, 8 miles east of Pierre.
Drainage area. 0.42 sq mi.
Gage. Crest-stage gage.
Stage-discharge relation.--Defined by current-meter measurements below 20 cfs and extended above on basis of Indirect measurements at 559 and 705 cfs.
Remarks. Only annual peaks are shown.
Peak stages and discharges
Water year
1956 1957 1958 1959 1960
Date
Aug. 10, 1956 June 10, 1957 March 1958 May 30, 1959 May 18, 1960
Gage height (feet)
10. 3S 2.53
a2.47 2.97 3.24
Discharge (efs)
705 43 5
62 559
Water year
1961 1962 1963 1964
Date
June 1961 June 15, 1962 June 6, 1963 May 2, 1964
Gage height (feet)
2.54 4.43 3.86 2.10
Discharge (efs)
43 147 110 24
a Backwater from ice
4417.5. Missouri River tributary near Canning, S. Dsk.
Location. Lat 44°20', long 100°10', in NW^- sec.13, T.110 N., R.78 W., at cul- vert on State Highway 34, 8 miles southwest of Canning.
Drainage area.--0.20 sq mi.
Gage. Crest-stage gage.
Stage-discharge relation. Defined by current-meter measurements below 12 cfs and extended above on basis of indirect measurements at 172 and 284 cfs.
Remarks. Only annual peaks are shown.

UNNAMED MISSOURI RIVER TRIBUTARIES 393
Peak stages and discharges of Missouri River tributary near Canning, S. Dak.
Water year
19561957195819591960
Date
Aug. 10, 1956June 10, 1957March 1958July 14, 1959May 18, 1960
Gage height (feet)
6.403.88
a2.454.527.40
Discharge (cfs)
172671
92284
Water year
1961196219631964
Date
June 1961June 15, 1962June 6, 1963July 10, 1964
Gage height (feet)
3.976.223.934.59
D'.scharge (cfs)
711627095
a Backwater from ice.
MEDICINE KNOLL CREEK BASIN
4420. Medicine Knoll Creek near Blunt, S. Dak. (Published as "Medicine Creek" prior to October 1959)
Location. Lat 44°33'45", long 99"54'40", in NW^ sec.31, T.113 N., R.75 W., on left bank at downstream side of highway bridge, 3 miles upstream frotr South Pork Medicine Knoll Creek and 5 miles northeast of Blunt.
Drainage area. 455 sq mi, approximately.
Gage. Nonrecording prior to Oct. 31, 1950; recording thereafter. Altitude of gage is 1,612 ft (by barometer).
Stage-discharge relation. Defined by current-meter measurements.
Bankfull stage. 10 ft.
Remarks. Base for partial-duration series, 50 cfs.
Peak stages and discharges
Water year
1917 J
1950
1951
1952
1953
1954
1955
1956
Date
Mar. 26-29, 1950 Mar. 30, 1950
Mar. 2S, 1951Aug. 16, 1951
Apr. 5, 1952
Mar. 14, 1953 Mar. 17, 1953 Mar. 22, 1953May 2, 1953 Aug. 2, 1953
June 13, 1954
Mar. 11, 1955
Mar. 19, 1956
Gage height (feet)
a!5
b!3.2
b9.008.55
12.34
bll.89 bll.58 bll.27
8.47 11.04
7.91
b!2.04
b9.85
Discharge (efs)
cl,300
_52
1,830
330 44452
458
12
526
-
Water year
1956
1957
1958
1959
1960
1961
1962
1963
Date
Mar. 21, 1956
May 26, 1957
Mar. 26, 1958
June 20, 1959
Mar. 27, 1960Apr. 1, 1960 Apr. 5, 1960 Aug. 30, 1960
May 20, 1961
Mar. 27, 1962 June 18, 1962June 22, 1962 Aug. 11, 1962
Apr. 16, 1963
Gage height (feet)
b9.00
8.32
blO.15
7.72
b!2.3012.05 11.39 9.25
8.18
blO.70 9.109.08
10.22
7.81
Ilscharge (cfs)
12
15
clOO
4.1
_1,540
932 102
21
140 5756
1S4
6.3
a Annual peak only; s b Backwater from ice. c About.
UNNAMED MISSOURI RIVER TRIBUTARIES
4420.5. Missouri River tributary near De Grey, S. Dak.
Location.--Lat 44°18', long 99°59', in SW£ sec.28, T.110 N., R.76 W., at cul- vert on State Highway 34, 3-jr miles northwest of De Grey.
Drainage area. 1.64 sq mi.
Gage. Crest-stage gage.
Stage-discharge relation.--Defined by current-meter measurements below 125 cfs and extended above on basis of indirect measurements at 470 and 976 cfs.
Remarks. Only annual peaks are shown.

394 UNNAMED MISSOURI RIVER TRIBUTARIES
ppal- itaf°p ftn<1 <iisnharPPB of Missouri River tributary near De
Water year
1956 1957 1958 1959 1960
Date
Aug. 1, 1956 June 10, 1957 March 1958 Sept. 18, 1959 Aug. 24, 1960
Gage height (feet)
6.99 5.96
al.50 1.85 4 60
Discharge (cfs)
976 750 10 85
485
Water year
1961 1962 1963 1964
Date
June 1961 June 15, 1962 June 6, 1963 July 10, 1964
Grsy, S.
Gage h-jight (feet)
1.81 5.935.52 .60
Dak.
Discharge (cfs)
79 745 660 310
a Backwater from ice.
MEDICINE CREEK BASIN
4423.5. North Fork Medicine Creek near Vivian, S. Dak.
Location. Lat 43°57', long 100°20', in SW£ sec.28, T.106 N., R.79 W., at bridge on U.S. Highway 83, 2f miles northwest of Vivian.
Drainage area. 45.9 sq mi.
Gage.--Crest-stage gage. At site 1,300 ft upstream at different datum prior to June 1961. *
Stage-discharge relation. Defined by current-meter measurements below 500 cfs 1956-60 and throughout 1961-64.
Remarks. Only annual peaks are shown.
Peak stages and discharges
Water year
19561957 195819591960
Date
Mar. 24, 1956Apr. 18, 1957 Apr. 7, 1958
Apr. 3, 1960
Gage height (feet)
2.623.83 2.92-
7.05
Discharge (cfs)
36195560
1,080
Water year
1961196219631964
Date
June 14, 1961June 25, 1962 June 6, 1963Apr. 27, 1964
Gage height (feet)
3.79
4.77
Discharge (cfs)
61
113
4423.8. Medicine Creek tributary near Vivian, S. Dik.
Location.--Lat 44°06', long 100°20', in SE£ sec.5, T.107 N., R.73 W., at cul- vert on former U.S. Highway 83, 12^ miles northwest of Vivian.
Drainage area. 0.30 sq mi.
Gage. Crest-stage gage.
Stage-discharge relation. Defined by current-meter measurements below 20 cfs and extended above on basis of indirect measurement at 214 cfs.
Remarks. Only annual peaks are shown.
__ Peak stages and discharges
Water year
1956 1957 1958 1959 1960
Date
Aug. 10, 1956 Apr. 18, 1957 Apr. 6, 1958 Sept. 1, 1959 May 18, 1960
Gage height (feet)
3.91 7.81 4.32 8.03 6.29
Discharge (cfs)
37 202 50
214 128
Water year
1961 1962 1963 1964
Date
June 14, 1961 June 15, 1962 March 1963 May 3, 1964
Q-Jge height (feet)
3.20 9.72 3.09 5.71
Discharge (cfs)
18 302 15
104

MEDICINE CREEK BASIN 395
4424. Medicine Creek tributary No. 2 near Vivian, S. Dak.
Location. Lat 44°02', long 100°19', in NW^ sec.33, T.107 N., R.79 W., at cul vert on U.S. Highway 83, 8 miles northwest of Vivian.
Drainage area. 8.62 sq mi.
Gage. Crest-stage gage. At site 50 ft upstream at different datum prior to June 1961.
Stage-discharge relation.--Defined by current-meter measurements.
Remarks. Only annual peaks are shown.
Peak stages and discharges
Water year
1956 1957 1958 1959 1960
Date
Mar. 19, 1956 Apr. 18, 1957 Apr. 6, 1958 Sept. 18, 1959 Mar. 26, 1960
Gage height (feet)
a6.67 4.58 4.00 3.43 4.80
Discharge (cfs)
50 340 120 35
475a Backwater from ice.
Water year
1961 1962 1963 1964
Date
June 14, 1961 May 16, 1962 June 6, 1963 May 3, 1964
Gage height (feet)
3.56 a6.36 3.76 5.14
Di scharge (cfs)
60 180 72
185
4425. Medicine Creek at Kennebec, S. Dak.
Location. Lat 43°54', long 99°52', in NW^-NE^ sec.18, T.105 N., R.75 W., on right bank 4 ft downstream from highway bridge, half a mile west of Kennebec. and half a mile downstream from nearest tributary.
Drainage area. 465 sq mi.
Gage.--Recording. "1929.
Datum of gage is 1,659.64 ft above mean sea level, datum of
Stage-discharge relation. Defined by current-meter measurements. Remarks.--Base for partial-duration series, 100 cfs.
Peak stages and discharges
Water year
1952
1955
1956
1957
1958
1959
Date
April 1952
Mar. 10, 1955Apr*. 1, 1955June 4, 1955
Mar. 22, 1956Mar. 26, 1956Apr. 2, 1956Apr. 6, 1956
Apr. 19, 1957Apr. 21, 1957May 23, 1957June 9, 1957June 12, 1957June 14, 1957June 18, 1957Aug. 31, 1957
Mar. 28, 1958Apr. 8, 1958May 17, 1958
-
Gage height (feet)
a!7.0
13.543.348.66
5.654.594.843.24
b6.4212.365.365.179.734.95
10.025.91
7.349.863.93
-
Discharge (cfs)
_
1,840117682
271210229107
c!501,420260251694233910315
490889152
0
Water year
1960
1961
1962
1963
1964
Date
Mar. 28, 1960Apr. 5, 1960May 19, I960May 26, 1960
May 18, 1961June 16, 1961
Mar. 31, 1962May 17, 1962May 23, 1962May 30, 1962June 18, 1962June 23, 1962June 27, 1962July 2, 1962July 7, 1962July 15, 1962
June 9, 1963
Apr. 28, 1964
Gage height (feet)
16.7114.2815.215.20
3.794.40
dlO.3813.049.7414.2510.736.77
10.4910.823.76
10.97
4.23
12.44
D.' scharge (cfs)
8,9702,6203,780
253
144191
7001,760869
2,5901,020
457989
1,040146
1,030
172
el, 490
a Annual peak only; from floodmarks. b Backwater from temporary dam. d Backwater from ice. e Annual peak only.

396 MISSOURI RIVER MAIN STEM
4430. Missouri River at Chamberlain, 3. Dak.
Location.--Lat 43°48'40", long 99°20'10", in NE£ sec.16, T.104 N., R.71 W.,near left bank on downstream side of bridge on U.S. Highway 16 at Chamberlain, at mile 1,012.8.
Drainage area.--250,800 sq mi, approximately.
Gage. Nonrecording, except recording Aug. 27, 1945, to Jan. 18, 1954. At site 1,800 ft upstream at datum 4.00 ft higher Aug. 19, 1928, to Sept. 30, 1929. At site 600 ft upstream Mar. 7, 1945, to May 26, 1953, and at site 1,800 ft upstream May 27, 1953, to Jan. 18, 1954; both at present datum. Datum of gage is 1,320.11 ft above mean sea level, datum of 1929. Gage heights ad justed to present datum.
Stage-discharge relation. Defined by current-meter measurements.
Bankfull stage.--18 ft.
Remarks. Plow regulated by Port Peck Reservoir (usable capacity, 18,800,000 acre-ft) since November 1937, and by Garrison Reservoir (capacity, 23,000,000 acre-ft) since November 1953. Only annual peaks are shown.
Peak stages and discharges
Water year
1929
1943
1945
1946 1947
Date
Mar. 30, 1929 June 4, 1929
Apr. 7, 1943
Mar. 21, 1945
June 21, 1946 Apr. 2, 1947
Gage height (feet)13.26
19.3
11.45
10.35 16.22
Discharge (cfs)
151,000
107,800
81,000 213,000
Water year
1948 1949 1950
1951 1952 1953 1954
Date
Mar. 25, 1948 Apr. 6, 1949 Apr. 22, 1950
Apr. 8, 1951 Apr. 11, 1952June 18, 1953 Oct. 30, 1953Sept. 30, 1954
Gage height (feet)11.82 15.02 18.80
11.52 25.55 13.97 8.66
a!3.83
Discharge (cfs)
122,000 177,000 250,000
113,000 440,000112,000 47 , 500
-
a Backwater from Port Randall Reservoir.
WHITE RIVER BASIN
4432. White River tributary near Glen, Nebr.
Location.--Lat 42°37', long 103°39', in Wi sec.34, T.31 N., R.54 W., on left upstream wingwall of steel truss bridge on unimproved road, 4.5 miles west of Glen.
Drainage area. 7.97 sq mi.
Gage.--Crest-stage gage.
Stage-discharge relation.--Defined by current-meter measurements below 41 cfs and extended above on basis of slope-area measurements at 229 and 300 cfs.
Bankfull stage.--13 ft.
Remarks. Only annual peaks are shown.
Peak stages and discharges
Water year
195319541955
195619571958
Date
June 19, 1953May 22, 1954Sept. 20, 1955
June 16, 1956May 25, 1957Aug. 7 , 1958
Gage height (feet)
11.7110.8113.30
10.5511.1711.32
Discharge (cfs)
4212
229
81924
Water year
19591960
196119621963
Date
June 29, 1959Mar. 18, 1960
Aug. 1, 1961July 31, 1962June 6, 1963
Gage I eight (feet)
10.7612.18
10.4814.4014.22
Discharge (cfs)
1142
2.5435380

WHITE RIVER BASIN 397
4433. Deep Creek near Glen, Nebr.
Location.--Lat 42°37', long 103°34', in SE^SE^ sec.32, T.31 N., R.53 W., on right downstream side of bridge on dirt road 1.4 miles east of Glen.
Drainage area.--10.9 sq mi.
Gage.--Crest-stage gage.
Stage-discharge relation.--Defined by low-flow estimates, and slope-area meas- urements at 187 and 3,050 cfs.
Remarks.--Only annual peaks are shown.
Peak stages and discharges
Water year
195519541955
1956 19571958
Date
Aug. 15, 1953May 22, 1954Sept. 20, 1955
May 27, 1956 May 23, 1957July 9, 1958
Gage height (feet)
14.927.5
11.76
10.375.84
10.88
Discharge (cfs)
3,0502
140
50 1.5
80
Water year
19591960
19611962 1963
Date
May 14, 1959Aug. 24, 1960
Aug. 1, 1961July 31, 1962 June 6, 1963
Gage height (feet)7.4312.4
10.4810.58 8.30
D'.scharge (cfs)
1187
516030
4437. Soldiers Creek near Crawford, Nebr.
Location.--Lat 42°41', long 103°32', in NE^SW^ sec.3, T.31 N., R.53 W., 75 ft upstream from wooden bridge near stockyard on James Ranch, 0.4 mile upstream from boundary fence on Fort Robinson Military Reservation, 0.7 mile upstream from reservoir on Fort Robinson Military Reservation, and 6 miles west of Crawford.
Drainage area. 52.6 sq mi.
Gage. Crest-stage gage. At datum 0.67 ft higher prior to Aug. 22, 1961.
Stage-discharge relation. Defined by low-flow estimates, and three indirect measurements at 64, 949, and 3,970 cfs; subject to change owing to beaver activity.
Remarks.--Only annual peaks are shown.
Peak stages and discharges
Water year
1955
1956 1957 1958 1959
Date
Sept. 20, 1955
Oct. 4, 1955 July 20, 1957 July 10, 1958 Apr. 9, 1959
Gage height (feet)
16.49
9.79 11.72 21.90 10.27
Discharge (cfs)
949
5 55
3,970 3.5
Water year
1960
1961 1962 1963
Date
Mar. 18, 1960
Aug. 1, 1961 June 16, 1962 Feb. 2, 1963
Gage height (feet)
16.12
9.55 11.87
a!3.03
lischarge (cfs)
840
9 33
b30
a Backwater from ice. b Estimated.
4439. White River tributary No. 2 near Crawford, Nebr.
Location.--Lat 42°39', long 103°24', on east line of sec.22, T.31 N., R.52 W., at box culvert on State Highway 2, 2.2 miles south of junction of State Highway 2 and U.S. Highway 20, and 3 miles south of Crawford.
Drainage area.--5.45 sq mi.
Gage. Crest-stage gage.
Stage-discharge relation.--Defined by low-flow estimates, and slope-area measurement at 698 cfs.
Remarks. Only annual peaks are shown.
219-848 O - 66 - 27

398 WHITE RIVER BASIN
Peak stages and discharges of White River tributary No. 2, near Crawford, Nebr.
Water year
1953 1954 1955
1956 1957 1958
Date
May 22, 1954
July 10, 1958
Gage height (feet)
10.36
11.29
Discharge (cfs)
0 1.6 0
0u
450
Water year
1959 19601961 1962 1963
Date
May 24, 1960
June 6, 1963
Gage height (feet)
11.12
(a)
Discharge (cfs)
0 698
0 0
b .5
a Below 10.0 ft. b Estimated.
4440. White River at Crawford, Nebr.
Location. Lat 42°41', long 103°25', in W| sec.3, T.31 N., R.52 W., on right bank 15 ft downstream from bridge in city park at Crawford.
Drainage area.--313 sq mi. At site used Oct. 3, 1933, to Sept. 30, 1943, 295 sq mi.
Gage. Nonrecording prior to Oct. 29, 1947; recording thereafter. At site half a mile upstream at different datum prior to Oct. 2, 1933. At site 1 mile up stream at different datum Oct. 3, 1933, to Sept. 30, 1943. Datum of gage is 3,659.52 ft above mean sea level, datum of 1929.
Stage-discharge relation.--1931-44: Defined by current-meter measurements below 120 cfs and extended above on basis of slope-area measurement at 1,100 cfs. 1947-63: Defined by current-meter measurements below 240 cfs and extended above on basis of logarithmic plotting.
Historical data.--Flood of May 20, 1920, reached a stage of about 9.9 ft, site and datum of 1934-44, from Chicago, Burlington, and Quincy Railroad records of stage comparative with the 1938 peak at railroad bridge l£ miles upstream (discharge, about 1,000 cfs). Data for flood of Aug. 20, 1944, was obtained from records of Nebraska Bureau of Roads and Bridges; maximum stage known for at least 1918-44 according to Crawford Tribune. Local reports indicate that a 1947 stage was higher than that of Mar. 15, 1948.
Remarks.--Base for partial-duration series, 60 cfs. shown prior to 1948.
Only annual peaks are
Peak stages and discharges
Water year
1920
19311932193319341935
19361937193819391940
1941194219431944
1948
Date
May 20, 1920
Aug. 16, 1931May 6, 1932Aug. 28, 1933
Tlar. 30, 1934June 16, 1935
Sept. 4, 1936Feb. 15, 1937Apr. 24, 1938Mar. 10, 1939Aug. 2, 1940
Apr. 2, 1941May 12, 1942June 23, 1943Aug. 20, 1944
Feb. 19, 1948Mar. 15, 1948Mar. 18, 1948May 8, 1948May 24, 1948June 3, 1948June 17, 1948July 18, 1948Aug. 1, 1948Aug. 5, 1948
Gage height (feet)
a9.9
3.76.0
10.32.106.02
10.822.32
10.133.82
11.2
2.1011.65.04
14.4
2.456.882.271.931.771.973.413.202.932.12
Discharge (cfs)
al,000
136350
1,08042
452
1,10081
1,010204
1,170
721,230
266al,700
1541,580
141886281
405351287121
Water year
1949
1950
1951
1952
1953
1954
1955
Date
Jan. 8, 1949May 21, 1949May 29, 1949July 30, 1949Aug. 19, 1949
Jan. 19, 1950Aug. 4, 1950
July 28, 1951July 31, 1951Sept. 3, 1951Sept. 4, 1951
Mar. 30, 1952June 27, 1952
June 7, 1953July 29, 1953Aug. 16, 1953
May 23, 1954June 18, 1954July 28, 1954
June 3, 1955June 17, 1955June 22, 1955Aug. 6, 1955
Gage height (feet)
b4.641.742.241.682.05
b3.332.04
3.432.564.372.68
1.663.02
2.611.736.05
2.421.741.91
1.683.121.741.97
Discharge (cfs)
-60
12963
109
-99
410205681231
81315
25766
1,270
1726793
6233967
104a About; site and. datum used 1934-43. b Backwater from ice.

WHITE RIVER BASIN 399
Peak stages and discharges of White River at Crawford, Nebr. Continued
Water year
1955
1956
1957
1958
1959
1960
Date
Sept. 20, 1955
May 27, 1956June 17, 1956July 2, 1956
Feb. 6, 1957May 20, 1957May 25, 1957May 31, 1957June 11, 1957Aug. 17, 1957
June 18, 1958July 10, 1958Aug. 7, 1958Sept. 12, 1958
June 22, 1959July 16, 1959
Mar. 9, 1960Mar. 21, 1960
Gage height (feet)
5.90
1.752.425.10
b3.871.721.761.942.072.45
2.227.72.553.21
4.403.82
--
Discharge (ofs)
1,220
66182958
-65688696
182
921,060
126212
390303
460740
Water year
1960
1961
1962
1963
Date
May 15, 1960May 25, 1960Aug. 8, 1960Aug. 24, 1960
Oct. 13, 1960July 29, 1961
May 26, 1962May 28, 1962June 6, 1962June 17, 1962July 10, 1962July 20, 1962July 31, 1962
Feb. 2, 1963May 31, 1963June 2, 1963June 7, 1963June 15, 1963Aug. 18, 1963
Gage height (feet)
-3.35-
6.25
1.952.22
---
2.81-
4.23-
b4.402.062.56-
2.082.30
Eischarge (cfs)
145232260750
6292
220120110164150364280
-76
12715074100
b Backwater from ice.
4450. White River below Cottonwood Creek,near Whitney, Nebr.
Location. Lat 42°48'35", long 103°10'05", in NE^NE^ sec.26, T.33 N., R.50 W., on left bank half a mile downstream from Cottonwood Creek and 4^ miles northeast of Whitney.
Drainage area. 676 sq mi.
Gage.--Recording. Altitude of gage is 3,320 ft (from topographic map).
Stage-discharge relation. Defined by current-meter measurements below 3,300 cfs.
Remarks. Peak discharge not appreciably affected by diversions. Base for partial-duration series, 350 cfs.
Peak stages and discharges
Water year
1949
1950
1951
1952
1953
1954
1955
Date
Feb. 26, 1949May 21, 1949
May 9, 1950
June 19, 1951July 28, 1951Sept. 4, 1951
Mar. 20, 1952June 28, 1952
Mar. 9, 1953June 8, 1953July 29, 1953
May 23, 1954
May 17, 1955May 27, 1955June 3, 1955
Gage height (feet)
_11.14
10.76
10.4811.8616.21
b!2.858.96
b!2.0410.6111.00
19.01
10.315.7014.44
Discharge (cfs)
a560582
498
551722
1,330
-359
-570650
2,310
4601,090
919
Water year
1955
1956
1957
1958
1959
1960
1961
Date
Aug. 11, 1955Sept. 20, 1955
May 27, 1956
May 17, 1957May 20, 1957May 25, 1957
July 10, 1958July 30, 1958
fMar. 18, 1959June 3O, 1959
Mar. 20, 1960May 28, 1960
July 20, 1961July 29, 1961
Gage height (feet)
16.2017.56
14.72
15.0820.0919.12
16.66-
b9.508.90
-11.98
14.5513.93
Discharge (cfs)
1,2301,400
974
1,0704,4802,450
995450
-243
370528
765704
a Dally mean.b Backwater from ice.

400 WHITE RIVER BASIN
4455. White River near Chadron, Nebr.
Location. Lat 42°50', long 103°07', in SE^ sec.18, T.33 N., R.49 W., 20 ft downstream from bridge on U.S. Highway 20, 2 miles downstrearr from Dead Horse Creek, and 6 miles west of Chadron.
Drainage area.--750 sq mi, approximately.
Gage.--Nonrecording prior to Dec. 7, 1934; recording thereafter.
Stage-discharge relation. Defined by current-meter measurements below 1,900 cfs and by slope-area measurement at 2,040 cfs.
Remarks. Peak discharges not appreciably affected by diversions. Base for partial-duration series, 380 cfs.
Peak stages and discharges
Water year
1931
1932
1933
1934
1935
1936
1937
1938
1939
1940
Date
Aug. 17, 1931
Apr. 24, 1932
Apr. 21, 1933
Aug. 17, 1934
Apr. 26, 1935May 19, 1935June 1, 1935
Sept. 4, 1936
May 30, 1937June 12, 1937
May 19, 193S
May 24, 1939Aug. 18, 1939
Apr. 16, 1940Apr. 18, 1940Sept. 6, 1940
Gage height (feet)
7.8
16.8
16. S
16.1
17.1216.1410.27
17.36
10.329.62
9.86
16.6517.66
9.389.91
16. S2
Discharge (cfs)
a320
1,680
1,680
1,220
2,O4O1,240
502
2,350
532442
502
1,5503,120
458510
1,700
Water year
1941
1942
1943
1947
1949
1950
1951
1952
Date
Apr. 14, 1941June 10, 1941July 13, 1941
May 1, 1942May 7, 1942May 12, 1942May 13, 1942May IS, 1942June 6, 1942
Oct. 14, 1942May 30, 1943June 11, 1943Mar. 25, 1943
June 22, 1947
-
-
_
-
Gage h3ight (feet)
11.2616.7316.72
_-
18.07--
13.35
12.5216.2213.91
b!7.24
19.1
-
-
-
-
Discharge (cfs)
6191,4701,470
1,6702,2SO3,6903,560
708664
5821,170
682-
5,500
a600
a5OO
al,200
a360
a About.b Backwater from ice.
4455.3."Chadron Creek at Chadron State Park, near Chadron, Nebr.
Location. Lat 42°43', long 103°01', in Sw£ sec.31, T.32 N., R.^8 W., on left downstream side of box culvert on U.S. Highway 385, 0.9 mile south of entrance to Chadron State Park and 9 miles south of Chadron.
Drainage area. 3.35 sq mi.
Gage. Crest-stage
Stage-discharge relation. Based on low-flow estimates and slope-area measure- ments at 22.9 and 165 cfs.
Remarks. Only annual peaks are shown.
Peak stages and discharges
Water year
1953 19541955
19561957 1958
Date
Sept. 2, 1954May 26, 1955
-
Gage height (feet)
11.349.20
_
Discharge (cfs)
o402.0
00 0
Water year
1959 1960
1961 19621963
Date
Aug. 21, 1959 June 27, I960
July 19, 1961 June 11, 1962July 13, 1963
Gage height (feet)
10.47 12.03
10.62 11.7312.12
Discharge (cfs)
10165
1295
188

WHITE RIVER BASIN 401
4455.6. Chadron Creek near Chadron, Nebr.
Location. Lat 42°43', long 103°01', in NE^ sec.36, T.32 N., R.49 W., 01 left downstream wingwall of concrete culvert, 100 ft south of entrance to Chadron State Park, 200 ft west of U.S. Highway 385, and 8 miles south of Chadron.
Drainage area. 14.9 sq mi.
Gage.--Crest-stage gage.
Stage-discharge relation.--Defined by low-flow estimates and current-meter meas- urements below 86 cfs, and extended above on basis of indirect measurements at 714, 1,610, and 2,020 cfs.
Remar s. Only annual peaks are shown.
Peak stages and discharges
Water year
195319541955
195619571958
Date
July 16, 1953Aug. 29, 1954May 16, 1955
Sept. 28, 1956May 24, 1957July 12, 1958
Gage height (feet)
10.6613.7213.0
9.1610.3310.69
Discharge (cfs)
751,610
714
.65080
Water year
19591960
196119621963
Date
May 26, 1959June 27, 1960
July 17, 1961June 11, 1962July 13, 1963
Gage height (feet)
11.6014.05
9.8814.4712.41
Discharge (cfs)
1822,020
222,740
370
4460. White River near Oglala, S. Dak.
Location. Lat 43°15'10", long 102°49'30", in SW^NE^.sec.24, T.38 N., R.47 W., on right bank at downstream side of highway bridge, 3 miles downstream from Blacktail Creek and 7 miles northwest of Oglala.
Drainage area.--2,200 sq mi, approximately.
Gage. Nonrecording prior to May 6, 1947; recording thereafter. Datum of gage is 2,853.54 ft above mean sea level, datum of 1929.
Stage-discharge relation. Defined by current-meter measurements below 2,800 cfs and extended above by velocity-area studies.
Bankfull stage.--19 ft.
Remarks. Base for partial-duration series, shown prior to 1947.
Peak stages and discharges
cfs. Only annual peaks are
Water year
19441945
1946
1947
1948
1949
1950
1951
1952
1953
1954
Date
June 14, 1944Mar. 26, 1945
May 3, 1946
June 21, 1947June 30, 1947July 10, 1947
Mar. 20, 1948 Aug. 9, 1948
Mar. 4, 1949 Mar. 5, 1949Mar. 22, 1949
May 10, 1950
July 30, 1951
Mar. 13, 1952 Mar. 31, 1952
Mar. 13, 1953Mar. 14, 1953
May 26, 1954
Gage height (feet)
17.1213.68
14.32
23.5019.3519.05
a!3.91 13.16
20.60 20.6314.15
10.50
12.63
all. 70 10.42
a!4.42a!3.99
12.05
Discharge (cfs)
1,370968
1,040
5,2002,0101,880
832
2,670
892
455
733
513
_830
672
Wateryear
1955
1956
1957
1958
1959
1960
1961
1962
1963
Date
June 17, 1955Sept. 21, 1955
Feb. 24, 1956May 30, 1956
May 20, 1957May 26, 1957June 12, 1957
July 13, 1958
Mar. 23, 1959 Sept. 28, 1959
Mar. 20, 1960Mar. 23, 1960
July 22, 1961
June 14, 1962 June 17, 1962 June 28, 1962July 17, 1962
June 16, 1963
Gage height (feet)
13.4619.19
a!7.0410.64
18.9619.5420.14
12.98
a8.20 7.88
a!7.8116.42
9.08
21.73 21.12 15.5714.12
17.97
Discharge (cfs)
8072,110
-510
1,8302,0402,330
750
249
-1,210
355
2,720 2,450 1,130934
1,560
a Backwater from ice.

402 WHITE RIVER BASIN
4464. Cain Creek tributary at Iralay, S. Dak.
Location.--Lat 43°43'00", long 102°23'25", in SE^NW^ sec.12, T.4 S., R.14 E., at bridge on State Highway 40, half a mile east of Iralay.
Drainage area. 14.0 sq mi.
Gage . Crest-stage gage.
Stage-discharge relation. Defined by current-meter measurements below 40 cfs and extended above on basis of slope-area measurements at 1,030 and 2,110 cfs.
Remarks.--Only annual peaks are shown.
Peak stages and discharges
Water year
1956 1957 1958 1959 1960
Date
Aug. 8, 1956 May 19, 1957 July 4, 1958 May 5, 1959 August 1960
Gage height (feet)
4.90 7.98 7.03 6.50 6.20
Discharge (cfs)
320 1,390 1,030
840 730
Water year
1961 1962 1963 1964
Date
August 1961 June 15, 1962 May 31, 1963 June 17, 1964
Gage t eight (feet)
4.44 11.57 7.64 9.34
Discharge (cfs)
220
1,260 2,110
4465. White River near Interior, S. Dak.
Location. La t 43°42'30", long 102 0 01'10", in SE^ sec.12, T.4 S., R.17 E., onright bank 700 ft upstream from highway bridge, 2 miles downstream fromPotato Creek, and 2^ miles southwest of Interior.
Drainage area. 4,120 sq mi, approximately.
Ga e_. Nonrecording. At site about 5 miles downstream at different datumune 24, 1904, to Nov. 30, 1906; at site 700 ft downstream at datum 1.98 ft
lower Sept. 1, 1911, to Sept. 30, 1918; at site 700 ft downstream at same datum Aug. 9, 1928, to June 30, 1932, and Sept. 24, 1939, to June 4, 1942. Gage heights for 1912-18 given herein converted to 1929-42 datum. Altitude of gage is 2,330 ft (from topographic map).
Stage-discharge relation. Defined by current-meter measurements below 7,100 cfs and extended above by logarithmic plotting.
Bankfull stage. 12 ft.
Remarks.--Only annual peaks are shown.
Peak stages and discharges
Water year
1905
1906
1912
1913 1914 1915
1916 1917
Date
June 18, 1905
Aug. 20, 1906
Mar. 20, 1912 Mar. 22, 1912 June 14, 1913 June 30, 1914 June 12, 1915
May 21, 1916 Mar. 23, 1917 May 26, 1917
Gage height (feet)
16.0
7.4
a8.9
6.0 5.4
11.0
8.8 a9.8
Discharge (cfs)
16,500
3,410
8,230 4,720 3,650
13,300
9,120
6,500
Water year
1918
1929 1930
1931 1932
1940
1941 1942
Date
July 17, 1918
Mar. 5, 1929 Aug. 16, 1930
Oct. 3, 1930 May 6, 1932
Mar. 15, 194O July 26, 1940 June 10, 1941 May 1, 1942
Gage height (feet)
7.0
7.5 8.6
6.0 10.0
aS.OO
7.7 12.4
Discharge (cfs)
5,500
6,300 8,510
3,670 11,500
1,940 8,730
17,100
a Backwater from ice.

WHITE RIVER BASIN 403
4465.5. White River tributary near Interior, S. Dak.
Location.--Lat 43°45' ) long 101°57', in SE^ sec.27, T.3 S., R.18 E., at culvert on U.S. Highway 16A, 2| miles northeast of Interior.
Drainage area. 0.14 sq mi.
Gage. Crest-stage gage.
Stage-discharge relation. Defined by current-meter measurements below 25 cfs and extended above on basis of culvert computations at 193 and 558 cfs.
Remarks. Only annual peaks are shown.
Peak stages and discharges
Water year
1956 1957 1958 1959 1960
Date
June 1956 May 20, 1957 July 4, 1958 June 26, 1959 August 1960
Gage height (feet)
8.17 6.21 5.50 7.22 4.30
Discharge (cfs)
490 265 185 380 57
Water year
1961 1962 1963 1964
Date
August 1961 July 27, 1962 June 15, 1963 June 8, 1964
Gage height (feet)
4.76 6.86 4.95 8.76
Discharge (cfs)
105 338 125558
4470. White River near Kadoka, S. Dak.
Location.--Lat 43°45'10", long 101°31'30", in SE^SE^ sec.30, T.3 S., R.22 E., Black Hills meridian, near center of span on downstream side of bridge on State Highway 73, 5 miles upstream from Pass Creek, 5| miles downstream from Cottonwood Creek, and 5f miles south of Kadoka.
Drainage area. 5,000 sq mi, approximately.
Gage.--Nonrecordlng July 19, 1942, to June 13, 1949, and Mar. 9, 1955, to May 17, 1957; intermittent recording and nonrecording June 14, 1949, to Mar. 8, 1955, and since May 17, 1957. At site a quarter of a mile down stream prior to Mar. 9, 1955. Datum of gage is 2,122.18 ft above mean sea level, datum of 1929.
Stage-discharge relation. Defined by current-meter measurements below 16,000 cfs and extended above by logarithmic plotting.
Bankfull stage.--16 ft.
Historical data. Flood of June 4, 1942, reached a stage of 16.24 ft, f-om- floodtnarks at site a quarter of a mile downstream (discharge, about 32,000 cfs). Floods of Mar. 8, 1905, and spring of 1927 were 1 or 2 ft higher than flood of June 4, 1942.
Remarks.--Base for partial-duration series, 3,600 cfs. shown prior to 1948.
Peak stages and discharges
Only annual peaks are
Water year
194219431944
1945
19461947
1948
1949
1950
Date
June 4, 1942May 30, 1943Mar. 24, 1944June 12, 1944Aug. b, 1945
June 19, 1946June 23, 1947
Feb. 19, 1948June 17, 1948June 23, 1948June 26, 1948
Mar. 7, 1949Aug. 18, 1949
Mar. 23, 1950May 9, 1950
a About .
Oage height (feet)
16.2410.25
b!2.2_
7.55
9.9512.20
blO.O8.49.758.50
9.407.70
bS.088.84
Discharge (cfs)
a32,0008,080
-13,1003,700
7,94016,500
4,5005,0008,6905,960
6,8404,250
3,8005,630
Water year
1951
1952
1953
1954
Date
Mar. 23, 1951June 2, 1951June 7, 1951June 20, 1951June 24, 1951Sept. 2, 1951
Mar. 29, 1952May 23, 1952June 28, 1952
Feb. 6, 1953_Mar. 10, 1953Mar. 12, 1953May 2, 1953July 28, 1953Aug. 2, 1953
May 23, 1954
Gage height (feet)
8.337.56
13.838.557.558.63
11.3511.1910.53
bll.43bll.96b9.1410.4613.0813.2
8.78
Discharge (cfs)
4,8504,280
21,7007,1505,2805,280
11,80013,50011,400
9,60010,8006,790
10,80018,80019,300
7,710
b Backwater from Ice.

404 WHITE RIVER BASIN
Peak stages and discharges of White River near Kadoka, S. Dak.--Continued
Water year
1955
1956
1957
1958
1959
Date
Mar. 10, 1955Mar. 11, 1955May 27, 1955Sept. 21, 1955
Feb. 27, 1956
Feb. 27, 1957May 17, 1957May 21, 1957May 26, 1957June 10, 1957
Apr. 26, 1958July 4, 1958July 20, 1958July 31, 1958
May 5, 1959June 30, 1959
Gage height (feet)
b!2.43b9.548.80
13.28
b!2.81
8.209.68
13.4712.4612.19
8.138.238.948.25
12.238.35
Discharge (cfs)
-5,1504,770
14,400
3,000
3,6005,53014,50013,30011,300
3,6903,9604,9103,800
12,0004,190
Water year
1960
1961
1962
1963
Date
Mar. 19, 1960Mar. 19, 1960May 25, 1960
June 14, 1961July 27, 1961
Mar. 21, 1962May 22, 1962May 30, 1962June 13, 1962June 16, 1962June 18, 1962June 21, 1962June 25, 1962July 13, 1962
Oct. 7, 1962May 31, 1963June 16, 1963
Gage height (feet)b!3.9411.118.71
8.119.67
11.8811.459.289.2413.1214.959.438.74
10.24
8.138.54
12.57
Discharge (cfs)
-9,5204,620
3,6606,280
9,6508,9205,4705,410
12,40019,6005,7004,6606,930
3,7304,15010,900
b Backwater from ice.
4495. South Fork White River near Rosebud, S. Dak.
Location.--Lat 43°19'30", long 100°53'05", in NW£ sec.28, T.39 N., R.30 W., on left bank at downstream side of bridge on U.S. Highway 18, 4^ miles down stream from Rosebud Creek and 6| miles northwest of Rosebud.
Drainage area. 1,020 sq mi, approximately, of which about 760 sq mi contributes directly to surface runoff.
Gage.--Nonrecording prior to May 11, 1948; recording thereafter. Altitude of gage is 2,295 ft (by barometer).
Stage-discharge relation. Defined by current-meter measurements below 810 cfs and extended above by velocity-area studies.
Bankfull stage.--17 ft.
Remarks. Base for partial-duration series, 330 cfs. shown prior to 1948.
Peak stages and discharges
Only annual peaks are
Water year
19441945
1946
1947
1948
1949
1950
1951
1952
Date
May 17, 1944Mar. 10, 1945Mar. 12, 1945
Feb. 18, 1946Aug. 28, 1946Mar. 10, 1947Mar. 14, 15, 1947
Mar. 11, 1948Aug. 13, 1948
Mar. 4, 1949Mar. 5, 1949May 31, 1949
Feb. 18, 1950Mar. 16, 1950Mar. 23, 1950Mar. 31, 1950July 18, 1950Mar. 22, 1951 Mar. 26, 1951Mar. 17, 1952Mar. 23, 1952Mar. 29, 1952
Gage height (feet)
13.92a9.96
_
a.6.99-
a6.53
a7.335.52
alO.28all. 87
5.27
a7.75a7.929.985. 885.56
a6.24 a6.35a7.634.976.75
Discharge (cfs)
4,470_
b700
_566_
b417
_498
1,250_392
4001,1002,220
596491
340
650365942
Water year
1953
1954
1955
1956
1957
1958
Date
Peb. 10, 1953Mar. 3, 1953Mar. 15, 1953Mar. 18, 1953May 3, 1953
Jan. 14, 1954Mar. 19, 1954
Mar. 10, 1955Mar. 11, 1955Mar. 14, 1955Mar. 29, 1955June 2, 1955June 16, 1955
Mar. 16, 1956Mar. 20, 1956
Jan. 7, 1957Apr. 21, 1957May 26, 1957 June 16, 1957
Mar. 2, 1958Apr. 8, 1958June 12, 1958
Gage height (feet)a7.00a7.004.915.135.10
a5.924.38
a9.47a9.335.755.004.745.07
a7.514.58
a5.984.674.70 4.80
a6.034.655.40
Discharge (cfs)
--436510500
-311
-770635443368462
-358
-352387 410
-358575
a Backwater from ice. b Maximum daily mean.

WHITE RIVER BASIN 405
Peak stages and discharges of South Pork White River near Rosebud, S. Dak. Continued
Wateryear
1958
1959
1960
1961
1962
Date
July 24, 1958
Aug. 20, 1959
Mar. 21, 1960Mar. 21, 1960Mar. 25, 1960May 25, 1960
Feb. 24, 1961May 19, 1961
May 16, 1962
Gage height (feet)
4.81
6.62
alO.279.526.834.33
a6.064.22
4.59
Discharge (cfs)
416
943
-2,3701,290
337
-299
394
Water year
1962
1963
Date
May 21, 1962May 25, 1962May 30, 1962June 13, 1962June 17, 1962June 21, 1962July 4, 1962July 12, 1962
Dec. 23, 1962June 21, 1963June 26, 1963
Gage height (feet)
6.134.524.654.937.305.584.42
12.27
a8.124.645.26
Discharge (cfs)
986367416519
1,430785356
3,600
_378617
a Backwater from ice.
4497. South Pork White River tributary near Mission, S. Dak.
Location.--Lat 43°20', long 100°43', in NW£ sec.25, T.39 N., R.29 W., at cul- vert on U.S. Highway 83, 3^ miles northwest of Mission.
Drainage area. 2.62 sq mi.
Gage.--Crest-stage gage.
Stage-discharge relation. Defined by current-meter measurements below and extended above on basis of indirect measurement at 646 cfs.
Remarks.--Only annual peaks are shown.
Peak stages and discharges
cfs
Water year
1956 1957 1958 1959 1960
Date
Mar. 19, 1956 June 1957
June 24, 1958 July 1959
Mar. 21, 1960
Gage height (feet)
a4.93 5.79 5.01 3.40 7.95
Discharge (cfs)
35 66 42 10
245
Water year
1961 1962 1963 1964
Date
Mar. 4, 1361 June 1962
February 1963 July 30, 1964
Gage height (feet)
2.26 10.15 a4.55 5.12
Discharge (cfs)
1 646 15 45
a Backwater from ice.
4505. South Fork White River below White River, S. Dak.(Published as "near White River" 1929-32 and as "at
White River" 1938-40)
Location. Lat 43°36'00", long 100°43'50", in NE^SE^ sec.23, T.42 N., R.29 W., on right bank 1 mile upstream from small tributary, 2 miles downstream from Pine Creek, and 2,\ miles northeast of town of White River.
Drainage area. 1,570 sq mi, approximately; 1,380 sq mi, approximately, at 1930-32 site; 1,420 sq mi, approximately, at 1939-40 site. About 260 sq mi
is probably noncontributing.
Gage. Nonrecording prior to August 1938; recording thereafter. At sites 7^ miles upstream 1929-32, and Z\ miles upstream 1938-40, at different datums. Altitude of gage is 1,906 ft (by barometer).
Stage-discharge relation.--Defined by current-meter measurements below 600 cfs 1929-32 and below 280 cfs 1938-40; extended above by velocity-area studies. Defined by current-meter measurements throughout at present site.
Bankfull stage.--? ft.
Remarks.--Peaks affected by regulation at small powerplant 3 miles upstream subsequent to 1938. Discharges given herein converted to present site by drainage-area relationship. Only annual peaks are shown.

406 WHITE RIVER BASIN
Peak stages and discharges of South Pork White River below White Rive", S. Dak.
Water year
1930
193119321939
1940
1950
1951
1952
1953
1954
Date
May 11, 1930
Feb. 4, 1931May 6, 1932Mar. 12, 1939 May 23, 1939 Mar. 16, 1940 June 3, 1940
Mar. 24, 1950
Mar 24, 1951 Aug 1, 1951Mar 28, 1952 Mar 29, 1952 Mar 12, 1953 Apr 30, 1953 Mar 17, 1954
Gage height (feet)
5.16
3.488.22
a7.88 4.25
a4.21 3.41
a8.93
a4.07 3.59
alO.90 6.15
a4.93 4.16 3.23
Discharge (cfs)
1,390
4384,110
909
b565
-
1,830
5,850
2,820 bl,870
Water year
1955
1956
1957
1958
1959
1960
1961 1962 1963
Date
Mar. 10, 1955Mar. 11, 1955
Mar. 20, 1956Aug. 6, 1956 Dec. 12, 1956 Aug. 26, 1957 Mar. 4, 1958
Mar. 3, 1959 Aug. 20, 1959Mar. 21, 1960 Mar. 22, 1960
Aug. 12, 1961 June 25, 1962 Feb. 14, 1963 June 15, 1963
Gage height (feet)a<5.354.03
a6.283.41
a3.35 2.83
a3.17
a3.41 2.61
a3.86 6.66
3.46 6.78
a4.16 2.60
Discharge (cfs)
-2,840
-1,960
1,420
1,210
6,050
1,920 5,950
1,100
a Backwater from ice. b Caused by regulation.
4515. White River at Westover, S. Dak. (Published as "near Westover" 1913-17)
Location. Lat 43°44'30", long 100°39'50", in SW^ sec.33, T.3 S., R.29 E., at bridge on U.S. Highway 83, half a mile southeast of Westover and 2 miles downstream from South Fork White River.
Drainage area.--7,850 sq mi, approximately.
Gage. Nonrecording. Datum of gage is 1,755.8 ft above mean sea level, datum of 1929.
Stage-discharge relation. Defined by current-meter measurements below 9,100 cfs.
Bankfull stage.--12 ft.
Remarks. All gage heights are maximum observed. Only annual peaks are shown.
Peak stages and discharges
Water year
1913 1914 1915
1916
Date
Apr. 14, 1913 May 4, 1914 Apr. 4, 1915
Feb. 18, 1916
Gage height (feet)10.9 9.6
13.0
all. 8
Discharge (cfs)
6,660 3,630
15,200
Water year
1916 1917
1918
Date
May 25, 1916 Mar. 22, 1917 May 27, 1917 Feb. 25, 1918 June 1, 1918
Gage height (feet)
10.6 a!5.1 11.0
all. 9 10.8
Discharge (cfs)
7,700
8,600
7,550a Backwater from ice.
4520. White River near Oacoma, S. Dak.
Location. Lat 43°44'45", long 99°33'20", in SE^SW^ sec.3, T.103 P., R.73 W., near center of span at downstream side of bridge on State Highway 47, 8 miles southwest of Oacoma, 8^ miles downstream from Black Dog" Creek, and 16^ miles upstream from mouth.
Drainage area. 10,200 sq mi, approximately.
Gage.--Nonrecording Aug. 24, 1928, to May 18, 1934, and May 10, 1942, to Sept. 30, 1951; recording May 19, 1934, to May 9, 1942, and since Oct. 1, 1951. At site 12^ miles downstream at different datum Aug. 24, 1928, to Sept. 30, 1951; at site 1^ miles downstream at different datum Oct. 1, 1951, to May 23, 1955; at site a quarter of a mile downstream at same datum May 24, 1955, to Feb. 26, 1960. Altitude of gage is 1,375 ft (from topographic map).
Stage-discharge relation.--Defined by current-meter measurements.
Bankfull stage.--15 ft.
Remarks.--Base for partial-duration series, 5,500 cfs. shown prior to 1934, and 1942-47.
Only annual peaks are

WHITE RIVER BASIN 407
Peak stages and discharges of White River near Oacoma, S. Dak.
Water year
19291930
193119321933
1934
1935
1936
1937
1938
1939
1940
1941
194219431944
1945
19461947
1»46
1949
1950
Date
Mar. 10, 1929Mar. 10, 1930May 13, 1930
Oct. 6, 1930May 8, 1932Sept. 1, 1933
June 20, 1934
Apr. 11, 1935Apr. 27, 1935May 21, 1935June 2, 1935
Mar. 4, 1936Mar. 5, 1936
- Mar. 6, 1937June 19, 1937July 15, 1937July 20, 1937
Mar. 13, 1938May 20, 1938
Mar. 20, 1939May 28, 1939
Mar. 19, 1940May 1, 1940
June 2, 1941June 12, 1941July 5, 1941
May 8, 1942June 1, 1943Mar. 23, 1944June 14, 1944Mar. 12, 1945
June 20, 1946Mar. 15, 1947June 25, 1947
Mar. 21, 1948June 17, 1948June 24, 1948
Mar. 1, 1949Mar. 8, 1949
Mar. 31, 1950
Gage height (feet)
6.6a!4.02
-
5.026.85.30
5.00
5.527.306.607.55
a7.36a6.40
a8.685.945.155.79
a8.706.20
alO.625.32
a7.004.35
5.666.506.21
10.74.68
al3.10-
5.05
4.87a7.65
-
a5.606.055.59
a9.45.46
a!7.6
Discharge (cfs)
10,800-
12,100
5,47012,1006,580
5,680
8,10014,40011,20015,800
-7,210
-8,5005,6407,920
-9,540
-6,160
-3,140
7,97010,6009,960
35,3006,980
-14,6006,200
5,530-
11,400
-12,20011,400
-10,200
b20,000
Water year
1950
1951
1952
1953
1954
1955
1956
1957
1958
1959
1960
1961
1962
1963
Date
May 10, 1950
June 8, 1951June 21, 1951June 25 or 26,
1951
Mar. 19, 1952Mar. 30, 1952May 24, 1952June 29, 1952
Mar. 12, 1953Mar. 14, 1953Mar. 18, 1953May 3, 1953July 29, 1953Aug. 3, 1953
May 25, 1954
Mar. 9, 1955Mar. 12, 1955Sept. 22, 1955
Mar. 9, 1956
Mar. 2, 1957May 22, 1957May 27, 1957June 12, 1957July 1, 1957
Apr. 8, 1958
May 7, 1959
Mar. 21, 1960Mar. 23, 1960Mar. 27, 1960
June 16, 1961
Mar. 27, 1962May 19, 1962May 23, 1962May 31, 1962June 17, 1962June 26, 1962July 2, 1962July 15, 1962
June 18, 1963
Gage height (feet)
6.30
5.505.655.50
8.9015.406.506.68
11.288.926.879.826.496.47
5.04
a8.606.746.19
a7.92
a7.577.247.997.506.58
6.49
6.65
a!7.0711.4011.43
6.46
a!2.676.747.838.83
11.009.768.81
11.67
8.02
Discharge (cfs)
11,100
7,7008,1007,700
(c)51,90011,3009,970
29,90017,70010,60019,1009,3609,290
4,990
-9,330
10,200
5,500
d9,00010,00012,80011,0007,750
6,530
9,020
-23,30023,400
6,050
12,0006,3209,420
13,50021,30014,70011,40023,200
9,850
a Backwater from ice.b Estimated.c Unknown; greater than 5,500 cfs.d About.

408 MISSOURI RIVER MAIN STEM
4530. Missouri River below Fort Randall Dam, S. Dak.
Location. Lat 42°58'55", long 98°29'35", in SW^NE^ sec.28, T.35 N., R.10 W., sixth principal meridian, on right bank 6 miles downstream from Randall Creek, 7 miles downstream from Fort Randall Dam, 12 miles south of Lake Andes, and at mile 873.
Drainage area. 263,500 sq mi, approximately.
Gage. Recording. Datum of gage is 1,230.00 ft above mean sea level, datum of 1929 (Corps of Engineers bench mark).
Stage-discharge relation. Defined by current-meter measurements.
Bankfull stage.--13 ft.
Historical data. Maximum stage known (April 1881} is about 5 ft higher than that of April 1943.
Remarks. Many diversions for irrigation above station. Flow regulated by Fort Peck Reservoir (usable capacity, 18,800,000 acre-ft) since November 1937, by Fort Randall Reservoir (capacity, 6,093,000 acre-ft} since December 1952, by Garrison Reservoir (capacity, 23,000,000 acre-ft} since November 1953, and by Oahe Reservoir (capacity, 23,630,000 acre-ft} since August 1958. Only annual peaks are shown.
Peak stages and discharges
Water year
1943
1948
1949 1950
1951 1952 1953 1954
Date
Apr. 1, 1943
Mar. 26, 1948 June 18, 1948 Apr. 6, 1949 Apr. 23, 1950
Apr. 8, 1951 Apr. 12, 1952 June 24, 1953 Aug. 1, 1954Sept. 30, 1954
Qage height (feet)
16.5
10.06 12.36 15.83
9.88 20.82 11.96 5.29-
Discharge (cfs)
_
103,000
182,000 249,000
134,000 447,000 109,000
34,300
Water year
1955
1956 1957 1958 1959 1960
1961 1962 1963
Date
Aug. 5, 1955
June 14, 1956 June 7, 1957 Aug. 11, 1958 Sept. 16, 1959 June 16, 1960
July 15, 1961 July 25, 1962 July 3, 1963
Gage height (feet)
6.15
7.76 6.39 6.06 6.74 8.46
6.22 7.19 6.07
Discharge (cfs)
41,900
53,400 44,7OO 42,500 47,400 87,700
45,500 74,400 52,700
PONCA CREEK BASIN
4535. Ponca Creek at Anoka, Nebr.
Location.--Lat 42°56'25", long 98°50'30", in NE£ sec.9 T.34 N., R.13 W.,'on downstream side of left pier of bridge on U.S. Highway 281, half a mile southwest of Anoka and half a mile upstream from Dry Creek.
Drainage area. 410 sq mi, approximately.
Gage.--Nonrecording only prior to Sept. 13, 1950; recording above 3.7 ft Sept. 13, 1950, to Sept. 18, 1958, and above 1.6 ft since Sept. 18, 1958.
Stage-discharge relation. Defined by current-meter measurements.
Remarks. Base for partial-duration series, 500 cfs.
Peak stages and discharges
Water year
1949
1950
1951
Date
Apr. 6, 1949
Mar. 5, 1950 Mar. 26, 1950 Apr. 2, 195O July 9, 1950
June 2, 1951 June 19, 1951 June 25, 1951 Aug. 15, 1951Aug. 20, 1951Aug. 27, 1951
Qage height (feet)
5.45
7.32 14.20 15.00 4.90
5.36 6.95
1O.O3 5.656.354.78
Discharge (cfs)
930
al,310 5,950 6,770
580
760 1,3OO 2,650
8921,100
544
Water year
1952
1953
1954
1955
Date
Mar. 17, 1952Mar. 31, 1952
Mar. 14, 1953 Mar. 18, 1953 May 3, 1953
June 7, 1954 June 16, 1954 June 20, 1954 Aug. 22, 1954
Mar. 8, 1955
Glge height (feet)
6.249.23
b8.785.57 5.07
5.90 4.59 7.44 4.78
b9.1
Discharge (cfs)
8742,940
888 771
1,090 604
2,080 637_
a Daily mean.b Backwater from ice.

PONCA CREEK BASIN 409
Peak stages and discharges of Ponca Creek at Anoka, Nebr.--Continued
Water year
1955
1956
1957
1958
1959
1960
Date
Mar. 10, 1955
Mar. 18, 1956Mar. 18, 1956
Apr. 20, 1957May 25, 1957July 3, 1957
Mar. 25, 1958Mar. 26, 1958Apr. 6, 1958July 31, 1958
July 17, 1959Aug. 9, 1959
Mar. 27, 1960Apr. 6, 1960Apr. 12, 1960May 6, 1960May 19, 1960
Qage height (feet)
-
b5.974.62
4.388.734.70
b6.635.144.505.72
7.685.35
16.866.183.425.133.41
Discharge (cfs)
(e)
-582
5222,230
650
-729671948
1,930802
9,8101,430
5161,060
513
Water year
1960
1961
1962
1963
Date
June 28, 1960
Aug. 18, 1961
Mar. 27, 1962Mar. 31, 1962Apr. 7, 1962May 17, 1962May 29, 1962June 7, 1962June 17, 1962June 23, 1962July 2, 1962July 15, 1962July 28, 1962July 31, 1962Aug. 3, 1962Sept. 16, 1962
May 27, 1963July 5, 1963July 13, 1963
Gage height (feet)
4.12
12.78
9.105.555.08
10.7311.338.46
11.0610.5210.159.775.257.599.335.72
5.225.675.40
Discharge (cfs)
726
5,510
3,0601,2001,0104,2404,7202,6804,5104,0803,7403,390
7681,8703,010
948
757928820
b Backwater from ice.c Not determined; probably exceeded base discharge.
4536. Ponca Creek at Verde1, Nefer.
Location. Lat 42°28'40", long 98°10'35", in NE^-NE^ sec.30, T.33 N., R.7 W., near left bank at downstream side of bridge on State Highway 12, 0.6 mile east of Verde1 and 3.1 miles upstream from mouth.
Drainage area. 820 sq mi, approximately.
Gage.--Nonrecording prior to Apr. 27, 1958, and Apr. 19, 1961, to Nov. 14, 1962: recording Apr. 27, 1958, to Apr. 18, 1961, and since Nov. 14, 1962. Near present site at datum 0.4 ft lower prior to Apr. 19, 1961. At site 1.1 miles upstream at different datum Apr. 19, 1961, to Sept. 4, 1963. Datum of gage is 1,239.9 ft above mean sea level (Nebraska Department of Highways reference marks).
Stage-discharge relation.--Defined by current-meter measurements.
Remarks.--Base for partial-duration series, 800 cfs.
Peak stages and discharges
Water- year
1958
1959
1960
1961
Date
Mar. 26, 1958July 8, 1958July 27, 1958July 31, 1958
May 31, 1959
Mar. 27, 1960Apr. 1, 1960Apr. 5, 1960May 6, 1960May 19, 1960Aug. 28, 1960
June 14, 1961Aug. 18, 1961
Qage height (feet)
5.677.106.905.95
5.89
15.106.306.925.467.235.06
5.677.45
Discharge (cfs)
8571,8001,6601,020
984
15,7001,6902,1601,2502,4401,060
1,3402,640
Water year
1962
1963
Date
Mar. 28, 1962Apr. 8, 1962May 17, 1962May 30, 1962June 8, 1962June 18, 1962June 24, 1962July 3, 1962July 14 or!5, 1962July 28, 1962Aug. 1, 1962Aug. 3, 1962Sept. 17, 1962
Feb. 6, 1963July 27, 1963
Qage height (feet)10.17
-7.00-------
4.26--
C6.954.84
Discharge(Of 3)
5,320al,3002,840(b)(b)
a5,900a4,700a2,800a3,800
a8001,110
a3,400al,000
_2,060
a About.b Not determined; probably exceeded base discharge.c Backwater from ice.

410 NIOBRARA RIVER BASIN
4540. Niobrara River at Wyoming-Nebraska State line
Location. Lat 42°39', long 104 0 04', in SW^ sec.15, T.31 N., R.60 W., on left bank a quarter of a mile downstream from Van Tassel Creek, 0.3 mile upstream from Wyoming-Nebraska State line, and 3 miles east of Van Tassel, Wyo.
Gage.--Recording.
Stage-discharge relation.--Defined by current-meter measurements below 63 cfs.
Remarks. Base for partial-duration series, 20 cfs.
Peak stages and discharges
Wateryear
1956
1957
1958
1959
1960
a No
Date
Feb. 24, 1956
May 4, 1957July 13, 1957
Mar. 23, 1958Apr. 6, 1958
June 21, 1959
Mar. 8, 1960Mar. 19, 1960Apr. 16, 1960
; determined prol
Qage height (feet)
1.83
1.984.07
2.27-
3.35
b5.154.862.55
Discharge (cfs)
21
31220
52(a)
140
29033272
Water year
1961
1962
1963
Date
Dec. 6, 1960Apr. 17, 1961
Feb. 2, 1962Mar. 19, 1962June 17, 1962
Jan. 31 or Feb. 1,1963
Mar. 25, 1963May 31, 1963
Gage height (feet)t3.811.54
3.992.665.84
t6.47
-1.71
Discharge (ofs)
-12
21169
465
c2OO
4121
jably exceeded base discharge.b Backwater from ice .c About.
4541. Niobrara River at Agate, Nebr.
Location.--Lat 42°25', long 103°47', in SW£ sec.6, T.28 N., R.55 W., on right bank 10 ft upstream from farm bridge, 300 ft upstream from bridge on State Highway 22, a quarter of a mile northwest of Agate, and 14-| miles upstream from Whistle Creek.
Gage.--Nonrecording prior to Nov. 3, I960: recording thereafter. Altitude of gage is 4,440 ft (from topographic map).
Stage-discharge relation.--Defined by current-meter measurements.
Remarks.--Peak flows are materially affected by diversions for irrigation of about 2,000 acres above station. Only annual peaks are shown.
Peak stages and discharges
Water year
1958 1959 1960
Date
July 19, 1958 June 23, 1959 Mar. 11, 1960
Qage height (feet)3.40 5.00 4.42
Discharge (cfs)
60 181 133
Water year
1961 1962 1963
Date
Mar. 18, 1961 Mar. 22, 1962 Feb. 4, 1963
Gage height (feet)F3.69 3.42 4.37
Discharge (cfs)
33 63
129a Backwater from beaver dam.
4545. Niobrara River above Box Butte Reservoir, Nebr.
Location.--Lat 42°27'35", long 103°10'15", in NE^- sec.27, T.29 N., R.50 W., on right bank 1 mile upstream from high-water line of Box Butte Reservoir and 6 miles east of Marsland.
Gage.--Nonrecording prior to Nov. 27, 1949; recording thereafter, gage is 4,012.47 ft above mean sea level, datum of 1929.
Datum of
Stage-discharge relation.--Defined by current-meter measurements below 230 cfs.
Remarks. Base for partial-duration series, 150 cfs.

NIOBRARA RIVER BASIN 411
Peak stages and discharges of Nlobrara River above Box Butte Reservoir, N?br.
Water year
1947
1948
1949
1950
1951
1952
1953
1954
1955
1956
Date
June 17, 1947
June 17, 1948
Mar. 8, 1949
Mar. 27, 1950May 5, 1950
July 28, 1951July 30, 1951Sept. 3, 1951Sept. 4, 1951
June 22, 1952June 28, 1952Aug. 21, 1952
Feb. 21, 1953Mar. 14, 1953
June 28, 1954
June 16, 1955
Dec. 14, 1955
Gage height (feet)
7.00
6.54
5.90
a5.905.36
10.306.807.087.97
7.796.367.88
a6.095.02
6.69
4.82
a4.31
Discharge (cfs)
350
280
162
-139
461212229282
271187279
-117
216
107
-
Water year
1956
1957
1958
1959
1960
1961
1962
1963
Date
May 27, 1956
May 19, 1957May 25, 1957May 29, 1957May 31, 1957June 10, 1957Aug. 18, 1957
July 10, 1958July 12, 1958Aug. 8, 1958
June 25, 1959
Mar. 10, 1960Mar. 19, 1960Aug. 25, 1960
July 28, 1961
May 14, 1962May 27, 1962July 14, 1962
Apr. 4, 1963
Gage height (feet)
4.22
6.345.886.476.027.596.02
6.366.606.44
5.15
5.916.666.49
8.27
6.157.256.49
4.58
Discharge (cfs)
82.0
189166196173259173
192204196
136
170208200
300
182239200
111a Backwater from Ice
4559. Niobrara River near Dunlap, Nebr. (Published as "at Dunlap" prior to Nov. 17, 1936)
Location.--Lat 42°27'45", long 102°55'25", on river and two diversion canals in SE£NW£ sec.26, T.29 N., R.48 W., at diversion dam 1,000 ft upstreair from Cottonwood Creek and 2.5 miles east of Dunlap.
Drainage area. 1,550 sq mi, approximately.
Gage. Nonrecording at site 0.3 mile upstream prior to Nov. 17, 1936; recording thereafter. At site half a mile upstream Nov. 17, 1936, to Sept. 30, 1942. Both gages at altitude 3,870 ft (from topographic map).
Stage-discharge relation.--Prior to Sept. 30, 1942, defined by current-meter measurements below 120 cfs, and by slope-area measurements at 801 and 2,890 cfs. Since September 1961, defined by current-meter measurements below 170 cfs and extended above on basis of flow-over-dam measurement at 2,930 cfs.
Remarks. Since 1962, flow computed for each channel (or canal) and combined for total flow. Peak flows affected by regulation of Box Butte Reservoir (usable capacity, 30,400 acre-ft). Base for partial-duration serie*, 160 cfs. Only annual peaks are shown prior to 1937.
Peak stages and discharges
Water year
1931 1932 1933 1934 1935
1936
1937
1938
Date
Aug. 4, 1931 May 6, 1932 Aug. 26, 1933 Aug. 16, 1934 June 17, 1935
Mar. 6, 1936
Mar. 25, 1937 Sept. 4, 1937
Apr. 26, 1938 May 20, 1938 Aug. 27, 1938
Gage height (feet)
4.7 8.OO
10.62 9.48 4.40
2.90
2.41 9.8
2.47 3.00 4.65
Discharge (cfs)
374 890
1,270 1,170
308
123
162 2,890
167 210 496
Water year
1939
1940
1941
1942
1962
Date
Aug. 1, 1939
Dec. 26, 1939 Mar. 21, 194O
Apr. 1, 1941 June 9, 1941 June 28, 1941
May 13, 1942 June 25, 1942
July 30, 1962
Gage height (feet)
4.16
a4.19 2.88
2.64 4.98 7.80
10.04 4.35
Discharge (cfs)
372
160
171 554
1,200
2,600 265
3,230
a Backwater- from Ice.

412 NIOBRARA RIVER BASIN
4562. Pebble Creek near Esther, Nebr.
Location. Lat 42°36', long 103°04', in M£ sec.10, T.30 N., R.49 W., on post in creek channel, 5 miles west of U.S. Highway 385 at Esther (former post office) and 1.2 miles south of schoolhouse.
Drainage area. 3.07 sq mi.
Gage.--Crest-stage gage.
Stage-discharge relation. Defined by slepe-area measurements at 23, 25, 185, and 2,000 cfs.
Remarks. Only annual peaks are shown.
Peak stages and discharges
Water year
1953 1954 1955
1956 1957 1958
Date
July 28, 1953 Apr. 22, 1954 Apr. 26, 1955
July 20, 1957 July 9, 1958
Qage height (feet)
18.67 12.19 11.07
11.57 10.95
Discharge (cfs)
2,000 170 18
O 48 14
Water year
1959 1960
1961 1962 1963
Date
Aug. 25, 1960
July 12, 1962 Feb. 3, 1963
Qrge height (feet)
12.25
12.68 11.55
Discharge (cfs)
o185
0 265 43
4563. Pebble Creek near Dunlap, Nebr.
Location. Lat 42°30', long 102°59', on south line sec.8, T.29 N., R.48W., on tree 100 ft upstream from east-west road, 0.3 mile west of U.S. Highway 385, and 3 miles northwest of Dunlap.
Drainage area. 23.5 sq mi.
Gage. Crest-stage gage. Altitude of gage is 3,933 ft (from toporraphic map).
Stage-discharge relation. Defined by low-flow estimates, current-meter meas- urements at 2 and 306 cfs, and extended above on basis of a culvert and contracted-opening measurement at 2,740 cfs.
Remarks. Only annual peaks are shown.
Peak stages and discharges
Water year
195319541955
195619571958
Date
July 28, 1953June 27, 1954May 17, 1955
June 1, 1956May 20, 1957
-
Qage height (feet)12.8810.8411.65
9.1411.829.2
Discharge (cfs)
2,740120310
.1410
.2
Water year
19591960
196119621963
Date
Sept. 18, 1959Mar. 18, 1960
Aug. 13, 1961July 12, 1962June 14, 1963
Qage height (feet)
9.1811.98
10.211.8910.30
Discharge (cfs)
0.2550
1465
2
4564. Cottonwood Creek near Dunlap, Nebr.
Location. Lat 42°29', long 102°58', in NWi sec.16, T.29 N., R.48W., on right downstream side of bridge on U.S. Highway 385, 2 miles northwest of Dunlap and 3 miles north of Niobrara River bridge.
Drainage area.--82.2 sq mi.
Gage. Crest-stage gage. Altitude of gage is 3,945 ft (from topographic map).
Stage-discharge relation. Defined by current-meter measurements below 680 cfs and extended above on basis of contracted-opening measurement at 28,100 cfs.
Remarks. The June 17, 1948, peak was computed from a slope-area survey by the Bureau of Reclamation at a site about 1^ miles downstream. Th? stage for this discharge was not related to the gage and no adjustment h^s been attempted for the change in drainage area between the gage and the survey site. Only annual peaks are shown.

NIOBRARA RIVER BASIN 413
Peak stages and discharges of Cottonwood Creek near Dunlap, Nebr.
Water year
1948
1951 1952 1953 1954 1955
1956
Date
June 17, 1948
July 28, 1951
July 28, 1953 May 22, 1954 May 17, 1955
July 5, 1956
Gage height (feet)
-
20.10 9.55 13.60 14.55 12.28
11.00
Discharge (cfs)
10,800
28,100 1
1,540 2,640
440
50
Water year
1957 1958 1959 1960
1961 1962 1963
Date
May 20, 1957 July 9, 1958 May 4, 1959 Aug. 25, 1960
July 19, 1961 July 12, 1962 Feb. 5, 1965
Gage height (feet)
12.52 11.21 10.29 14.70
10.47 12.78 (a)
Discharge(Of 8)
570 80 1
5,570
7 750 b5
a Below 10.0 ft. b Estimated.
4565. Niobrara River near Hay Springs, Nebr.
Location Lat 42°29'00", long 102°41'40", In NW^ sec.23, T.29 N., R.46 W., on left bank 20 ft downstream from bridge on State Highway 87, 4 miles upstream from Box Butte Creek, and 14 miles south of Hay Springs.
Gage. Recording. Datum of gage Is 3,723.42 ft above mean sea level, datum of T929. At site 500 ft upstream at datum 1.5 ft higher prior to July 31, 1951.
Stage-discharge relation. Defined by current-meter measurements below 470 cfs and extended above on basis of slope-area measurement at 7,330 cfs.
Remarks. Peak flows are materially affected by regulation and diversions. Only annual peaks are shown.
Peak stages and discharges
Water year
1950
1951 1952
1955 1954 1955
1956
Date
Aug. 25, 1950
July 28, 1951Jan. 26, 1952 Mar. 29, 1952 July 29, 1953 May 23, 1954 June 27, 1955
Feb. 25, 1956 July 3, 1956
Gage height (feet)4.42
7.2a2.75 2.63 2.85 5.6S 2.87
a3.12 2.13
Discharge (cfs)
1,690
7,330
455 511
1,160 559
141
Water year
1957 1958 1959
1960
1961
1962 1965
Date
May 20, 1957 June 2, 1958 Jan. 9, 1959 June 29, 1959 Mar. 18, 1960 Aug. 24, 1960
Jan. 15, 1961 Sept. 22, 1961 July 51, 1962 Aug. 26, 1965
Gage height (feet)4.87 5.15
a2.54 1.86
a4.25 4.10
al.71 1.50 4.23 3.42
Discharge (cfs)
2,690 964
138
2,260
104 2,380 1,450
a Backwater from ice .
4572. Berea Creek near Alliance, Nebr.
Location. Lat 42 0 08'25", long 102°51'30", In NW^SW^ sec.18, T.25 N., R.47 W., on left downstream side of bridge on U.S. Highway 385, 1 mile north of cemetery and 3 miles north of junction of U.S. Highway 385 and State High way 2 at east city limits of Alliance.
Drainage area. 34.0 sq ml.
Gage. Crest-stage gage. Datum raised 1 ft Aug. 26, 1960. All gage heights adjusted to present datum.
Stage-discharge relation.--Defined by current-meter measurements below 27 cfs and slope-area measurement at 110 cfs.
Remarks. Only annual peaks are shown.
Peak stages and discharges
Water year
1953 19541955
1956 1957 1958
Date
Aug. 18, 1953 May 16, 1954 May 26, 1955
July 2, 1956 May 19, 1957 June 8, 1958
Gage height (feet)11.31 9.51 10.43
11.52 10.89 11.82
Discharge (cfs)
63 1
19
77 38
102
Water year
1959 1960
1961 1962 1963
Date
Sept. 24, 1959 Mar. 18, 1960
May 31, 1961 June 15, 1962 May 30, 1963
Gage height (feet)10.82 11.87
10.55 11.13 11.52
Discharge (cfs)
35 107
23 47 60
219-848 O - 66 - 28

414 NIOBRARA RIVER BASIN
4575. Niobrara River near Gordon, Nebr.
Location. Lat 42°38'00", long 102°12'40", in NE^ sec.26, T.31 N., R.42 W., on left bank 250 ft upstream from bridge on State Highway 27, 4 miles down stream from Rush Creek, and 11 miles south of Gordon.
Drainage area. 2,595 sq mi.
Gage. Nonrecording at bridge 4 miles downstream at different datum Aug. 24, 1928, to June 30, 1932; recording at present site and datum since October 1945. Datum of gage is 3,434.49 ft above mean sea level, datum of 1929.
Stage-discharge relation. Defined by current-meter measurements below 5,000 cfs.
Remarks. Peak flows are materially affected by regulation and diversions. Only annual peaks are shown.
Peak stages and discharges
Water year
19291930
19311932
19461947194819491950
19511952
1953
1954
Date
June 2, 1929May 11, 1930
Apr. 1, 1931May 6, 1932
Sept. 18, 1946June 18, 1947June 17, 1948Feb. 26, 1949Aug. 26, 1950
July 28, 1951Jan. 21, 1952Mar. 29, 1952Mar. 2, 1953July 29, 1953Jan. 21, 1954
Qage height (feet)
1.801.04
1.662.40
3.793.114.473.092.94
4.81a2.641.88
a3.041.84a2.48
Discharge (cfs)
1,230869
1,2202,630
3,5502,0405,4102,4701,720
5,940-378-723-
Water year
19541955
1956
19571958
1959
1960
1961
19621963
Date
May 23, 1954Mar. 4, 1955Mar. 6, 1955
Dec. 25, 1955Mar. 25, 1956May 20, 1957Feb. 14, 1958June 2, 1958Jan. 21, 1959May 5, 1959Mar. 10, 1960Aug. 25, 1960
Dec. 4, 1960May 14, 1961May 21, 1962Aug. 27, 1963
OKge height (feet)
2.33at. 531.86
a2.191.373.20
a2.571.72
a2.281.48
a2.922.36
2.131.105.252.09
Discharge (cfs)
627-546
-202
2,530-516-365-
2,330
-334
9,1301,870
a Backwater from ice .
4577. Antelope Creek at Gordon, Nebr.
Location. Lat 42°48', long 102°12', in SE^ sec.25, T.33 N., R.42 W., on right upstream side of concrete arch culvert south of community building on Oak Street, between Third and Fourth Streets, in Gordon.
Drainage area. 61.1 sq mi.
Gage. Crest-stage gage.
Stage-discharge relation. Defined by current-meter measurements below 40 cfs and extended above on basis of indirect measurements at 172 and 444 cfs.
Remarks. Only annual peaks are shown.
Peak stages and discharges
Water year
1953 1954 1955
1956 1957 1958
Date
July 29, 1953 July 19, 1954 Mar. 9, 1955
July 2, 1956 July 28, 1957 May 24, 1958
Qage height (feet)11.09 11.36 13.95
10.43 10.90 17.86
Discharge (cfs)
47 64
220
22 38
444
Water year
1959 1960
1961 1962 1963
Date
May 4, 1959 Mar. 18, 1960
Aug. 12, 1961 June 12, 1962 June 15, 1963
Q.ige height (feet)10.29 15.57
11.00 14.60 12.90
Discharge (cfs)
17 380
42 348 246

NIOBRARA RIVER BASIN 415
4578. Antelope Creek tributary near Gordon, Nebr.
Location. Lat 42°50', long 102°12', on west edge of sec.18, T.33 N., R.41 W., on 3-span concrete bridge of State Highway 27, 0.3 mile north of crossroad, 2 miles north of Gordon, and 2-| miles north of U.S. Highway 20.
Drainage area.--26.6 sq mi.
Gage. Crest-stage gage.
Stage-discharge relation. Defined by current-meter measurements below 6 cfs and extended above on basis of contracted-opening measurement at 1,430 cfs.
Remarks. Only annual peaks are shown.
Peak stages and discharges
Water year
1953 1954 1955
1956 1957 1958
Date
July 29, 1953 Aug. 29, 1954 June 17, 1955
July 28, 1957 May 24, 1958
Oage height (feet)10.44 9.42
16.69
15.09 10.93
Discharge (cfs)
50 3
1,900
0 1,240
95
Water year
1959 1960
1961 1962 1963
Date
Mar. 18, 1960
June 12, 1962
Oage height ( feet )
15.85
15.15
Discharge (cfs)
0 1,560
0 1,260
0
4585. Bear Creek near Eli, Nebr.
Location. Lat 42°54', long 101°31', in Sw£ sec.24, T.34 N., R.36 W., 01 left bank 3 miles south of Eli and 9 miles upstream from mouth.
Drainage area.--360 sq mi, approximately, of which 78 sq mi contributes directly to surface runoff.
Gage. Nonrecordlng. At site half a mile downstream at different datum prior Tfo Mar. 14, 1948. At present site at different datum Mar. 14, 1948, to
June 24, 1949. Altitude of gage is 3,110 ft (from topographic map).
Stage-discharge relation.--Defined by current-meter measurements.
Remarks.--Only annual maximum observed stages and discharges are shown.
Peak stages and discharges
Water year
1948
1949 1950
Date
Mar. 12, 1948Mar. 19, 1948 Mar. 28, 1949 May 11, 1950
Oage height ( feet )a4.15
2.444.48
Discharge (cfs)
-90 51
138
Water year
1951 1952 1953
Date
May. 20, 1951 Apr. 1, 1952 Mar. 14, 1953 May 3, 1953
Oage height ( feet )
5.07 4.80
a5.20
Discharge (cfs)
145 115
127
a Backwater from ice.
4590. Niobrara River near Cody, Nebr.
Location. --La t 42°49'50", long 101°17'20", in NW^NE^ sec. 23, T.33 N., R.34 W., on left bank a quarter of a mile upstream from Mogle Bridge , 3 miler upstream from Medicine Creek, 5 miles downstream from Bear Creek, and 10 miles south of Cody.
Gage. Recording. Altitude of gage is 2,770 ft (from topographic map).
Stage -discharge relation. Defined by current-meter measurements.
Remarks . Peak flow affected to some extent by storage in Box Elder Reservoir and by diversions. Base for partial-duration series, 1,300 cfs.

416 NIOBRARA RIVER BASIN
Peak stages and discharges of Niobrara River near Cody, Hebr.
Water year
1948
1949
1950
1951
1952
Date
Mar. 16, 1948June 18, 1948
Jan. 4, 1949Feb. 27, 1949Mar. 1, 1949Mar. 15, 1949
Aug. 14, 1950Aug. 27, 1950
July 29, 1951Sept. 5, 1951
Mar. 30, 1952
Gage height (feet)3.215.70
a4.083.963.602.92
2.963.84
6.224.70
2.33
Discharge (cfs)
1,7903,700
_2,2702,1401,460
1,5402,360
4,1702,790
1,140
Water year
1953
1954
1955
1956
1957
Date
Feb. 20, 1953July 30, 1953
July 20, 1954
Mar. 5, 1955Mar 10, 1955Aug. 28, 1955
Aug. 8, 1956
May 21, 1957June 12, 1957July 22, 1957
Gage height (feet)a2.592.10
3.00
a4.732.662.66
2.08
4.962.592.88
Discharge (cfs)
-948
1,590
-1,4601,360
968
3,1601,3601,520
a Backwater from ice.
4595. Snake River near Burge, Nebr.
Location. Lat 42°39'20", long 100°51'00", In NE£ sec.20, T.31 N., R.30 W., on right bank 150 ft downstream from Nebraska National Forest boundary, 6^ miles southwest of Burge, and 22 miles southwest of Valentine.
Drainage area.--620 sq mi, approximately, of which about 100 sq mi contributes directly to surface runoff.
Gage. Recording. Datum of gage is 2,805.36 ft above mean sea level, datum of 1929 (levels by Bureau of Reclamation).
Stage-discharge relation. Defined by current-meter measurements below 520 cfs and extended above on basis of slope-area measurement at 1,830 cfs.
Bankfull stage.--No overflow likely.
Remarks.--Backwater during ice conditions varies considerably during short intervals of time and cannot be determined reliably. Base for partial- duration series, 380 cfs.
Peak stages and discharges
Water year
1948
1949
1950
1951
1952
1953
Date
Feb. 15, 1948Sept. 23, 1948
Oct. 29, 1948Jan. 10, 1949Feb. 26, 1949Mar. 24, 1949July 6, 1949
Oct. 10, 1949Jan. 4, 1950May 6, 1950May 8, 1950June 2, 1950
Feb. 2, 1951Feb. 11, 1951Mar. 8, 1951May 19, 1951June 18, 1951June 24, 1951July 12, 1951Aug. 14, 1951Sept. 4, 1951
Jan. 28, 1952May 16, 1952May 23, 1952
Jan. 15, 1953Mar. 12, 1953May 2, 1953July 27, 1953July 30, 1953
Gage height (feet)a2.862.69
-a3.132.67--
2.74a3.332.532.642.67
a4.042.522.772.572.902.572.522.602.56
a3.522.692.50
a3.773.112.862.662.72
Discharge (cfs)
_381
378-
452382386
443-
386431439
-402510414510406386419402
-436377
-566484408427
Water year
1954
1955
1956
1957
1958
1959
1960
Date
Mar. 16, 1954Mar. 19, 1954Mar. 25, 1954Apr. 29, 1954May 30, 1954June 7, 1954
May 26, 1955Sept. 20, 1955
Nov. 21, 1955Mar. 4-6, 1956Aug. 3, 1956
Apr. 12, 1957Apr. 20, 1957May 4, 1957May 16, 1957June 13, 1957Aug. 17, 1957
Mar. 5, 1958Apr. 2, 1958Apr. 23, 1958Apr. 28, 1958
Mar. 20, 1959
Mar. 23, 1960May 7, 1960June 13, 1960June 19, 1960June 27, 1960Aug. 25, 1960
Gage height (feet)
2.562.592.502.582.752.58
3.162.60
2.56-
2.95
2.502.632.592.752.622.55
2.532.842.492.49
C2.60
2.862.902.622.572.792.84
Discharge (cfs)
414424396393446418
577390
390b400491
396424393436399380
399501383380
396
476496406393469492
a Backwater from ice^b About.c Occurred May 7, 1959.

NIOBRARA RIVER BASIN 417
Peak stages and discharges of Snake River near Surge, Nebr. Continued
Water year
1961
1962
Date
May 14, 1961
Mar. 22, 1962 May 17, 1962 May 29, 1962 June 21, 1962
Gage height (feet)
2.73
2.79 2.72 2.72 2.81
Discharge (cfs)
444
451 451 444 460
Water year
1962
1963
Date
June 30, 1962 July 12, 1962 July 17, 1962 July 31, 1962
Feb. 7, 1963
Gage height (feet)
5.39 3.90 2.73 3.23
6.96
Discharge (ofs)
1,830 915 438 602
d3,170d Result of release of storage behind temporary construction dike.
4610. Minnechaduza Creek at Valentine, Nebr.
Location. Lat 42°53'10", long 100°33'10", in SW^ sec.30, T.34 N., R.27 W., on right bank 500 ft downstream from powerplant in city park at north edge of Valentine and 4 miles upstream from mouth.
Drainage area. 510 sq mi, approximately, of which 200 sq mi contributes directly to surface runoff.
Gage.--Recording. Altitude of gage is 2,470 ft (from topographic map).
Stage-discharge relation. Defined by current-meter measurements.
Remarks. The powerplant reservoir 500 ft upstream has a limited storage capac- ity, but the operation of the plant can regulate appreciably all peiks below 400 cfs. Only annual peaks are shown.
Peak stages and discharges
Water year
1948
19491950
19511952195319541955
Date
Jan. 5, 1948Mar. 20, 1948May 29, 1949Mar. 26, 1950
Aug. 1, 1951Mar. 30, 1952Mar. 14, 1953Mar. 23, 1954Mar. 10, 1955
Gage height (feet)a2.96
_4.213.21
4.016.584.212.865.99
Discharge (cfs)
-140326186
241894314141663
Water year
19561957195819591960
196119621963
Date
Mar. 5, 1956Apr. 12, 1957Apr. 29, 1958Nov. 1, 1958Mar. 22, 1960
June 8, 1961May 22, 1962Sept. 2, 1963
Gage height (feet)3.032.86
b2.92C2.928.00
3.643.342.77
Discharge (cfs)
170145153154
1,100
307278173
a Backwater from ice. b Occurred July 4, 1958. c Occurred Aug. 4, 1959.
4615. Niobrara River near Sparks, Nebr.
Location. Lat 42°54'10", long 100°21'40", in SE^ sec.22, T.34 N., R.26 W., on left bank 18 ft downstream from highway bridge, 2^ miles downstreair from Big
Beaver Creek, 5^ miles downstream from Minnechaduza Creek, and 6^ irilessouthwest of Sparks.
Drainage area. 6,406 sq mi.
Gage.--Recording. Datum of gage is 2,287.57 ft above mean sea level, datum of ~~T"929.
Stage-discharge relation. Defined by current-meter measurements below 3,800 cfs.
Remarks.--Peak flows affected by storage in Box Elder Reservoir and by irri- gation and power developments. Only annual peaks are shown.

418 NIOBRARA RIVER BASIN
Peak stages and discharges of Niobrara River near Sparks, Nebr.
Water year
19461947
194819491950
19511952
1953
19541955
Date
Sept. 19, 1946Jan. 9, 1947June 16, 1947Aug. 11, 1948Mar. 5, 1949Aug. 27, 1950
July 29, 1951Mar. 10, 1952Mar. 30, 195?Feb. 23, 1953May 2, 1953Mar. 13, 1954Mar. 9, 1955
Gage height (feet)4.33
a7.14-
5.236.734.51
5.29a5.56
-a4.94
-5.434.98
Discharge (cfs)
2,350-
3,5605,200
10,2003,500
5,470-
2,560-
2,640b6,1804,460
Water year
1956
195719581959
1960
19611962
1963
Date
Mar. 5, 1956May 7, 1956May 21, 1957Aug. 10, 1958Nov. 18, 1958May 9, 1959Nov. 6, 1959
Dec. 5, 1960Feb. 15, 1962July 1, 1962Dec. 11, 1962Mar. 1, 1963
C-age height (feet)s6.ll
-4.86
C3.83£4.31
-5.60
?4.32E-8.09
--
£ 9.07
Discharge (cfs)
-2,2804,4602,230
-2,070
b6,430
2,800-
7,670b4,570
-
a Backwater from ice.b Release of temporary storage caused by ice jam at powerplant 6 miles upstream.c Occurred Apr. 1, 1958.
4620. Niobrara River near Norden, Nebr.
Location.--Lat 42°47'13", long 100°02 I 06", in N^SW"£ sec.33, T.33 N., R.23 W., on left bank 60 ft downstream from bridge on county road, if iriles down stream from Fairfield Greek, and 6 miles south of Norden.
Gage.--Recording. Datum of gage is 2,109.93 ft above mean sea level, datum of ~I929.
Stage-discharge relation.--Defined by current-meter measurements below 4,200 cfs and extended above on basis of slope-area measurement at 7,380 cfs.
Remarks.--Peak flows affected by storage in Box Elder Reservoir and by irri- gation and power developments. Only annual peaks are shown.
Peak stages and discharges
Water year
1953
1954
1955
19561957
1958
Date
Feb. 23, 1953June 20, 1953Mar. 3, 1954Mar. 14, 1954Jan. 20, 1955Mar. 11, 1955
Mar. 7, 1956Feb. 11, 1957May 22, 1957Jan. 31, 1958
Gage height (feet)
a6.8l-
a5.21-
ae.oo-
3.60as. 16
-a7.43
Discharge (cfs)
-2,940
-3,060
-3,730
2,130-
4,370-
Water year
19581959
1960
196119621963
Date
Apr. 6, 1958Dec. 10, 1958May 7, 1959Jan. 31, 1960Mar. 23, 1960
Dec. 5, 1960July 1, 1962Feb. 8, 1963Aug. 29, 1963
Gage height (feet)
-a7.07
-a7.435.57
a6.067.10
a7.83-
Discharge (cfs)
2,190-
1,870-
4,170
b2,0007,380
-2,330
a Backwater from ice. b About.
4631. Bone Greek tributary near Ainsworth, Nebr.
Location.--Lat 42°34'30", long 99°55'50", in Nwi sec.17, T.30 N., R.22 W., 15 ft downstream from north-south sanded road 3 miles west or U.S. High way 20, and 1^ miles north from Ainsworth.
Drainage area. 0.39 sq mi.
Gage. Crest-stage gage. At datum 0.5 ft lower prior to Apr. 5, 1963. Gage neights adjusted to present datum.
Stage-discharge relation. Defined by current-meter measurements below 13 cfs and extended above on basis of slope-area measurements at 16.5, 17.2, 18.5, 22.6, and 150 cfs.
Remarks. Only annual peaks are shown.

NIOBRARA RIVER BASIN 419
Peak stages and discharges of Bone Creek tributary near Ainswyth, Nebr.
Water year
1956 1957 1958 1959 1960
Date
June 6, 1956 June 13, 1957
July 3, 1959 June 27, 1960
Gage height (feet)
10.43 10.36 10.94 11.61 11.85
Discharge (cfs)
3.0 3
22.6 150 202
Water year
1961 1962 1963
Date
Aug. 21, 1961 Aug. 2, 1962 July 27, 1963
Gage height (feet)
11.30 11.79 11.46
Discharge (cfs)
82189 117
4632. Bone Creek tributary No. 2 near Ainsworth, Nebr.
Location. Lat 42°34'45", long 99°48'02", in SW^SE^ sec.8, T.30 N., R.21 W., 800 ft east of half-section line, on right downstream abutment of culvert on east-west gravel road, 3.4 miles northeast of Ainsworth.
Drainage area. 2.18 sq mi.
Gage. Crest-stage gage.
Stage-discharge relation. Defined by current-meter measurements below 12 cfs and extended above on basis of indirect measurements at 59.7 and 64C cfs.
Remarks. Only annual peaks are shown.
Peak stages and discharges
Water year
1958 1959 1960
Date
May 30, 1958 July 16, 1959 Mar. 21, I960
Gage height (feet)
10.93 10.40 11.93
Discharge (cfs)
59.7 18
216
Water year
1961 1962 1963
Date
Mar. 14, 1961 June 30, 1962 June 26, 1963
Gage height (feet)
10.52 13.29 10.49
Discharge (cfs)
25 640 53
4633. Sand Draw tributary near Ainsworth, Nebr.
Location.--Lat 42°36'00", long 99°57'00", in SW^NW^ sec.6, T.30 N., R.22 W., on north-south abandoned road right-of-way, 5^ miles northwest of Ainsworth.
Drainage area. 1.07 sq mi.
Gage. Crest-stage gage.
Stage-discharge relation. Defined by eight slope-area measurements below 747 cfs.
Remarks. Only annual peaks are shown.
Peak stages and discharges
Water year
1956 1957 1958 1959 1960
Date
June 6, 1956 July 26, 1957 July 24, 1958 July 3, 1959 June 27, 1960
Gage height (feet)
10.90 11.69 12.10 12.54 13.75
Discharge (cfs)
16.3 43.4 56.3
126 710
Water year
1961 1962 1963
Date
Mar. 14, 1961 June 30, 1962 Apr. 10, 1963
Gage height (feet)
11.39 14.4 11.93
Discharge (cfs)
30747 51

420 NIOBRARA RIVER BASIN
» 4635. Long Pine Creek near Riverview, Nebr.
Location.--Lat 42°41'20", long 99°41'20", in N^ sec.5, T.31 N., R.20 W., on right bank 7 ft downstream from county road bridge, 1 mile downstream from Bone Creek, and 5^ miles southwest of Riverview.
Drainage area.--390 sq mi, approximately.
Gage.--Recording. At site 100 ft upstream prior to Dec. 7, 1962. Datum of gage is 1,983.34 ft above mean sea level (levels by Bureau of Reclamation).
Stage-discharge relation. Defined by current-meter measurements below 3,600 cfs and extended above on basis of slope-area measurement at 9,650 cfs.
Remarks. Peak discharges not significantly affected by diversions and power development upstream. Base for partial-duration series, 650 cfs.
Peak stages and discharges
Water year
1949
1950
1951
1952
1953
1955
Date
June 12, 1949
Feb. 27, 1950Mar. 23, 195OAug. 12, 1950
May 17, 1951June 2, 1951June 18, 1951June 26, 1951Aug. 1, 1951Aug. 20, 1951
May 17, 1952May 24, 1952Aug. 1, 1952
Feb. 21, 1953Mar. 12, 1953June 15, 1953June 19, 1953Aug. 3, 1953
Feb. 20, 1955
dage height (feet)
5.77
4.604.554.70
4.504.935.709.005.21
10.24
6.646.578.70
a7.416.326.956.746.22
a8.15
Discharge (=fs)
1,100
791688671
805926
1,2204,010
6745,410
868762
2,840
_882
1,2201,190
651
-
Water year
1955
1956
1957
1958
1959
1960
1961
1962
1963
Date
Sept. 20, 1955
June 16, 1956
July 21, 1957July 27, 1957
Apr. 6, 1958
July 16, 1959
Mar. 21, I960June 20, 1960June 27, I960
June 10, 1961
July 1, 1962July 14, 1962Aug. 1, 1962Sept. 2, 1962
Jan. 11, 1963May 26, 1963
Gage height (feet)
4.65
5.37
6.436.41
4.35
3.77
7.116.036.33
2.78
15.687.427.176.12
a7.565.62
Discharge (cfs)
331
1,060
1,8801,870
773
524
2,3101,6001,780
266
9,6502,4502,2OO1,150
-638
a Backwater from ice.
4640. Keya Paha River near Hidden Timber, S. Dak.
Location. Lat 43°12'30", long 100°21'20", in SE^NE^ sec.2, T.37 N., R.26 W., on left bank A-frame of cableway, 3 miles southeast of Hidden Timber, 3 miles downstream from confluence of Antelope Creek and Rock Creek, 7^ miles upstream from Eagle Creek, and 10j miles south of Okreek.
Drainage area. 320 sq mi, approximately.
Gage.--Nonrecording. Altitude of gage is 2,330 ft (by barometer).
Stage-discharge relation.--Defined by current-meter measurements below 380 cfs and extended above by slope-area measurement at 2,710 cfs.
Bankfull stage.--10 ft.
Remarks. Only annual peaks are shown.
Peak stages and discharges
Water year
1948 1949
1950
Date
Mar. 15, 1948 Feb. 26, 1949 Mar. 4, 1949 Mar. 24, 1950
Gage height (feet)a6.87 a8.O8 a7.32 10.87
Discharge (cfs)
150
120 1,680
Water year
1951 1952 1953
Date
Mar. 24, 1951 Mar. 30, 1952 Mar. 14, 1953
Gage height (feet)
5.41 10.6
Discharge (cfs)
b225 2,710
bl,000
a Backwater from ice.b Maximum daily discharge.

NIOBRARA RIVER BASIN 421
4645. Keya Paha River at Wewela, S. Dak.
Location. Lat 43°01'40", long 99°46'45", in NE^SE^ sec.24, T.95 N., F.76 W., on left bank 13 ft downstream from bridge on U.S. Highway 183, three-quarters of a mile north of Wewela, 4|- miles upstream from Holt Creek, and llf- miles downstream from Lost Creek.
Drainage area. 1,070 sq mi, approximately.
Gage. Nonrecording prior to June 21, 1957; recording thereafter. Datum of gage is 2,049.78 ft above mean sea level, datum of 1929.
Stage-discharge relation.--Defined by current-meter measurements.
Bankfull stage.--11 ft.
Remarks. Base for partial-duration series, 250 cfs. shown prior to 1956.
Peak stages and discharges
Only annual peai's are
Water year
1939
1940
1950
19511952195319541955
1956
1957
1958
Date
Mar. 14, 1939Mar. 16, 1939Apr. 29, 1940
Mar. 25, 1950
July 4, 1951Mar. 31, 1952Mar. 15, 1953Mar. 22, 1954Mar. 10, 1955July 29, 1955
Mar. 4, 1956Mar. 19, 1956Apr. 6, 1956May 4, 1956
Apr. 19, 1957May 17, 1957June 16, 1957July 1, 1957
Feb. 24, 1958Mar. 26, 1958Apr. 8, 1958Apr. 25, 1958July 27, 1958July 31, 1958
Gage height (feet)
a4.454.323.29
a!3.5
4.29b!3.45
7.70-
a9.77-
a5.91(a)3.102.S2
7.664.364.33.76
a3.162.S83.623.024.183.45
Discharge (cfs)
-373239
2,500
2625,4302,020
400-
1,SSO
N(a)314251
2,160707680491
270280484300673420
Water year
1959
1960
1961
1962
1963
Date
Mar. 19, 1959May 29, 1959
Mar. 24, 1960Apr. 6, 1960Apr. IS, 1960Apr. 30, 1960May 6, 1960
Feb. 18, 1961May 18, 1961
Mar. 29, 1962May 15, 1962May 23, 1962May 30, 1962June 6, 1962June 17, 1962June 23, 1962June 26, 1962July 1, 1962July 5, 1962July 14, 1962July 27, 1962Aug. 2, 1962
Feb. 8, 1962Mar. 24, 1963Apr. 11, 1963
Gage height (feet)
3.113. 73
10.564.232.862.924.03
a4.442.24
a6.S38.534.685.224.146.064.494.337.134.367.703.555.41
a3.652.932.96
Discharge (cfs)
338497
4,210700272292634
-156
1,3002,950
8801,140
6631,700
917S45
2,290858
2,460422
1,190
-288296
a Backwater from ice. greater than 360 cfs.
b Occurred on preceding day. c Unknown; probably d Unknown; probably greater than 460 cfs.
4649. Keya Paha River near Naper, Nebr.
Location. Lat 42°55'00", long 99°05'50", in SE^SE^ sec.17, T.34 N., R.15 W., on left bank 8 ft downstream from highway bridge, 3.3 miles south of Naper, and 8.6 miles upstream from mouth.
Gage. Nonrecording prior to May 2, 1958; recording thereafter. Altitude of gage is 1,680 ft (from topographic map).
Stage-discharge relation. Defined by current-meter measurements below 6,000 cfs.
Remarks. Base for partial-duration series, 900 cfs.
Peak stages and discharges
Water year
1958
1959
a Not
Date
Apr. 5, 1958 July 27, 195S July 30, 1958
Mar. 30, 1959 May 28, 1959 determined; prc
Gage height (feet)
6.84 6.95
b7.30 6.29
bably exc
Discharge (cfs)
(a)1,940 2,150
1,590 eeded base d
Water year
1960
1961 scharge .
Date
Mar. 23, 1960 Mar. 27, 1960 Apr. 6, 1960 May 6, 1960
Feb. 22, 1961
Gage height (feet)b!3.34
9.82 5.92 7. IS
b6.65
Discharge (cfs)
6,890 1,240 2,520
b Backwater from ice.

422 NIOBRARA RIVER BASIN
Peak stages and discharges of Keya Paha River near Naper, Nebr.--Continued
Water year
1961
1962
Date
Aug. 18, 1961
Mar. 29, 1962May 16, 1962May 23, 1962May 28, 1962June 6, 1962June 17, 1962June 23, 1962June 25, 1962July 1, 1962
Qage height (feet)
5.77
6.828.656.057.816.367.607.686.41
10.91
Discharge (cfs)
646
2,3404,9101,3603,6201,6503,3003,4201,6009,280
Wateryear
1962
1963
Date
July 5, 1962July 13, 1962July 27, 1962July 31, 1962Aug. 2, 1962Aug. 5, 1962
May 26, 1963June 10, 1963July 8, 1963
Gage height (feet)
6.199.907.438.218.005.99
6.526.328.66
Discharge (cfs)
1,4307,0503,0604,2203,9001,200
1,180970
4,570
4650. Niobrara River near Spencer, Nebr.
Location.--Lat 42°48'33", long 98°30'19", in SE^NW^ sec.30, T.33 N., R.ll W., at Spencer powerplant dam 5 miles southeast of Spencer.
Drainage area. 10,400 sq ml, approximately.
Gage. Nonrecordlng May to December 1908 on former highway bridge 275 ft down stream, and Aug. 1, 1913, to Sept. 30, 1915, at highway bridge 10 miles downstream, at different daturns. Aug. 1, 1927, to Sept. 30, 1936, and June 14, 1940, to Sept. 30, 1944, discharge computed as flow through power house and over dam. Recording Oct. 1, 1944, to Nov. 10, 1954, at highway bridge 225 ft downstream, and Nov. 11, 1954, to Sept. 30, 1957, at site 0.3 mile downstream at datum 9.78 ft lower. Oct. 1, 1957, to Oct. 21, 1958, discharge computed as flow through powerhouse and over dam. Recording Oct. 22, 1958, to Aug. 13, 1963, at site 225 ft downstream at present datum. Since Aug. 13, 1963, recording and hourly log of powerplant operation. Datum of gage Is 1,473.67 ft above mean sea level, datum of 1929. Elevation of taintor gate sill, 1,491.12 ft above mean sea level, datum of 1929.
Stage-discharge relation. Defined by current-meter measurements below 22,000 cfs and by slope-area measurement at 27,400 cfs.
Remarks. Peak flows affected by irrigation and power developments. Only annual peaks are shown.
Peak stages and discharges
Water year
1908
19141915
192819291930
19311932193319341935
1936
193S19391940
1941194219431944
Date
Aug. 6, 190S
May 24, 1914May 26, 1915
June 28, 1928June 6, 1929Sept. 6, 1930
Mar. 31, 1931May 26, 1932July 11, 1933Sept. 24, 1934Mar. 1, 1935
May 22, 1936
May 1938March 1939March 1940
Dec. 12, 1940May 16, 1942June 14, 1943June 13, 1944
Qage height (feet)
7.0
4.86.6
---
-----
-
---
_---
Discharge (cfs)
a!3,000
a9,200-
4,3006,720
15,200
7,1807,910
10,70011,500a7,000
10,200
a9,100a7,900a5,400
4,98012,80021,50011,200
Water year
1945
19461947194819491950
19511952
1953195*1955
19561957195819591960
196119621963
Date
Mar. 12, 1945
Aug. 5, 1946Oct. 5, 1946June 13, 1948Aug. 3, 1949Mar. 6, 1950
Aug. 2, 1951Dec. 27, 1951Apr. 1, 1952Mar. 15, 1953Mar. 29, 1954Mar. 12, 1955
Mar. 18, 1956May 19, 1957Feb. 26, 1958Mar. 29, 1959Mar. 27, 1960
Dec. 6, 1960July 1, 1962July 27, 1963
C-age height (feet)
3.90
3.154.003.003.366.0
2.80b2.932.802.682.10
12.16
---
7.258.6
4.8012.05.80
Discharge (cfs)
11,700
S,48015,4008,550
10,900a!8,SOO
8,870-
10,10012,40010.90027,400
2,9906,7105,840
11,00023,400
6,80027 , 0008,560
a About.b Backwater from ice.

NIOBRARA RIVER BASIN 423
4652. Honey Creek near O'Neill, Nebr.
Location. Lat 42°34'52" long 98°41'45", in SW corner of sec.11, T.30 N., R.12 W., on left side and downstream end of culvert on east-west county road, 9 miles northwest of O'Neill.
Drainage area. 2.54 sq mi.
Gage.--Crest-stage gage.
Stage-discharge relation.--Defined by a current-meter measurement at 16.4 cfs and an indirect measurement at 68.6 cfs.
Remarks. Only annual peaks are shown.
Peak stages and discharges
Water year
1958 1959 1960
Date
Apr. 23, 1958 Aug. 22, 1959 Mar. 27, 1960
Gage height (feet)
11.86 11.30 14.74
Discharge (cfs)
61 2570
Water year
1961 1962 1963
Date
July 27, 1961 July 11, 1962 July 9, 1963
Gage height (feet)
10.95 12.18 11.41
Discharge (cfs)
10 S5 33
4653. Camp Creek near O'Neill, Nebr.
Location.--Lat 42°39'08", long 98°39'26", in NW^SWi sec.19, T.31 N., R.ll W., on left downstream wingwall of culvert, 13 miles north of O'Neill or U.S. Highway 281.
Drainage area. 1.65 sq mi.
Gage. Crest-stage gage.
Stage-discharge relation. Based on estimates, and a slope-area measurement at 68.9 cfs.
Remarks. Only annual peaks are shown.
Peak stages and discharges
Water year
1958 1959 1960
Date
Apr. 23, 1958 Mar. 26, 1959 Mar. 27, 1960
Gage height (feet)
all. 02 a!2.80
Discharge (cfs)
0.5 b6
b50
Water year
1961» 1962 1963
Date
July 27, 1961 July 11, 1962 Feb. 5, 1963
Gage height (feet)
10.17 10.68
all. 22
Discharge (cfs)
27 68.9
blOa Backwater from ice. b Approximate.

424 NIOBRARA RIVER BASIN
4654. Blackbird Creek tributary near O'Neill, Nebr.
Location. Lat 42°33'42", long 98°38'47", in SW^NE^ sec.19, T.30 N., R.ll W., in open pasture 7^ miles north of O'Neill.
Drainage area . 0.60 sq mi.
Gage. Crest-stage gage.
Stage-discharge relation. Defined by field estimates below 3 cfs and extended above on basis of slope-area measurement at 68.2 cfs.
Remarks. Only annual peaks are shown.
Peak stages and discharges
Water year
1958 1959 1960
Date
July 26, 1958 Aug. 22, 1959 Mar. 27, 1960
Oage height (feet)
12.81 11.19 12.04
Discharge 1 Water (cfs) II year
94 1961 10 1962 47 (I 1963
Date
Mar. 14, 1961 July 11, 1962 Feb. 5, 1963
Grge height (feet)10.64 12.41
all. 90
Discharge (cfs)
2.0 68.2
b20a Backwater from ice. b Estimated.
4655. Niobrara River near Verdel, Nebr.
Location. Lat 42°44'25", long 98°12'45", near center of N| sec.23, T.32 N., R.8 W., on left bank 4 ft downstream from Pishelville bridge, 6 miles south of Verdel, and 6 miles upstream from Verdigre Creek.
Drainage area. 10,900 sq mi, approximately.
Gage. Nonrecording prior to June 14, 1940; recording thereafter. Datum of gage is 1,308.12 ft above mean sea level, datum of 1929.
Stage-discharge relation. Defined by current-meter measurements below 32,000 cfs.
Remarks. Peak flows affected by irrigation and power developments. Only annual peaks are shown.
Peak stages and discharges
Water year
1938 1939 1940
1959 1960
Date
May 2, 193S Mar. 20, 1939 Mar. 18, 1940
Mar. 19, 1959 Mar. 27, 1960
Oage height (feet)
5.70 5.49 4.95
a6.69 10.1
Discharge (cfs)
10,000 8,700 5,900
7,670 39,000
Water year
1961 1962
1963
Date
May 14, 1961 Mar. 27, 1962 July 1, 1962 Feb. 8, 1963 July 27, 1963
Oage height (feet)
5.62 a9.68
a7.35
Discharge (cfs)
6,290
25, 600
10,100
a Backwater from ice.
BAZILE CREEK BASIN
4665. Bazile Creek near Niobrara, Nebr.
Location.--Lat 42°45'OC", long 97°56'10", in NE^ sec.18, T.32 N., R.5 W., on downstream side of left pier of bridge on State Highway 12, 2^ miles up stream from mouth and 4^ miles east of Niobrara.
Drainage area. 440 sq mi, approximately.
Gage. Nonrecording. Supplementary recording gage above 4.2 ft at datum 4 ft TTigher Dec. 16, 1952, to June 16, 1947. Supplementary recording gage above 8.2 ft at present datum June 17, 1947, to Sept. 14, 1958. Supplementary gage above 4.3 ft since Sept. 14, 1958. All gage heights adjusted to present datum. Datum of gage is 1,210.81 ft above mean sea level, datum of 1929, supplementary adjustment of 1949.
Stage-discharge relation. Defined by current-meter measurements below 6,500 cfs and extended above on basis of contracted-opening measurements at 24,400 and 68,600 cfs.
Remarks. Base for partial-duration series, 1,000 cfs.

BAZILE CREEK BASIN 425
Peak stages and discharges of Bazile Creek near Niobrara, Nebr.
Water year
1951
1952
1953
1954
1955
1956
1957
1958
1959
Date
June 19, 1951
May 21, 1952
Mar. 10, 1953June 8, 1953July 30, 1953
May 31, 1954June 6, 1954June 18, 1954June 20, 1954
Mar. 3, 1955Sept. 21, 1955
Mar. 2, 1956July 15, 1956
Oct. 29, 1956Apr. 20, 1957May 21, 1957June 16, 1957July 1, 1957
Mar. 23, 1958July 27, 1958
May 29, 1959
Gage height (feet)
15.36
9.15
C17.0613.859.96
13.8015.5110.0310.96
016.6511.20
C9.687.41
10.2314.339.57
19.9611.47
7.2314.6
12.66
Discharge (cfs)
a24,400
b776
d3,00011,6001,260
10,40026,1001,3201,960
(e)2,440
-237
1,49014,4001,600
68,6004,860
2,25028,000
7,380
Water year
1959
1960
1961
1962
1963
Date
May 31, 1959June 26, 1959June 27, 1959Aug. 10, 1959
Apr. 1, 1960Apr. 6, 1960Apr. 12, 1960May 6, 1960May 19, 1960May 25, 1960June 10, 1960June 16, 1960June 28, 1960July 18, 1960Aug. 28, 1960
Feb. 12, 1961May 30, 1961June 15, 1961July 22, 1961
Mar. 27, 1962June 10, 1962June 17, 1962July 1, 1962
Aug. 5, 1963
Gage height (feet)
14.599.88
10.327.10
12.809.26
10.6010.4012.787.888.368.208.137.64
13.62
Cll.5410.139.98
10.60
017.9313.5712.979.77
11.98
Discharge (of 3)
16,3003,5804,5601,620
7,8102,4503,8003,5807,7501,3401,7101,5801,5201,160
10,700
-2,3202,1402,980
6,60010,5008,3501,910
4,640
a Annual peak only, c Backwater from ice.
b Maximum observe d About. e N
d during period May 7 to Sept. 30. lot determined.
MISSOURI RIVER MAIN STEM
4675. Missouri River at Yankton, S. Dak.
Location.--Lat 42°52', long 97°24', between sec.18, T.93 N., R.55 W., andsec.13, T.93 N., R.56 W., on downstream end of left pier of Meridian Highway Bridge on U.S. Highway 281 in Yankton, 8.3 miles upstream from James River, 5.3 miles downstream from Gavins Point Dam, and at mile 805.8.
Drainage area. 279,500 sq mi, approximately.
Gage. Nonrecording prior to Sept. 20, 1932; recording thereafter. Datum of gage is 1,159.68 ft above mean sea level, datum of 1929.
Stage-discharge relation. Defined by current-meter measurements.
Bankfull stage. 12 ft.
Historical data. The stage that occurred Apr. 5, 1881, is the maximum known.
Remarks. In addition to regulation shown for station below Fort Randall Dam, flows at this station have been regulated by Lewis and Clark Lake (capacity, 541,300 acre-ft) since July 1955. Only annual peaks are shown.
Peak stages and discharges
Water year
18S1
19311932
1933
19341935
1936
19371938
Date
Apr. 5, 1881
June 15, 1931Mar. 22, 1932June IS, 1932May 29, 1933June 2S, 1933Mar. 3, 1934July 16, 1935
Mar. 21, 1936Apr. IS, 1936June 22, 1937Mar. 24, 1938July 12, 1938
Gage height (feet)a30.5
7.22a!4.SO
9.68-
S.64alO . 30
8.90
a7.857.609.60-
10.15
Discharge (cfs)
-
46,500-
124,000111,000
-112,000130,000
-102,000112,000146,000
-
Water year
19391940
19411942194319441945
194619471948
1949
Date
Apr. 1, 1939June 15, 1940
June 14, 1941May 15, 1942Apr. 8, 1943Apr. 9, 1944Mar. 12, 1945Mar. 22, 1945
June 22, 1946Apr. 3, 1947Mar. 21, 194SMar. 26, 1948Apr. 7, 1949
Gage height (feet)
blO.107.42
10.2910.20
b!3.6010. S2as. 207.63
8.5711.00a9.058.60-
Discharge (cfs)
176,00050,800
137,000126,000282,000172,700
-98,300
87 , 300176,000
-110,000173,000
a Backwater from ice.b Occurred on following day.

426 MISSOURI RIVER MAIN STEM
Peak stages and discharges of Missouri River at Yankton, S. Dak. Continued
Water year
19491950
19511952195319541955
19561957
Date
Apr. 10, 1949Apr. 24, 1950
Apr. 7, 1951Apr. 13, 1952June 25, 1953June 1, 1954Mar. 11, 1955Aug. 25, 1955
Aug. 24, 1956Oct. 2, 1956
Gage height (feet)10.5511.60
8.4315.58.594.79
a5.614.85
5.05-
Discharge (cfs)
-237,000
134,000480,000112,00038,600
-38,500
47 , 00038 , 600
Water- year
19571958
1959
1960
1961
19621963
Date
Oct. 10, 1956Oct. 3, 1957Oct. 7, 1957Oct. 7, 1958Aug. 28, 1959Mar. 29, 1960
Nov. 2, 1960July 6, 1961July 4, 1962July 25, 1963
Gage height (feet)
4.624.07-
3.59-
3.59
3.00-
3.332.80
Discharge (cfs)
--
35,300-
33,90034,700
-31 , 80035,90033,800
a Backwater from ice.
JAMES RIVER BASIN
4676. James River near Manfred, N. Dak.
Location.--Lat 47°38'40", long 99°49'40", near midpoint of north line sec.15, T.148 N., R.72 W., on left upstream wingwall of bridge on U.S. Highway 52, 5 miles southwest of Manfred.
Drainage area. 290 sq mi, approximately, of which about 50 sq mi probably contributes directly to surface runoff.
Gage.--Crest-stage gage prior to Sept. 16, 1957; recording and crest-stage gages thereafter. Datum of gage is 1,605.73 ft above mean sea level, datum of 1929.
Stage-discharge relation. Defined by current-meter measurements.
Bankfull stage.--? ft.
Remarks. Base for partial-duration series, 30 cfs.
Peak stages and discharges
Water year
1950
1955
1956
1957
1958
1959
Date
April 1950
Mar. 30, 1955
Aug. 13, 1956
Apr. 11, 1957
Mar. 30, 1958
Mar. 12, 1959 Mar. 18, 1959
Gage height (feet)
a9
b3.80
b5.98
2.02
bl.90
b2.8 bl.88
Discharge (cfs)
110
250
35
26
6
Water year
1960
1961
1962
1963
1964
Date
Mar. 27, 1960
Mar. 14, 1961 May 12-16,1961
Mar. 25, 1962 Mar. 28, 1962
June 26, 1963
June 20, 1964
Gage height (feet)
6.15
1.24
b?!94
1.37
3.52
Discharge (cfs)
555
.3
40
2.7
73
a About; caused by ice jam. b Backwater from ice or snow.
4676.5. James River tributary near Manfred, N. Dak.
Location. Lat 47°38'50", long 99°54'20", in SW£ sec.7, T.148 N., R.72 W., at bridge on county highway, 8 miles southwest of Manfred.
Drainage area.--95.9 sq mi, of which 37.2 sq mi probably contributes directly to surface runoff.
Gage. Crest-stage gage.
Stage-discharge relation. Defined by current-meter measurements below 132 cfs.
Remarks. Only annual peaks are shown.

JAMES RIVER BASIN 427
Peak stages and discharges of James River tributary near Manfred, N. Dak.
Water year
1955
195619571958
1959
Date
March 1955
Apr. I, 1956March 1957April or May
1958March 1959
Qage height (feet)
1.88
al.981.581.50
1.0
Discharge (cfs)
110
50b2b5
b3
Water year
1960
196119621963
1964
Date
March 1960
_Mar. 29, 1962June or July
1963June 1964
Gage height (feet)
2.70
_2.5
al.21
-
Discharge (cfs)
-
0-bl
b6a Backwater present, b Estimated.
4678. James River tributary No. 3 near Manfred, N. Dak.
Location. Lat 48°38'40", long 99°45'30", in NE^NE^ sec.18, T.148 N., R.71 W., at culvert on former U.S. Highway 52, 3| miles south of Manfred.
Drainage area. 21.3 sq mi, of which about 20 sq mi probably contributes directly to surface runoff.
Gage. Crest-stage gage.
Stage-discharge relation.--Defined by current-meter measurement below 20.4 cfs.
Remarks. Only annual peaks are shown.
Peak stages and discharges
Water year
1955
1956195719581959
Date
March 1955March 1955
April 1956Aug. 12, 1957Mar. 26, 1958March 1959March 1959
Qage height (feet)a3.35al.70
a3.982.242.07
a2.31a2.00
Discharge (cfs)
-9
b501814-1
Water year
1960
1961196219631964
Date
March 1960
--
Summer 1963May or June
1964
Gage height (feet)
2.7
-2.87-
2.33
Discharge (cfs)
70
02.1
17
a Backwater from snow or ice. b Estimated.
4680. James River at New Rockford, N. Dak."
Location. Lat 47°41'05", long 99°07'30", on line between sees. 32 and 33, T.149 N., R.66 W., on right bank 90 ft downstream from U.S. Highway 281
bridge at New Rockford, 7 miles upstream from small tributary.
Drainage area. 596 sq mi, of which about 406 sq mi probably contributes directly to surface runoff.
Gage.--Nonrecording prior to Aug. 8, 1951; recording thereafter. Datu-n of gage is 1,500.00 ft above mean sea level, datum of 1929.
Stage-discharge relation.--Defined by current-meter measurements below 470 cfs.
Bankfull stage. 10 ft.
Historical data.--Flood of April 1948 is greatest known since at least 1925, from information by local resident.
Remarks.--Considerable channel storage above gage does not materially affect the higher peak flows. Only annual peaks are shown.

428 JAMES RIVER BASIN
Peak stages and discharges of James River at New Rockford, N. Dak.
Water year
1948
1950
19511952195319541955
Date
April 1948
April 1950
Apr. 12, 1951Apr. 8, 1952July 11, 1953June 16, 1954Apr. 8 or 9
1955
Gage height (feet)a!3
11.3
9.20b8.856.366.857.52
Discharge (cfs)
-
-
840380
4.12175
Water year
19561957195819591960
196119621963
Date
Apr. 16, 1956Sept. 18, 1957Nov. 9, 1957
-Apr. 3, 1960
---
Gage height (feet)b8.708.798.89-
10.16
---
Discharge (cfs)
30624450
670
000
a About.b Backwater from ice.
4685. James River near Pingree, N. Dak.
Location. Lat 47°08'30", long 98°47'00", in SW^SWi sec.3, T.142 N., R.64 W., on right bank 500 ft upstream from dam at outlet of DePuy Marsh, 6^ miles southeast of Pingree, and 6^ miles northeast of Buchanan.
Drainage area.--1,580 sq mi, approximately, of which about 1,140 sq mi contrib- utes directly to surface runoff.
Gage. Recording. Datum of gage is 1,400.00 ft above mean sea level, datum of "1929.
Stage-discharge relation. Defined by current-meter measurements below 150 cf s .
Remarks. Peak flows are materially affected by storage above station. Only annual peaks are shown.
Peak stages and discharges
Water year
195319541955
195619571958
Date
June 25, 1953June 15, 1954May 4, 1955
June 6, 1956May 26, 1957Apr. 28, 1958
Oage he ight (feet)
37.1637.0837.25
37.3232.0637.52
Discharge (cfs)
160107237
17580
245
Water year
1959
1960
196119621963
Date
Oct.l to Dec.8,1958
Apr. 13, 1960
_July 7, 1962
-
Gage height ( feet )
-
37.62
_37.19
-
Discharge (cfs)
0.2
293
O113
0
4695. Pipestem Creek near Buchanan, N. Dak.
Location.. Lat 47°03'59", long 98°55'07", at north line of sec.*, T.141 N., R.65 W., on left bank 30 ft downstream from bridge on county road, 4-J miles west of Buchanan.
Drainage area. 925 sq mi, of which 475 sq mi contributes directly to surface runoff.
Gage.--Nonrecording prior to July 11, 1950; recording thereafter. Datum of gage is 1,467.01 ft above mean sea level, datum of 1929.
Stage-discharge relation.--Defined by current-meter measurement?.
Bankfull stage.--8 ft.
Remarks. Base for partial-duration series, 200 cfs.

JAMES RIVER BASIN 429
Peak stages and discharges of Pipestem Creek near Buchanan, H. Dak.
Water year
1950
1951
1952
1953
1954
1955
1956
Date
Apr. 6, 1950Apr. 9, 1950Apr. 17, 1950May 12, 1950
Apr. 4, 1951Apr. 6, 1951
Apr. 4, 1952Apr. 4, 1952
Mar. 14, 1953June 20, 1953
June 7, 1954June 12, 1954
Mar. 31, 1955Apr. 2, 1955
May 30, 1956June 7, 1956
Gage height (feet)all. 28all. 8910.7710.34
a8. 387.84
a9.48a9.4
a5.14.41
7.276.02
a7.206.77
6.887.06
Discharge (cfs)
900-
4,4803,440
-826
-al , 100
-116
539316
_491
516560
Water year
1957
1958
1959
1960
1961
1962
1963
1964
Date
Mar. 22, 1957Sept. 11, 1957
Feb. 27, 1958Mar. 30, 1958
Mar. 30, 1959
Mar. 27, 1960
Mar. 3, 1961Apr. 6, 1961
Mar. 29, 1962July 6, 1962July 19, 1962
Mar. 24, 1963
June 18, 1964
Gage height (feet)a4.383.55
-a7.12
a2.56
7.6
a4.092.89
a6.388.268.14
a3.72
7.61
Discharge (cfs)
-55
370400
4.3
678
-15
320894854
28
681
a Backwater from ice.
4696. Minneapolis Flats Creek tributary near Eldridge, N. Dak.
Location.--Lat 46°53'25", long 98°55'30", at section line 5-6, T.139 N., R.65 W. , at culverts on county highway, 3^ miles west of Eldridge.
Drainage area. 9.91 sq mi.
Gage. Crest-stage gage.
Stage-discharge relation. Defined by current-meter measurements below 28 cfs.
Remarks. Only annual peaks are shown.
Peak stages and discharges
Water year
1955
19561957195819591960
Date
June 1955
June 6, 1956Spring 1957March 1958
-Apr. 5, 1960
Gage height (feet)
1.90
2.682.08
a2.78-
2.46
Discharge (cfs)
5.6
3310.5100
30
Water year
1961
196219631964
Date
Marcher April1961
July6or7, 1962-
May or June1964
Gage height (feet)
1.85
3.36-
3.28
Discharge (cfs)
0.2
600
58
a Backwater from ice.
219-848 O - 66 - 29

430 JAMES RIVER BASIN
4700. James River at Jamestown, N. Dak.
Location. Lat 46°53'45", long 98°41'28", in NW^SW^ sec.31, T.140 N., R.63 W. on right bank 80 ft downstream from Asylum Bridge at southeast corner of Jamestown and 2.5 miles downstream from Pipestem Creek.
Drainage area. 2,840 sq mi, of which about to surface runoff.
sq mi contributes directly
Gage. Nonrecording prior to Oct. 1, 1949; recording thereafter. At site 80 ft upstream at datum 5.00 ft lower June 1928 to August 1933. At site 80 ft up stream at present datum August 1937 to September 1939 and MarA 1943 to Sept. 30, 1949. Datum of gage is 1,375.27 ft above mean sea level, datum of 1929. Gage heights given herein converted to present site ani datum.
Stage-discharge relation.--Defined by current-meter measurements.
Bankfull stage.--12 ft.
Historical data.--Flood of Apr. 27, 1897, was about the same as flood of May 13, 1950. Flood of Mar. 27, 1902, was about 2 ft lower aid flood of Apr. 11, 1919, was about 1 ft lower than the 1950 flood. Floods also oc curred in 1876, 1881, 1882, 1883.
Remarks.--Flow regulated by Arrowood and Jim Lakes (combined capacity, 16,000 acre-ft) and by Jamestown Reservoir since 1954 (capacity, 229,500 acre-ft). Base for partial-duration series, 200 cfs. Only annual peaks are shown prior to Oct. 1, 1949, and since 1953.
Peak stages and discharges
Water year
192819291930
1931L9321933
19381939
1943L9441945
1946
1947
19481949
1950
Date
July 5, 1928Mar. 14, 1329Mar. 11, 1930
Apr. 6, 1931Feb. 28, 1932Feb. 28, 1933
Mar. 15, 1938Mar. 24, 1939
Mar. 31, 1943May 28, 1944Mar. 14, 1945
Mar. 23, 1946Apr. 10, 1946Mar. 24, 1947Apr. 12, 1947Apr. 23, 1948Apr. 4, 1949
Apr. 7, 1950Apr. 17, 1950May 13, 1950June 12, 1950
Gage height (feet)7.49.2
a6.8
2.44a7.38a6.78
3.904.65
a!2.775.585.62
4.41-
a7.60-
b!4.3110.06
al2.8515.7315.826.17
Discharge (cfs)
7861.100
580
91722642
162250
1,900370434
-159-697
3,2501,350
1,6806,0206,39O
589
Water year
1950
1951
1952
1953
19541955
19561957
195819591960
196119621963
Date
June 26, 195O
Mar. 29, 1951Apr. 5, 1951
Apr. 4, 1952Apr. 8, 1952
May 30, 1953June 15, 1953June 20, 1953June 27, 1953
June 8, 1954Apr. 3, 1955
June 16, 1956Mar. 26, 1957Sept. 19, 1957Feb. 28, 1958June 27, 1959Mar. 27, I960
Mar. 7, 1961July 20, 1962July 11, 1963
C-age height (feet)
4.51
a9.639.48
10.1811.12
6.486.146.635.69
6.956.10
8.86-
C5.24a8. 623. IS
all. 76
2.4311.423.45
Discharge (cfs)
328
1,1001,130
1,3601,620
617559642486
637552
93792
-600135
1,710
321,630
123a Backwater from ice.b Occurred on following day.c Backwater from temporary fill.
4702. Beaver Creek tributary near Eldridge, N. Dfk.
Location.--Lat 46°52'15", long 98°55'30", at section line 7-8, T.139 N., R.65 W., at culvert on county highway, 4 miles southwest of Eldridge.
Drainage area.--0.19 sq mi.
Gage.--Crest-stage gage.
Stage-discharge relation. Defined by current-meter measurement? below 3 cfs and extended above on basis of estimate at 45 cfs based on stage and cul vert geometry.
Remarks.--Only annual peaks are shown.

JAMES RIVER BASIN 431
Peak stages and discharges of Beaver Creek tributary near Eldridge, N.
Water year
1955
19561357195819531360
Date
June 1955
May 29, 1956
Feb. 27, 1958March 1959March 1960
Oage height (feet)
3.90
3.00_
2.37-
3.00
Discharge (cfs)
28
1409.5a.l
13
Water year
1961
196219631964
Date
February 1961Feb. 27, 1961July 19, 1962April 1963May or June
1964
Gage height (feet)
3.88-
5.552.524.80
Dak.
Discharge (cfs)
4511
a Estimated.
4703. Beaver Creek near Sydney, N. Dak.
Location.--Lat 46°45'00", long 98°47'50", In SW^SW^ sec.20, T.138 N., R.64 W., at bridge on county highway 2 miles northwest of Sydney.
Drainage area. 92.2 sq mi.
Gage. Crest-stage gage.
Stage-discharge relation.--Defined by current-meter measurements below 440 cfs.
Remarks.--Only annual peaks are shown.
Peak stages and discharges
Water year
1955
19561957195819591960
Date
June 1955
June 6, 1956' May 1957Feb. 28, 1958July 15, 1959Mar. 27, 1960
Oage height (feet)3.18
4.821.60
b4.481.504.44
Discharge (cfs)
ISO
490a5290
2.1410
Water year
196119621963
1964
Date
March 1961July 8, 1962April or May
1963May or June
1964
Gage height (feet)b2.667.662.39
3.52
Discharge (cfs)
a2.570070
-
a Estimated.b Backwater from ice.
4704. Buffalo Creek tributary near Sydney, N. Dak.
Location.--Lat 46°42'40", long 98°50'20", in SW^NW^ sec.l, T.137 N., R.65 W., at bridge on county highway, 3^ miles southwest of Sydney.
Drainage area. 26.2 sq mi.
Gage.--Crest-stage gage. At different datum prior to March 1959.
Stage-discharge relation. Prior to March 1959, defined by current-meter meas urements below 120 cfs. After March 1959, defined by current-meter measure ments below 57 cfs.
Remarks.--Only annual peaks are shown.
Peak stages and discharges
Water year
1955
1956 1957
1958 1959 1960
Date
Summer 1955
June 6, 1956 March 1957 May 25, 1957 Feb. 28, 1958 July 14, 1959 Mar. 27, 1960
Gage height (feet)5.93
6.16 a4.68
a6.583.04 2.71
Discharge (cfs)
72
130
4 40 120 66
Water year
1961 1962 1963
1964
Date
March 1961 July 5, 1962 March or April
1963 May or June
1964
a Backwater from ice.
Gage height (feet)
2.00 3.45 2.35
1.86
Discharge (cfs)
5125 20
2

432 JAMES RIVER BASIN
4705. James River at La Moure, N. Dak.
Location. Lat 46°21'20", long 98°18'15", at northeast corner of sec.11,T.133 Ni, R.61 W., on left bank 80 ft downstream from State Highway 13, half a mile west of La Moure, and 12 miles upstream from Cottonwool Creek.
Drainage area.--5,740 sq mi, approximately, of which about 2,940 sq mi contrib utes directly to surface runoff.
Gage.--Nonrecording prior to Sept. 2, 1951; recording thereafter. Datum of gage is 1,290.00 ft above mean sea level, datum of 1929.
Stage-discharge relation. Defined by current-meter measurements.
Bankfull stage. 14 ft.
Historical data. A long-time local resident states that the 1950 flood was the highest since 1882, with stage in either 1942 or 1943 being almost as high due to large ice jams.
Remarks.--Flow regulated by Arrowood and Jim Lakes (combined capacity, 16,000 acre-ft) and by Jamestown Reservoir since 1954 (capacity, 229,500 acre-ft). Only annual peaks are shown.
Peak stages and discharges
Water year
1950
1951
1952
195319541955
1956
Date
May 16, 1950
Apr. 3, 1951Apr. 8, 1951Apr. 9, 1952Apr. 11, 1952June 18, 1953July 5, 1954Apr. 5, 1955
June 9, 1956
Qage height (feet)
15.34
all. 45-
ais.15-
9.518.908.62
9.38
Discharge (cfs)
5,730
-2,000
-3,6001,250845639
1,150
Water year
1957195819591960
196119621963
Date
Mar. 31, 1957Mar. 5, 1958Apr. 6, 1959Apr. 2, 1960Apr. 9, 1960
Apr. 4, 1961July 11, 1962Apr. 3, 1963
C-age height (feet)
7.598.797.71
all. 06-
7.6011.597.74
Discharge (cfs)
82762126-
1,610
932,250
171
a Backwater from Ice.
4710. James River at Columbia, S. Dak.
Location. Lab 45°37'05", long 98°19'30", in NE^NW^ sec.29, T.125 N. , R.62 W., on left bank 10 ft downstream from highway bridge, three-quarters of a mile northwest of Columbia, 2^ miles upstream from Chicago and North Western Railway Co. bridge, 3f miles upstream from Elm River, and 9 miles downstream from Sand Lake.
Drainage area.--7,050 sq mi, approximately, of which about 4,050 sq mi contrib utes directly to surface runoff.
Gage.--Nonrecording prior to Oct. 5, 1957; recording thereafter. Datum of gage is 1,274.54 ft above mean sea level, datum of 1929.
Stage-discharge relation.--Defined by current-meter measurements.
Bankfull stage. 10 ft.
Remarks.--Occasional reverse flow caused by Elm River (maximum, 1,860 cfs Apr. 8, 1952). Only annual peaks are shown.
Peak stages and discharges
Water year
19461947
194819491950
195113521953
1954
1955
Date
May 25, 1946Apr. 18, 1947May 2, 1947May 10, 1948Apr. 27, 1949May 24, 1950
Apr. 21, 1951Apr. 17, 1952June 27, 1953July 3, 1953June 17, 1954July 6, 1954July 19, 1955
Qage height ( feet )
7.56al5.20
-15.5912.6116.89
13.5116.53
al3.74-
alO.08-
a. 14
Discharge (cfs)
121-
1,1701,950
S575,420
1,0403,580
-766-185143
Water year
195619571958
19591960
1961
1962
1963
Date
June 22, 1956Apr. 20, 1957Mar. 10, 1958Apr. 23, 1958
-Apr. 29, 1960
Mar. 19, 1961May 18, 1961Aug. 1, 1962Aug. 19, 1962June 15, 1963
Gage height (feet)8.937.43
b9.50--
12.06
_6.12
a!4.36-
9.54
a Backwater from Elm River. b Backwater from ice.
Discharge (cfs)
23793-
2160
589
10--
914357

JAMES RIVER BASIN 433
4710.5. Elm River tributary near Leola, S. Dak.
Location. Lat 45°51', long 98°46', in NE^ sec.3, T.127 N. , R.66 W. , at culvert on county highway, 12^- miles northeast of Leola.
Drainage area.--14.7 sq mi.
Gage. Crest-stage gage.
Stage-discharge relation.--Defined by current-meter measurements below 80 cfs and extended above on basis of indirect measurement at 418 cfs.
Remarks. Only annual peaks are shown.
Peak stages and discharges ,
Water year
1956 1957 1958 1959 1960
Date
June 17, 1956 Aug. 8, 1957 June 1958
Mar. 25, 1959 Mar. 28, 1960
Gage height (feet)
3.08 3.74 4.89 2.10 6.35
Discharge (cfs)
37 41 87
.2 185
Water year
1961 1962 1963 1964
Date
Apr. 23, 1961 Apr. 2, 1962 June 9, 1963 May 3, 1964
Gage height (feet)
2.63 3.85 4.10 8.62
Discharge (cfs)
6 42 52
418
4712. Maple River at North Dakota-South Dakota State line
Location.--Lat 45°56'20", long 98°27'10", in SW£SE£ sec.33, T.129 N., R.62 W., on left bank 0.4 mile upstream from State line, 8 miles northeast of Frederick, S. Dak., and 15^ miles upstream from mouth.
Drainage area.--750 sq mi, approximately, of which about 480 sq mi contributes directly to surface runoff.
Gage. Nonrecording at site 0.4 mile downstream at datum 0.94 ft lower prior to June 14, 1962; recording thereafter. Altitude of gage is 1,365 ft (from topographic map).
Stage-discharge relation. Defined by current-meter measurements.
Remarks.--Base for partial-duration series, 50 cfs.
Peak stages and discharges
Water year
1957
1958
1959
1960
1961
Date
July 30, 1957
Mar. 3, 1958Mar. 6, 1958May 16, 1958
-
Mar. 29, 1960Apr. 9, 1960May 29, 1960
Mar. 13, 1961
Gage height (feet)
4.15
a8.327.505.55
-
6.856.485.97
3.90
Discharge (cfs)
49
496390163
0
589508350
45
Water year
1962
1963
1964
Date
Mar. 30, 1962June 24, 1962July 9, 1962July 22, 1962Aug. 13, 1962
Mar. 29, 1963May 27, 1963June 7, 1963
June 26, 1964
Gage height (feet)
alO.746.48
10.976.184.51
4.614.745.77
7.21
Discharge (cfs)
1,500329
2,03034856
5588
270
b598
a Backwater from Ice b Annual peak only.
4713.5. Maple River at Frederick, S. Dak.
Location.--Lat 45°49'57", long 98°30'45", in NE£SW£nw£ sec.11, T.127 N. , R.64 W., at dam on Maple River in City Park, at west edge of Frederick.
Drainage area.--822 sq mi, of which 532" sq mi contributes directly to surface runoff.
Gage.--Crest-stage gage.
Stage-discharge relation.--Defined by current-meter measurements.
Remarks.--Only annual peaks are shown.

434 JAMES RIVER BASIN
Peak stages and discharges of Maple River at Frederick, S. Dak.
Water year
1956 1957 1958 1959 1960
Date
May 1956 July 31, 1957 Mar. 4, 1958
Mar. 30, 1960
Sage height (feet)
6.45 6.47 7.18
8.14
Discharge (cfs)
44 48 250
0 820
Water year
1961 1962 1963 1964
Date
Mar. 30, 1961 July 10, 1962 July 26, 1963 June 27, 1964
Gige height (feet)
6.39 9.72 7.03 7.74
Discharge (cfs)
352,800
200 500
4714. Willow Creek tributary near Leola, S. Dak.
Location. Lat 45°44', long 98°46', In SWir sec.11, T.126 N. , R.66 W., at cul vert on former State Highway 10, 8f miles northeast of Leola.
Drainage area. 3.74 sq mi.
Gage.--Crest-stage gage.
Stage-discharge relation.--Defined by current-meter measurements below 12 cfs.
Remarks. Only annual peaks are shown.
Peak stages and discharges
Water year
1956 1957 1958 1959 1960
Date
Aug. 8, 1957 Mar. 4, 1958 March 1959 Mar. 30, 1960
Gage height (feet)
1.85 2.18
al.09 2.25
Discharge (cfs)
0 15 23
(b) 25
Water year
1961 1962 1963 1964
Date
July 4, 1962 June 9, 1963 May 3, 1964
Gige height (feet)
2.07 1.51 2.58
Discharge (cfs)
020 7
33
a Backwater from ice. b Less than 0.5 cfs.
4714.5. Willow Creek tributary near Barnard, S. Dal'.
Location.--Lat 45°44', long 98°38', in SW£ sec.11, T.126 N. , R.65 W. , at cul vert on former State Highway 10, 6j miles west of Barnard.
Drainage area. 0.18 sq mi.
Gage. Crest-stage gage.
Stage-discharge relation.--Defined by current-meter measurements below 10 cfs.
Remarks. Only annual peaks are shown.
Peak stages and discharges
Water year
1956 1957 1958 1959 1960
Date
Mar. 4, 1958 February 1959 Apr. 5, 1960
Gage height (feet)
2.24 al.47 a2.59
Discharge (cfs)
0 0 14
(b)20
Water year
1961 1962 1963 1964
Date
July 4, 1962 June 9, 1963 May 3, 1964
Gage height (feet)
1.98 1.95 1.73
Discharge (cfs)
0 9 8.5 5.0
a Backwater from ice. b Less than 1 cfs.

JAMES RIVER BASIN 435
4715. Elm River at Westport, S. Dak.
Location. Lat 45°39'20", long 98°29'50", in SW^NW^ sec.12, T.125 N., R.64 W., on right bank 12 ft downstream from highway bridge (formerly U.S. Highway 281), half a mile north of Westport, three-quarters of a mile upstream from Chicago, Milwaukee, St. Paul and Pacific Railroad bridge, 9^ miles down stream from Willow Creek, and 30| miles upstream from mouth.
Drainage area.--1,680 sq mi, approximately, of which about 1,170 sq mi contrib utes directly to surface runoff.
Gage. Nonrecording Oct. 1, 1945, to Aug. 5, 1951, and Apr. 8 to Sept. 9, 1952; recording Aug. 6, 1951, to Apr. 7, 1952, and since Sept. 10, 1952. Datum of gage is 1,309.3 ft above mean sea level, datum of 1929.
Stage-discharge relation. Defined by current-meter measurements.
Bankfull stage.--8 ft.
Remarks. Flow regulated for Aberdeen municipal water supply by Elm Lake and other small reservoirs (combined capacity, about 16,000 acre-ft). Ease for partial-duration series, 100 cfs.
Peak stages and discharges
Water year
1947
1948
1949
1950
1951
1952
1953
1954
1955
Date
Apr. 14, 1947
Mar. 13, 1948Mar. 29, 1948
Mar. 12, 1949Apr. 2, 1949
Mar. 28, 1950Apr. 6, 1950Apr. 20, 1950May 11, 1950May 23, 1950
Apr. 2, 1951
Apr. 8, 1952
Mar. 19, 1953June 20, 1953June 24, 1953
June 14, 1954
Mar. 12, 1955Mar. 19, 1955Apr. 4, 1955July 12, 1955
Oage height (feet)
11.45
b8.2712.51
b8.258.20
b8.12bll.74
6.5010.796.76
b9.4O
20.10
b8.6810.009.73
10.50
t>6.40b7.625.916.12
Discharge (cfs)
a2,100
4002,870
450840
4001,400
3141,870
329
550
7,520
7001,4201,320
1,560
160300168220
Water year
1955
1956
1957
1958
1959
1960
1961
1962
1963
Date
July 16, 1955
Mar. 22, 1956Apr. 15, 1956
Sept. 3, 1957
Feb. 28, 1958Mar. 4, 1958Mar. 1 , 1958May 17, 1958
July 15, 1959
Mar. 29, 1960Apr. 9, 1960May 30, 1960
Mar. 28, 1961
Mar. 31, 1962June 20, 1962June 25, 1962July 10, 1962July 23, 1962
May 29, 1963June 9, 1963
Qage height (feet)
7.08
b5.575.56
5.54
7.529.207.986.26
4.95
bll.268.887.17
4.89
b!3.526.587.53
12.856.70
5.806.78
Discharge (cfs)
453
_111
89
5371,060
676207
39
1,1001,170
549
34
2,100343645
2,670396
151348
a Annual peak only, b Backwater from ice.

436 JAMES RIVER BASIN
4720. James River near Stratford, S. Dak.
Location. Lat 45°14'30", long 98°23'30", in NE^NE^NE^ sec.3, T.120 N., R.63 W. on right bank 30 ft downstream from highway bridge, 6f miles southwest of Stratford, and 8f miles upstream from Mud Creek.
Drainage area. 9,990 sq mi, approximately, of which about 6,070 sq mi contrib utes directly to surface runoff.
Gage. Nonrecording March 1950 to August 1951; recording thereafter. Datum of gage is 1,254.29 ft above mean sea level, datum of 1929.
Stage-discharge relation. Defined by current-meter measurements.
Bankfull stage. 14 ft.
Remarks. Base for partial-duration series, 400 cfs.
Peak stages and discharges
Water year
1950
1951
1952
1953
1954
1955
1956
1957
Date
May 14, 1950
May 19, 1951
Apr. 19, 1952
July 13, 1953
June 28, 1954
July 28, 1955
July 6, 1956
June 18, 1957
Gage height (feet)
17.8
15.47
18.13
15.16
11.33
9.63
9.55
9.06
Discharge (cfs)
a5,580
870
4,970
718
321
185
177
153
Water year
1958
1959
1960
1961
1962
1963
Date
Mar. 26, 1958
-
May 12, 1960
Apr. 7-10, 1961 May 30, 1961
Aug. 12, 1962 Aug. 14, 1962
June 28, 1963
Gage height (feet)
1:12.25
-
13.76
6.01
15.77
11.65
Discharge (cfs)
277
0
362
14
361
314
a Annual peak only. t> Backwater from ice.
4725. Mud Creek near Stratford, S. Dak.
Location. Lat 45°14'30", long 98°18'00", in NE^NWir sec.4, T.120 N., R.62 W. , on right bank 20 ft downstream from highway bridge, three-quarters of a mile upstream from nearest tributary, 5£ miles south of Stratford, and 9^ miles upstream from mouth.
Drainage area. 740 sq mi, approximately, of which about 470 sq mi contributes directly to surface runoff.
Gage.--Recording. Datum of gage is 1,263.32 ft above mean sea level, datum of 1929.
Stage-discharge relation.--Defined by current-meter measurements.
Remarks. Base for partial-duration series, 50 cfs.
Peak stages and discharges
Water year
1956
1957
1958
1959
1960
Date
Apr. 15, 1956
Mar. 28, 1957May 31, 1957
(a)
Apr. 4, 1959
Apr. 4, 1960
Gage height (feet)
5.48
7.696.91
4.36
4.74
9.16
Discharge (cfs)
12
9552
2.5
1.7
196
Water year
1961
1962
1963
Date
May 14, 1961
Mar. 28, 1962May 27, 1962June 17, 1962June 21, 1962
June 1, 1963
Gage height (feet)
5.03
10.537.768.408.39
5.34
Discharge (cfs)
7
637100141140
9.9
a. Maximum discharge occurred on many days. Maximum gage height occurred May 2, 1958.

JAMES RIVER BASIN 437
4730. James River at Ashton, S. Dak.
Location.--Lat 45°00'02", long 98°28'57", in SE^Sw£ sec.25, T.118 N., R.64 W., on right bank 900 ft upstream from highway bridge, half a mile east of Ashton, 6 miles upstream from Snake Creek, and 14 miles upstream fron Turtle Creek.
Drainage area. 11,000 sq mi, approximately, of which about 6,810 sq mi con- tributes directly to surface runoff.
Gage.--Nonrecording at site 900 ft downstream at same datum prior to December 1957; recording thereafter. Datum of gage is 1,244.4 ft above mean sea level, datum of 1929.
Stage-discharge relation.--Defined by current-meter measurements.
Bankfull stage. 15 ft.
Remarks. Occasional reverse flow caused by Snake Creek (maximum, 1,500 cfs Apr. 10, 1952). Base for partial-duration series, 600 cfs.
Peak stages and discharges
Water year
1946
1947
1948
1949
1950
1951
1952
1953
1954
1955
Date
Mar. 28, 1946
May 22, 1947
Mar. 25, 1948May 16, 1948
May 21, 1949
May 19, 195O
May 18, 1951
Apr. 23, 1952
Aug. 3, 1953Aug. 4, 1953
June 30, 1954
Mar. 15, 1955
Oage height (feet)
7.12
8.83
a!3.7810.90
7.94
19.14
9.39
19.59
alO.64-
6.34
b8.56
Discharge (cfs)
494
786
_1,11O
579
5,170
840
4,860
_1,000
317
-
Water year
1955
1956
1957
195S
1959
1960
1961
196?
1963
Date
July 30, 1955
July 7, 1956
June 22, 1957
Mar. 30, 1958
-
Apr. 4, 1960Apr. 10, 1960
May 25, 1961
Apr. 3, 1962May 4, 1962Aug. 30, 1962
June 30, 1963
Qage height ( feet )
5.84
5.57
5.54
7.46
-
b!2.96a!2.04
4.52
b!2.379.03
10.08
6.51
r'.scharge (cfs)
194
204
170
373
0
-520
16
-602805
320
a Backwater from Snake Creek, b Backwater from Ice.
4735. West Branch Snake Creek near Athol, S. Dak.
Location. Lat 45°03'20", long 98°44'10", in SE^NE^ sec. 11, T.118 N., R.66 W., on left bank at upstream side of highway bridge, 3 miles downstream from confluence of Nixon River and Perry Creek and 1\ miles northwest of Athol.
Drainage area.--1,820 sq mi, approximately, of which about 1,090 sq mi contrib- utes directly to surface runoff.
Gage.--Nonrecording at site half a mile upstream at datum 4.78 ft higher prior to May 1951; recording thereafter. Altitude of gage is 1,325 ft (by barometer).
Stage-discharge relation. Defined by current-meter measurements.
Bankfull stage. 10 ft.
Remarks. Base for partial-duration series, 75 cfs.
Peak stages and discharges
Water year
1950
1951
Date
Mar. 27, 1950 Apr. 3, 1950 May 12, 1950
Mar. 28, 1951
Oage height (feet)aS.68 S.O5 5.63
a5.90
Discharge (cfs)
395 102
70
Water year
1952
1953
Date
Apr. 9, 1952 Apr. 28, 1952
Mar. 23, 1953 June 20, 1953
Gage height ( feet )
a!6.42 9.59
a!2.50 10.53
I ischarge (cfs)
2,200 88
480 153
a Backwater from ice

438 JAMES RIVER BASIN
Peak stages and discharges of West Branch Snake Creek near Athol, S. Dak. Continued
Water year
1953
1954
1955
1956
1957
1958
Date
July 30, 1953Aug. 6, 1953Aug. 11, 1953
June 8, 1954
Mar. 12, 1955
June 17, 1956
June 16, 1957
Mar. 26, 1958
Qage height (feet)
13.9913.0612.52
9.37
all. 88
7.44
8.98
8.67
Discharge (cfs)
955601416
63
290
8
49
28
Water year
1959
1960
1961
1962
1963
Date
-
Apr. 3, 1960Apr. 8, 1960
-
Mar. 29, 1962Apr. 2, 1962June 16, 1962
June 16, 1963
Qage t eight (feet)
-
al2.9813.78
-
a!4.0511.2910.92
7.58
Discharge (cfs)
0
6501,170
0
870270155
7.4
a Backwater from ice.
4737. Snake Creek near Ashton, S. Dak.
Location. Lat 45°02', long 98°34', in SW^-SW^- sec.17, T.118 N. , R.64 W. , on right bank 7 ft downstream from highway bridge, 700 ft downstream from West Branch Snake Creek, 4-| miles northwest of Ashton, and 16^- miles upstream from mouth.
Drainage area.--2 ,620 sq mi, approximately, of which about 1,770 sq mi contrib utes directly to surface runoff.
Gage.--Recording October 1955 to October 1957 at site 9 miles downstream atdifferent datum; nonrecording October 1957 to May 1958; recording thereafter. Altitude of gage is 1,265 ft (from topographic map).
Stage-discharge relation.--Defined by current-meter measurements.
Remarks.--Base for partial-duration series, 75 cfs.
Peak stages and discharges
Water year
1956
1957
1958
1959
1960
Date
June 29, 1956
May 27, 1957 June 28, 1957
Mar. 29, 1958
-
Apr. 2, 1960
Qage height (feet)
5.57
6.64 7.12
7.60
-
12.22
Discharge (cfs)
16
77 77
112
0
897
Water year
1960
1961
1962
1963
Date
Apr. 9, 1960
Mar. 21, 1961
Mar. 31, 1962 May 22, 1962 June 20, 1962
Apr. 30, 1963
Qage he ight (feet)
12.87
a7.22
12.87 8.69 10.27
4.93
Discharge (cfs)
1,150
16
891 132 256
3.4
a Backwater from vegetation.
4738. Matter Creek tributary near Orient, S. Dak.
Location.--Lat 44°48'10", long 99°04'05", in SE^NE^ sec.l, T.115 N., R.69 W., at culvert on county highway, 6f miles southeast of Orient.
Drainage area. 5.41 sq mi.
Gage. Crest-stage gage. Altitude of gage is 1,535 ft (from topographic map).
Stage-discharge relation.--Defined by current-meter measurements.
Remarks.--Only annual peaks are shown.
Peak stages and discharges
Water year
1956 1957 1958 1953 1960
Date
June 15, 1956 July 3, 1957 Feb. 27, 1958
Mar. 30, 1960
Qage height (feet)
3.08 4.83 3.60
7.41
Discharge (cfs)
9 53 18 0
325
Water year
1961 1962 1963 1964
Date
Mar. 27, 1962 Apr. 16, 1963 May 3, 1964
Gage height (feet)
a6.34 2.08 2.56
Discharge (cfs)
080
.2 3.0

JAMES RIVER BASIN 439
4738.2. Shaefer Creek near Orient, S. Dak.
Location. Lat 44°46'45", long 99°02'40", in NW^NW^ sec.17, T.115 N., R.68 ¥., on downstream side of bridge on county highway, 8| miles southeast of Orient.
Drainage area.--45.1 sq mi.
Gage.--Crest-stage gage. Altitude of gage is 1,495 ft (from topographic map).
Stage-discharge relation. Defined by current-meter measurements below 600 cfs.
Remarks.--Only annual peaks are shown.
Peak stages and discharges
Water year
1956 1957 1958 1959 1960
Date
July 3, 1957 Feb. 27, 1958
Mar. 30, 1960
Gage height (feet)
(a) 3.24 2.64
5.12
Discharge (cfs)
(b) 250 63 0
870
Water year
1961 1962 1963 1964
Date
May 17, 1961 Mar. 27, 1962 July 26, 1963 May 3, 1964
Gage height (feet)
1.80 c5.47 1.98 2.76
Discharge (cfs)
10 190 18 82
a Peak stage did not reach bottom of gage. b Less than 10 cfs. c Backwater from ice.
4738.5. Shaefer Creek tributary near Orient, S. Dak.
Location.--Lat 44°44', long 98°59', in SE^ sec.34, T.115 N., R.68 W., at cul vert on State Highway 45, 13 miles southeast of Orient.
Drainage area. 6.08 sq mi.
Gage. Crest-stage gage.
Stage-discharge relation.--Defined by current-meter measurements below 150 cfs.
Remarks . Only annual peaks are shown.
Peak stages and discharges
Water year
1956 1957 1958 1959 1960
Date
June 15, 1956 July 3, 1957 Feb. 27, 1958
L Mar. 30 3 1960
Gage height (feet)3.504.47 3.37
6.12
Discharge (cfs)
24 93 15 0
221
Water year
19611962 1963 1964
Date
May 17, 1961 Mar. 27, 1962 July 26, 1963 May 3, 1964
Gage height (feet)
3.01 a5.67 3.62 3.29
Discharge (cfs)
1.0 100 32 9.0
a Backwater from ice
4738.8. Shaefer Creek tributary near Miller, S. Dak.
Location.--Lat 44°42', long 98°59', in NE^ sec.10, T.114 N., R.68 W. , at cul vert on State Highway 45, 15 miles north of Miller.
Drainage area.--5.75 sq mi.
Gage.--Crest-stage gage. Datum of gage is 1,455.74 ft above mean sea level, datum of 1929.
Stage-discharge relation.--Defined by current-meter measurements below 50 cfs.
Remarks. Only annual peaks are shown.
Peak stages and discharges
Water year
1956 1957 1958 1959 1960
Date
June 15, 1956 May 20, 1957
May 195S
Mar. 30, I960
Gage height (feet)
3.49 3.04 3.04
4.61
Discharge (cfs)
45 10 10 0
Water year
1961 1962 1963 1964
Date
May 17, 1961 June 16, 1962 July 26, 1963 May 3, 1964
Gage height (feet)
2.94 3.53 2.82 3.25
Discharge(cm)
6 50 2.0
25

440 JAMES RIVER BASIN
4745. Turtle Creek at Redfield, S. Dak.
Location. Lat 44°53'00", long 98°30'45", in SW^SE^ sec.3, T.116 N., R.64 W., near center of span at downstream side of bridge on U.S. Highway 281, at north edge of Redfield, 6f miles upstream from mouth.
Drainage area. 1,540 sq mi, approximately.
Gage.--Nonrecording October 1945 to May 1951; recording May 1951 to September 1962; nonrecording thereafter. Datum of gage is 1,259.3 ft above mean sea level, datum of 1929.
Stage-discharge relation. Defined by current-meter measurements.
Bankfull stage.--9 ft.
Remarks.--Peaks are probably affected by offstream storage in Twin Lakes and by regulation at Lake Redfield (capacity, 1,570 acre-ft). Base for partial- duration series, 50 cfs.
Peak stages and discharges
Water year
1946
1947
1948
1949
1950
1951
1952
1953
1954
1955
Date
Mar. 2, 1946July 10, 1946
Apr. 11, 1947
Mar. 23, 1948June 27, 1948July 21, 1948
Mar. 5, 1949
Mar. 31, 1950Apr. 11, 1950Apr. 30, 1950May 13, 1950May 22, 1950
Mar. 31, 1951Apr. 22, 1951
Mar. 15, 1952Mar. 25, 1952Apr. 10, 1952June 28, 1952
Feb. 27, 1953Mar. 14, 1953Mar. 18, 1953Mar. 23, 1953Apr. 12, 1953May 7, 1953June 15, 1953June 20, 1953July 28, 1953
June 7, 1954
Mar. 11, 1955
Gage height (feet)
4.454.05
6.52
12.387.006.37
5.58
all. 307.515.787.098.90
7.535.33
5.415.37
15.517.24
5.356.927.417.985.817.165.515.565.51
5.56
5.80
Discharge (cfs)
_24
60
3,160255133
45
2,34039886
2961,020
43351
b58b54
6,420350
b59278393577111335787874
95
108
Water year
1955
1956
1957
1958
1959
1960
1961
1962
1963
Date
Mar. 15, 1955June 9, 1955
June 17, 1956
Apr. 20, 1957Apr. 24, 1957May 21, 1957May 25, 1957May 29, 1957June 11, 1957July 4, 1957July 12, 1957
Mar. 25, 1958Apr. 1, 1958Apr. 11, 1958Apr. 28, 1958
July 17, 1959
Mar. 31, 1960Apr. 9, 1960
May 18, 1961
Apr. 5, 1962Apr. 8, 1962May 22, 1962May 30, 1962June 8, 1962June 24, 1962July 1, 1962July 11, 1962
Oct. 27, 1962Aug. 26, 1963
Gage height (feet)
7.325.45
5.20
6.377.525.205.455.495.105.575.96
5.257.346.125.03
4.73
all. 9510.78
5.29
8.086.546.785.575.727.386.516.87
2.052.24
Discharge (cfs)
36973
51
20745165929755
109154
6840219757
21
2,5802,070
64
556225289103120379222301
3.0-
a Backwater from ice.b Release from Lake Redfield.

JAMES RIVER BASIN 441
4750. James River near Redfield, S. Dak.
Location. Lat 44°55'10", long 98°25'50", in SW^NW£ sec.28, T.117 N., R.63 W., on right bank just downstream from highway bridge, 4^ miles northeast of Redfield, and 5-q; miles downstream from Turtle Creek.
Drainage area.--14,800 sq mi, approximately, of which about 10,200 sq mi con tributes directly to surface runoff.
Gage.--Nonrecording March 1950 to July 1951; recording thereafter. Datum of gage is 1,236.3 ft above mean sea level, datum of 1929.
Stage-discharge relation. Defined by current-meter measurements.
Bankfull stage.--20 ft.
Remarks.--Base for partial-duration series, 800 cfs.
Peak stages and discharges
Water year
1950
1951
1952
1953
1954
1955
1956
Date
May 22, 1950
Apr. 2, 1951May 18, 1951
Apr. 11, 1952Apr. 24, 1952June 28, 1952
Mar. 18, 1953Mar. 24, 1953Aug. 4, 1953
Mar. 27, 1954July 5, 1954
Mar. 16, 1955July 30, 1955
May 27, 1956
Gage height (feet)
20.68
b8.878.32
22.1220.9610.58
bll.1910.4711.01
b7.775.78
b9.67clO.Ol
5.53
Discharge (cfs)
a5,290
-831
6,1005,3001,380
-1,3501,310
-330
525-
293
Water year
1957
1958
1959
1960
1961
1962
1963
Date
Apr. 22, 1957Apr. 24, 1957
Apr. 1, 1958
Mar. 4, 1959
Apr. 4, 1960
May 19, 1961
Mar. 31, 1962Apr. 4, 1962May 22, 1962June 23, 1962Sept. 2, 1962
July 3, 1963
Gage height (feet)
cS.606.715
8.56
3.45
18.47
4.73
b!6.60b!6.5i
9.349.598.81
6.3?
Discharge (cfs)
-477
719
22
2,960
65
-2,000
9551,020826
314
a Annual peak only.b Backwater from ice.c Backwater from temporary dam downstream.
4755. Dry Run near Frankfort, S. Dak.
Location. Lat 44°56'15", long 98°19'45", In NW^NWi sec. 20, T.117 N. , R.62 W. , on left bank 8 ft downstream from highway bridge , 400 ft downstream from small tributary, 4 1/3 miles north of Frankfort, and 7 miles upstream from mouth .
Drainage area. 225 sq mi.
Gage. --Re cord ing. Altitude of gage Is 1,255 ft (from topographic map).
Stage-discharge relation. Defined by current-meter measurements.
Remarks . Base for partial-duration series, 10 cfs.
Peak stages and discharges
Water year
1956
1957
1958
1959
1960
1961
Date
June 22, 1956
Apr. 21, 1957
Mar. 28, 1958
June 17, 1959
Mar. 28, 1960
-
Gage height (feet)
3.71
3.60
3.00
3.77
8.29
-
Discharge (cfs)
6
6
.5
7
405
0
Water year
1962
1963
1964
Date
Mar. 29, 1962May 18, 1962May 24, 1962May 29, 1962June 5, 1962June 10, 1962June 19, 1962
-
-
Gage height (feet)
9.164.955.684.774.724.995.97
-
-
Discharge (cfs)
772244921212956
0
0

442 JAMES RIVER BASIN
4760. James River at Huron, S. Dak.
Location. Lat 44°21'55", long 98°11'45", in SW^SE^NE^ sec.6, T.110 N., R.61 W. on right bank 15 ft upstream from city dam at Huron, 135 ft downstream from Chicago and North Western Railway Co. bridge, and 165 ft upstream from bridge on U.S. Highway 14.
Drainage area. 16,800 sq mi, approximately, of which about 12,010 sq mi con tributes directly to surface runoff.
Gage.--Nonrecording prior to Oct. 18, 1951; recording thereafter. Datum of gage is 1,223.44 ft above mean sea level, datum of 1929.
Stage-discharge relation. Defined by current-meter measurements. Controlled below 1,500 cfs by masonry dam since August 1943.
Bankfull stage.--9 ft.
Historical data. Maximum stage known, that of April 1881, from U.S. Weather Bureau publication.
Remarks. Base for partial-duration series, 1,000 cfs. Only annual peaks are shown prior to August 1943.
Peak stages and discharges
Water year
1881
19291930
1931 1932
1944
1945
1946
1947
1948
1949
1950
1951
Date
April 1881
Mar. 20, 1929May 13, 1930
Apr. 24, 1931 Mar. 4, 1932
Mar. 31, 1944Apr. 8, 1944May 14, 1944
Mar. 21, 1945June 6, 1945
Mar. 21, 1946
Apr. 11, 1947
Mar. 27, 1948May 20, 1948
May 18, 1949
Apr. 7, 1950May 24, 1950
Apr. 5, 1951
Gage height (feet)
19.8
a 12. 005.12
4.10 a9.52
10.489.668.90
9.689.06
9.60
9.00
14.488.84
8.44
a!2.1814.30
8.70
Discharge (cfs)
-
2,650560
345 650
2,4601,9201,270
1,9201,450
1,850
1,360
4,6301,220
672
3,0204,840
900
Water year
1952
1953
1954
1955
1956
1957
1958
1959
1960
1961
1962
1963
Date
Apr. 15, 1952June 30, 1952
Mar. 20, 1953Aug. 6, 1953
July 6, 1954
Mar. 13, 1955Mar. 15, 1955
Aug. 4, 1956
May 26, 1957
Apr. 2, 1958
Apr. 2, 1959
Apr. 6, 1960
May 14, 1961
Apr. 2, 1962May 24, 1962June 11, 1962June 24, 1962
Apr. 29, 1963
Gage height (feet)15.239.12
9.7410.86
8.24
a8.659.60
8.76
8.52
8.63
7.78
15.42
9.26
15.8011.5910.3010.48
9.42
Discharge (cfs)
5,5801,440
1,9502,690
373
835-
984
674
809
51
6,050
318
6,2502,5901,8201,920
708a Backwater from Ice.

JAMES RIVER BASIN 443
4765. Sand Creek near Alpena, S. Dak.
Location.--Lat 44°09'20", long 98°26'10", in NE^NE^ sec.19, T.108 N., R.63 W., on left bank 5 ft downstream from highway bridge, 4 miles southwest of Alpena, 7 miles upstream from Chicago, Milwaukee, St. Paul and Pacific Rail road bridge, and 10j miles upstream from interlink with Cain Creek.
Drainage area. 240 sq mi, approximately.
Gage.--Nonrecording March 1950 to September 1951; recording thereafter. Alti tude of gage is 1,315 ft (by barometer).
Stage-discharge relation. Defined by current-meter measurements.
Bankfull stage.--11 ft.
Remarks. Base for partial-duration series, 50 cfs.
Peak stages and discharges
Water year
1950
1951
1952
1953
1954
1955
1956
1957
Date
Mar. 28, 1950
Mar. 28, 1951May 21, 1951June 5, 1951July 1, 1951
Apr. 3, 1952Apr. 9, 1952
Mar. 17, 1953May 3, 1953June 9, 1953July 12, 1953
June 11, 1954June 17, 1954
Mar. 12, 1955
Aug. 3, 1956
Mar. 24, 1957Apr. 22, 1957May 22, 1957May 25, 1957July 4, 1957
Gage height (feet)
a 14.1
all. 709.528.879.82
a!2.6812.30
alO.229.62
10.6310.82
8.859.43
12.10
9.78
a9.559.588.779.08
10.91
Discharge (cfs)
1,000
750285128363
1,1301,050
190174434504
64136
788
145
701696086
231
Water year
1957
1958
1959
1960
1961
1962
1963
1964
Date
July 7, 1957
War. 26, 1958Apr. 8, 1958
Mar. 2, 1959Apr. 20, 1959
Mar. 28, 1960Apr. 7, 1960Apr. 12, 1960Apr. 14, 1960
June 14, 1961
Mar. 31, 1962May 19, 1962May 23, 1962May 29, 1962June 9, 1962June 17, 1962July 4, 1962July 13, 1962
Mar. 23, 1963
May 5, 1964
Gage height (feet)
9.96
10.899.91
a6.70-
13.3511.438.958.95
10.56
a!2.968.66
11.779.74
11.379.71
10.868.94
7.98
8.39
Discharge (cfs)
69
315181
-.5
2,2406416161
332
1,00051
880218680199 *506106
17
37a Backwater from ice.
4770. James River near Porestburg, S. Dak.
Location.--Lat 43°58'45", long 98°04'05", in SW^SW^NW^ sec.20, T.106 N., R.60 W., on right bank 5 ft downstream from highway bridge, 3f miles southeast of Porestburg, 4^ miles downstream from Chicago, Milwaukee, St. Paul and Pacif ic Railroad bridge, and 6-5- miles downstream from Sand Creek.
Drainage area.--18.600 sq mi, approximately, of which about 13,810 sq mi con tributes directly to surface runoff.
Gage.--Nonrecording March 1950 to September 1951; recording thereafter. Alti tude of gage is 1,205 ft (by barometer).
Stage-discharge relation.--Defined by current-meter measurements.
Bankfull stage. 12 ft.
Historical data.--Floods in March 1920 and March 1922 reached a stage of about 18 ft, from information by local residents.
Remarks.--Base for partial-duration series, 1,000 cfs.

444 JAMES RIVER BASIN
Peak stages and discharges of James River near Forestburg, S. Dak.
Water year
1920
1922
1950
1951
1952
1953
1954
1955
Date
March 1920
March 1922
Apr. 10, 1950 May 27,33, 1950
Mar. 31, 1951 July 1, 1951
Apr. 16, 1952 July 2, 1952
Mar. 19, 1953 Aug. 12, 1953
July 6, 1954
Mar. 19, 1955
Qage height (feet)
a!8
a!8
13.39 15.06
blO.84 8.67
15.46 8.62
11.17 11.10
4.86
b9.69
Discharge (cfs)
3,180 5,180
1,600 1,230
6,290 1,220
2,080 2,060
332
1,210
Water year
1956
1957
1958
1959
1960
1961
1962
1963
Date
Aug. 6, 1956
May 30, 1957
Apr. 6, 1958
June 13, 1959
Apr. 2, 1960
Mar. 6, 1961
Mar. 31, 1962 Apr. 5, 1962 May 26, 1962 June 12, 1962
Oct. 1, 1962
Gage height (feet)
7.19
7.02
7.21
3.35
16.27
b7.24
16.40 15.87 14.97 14.67
6.17
Discharge (cfs)
920
864
924
80
10,900
702
12,000 8,280 5,000 4,390
599
a Annual peak only, about; from Information by local residents, b Backwater from Ice.
4775. Firesteel Creek near Mount Vernon, S. Dak.
Location. Lat 43°46', long 98°15', in SW^SW£ sec.26, T.104 N. , R.62 W., near center of span on downstream side of highway bridge, 4-J miles north of Mount Vernon, 5-^ miles downstream from West Firesteel Creek, and 12 miles north west of Mltchell.
Drainage area. 540 sq mi, approximately.
Gage.--Nonrecording. Altitude of gage is 1,310 ft (from topographic map).
Stage-discharge relation.--Defined by current-meter measurements.
Remarks. Base for partial-duration series, 100 cfs.
Peak stages and discharges
Water year
1956
1957
1958
1959
1960
1961
Date
Aug. 6, 1956
Mar. 26, 1957May 24, 1957May 27, 1957July 8, 1957
Mar. 27, 1958Apr. 8, 1958
Mar. 2, 1959
Mar. 28, 1960
June 16, 1961
Qage height (feet)
4.6
a4.006.146.186.60
5.664.48
a2.90
15.13
4.76
Discharge (cfs)
174
110519523539
416189
1.1
5,780
225
Water year
1962
1963
Date
Mar. 31, 1962May 18, 1962May 23, 1962May 30, 1962June 9, 1962June 17, 1962July 6, 1962July 13, 1962July 17, 1962Aug. 10, 1962
Mar. 27, 1963
Qige height (feet)a!6.8510.709.75
10.5512.6113.255.075.094.766.13
2.94
Discharge (cfs)
3,6001,9001,4401,8203,1703,800
268271216466
29
a Backwater from Ice.
4782.5. North Branch Dry Creek tributary near Parkston, S. Dak.
Location. Lat 43°22', long 97°55', in NE£ sec.27, T.99 N., R.60 W., at culvert on county highway, 3f miles southeast of Parkston.
Drainage area. 3.19 sq mi.
Gage. Crest-stage gage. Altitude of gage is 1,350 ft (from topographic map).
Stage-discharge relation. Defined by current-meter measurements below 120 cfs and extended above by wier formula.
Remarks. Only annual peaks are shown.

JAMES RIVER BASIN 445
Peak stages and discharges of North Branch Dry Creek tributary near Parkston, S. Dak.
Water year
1956 1957 1958 1959 I960
Date
July 1, 1956 June 17, 1957 Mar. 28, 1958
Mar. 27, 1960
Gage height (feet)
4.32 4.15 4.47
6.52
Discharge (cfs)
17 6
27 0
340
Water year
1961 1962 1963 1964
Date
Feb. 22, 1961 July 1962
Mar. 20, 1963 April 1964
Gage height (feet)
4.14 5.66 4.02
Discharge (cfs)
6 183
.5 (a)
a Less than 1 cfs.
4782.6. North Branch Dry Creek near Parkston, S. Dak.
Location.--Lat 43°22', long 97°51', in NE^ sec.29, T.99 N., R.59 W., at bridge on county highway, 1\ miles southeast of Parkston.
Drainage area.--37.0 sq mi.
Gage.--Crest-stage gage. Altitude of gage is 1,275 ft (from topographic map).
Stage-discharge relation. Defined by current-meter measurements belo'f 800 cfs.
Remarks. Only annual peaks are shown.
Peak stages and discharges
Water year
1956 1957 1958 1959 1960
Date
March 1956 June 17, 1957 Mar. 26, 1958 Mar. 3, 1959 Mar. 27, 1960
Qage height (feet)
2.59 3.18 4.50
a2.30 8.55
Discharge (cfs)
26 51
182 3.2
1,470
Water year
1961 1962 1963 1964
Date
Aug. 21, 1961 July 1962
Mar. 19, 1963 Mar. 11, 1964
Gage height (feet)
3.47 8.76
a3.94 1.30
Discharge (cfs)
68 1,540
80 1.0
a Backwater from ice.
4782.8. South Branch Dry Creek near Parkston, S. Dak.
Location.--Lat 43°21' , long 97°50' , in NW£ sec.33, T.99 N., R.59 W., at bridge on county highway, 8-J- miles southeast of Parkston.
Drainage area. 17.1 sq mi.
Gage.--Crest-stage gage. Altitude of gage is 1,270 ft (from topographic map).
Stage-discharge relation.--Defined by current-meter measurements below 400 cfs.
Remarks.--Only annual peaks are shown.
Peak stages and discharges
Water year
1956 1957 1958 1959 1960
Date
March 1956 June 17, 1957 Mar. 26, 1958 May 31, 1959 Mar. 27, 1960
Gage height (feet)
2.67 3.42 4.26 4.36 7.37
Discharge (cfs)
7 27 92
104 920
Water year
1961 1962 1963 1964
Date
Aug. 21, 1961 July 1962
Mar. 19, 1963 Apr. 3, 1964
Gage height (feet)4.69 6.81 4.30 1.24
Discharge (cfs)
160 750 97
.1
4783. Dry Creek near Parkston, S. Dak.
Location. Lat 43°22', long 97°49', in SE^ sec.21, T.99 N., R.59 W., at bridge on county highway, 8^ miles southeast of Parkston.
Drainage area. 76.8 sq mi.
Gage.--Crest-stage gage. Altitude of gage is 1,240 ft (from topograpl ic map).
Stage-discharge relation.--Defined by current-meter measurements belov 2,000 cfs and extended above on basis of slope-area measurement at 4,210 cfs.
Remarks.--Only annual peaks are shown.
219-848 O - 66 - 30

446 JAMES RIVER BASIN
Peak stages and discharges of Dry Creek near- Parkston, S. Dak.
Water year
1956 1957 1958 1959 1960
Date
March 1956 June 17, 1957 Mar. 26, 1958 May 31, 1959 Mar. 27, 1960
Qage height (feet)
3.27 4.30 5.62 5.07
12.70
Discharge (cfs)
24 78
234 144
4,210
Water year
1961 1962 1963 1964
Date
Aug. 21, 1961 July 1962
Apr. 29, 1963 Apr. 27, 1964
Gage height (feet)
5.14 10.70 4.52 3.37
Discharge (cfs)
165 2,740
94 28
4785. James River near Scotland, S. Dak.
Location.--Lat 43°11'00", long 97°37'55", in SW^SW^ sec.30, T.97 N., R.57 W., on left bank 50 ft upstream from highway bridge, 500 ft upstrea-n from Dawson Creek, and 5 miles northeast of Scotland.
Drainage area. 21,550 sq mi, approximately, of which about 16,760 sq mi con tributes directly to surface runoff.
Gage.--Nonrecording September 1928 to November 1934; recording thereafter. Datum of gage is 1,168.51 ft above mean sea level, datum of 192?.
Stage-discharge relation. Defined by current-meter measurements. Large change occurred between 1942 and 1950 floods; stage-discharge relation for inter vening years not defined above 13 ft.
Bankfull stage.--11 ft.
Remarks.--Base for partial-duration series, 1,000 cfs.
Peak stages and discharges
Water year
1929
1930
1931
1932
1933
1934
1935
1936
1937
1938
1939
1940
1941
1942
1943
1944
Date
Mar. 31, 1929Apr. 26, 1929May 30, 1929
May 12, 1930
Apr. 28, 1931
Mar. 2, 1932Mar. 29, 1932
July 23, 1933
Sept. 25, 1934
June 29, 1935
Mar. 10, 1936May 23, 1936
Mar. 20, 1937Apr. 25, 1937June 27, 1937Aug. 2O, 1937
Mar. 3, 1938May 25, 1938
Apr. 1, 1939
June 24, 1940
Mar. 10, 1941
May 15, 1942June 21, 1942July 10, 1942Aug. 5, 1942
Mar. 8, 1943Apr. 14, 1943June 12, 1943June 16, 1943
Mar. 16, 1944Apr. 1, 1944
Gage height (feet)
11.928.288.80
5.63
3.12
11.407.64
4.08
7.22
3.12
a8.3010.29
6.697.068.4210.72
10.527.67
4.82
5.94
4.99
15.508.518.567.62
8.0012.6510.2810.86
all. 3011.19
Discharge (cfs)
2,9701,6701,850
856
289
2,5001,450
441
1,110
296
-2,240
1,0401,1401,4602,180
2,1001,360
622
910
710
10,8001,4901,5201,260
1,3503,1102,0302,250
1 , 1002,370
Water year
1944
1945
1946
1947
1948
1949
1950
1951
1952
Date
May 5, 1944May 25, 1944June 5, 1944June 13, 1944July 15, 1944Aug. 3, 1944Aug. 31, 1944
Mar. 13, 1945Mar. 31, 1945Apr. 18, 1945May 20, 1945June 18, 1945
Mar. 22, 1946
Apr. 16, 1947June 10, 1947June 23, 1947
Mar. 5, 1948Apr. 4, 1948June 28, 1948July 23, 1948Aug. 2, 1948
Mar. 9, 1949Mar. 22, 1949Mar. 30, 1949Apr. 8, 1949
Mar. 7, 1950Apr. 1, 1950June 6, 1950Aug. 4, 1950Sept. 22, 1950
Mar. 29, 1951May 21, 1951June 5, 1951June 19, 1951July 8, 1951
Feb. 17, 1952Apr. 23, 1952July 7, 1952
Gage height (feet)10.999.608.91
14.1411.6910.266.81
alO.468.798.366.7811.49
8.92
11.379.418.57
a7.2915.2611.977.638.63
a!4.567.39
11.6713.18
-15-8914.567.998.10
15.008.5411.009.96
13.10
alO.9416.237.16
Discharge (cfs)
2,2901,7901,5905,2702,5902,0301,100
1,7301,5701,4701,1002,500
1,760
2,4601,7301,520
-5,5103,0401,2801,520
2,6OO1,0102,5903,600
1,5006,2804,7201,5501,580
5,2001,6602,4602,1303,300
1,5006,4801,240
a Backwater from ice.

JAMfiS RIVER BASIN 447
Peak stages and discharges of James River near Scotland, S. Dak.--Continued
Wateryear
1953
1954
1955
1956
1957
1958
Date
Mar. 28, 1953May 8, 1953June 9, 1953July 2, 1953Aug. 18, 1953
June 20, 1954June 20, 1954
Mar. 13, 1955
Aug. 11, 1956
June 1, 1957June 17, 1957
Mar. 29, 1958
Gage height (feet)
8.998.069.357.569.14
b!2.2211.35
10.18
5.96
6.629.48
6.82
Discharge (cfs)
1,8301,5501,9401,4101,880
-2,160
2,220
955
1,0301,960
1,120
Water year
1958
1959
1960
1961
1962
1963
Date
Apr. 8, 1958
May 28, 1959
Apr. 6, 1960
May 15, 1961June 16, 1961
Apr. 3, 1962June 12, 1962July 6, 1962Aug. 11, 1962Sept. 4, 1962
Oct. 1, 1962
Gage height (feet)
7.24
3.62
18.66
b9.638.25
18.7416.9415.3311.567.24
9.57
Plscharge (cfs)
1,240
216
13,900
-1,430
15,2008,9905,6402,4801,140
1,720
b Backwater from Dawson Creek.
VERMILLION RIVER BASIN
4788. Saddlerock Creek near Canton, S. Dak.
Location.--Lat 43°12', long 96°44', in SW^ sec.23, T.97 N., R.50 W., at bridge on county highway, 9$ miles southwest of Canton.
Drainage area.--14.8 sq mi.
Gage. Crest-stage gage. Altitude of gage is 1,405 ft (from topographic map).
Stage-discharge relation.--Defined by current-meter measurements.
Remarks.--Only annual peaks are shown.
Peak stages and discharges
Water year
1956 1957 1958 1959 1960
Date
July 7, 1956 June 17, 1957 Feb. 26, 1958 May 28, 1959 Apr. 1, 1960
Gage height (feet)
3.66 5.38 3.66 5.14 7.83
Discharge (cfs)
42 205 42
175 650
Water year
1961 1962 1963 1964
Date
Mar. 15, 1961 May 18, 1962 Mar. 26, 1963 July 30, 1964
Gage height (feet)
3.67 7.57 3.17 3.89
D' s charge (cfs)
44 610 21 52
4788.2. Saddlerock Creek tributary near Beresford, S. Dak.
Location. Lat 43°13' , long 96°46' , in SW^ sec.16, T.97 N., R.50 W., at culvert on U.S. Highway 77, 9^ miles north of Beresford.
Drainage area. 2.32 sq mi.
Gage.--Crest-stage gage. Altitude of gage is 1,360 ft (from topographic map).
Stage-discharge relation.--Defined by current-meter measurements below 40 cfs.
Remarks.--Only annual peaks are shown.
Peak stages and discharges
Water year
1956 1957 1958 1959 1960
Date
July 7, 1956 June 17, 1957 Feb. 26, 1958 May 30, 1959 Apr. 12, 1960
Gage height (feet)3.25 4.17 4.06 4.06 5.93
Discharge (cfs)
2.7 23 20 20 72
Water year
1961 1962 1963 1964
Date
May 18, 1962 Mar. 19, 1963 Sept. 17, 1964
Gage height (feet)
4.52 6.69
a3.58 3.54
Discharge (cfs)
32 94 4 8.0
a Backwater from ice.

448 VERMILLION RIVER BASIN
4788.4. Saddlerock Creek near Beresford, S. Dak.
Location.--Lat 43°13', long 96°50', in SE£ sec.14, T.97 N., R.51 W., at bridge on county highway, 9f miles northwest of Beresford.
Drainage area.--26.3 sq mi.
Gage. Crest-stage gage. Altitude of gage is 1,300 ft (from topographic map).
Stage-discharge relation.--Defined by current-meter measurements.
Remarks.--Only annual peaks are shown.
Peak stages and discharges
Water year
1956 1957 1958 1959 1960
Date
June 17, 1957 Mar. 26, 1958 May 28, 1959 Apr. 1, I960
Gage height (feet)
(a) 4.91 2.42 3.70
Discharge (cfs)
(b)140 16 57
1,100
Water year
1961 1962 1963 1964
Date
Feb. 14, 1961 June 16, 1962 Mar. 19, 1963 May 12, 1964
Gage height (feet)o2.80 6.32 2.54 2.30
Discharge (cfs)
17 340 19 13
a Peak stage did not reach bottom of gage. b Less than 1O cfs. c Backwater from ice.
4790. Vermillion River near Wakonda, S. Dak.
Location.--Lat 42°59'20", long 96°57'50", in SW^NW^ sec.2, T.94 N., R.52 W., on left bank 40 ft downstream from bridge on State Highway 19, 3=- miles down stream from Prog Creek, 7-5- miles southeast of Wakonda, and 16j miles down stream from Turkey Ridge Creek.
Drainage area. 1,680 sq mi, approximately.
Gage. Honrecordlng October 1945 to September 1954; recording thereafter. Datum of gage is 1,150.9 ft above mean sea level (levels by C?rps of Engineers).
Stage-discharge relation. Defined by current-meter measurements.
Bankfull stage. 14 ft.
Remarks.--Base for partial-duration series, 1,000 cfs.
Peak stages and discharges
Water year
1946
1947
1948
1949
1950
1951
1952
1953
Date
Feb. 24, 1946Mar. 16, 1946
Apr. 15, 1947June 13, 1947
Mar. 3, 194SMar. IS, 1948Aug. 2, 1948
Mar. 5, 1949Mar. 8, 1949Mar. 29, 1949Apr. 8, 1949
Mar. 25, 1950Mar. 27, 195O
Mar. 30, 1951Apr. 5, 1951July 8, 1951Sept. 9, 1951
Feb. 17, 1952Mar. 22, 1952Mar. 31, 1952Apr. 4, 1952
Mar. 14, 1953
Oage height ( feet )alO.8810.67
15.0016.63
a!5.8215.7612.62
bl5.9015.2812.5013. 2O
a!3.9913.84
b!6.2514.8315.6913.06
al3.54alS.10bl6.3715.40
a!3.60
Discharge (cfs)
_730
2,1903,O10
1,1002,4401,060
-2,6501,1201,290
_1,470
-2,6502,53O1,190
1,2001,750
-3,28O
1,100
Water year
1953
1954
1955
1956
.1957
1958
1959
1960
1961
1962
1963
Date
June 11, 1953
June 19, 1954June 21, 1954
Mar. 12, 1955
June S, 1956
June 21, 1957July 6, 1957
Apr. 8, 1958
June 2, 1959
Apr. 1, 1960Apr. 8, 1960
June 14, 1961June 17, 1961
Mar. 28, 1962Mar. 31, 1962June 11, 1962June 18, 1962July 11, 1962
Mar. 27, 1963
Gage height (feet)15.23
bl6.5615.83
12.42
5.86
16.4812.47
6.84
13.95
16.9415.39
12.9614.08
b!6.7516.6711.7812.0611.89
5.97
Discharge (cfs)
1,900
_3,790
1,080
156
2,9901,120
303
1,480
7,3OO6,800
1,2101,500
_8,6601,2001,3901,520
203a Backwater from ice b Peak gage height only; occurred Just before levee break.

BIG SIOUX RIVER BASIN 449
4792. Big Sioux River near Ortley, S. Dak.
Location. Lat 45°13', long 97 010', in NW£ sec.34, T.121 N., R.52 W., at bridge on county highway, 7* miles southeast of Ortley and 9^ miles southeast of Waubay.
Drainage area. 53.8 sq mi.
Gage. Crest-stage gage.
Stage-discharge relation. Defined by current-meter measurements below 640 cfs.
Remarks. Only annual peaks are shown.
Peak stages and discharges
Water year
1956 1957 1958 1959 1960
Date
May 28, 1956 Mar. 21, 1957 Apr. 6, 1958 May 30, 1959 Mar. 29, 1960
Oage height (feet)a4.25 a5.02 a5.25 a3.75 5.39
Discharge (cfs)
56 110 126 30
495
Water year
1961 1962 1963 1964
Date
May 17, 1961 July 1, 1962 July 26, 1963 Apr. 16, 1964
Gage height (feet)a3.97 5.73 4.92 4.21
Discharge (cfs)
41 950 285 66
a Backwater from ice or vegetation.
4792.3. Big Sioux River tributary near Summit, S. Dak.
Location.--Lat 45°14', long 97°06', in NW£ sec.30, T.121 N., R.51 W. , at cul vert on U.S. Highway 81, 5| miles southwest of Summit and ll£ miles south east of Waubay.
Drainage area. 1.27 sq mi.
Gage. Crest-stage gage.
Stage-discharge relation. Defined by current-meter measurements.
Remarks. Only annual peaks are shown.
Peak stages and discharges
Water year
1956 1957 1958 1959 1960
Date
Apr. 2, 1956 Aug. 20, 1957 Apr. 6, 1958 Mar. 6, 1959 Apr. 5, 1960
Oage height (feet)a4.99 2.65 3.10
a3.39 a4.33
Discharge (cfs)
6
4 45
Water year
1961 1962 1963 1964
Date
July 1, 1962 June 9, 1963 Apr. 5, 1964
Gage height (feet)
2.36 2.03 2.67
Discharge (cfs)
(b) 92 45
a Backwater from ice.b Peak stage did not reach bottom of gage; discharge less than 2 cfs.
4792.4. Big Sioux River tributary No. 2 near Summit, S. Dak.
Location.--Lat 45°14', long 97°06', In SW^ sec.30, T.121 N. , R.51 W. , at cul vert on U.S. Highway 81, 5* miles southwest of Summit and 11^ miles south east of Waubay.
Drainage area. 0.26 sq mi.
Gage.--Crest-stage gage.
Stage-discharge relation. Defined by current-meter measurments.
Remarks. Only annual peaks are shown.
Peak stages and discharges
Water year
1956 1957 1958 1959 1960
Date
Apr. 2, 1956 Mar. 20, 1957 Apr. 6, 1958 Mar. 6, 1959 April 1960
Oage height (feet)a2.68 a3.02 2.98
a2.02 3.47
Discharge (cfs)
3 5
18 .5
26
Water year
1961 1962 1963 1964
Date
April 1961 July 1, 1962 June 9, 1963 Apr. 5, 1964
Gage height (feet)1.76 5.16 1.99 2.70
Discharge (cfs)
2.6
4.6 13
a Backwater from ice.

450 BIG SIOUX RIVER BASIN
4792.6. Big Sioux River tributary No. 3 near Summit, S. Dak.
miles southeastLocation. --Lat 45°13', long 97°06', in SE£ sec. 25, T.121 N. , R.52 W. , at cul
vert on county highway, 6^ miles southwest of Summit and 11^ m of Waubay .
Drainage area. --6. 60 sq mi.
Gage. --Crest-stage gage.
Stage-discharge relation. --De fined by current-meter measurements.
Remarks .--Only annual peaks are shown.
Peak stages and discharges
Water year
1956 1957 1958 1959 1360
Date
Apr. 2, 1956 May 21, 1957 Apr. 6, 1958 May 30, 1959 Mar. 30, 1960
Qage height (feet)
a4.96 4.40 4.82 2.71 5.17
Discharge (cfs)
40 88 172 1.4
275
Wateryear
1961 1962 1963 1964
Date
May 17, 1961 July 1, 1962 June 9, 1963 Apr. 5, 1964
Gage height (feet)
3.33 10.68 4.78 4.50
Discharge (cfs)
14
157 100
a Backwater from ice.
4795. Big Sioux River at Watertown, S. Dak.
Location.--Lat 44°56'30", long 97°08'50", in SW^SW^NW^ sec.13, T.117 N., R.53 W., on right bank 20 ft downstream from highway bridge, 1 mile down stream from inlet-outlet to Lake Kampeska, 2\ miles northwest of Watertown, and 1\ miles upstream from Willow Creek.
Drainage area. 1,800 sq mi, approximately, of which about 400 sc mi contrib utes directly to surface runoff.
Gage. Nonrecordlng prior to Oct. 16, 1958; recording thereafter. Altitude of gage Is 1,710 ft (from river-profile map).
Stage-discharge relation. Defined by current-meter measurements.
Bankfull stage.--8 ft.
Remarks. Water Is stored naturally offstream in Lake Kampeska (capacity,35,500 acre-ft) during periods when river is rising and then n°turally re leased, in part, when river is falling. Base for partial-duration series, 400 cfs. Only annual peaks are shown prior to 1948.
Peak stages and discharges
Water year
19461947
1948
1949
1950 /
1951
1952
1953
1954
1955
1956
Date
Mar. 15, 1946Apr. 13, 1947
Mar. 26, 1948
Apr. 2, 1949
Mar. 27, 1950
Mar. 29, 1951Apr. 7, 1951
Apr. 4, 1952Apr. 9, 1952
July 28, 1953
June 7, 1954
Mar. 10, 1955
June 22, 1956
Gage height (feet)
a8.258.93
8.30
6.07
a7.22
a7.806.34
alO.35alO.30
8.92
7.55
a7.58
5.80
Discharge (cfs)
684952
762
229
320
-229
-2,220
876
624
273
194
Water year
1957
1958
1959
1960
1961
1962
1963
Date
Mar. 21, 1957May 26, 1957
Apr. 11, 1958
Mar. 7, 1959May 31, 1959
Mar. 30, 1960
Mar. 14, 1961May 18, 1961
Mar. 28, 1962May 23, 1962June 8 , 1962June 17, 1962July 8, 1962
May 13, 1963June 10, 1963
Gpge height (feet)aS.566.51
5.10
6.064.92
alO.29
a5.94-
9.41?.467.947.877.70
6.14e.77
Discharge (cfs)
-304
140
-4.1
727
-8
6771,380
552549559
162-
a Backwater from ice.

BIG SIOUX RIVER BASIN 451
4797.5. Peg Munky Run near Estelline, S. Dak.
Location.--Lat 44°34', long 96°51', in N| sec.29, T.113 N., R.50 W. , at bridge on State Highway 28, 2-| miles east of Estelline.
Drainage area. 25.4 sq mi.
Gage.--Crest-stage gage.
Stage-discharge relation.--Defined by current-meter measurements belov 100 cfs and extended above on basis of indirect measurement at 1,080 cfs.
Remarks. Only annual peaks are shown.
Peak stages and discharges
Water year
1956 1957 1958 1959 1960
Date
Aug. 2, 1956 Mar. 21, 1957 July 13, 1958 Mar. 1, 1959 Apr. 6, 1960
Gage height (feet)
6.02 a4.67 4.42 5.34 6.68
Discharge (cfs)
667 80
202 390
1,080
Water year
1961 1962 1963 1964
Date
June 1, 1961 Mar. 27, 1962 July 28, 1963 Apr. 1, 1964
Gage height (feet)
5.50 6.58 4.43 3.26
Discharge (cfs)
440 1,010
2O8 73
a Backwater from Ice.
4798. North Deer Creek near Estelline, S. Dak.
Location. Lat 44°28', long 96°47', in SE£ sec.35, T.112 N., R.50 W., at bridge on U.S. Highway 77, 9f miles southeast of Estelline.
Drainage area.--48.3 sq mi.
Gage. Crest-stage gage.
Stage-discharge relation. Defined by current-meter measurements belov 260 cfs.
Remarks. Only annual peaks are shown.
Peak stages and discharges
Water year
1956 1957 1958 1959 1960
Date
July 7, 1956 June 16, 1957 Mar. 25, 1958 Mar. 9, 1959 Apr. 6, 1960
Gage height (feet)
6.30 4.10 3.91
a3.63 7.40
Discharge (cfs)
218 29 22 12
520
Water year
1961 1962 1963 1964
Date
June 7, 1961 July 4, 1962 July 28, 1963 Apr. 27, 1964
Gage height (feet)
6.04 7.61 7.52 4.70
Discharge Ufa)
175 590 560 56
a Backwater from Ice.
4799. Sixmile Creek tributary near Brookings, S. Dak.
Location. Lat 44°23', long 96°41', in NW^ sec.35, T.lll N., R.49 W., at bridge on county highway, 7^- miles northeast of Brookings.
Drainage area. 9.42 sq mi.
Gage.--Crest-stage gage.
Staple-discharge relation. Defined by current-meter measurements belov 110 cfs and extended above on basis of indirect measurement at 595 cfs.
Remarks. Only annual peaks are shown.
Peak stages and discharges
Water year
1356 1957 1958 1959 1960
Date
June 15, 1956 Mar. 21, 1957 Mar. 25, 1958 Mar. 9, 1959 Apr. 6, I960
Gage height (feet)
3.88 a4.83 3.80 3.78 6.16
Discharge (cfs)
12 20 10 11
595
Water year
1961 1962 1963 1964
Date
June 7, 1961 July 4, 1962 July 23, 1963 Apr. 27, 1964
Gage height (feet)
Discharge (cfs)
6.29 655 6.68 820 6.64 805 4.85 160
a Backwater from ice

452 BIG SIOUX RIVER BASIN
4799.5. Deer Creek near Brookings, S. Dak.
Location. Lat 44°23', long 96°37', in SW£ sec.29, T.lll N. , R.48 I/'., at bridge on county highway, 9f miles northeast of Brookings.
Drainage area. 4.21 sq mi.
Gage.--Crest-stage gage.
Stage-discharge relation. Defined by current-meter measurements below 100 cfs.
Remarks. Only annual peaks are shown.
Peak stages and discharges
Water year
1956 1957 1958 1959 1960
Date
June 15, 1956 Mar. 19, 1957 Mar. 25, 1958 Mar. 9, 1959 Apr. 6, 1960
Gage height (feet)2.66
a4.79 2.79
a3.46 5.74
Discharge (cfs)
0.4 30 1.8
10 185
Water year
1961 1962 1963 1964
Date
June 7, 1961 July 4, 1962 July 28, 1963 Apr. 1, 1964
Gag° height (feet)
5.83 5.74 5.76 3.68
Discharge (cfs)
194 185 187 26
a Backwater from ice.
4800. Big Sioux River near Brookings, S. Dak.
Location.--Lat 44°11', long 96°45', in NW^NW£ sec.8, T.108 N., R.49 W., on right bank 3 ft downstream from highway bridge, 1^ miles downstream from Deer Creek, and 9^ miles southeast of Brookings.
Drainage area.--4.420 sq mi, approximately, of which about 2,450 sq mi con- tribures directly to surface runoff.
Gage. Nonrecording August 1953 to May 1959; recording thereafter. Altitude of gage is 1,545 ft (by barometer).
Stage-discharge relation. Defined by current-meter measurements.
Remarks. Base for partial-duration series, 1,000 cfs.
Peak stages and discharges
Water year
1954
1955
1956
1957
1958
1959
Date
Mar. 22, 1954
Mar. 12, 1955
Mar. 24, 1956Aug. 8, 1956
Mar. 24, 1957June 17, 1957
Mar. 27, 1958
Mar. 5, 1959
Gage height (feet)
9.79
a8.62
a4.424.00
8.4011.67
4.58
aS.OO
Discharge (cfs)
1,970
1,180
-287
1,2405,320
382
-
Water year
1959
1960
1961
1962
1963
Date
Mar. 7, 1959
Mar. 30, 1960Apr. 7, 1960
Mar. 2, 1961
Mar. 29, 1962Apr. 7, 1962June 11, 1962July 7, 1962
Aug. 2, 1963
Gage height (feet)
-
12.2811.58
8.50
12.959.488.7711.14
9.72
Discharge (cfs)
b240
9,6204,820
1,340
10,6001,9001,3603,680
1,880a Backwater from ice. b Maximum daily.

BIG SIOUX RIVER BASIN 453
4810. Big Sioux River near Dell Rapids, S. Dak.
Location. Lat 43°47'25", long 96°44'45", in NW^NW£ sec.29, T.104 N., R.49 W., on right bank: at downstream side of highway bridge, a quarter of a mile downstream from confluence of divided channels, if miles upstream from near est tributary, and 3 miles southwest of Dell Rapids.
Drainage area. 5,060 sq mi, approximately, of which about 3,090 sq mi contrib utes directly to surface runoff.
Gage. Nonrecording May 1948 to November 1949; recording thereafter. At datum 0.04 ft lower prior to October 1951. Gage heights given herein are adjusted to present datum. Altitude of gage is 1,455 ft (by barometer).
Stage-discharge relation. Defined by current-meter measurements.
Bankfull stage.--12 ft.
Historical data.--In 1952, a local resident who had been in Dell Rapids for 61 years stated that the flood of April 1952 was the greatest and that of April 1951 was the next greatest within his memory.
Remarks. Base for partial-duration series, 1,000 cfs.
Peak stages and discharges
Water year
1949
1950
1951
1952
1953
1954
Date
Mar. 2S, 1949Apr. 6, 1949
Apr. 1, 1950Apr. 20, 1950May 12, 1950June 12, 1950
Apr. 1, 1951Apr. 4, 1951June 28, 1951July 4, 1951
Apr. 5, 1952June 17, 1952July 6, 1952July 21, 1952
Mar. 15, 1953Mar. 22, 1953May 5, 1953May 15, 1953May 25, 1953June 27, 1953Aug. 6, 1953Aug. 11, 1953
Mar. 19, 1954Mar. 25, 1954
Gage height (feet)
alO.089.46
all. 836.576.046.62
a!2.4741.328.276.75
14.858.887.036.59
a8.347.717.727.098.056.837.076.23
all. 2210.65
Discharge (cfs)
2,0402,700
2,8001,2101,0301,260
3,75012,3001,6901,110
15,4001,9801,2201,050
1,3501,7401,6401,3501,8001,3201,4101,030
2,7402,960
Water year
1955
1956
1957
1958
1959
1960
1961
1962
1963
Date
Mar. 12, 1955Mar. 16, 1955
July 14, 1956
Mar. 24, 1957June 18, 1957June 25, 1957July 3, 1957July 21, 1957
June 4, 1958
Mar. 10, 1959May 28, 1959
Mar. 31, 1960Apr. 1, 1960Apr. 6, 1960
Mar. 3, 1961Mar. 15, 1961
Mar. 30, 1962May 24, 1962June 8, 1962July 11, 1962
Aug. 4, 1963
Gage height (feet)
a7.94a8.72
8.6E
alO.0414.939.569.096.79
4.78
a5.084.56
a!4.8314.4212.86
a9.687.39
15.147.998.5310.43
8.20
Discharge (cfs)
1,1101,380
1,750
2,00015,5002,1901,9801,070
450
_380
-11,9005,550
1,6001,330
18,4001,5901,8103,000
1,740a Backwater from ice.

454 BIG SIOUX RIVER BASIN
4815. Skunk Creek near Sioux Palls, S. Dak.
Location. Lat 43°32'35", long 96°48'30", In NW^NWi sec.23, T.101 W., R.50 W. , on left bank at downstream side of bridge on U.S. Highway 16, 600 ft up stream from nearest tributary, 2-g- miles upstream from mouth, end 4 miles west of Sioux Palls.
Drainage area.--520 sq mi, approximately.
Gage. Nonrecording May 1948 to October 1949; recording thereafter. Datum of gage Is 1,415.29 ft above mean sea level, datum of 1929 (levels by Corps of Engineers).
Stage-discharge relation. Defined by current-meter measurements below 8,100 cfs and extended above on basis of slope-area measurement at 29,400 cfs.
Bankfull stage.--? ft.
Remarks. Base for partial-duration series, 500 cfs.
Peak stages and discharges
Water year
1949
1950
1951
1952
1953
1954
1955
1956
Date
Mar. 5, 1949Mar. 28, 1949Apr. 6, 1949
Mar. 25, 1950May 19, 1950June 12, 1950
Mar. 29, 1951Apr. 4, 1951June 18, 1951June 26, 1951
Feb. 12, 1952Mar. 20, 1952Mar. 29, 1952Apr. 22, 1952
Mar. 11, 1953June 8, 1953June 27, 1953
Mar. 19, 1954
Mar. 9, 1955
June 4, 1956Aug. 12, 1956
aage height (feet)a7.815.375.73
5.665.194.75
a9.257.785.469.48
a5.17a7.1912.165.08
36.646.978.28
7.19
a6.05
5.024.79
Discharge (cfs)
1,940853
1,060
1,030803592
2,1502,150
9283,070
-750
5,770813
7001,8802,770
2,000
797
781680
Water year
1957
1958
1959
1960
1961
1962
1963
Date
Mar. 24, 1957June 17, 1957June 28, 1957July 3, 1957
Apr. 6, 1958
May 28, 1959Aug. 2, 1959
Mar. 30, 1960Apr. 1, 1960Apr. 6, 1960Apr. 13, 1960May 19, 1960
Feb. 23, 1961Mar. 15, 1961
Mar. 23, 1962Apr. 4, 1962May 28, 1962June 17, 1962July 5, 1962July 20, 1962
Mar. 23, 1963Mar. 24, 1963
Gage height (feet)
a7.ll17.784.528.10
4.11
7.964.73
13.6410.2710.795.094.63
a6.544.48
12.436.624.964.684.564.67
a3.833.38
Discharge (cfs)
1,80029,400
5342,640
344
2,580675
8,2004,1204,640
799578
-525
6,4301,760
665538500546
-149
a Backwater from ice.

BIG SIOUX RIVER BASIN 455
4821. Big Sioux River near Brandon, S. Dak. (Published as "at Sioux Falls" prior to 1960)
Location.--Lat 43°36', long 96°38' , In NE^SE^ sec.30, T.102 N. , R.48 V., on left bank 130 ft upstream from Great Northern Railway bridge, 2f miles northwest of Brandon, and 7 miles upstream from Split Rock Creek.
Drainage area. 5,810 sq mi, approximately, of which about 3,840 sq mi contrib utes directly to surface runoff; 5,750 sq mi, approximately, of which about 3,780 sq mi contributes directly to surface runoff at 1943-59 site.
Gage.--Nonrecording August 1943 to September 1954; recording thereafter. At site 14| miles upstream at datum 109.45 ft higher prior to October 1959. Datum of gage is 1,283.38 ft above mean sea level, datum of 1929.
Stage-discharge relation.--Defined by current-meter measurements.
Historical data.--Flood of Apr. 7, 1952, is greatest since at least 1881, ac cording to records of Sioux Falls city engineer.
Remarks.--During periods of high stage, part of flow leaves the main channel upstream from the 1943-59 gage site and is diverted through a bypars canal across the loop of river on which the gage was located. Bypass caral flow (maximum 1951-59, 2,820 cfs June 19, 1957) returns to main channel at a point about 7 miles upstream from 1960-63 gage site; records prior to March 1951 do not include bypass flow. Base for partial-duration series, 2,600 cfs.
Peak stages and discharges
Water year
1944
1945
1946
1947
1948
1949
1950
1951
1952
Date
Feb. 26, 1944May 24, 1944July 11, 1944
Feb. 15, 1945Mar. 12, 1945Mar. 18, 1945June 4, 1945
Mar. 14, 1946Mar. 19, 1946
Apr. 17, 1947June 10, 1947
Feb. 28, 1948Mar. 18, 1948Mar. 26, 1948July 21, 1948July 29, 1948
Mar. 5, 1949Apr. 6, 1949
Mar. 26, 1950Apr. 3, 1950
Mar. 30, 1951Apr. 6, 1951June 26, 1951
Mar. 30, 1952
Gage height (feet)10.247.088.30
a9.4a9.47.197.06
aS.O8.20
8.8610.80
a!3.9a9.759.928.5510.00
a9.678.25
aS.l7.33
all. 1714.308.51
a!2.85
Discharge (cfs)
5,2502,6403,540
-2,6402,7002,710
_3,460
3,3205,000
(b)3,4404,2503,3804,330
_3,140
-2,560
4, 70013, 1003,340
7,900
Water year
1952
1953
1954
1955
1956
1957
1958
1959
1960
1961
1962
1963
Date
Apr. 2, 1952Apr. 7, 1952
Mar. 16, 1953June 27, 1953
Mar. 20, 1954Mar. 26, 1954
Mar. 1O, 1955Mar. 10, 1955
July 15, 1956
Mar. 25, 1957June 17, 1957July 4, 1957
Mar. 2, 1958Apr. 6, 1958
May 28, 1959
Apr. 1, 1960Apr. 6, 1960
Mar. 4, 1961
Mar. 31, 1962July 12, 1962
Aug. 5, 1963
Gage height (feet)
11.6514.50
a7.748.28
a8.797.97
a8.83a8.43
4.03
7.8116.019.48
a4.373.49
7.58
18.6117.51
8.97
19.9310.84
8.68
Discharge (cfs)
7,66013,500
-3,360
3,8703,240
_1,820
895
3,10016,2004,020
-493
2,850
14,40010,700
1,780
17,1002,680
1,640
a Backwater from Ice.b Discharge unknown; greater than 2,600 cfs.

456 BIG SIOUX RIVER BASIN
4828.7. Little Beaver Creek tributary near Canton, S. Dak.
Location. Lat 43°15', long 96°38', in NE£ sec.4, T.97 N. , R.49 V'., at culvert on county highway, 4 miles southwest of Canton.
Drainage area. 0.22 sq mi.
Gage. Crest-stage gage. Altitude of gage is 1,330 ft (from topographic map).
Stage-discharge relation. Defined by current-meter measurements below 16 cfs.
Remarks. Only annual peaks are shown.
Peak stages and discharges
Water year
1956 1957 1958 1959 1960
Date
June 4, 1956 July 27, 1957 Feb. 27, 1958 May 21, 1959 Apr. 1, 1960
Gage height (feet)
2.04 2.60 1.98 3.78 2.49
Discharge (cfs)
11 2310
20
Water year
1961 1962 1963 1964
Date
Mar. 15, 1961 June 16, 1962 Sept. 4, 1963 May 12, 1964
Cage height (feet)
2.03 3.49 2.56 2.78
Discharge (cfs)
11
2227
4834.1. Otter Creek north of Sibley, Iowa
Location.--Lat 43°28', long 95°45', at northeast corner of sec.25, T.100 N., R.41 W., at bridge on county road "H", 4 miles north of Sibley.
Drainage area. 11.9 sq mi.
Gage. Crest-stage gage.
Stage-discharge relation. Defined by current-meter measurements below 340 cfs and by contracted-opening measurement at 952 cfs.
Remarks. Only annual peaks are shown.
Peak stages and discharges
Water year
1952 1953 1954 1955
1956 1957
Date
Mar. 29, 1952 June 7, 1953 June 20, 1954 Apr. 23, 1955
Mar. 28, 1956
Gage height (feet)
6.95 8.06 7.73 4.56
4.12 (a)
Discharge (cfs)
108 982 751 52
45
Water year
1958 1959 1960
1961 1962 1963
Date
May 30, 1959 Apr. 30, 1960
Mar. 27, 1961 Mar. 31, 1962
Gage height (feet)
(a) 7.62 6.60
(a) 8.49 (a)
Discharge (cfs)
674 229
(b) 1,410 (b)
a Below bottom of gage. b Peak discharge less than 68 cfs.
4834.2. Schutte Creek near Sibley, Iowa
Location. Lat 43°29', long 95°46', near northwest corner sec.23, T.100 N., R.42 W., at culvert 6 miles northwest of Sibley.
Drainage area. 143 sq mi.
Gage. Crest-stage gage.
Stage-discharge relation.--Defined by current-meter measurements below 75 cfs and by indirect measurement at 503 cfs.
Remarks. Only annual peaks are shown.
Peak stages and discharges
Water year
1952 1953 1954 1955
1956 1957
Date
Mar. 29, 1952 June 7, 1953 June 19, 1954 Apr. 23, 1955
Aug. 13, 1956 June 18, 1957
Gage height (feet)4.49 5.15 4.04 3.84
3.55 3.81
Discharge (cfs)
175 503 86 62
46 60
Water year
1958 1959 1960
1961 1962 1963
Date
May 30, 1959 Mar. 30, 1960
Mar. 27, 1961 June 17, 1962
Oge height (feet)
(a) 3.84 4.17
3.76 3.77 (a)
Discharge (cfs)
15 62
100
54 55
(b)a Below bottom of gage. b Peak discharge less than 15 cfs.

BIG SIOUX RIVER BASIN 457
4834.3. Otter Creek at Slbley, Iowa
Location. Lat 43°24', long 95°46', near N^ corner sec.14, T.99 N., R.42 W., at bridge on old State Highway 9, 1 mile northeast of Slbley.
Drainage area. 29.9 sq ml.
Gage. Crest-stage gage.
Stage-discharge relation. Defined by current-meter measurements below 1,300 cfs, and by indirect measurement at 5,430 cfs.
Remarks. Only annual peaks are shown.
Peak stages and discharges
Water year
1952 1953 1954 1955
1956 1957
Date
Mar. 29, 1952 June 7, 1953 June 20, 1954 Apr. 23, 1955
Mar. 2S, 1956 Mar. 25, 1957
Qage height (feet)
8.14 9.S2 9.49 5.96
5.24 6.59
Discharge (cfs)
822 5,400 3,860
107
64 175
Water year
1958 1959 1960
1961 1962 1963
Date
June 4, 195S May 30, 1959 Mar. 30, 1960
Mar. 27, 1961 Mar. 31, 1962
Gage height (feet)
6.12 7.98 7.74
7.07
(a)
Discharge (cfs)
120 698 554
281 2,000
a Below bottom of gage.
4834.4. Dawson Creek near Slbley, Iowa
Location.--Lat 43°24', long 95°44', near NW£ sec.20, T.99 N., R.41 W., at cul vert on county road "D", 2 miles southeast of Sibley.
Drainage area. 4.35 sq mi.
Gage. Crest-stage gage.
Stage-discharge relation. Defined by current-meter measurements below 370 cfs, and by indirect measurement at 4,290 cfs.
Remarks. Only annual peaks are shown.
Peak stages and discharges
Water year
1952195319541955
19561957
Date
Mar. 29, 1952June 7, 1953June 20, 1954Apr. 23, 1955
Aug. 13, 1956July 3, 1957
Qage height (feet)
5.316.215.254.71
4.064. SI
Discharge (cfs)
4604,290
400110
52140
Water year
195819591960
196119621963
Date
June 4, 1958May 30, 1959Mar. 30, 1960
Mar. 27, 1961June 5, 1962July 24, 1963
Qage height (feet)
4.815.735.27
4.674.665.16
Discharge (cfs)
1401,290
440
110113328
4834.5. Wagner Creek near Ashton, Iowa
Location. Lat 43°21', long 95°47', on south line of sec.35, T.99 N., R.42 W., at bridge 3 miles northeast of Ashton.
Drainage area. 7.09 sq ml.
Gage. Crest-stage gage.
Stage-discharge relation.--Defined by current-meter measurements below 280 cfs, and by indirect measurements at 1,170 and 2,840 cfs.
Remarks. Only annual peaks are shown.

458 BIG SIOUX RIVER BASIN
Peak stages and discharges of Wagner Creek near Ashton, Icwa
Water year
1952195319541955
19561957
Date
Mar. 29, 1952June 7, 1953June 20, 1954Apr. 23, 1955
Aug. 13, 1956July 3, 1957
(Jage height (feet)
4.315.375.293.60
3.563.96
Discharge (cfs)
3902,8402,600
40
32180
Water year
195819591960
196119621963
Date
Apr. 5, 1958May 30, 1959Mar. 30, 1960
Mar. 27, 1961Mar. 31, 1962
-
Oige height (feet)
3.525.294.33
3.644.58(a)
Discharge (cfs)
242,600
475
52516-
a Below bottom of gage.
4834.6. Otter Creek near Ashton, Iowa
Location.--Lat 43°20', long 95°46', near SE corner sec.2, T.98 N., R.42 W., at bridge on county road, 2 miles northeast of Ashton.
Drainage area. 88.0 sq mi.
Gage.--Crest-stage
Stage-discharge relation.--Defined by current-meter measurements below 5,600 cfs, and by indirect measurements at 7,080 and 17,800 cfs.
Remarks. Only annual peaks are shown.
Peak stages and discharges
Water year
1952195319541955
19561957
Date
Mar. 29, 1952June 7, 1953June 20, 1954Apr. 23, 1955
Aug. 13, 1956July 3, 1957
(Jage height (feet)
9.8812.1611.177.14
7.628.51
Discharge (cfs)
2,10017,4006,320
393
489754
Water year
195819591960
196119621963
Date
Apr. 5, 1958May 30, 1959Mar. 30, 1960
Mar. 27, 1961Mar. 31, 1962June 10, 1963
G.\c;e height (feet)
7.0110.279.37
7.0110.656.61
Discharge (cfs)
3672,8801,300
3673,990
303
4835. Rock River near Rock Valley, Iowa
Location. Lat 43°12<05", long 96°20'15", in NE^NE^- sec.25, T.97 N. , R.47 W. , on downstream side of bridge on U.S. Highway 18, 1.8 miles west of Rock Valley and 16.4 miles upstream from mouth.
Drainage area. 1,600 sq mi.
Gage. Nonrecordlng prior to Aug. 13, 1952, recording thereafter (June 4, 1949, to Aug. 12, 1952, supplementary recording gage above 6.2 ft gage height). Datum of gage is 1,216.00 ft above mean sea level (State Highway Commission bench mark).
Stage-discharge relation. Defined by current-meter measurements below 23,000 cfs.
Bankfull stage.--12 ft.
Remarks. Base for partial-duration series, 3,000 cfs.
Peak stages and discharges
Water year
1897
194S
1949
1950
Date
-
July 23, 1948
Mar. 6, 1949Mar. 29, 1949Apr. 8, 1949
Mar. 5, 1950Mar. 25, 1950
Gage height (feet)
17.0
10.9
12.3011.7512.10
bll.6011.48
Discharge (cfs)
-
a4,090
5,7905,1605,530
-4,560
Water year
1950
1951
1952
1953
Date
Mar. 28, 1950
Mar. 30, 1951Apr. 5, 1951June 30, 1951
Mar. 20, 1952Mar. 31, 1952
Mar. 14, 1953
Gage height (feet)11.33
11.3714.7711.08
12.5515.30
10.83a Maximum for period' June to September. " b Backwater from ice.'
Discharge (cfs)
4,320
5,17014,3004,740
6,10017,300
4,220

BIG SIOUX RIVER BASIN 459
Peak stages and discharges of Rock River near Rock Valley, Iowa Continued
Water year
1953
1954
1955
1956
1957
1958
Date
May 21, 1953June 8, 1953June 29, 1953Aug. 6, 1953
Mar. 20, 1954June 21, 1954
Mar. 12, 1955
July 2, 1956
June 19, 1957July 3, 1957
Apr. 1, 1958
Gage height (feet)
10.2715.999.9510.83
12.1115.86
9.31
7.59
10.559.97
6.18
Discharge (cfs)
3,52018,9003,1504,220
5,30019,200
2,370
1,160
3,7703,050
545
Water year
1959
1960
1961
1962
1963
Date
June 1, 1959
Mar. 31, 1960Apr. 2, 1960
Mar. 2, 1961Mar. 16, 1961
Mar. 30, 1962Apr. 5, 1962May 24, 1962June 18, 1962
June 12, 1963
Gage height (feet)
14.06
15.3814.93
13.0610.29
16.9114.2611.0211.80
7.50
Discharge (ofs)
10,200
16,70014,100
8,5803,410
28,40011,0004,2605,220
1,300
4840. Dry Creek at Hawarden, Iowa
Location. Lat 42°59'45", long 96°28'15", in NE^NE^ sec.2, T.94 N., R.48 W. , on left bank 6 ft downstream from bridge on State Highway 10 at east edge of Hawarden and 1.7 miles upstream from mouth.
Drainage area. 48.4 sq mi.
Gage. Nonrecording prior to Oct. 30, 1949; recording thereafter. Datum of gage is 1,170.42 ft above mean sea level, datum of 1929 (Corps of Engineers bench mark).
Stage-discharge relation. Defined by current-meter measurements below 860 cfs and extended above on basis of contracted-opening measurement at 10,900 cfs.
Bankfull stage.--10 ft.
Remarks. Base for partial-duration series, 300 cfs.
Peak stages and discharges
Water year
1926
1954
1949
1950
1951
1952
1953
1954
Date
Septemberl926
-
Mar. 5, 1949
Mar. 24, 1950
Mar. 27, 1951Mar. 29, 1951Apr. 3, 1951June 25, 1951July 3, 1951
Mar. 18, 1952Mar. 30, 1952July 7, 1952Aug. 28, 1952
June 7, 1953
Mar. 16, 1954June 10, 1954June 19, 1954
Gage height (feet)
18.0
15.8
13.10
a!3.5
13.8313.299.92
11.4113.28
11.014.1412.5911.74
17.57
11.2411.7612.14
Discharge (cfs)
_
-
686
500
950(M319509850
4511,020
714556
10,900
479566630
Water year
1955
1956
1957
1958
1959
1960
1961
1962
1963
Date
Mar. 2, 1955Mar. 9, 1955
July 31, 1956
July 4, 1957
Apr. 6, 1958
May 28, 1959May 31, 1959
Mar. 28, 1960Apr. 2, 1960Apr. 12, 1960
Feb. 23, 1961Mar. 14, 1961
Mar. 28, 1962Aug. 30, 1962
Feb. 7, 16, 1963July 5, 1963
Gage height (feet)
a8.686.96
8.09
12.00
5.92
11.1814.75
15.1015.3610.32
a!3.0410.66
15.889.07
a6.836.77
Discharge (cfs)
_81
152
606
17
3761,000
2,4303,000
388
500425
2,330360
-101
a Backwater from ice.b Not determined; exceeded base discharge.

460 BIG SIOUX RIVER BASIN
4855. Big Sioux River at Akron, Iowa
Location.--Lat 42°49'40", long 96°33'50", in Wf sec.31, T.93 N., F.48 W. , on left bank at west edge of Akron, three-quarters of a mile downstream from State Highway 48 and 2^ miles upstream from Union Creek.
Drainage area.--9,030 sq mi, approximately, of which about 7,060 sq mi contrib utes directly to surface runoff.
_.--Nonrecording October 1928 to December 1934; recording thereafter, of gage is 1,118.90 ft above mean sea level, datum of 1929.
Datum
Stage-discharge relation. Defined by current-meter measurements; subject to extensive changes due to levee breaks in vicinity of the gage.
Bankfull stage.--15 ft.
Remarks. Base for partial-duration series, shown prior to 1935.
3,500 cfs. Only annual peaks are
Peak stages and discharges
Water year
19291930
1931193219331934
1935
1936
1937
1938
1939
1940
1941
1942
1943
1944
Date
Mar. 15, 1929June 6, 1930
Aug. 9, 1931Mar. 1, 1932Sept. 5, 1933June 8, 1934
Mar. 7, 1935Mar. 10, 1935
Mar. 12, 1936May 26, 1936Sept. 16, 1936
Mar. 10, 1937Apr. 14, 1937May 26, 1937
Mar. 5, 1938Mar. 18, 1938May 6, 1938July 4, 1938Sept. 12, 1938Sept. 17, 1938
Mar. 17, 1939Mar. 21, 1939
Mar. 22, 1940Apr. 2, 1940
Mar. 4, 1941Mar. 12, 1941Mar. 25, 1941Apr. 2, 1941
May 16, 1942May 30, 1942June 4, 1942June 29, 1942Aug. 2, 1942Aug. 31, 1942Sept. 5, 1942Sept. 21, 1942
Feb. 24, 1943Mar. 27, 1943June 18, 1943June 27, 1943July 7, 1943Aug. 15, 1943
Feb. 29, 1944May 7, 1944May 15, 1944May 21, 1944June 4, 1944June 12, 1944
Gage height (feet)
18.639.92
5.6018.0417.816.08
a!2.24alO.06
18.6311.7912.92
a!2.9912.2313.14
a!2.9017.2110.5817.5311.0316.58
a!5.4511.59
all. 0617.32
alO.9813.2413.5211.78
12.9815.7419.2313.9618.2815.2316.1811.52
15.1711.8617.3514.6911.6512.03
18.2412.9514.6011.2411.4517.18
Discharge (cfs)
20,8003,740
1,39016,90014,20010, 600
-3,000
18,0005,3006,720
5,3004,8805,760
4,20011,2003,54012,7003,8009,800
6,3004,370
-11,700
-5,5505,8204,350
4,8707,940
21,4005,810
16,6007,2808,6203,680
7,2003,92012,0006,6303,9204,160
15,9004,8206,6003,5103,64011,600
Water year
1944
1945
1946
1947
1948
1949
1950
1951
1952
1953
1954
1955
1956
Date
June 18, 1944July 15, 1944Aug. 7, 1944
Feb. 20, 1945Mar. 14, 1945May 23, 1945May 30, 1945June 17, 1945July 16, 1945
Mar. 5, 1946Mar. 17, 1946Apr. 22, 1946
Apr. 14, 1947May 2, 1947June 15, 1947June 26, 1947July 2, 1947
Mar. 2, 1948Mar. 21, 1948May 12, 1948July 25, 1948Aug. 2, 1948
Mar. 8, 1949Mar. 31, 1949Apr. 9, 1949
Mar. 7, 1950Mar. 28, 1950June 18, 1950
Apr. 6, 1951July 1, 1951July 4, 1951
Feb. 15, 1952Mar. 22, 1952Apr. 1, 1952Apr. 10, 1952June 19, 1952July 7, 1952
Mar. 16, 1953May 28, 1953June 8, 1953June 30, 1953Aug. 7, 1953
Mar. 22, 1954June 22, 1954
Mar. 11, 1955
July 17, 1956
Urge height (feet)
17.0116.5112.89
12.0317.4210.8612.0716.4811.40
15.2815.0511.45
14.4412.9016.8412.8612.43
a!8 . 5016.8711.0814.4911.58
17.0816.2217.11
a!2.5613.3613.40
19.6616.0815.54
all. 8116.1019.7517.7110.9215.36
14.2212.7119.3313.3113.04
18.1119.95
12.25
8.13
Discharge (cfs)
11,1009,8404,770
4,15012,3003,5004,2209,82O3,790
8,9708,4004,040
7,4005,120
10, 5004,6604,290
6,50010,8003,6106,6003,910
11,4009,17011,400
4,0005,2605,450
28,8008,3907,580
4,3009,650
33,00016,5003,8408,180
6,7805,090
21,8005,5605,340
15,60021,700
4,940
1,840
a Backwater from ice!

BIG SIOUX RIVER BASIN 461
Peak stages and discharges of Big Sioux River at Akron, Iowa.--Continued
Water year
1957
1958
1959
1960
1961
Date
Mar. 26, 1957June 21, 1957July 5, 1957
Apr. 8, 1958
June 3, 1959
Apr. 1, 1960Apr. 15, 1960
Mar. 5, 1961
Qage height (feet)
12.1419.5714.40
5.98
16.93
21.5616.18
16.18
Discharge (cfs)
4,58019,4005,980
1,120
8,430
49,5008,930
9,050
Water year
1961
1962
1963
Date
Mar. 17, 1961
Mar. 31, 1962May 26, 1962May 31, 1962June 10, 1962June 19, 1962July 8, 1962
Aug. 7, 1963
Gage height (feet)
14.12
22.0816.1112.9812.3416.7812.34
7.59
Discharge (cfs)
5,840
54,3008,5004,6204,1009,0104,240
1,650
MISSOURI RIVER MAIN STEM
4860. Missouri River at Sioux City, Iowa
Location. Lat 42°29'10", long 96°24'45", in NW^-SE^ sec. 16, T.29 N., R.9 E., sixth principal meridian, on right bank on upstream side of bridge on U.S. Highway 77 at Sioux City, 2.0 miles downstream from Big Sioux River.
Drainage area. 314,600 sq mi, approximately.
Gage. Nonrecording at various sites within 1.7 miles of present site atvarious datums prior to Jan. 1, 1906, and at present site and datum Jan. 1, 1906, to Feb. 14, 1935; recording thereafter. Datum of gage is 1,076.96 ft above mean sea level, datum of 1929. All gage heights adjusted to present datum.
Stage-discharge relation. Defined by current-meter measurements.
Remarks . Annual maximum stages prior to 1929 and 1932-38 from publication of Mississippi River Commission. Peak discharges affected by upstream main- stem reservoirs beginning with construction of Port Peck reservoir in 1937. Only annual peaks are shown.
Peak stages and discharges
Water year
18791880
18811882188318841885
18861887188818891890
1S911892189318941895
18961897189818991900
19011902190319041905
Date
Apr. 7, 1879July 7, 1880
Apr. 23, 1881June 27, 1882July 9, 1883Apr. 4, 1884June 15, 1885
Mar. 20, 1886Mar. 26, 1887Mar. 21, 1888Mar. 29, 1889June 7, 1890
July 5, 1891July 12, 1892Apr. 10, 1893Apr. 12, 1894June 6, 1895
June 14, 1896Apr. 11, 1897June 30, 1898Apr. 22, 1899Apr. 8, 1900
June 21, 1901June 12, 1902July 10, 1903Apr. 12, 1904July 6, 1905
Gage height (feet)
a!5.514.0
a22.513.413.515.915.1
a!4.4a!7.4a!6.4a9.411.7
12.914.6
a!3.6a!4.111.1
12.7a!4.713.0
a!6.0a!2.4
13.512.413.2
a!5.718.0
Discharge (cfs)
--
-----
-----
-----
-----
-----
Water year
19061907190819091910
19111912191319141915
19161917191819191920
19211922192319241925
19261927192819291930
1931
Date
June 16, 1906May 30, 1907June 23, 1908June 15, 1909Mar. 20, 1910
June 30, 1911Apr. 10, 1912Apr. 12, 1913June 13, 1914
-
July 10, 1916Apr. 13, 1917Mar. 29, 1918Apr. 10, 1919May 16, 1920
June 27, 1921June 24, 1922Mar. 23, 1923Apr. 13, 1924June 11, 1925
June 21, 1926May 13, 1927Feb. 5, 1928Apr. 1, 1929Mar. 6, 1930Apr. 10, 1930
June 16, 1931
Gage height (feet)
15.215.215.214.7
a!6.6
12.0a!6.1a!6.413.514.9
14.9a!6.5a!4.7a!3.616.1
14.213.1
a!6.8a!2.613.6
10.216.612.6
a!2.59.4
a9.8
9.79
Discharge (cfs)
_----
-----
-----
---_-
---
190,000108,000
-
54,700a Probably backwater
219-848 O - 66 - 31

462 MISSOURI RIVER MAIN STEM
Peak stages and discharges of Missouri River at Sioux City, Iowa. Continued
Water year
1932193319341935
19361937193819391940
19411942194319441945
19461947
Date
June 16,19, 1932May 28, 1933Mar. 3, 1934July 17, 1935
Mar. 8, 1936June 21, 1937Mar. 24, 1938Apr. 3, 1939June 16, 1940
June 15, 1941June 8, 1942Apr. 10, 1943Apr. 12, 1944Mar. 22, 1945
June 21, 1946Apr. 4, 1947
Gage height ( feet )
11.710.9
a!3.412.9
all.l11.813.214.358.90
13.0013.7718.7215.459.35
8.615.10
Discharge (cfs)
----
---
168,00055,700
121,000127,000212,000180,300116,400
87,900178,000
Water year
194819491950
19511952195319541955
19561957195819591960
196119621963
Date
Mar. 27, 1948Apr. 10, 1949Apr. 25, 1950
Apr. 8, 1951Apr. 14, 1952June 25, 1953June 21, 1954Mar. 12, 1955
Aug. 18, 1956Oct. 3, 1956July 2, 1958May 31, 1959Apr. 3, 1960
Aug. 10, 1961Apr. 2, 1962June 2, 1963
Gage height (feet)
b9.815.7218.44
13.0424.28C9.196.83
d6.19
7.106.437.286.5010.52
5.776.926.00
Discharge (cfs)
115,000178,000252,000
152,000441,000109,00051,30056,200
38,90036,20039,50033, 600101,000
32,70071,60034,400
a Probably backwater from ice. b Occurred June 27, 1948. c Occurred June 19, 1953. d Occurred June 10, 1955.Note. Stages listed prior to 1900 are average of morning and afternoon readings.
Those listed for 1900-28 and 1932-38 are afternoon readings.

SELECTED REFERENCES 463
Beckman, E. W., and Hutchison, N. E., 1962, Floods in Nebraska on small drainage areas, magnitude and frequency: U.S. Geol. Survey Circ. 458, 33 p.
Benson, M. A., 1960, Characteristics of frequency curves based on a theoretical 1,000-year record, in Dalrymple, Tate, 1960, p. 51-74.
____ 1962, Evolution of methods for evaluating the occurrence of floods: U.S. Geol. Survey Water-Supply Paper 1580-A, 30 p.
Berwick, V. K., 1958, Floods in eastern Montana, magnitude and frequency: U.S. Geol. Survey open-file report, 23 p.
Carter, J. R., and Green, A. R., 1963, Floods in Wyoming, magnitude and fre quency: U.S. Geol. Survey Circ. 478, 27 p.
Dalrymple, Tate, 1950, Regional flood frequency: Highway Research Board, Re search Rept. no. 11-B, p. 4-20.
____ 1960, Flood-frequency analyses: U.S. Geol. Survey Water-Supply Paper 1543-A, 80 p.
Fenneman, N. M., 1931, Physiography of western United States: New Yor'-c, McGraw- Hill Book Co., 534 p.
Furness, L. W., 1955, Floods in Nebraska, magnitude and frequency: Nebraska Dept. of Roads and Irrigation, 103 p.
Langbein, W. B., 1949, Annual floods and partial-duration flood series: Am. Geophys. Union Trans., v. 30, p. 879-881.
McCabe, J. A., and Crosby, 0. A., 1959, Floods in North and South Dakota, fre quency and magnitude: U.S. Geol. Survey open-file report, 132 p.
Powell, R. W., 1943, A simple method of estimating flood frequency: C.'.vil Eng., v. 13, no. 2, p. 105-107.
Prior, C. H., and Hess, J. H., 1961, Floods in Minnesota, magnitude ani fre quency: Minnesota Dept. Conserv., Div. of Waters Bull. 12, 141 p.
Schwob, H.H., 1953, Iowa floods, magnitude and frequency: Iowa Highway Cotnm., Highway Research Board Bull. 1, 171 p.

INDEX
Alkali Creek (Milk River basin) nearMalta, Mont..................... 166
Alkali Creek (Musselshell River basin)near Heath, Mont................ 50
American Fork, below Lebo Creek, nearHarlowton, Mont................. 140
near Harlowton, Mont................ 139Antelope Creek (lower tributary to
Heart River), near Carson, N. Dak.......................... 334
tributaries near Elgin, N. Dak...... 55Antelope Creek (upper tributary to
Heart River), near Dickison, N. Dak.......................... 331
tributary near New England, N. Dak.. 331 Antelope Creek (tributary to Mussel-
shell River), at Harlowton, Mont............................ 138
tributary near Harlowton, Mont...... 137tributary near mouth, near Harlowton,
Mont............................ 137tributary No. 2 near Harlowton,
Mont............................ 138Antelope Creek (tributary to Niobrara
River), at Gordon, Nebr......... 414tributary near Gordon, Nebr......... 415
Apple Creek, East Branch, tributarynear McKenz ie, N. Dak........... 55
near Menoken, N. Dak................ 338Apple Creek basin.....................55,338Area, description of.................. 12Armells Creek near Roy, Mont.......... 50Armells Creek basin................... 50
Bad River, near Fort Pierre, S. Dak... 390 near Midland, S. Dak................ 389North Fork, at Philip, S. Dak....... 389
Bad River basin......................389-391Badger Creek, near Browning, Mont..... 115
near Family, Mont................... 116Badwater Creek, at Booneville, Wyo.... 238
at Lybyer Ranch, near Lost Cabin,Wyo............................. 237
Baker Pond tributary No.2 at Bismarck,N. Dak.......................... 55
Baker Pond basin...................... 55Balanger Creek near Palisade,
Saskatchewan.................... 51Basin Creek, near Volborg, Mont....... 282
tributary near Volborg, Mont........ 282Battle Creek (Cheyenne River basin)
at Hermosa, S. Dak.............. 366Battle Creek (Milk River basin), above
Cypress Lake west inflow canal, near West Plains, Saskatchewan.. 162
at international boundary........... 162East Fork, near international
boundary........................ 164near Chinook, Mont.................. 165
Bazile Creek near Niobrara, Nebr...... 424Bear Butte Creek, near Sturgis,
S. Dak..........................57,383tributary near Sturgis, S. Dak...... 57
Bear Canyon Creek near Bozeman, Mont.. 86 Bear Creek near Eli, Nebr............. 415Beaver Creek (tributary to Big Muddy
Creek) near Daleview, Mont...... 52Beaver Creek (tributary to Cherry
Creek) near Faith, S. Dak....... 386Beaver Creek (tributary to Cheyenne
River, lower) near Buffalo Gap, S. Dak..................... 365
Beaver Creek (tributary to Cheyenne River, upper) near Newcastle, Wyo............................. 360
Beaver Creek (tributary to JamesRiver), near Sydney, N. Dak..... 431
tributary near Eldridge, N. Dak..... 430Beaver Creek (tributary to Little
Missouri River) at Wibaux, Mont. 318 Beaver Creek (tributary to Little Wind
River) near Arapahoe, Wyo....... 53
Beaver Creek (tributary to Milk River,lower) near Malta, Mont..........51,173
Beaver Creek (tributary to Milk River,upper) near Havre, Mont.......... 51
Beaver Creek (tributary to MissouriRiver) at Linton, N. Dak......... 345
Beaver Creek basin....................345-346Beaver Creek (tributary to Sun River)
at Gibson Dam, near Augusta, Mont............................. 106
Beaverhead River, at Barratts, Mont.... 62at Blaine, Mont...................... 64tributary No. 2 near Dillon, Mont.... 64
Belle Fourche River, at Hulett, Wyo.... 375at Wyoming-South Dakota State line... 376 below Moorecroft, Wyo................ 374near Belle Fourche, S. Dak........... 380near Elm Springs, S. Dak............. 383near Fruitdale, S. Dak............... 381near Moorecroft, Wyo................. 374near Sturgis, S. Dak................. 381tributary No. 2, near Hulett, Wyo.... 57
Belt Creek, near Belt, Mont............ 49near Monarch, Mont................... 113
Belt Creek basin.......................49,113Berea Creek near Alliance, Nebr.Big Coulee near Lavina, Mont...........Big Hole River, near Jackson, Mont....,
near Melrose, Mont...................Big Hole River basin...................Big Muddy Creek, at Daleview, Mont.....
4131416971
3-72 187
at Plentywood, Mont.................. 188at Reserve, Mont..................... 190near Culbertson, Mont................ 191tributaries near Plentywood, Mont.... 52tributary near Antelope, Mont........ 52
Big Muddy Creek basin..............52,187-191Big Sandy Creek, near Assinniboine,
Mont............................. 158near Box Elder, Mont................. 157
Big Sioux River, at Akron, Iowa........ 460at Watertown, S. Dak................. 450near Brandon, S. Dak................. 455near Brookings, S. Dak............... 452near Dell Rapids, S. Dak............. 453near Ortley, S. Dak.................. 449tributary near Dell Rapids, S. Da.'c... 58 tributary near Summit, S. Dak........ 449tributary No. 2 near Summit, S. Dik.. 449 tributary No. 3 near Summit, S. Dak.. 450 .g Sioux River basin..............58,449-460
Big Spring Creek at Lewiston, Mont..... 50Big Timber Creek, near Big Timber,
Mont............................. 202North Fork, near Big Timber, Mont.... 201South Fork, near Big Timber, Mont.... 202
Bighorn River, at Bighorn, Mont........ 272at Kane, Wyo......................... 258at Manderson, Wyo.................... 247at Thermopolis, Wyo.................. 240near Hardin, Mont.................... 265near Manderson, Wyo.................. 247near St. Xavier, Mont................ 263tributary near Thermopolis, Wyo...... 53
Birch Creek (tributary to Big HoleRiver) near Glen, Mont........... 72
Birch Creek (tributary to Two MedicineRiver), near Dupuyer, Mont....... 116
North Fork, near Dupuyer, Mont....... 49South Fork, near Dupuyer, Mont....... 49
Bitter Creek near Garland, Wyo......... 262Blackbird Creek tributary near O'Neill,
Nebr............................. 424Blacktail Creek (Marias River basin)
near Dupuyer, Mont............... 49Blacktail Creek (tributary to Misso'iri
River) near Dillon, Mont......... 63Blacktail Deer Creek near Mammoth,
Yellowstone National Park........ 195Bone Creek, tributary near Ainswortli,
Nebr............................. 418tributary No. 2 near Ainsworth, Nebr. 419
465

INDEX
Boulder Creek near Deadwood, S. Dak... Boulder River (tributary to Jefferson
River), above Rock Creek, near Basin, Mont.....................
near Boulder, Mont..................Boulder River basin...................Boulder River (tributary to Yellow-
stone River), at Big Timber, Mont............................
near Contact, Mont..................West Fork, at McLeod, Mont..........
near Bruffeys, Mont...............Box Elder Creek (tributary to Big
Muddy River), at damsite, near Plentywood, Mont................
near Plentywood, Mont...............Box Elder Creek (tributary to Mussel-
shell River), near Winnett, Mont............................
tributary near Winnett, Mont........Brackett Creek near Clyde Park, Mont.. Bridger Creek near Bozeman, Mont......Bruce Coulee tributary near Choteau,
Mont............................Buffalo Creek (Grand River basin),
near Scranton, N. Dak...........tributary near Buffalo Springs,
N. Dak..........................Buffalo Creek tributary (James River
basin) near Sydney, N. Dak......Bull Lake Creek, above Bull Lake,
Wyo.............................near Lenore, Wyo....................
Burns Creek near Savage, Mont.........Burnt Creek, tributary near Baldwin,
N. Dak..........................tributary No. 2 near Baldwin,
N. Dak..........................
382
7576
75-76
204203204203
189189
14514520187
50
56
348
431
226226304
326
327
Cain Creek tributary at Imlay, S. Dak. 402 Camel Creek near Ladner, S. Dak....... 56Camp Creek near O'Neill, Nebr......... 423Cannonball River, at Breien, N. Dak... 343
at Regent, N. Dak................... 339below Bentley, N. Dak............... 339near Wade, N. Dak................... 55
Cannonball River basin............55,339-344Canyon Creek near Tensleep, Wyo....... 248Careless Creek at Wallum, Mont........ 141Cartwright Coulee near Valier, Mont... 49 Castle Creek, at Mystic, S. Dak....... 57above Deerfield Reservoir, near
Hill City, S. Dak............... 367near Rochford, S. Dak............... 57North Fork, near Rochford, S. Dak... 57 tributary at sites 1,2, and 3 near
Rochford, S. Dak................ 56tributary No. 2, near Rochford,
S. Dak.......................... 57Cat Creek near Cat Creek, Mont........ 148Cedar Creek, near Haynes, N. Dak...... 340near Pretty Rock, N. Dak............ 341near Swastika, N. Dak............... 55
Chadron Creek, at Chadron State Park,near Chadron, Nebr.............. 400
near Chadron, Nebr.................. 401Charbonneau Creek tributaries near
Cartwright, N. Dak.............. 54Checkerboard Creek, at Delpine, Mont.. 134 near Delpine, Mont.................. 134
Cherry Creek, near Plainview, S. Dak.. 385 tributary No. 3 near Avance,
S. Dak.......................... 386Cheyenne River, at Edgemont, S. Dak... 361 near Eagle Butte, S. Dak............ 387near Hot Springs, S. Dak............ 363near Plainview, S. Dak.............. 385near Spencer, Wyo................... 360near Wasta, S. Dak.................. 372
Cheyenne River basin...........56-57,359-388Claghorn Canyon at Rapid City,
S. Dak.......................... 57Clark Coulee near Antelope,
Mont............................ 52Claymore Creek tributary No. 2 near
Trail City, S. Dak.............. 353Clear Creek, at Buffalo, Wyo.......... 54near Arvada, Wyo.................... 299near Buffalo, Wyo................... 294North Fork, near Buffalo, Wyo....... 293
Page Coal Draw near Midwest, Wyo............ 54Cold Draw tributary near Thermopolis,
Wyo.............................. 53Coon Creek near Emblem, Wyo............ 53Corral Creek tributary near Baker,
Mont............................. 54Cottonwood Creek (Judith River basin)
near Moore, Mont................. 131Cottonwood Creek (Niobrara R:'.ver basin)
near Dunlap, Nebr................ 412Cottonwood Creek (Yellowstone River
basin) at Winchester, Wyo........ 244Cow Sipyon near Miles City, Mont....... 53Crazy Woman Creek, Middle Fork, near
Greub, Wyo....................... 291near Arvada, Wyo..................... 2 92near Buffalo, Wyo.................... 54North Fork, below Spring Draw, near
Buffalo, Wyo..................... 289near Buffalo, Wyo.................. 289near Greub, Wyo.................... 290
Crooked Creek (Grand River basin),Middle Fork near Korinen, N. Dak. 56
near Ludlow, S. Dak.................. 56Crooked Creek (Yellowstone R'ver basin)
near Shepherd, Mont.............. 52Cross Creek near Big Horn, Wyo.........53,278Crow Creek (tributary to Missouri
River) near Radersburg, Mont..... 90Crow Creek (Yellowstone River basin)
near Tipperary, Wyo.............. 52Currant Creek near Roundup, Mont....... 142Cut Bank Creek, at Cut Bank, Mont...... 118near Browning, Mont.................. 118
Daniel Creek near Vol Maire,Saskatchewan..................... 51
Davis Creek near Medora, N. Dak........ 55Dawson Creek near Sibley, Iowa......... 457Dead Horse Creek near Buffalo, Wyo..... 54Deadman Creek (tributary to Missouri
River), tributary near Mobridge,S. Dak........................... 353
Deadman Creek (Yellowstone River basin)near Arvada, Wyo................. 54
Dearborn River, near Augusta, Mont..... 48near demons, Mont................... 99near Craig, Mont..................... 100South Fork, near Craig, Mort......... 49
Dearborn River basin.............48-49,99-100Deep Creek (tributary to Little
Missouri River) near Bowman,N. Dak........................... 314
Deep Creek (tributary to MissouriRiver) below North Fork DeepCreek, near Townsend, I'ont....... 91
Deep Creek (tributary to Teton River)near Choteau, Mont............... 126
Deep Creek (tributary to White River)near Glen, Nebr.................. 397
Deep Creek (tributary to YellowstoneRiver) near Kinsey, Mont......... 54
Deer Creek near Brookings, S. Dak...... 452Dinwoody Creek, above lakes, near
Burris, Wyo...................... 223near Burris, Wyo..................... 223
Disjardin Coulee near Malta, Mont...... 167Dog Creek near Craig, Mont............. 48Douglas Creek, East Branch, tributary
near Garrison, N. Dak............ 320Dry Ash Creek, South Fork, near Circle,
Mont............................. 182Dry Cottonwood Creek near Booneville,
Wyo.............................. 53Dry Creek (tributary to Battle Creek)
at Hermosa, S. Dak............... 56Dry Creek (tributary to Big Sioux
River) at Hawarden, lova......... 459Dry Creek (tributary to Bighorn River)
a t Greybull, Wyo................. 256Dry Creek (tributary-to Jamee River),
near Parkston, S. Dak............ 445North Branch, near Parkstor, S. Dak.. 445
tributary near Parkston, S. Dak.... 444South Branch, near Parkstor, S. Dak.. 445
Dry Creek (tributary to Missouri River)near Van Norman, Mont............ 149
Dry Creek basin....................51,148-149Dry Creek (tributary to Shostone River)
near Cody, Wyo................... 53

INDEX 467
Page Dry Creek (tributary to Wind River)
near Burris, Wyo................ 225Dry Fork Coulee tributary, near Loma,
Mont............................ 122Dry Fork Creek tributary near Glasgow,
Mont............................ 51Dry Run near Frankfort, S. Dak........ 441Dry Wash near Three Forks, Mont....... 48Duck Creek (Little Missouri River
basin) near Wibaux, Mont........ 55Duck Creek (Redwater Creek basin),
East Fork, near Brockway, Mont.. 180 near Brockway, Mont................. 180
Dupuyer Creek near Valier, Mont....... 117
East Gallatin River, at Bozeman,Mont............................ 86
near Bozeman, Mont.................. 85East Goose Creek near Big Horn, Wyo... 277 East Poplar River at international
boundary........................ 184Elk Creek (Cheyenne River basin) near
Elm Springs, S. Dak............. 373Elk Creek (Sun River basin) at
Augusta, Mont................... 109Elm River, at Westport, S. Dak........ 435
tributary near Leola, S. Dak........ 433
Fall River at Hot Springs, S. Dak..... 364Fifteen Mile Creek near Worland,
Wyo.. ........................... 246Firesteel Creek near Mount Vernon,
S. Dak.......................... 444Fish Creek near Silverstar, Mont...... 74Fivemile Creek, above Wyoming Canal,
near Pavillion, Wyo............. 235near Pavillion, Wyo................. 53near Riverton, Wyo.................. 236near Shoshoni, Wyo.................. 237
Flatwillow Creek, near Flatwillow,Mont............................ 143
near Winnett, Mont.................. 144Flood-frequency analysis.............. 13
at a gaging station................. 14Flood-frequency data, application..... 3
regional............................ 4special application for large
streams......................... 7Flood records, at a gaging station..... 18
summary of peaks.................... 20summary of peaks for short-term
stations and miscellaneous peaks 48 Flood series, two types............... 14Ford Creek near Augusta, Mont......... 108Freda Creek, near Moorcroft, Wyo...... 57Frenchman River, above Eastend Reser
voir, Ravenscrag, Saskatchewan.. 169 at 50-Mile, near Bracken,
Saskatchewan.................... 171at international boundary........... 172at Morrisons, near Eastend,
Saskatchewan.................... 170below Eastend Reservoir, near East-
end, Saskatchewan............... 169below Val Marie, Saskatchewan....... 171near Saco, Mont..................... 51
Gaging stations, data................. 59short term.......................... 48
Gallatin River, at Logan, Mont........ 89near Gallatin Gateway, Mont......... 84near Salesville, Mont............... 85
Gallatin River basin.................. 82-89Gardner River, at Mammoth, Yellowstone
National Park................... 195near Mammoth, Yellowstone National
Park............................ 196Goodman Coulee near Eden, Mont........ 104Goose Creek, at Sheridan, Wyo......... 53
below Sheridan, Wyo................. 280near Sheridan, Wyo.................. 279
Gooseberry Creek, at Dickie, Wyo....... 245at Neiber, Wyo...................... 246near Dickie, Wyo.................... 53near Grass Creek, Wyo............... 245
Gorman Coulee, near Cat Creek, Mont... 146 tributary near Cat Creek, Mont...... 147
Government Creek near Richardton,N. Dak.......................... 333
Grace Coolidge Creek tributary nearHermosa, S. Dak................. 56
Grand River, at Shadehill, S. Dak...... 351near Wakpala, N. Dak................. 352North Fork, at Haley, N. Dak......... 347
near Bowman, N. Dak................ 55near North Dakota-South Dakota
State line....................... 56near White Butte, S. Dak........... 349tributary near Bowman, N. Dak...... 55
South Fork, at Buffalo, S. Dak....... 349near Cash, S. Dak.................. 350
Grand River basin...............55-56,346-353Grasshopper Creek near Dillon, Mont.... 61Green River near Gladstone, N. Dak..... 330Greybull River, at Meeteetse, Wyo...... 254near Basin, Wyo...................... 255near Pitchfork, Wyo.................. 252
Griffith Creek near Glendive, Mont..... 304
Hardy Creek near Cascade, Mont......... 49Hardy Creek basin...................... 49Hat Creek near Edgemont, S. Dak........ 362Hay Creek at Belle Fourche, S. Dak..... 379Hay Draw near Midwest, Wyo............. 54Heart River, at Lehigh, N. Dak......... 329
below Heart Butte Dam, near GlenUllin, N. Dak.................... 333
near Lark, N. Dak.................... 336near Mandan, N. Dak.................. 337near Richardton, N. Dak.............. 332near South Heart, N. Dak............. 328tributary near Dickinson, N. Dak..... 329tributary near South Heart, N. Dak... 329
Heart River basin..................1)5,328-337Helnes Coulee tributary near Valier,
Mont............................. 50Highwood Creek near Highwood, Mont..... 49Highwood Creek basin................... 49Honey Creek near O'Neill, Nebr......... 423Horse Creek at international boundary.. 174Horse Prairie Creek near Grant, Mont.., Hound Creek near Eden, Mont.......Hyalite Creek at Hyalite ranger
station, near Bozeman, Mont.
Inyan Kara Creek near Upton, Wyo. Iron Creek near Rochford, S. Dak.
James River, at Ashton, S. Dak. at Columbia, S. Dak..........at Huron, S. Dak.............at Jamestown, N. Dak.........at La Moure, N. Dak..........at New Rockford, N. Dak......near Forestburg, S. Dak......near Manfred, N. Dak. near Pingree, N. Dak. near Redfield, S. near Scotland, S.
Dak. Dak.
near Stratford, S. Dak.
6149
5757
437432442430432427443426428441446436
tributary near Manfred, N. Dak....... 426tributary No. 3 near Manfred, N. Dak.
James River basin......................Jawbone Creek at Harlowton, Mont.......Jefferson River, at Sappington, Mont...near Silverstar, Mont................near Twin Bridges, Mont..............tributary No. 2 near Whitehall, Mont.
Judith River, near Utica, Mont.........South Fork, near Utica, Mont.
427 426 50 77 73 73 75
129 128
Judith River basin.................50,128-132Jules Creek near Medora, N. Dak........ 317
Kanaranzi Creek, North Branch tributary,near Lismore, Minn............... 58
tributary near Adrian, Minn......... 58Keya Paha River, at Wewela, S. Dak..... 421
near Hidden Timber, S. Dak........... 420near Naper, Nebr..................... 421
Kirby Creek near Lucerne, Wyo.......... 244Kirby Draw near Riverton, Wyo.......... 53Knife River, at Hazen, N. Dak.......... 323
near Golden Valley, N. Dak........... 321Knife River basin.....................321-323
Lamar River near Tower Falls ranger station, Yellowstone National Park.............................
Lame Jones Creek tributary at Willard, Mont.............................
Lance Creek at Spencer, Wyo............Laughlin Coulee near Valier, Mont......
194
5435949

468 INDEX
Page Lebo Creek near Harlowton, Mont....... 139Left Rock Creek near Kirby, Mont...... 282Leggerini Creek near Helena, Mont..... 48Lime Creek near Tampico, Mont......... 51Little Beaver Creek (Big Sioux River
basin) tributary near Canton, S. Dak.......................... 456
Little Beaver Creek (Little Missouri River basin) near Marmarth, N. Dak.......................... 313
Little Bighorn River, at State line,near Wyola, Mont................ 266
below Pass Creek, near Wyola, Mont.. 268 near Crow Agency, Mont.............. 271near Hardin, Mont................... 272near Wyola, Mont.................... 267
Little Dry Creek near Van Norman,Mont............................ 148
Little Goose Creek in canyon, nearBig Horn, Wyo................... 279
Little Heart River near St. Anthony,N. Dak.......................... 55
Little Heart River basin.............. 55Little Missouri River, at Marmarth,
N. Dak.......................... 314at Medora, N. Dak................... 315at Camp Crook, S. Dak............... 312near Alzada, Mont................... 310near Watford City, N. Dak........... 319tributary near Marmarth, N. Dak..... 54tributary near Medora, N. Dak....... 317
Little Missouri River basin....54-55,310-319Little Moreau River near Timberlake,
S. Dak.......................... 56Little Muddy Creek, below Cow Creek,
near Williston, N. Dak.......... 308near Williston, N. Dak.............. 309
Little Pipestone Creek near Whitehall,Mont............................ 74
Little Popo Agie River, at Hudson,Wyo............................. 233
near Lander, Wyo.................... 232Little Porcupine Creek (Prickly Pear
Creek basin) tributary near Helena, Mont.................... 95
Little Porcupine Creek (Yellowstone River basin) near Forsyth, Mont............................ 273
Little Powder River near Broadus,Mont............................ 302
Little Prickly Pear Creek, at WolfCreek, Mont..................... 48
near Canyon Creek, Mont............. 98near Marysville, Mont............... 97
Little Prickly Pear Creek basin.....48,97-98Little Tongue River near Dayton, Wyo.. 276 Little Wind River, above Arapahoe,
Wyo. ............................ 230at Fort Washakie, Wyo............... 52below Arapahoe, Wyo................. 234near Arapahoe, Wyo.................. 52near Riverton, Wyo.................. 234North Fork, at Fort Washakie, Wyo... 229South Fork, near Fort Washakie, Wyo. 229
Livermore Creek near Babb, Mont....... 51Lodge Creek, at international boundary 160
below McRae Creek, at inter national boundary............... 161
near Chinook, Mont.................. 51Lodgegrass Creek, above Willow Creek
diversion, near Wyola, Mont..... 269at Lodgegrass, Mont................. 270near Lodgegrass, Mont............... 270
Logger Creek near Gallatin Gateway,Mont............................ 83
Lone Man Coulee near Valier, Mont..... 50Lone Pine Creek near Riverview, Nebr.. 420 Lone Tree Creek near Wibaux, Mont..... 55Long Lake Creek, West Branch, near
Hazelton, N. Dak................ 338Louise Creek, above Flasher, N. Dak... 343
tributary near Brisbane, N. Dak..... 342tributary near Lark, N. Dak......... 342tributary No. 2 near Lark, N. Dak... 342
Lump Gulch Creek at Zastrow's ranch,near Clancy, Mont............... 92
Lyons Creek (Little Prickly Pear Creekbasin) near Wolf Creek, Mont.... 98
Lyons Creek (Milk River basin) atinternational boundary.......... 165
McCune Creek near Circle, Mort......... 182IcDonald Creek at Winnett, Mont........ 146McEachern Creek at internatioral
boundary......................'... 175McRae Creek at international boundary.. 160 tedison River at Hebgen Dam, near
West Yellowstone, Mont........... 48below Cherry Creek, near iNorris,
Mont............................. 81below Hebgen Dam near Grayling, Mont. 48 near Cameron, Mont................... 81near Three Forks, Mont............... 82near West Yellowstone, Mont.......... 80
Madison River basin..................48,80-82Maple River, at Frederick, S. Dak...... 433
at North Dakota-South Dakota Stateline............................. 433
Marias River, Dry Fork, at Fowler,Mont............................. 120
Dry Fork, near Conrad, Mont.......... 50North Fork of, near Dupuyer, Mont.. 50
near Brinkman, Mont.................. 121near Shelby, Mont.................... 119tributary at Loma, Mont.............. 123tributary No. 2 at Loma, Mont........ 123
Marias River basin..............49-50,115-127Marne Creek, at Yankton, S. Dak........ 57
tributary near Yankton, S. Dak....... 58Marne Creek basin...................... 57-58Mason Creek near Mizpah, Mont.......... 54Matter Creek tributary near Orient,
S. Dak........................... 438Maximum known floods ................... 20Meadow Creek near Locate, Mont......... 54Mean annual flood, definition.......... 17Medicine Creek, at Kennebec, S. Dak.... 395
North Fork, near Vivian, S. Dak...... 394tributaries near Reliance, S. Dak.... 57tributary near Vivian, S. Dak........ 394tributary No. 2 near Vivian, S. Dak.. 395
Medicine Creek basin...............57,394-395Medicine Knoll Creek near Blunt,
S. Dak........................... 393Medicine Lodge Creek near Hyattville,
Wyo.............................. 250Meyers Creek near Locate, Mont......... 54Middle Creek near Govenlock,
Saskatchewan..................... 51Middle Popo Agie River near Lander,
Wyo. .............................53,230Milk River, above Havre, Mont.......... 157
at eastern crossing of internationalboundary......................... 155
at Havre, Mont....................... 158at Lohman, Mont...................... 159at Malta, Mont....................... 167at Milk River, Alberta............... 154at Nashua, Mont...................... 178at western crossing of international
boundary......................... 151Dry Fork, near Babb, Mont............ 51Middle Fork near Babb, Mont.......... 51near Del Bonita, Mont................ 150near Vandalia, Mont.................. 176North Fork, above St. Mary Canal,
near Browning, Mont.............. 153South Fork, near Babb, Mont.......... 51
Milk River basin...................51,150-178Mill Creek near Pray, Mont............. 198Miller Creek near Whitewood, S. Dak.... 378Millers Coulee near Valier, Mont....... 50Miner Creek near Jackson, Moit......... 70Minneapolis Flats Creek tributary near
Eldridge, N. Dak................. 429Minnechaduza Creek at Valentine, Nebr.. 417 Miscellaneous sites.................... 48Missouri River, at Bismarck, N. Dak.... 327
at Cascade, Mont..................... 100at Chamberlain, S. Dak............... 396at Fort Benton, Mont................. 114at Pierre, S. Dak.................... 388at powerplant ferry, near Zortman,
Mont............................. 132at Sioux City, Iowa.................. 461at Toston, Mont...................... 90at Virgelle, Mont.................... 128at Yankton, S. Dak................... 425below Fort Peck Dam,
Mont............................. 150below Fort Randall Dam, S. Dak....... 408

INDEX
Page Missouri River, below Hauser Lake
Dam, near Helena, Mont.......... 96below Holter Dam, near Wolf Creek,
Mont............................ 97near Culbertson, Mont............... 191near Elbowoods, N. Dak.............. 320^near Great Falls, Mont.............. 113near Townsend, Mont................. 91near Ulm, Mont...................... 105near Williston, N. Dak.............. 307near.Wolf Point, Mont............... 179tributary near Canning, S. Dak...... 392 tributary-near DeGrey, S. Dak....... 393tributary near Huff, N. Dak......... 55tributary near Pierre, S. Dak....... 392
Mitchell Gulch near East Helena, Mont. 91 Mound Creek, near Luverne, Minn....... 58
tributary, at Hardwick, Minn........ 58Moreau River, atBixby, S. Dak........ 354
at Promise, S. Dak.................. 358near Eagle Butte, S". Dak............ 356near Faith, S. Dak.................. 355near Whitehorse, S. Dak............. 357North Fork, tributary near Redig,
S. Dak.......................... 354Moreau River basin................56,354-359Mud Creek near Stratford, S. Dak...... 436Muddy Creek (Heart River basin) near
Almont, N. Dak.................. 335Muddy Creek (Marias River basin), near
Bynum, Mont..................... 126near Collins, Mont.................. 50North Fork, near Bynum, Mont........ 127
Muddy Creek (Sun River basin) atVaughn, Mont.................... Ill
Muddy Creek (Yellowstone River basin)near Pavillion, Wyo............. 238
near Shoshoni, Wyo.................. 239Mush Creek near Pierre, S. Dak........ 392Muskrat Creek near Shoshoni, Wyo...... 235Musselshell River, at Harlowton, Mont. 136
at Mosby, Mont...................... 147at Musselshell, Mont................ 143near Roundup, Mont.................. 142near Ryega te, Mont................. 140North Fork, at Delpine, Mont........ 133
near Delpine, Mont................ 133near Martindale, Mont............. 135
South Fork, above Martindale, Mont.. 135 near Martlndale, Mont............. 136
tributary near Ryegate, Mont........ 51Musselshell River basin........50-51,133-147
Newland Creek, near damsite, nearWhite Sulphur Springs, Mont..... 102
near White Sulphur Springs, Mont.... 101Niobrara River, above Box Butte
Reservoir, Nebr................. 410at Agate, Nebr...................... 410at Wyoming-Nebraska State line...... 410near Cody, Nebr..................... 415near Dunlap, Nebr................... 411near Gordon, Nebr................... 414near Hay Springs, Nebr.............. 413near Norden, Nebr................... 418near Sparks, Nebr................... 417near Spencer, Nebr.................. 422near Verdel, Nebr................... 424
Niobrara River basin.................410-424North Creek near Alzada, Mont......... 310North Deer Creek near Estelline,
S. Dak.......................... 451North Milk River near international
boundary........................ 153North Piney Creek near Story, Wyo..... 297North Popo Agie River near Lander, Wyo. 231
near Milford, Wyo................... 231Norwegian Creek (Heart River basin)
near Belfield, N. Dak........... 55near Fryburg, N. Dak................ 55
Norwegian Creek (Willow Creek basin)near Harrison, Mont............. 79
Nowood Creek, at Bonanza,Wyo............................. 252
near Tensleep, Wyo.................. 248Nuggett Creek near Neihart, Mont...... 102
Old Woman Creek tributaries near Red- bird , Wyo....................... 56
Otter Creek, at Sibley, Iowa.......... 457near Ashton, Iowa................... 458
Page Otter Creek north of Sibley, Iowa ...... 456Owl Creek (tributary to Big Horn River)
Middle Fork, near Thermopolis, Wyo.............................. 53
near Lucerne, Wyo.................... 243near Thermopolis, Wyo................ 243North Fork, near Anchor, Wyo.........53,242
near Thermopolis, Wyo.............. 53South Fork, above Curtis Ranch, near
Thermopolis, Wyo................. 241at Curtis Ranch, near Thermopolis,
Wyo. ............................. 242near Anchor, Wyo................... 240
Owl Creek (tributary to Little Big HornRiver) near Lodgegrass, Mont..... 269
Painted Woods Creek (lower tributary to Missouri River) near Wilton, N. Dak........................... 324
Painted Woods Creek (upper tributary to Missouri River), tributary near Williston, N. Dak................ 306
tributary No. 2 near Williston,N. Dak........................... 306
Paintrock Creek, below Lake Solitude,Wyo..... ......................... 249
near Bonanza, Wyo.................... 251near Hyattville, Wyo................. 250
Pass Creek near Wyola, Mont............ 267Pebble Creek, near Dunlap, Nebr........ 412near Esther, Nebr.................... 412
Peg Munky Run near Estelline, S. Dak... 451 Peoples Creek near Dodson, Mont........ 166Pine Creek near Ardmore, S. Dak........ 362Piney Creek, at Kearney, Wyo........... 298at Ucross, Wyo....................... 299
Plpestem Creek near Buchanan, N. Dak... 428 Poison Creek at Shoshoni, Wyo.......... 53Ponca Creek, at Anoka, Nebr............ 408
at Verdel, Nebr...................... 409Pondera Coulee near Chester, Mont...... 50Poplar River, at Poplar, Mont.......... 52Middle Fork, at international
boundary......................... 183near Bredette, Mont.................. 186near Poplar, Mont.................... 186West Fork, at international boundary. 185
near Richland, Mont................ 185Poplar River basin.................52,183-187Porcupine Creek at Nashua, Mont........ 178Powder River, at Arvada, Wyo........... 292
at Moorhead, Mont.................... 300at Sussex, Wyo....................... 288Middle Fork, above Kaycee, Wyo....... 284
near Barnum, Wyo................... 54near Arvada, Wyo..................... 54near Kaycee, Wyo..................... 287near Locate, Mont.................... 302North Fork, near Hazleton, Wyo....... 286
near Mayoworth, Wyo................ 286South Fork, near Kaycee, Wyo......... 288
Prickly Pear Creek, at East Helena,Mont............................. 93
near Clancy, Mont.................... 92Prickly Pear Creek basin.............48,92-96Pryor Creek, at Huntley, Mont.......... 221near Billings, Mont.................. 221
Rapid Creek, above Canyon Lake, nearRapid City, S. Dak............... 370
above Pactola Reservoir, at SilverCity, S. Dak..................... 368
at Creston, S. Dak................... 57at Rapid City, S. Dak................ 370below Pactola Dam, S. Dak............ 369near Farmingdale, S. Dak............. 371tributary at Rapid City, S. Dak...... 57tributary near Rapid City, S. Dak.... 57
Red Boy Coulee at Brocton, Mont........ 52Red Fork near Barnum, Wyo.............. 285Red Lodge Creek above Cooney Reservoir,
near Boyd, Mont.................. 215Red Rock Coulee near Lohman, Mont...... 51Red Rock River, at dam on Lower Red
Rock Lake, near Lakeview, Mont... 48 at Kennedy Ranch, near Lakeview,Mont. 59 near Dell, Mont...................... 60
Redwater Creek (tributary to Belle Fourche River), above Belle Fourche, S. Dak.................. 379
at Wyoming-South Dakota State lino... 377

470 INDEX
Redwater Creek (tributary to MissouriRiver), at Broekway, Mont....... 181
at Circle, Mont..................... 182tributary near Brockway, Mont....... 181
Redwater Creek basin.................180-183Rock Creek (tributary to Clarks Pork
Yellowstone River), at Joliet, Mont............................ 218
at Rockvale , Mont................... 218near Red Lodge , Mont................ 213West Fork, below Basin Creek, near
Red Lodge , Mont................. 214near Red Lodge, Mont.............. 215
Rock Creek (tributary to Clear Creek)near Buffalo , Wyo............... 295
Rock Creek (tributary to Milk River),at international boundary....... 173
below Horse Creek, near inter national boundary............... 175
near Hinsdale, Mont................. 176Rock River near Rock Valley, Iowa..... 458Rosebud Creek (tributary to Stillwater
River) near Absarokee, Mont..... 207Rosebud Creek (tributary to Yellow-
stone River) near Forsyth, Mont. 274 near Rosebud, Mont.................. 273
Ross Pork near Hobson, Mont........... 130Ruby River, above reservoir, near
Alder, Mont..................... 66above Warm Springs Creek, near
Alder, Mont..................... 65at damsite, near Alder, Mont........ 67at Laurin, Mont..................... 68below Ramshorn Creek, near Sheridan,
Mont...............near Alder, Mont.......near Twin Bridges, Mont
........ 67
........ 69Ruby River basin...................... 65-69Rush Creek tributaries near Moorcroft,
Wyo............................. 56
Saddleroek Creek, near Beresford,S. Dak. ......................... 448
near Canton, S. Dak................. 447tributary near Beresford, S. Dak.... 447
Sage Creek (tributary to Big SandyCreek), near Kremlin, Mont. ...... 157
tributary at Hingham, Mont.......... 51Sage Creek (tributary to Shoshone
River) near Deaver, Wyo......... 53near Lovell, Wyo.................... 263
Sage Creek (Wild Horse Lake closedbasin) at "Q" Ranch, near Wild- horse , Alberta.................. 156
Salt Creek near Sussex, Wyo........... 54Sand Creek (Cheyenne River basin) near
Glenrock, Wyo................... 56Sand Creek (tributary to Beaver Creek)
near Temvik, N. Dak............. 346Sand Creek (tributary to Dry Creek)
near Jordan, Mont............... 148Sand Creek (tributary to James River)
near Alpena, S. Dak............. 443Sand Creek (tributary to Little
Missouri River) near Amidon,N. Dak.......................... 55
Sand Creek (tributary to MissouriRiver) near Williston, N. Dak... 307
Sand Creek (tributary to Powder River)near Broadus, Mont.............. 301
Sand Creek (tributary to Sheep Creek)at Sappington, Mont............. 48
Sand Creek (tributary to Wind River)near Worland, Wyo............... 53
Sand Draw (Niobrara River basin) trib utary near Ainsworth, Nebr...... 419
Sand Draw (Yellowstone River basin)near Thermopolis, Wyo........... 53 Sq
Sand Gulch near Shoshoni, Wyo......... 236Sandstone Creek near Plevna, Mont..... 54Schutte Creek near Sibley, Iowa....... 456Second Creek tributary near Jordan,
Mont............................ 51Shaefer Creek, near Orient, S. Dak.... 439
tributary near Miller, S. Dak....... 439tributary near Orient, S. Dak....... 439
Sheep Creek (tributary to Little Mis souri River), tributary near Medora, N. Dak.................. 316
tributary No. 2 near Medora, N. Dak. 316
Page Sheep Creek (tributary to Red Rock
River) below Muddy Creek, nearDell, Mont....................... 59
Sheep Creek basin...................... 48,59Sheep Creek (tributary to Smith River)
near White Salphur Springs, Mont. 102 Shell Creek, above Shell Creek Reser
voir, Wyo........................ 256at Shell, Wyo........................ 258near Shell, Wyo...................... 257
Shields River, at Clyde Park, Mont..... 200near Wilsall, Mont................... 199
Shoshone River, at Byron, Wyo.......... 262at Cody, Wyo......................... 261at Corbett Dam, Wyo.................. 261at Kane, Wyo......................... 263at Lovell, Wyo....................... 53near Garland, Wyo.................... 53North Pork, near Wapiti, Wyo......... 259South Pork, above Buffalo Bill Reser
voir, Wyo........................ 260near Ishawooa, Wyo................. 260near Valley, Wyo................... 259
Sixmile Creek tributary near Brookings,S. Dak........................... 451
Skunk Creek, near Sioux Palls, S. Dak.. 454 tributary near Colton, S. Dak........ 58
Smith Creek, below Pord Creek, nearAugusta, Mont.................... 109
near Augusta, Mont................... 108Smith River, at Truly, Mont............ 104near Eden, Mont...................... 103near White Sulphur Springs, Mont.....49,101
Smith River basin..................49,101-104Snake Creek (tributary to Janes River),
near Ashton, S. Dak.............. 438West Branch, near Athol, S. Dak...... 437
Snake Creek (tributary to MissouriRiver), tributary near Garrison,N. Dak........................... 321
Snake River near Surge, Nebr........... 416Soap Creek, near mouth, near St.
Xavier, Mont..................... 265near St. Xavier, Mont................ 264
Soldiers Creek near Crawford, Nebr..... 397South Boulder River near Jefferson
Island, Mont..................... 77South Bridger Creek near Lysite, Wyo... 53 South Canyon, at Rapid City, S. Dak.... 57near Rapid City, S. Dak.............. 57
South Piney Creek, at Willow Park,Wyo.............................. 296
near Story, Wyo...................... 296Spearfish Creek at Spearfish, S. Dak... 377 Spokane Creek basin.................... 91Spring Coulee, near Glasgow, Mont...... 51near Havre, Mont..................... 51
Spring Creek (Beaver Creek basin) nearLinton, N. Dak................... 346
Spring Creek (Big Muddy Cree'c basin), at Highway 16, near Plentywood, Mont............................. 190
near Plentywood, Mont................ 189Spring Creek (Cheyenne River basin)
near Hermosa, S. Dak............. 367Spring Creek (Grand River basin), near
Bowman, N. Dak................... 346tributary near Bowman, N. Dak........ 347
Spring Creek (Knife River basin) at Zap,N. Dak........................... 322
Spring Creek (Little Missouri Riverbasin) near Wibaux, Mont......... 317
Spring Creek (Marias River basin) nearStrabane, Mont................... 124
Spring Creek (Rock Creek basin) trib utary near Wolf Creek, Mont...... 48
Spring Gulch near Birdseye, Mont....... 48uare Butte Creek, at Center,
N. Dak........................... 325tributary near Center, N. Dak........ 325tributary No. 2 near Center, N. Dak.. 325 tributary No. 3 near Center, N. Dak.. 326
Square Butte Creek basin..............325-326Squaw Creek near Gallatin Gateway,
Mont............................. 83Stillwater River, near Absankee, Mont. 208 near Nye, Mont....................... 52
Sully Creek near Medora,N. Dak........................... 55
Sun River at Port Shaw, Mont........... 110

INDEX 471
Page Sun River, at Sun River, Mont......... 110near Augusta, Mont..................49,106near Vaughn, Mont................... IllNorth Fork, near Augusta, Mont...... 105South Fork, near Augusta, Mont...... 49tributary near Great Fall, Mont..... 112
Sun River basin...................49,105-112Sunday Gulch near Hill City, S. Dak... 366 Sunlight Creek near Painter, Wyo...... 210Sweet Grass Creek, above Melville,
Mont............................ 205below Melville, Mont................ 206near Melville, Mont................. 205
Sweetbr-iar Creek near Judson, N. Dak.. 336
Taylor Creek (Gallatin River basin)near Grayling, Mont............. 82
Taylor Creek (Milk River basin), SouthFork, near Malta, Mont.......... 167
Tenmile Creek, near Helena, Mont...... 96near Rimini, Mont................... 94
Tensleep Creek near Tensleep, Wyo..... 249Teton River, at Strabane, Mont........ 124near Carter, Mont................... 50near Choteau, Mont..................50,125near Dutton, Mont................... 127near Farmington, Mont............... 123
Thirty Mile Creek (Cannonball Riverbasin) near Bently, N. Dak...... 55
Thirty Mile Creek (Milk River basin)near Harlem, Mont............... 51
Tiber Reservoir Inflow, Montana....... 50Tongue River, at Carneyville, Wyo..... 53
at Dayton, Wyo...................... 53at Miles City, Mont................. 283near Acme, Wyo...................... 281near Dayton, Wyo.................... 275near Decker, Mont................... 281North Fork, near Dayton, Wyo........ 274South Fork, near Dayton, Wyo........ 275
Tower Creek at Tower Falls, Yellow- stone National Park............. 193
Trail Creek near Wisdom, Mont......... 70Trout Creek near Fort Washakie, Wyo... 52 Turtle Creek (tributary to James
River) at Redfield, S. Dak...... 440Turtle Creek (tributary to Missouri
River) near Turtle Lake, N. Dak. 324 Tusler Creek near Brockway, Mont...... 181Two Medicine Creek, above Trick Falls,
near East Glacier, Mont......... 49Dry Fork, near East Glacier, Mont... 49 near Browning, Mont................. 115near East Glacier, Mont............. 4Snear Ethridge, Mont................. 50South Fork, near East Glacier,
Mont............................ 49
linger Creek near Vandalia, Mont. ...... 177
448Vermillion River, near Wakonda,
S. Dak.........................West Fork, tributaries near Howard,
S. Dak.......................... 58Vermillion River basin............58,447-448
Wagner Creek near Ashton, Iowa........ 457Wegner Creek at Craig, Mont........... 48West Buckeye Creek near Billings,
Mont............................ 220West Goose Creek near Big Horn,
Wyo............................. 278Wets Creek near Billings, Mont........ 22CWhistle Creek near Emblem, Wyo........ 53White Clay Creek, at Pine Ridge,
S. Dak.......................... 57White Earth River- at White Earth,
N. Dak.......................... 309White River, at Crawford,
Nebr............................ 398at Westover, S. Dak................. 406below Cottonwood Creek, near
Whitney, Nebr................... 399near Chadron, Nebr.................. 40Cnear Interior, S. Dak............... 402
White River, near Kadoka, S. Dak....... 403near Oacotna, S. Dak.................. 406near Oglala, S. Dak.................. 401South Fork, below White River, S.Dak. 405 near Rosebud, S. Dak............... 404tributary near Mission, S. Dak..... 405
tributary near Conata, S. Dak........ 57tributary near Glen, Nebr............ 396tributary near Interior, S. Dak...... 403tributary No. 2 near Crawford, Nebr. . 397
White River basin..................57,396-407Whitewater Creek near international
boundary......................... 168Whitewood Creek at Whitewood, S. Dak... 57 Wide Sandy Creek near Buffalo, S. Di^.. 350 Willow Creek (tributary to Deep Creek)
near Choteau, Mont............... 125Willow Creek (tributary to Elm River),
tributary near Barnard, S. Dak... 434 tributary near Leola, S. Dak......... 434
Willow Creek (tributary to JeffersonRiver) near Harrison, Mont....... 78
Willow Creek (tributary to Little Missouri River) near Alzada, Mont............................. 312
Willow Creek (tributary to MariasRiver) at Browning, Mont......... 50
near Devon, Mont..................... 121Willow Creek (tributary to Milk River)
near Glasgow, Mont...............51,177Willow Creek (tributary to Missouri
River) near Willow Creek, Mont... 79 Willow Creek basin..................... 78-79Willow Creek (tributary to Red Lodge
Creek) near Boyd, Mont........... 217Willow Creek (tributary to Sun River)
near Augusta, Mont............... 107South Fork, near Augusta, Mont....... 49
Willow Creek (tributary to Wind River)near Crowheart, Wyo.............. 225
Wind River, at Riverton, Wyo........... 228East Fork, near Dubois, Wyo.......... 223near Burris, Wyo..................... 224near Crowheart, Wyo.................. 227near Dubois, Wyo..................... 222
Wolf Creek (tributary to Judith River), at Neubert Ranch, near Stanford, Mont............................. 131
near Stanford, Mont.................. 131Wolf Creek (tributary to Missouri
River) near Wolf Point, Mont..... 179tributary No. 2 near Wolf Point,
Mont............................. 52Wolf Creek basin.......................52,179Wolf Creek (tributary North Fork
Willow Creek) near Hammond, Mont. 311 Wolf Creek (tributary to Tongue River)
at Wolf, Wyo..................... 277Wood River, at Sunshine, Wyo........... 253
near Meeteetse, Wyo.................. 253Woodpile Coulee near international
boundary......................... 163Woods Coulee near Dupuyer, Mont........ 50Wyatt Creek tributary near Manville, Wyo. 56
Yellowstone River, at Billings, Mont... 219 at Corwin Springs, Mont.............. 197at Glendive, Mont.................... 303at Huntley, Mont..................... 222at Miles City, Mont.................. 283at Yellowstone Lake Outlet, Yellov-
stone National Park.............. 192darks Fork, above Squaw Creek, near
Painter, Wyo..................... 209at Chance, Mont.................... 211at Edgar, Mont..................... 212at Fromberg, Mont.................. 212below Crandall Creek, near Painter,
Wyo.............................. 209near Clark, Wyo.................... 210
near Canyon Hotel, YellowstoneNational Park.................... 192
near Livingston, Mont................ 198near Sidney, Mont.................... 305
Yellowstone River basin.........52-54,192-305
U. S. GOVERNMENT PRINTING OFFICE : 1966 O - 2 - 9-848
Top Related