


Languages
Pages
Legal


LOTTERY CORPORATIONMARKETING EFFECTIVENESS MODEL
2
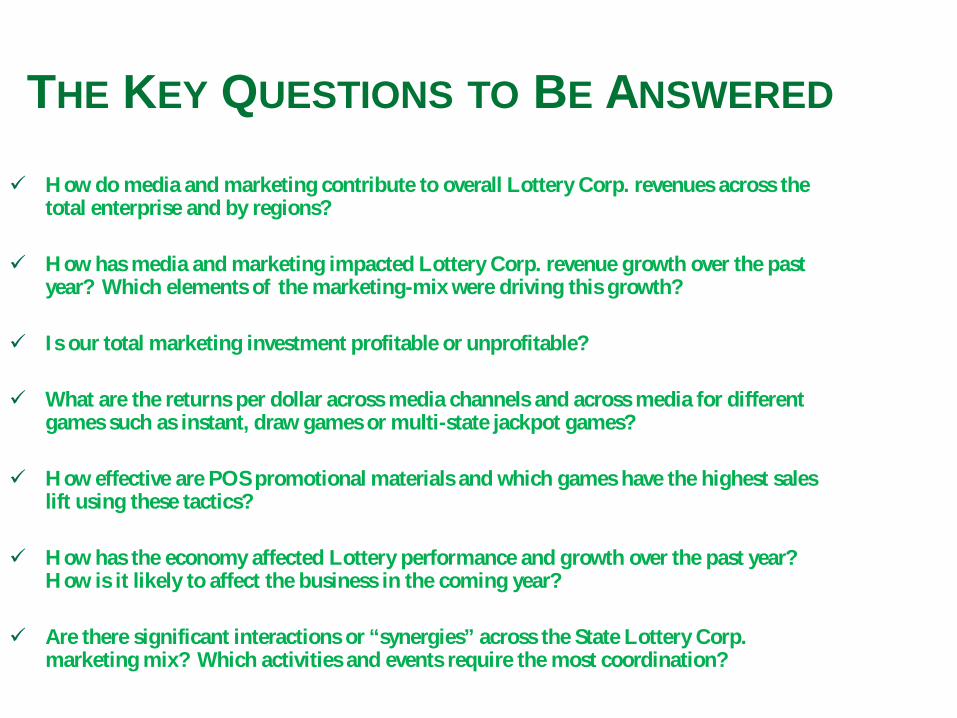
THE KEY QUESTIONS TO BE ANSWERED
How do media and marketing contribute to overall Lottery Corp. revenues across the total enterprise and by regions?
How has media and marketing impacted Lottery Corp. revenue growth over the past year? Which elements of the marketing-mix were driving this growth?
Is our total marketing investment profitable or unprofitable?
What are the returns per dollar across media channels and across media for different games such as instant, draw games or multi-state jackpot games?
How effective are POS promotional materials and which games have the highest sales lift using these tactics?
How has the economy affected Lottery performance and growth over the past year? How is it likely to affect the business in the coming year?
Are there significant interactions or “synergies” across the State Lottery Corp. marketing mix? Which activities and events require the most coordination?

3
THE KEY QUESTIONS TO BE ANSWERED-CTD.
What are the threshold levels of jackpot payout needed to drive growth for Mega-Millions and Power Ball?
What are the returns to highly-discounted “draw-station” media time-slots?
What would be the impact on sales if we increased the number of lottery-selling outlets by +2 percent next year?
What are the returns to various digital media channels such as banner ads, paid search, etc.? Should we invest more in these channels?
How does the Lottery’s public reputation as expressed through social media, affect business performance, if any?
What would be the returns and growth impact if we increased overall media spend by $3 million next year?
If we optimized our marketing spend next year according to the measured productivity from this model, how much additional sales could we expect if we held our overall marketing budget constant? Which media channels and games should we invest more and less?
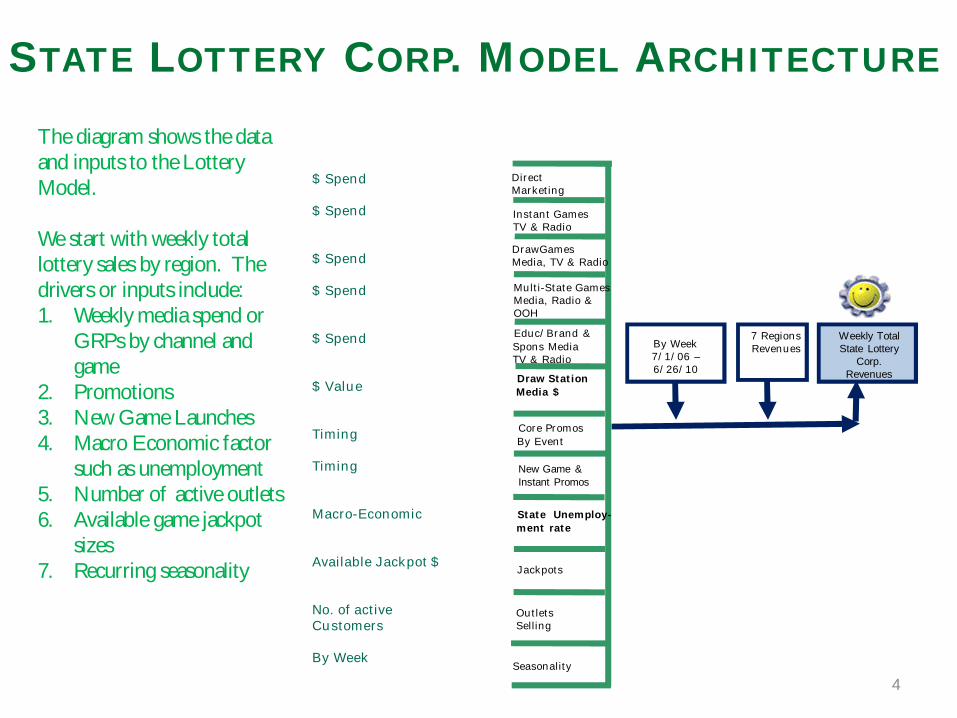
STATE LOTTERY CORP. MODEL ARCHITECTURE
Weekly TotalState Lottery
Corp.Revenues
New Game & Instant Promos
Direct Marketing
State Unemploy-ment rate
Educ/Brand & Spons MediaTV & Radio
Core PromosBy Event
DrawGamesMedia, TV & Radio
Instant GamesTV & Radio
By Week7/1/06 –6/26/10
$ Spend
$ Spend
$ Spend
$ Spend
$ Spend
$ Value
Timing
Timing
Macro-Economic
Available Jackpot $
No. of active Customers
By Week
7 RegionsRevenues
Seasonality
Jackpots
The diagram shows the data and inputs to the Lottery Model.
We start with weekly total lottery sales by region. The drivers or inputs include:1. Weekly media spend or
GRPs by channel and game
2. Promotions3. New Game Launches4. Macro Economic factor
such as unemployment5. Number of active outlets6. Available game jackpot
sizes7. Recurring seasonality
Multi-State Games Media, Radio &OOH
Draw StationMedia $
OutletsSelling
4

$0
$10,000,000
$20,000,000
$30,000,000
$40,000,000
$50,000,000
$60,000,000
$70,000,000
$80,000,000
$90,000,000
ModelActual
ACTUAL AND MODELED STATE LOTTERYCORP. REVENUES
5
R2=99.1%, Holdout R2=99.5%, MAPE = +/- 0.8%
Once the predictive model is completed, we validate by showing how well it fits versus actual sales. We also withhold at least10% of the data from model calibration to determine how well the model predicts.
HoldoutPeriod
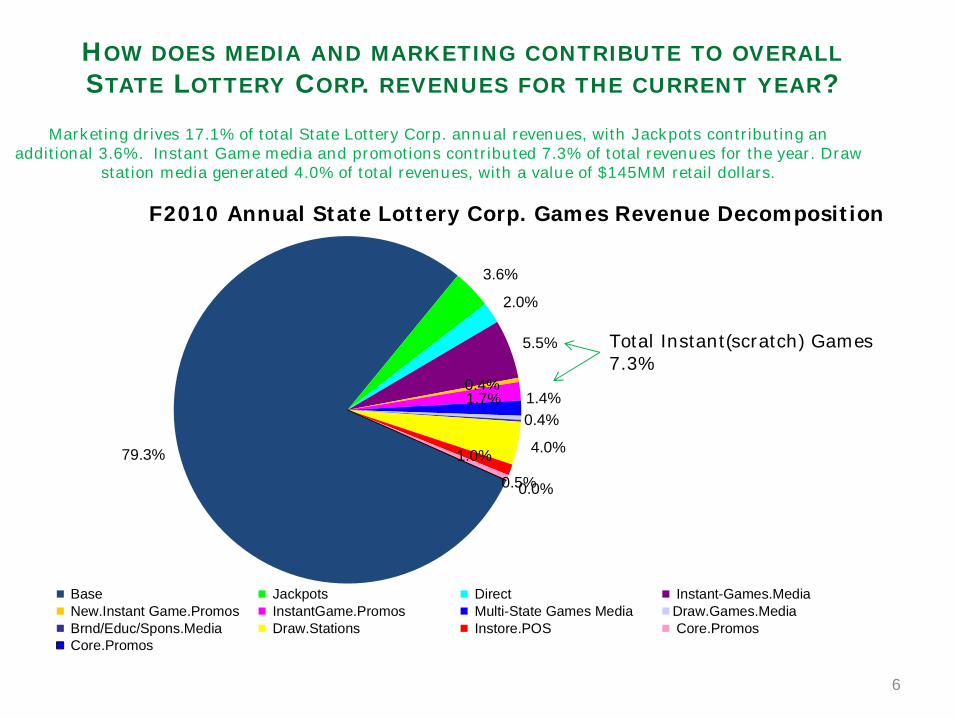
HOW DOES MEDIA AND MARKETING CONTRIBUTE TO OVERALLSTATE LOTTERY CORP. REVENUES FOR THE CURRENT YEAR?
79.3%
3.6%
2.0%
5.5%
0.4%1.7% 1.4%
0.4%
4.0%1.0%
0.5%0.0%
Base Jackpots Direct Instant-Games.Media New.Instant Game.Promos InstantGame.Promos Multi-State Games Media Draw.Games.Media Brnd/Educ/Spons.Media Draw.Stations Instore.POS Core.Promos Core.Promos
Total Instant(scratch) Games 7.3%
Marketing drives 17.1% of total State Lottery Corp. annual revenues, with Jackpots contributing an additional 3.6%. Instant Game media and promotions contributed 7.3% of total revenues for the year. Draw
station media generated 4.0% of total revenues, with a value of $145MM retail dollars.
F2010 Annual State Lottery Corp. Games Revenue Decomposition
6

HOW HAS MEDIA AND MARKETING IMPACTED STATELOTTERY CORP. REVENUE GROWTH?
-2.8%-2.7%
-1.2%-0.4%-0.2%
-0.2%-0.1%
+0.1%+0.2%
+0.5%+0.5%+0.6%
+1.5%+3.5%
-$150,000 -$100,000 -$50,000 $0 $50,000 $100,000 $150,000
FY20
10 V
aria
nce.
Impa
ct $
000
Marketing Variance Impact. F2010 v. Year-Ago
Base Monmentum
Multi-State Games Media
Jackpots
Draw Stations
No.Stores Selling
Draw Games Media
Direct
Brand/Educ/Spons. Media
Core Promos
New-Games Promos
Instore POS
Instant Games Promos
Economy (Unemployment)
Instant Games Media
We quantify and determine the contribution and impact of each media and marketing driver on yea-over-year growth. We will also be able to identify those factors that are impediments to growth.
7

WHICH MEDIA CHANNELS & GAMES DRIVE THE MOST REVENUE& RETURNS?
$0.0
2
$0.0
7
$0.1
7
$0.1
7
$0.1
9
$0.2
4
$0.3
4
$0.3
7
$0.6
0
$0.9
0
$1.1
4
$1.1
8
$1.4
3
$1.8
9
$2.0
7
$2.6
1
$4.0
4
$4.6
2
$5.5
8 $8.1
0
$8.2
8 $11.
03
$24.
54 $2
8.03
$0
$5
$10
$15
$20
$25
$30
Incremental Revenue per Dollar Spend
We are able to quantify and identify the specific incremental revenue and returns of each media channel and game. Overall, we see the high value of marketing for the Stare Lottery Corp. One dollar of spend generated $4.62 of revenue and $1.91 of net profit. Marketing is highly profitable here!
8
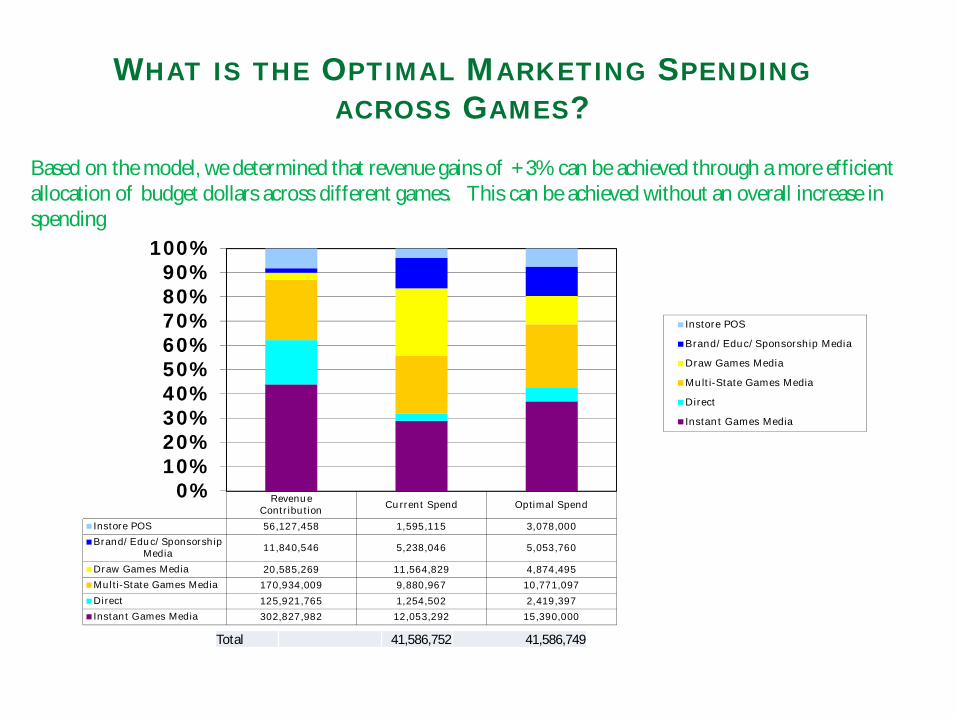
WHAT IS THE OPTIMAL MARKETING SPENDINGACROSS GAMES?
RevenueContribution Current Spend Optimal Spend
Instore POS 56,127,458 1,595,115 3,078,000Brand/Educ/Sponsorship
Media 11,840,546 5,238,046 5,053,760
Draw Games Media 20,585,269 11,564,829 4,874,495Multi-State Games Media 170,934,009 9,880,967 10,771,097Direct 125,921,765 1,254,502 2,419,397Instant Games Media 302,827,982 12,053,292 15,390,000
0%10%20%30%40%50%60%70%80%90%
100%
Instore POS
Brand/Educ/Sponsorship Media
Draw Games Media
Multi-State Games Media
Direct
Instant Games Media
9
Based on the model, we determined that revenue gains of +3% can be achieved through a more efficient allocation of budget dollars across different games. This can be achieved without an overall increase in spending
Total 41,586,752 41,586,749
Top Related