


Languages
Pages
Legal


Los Angeles County Storm Water Modeling –Bringing Data TogetherTJ MoonCivil EngineerCounty of Los Angeles Department of Public Works

The Los Angeles County Flood Control District
LACFCD owns and operates a vast flood control and water conservation system:
• 14 major dams
• 27 spreading grounds
• 500 miles of open channels
• 3,000 miles of storm drain
• Over 150 debris basins
Serves 10 million residents over 2,700 square miles!

Water Resources & Quality Issues
Los Angeles River - 1949 Los Angeles River – Current Day

The Data Silo Problem
Rainfall WaterQuality
LandUse
Dams

The “Model” Solution
GIS BasedWatershed
Model
Rainfall
Streams
WaterQuality
LandUse
Elevation
Dams
POTWs
SpreadingGrounds
Soils
SlopesSub-
BasinsGIS
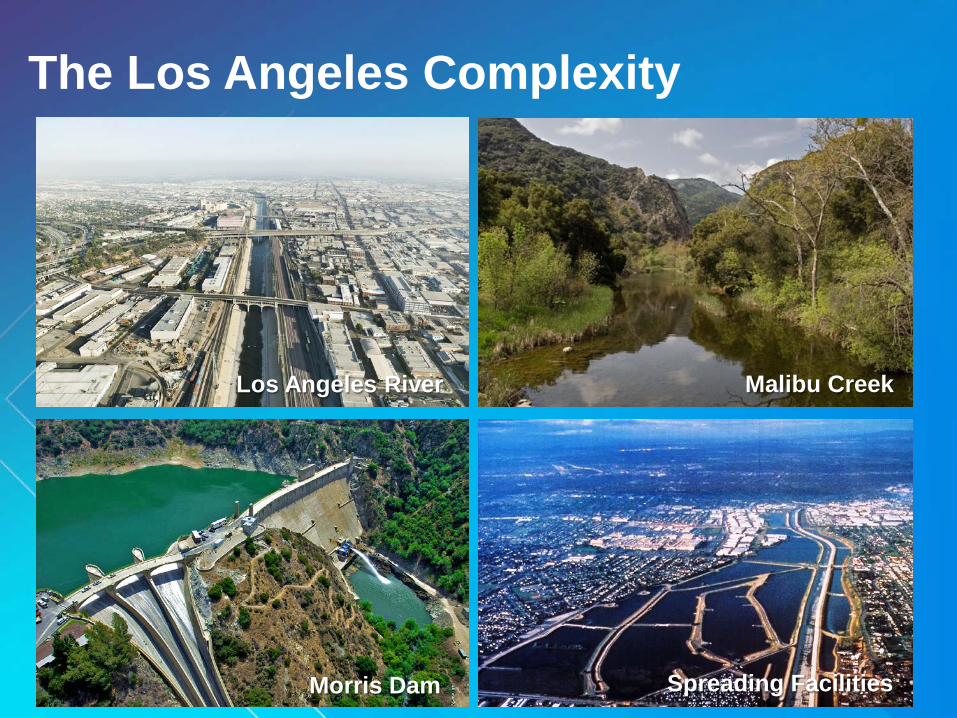
The Los Angeles Complexity
Los Angeles River Malibu Creek
Morris Dam Spreading Facilities
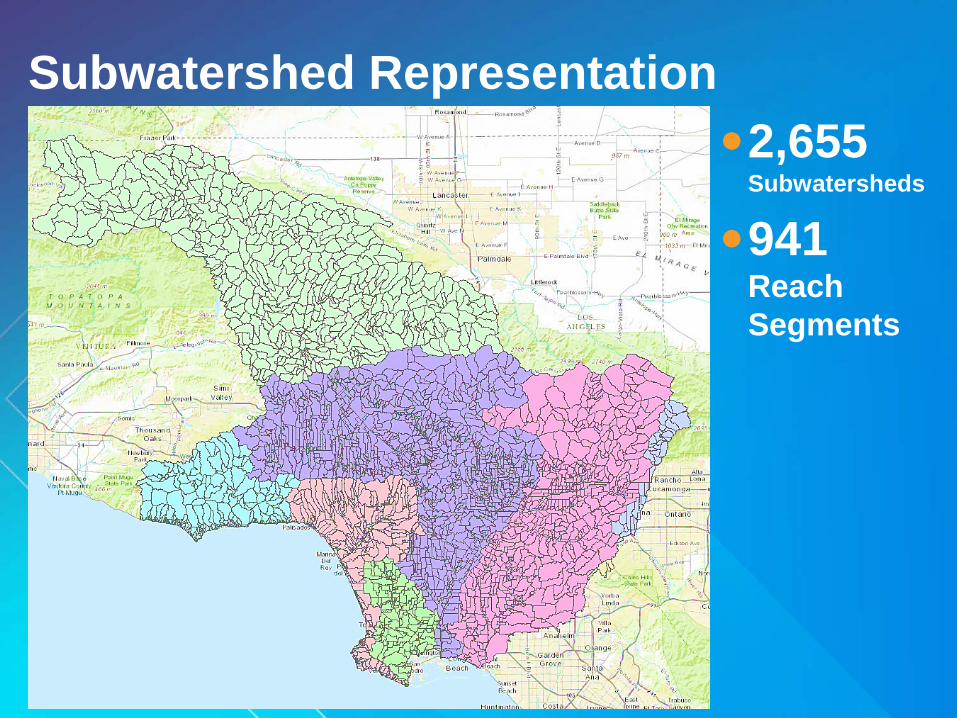
Subwatershed Representation2,655
Subwatersheds
941 Reach Segments

Land Use Representation
2005 LA County Land Use WMMS Update Land Use

Weather Representation
Rainfall Data• Analyzed
448 Rainfall Gages
• Selected 148 Rainfall Gages

Dam/Reservoir Representation
0
50
100
150
200
250
300
350
1050 1100 1150
Dis
char
ge (c
fs)
Water Surface Elevation (ft)
Morris Dam Depth vs Discharge Curve
Constructed F-Table
Depth StorageVolume
(acre-feet)
Discharge (cfs)
102 6,114 0
107 6,795 37
132 10,995 37
148 14,751 59
186 26,261 800
187 26,280 2,218
190 27,718 4,063
Actual Dam Operation
Flow -Table
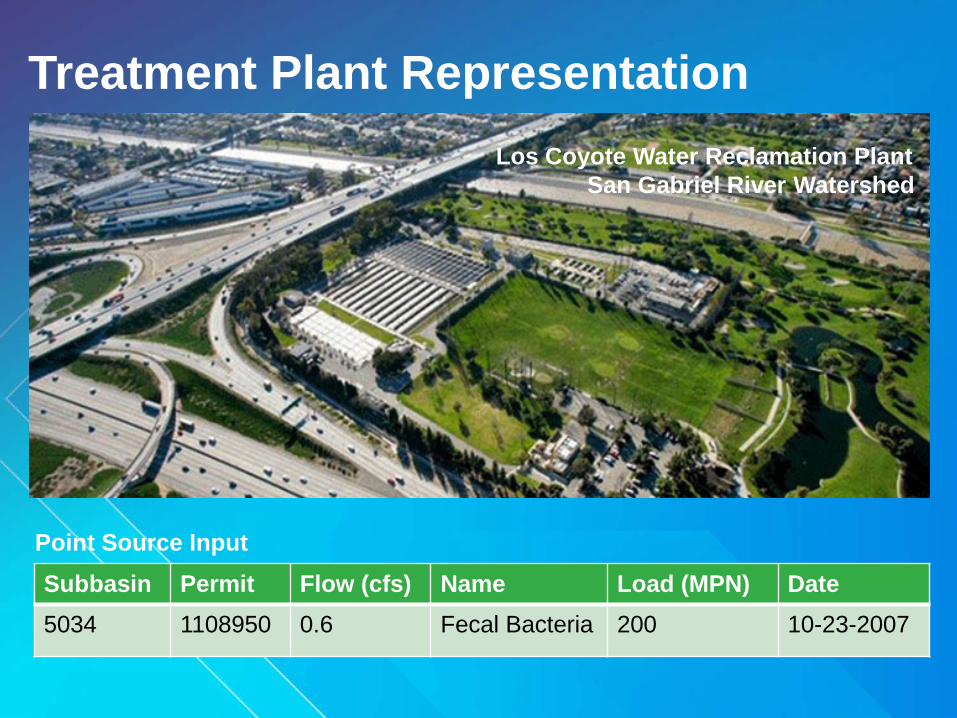
Treatment Plant Representation
Subbasin Permit Flow (cfs) Name Load (MPN) Date5034 1108950 0.6 Fecal Bacteria 200 10-23-2007
Point Source Input
Los Coyote Water Reclamation PlantSan Gabriel River Watershed

Watershed Management Modeling System
Weather text file
Access Database
GISInterface
LSPC Model
Results

-
200,000
400,000
600,000
800,000
1,000,000
1,200,000
'01 '02 '03 '04 '05 '06 '07 '08 '09 '10 '11
Flow
Vol
ume
(ac-
ft)
Water Year
Hydrological Calibration/ValidationLos Angeles River Flow
Modeled DataObserved Data
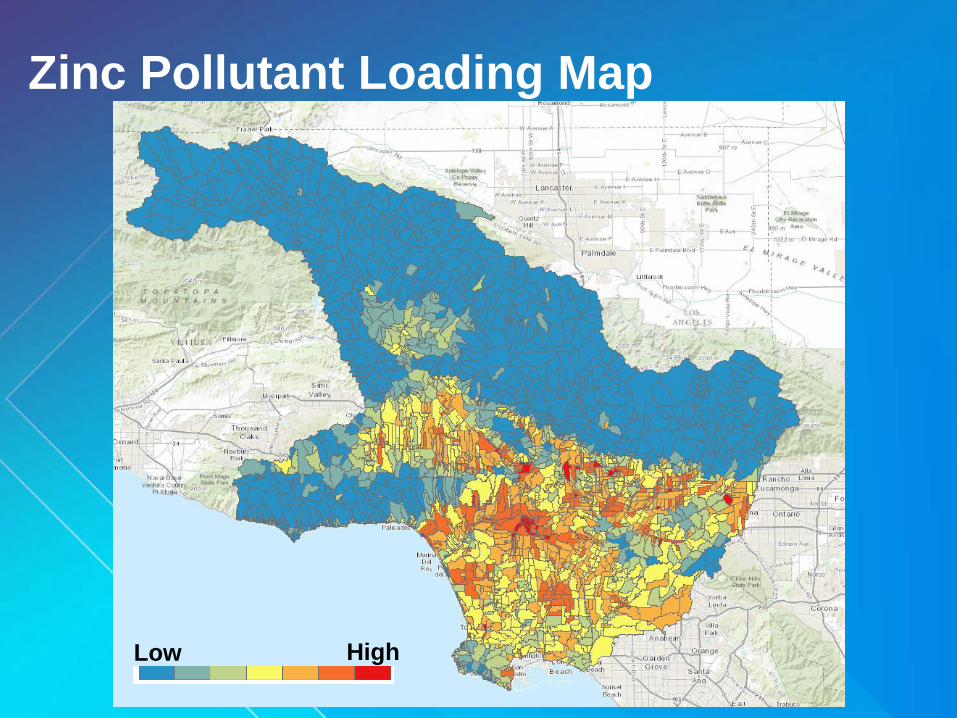
Zinc Pollutant Loading Map
HighLow

The Road Map
Problem:Water Quality
Need:Data
Solution:Model
Results:TMDL Plans

Multi-Pollutant Implementation Plans
Los Angeles River
Ballona Creek
Marina del Rey
Machado Lake
Other Uses• MS4 Permit – TMDL Compliance – California Water
Quality Regional Board• Climate Change Studies - U.S. Bureau of Reclamation• Stormwater Master Plans - Los Angeles Department of
Water and Power• Research - UCLA’s Water Sustainability Analysis Project• Research – Pardee Rand Graduate School Project

“All models are wrong but some are useful” – George E. P. Box
Conclusion
LACountyWMMS.comTJ Moon
[email protected]@tjmoon_LACoDPW
Top Related