


Languages
Pages
Legal


London Bridges Engineering Group
Bridge Condition Indicators Project
STRUCTURES CONDITION SURVEY
OF BOROUGH PRINCIPAL ROAD NETWORK
Six Year Report – April 03 to March 09
DOCUMENT CONTROL
DOCUMENT DETAILS:
NAME:
Bridge Condition Indicators Project: Structures Condition Survey of Borough Principal Road Network
Six Year Report – April 03 to March 09
VERSION: 1.0
OWNER: London Bridges Engineering Group
PREPARED BY: Atkins
DATE OF ISSUE: September 2010
VERSION HISTORY:
JOB: BPRN Structures Condition Survey REF: BCI Study_Final.doc
Version Purpose
Description
Originated Reviewed Authorised Date
Draft 1.0 For discussion Garry Sterritt/ Vicky Vassou
Draft 2.0 Draft for Comment
Megha Garia 24/03/2010
Draft 3.0 Draft for comment
Megha Garia Vicky Vassou Vicky Vassou 11/05/2010
Draft 4.0 Draft for comment
Megha Garia Vicky Vassou Vicky Vassou 08/07/2010
Final Final Report Megha Garia Vicky Vassou Vicky Vassou 07/09/2010
BCI PROJECT SIX YEAR REPORT
September 2010 i BCI Study_Final.doc
LoBEG Asset Management Working Group
Richard McFarlane Royal Borough of Kingston upon Thames
Joe Figurado London Borough of Hackney
Trevor Pennell London Borough of Enfield
Paul Williams London Borough of Brent
Andy Foster Westminster City Council
Awtar Jandu Transport for London
Duro Basic Transport for London
Garry Sterritt Transport for London
Sharan Gill Transport for London
Stephen Pottle Transport for London
Technical Support
Vicky Vassou Atkins
Megha Garia Atkins
Abdul Hilmy Capita Symonds
Kevin Andrews WestOne
Hugh Brooman Surrey County Council
Ryan Finn Camden Consultancy
BCI PROJECT SIX YEAR REPORT
September 2010 ii BCI Study_Final.doc
Executive Summary
The BCI project forms part of the strategy that is being developed by Transport for London (TfL) jointly with the London Technical Advisors Group (LoTAG) and London Bridges Engineering Group (LoBEG) for Asset Management across the Transport for London Road Network (TLRN) and the Borough Principal Road Network (BPRN).
The BCI Project comprised
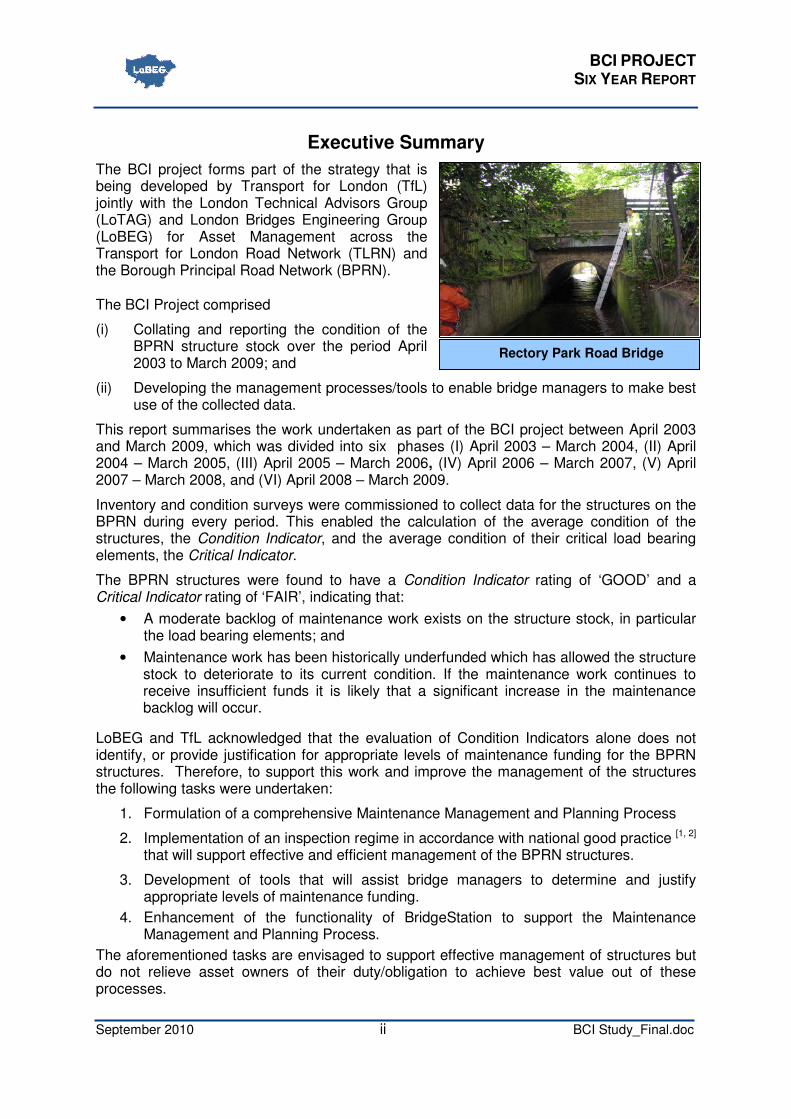
(i) Collating and reporting the condition of the BPRN structure stock over the period April 2003 to March 2009; and
(ii) Developing the management processes/tools to enable bridge managers to make best use of the collected data.
This report summarises the work undertaken as part of the BCI project between April 2003 and March 2009, which was divided into six phases (I) April 2003 – March 2004, (II) April 2004 – March 2005, (III) April 2005 – March 2006, (IV) April 2006 – March 2007, (V) April 2007 – March 2008, and (VI) April 2008 – March 2009.
Inventory and condition surveys were commissioned to collect data for the structures on the BPRN during every period. This enabled the calculation of the average condition of the structures, the Condition Indicator, and the average condition of their critical load bearing elements, the Critical Indicator.
The BPRN structures were found to have a Condition Indicator rating of ‘GOOD’ and a Critical Indicator rating of ‘FAIR’, indicating that:
• A moderate backlog of maintenance work exists on the structure stock, in particular the load bearing elements; and
• Maintenance work has been historically underfunded which has allowed the structure stock to deteriorate to its current condition. If the maintenance work continues to receive insufficient funds it is likely that a significant increase in the maintenance backlog will occur.
LoBEG and TfL acknowledged that the evaluation of Condition Indicators alone does not identify, or provide justification for appropriate levels of maintenance funding for the BPRN structures. Therefore, to support this work and improve the management of the structures the following tasks were undertaken:
1. Formulation of a comprehensive Maintenance Management and Planning Process
2. Implementation of an inspection regime in accordance with national good practice [1, 2] that will support effective and efficient management of the BPRN structures.
3. Development of tools that will assist bridge managers to determine and justify appropriate levels of maintenance funding.
4. Enhancement of the functionality of BridgeStation to support the Maintenance Management and Planning Process.
The aforementioned tasks are envisaged to support effective management of structures but do not relieve asset owners of their duty/obligation to achieve best value out of these processes.
Rectory Park Road Bridge
BCI PROJECT SIX YEAR REPORT
September 2010 iii BCI Study_Final.doc
Contents
Section Page
1 Introduction 1
1.1 General 1
1.2 Project financial support 1
1.3 Background 1
1.4 Purpose and Objectives 2
1.5 Scope and Duration 2
1.6 Project Team 3
1.7 Project Deliverables 4
1.8 Summary of Report Content 5
2 Background 6
2.1 The Purpose of Inspections 6
2.2 The Need for Good Inspection Information 6
2.3 Current Inspection Practices 7
2.4 Previous Inspection Practices 7
3 BPRN Structure Stock 8
3.1 General 8
3.2 Structure types and definitions 9
3.3 Data Collection 10
3.4 Number of Structures 10
4 Inspection Regime 12
4.1 General and Principal Inspections 12
4.2 Inspection Brief and Contracts 12
4.3 Inspection Programme 13
4.4 Future Inspection Programme 13
4.5 Conclusions and Lessons Learned 13
5 Compiling Inspection Data 14
5.1 Handover 14
5.2 Interim spreadsheet database 14
5.3 BridgeStation database 15
5.4 Conclusions and Lessons Learned 16
6 Condition Indicator for the BPRN 17
6.1 Evaluating the Bridge Condition Indicator 17
6.2 BCI for Structure Type 19
6.3 Stock Condition Indicators for Boroughs 22
6.4 BCI values for the BPRN stock 29
6.5 Interpretation of Scores 29
6.6 Conclusions 35
7 Maintenance Management and Planning 37
8 Conclusions, Lessons Learned and Recommendations 41
8.1 Conclusions 41
8.2 Lessons Learned 41

BCI PROJECT SIX YEAR REPORT
September 2010 iv BCI Study_Final.doc
8.3 Recommendations 42
9 References 44
APPENDIX A: CSS Inspection Forms
APPENDIX B: ROADS 277 Form
APPENDIX C: BE11/94 Form
APPENDIX D: Inspection Briefs
APPENDIX E: General Inspection Report Format
APPENDIX F: Principal Inspection Report Format
APPENDIX G: Condition Indicators

BCI PROJECT SIX YEAR REPORT
September 2010 v BCI Study_Final.doc
Glossary
Asset Management[1]
Asset management is a strategic approach that identifies the optimal allocation of resources for the management, operation, preservation and enhancement of the highway infrastructure to meet the needs of current and future customers.
Backlog[1] The monetary value of work required to close the gap between the actual performance provided by an asset and the current required performance.
General Inspection[2] General Inspections comprise a visual inspection (undertaken from ground level) of all parts of the structure that can be inspected without the need for special access equipment or traffic management arrangements.
Inventory[1] Information on individual structures in the stock, including but not restricted to location, structural type, dimensions, construction information and records of use.
Preventative Maintenance[1]
Work carried out to maintain the condition of the structure by protecting it from deterioration or slowing down the rate of deterioration. Preventative maintenance is justified on economic grounds because it provides minimum whole life cost maintenance. By timely intervention preventative maintenance reduces the need for essential work and/or the likelihood of essential work arising prematurely in the future. Examples of preventative maintenance include re-pointing, repainting, minor defect repairs, silane impregnation, cathodic protection and re-waterproofing.
Principal Inspection[2]
Principal Inspections comprise a comprehensive close examination, within a touching distance, of all inspectable parts of a structure, utilising suitable inspection techniques, access equipment and/or traffic management works, as necessary.
Essential Reactive Maintenance[1]
Major structural repair work and especially that undertaken when part or all of a structure is considered to be, or about to become, structurally inadequate or unsafe. Examples of essential maintenance include major concrete, masonry and steelwork repairs, and scour repairs.
Routine Maintenance[1]
Minor work carried out on a regular or cyclic basis that helps to maintain the condition and functionality of the structure and reduce the need for other, normally more expensive, maintenance works. Examples of routine maintenance common to highway structures include cleaning out expansion joints and drainage systems, greasing of metal bearings, removal of vegetation, removal of blockages in watercourses including removal of silt.
BCI PROJECT SIX YEAR REPORT
September 2010 vi BCI Study_Final.doc
Abbreviations
AM Asset Management
AVF Asset Value Factor
BCI Bridge Condition Indicator
BPRN Borough Principal Road Network
BSCI Bridge Stock Condition Indicator
CI Condition Indicator
CIPFA Chartered Institute of Public Finance and Accountancy
CSS County Surveyors’ Society
DfT Department for Transport
DMRB Design Manual for Roads and Bridges
GI General Inspection
GPG Good Practice Guide
GRC Gross Replacement Cost
LoBEG London Bridges Engineering Group
LoTAG London Technical Advisors Group
PI Principal Inspection
SCI Stock Condition Indicator
TfL Transport for London
TLRN Transport for London Road Network

BCI PROJECT SIX YEAR REPORT
September 2010 1 BCI Study_Final.doc
1 Introduction
1.1 General
Transport for London (TfL), jointly with LoTAG and LoBEG, has developed a long-term strategy for Asset Management across the Transport for London Road Network (TLRN) and the Borough Principle Road Network (BPRN). The Bridge Condition Indicator (BCI) Project forms part of this strategy.
The BCI Project comprised:
(i) collating and reporting the condition of the BPRN structure stock over the period April 2003 to March 2009; and
(ii) developing the management processes/tools to enable bridge managers to make full and best use of the data collected.
The project comprised of six phases (I) April 2003 – March 2004, (II) April 2004 – March 2005, (III) April 2005 – March 2006, (IV) April 2006 – March 2007, (V) April 2007 – March 2008, and (VI) April 2008 – March 2009. This report summarises the work undertaken in each period of the BCI project between April 2003 and March 2009.
1.2 Project financial support
Financial support for the BCI project is provided by Transport for London.
1.3 Background
The highway network is the largest and most visible community asset for which many local authorities are responsible [3]. The Highways Act 1980 places a statutory obligation on authorities to maintain the public highway. In discharging this duty authorities should seek to comply with current good practice; Asset Management is widely recognised as representing current good practice in infrastructure management [1, 3, 4, 5].
Transport for London (TfL) fully recognises the need to adopt Asset Management for London’s transport infrastructure [6]. In response to this, TfL, jointly with LoTAG and LoBEG, is developing and implementing Asset Management for the Transport for London Road Network (TLRN), the Borough Principal Road Network (BPRN) and other borough roads.
Highway structures are an integral component of the highway network, creating vital links and in some cases creating prominent community and historical features. Highway structures have long service lives and generally slow rates of deterioration. These characteristics make many highway infrastructure assets conducive to a ‘save now, pay later’ management approach, an approach which is thought to be widespread in the UK.
New Bournes Bridge
BCI PROJECT SIX YEAR REPORT
September 2010 2 BCI Study_Final.doc
The Government has recognised that this approach neither meets the service requirements nor does it provide long-term value for money. To address this issue the Government is advocating [3] and fully supporting an Asset Management approach for highways1.
1.4 Purpose and Objectives
The purpose of this project is to ensure that fundamental management information and activities are in place, and sustained, for the BPRN structures and that these align with recognised good practice. The project aims to:
• To provide information that assists authorities/bridge managers to check that highway structures are safe for use and fit for purpose
• To provide justification for investment in the on-going maintenance of the BPRN highway structures.
• To develop tools/procedures that will improve and streamline management activities.
The following are the key activities that facilitate in meeting the project objectives:
• Identify all highway structures on the BPRN;
• Develop and continually review/update/improve an inspection brief that ensures best use is made of inspections and that suppliers provide the required information.
• Implement an on-going regime of General and Principal Inspections for all the BPRN structures in accordance with accepted good practice, i.e. CSS inspection procedures.
• Evaluate the condition score for the BPRN structures, using the inspection information, in accordance with the CSS Guidance[7, 8, 9 and 10];
• Produce a report on the results, interpretation and recommendations.
• Support Asset Management Planning
1.5 Scope and Duration
The scope of the project is:
• To collate inventory and condition data for the BPRN structure stock and evaluate the Condition Indicator values for the stock throughout the six phases of the project: (I) April 2003 – March 2004, (II) April 2004 – March 2005, (III) April 2005 – March 2006, (IV) April 2006 – March 2007, (V) April 2007 – March 2008, and (VI) April 2008 – March 2009.
• Continually review and improve asset management planning processes.
1 In 2009 the Department for Transport made an additional £23m available to local authorities to support data
collection and the development of asset management practices.
BCI PROJECT SIX YEAR REPORT
September 2010 3 BCI Study_Final.doc
1.6 Project Team
The Royal Borough of Kingston upon Thames (hereafter referred to as RBK) acted as the lead borough on behalf of LoBEG for this project, managing the overall team which consisted of:
• Capita Symonds managed the Inspection programme during the first 6 year cycle of inspections. Their responsibilities mainly comprised of:
• Maintaining the six year inspection inventory of the BPRN highway structures;
• Liaising with the boroughs, for each phase of the inspections, to ascertain whether they wished to undertake the inspections in-house and seeking costs/programme from those who wished to do so;
• Preparing draft tender documents, for the boroughs that did not undertake the inspections in-house, for inspections to be procured through competitive tendering; inviting and assessing the tenders and making recommendations to the Project sponsor on the contract award;
• Reviewing the inspection reports with the aim of approving the final versions; and
• Providing technical support to LoBEG Asset Management Working Group on the technical documents prepared by the Group.
• Atkins provided specialist bridge management support to the LoBEG BCI project. The specialist support related to,
• Inspection practices;
• Condition indicators;
• Maintenance prioritisation (including Risk Based Maintenance);
• Lifecycle planning and
• Financial planning.
• Camden Consultancy Service were involved in incorporating BCI tools and functionalities into the BridgeStation based on their research and pilot studies. They worked closely with the Project Sponsor, Atkins, and Capita Symonds during the first 6 year cycle of inspection.
• Inspection teams appointed by RBK, carried out structures inspections and prepared Roads 277 Forms, namely Enfield Borough Council, Surrey County Council and Capita Symonds.
• Some Boroughs carried out their own inspections and prepared Roads 277 Forms for the structures in their boroughs. Whilst the inspection in the other boroughs were undertaken by Consultants procured through competitive tendering.
• TfL Street Management were responsible for the funding and overseeing the progress of the project.
BCI PROJECT SIX YEAR REPORT
September 2010 4 BCI Study_Final.doc
1.7 Project Deliverables
Project Deliverables include:
• Identification of all highway structures on the BPRN;
• Development and delivery of 6-year Inspection Programme (divided into six phases)
• Inspection Briefs for each of the six phases;
• Structures condition data/inspection reports;
• Updated database of structures: Interim Database and BridgeStation;
• BCI Values for the BPRN structure stock;
• BCI Reports: annual and 6-year.
• Improved processes to support Asset Management Planning

BCI PROJECT SIX YEAR REPORT
September 2010 5 BCI Study_Final.doc
1.8 Summary of Report Content
The contents of this report are summarised in Table 1:
Table 1: Contents of Report
Section Description
1. Introduction Provides a brief description of the project background, project team and overall objectives of the project.
2. Background Describes the previous and current inspection practices and emphasises the need for inspections.
3. BPRN Structure Stock Provides a description of the Borough Principal Road Network (BPRN), BPRN structures – types and quantities.
4. Inspection Regime Presents the first six-year (April 2003 to March 2009) and the next six-year (April 2009 – March 2015) inspection programmes
5. Compiling Inspection Data Describes the process for compiling the inspection data – previous practices (Spreadsheet database) and current practices (BridgeStation).
6. Condition Indicator for the BPRN Presents the detailed results for the BPRN structure stock – Structure Type Condition Indicators, Borough Condition Indicators and Condition Index for the entire BPRN stock.
7. Condition Based Maintenance Planning Presents the current and future developments for improved management of BPRN structures.
8. Conclusions, Lessons Learned and Recommendations
Draws conclusion and lessons learned from the current work.
9. References Lists the documents referred to for the purpose of this project.
Appendices Provides supporting information including:
• Inspection Forms
• Inspection Report Formats
• Inspection Briefs
• Condition Indicator Values and Graphs
BCI PROJECT SIX YEAR REPORT
September 2010 6 BCI Study_Final.doc
2 Background
2.1 The Purpose of Inspections
Management of Highway Structures: A Code of Practice [1] states that:
‘The overall purpose of inspection, testing and monitoring is to check that the highway structures stock is safe for use and fit for purpose and to provide the data required to support the Good Management Practice identified in this Code’
Inspections form the basis for maintenance planning and other management activities and facilitate in:
• Collation/Compilation of Data:
� To compile, verify and maintain inventory data, e.g. structure type, dimensions and location, for all the highway structures the authority is responsible for.
� To collate data on current condition, performance and environment of the structure e.g. severity and extent of defects, material strength and loading.
• Ensuring Asset Safety/Function: To check/determine if the asset is safe for use and fit for purpose, i.e. the asset is able to perform its required function.
• Identification of Maintenance Needs: To support the identification, planning and programming of maintenance (or improvement) activities necessary to achieve safety, functional and aesthetic requirements;
2.2 The Need for Good Inspection Information
A sound knowledge of the asset is fundamental to bridge management, not just at a high level, but in sufficient detail to support the maintenance planning and other management activities and also support decision making. It is essential to maintain the quality and consistency of inspection data to support:
• Asset Specific Decisions: The majority of the inspection work involves collecting relevant data and describing defects in terms of their type, location, extent, severity and, if possible, cause. Thus accurate reporting is essential to enable the asset manager and/or the relevant parties to make appropriate decisions concerning the safety and maintenance of the structure.
• Justification for Funding: Enable bridge managers in determining and justifying the appropriate levels of maintenance funding.
• Bridge Management Techniques: Consistency is vital to current and developing bridge management techniques, e.g. Bridge Condition Indicator calculation, prioritising maintenance, asset valuation/depreciation, lifecycle planning, long-term financial planning and trending and comparison (of any of these) between authorities. To ensure that these approaches are suitably supported, it is essential that the inspection data collated for these purposes is consistent and accurate.

BCI PROJECT SIX YEAR REPORT
September 2010 7 BCI Study_Final.doc
2.3 Current Inspection Practices
All inspections undertaken by the Boroughs, after 2002, have been carried out in accordance with the guidelines set out in ‘Guidance Note on Bridge Inspection Reporting’ published by CSS in July 2002[9].
A CSS style inspection proforma is completed during all General and Principal Inspections. The CSS proforma comprises[2]:
• Basic Inventory Data, i.e. Bridge name, Road name, O.S. Grid Reference, Number of spans, etc.;
• Bridge elements, i.e. list of all bridge elements for which a condition score should be recorded;
• Element Condition Reporting, i.e. information is reported for each bridge element separately in terms of ‘Severity’, ‘Extent’ of defects and ‘Defect Type’;
• Maintenance Works, i.e. Work required, Work priority and Cost of Work;
• Inspection Dates;
• Relevant comments from the Inspector and the signing off Engineer to include additional information that may be beneficial for decision making and/or future purposes;
• Detailed description of Work Required
A CSS Inspection Proforma for bridges can be found in Appendix A.
In addition to the CSS forms, inspectors are required to include a ROADS 277 (Appendix B) form giving all details of the structure. A written report of the observations, findings, causes and recommended remedies with a Routine Maintenance Schedule and a Risk Assessment Form is also submitted in the specified format.
2.4 Previous Inspection Practices
Prior to 2002, inspections were undertaken in accordance with the guidelines set out in BD63/94 [11], a DMRB standard that described the inspection and reporting requirements for highway structures.
For every inspection (General or Principal), a BE 11 form was completed to include the
• General structure details, i.e. structure name, no., Reference, etc.
• Inspection Details, i.e. type and date of inspection,
• Condition of elements, i.e. Extent and Severity of defects;
• Type of action/works required;
• Priority of required works and reason for priority allocation;
• Approximate cost of required works; and
• Additional comments from the inspector.
A BE11 Form for bridges can be found in Appendix C.
In addition to the BE 11 forms, inspectors were required to complete a ROADS 277 form (Appendix B) giving all details of the structure.
BCI PROJECT SIX YEAR REPORT
September 2010 8 BCI Study_Final.doc
3 BPRN Structure Stock
3.1 General
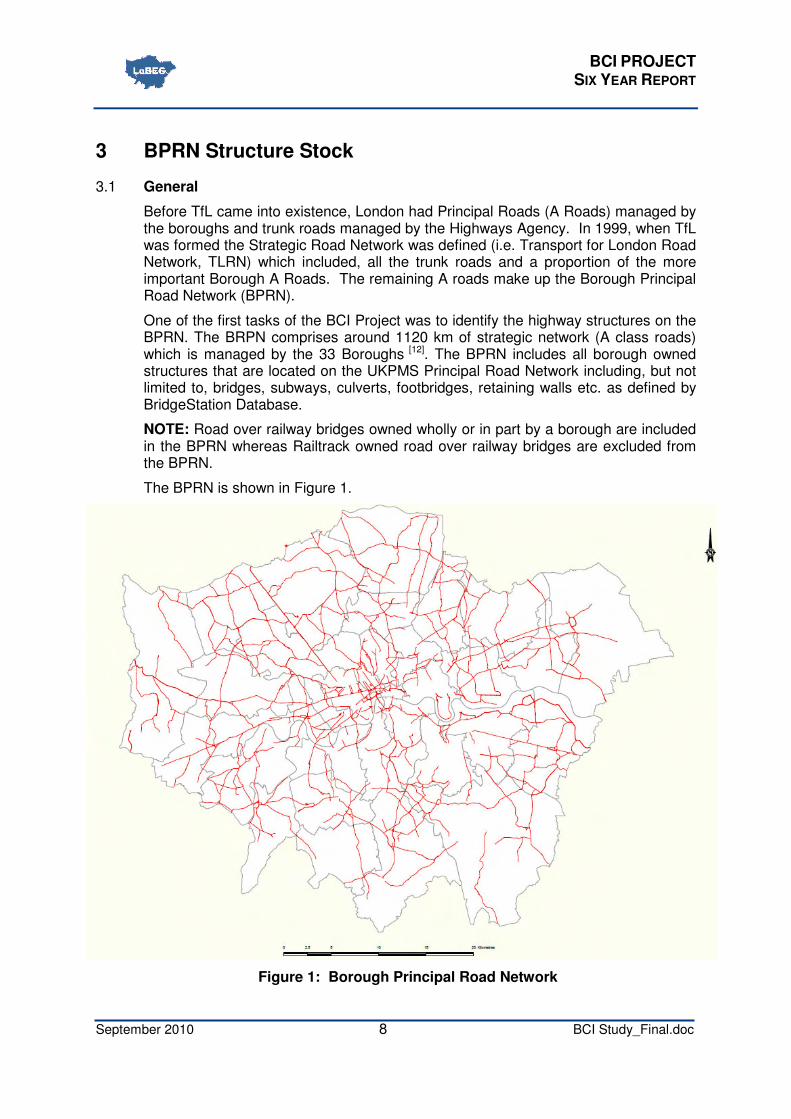
Before TfL came into existence, London had Principal Roads (A Roads) managed by the boroughs and trunk roads managed by the Highways Agency. In 1999, when TfL was formed the Strategic Road Network was defined (i.e. Transport for London Road Network, TLRN) which included, all the trunk roads and a proportion of the more important Borough A Roads. The remaining A roads make up the Borough Principal Road Network (BPRN).
One of the first tasks of the BCI Project was to identify the highway structures on the BPRN. The BRPN comprises around 1120 km of strategic network (A class roads) which is managed by the 33 Boroughs [12]. The BPRN includes all borough owned structures that are located on the UKPMS Principal Road Network including, but not limited to, bridges, subways, culverts, footbridges, retaining walls etc. as defined by BridgeStation Database.
NOTE: Road over railway bridges owned wholly or in part by a borough are included in the BPRN whereas Railtrack owned road over railway bridges are excluded from the BPRN.
The BPRN is shown in Figure 1.
Figure 1: Borough Principal Road Network
BCI PROJECT SIX YEAR REPORT
September 2010 9 BCI Study_Final.doc
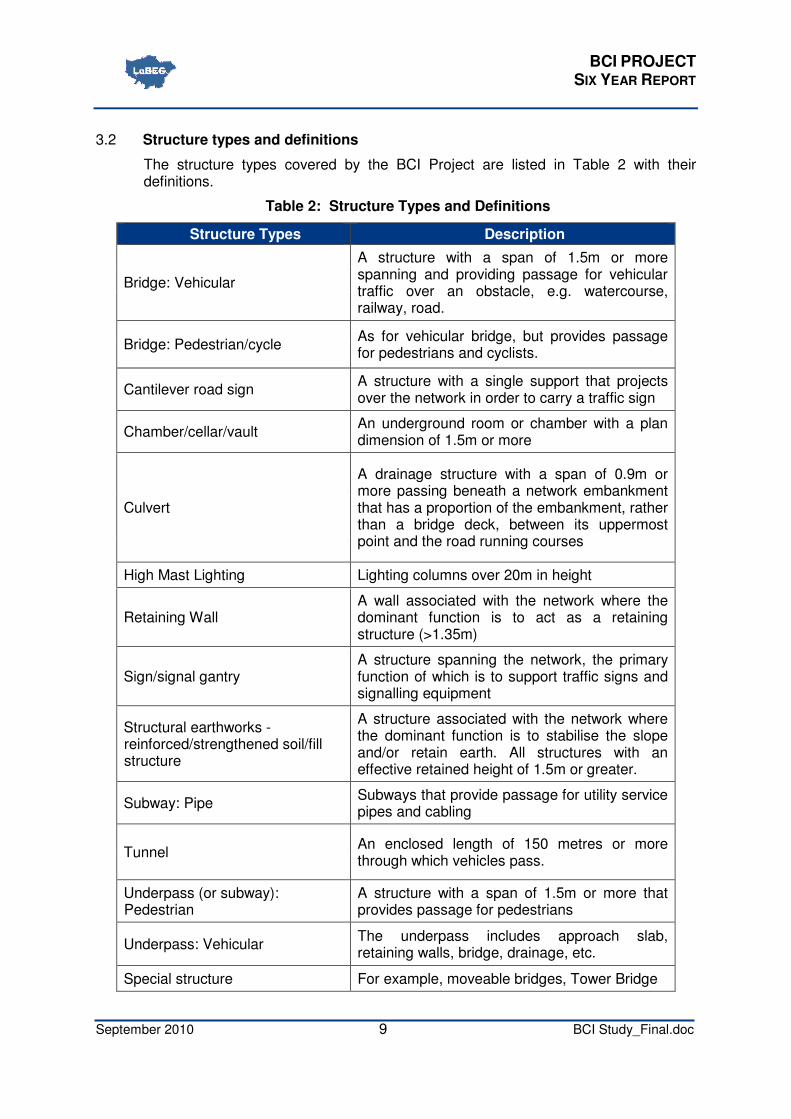
3.2 Structure types and definitions
The structure types covered by the BCI Project are listed in Table 2 with their definitions.
Table 2: Structure Types and Definitions
Structure Types Description
Bridge: Vehicular
A structure with a span of 1.5m or more spanning and providing passage for vehicular traffic over an obstacle, e.g. watercourse, railway, road.
Bridge: Pedestrian/cycle As for vehicular bridge, but provides passage for pedestrians and cyclists.
Cantilever road sign A structure with a single support that projects over the network in order to carry a traffic sign
Chamber/cellar/vault An underground room or chamber with a plan dimension of 1.5m or more
Culvert
A drainage structure with a span of 0.9m or more passing beneath a network embankment that has a proportion of the embankment, rather than a bridge deck, between its uppermost point and the road running courses
High Mast Lighting Lighting columns over 20m in height
Retaining Wall A wall associated with the network where the dominant function is to act as a retaining structure (>1.35m)
Sign/signal gantry A structure spanning the network, the primary function of which is to support traffic signs and signalling equipment
Structural earthworks - reinforced/strengthened soil/fill structure
A structure associated with the network where the dominant function is to stabilise the slope and/or retain earth. All structures with an effective retained height of 1.5m or greater.
Subway: Pipe Subways that provide passage for utility service pipes and cabling
Tunnel An enclosed length of 150 metres or more through which vehicles pass.
Underpass (or subway): Pedestrian
A structure with a span of 1.5m or more that provides passage for pedestrians
Underpass: Vehicular The underpass includes approach slab, retaining walls, bridge, drainage, etc.
Special structure For example, moveable bridges, Tower Bridge
BCI PROJECT SIX YEAR REPORT
September 2010 10 BCI Study_Final.doc
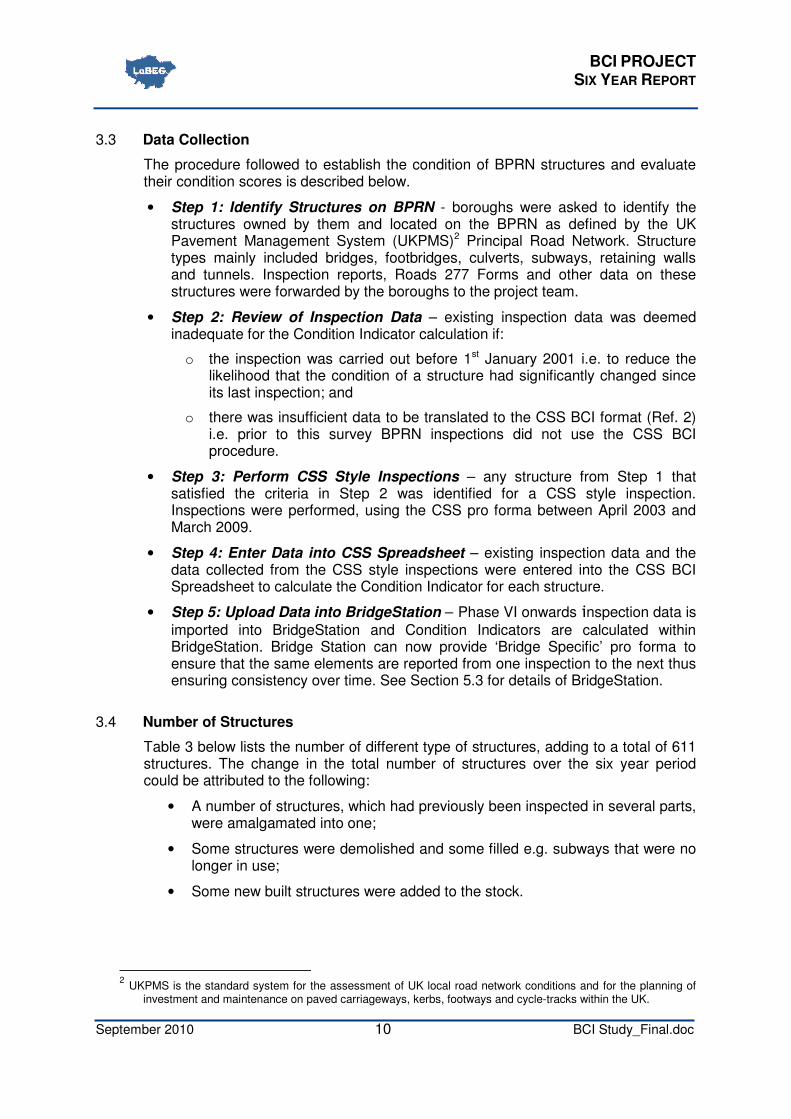
3.3 Data Collection
The procedure followed to establish the condition of BPRN structures and evaluate their condition scores is described below.
• Step 1: Identify Structures on BPRN - boroughs were asked to identify the structures owned by them and located on the BPRN as defined by the UK Pavement Management System (UKPMS)2 Principal Road Network. Structure types mainly included bridges, footbridges, culverts, subways, retaining walls and tunnels. Inspection reports, Roads 277 Forms and other data on these structures were forwarded by the boroughs to the project team.
• Step 2: Review of Inspection Data – existing inspection data was deemed inadequate for the Condition Indicator calculation if:
o the inspection was carried out before 1st January 2001 i.e. to reduce the likelihood that the condition of a structure had significantly changed since its last inspection; and
o there was insufficient data to be translated to the CSS BCI format (Ref. 2) i.e. prior to this survey BPRN inspections did not use the CSS BCI procedure.
• Step 3: Perform CSS Style Inspections – any structure from Step 1 that satisfied the criteria in Step 2 was identified for a CSS style inspection. Inspections were performed, using the CSS pro forma between April 2003 and March 2009.
• Step 4: Enter Data into CSS Spreadsheet – existing inspection data and the data collected from the CSS style inspections were entered into the CSS BCI Spreadsheet to calculate the Condition Indicator for each structure.
• Step 5: Upload Data into BridgeStation – Phase VI onwards inspection data is
imported into BridgeStation and Condition Indicators are calculated within BridgeStation. Bridge Station can now provide ‘Bridge Specific’ pro forma to ensure that the same elements are reported from one inspection to the next thus ensuring consistency over time. See Section 5.3 for details of BridgeStation.
3.4 Number of Structures
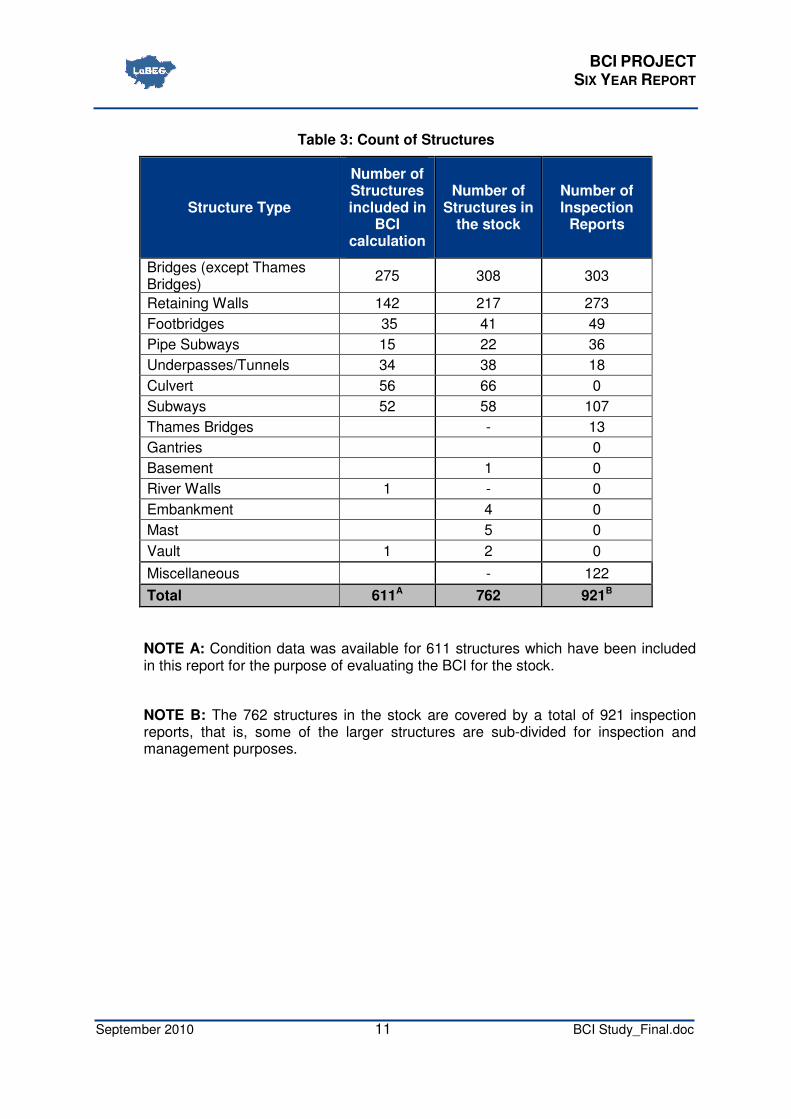
Table 3 below lists the number of different type of structures, adding to a total of 611 structures. The change in the total number of structures over the six year period could be attributed to the following:
• A number of structures, which had previously been inspected in several parts, were amalgamated into one;
• Some structures were demolished and some filled e.g. subways that were no longer in use;
• Some new built structures were added to the stock.
2 UKPMS is the standard system for the assessment of UK local road network conditions and for the planning of
investment and maintenance on paved carriageways, kerbs, footways and cycle-tracks within the UK.
BCI PROJECT SIX YEAR REPORT
September 2010 11 BCI Study_Final.doc
Table 3: Count of Structures
Structure Type
Number of Structures included in
BCI calculation
Number of Structures in
the stock
Number of Inspection
Reports
Bridges (except Thames Bridges)
275 308 303
Retaining Walls 142 217 273
Footbridges 35 41 49
Pipe Subways 15 22 36
Underpasses/Tunnels 34 38 18
Culvert 56 66 0
Subways 52 58 107
Thames Bridges - 13
Gantries
0
Basement 1 0
River Walls 1 - 0
Embankment 4 0
Mast 5 0
Vault 1 2 0
Miscellaneous - 122
Total 611A 762 921B
NOTE A: Condition data was available for 611 structures which have been included in this report for the purpose of evaluating the BCI for the stock.
NOTE B: The 762 structures in the stock are covered by a total of 921 inspection reports, that is, some of the larger structures are sub-divided for inspection and management purposes.
BCI PROJECT SIX YEAR REPORT
September 2010 12 BCI Study_Final.doc
4 Inspection Regime
4.1 General and Principal Inspections
The BCI Project included an on-going regime of General and Principal Inspections of the highway structures on the BPRN, in accordance with good practice, i.e. CSS Inspection Procedures [9] and the Code of Practice for Management of Highway Structures [1]. It is recommended [1, 2] that all highway structures should be subjected to
•••• A regular General Inspection not more than two years following the previous General or Principal Inspection; and
•••• A regular Principal Inspection not more than six years following the previous Principal Inspection unless a risk assessment has been carried out to define an alternative interval.
The first six year (2003 – 2009) inspection programme was developed in accordance with the aforementioned intervals and is summarised in Table 4, section 4.3.
4.2 Inspection Brief and Contracts
An Inspection brief/specification was issued by the RBK, for every phase (I – VI) of inspections, to every party (consultant or borough) undertaking the inspections.
The inspection brief that was issued for the Phase V inspections is presented in Appendix D. The briefs generally comprised of:
• Scope of Works which included:
o A list of highway structures for which General and Principal Inspections needed to be undertaken
o Existing information on the listed structures, e.g. Inspection reports, assessment reports, 277 forms, etc.
• Standards and guidance documents to be followed for carrying out inspections and collating/reporting the inspection data.
• Procedures for undertaking inspections, in particular:
o Ensuring public safety by bringing immediate attention to defects having safety implications
o Arranging access and traffic management to carry out inspection works
o Ensuring compliance with Health and Safety requirements
o Reporting of element condition information, i.e. format and additional information
• Content and format of GI and PI reports, e.g. report front and back covers, standard forms to be included in the report (CSS inspection form, 277 forms, risk assessment form, etc.) electronic format (word/excel/pdf), etc. A copy of GI and PI report layout is presented in Appendix E and F, respectively.

BCI PROJECT SIX YEAR REPORT
September 2010 13 BCI Study_Final.doc
4.3 Inspection Programme
The first six year inspection programme is summarised in Table 4 below
Table 4: First Six Year Inspection Programme
Structure Inspections
Year
Total 03-04 04-05 05-06 06-07 07-08 08-09
Principal Inspection (PI)
116 238 198 121 125 143 941
General Inspection (GI)
129 321 239 301 306 286 1582
Total 245 559 437 422 431 429 2523
4.4 Future Inspection Programme
The second six year inspection programme has also been developed in accordance with the aforementioned GI/PI intervals (Section 4.1) and is summarised in Table 5 below.
Table 5: Second Six Year Inspection Programme
Structure Inspections
Year
Total 09-10 10-11 11-12 12-13 13-14 14-15
Principal Inspection (PI)
163 168 174 121 107 147 880
General Inspection (GI)
303 265 293 311 329 286 1787
Total 466 433 467 432 436 433 2667
4.5 Conclusions and Lessons Learned
The development/delivery of the inspection programme supported the identification of the BPRN structures and also provided clarity on which structures the London Boroughs are responsible for.
Due to significant inconsistencies within the inventory and condition data LoBEG recognised the importance of having consistent element inventories and the impact these have on the BCI values for the stock. This led LoBEG to start developing a Good Practice Guide (GPG) on creating structure inventories to achieve consistent practice for identifying element inventories, condition reporting and BCI evaluation.

BCI PROJECT SIX YEAR REPORT
September 2010 14 BCI Study_Final.doc
5 Compiling Inspection Data
5.1 Handover
The inspection reports (hard and electronic copies) produced by the Consultants were sent to the boroughs, whereas the reports produced by the boroughs, once finalised, remained with the boroughs. All final reports were subsequently sent to Camden Consultancy Service for uploading the information into the BridgeStation.
5.2 Interim spreadsheet database
For all the phases, except Phase VI, data from the CSS inspection forms was input manually into an Interim Database to evaluate the BCI scores for each individual structure in the stock. In Phase VI the BCI scores were calculated within BridgeStation.
The Interim Database was a Microsoft Excel file which was used to
• store condition data for all the BPRN structures;
• calculate the BCI values for each individual structure based on the condition data;
• produce BCI histograms/graphs based on the calculations;
• evaluate the condition index for each structure type (Bridges, Retaining Wall, etc.); and
• evaluate the Condition Index for the stock.
Figure 2 presents a screenshot of the Main screen of the interim spreadsheet database.
Figure 2: Interim Spreadsheet Database
BCI PROJECT SIX YEAR REPORT
September 2010 15 BCI Study_Final.doc
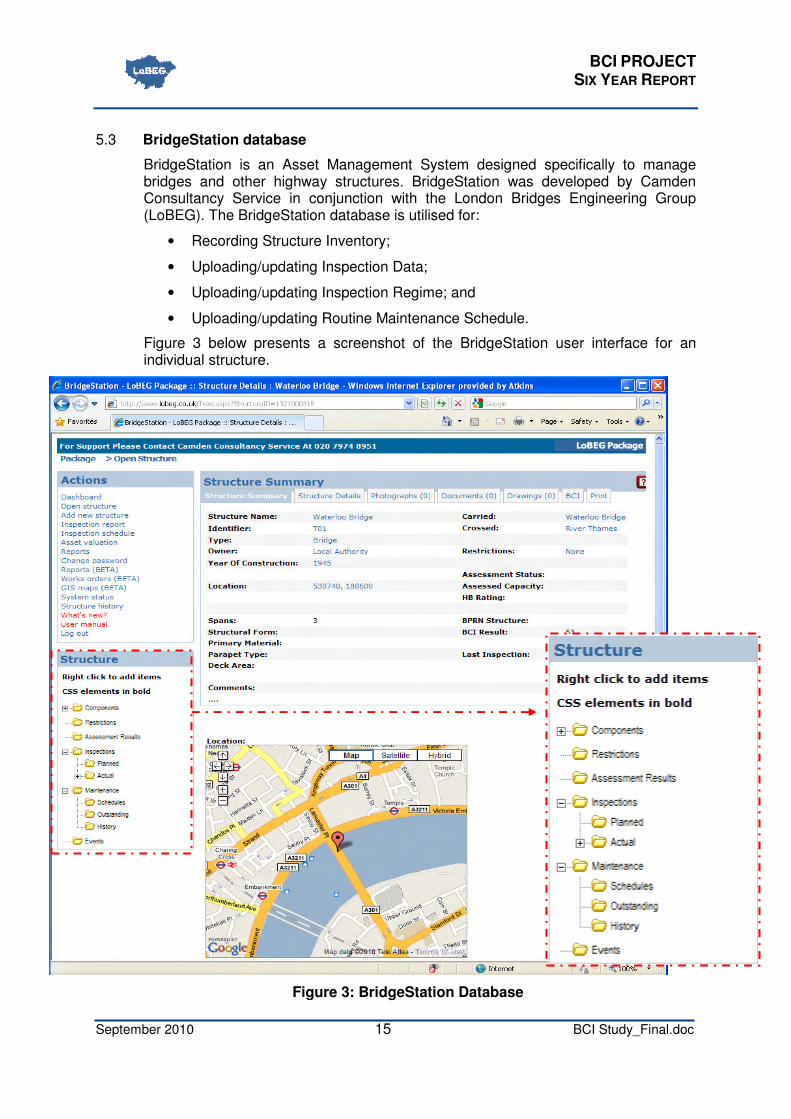
5.3 BridgeStation database
BridgeStation is an Asset Management System designed specifically to manage bridges and other highway structures. BridgeStation was developed by Camden Consultancy Service in conjunction with the London Bridges Engineering Group (LoBEG). The BridgeStation database is utilised for:
• Recording Structure Inventory;
• Uploading/updating Inspection Data;
• Uploading/updating Inspection Regime; and
• Uploading/updating Routine Maintenance Schedule.
Figure 3 below presents a screenshot of the BridgeStation user interface for an individual structure.
Figure 3: BridgeStation Database
BCI PROJECT SIX YEAR REPORT
September 2010 16 BCI Study_Final.doc
After the development of BridgeStation, the data from Interim Spreadsheet Database was migrated/bulk imported into BridgeStation. This required a considerable amount of data validation and cleansing, e.g. matching up of structure names used in the interim database to those used in the BridgeStation’s database, or cleansing the data for errors, e.g. structure reference numbers where a letter had been used in place of a number and vice versa.
The current inspection data, from the Consultants and the Boroughs, is received in the form of PDF reports or Microsoft Excel CSS Proforma. The data that is in the Microsoft Excel CSS ProForma format can be imported into BridgeStation using a software application that automatically reads the CSS Pro Forma. However, there is also some manual cleansing required in matching up structure names used by engineers on the CSS proforma to those of the BridgeStation’s database.
BridgeStation is regularly updated when new information is received on existing structures, e.g. condition from latest inspection, etc. However, adding new structures to BridgeStation is left to the discretion of the borough.
5.4 Conclusions and Lessons Learned
The Interim Spreadsheet Database proved beneficial in testing and trialling the evaluation of Condition Indicator scores for the stock. Over the years inspectors, engineers and managers became increasingly familiar with the Interim Database. However with the migration of the Interim Database to BridgeStation inspectors, engineers and managers are slowly gaining momentum in familiarising themselves with BridgeStation. The migration has been a slow process and required considerable effort as a significant amount of data cleansing and validation had to be undertaken to ensure the quality of inspection information. This again reinforced the need for consistent element inventories and condition reporting. It is considered that there is still a lack of clarity within BridgeStation which may gradually be addressed as it evolves and as more and more inspectors/engineers/managers become increasingly familiar with the system.
BCI PROJECT SIX YEAR REPORT
September 2010 17 BCI Study_Final.doc
6 Condition Indicator for the BPRN
6.1 Evaluating the Bridge Condition Indicator
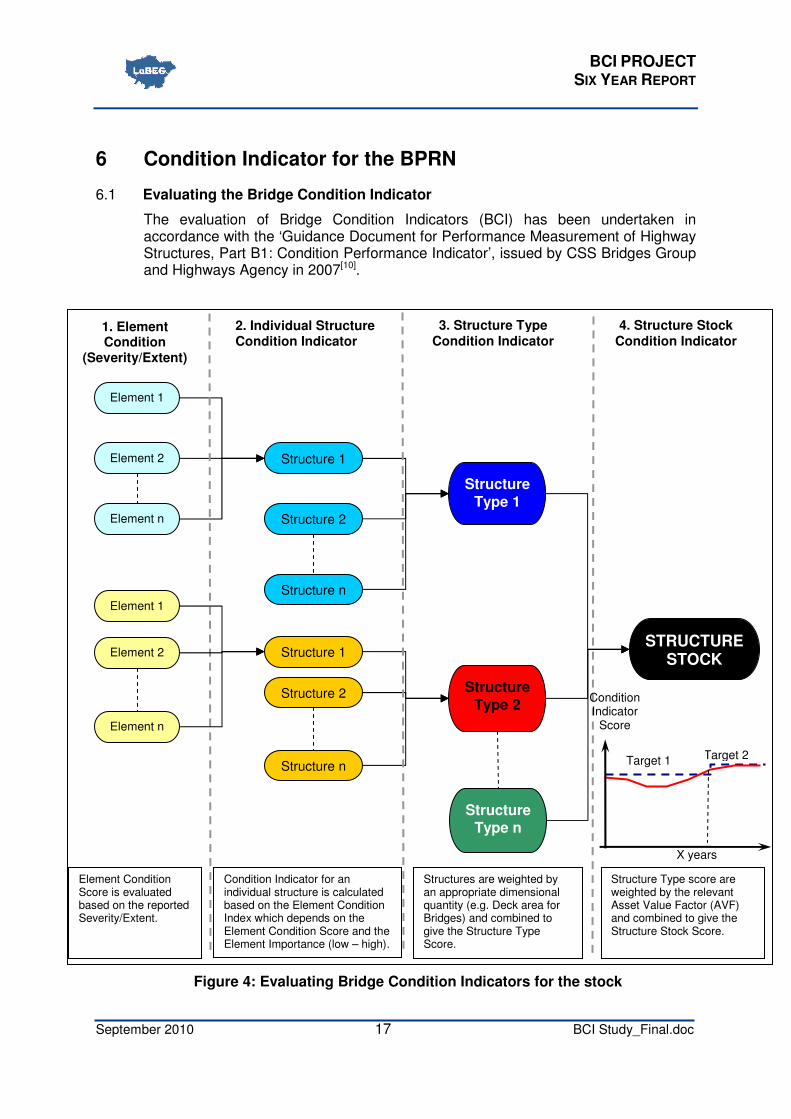
The evaluation of Bridge Condition Indicators (BCI) has been undertaken in accordance with the ‘Guidance Document for Performance Measurement of Highway Structures, Part B1: Condition Performance Indicator’, issued by CSS Bridges Group and Highways Agency in 2007[10].
Figure 4: Evaluating Bridge Condition Indicators for the stock
Element 1
Element 2
Element n
Structure 1
Structure
Type 1
STRUCTURE STOCK
Structure 2
Structure n
Structure 1
Structure
Type 2 Structure 2
Structure n
Structure Type n
1. Element Condition
(Severity/Extent)
2. Individual Structure Condition Indicator
3. Structure Type Condition Indicator
4. Structure Stock Condition Indicator
Element 1
Element 2
Element n
Condition Indicator
Score
Target 2 Target 1
X years
Structure Type score are weighted by the relevant Asset Value Factor (AVF) and combined to give the Structure Stock Score.
Structures are weighted by an appropriate dimensional quantity (e.g. Deck area for Bridges) and combined to give the Structure Type Score.
Condition Indicator for an individual structure is calculated based on the Element Condition Index which depends on the Element Condition Score and the Element Importance (low – high).
Element Condition Score is evaluated based on the reported Severity/Extent.

BCI PROJECT SIX YEAR REPORT
September 2010 18 BCI Study_Final.doc
The process for evaluating the BCI is illustrated in Figure 4, where:
• Element Condition, in terms of Severity and Extent, is used to evaluate the Element Condition Scores at element level.
• The Element Condition Scores and Element Importance are used to evaluate the Condition Indicator (CI) for an individual structure. Two condition indicators are calculated for each structure, which are defined as:
• BCIav: The average BCI for a structure taking into account the condition of all structural elements on the structure. This score provides an overview of the average structure condition.
• BCIcrit: The condition score of the load bearing element which is in worst condition, this score provides an indication of the criticality of the structure with regards to the load bearing capacity.
• The CI scores for individual structures are used to evaluate the Structure Type Condition Indicator, e.g. BCI for all Bridges (1, 2….n), weighted according to the deck area, is used to evaluate the BCI for the overall stock of Bridges.
• The Structure Type Condition Indicator for each structure type (e.g. Bridges, Retaining Walls, Tunnels, etc.), weighted according to the relevant Asset Value Factor (AVF), is used to evaluate the Structure Stock Condition Indicator. Table 6 lists the structures that have been used for calculating the Stock Condition Indicator, along with the corresponding Asset Value Factors. Two condition indicators are evaluated for a stock of structures:
• Stock Condition Indicator – the weighted average of the individual Condition Indicator scores, this score provides an overview of the average stock condition.
• Critical Stock Indicator – the weighted average of the Critical Indicator scores, this score provides an indication of the criticality of the stock with regards to load carrying capacity.
Table 6: Structures included in the evaluation of the BCI scores for the stock
Structure Type (BPRN) Included? Asset Value Factor
(AVF)[10] Comments
Basement No No AVF defined.
Bridge Yes 0.2
Culvert No No AVF defined.
Footbridge Yes 0.2 Treated as Bridges
Pedestrian Subway No No AVF defined.
Pipe Subway No No AVF defined.
Retaining Wall Yes 0.1
Tunnel Yes 0.5
Vault No No AVF defined.

BCI PROJECT SIX YEAR REPORT
September 2010 19 BCI Study_Final.doc
The following sections present the Condition Indicators which have been evaluated for the BPRN stock.
6.2 BCI for Structure Type
The BCIav and BCIcrit values evaluated, over the six year period, for the different structure types are summarised in Table 7 below. No condition data was available for Vaults and Basements prior to 2006-07, as these structures were excluded from previous inspection regime due to ownership issues.
Table 7: BCIav and BCIcrit for BPRN Structures
Structure Type 2003-04 2004-05 2005-06 2006-07 2007-08 2008-09
BC
I A
vera
ge
Basement (Ave) 100.00 100.00
Bridge (Ave) 84.42 85.19 86.96 85.52 85.06 83.81
Culvert (Ave) 89.71 91.00 87.86 89.70 89.57 89.72
Footbridge (Ave) 91.68 91.95 88.87 88.70 88.84 87.08
Pedestrian Subway (Ave)
84.84 85.04 85.34 86.06 85.41 85.79
Pipe Subway (Ave) 98.85 98.56 93.98 91.28 91.37 88.92
Retaining Wall (Ave) 91.76 89.38 88.39 85.90 85.41 84.88
Tunnel (Ave) 82.69 83.34 92.60 93.46 92.65 89.52
Vault (Ave) 99.00 99.00 99.00
BC
I C
riti
cal
Basement (Crit) 100.00 100.00
Bridge (Crit) 73.39 74.94 78.59 72.62 70.92 72.21
Culvert (Crit) 92.24 92.35 85.23 86.42 84.22 84.56
Footbridge (Crit) 85.81 88.48 83.45 86.91 86.73 85.54
Pedestrian Subway (Crit)
83.84 83.98 84.36 88.49 87.74 84.28
Pipe Subway (Crit) 99.53 98.51 90.60 85.26 85.15 84.12
Retaining Wall (Crit) 97.81 98.13 93.93 90.81 90.16 89.11
Tunnel (Crit) 79.89 79.88 93.68 95.47 93.20 86.02
Vault (Crit) 100.00 100.00 100.00

BCI PROJECT SIX YEAR REPORT
September 2010 20 BCI Study_Final.doc
50
55
60
65
70
75
80
85
90
95
100
2003-04 2004-05 2005-06 2006-07 2007-08 2008-09
BC
I S
co
re
Year
Change in BCI (average) Score with Time
Basement (Ave) Bridge (Ave) Culvert (Ave)
Footbridge (Ave) Pedestrian Subway (Ave) Pipe Subway (Ave)
Retaining Wall (Ave) Tunnel (Ave) Vault (Ave)
Figure 5: Trend of BCI (average) over the 6 year Period
Figure 5 present the change in BCI average scores, for each structure type, over the six year period. The figure indicates that the BCI average for the different structure types has been above 80 throughout the six year period. The increment and decrement in the values during the six year period can be attributed, but not limited to:
• Improvement in individual structure scores due to maintenance and treatment of structures;
• Deterioration of structures due to little or no maintenance;
• Demolition/De-commissioning of some structures in the stock;
• Addition of new structures to the stock.
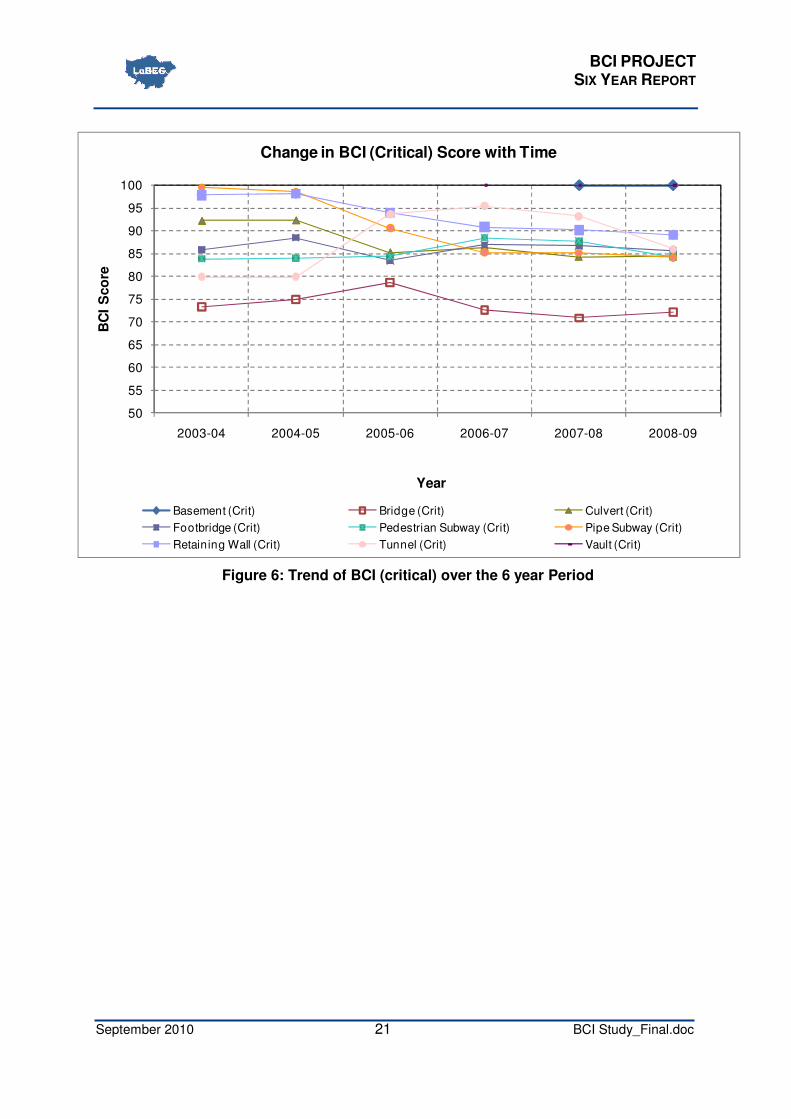
Figure 6 presents the change in BCI critical scores, for each of the structure type, over the six year period. The figure indicates that the BCI critical for the different structure types has been above 80, for all structure types except Bridges that have a critical score below 75, throughout the six year period.
Appendix G1 presents the change in BCI scores over the six year period separately for each structure type.
An interpretation of these results is presented in section 6.5.
BCI PROJECT SIX YEAR REPORT
September 2010 21 BCI Study_Final.doc
50
55
60
65
70
75
80
85
90
95
100
2003-04 2004-05 2005-06 2006-07 2007-08 2008-09
BC
I S
co
re
Year
Change in BCI (Critical) Score with Time
Basement (Crit) Bridge (Crit) Culvert (Crit)
Footbridge (Crit) Pedestrian Subway (Crit) Pipe Subway (Crit)
Retaining Wall (Crit) Tunnel (Crit) Vault (Crit)
Figure 6: Trend of BCI (critical) over the 6 year Period
BCI PROJECT SIX YEAR REPORT
September 2010 22 BCI Study_Final.doc
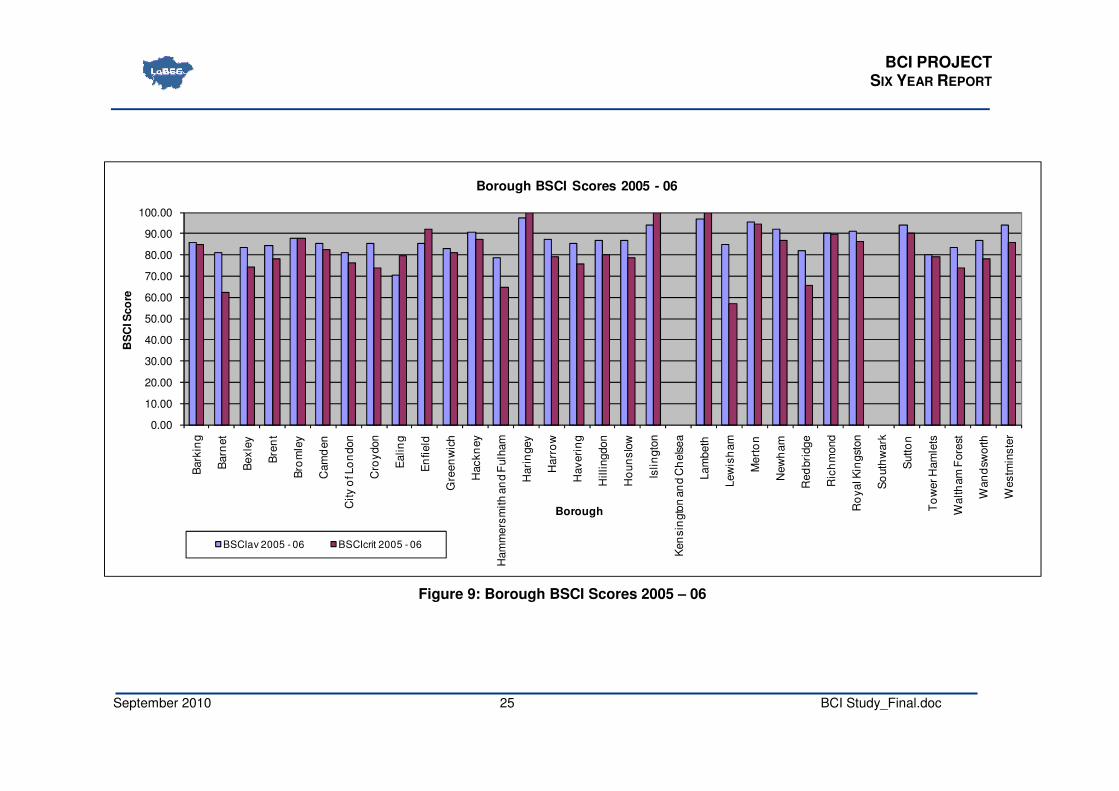
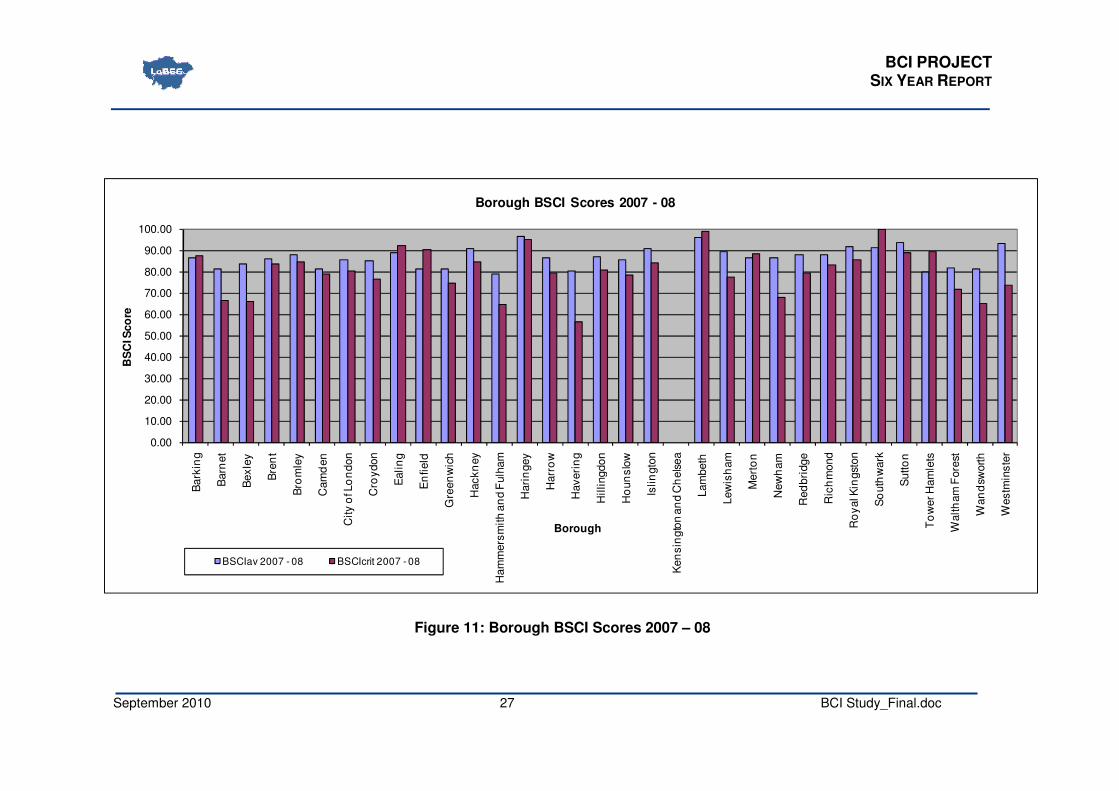
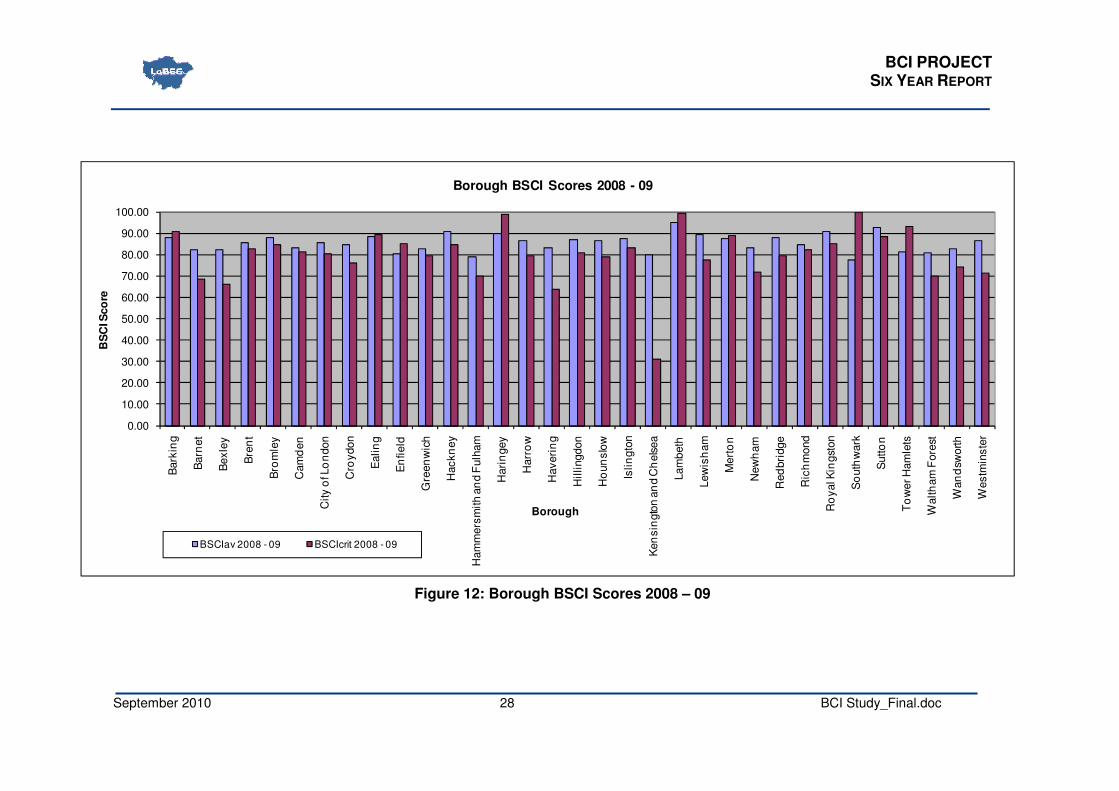
6.3 Stock Condition Indicators for Boroughs
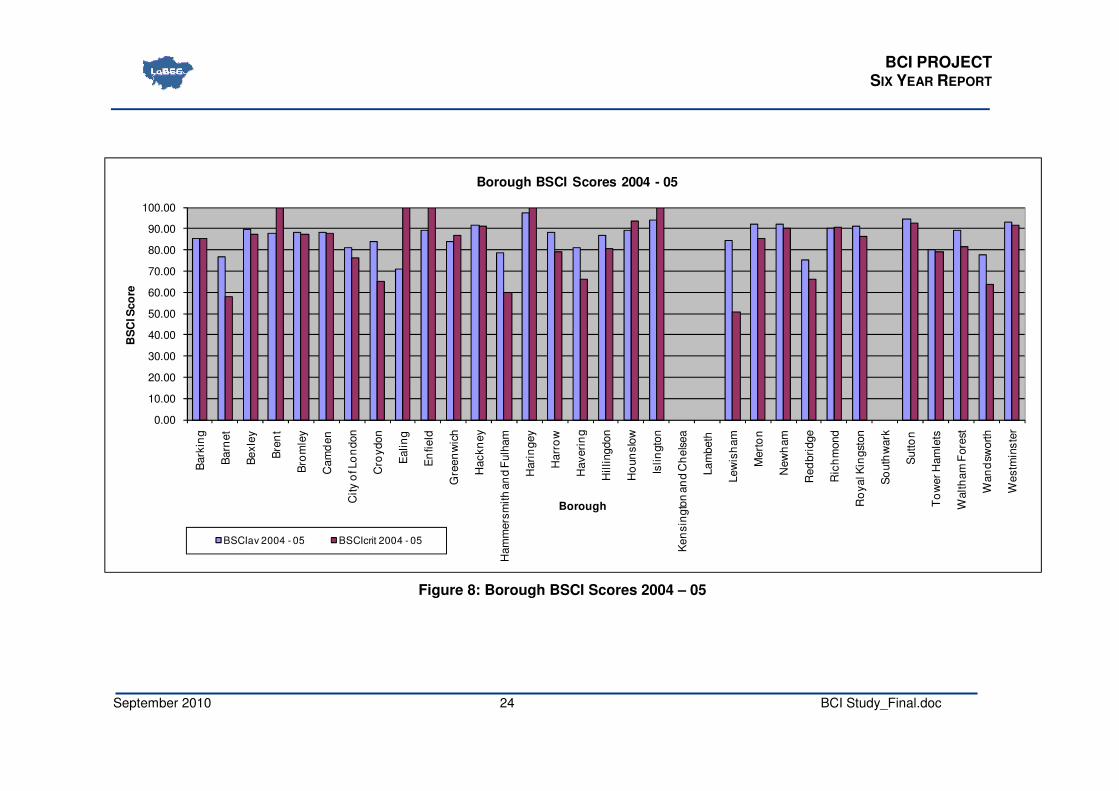
Figure 7 - Figure 12 present the BSCI average and critical scores for each of the Boroughs from 2003 – 04 to 2008 – 09, respectively.
The figures indicate that:
• In 2003 – 04, no BSCI scores have been evaluated for eight boroughs, i.e. Brent, Islington, Kensington and Chelsea, Lambeth, Royal Kingston, Southwark, Tower Hamlets and Training. This could be attributed to no inspections being undertaken and thus inspection data not being available.
• The average BSCI for the majority of the Boroughs, throughout the six year period, has been above 80.
• The critical BSCI for most of the Boroughs, throughout the six year period, has been above 70.
Appendix G2 presents the Average and Critical BSCI scores, for each Borough, for each year within the six year period. Appendix G3 presents the change in the Average and Critical BSCI scores, for each Borough, over the six year period.
An interpretation of these results is presented in section 6.5.

BCI PROJECT SIX YEAR REPORT
September 2010 23 BCI Study_Final.doc
0.00
10.00
20.00
30.00
40.00
50.00
60.00
70.00
80.00
90.00
100.00
Bark
ing
Barn
et
Bexle
y
Bre
nt
Bro
mle
y
Cam
den
City o
f Lo
ndon
Cro
ydon
Ealin
g
En
field
Gre
en
wic
h
Hackn
ey
Ham
mers
mith a
nd F
ulh
am
Hari
ngey
Harr
ow
Haveri
ng
Hillingdon
Ho
un
slo
w
Islin
gto
n
Ken
sin
gto
n a
nd C
hels
ea
Lam
beth
Lew
ish
am
Mert
on
New
ham
Red
bri
dge
Ric
hm
ond
Ro
yal K
ingst
on
So
uth
wark
Sutto
n
To
wer H
am
lets
Walth
am
Fore
st
Wan
dsw
orth
Westm
inste
r
BS
CI S
co
re
Borough
Borough BSCI Scores 2003 - 04
BSCIav 2003 - 04 BSCIcrit 2003 - 04
Figure 7: Borough BSCI Scores 2003 – 04
BCI PROJECT SIX YEAR REPORT
September 2010 24 BCI Study_Final.doc
0.00
10.00
20.00
30.00
40.00
50.00
60.00
70.00
80.00
90.00
100.00B
ark
ing
Barn
et
Bexle
y
Bre
nt
Bro
mle
y
Cam
den
City o
f Lo
ndon
Cro
ydon
Ealin
g
En
field
Gre
en
wic
h
Hackn
ey
Ham
mers
mith a
nd F
ulh
am
Hari
ngey
Harr
ow
Haveri
ng
Hillingdon
Ho
un
slo
w
Islin
gto
n
Ken
sin
gto
n a
nd C
hels
ea
Lam
beth
Lew
ish
am
Mert
on
New
ham
Red
bri
dge
Ric
hm
ond
Ro
yal K
ingst
on
So
uth
wark
Sutto
n
To
wer H
am
lets
Walth
am
Fore
st
Wan
dsw
orth
Westm
inste
r
BS
CI S
co
re
Borough
Borough BSCI Scores 2004 - 05
BSCIav 2004 - 05 BSCIcrit 2004 - 05
Figure 8: Borough BSCI Scores 2004 – 05
BCI PROJECT SIX YEAR REPORT
September 2010 25 BCI Study_Final.doc
0.00
10.00
20.00
30.00
40.00
50.00
60.00
70.00
80.00
90.00
100.00
Bark
ing
Barn
et
Bexle
y
Bre
nt
Bro
mle
y
Cam
den
City o
f Lo
ndon
Cro
ydon
Ealin
g
En
field
Gre
en
wic
h
Hackn
ey
Ham
mers
mith a
nd F
ulh
am
Hari
ngey
Harr
ow
Haveri
ng
Hillingdon
Ho
un
slo
w
Islin
gto
n
Ken
sin
gto
n a
nd C
hels
ea
Lam
beth
Lew
ish
am
Mert
on
New
ham
Red
bri
dge
Ric
hm
ond
Ro
yal K
ingst
on
So
uth
wark
Sutto
n
To
wer H
am
lets
Walth
am
Fore
st
Wan
dsw
orth
Westm
inste
r
BS
CI S
co
re
Borough
Borough BSCI Scores 2005 - 06
BSCIav 2005 - 06 BSCIcrit 2005 - 06
Figure 9: Borough BSCI Scores 2005 – 06

BCI PROJECT SIX YEAR REPORT
September 2010 26 BCI Study_Final.doc
0.00
10.00
20.00
30.00
40.00
50.00
60.00
70.00
80.00
90.00
100.00
Bark
ing
Barn
et
Bexle
y
Bre
nt
Bro
mle
y
Cam
de
n
Cit
y o
f Lo
ndon
Cro
yd
on
Ealin
g
En
fie
ld
Gre
en
wic
h
Hack
ne
y
Ha
mm
ers
mith
an
d F
ulh
am
Hari
ng
ey
Harr
ow
Have
rin
g
Hillin
gdon
Ho
un
slo
w
Isli
ngto
n
Ken
sin
gto
n a
nd
Ch
els
ea
La
mbe
th
Lew
ish
am
Mert
on
New
ham
Red
bri
dge
Ric
hm
ond
Ro
yal K
ing
ston
So
uth
wa
rk
Sutto
n
To
wer
Ham
lets
Walth
am
Fore
st
Wan
dsw
orth
Westm
ins
ter
BS
CI S
co
re
Borough
Borough BSCI Scores 2006 - 07
BSCIav 2006 - 07 BSCIcrit 2006 - 07
Figure 10: Borough BSCI Scores 2006 – 07
BCI PROJECT SIX YEAR REPORT
September 2010 27 BCI Study_Final.doc
0.00
10.00
20.00
30.00
40.00
50.00
60.00
70.00
80.00
90.00
100.00
Ba
rkin
g
Barn
et
Bex
ley
Bre
nt
Bro
mle
y
Cam
den
City o
f Lo
nd
on
Cro
ydon
Eali
ng
En
field
Gre
en
wic
h
Hackn
ey
Ha
mm
ers
mith
an
d F
ulh
am
Hari
ngey
Harr
ow
Haveri
ng
Hillingdo
n
Ho
un
slo
w
Islin
gto
n
Ken
sin
gto
n a
nd C
hels
ea
Lam
beth
Lew
ish
am
Mert
on
New
ha
m
Red
bri
dge
Ric
hm
ond
Ro
yal K
ingst
on
So
uth
wark
Su
tto
n
To
wer H
am
lets
Walth
am
Fore
st
Wan
dsw
orth
Westm
inste
r
BS
CI S
co
re
Borough
Borough BSCI Scores 2007 - 08
BSCIav 2007 - 08 BSCIcrit 2007 - 08
Figure 11: Borough BSCI Scores 2007 – 08
BCI PROJECT SIX YEAR REPORT
September 2010 28 BCI Study_Final.doc
0.00
10.00
20.00
30.00
40.00
50.00
60.00
70.00
80.00
90.00
100.00
Bark
ing
Barn
et
Bexle
y
Bre
nt
Bro
mle
y
Cam
den
City o
f Lo
ndon
Cro
ydon
Ealin
g
En
fie
ld
Gre
en
wic
h
Hackn
ey
Ham
mers
mith a
nd F
ulh
am
Hari
ngey
Harr
ow
Haveri
ng
Hillingdon
Ho
un
slo
w
Islin
gto
n
Ken
sin
gto
n a
nd C
hels
ea
Lam
beth
Lew
ish
am
Mert
on
New
ham
Red
bri
dge
Ric
hm
ond
Ro
yal K
ingst
on
So
uth
wark
Sutto
n
To
we
r H
am
lets
Walth
am
Fore
st
Wan
dsw
orth
Westm
inste
r
BS
CI S
co
re
Borough
Borough BSCI Scores 2008 - 09
BSCIav 2008 - 09 BSCIcrit 2008 - 09
Figure 12: Borough BSCI Scores 2008 – 09
BCI PROJECT SIX YEAR REPORT
September 2010 29 BCI Study_Final.doc
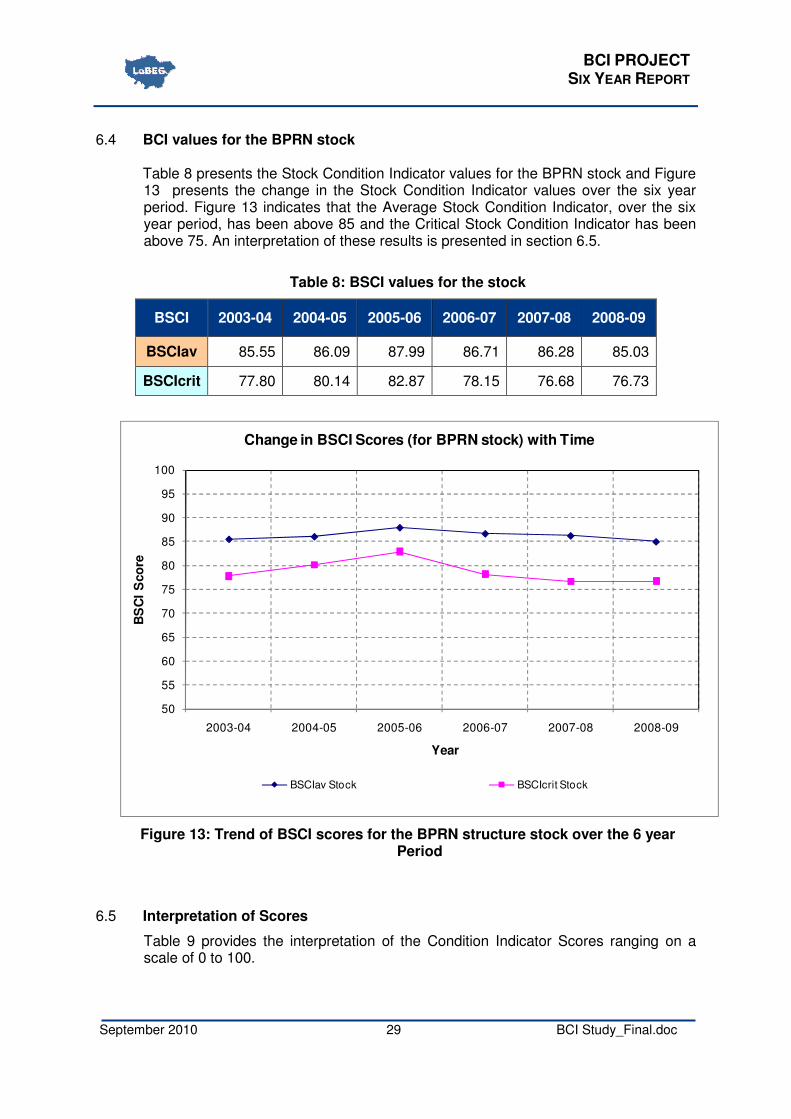
6.4 BCI values for the BPRN stock
Table 8 presents the Stock Condition Indicator values for the BPRN stock and Figure 13 presents the change in the Stock Condition Indicator values over the six year period. Figure 13 indicates that the Average Stock Condition Indicator, over the six year period, has been above 85 and the Critical Stock Condition Indicator has been above 75. An interpretation of these results is presented in section 6.5.
Table 8: BSCI values for the stock
BSCI 2003-04 2004-05 2005-06 2006-07 2007-08 2008-09
BSCIav 85.55 86.09 87.99 86.71 86.28 85.03
BSCIcrit 77.80 80.14 82.87 78.15 76.68 76.73
50
55
60
65
70
75
80
85
90
95
100
2003-04 2004-05 2005-06 2006-07 2007-08 2008-09
BS
CI
Sco
re
Year
Change in BSCI Scores (for BPRN stock) with Time
BSCIav Stock BSCIcrit Stock
Figure 13: Trend of BSCI scores for the BPRN structure stock over the 6 year Period
6.5 Interpretation of Scores
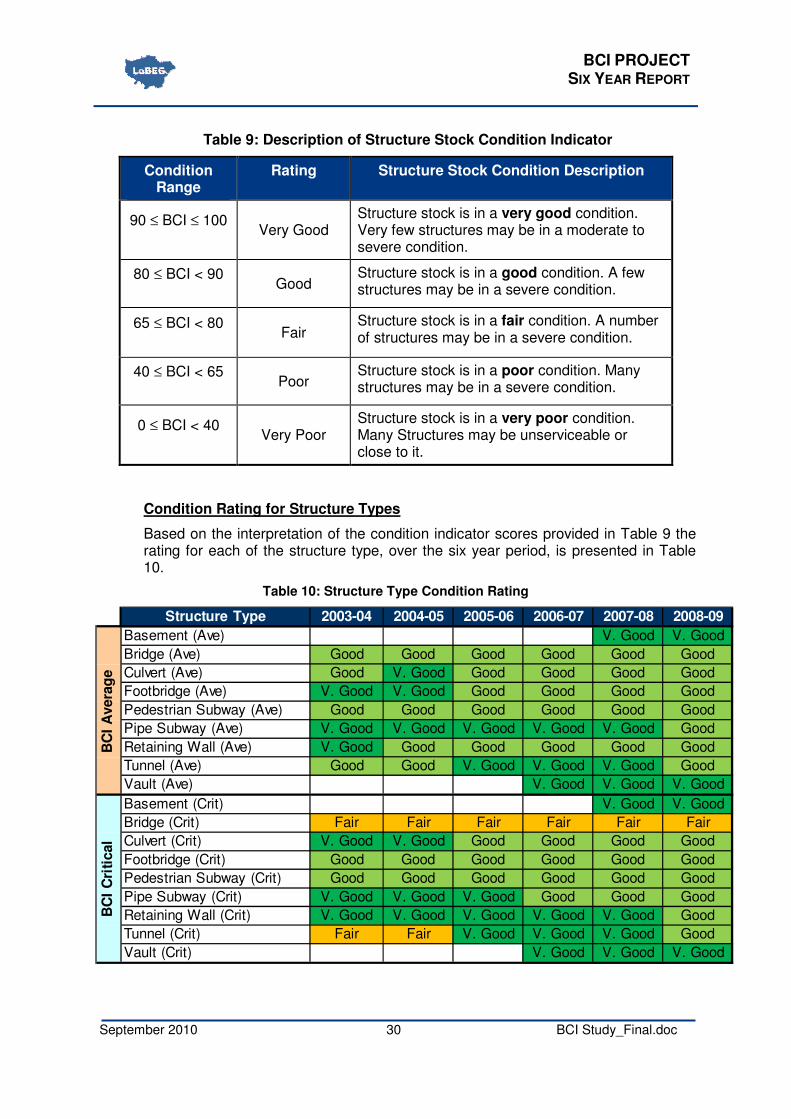
Table 9 provides the interpretation of the Condition Indicator Scores ranging on a scale of 0 to 100.
BCI PROJECT SIX YEAR REPORT
September 2010 30 BCI Study_Final.doc
Table 9: Description of Structure Stock Condition Indicator
Condition Range
Rating Structure Stock Condition Description
90 ≤ BCI ≤ 100
Very Good
Structure stock is in a very good condition. Very few structures may be in a moderate to severe condition.
80 ≤ BCI < 90
Good
Structure stock is in a good condition. A few structures may be in a severe condition.
65 ≤ BCI < 80
Fair
Structure stock is in a fair condition. A number of structures may be in a severe condition.
40 ≤ BCI < 65
Poor
Structure stock is in a poor condition. Many structures may be in a severe condition.
0 ≤ BCI < 40
Very Poor
Structure stock is in a very poor condition. Many Structures may be unserviceable or close to it.
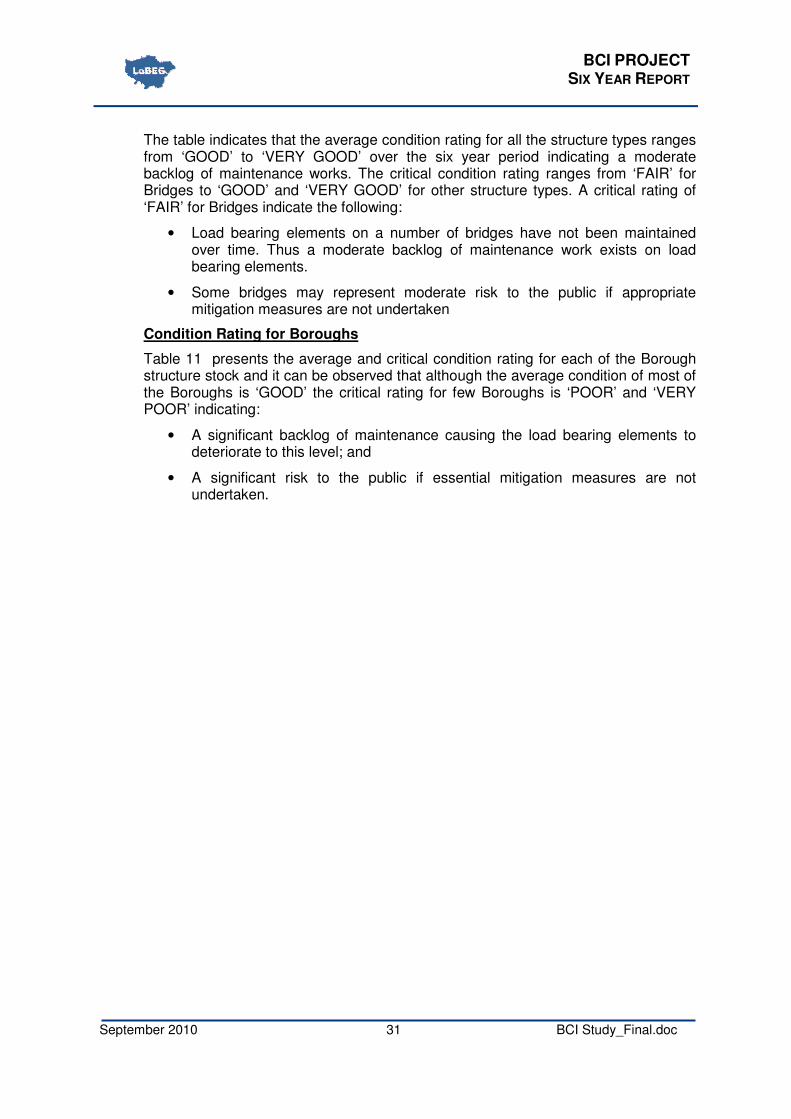
Condition Rating for Structure Types
Based on the interpretation of the condition indicator scores provided in Table 9 the rating for each of the structure type, over the six year period, is presented in Table 10.
Table 10: Structure Type Condition Rating
Structure Type 2003-04 2004-05 2005-06 2006-07 2007-08 2008-09
Basement (Ave) V. Good V. Good
Bridge (Ave) Good Good Good Good Good Good
Culvert (Ave) Good V. Good Good Good Good Good
Footbridge (Ave) V. Good V. Good Good Good Good Good
Pedestrian Subway (Ave) Good Good Good Good Good Good
Pipe Subway (Ave) V. Good V. Good V. Good V. Good V. Good Good
Retaining Wall (Ave) V. Good Good Good Good Good Good
Tunnel (Ave) Good Good V. Good V. Good V. Good Good
Vault (Ave) V. Good V. Good V. Good
Basement (Crit) V. Good V. Good
Bridge (Crit) Fair Fair Fair Fair Fair Fair
Culvert (Crit) V. Good V. Good Good Good Good Good
Footbridge (Crit) Good Good Good Good Good Good
Pedestrian Subway (Crit) Good Good Good Good Good Good
Pipe Subway (Crit) V. Good V. Good V. Good Good Good Good
Retaining Wall (Crit) V. Good V. Good V. Good V. Good V. Good Good
Tunnel (Crit) Fair Fair V. Good V. Good V. Good Good
Vault (Crit) V. Good V. Good V. Good
BC
I A
vera
ge
BC
I C
riti
cal
BCI PROJECT SIX YEAR REPORT
September 2010 31 BCI Study_Final.doc
The table indicates that the average condition rating for all the structure types ranges from ‘GOOD’ to ‘VERY GOOD’ over the six year period indicating a moderate backlog of maintenance works. The critical condition rating ranges from ‘FAIR’ for Bridges to ‘GOOD’ and ‘VERY GOOD’ for other structure types. A critical rating of ‘FAIR’ for Bridges indicate the following:
• Load bearing elements on a number of bridges have not been maintained over time. Thus a moderate backlog of maintenance work exists on load bearing elements.
• Some bridges may represent moderate risk to the public if appropriate mitigation measures are not undertaken
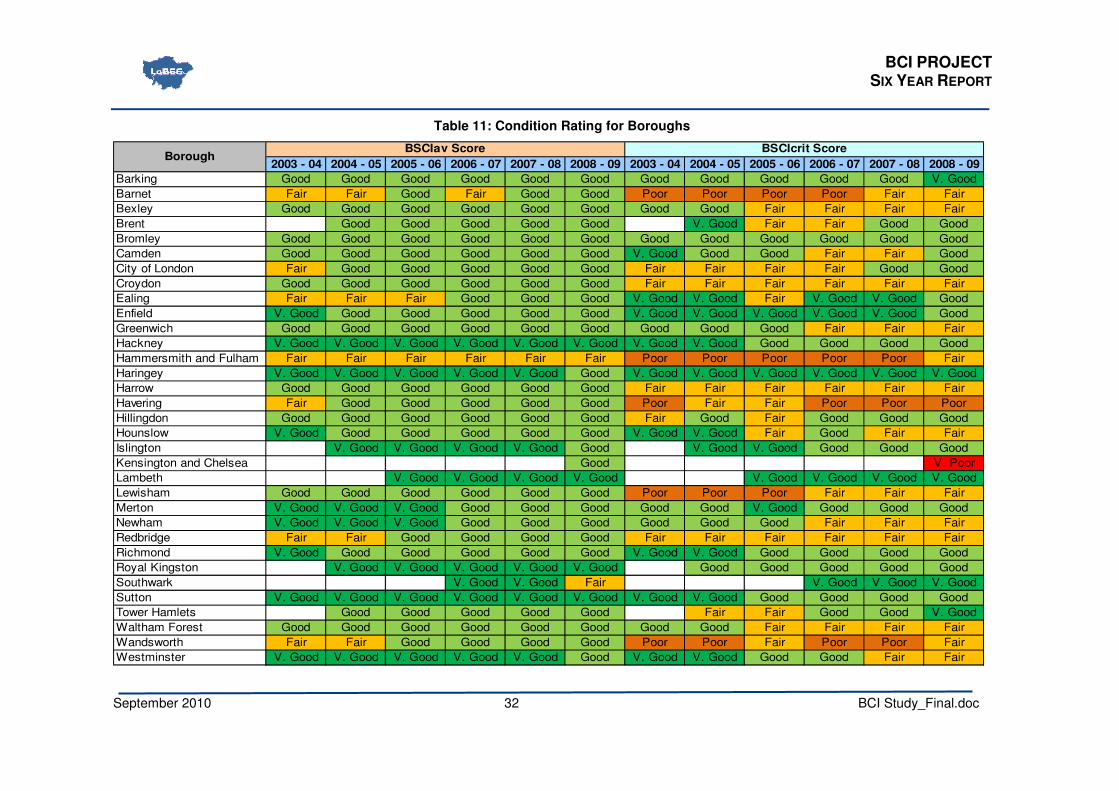
Condition Rating for Boroughs
Table 11 presents the average and critical condition rating for each of the Borough structure stock and it can be observed that although the average condition of most of the Boroughs is ‘GOOD’ the critical rating for few Boroughs is ‘POOR’ and ‘VERY POOR’ indicating:
• A significant backlog of maintenance causing the load bearing elements to deteriorate to this level; and
• A significant risk to the public if essential mitigation measures are not undertaken.
BCI PROJECT SIX YEAR REPORT
September 2010 32 BCI Study_Final.doc
Table 11: Condition Rating for Boroughs
2003 - 04 2004 - 05 2005 - 06 2006 - 07 2007 - 08 2008 - 09 2003 - 04 2004 - 05 2005 - 06 2006 - 07 2007 - 08 2008 - 09
Barking Good Good Good Good Good Good Good Good Good Good Good V. Good
Barnet Fair Fair Good Fair Good Good Poor Poor Poor Poor Fair Fair
Bexley Good Good Good Good Good Good Good Good Fair Fair Fair Fair
Brent Good Good Good Good Good V. Good Fair Fair Good Good
Bromley Good Good Good Good Good Good Good Good Good Good Good Good
Camden Good Good Good Good Good Good V. Good Good Good Fair Fair Good
City of London Fair Good Good Good Good Good Fair Fair Fair Fair Good Good
Croydon Good Good Good Good Good Good Fair Fair Fair Fair Fair Fair
Ealing Fair Fair Fair Good Good Good V. Good V. Good Fair V. Good V. Good Good
Enfield V. Good Good Good Good Good Good V. Good V. Good V. Good V. Good V. Good Good
Greenwich Good Good Good Good Good Good Good Good Good Fair Fair Fair
Hackney V. Good V. Good V. Good V. Good V. Good V. Good V. Good V. Good Good Good Good Good
Hammersmith and Fulham Fair Fair Fair Fair Fair Fair Poor Poor Poor Poor Poor Fair
Haringey V. Good V. Good V. Good V. Good V. Good Good V. Good V. Good V. Good V. Good V. Good V. Good
Harrow Good Good Good Good Good Good Fair Fair Fair Fair Fair Fair
Havering Fair Good Good Good Good Good Poor Fair Fair Poor Poor Poor
Hillingdon Good Good Good Good Good Good Fair Good Fair Good Good Good
Hounslow V. Good Good Good Good Good Good V. Good V. Good Fair Good Fair Fair
Islington V. Good V. Good V. Good V. Good Good V. Good V. Good Good Good Good
Kensington and Chelsea Good V. Poor
Lambeth V. Good V. Good V. Good V. Good V. Good V. Good V. Good V. Good
Lewisham Good Good Good Good Good Good Poor Poor Poor Fair Fair Fair
Merton V. Good V. Good V. Good Good Good Good Good Good V. Good Good Good Good
Newham V. Good V. Good V. Good Good Good Good Good Good Good Fair Fair Fair
Redbridge Fair Fair Good Good Good Good Fair Fair Fair Fair Fair Fair
Richmond V. Good Good Good Good Good Good V. Good V. Good Good Good Good Good
Royal Kingston V. Good V. Good V. Good V. Good V. Good Good Good Good Good Good
Southwark V. Good V. Good Fair V. Good V. Good V. Good
Sutton V. Good V. Good V. Good V. Good V. Good V. Good V. Good V. Good Good Good Good Good
Tower Hamlets Good Good Good Good Good Fair Fair Good Good V. Good
Waltham Forest Good Good Good Good Good Good Good Good Fair Fair Fair Fair
Wandsworth Fair Fair Good Good Good Good Poor Poor Fair Poor Poor Fair
Westminster V. Good V. Good V. Good V. Good V. Good Good V. Good V. Good Good Good Fair Fair
BSCIcrit ScoreBorough
BSCIav Score
BCI PROJECT SIX YEAR REPORT
September 2010 33 BCI Study_Final.doc
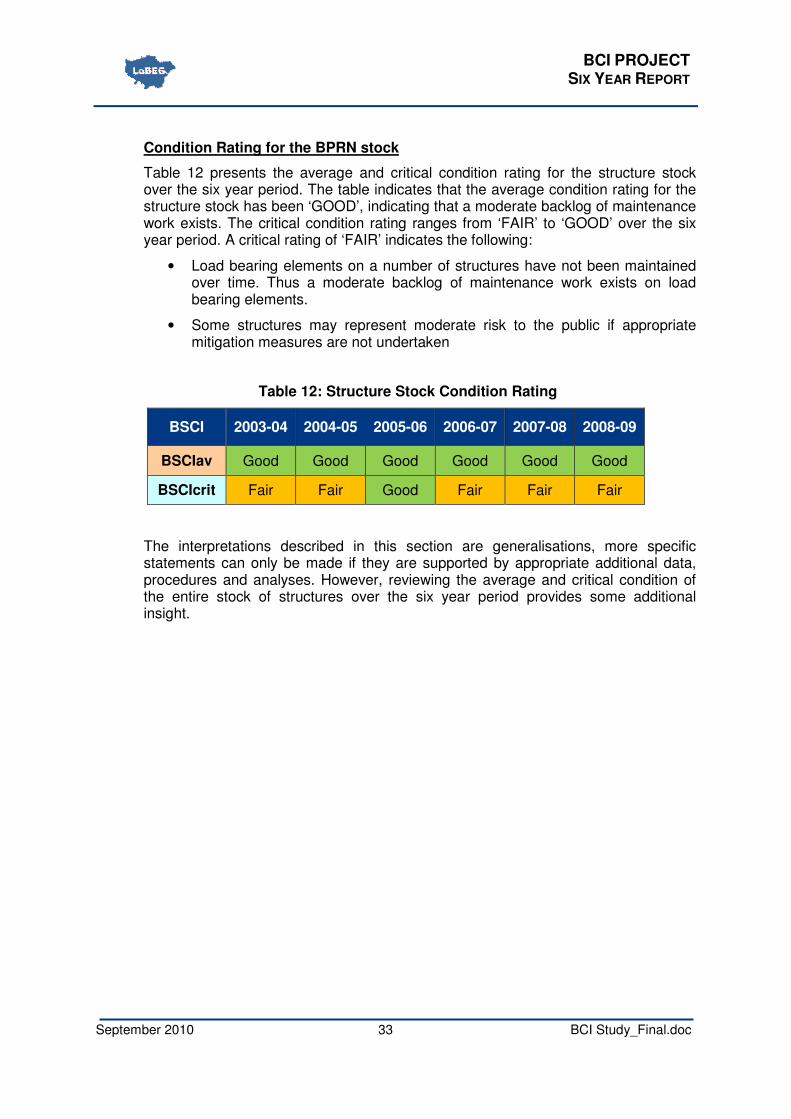
Condition Rating for the BPRN stock
Table 12 presents the average and critical condition rating for the structure stock over the six year period. The table indicates that the average condition rating for the structure stock has been ‘GOOD’, indicating that a moderate backlog of maintenance work exists. The critical condition rating ranges from ‘FAIR’ to ‘GOOD’ over the six year period. A critical rating of ‘FAIR’ indicates the following:
• Load bearing elements on a number of structures have not been maintained over time. Thus a moderate backlog of maintenance work exists on load bearing elements.
• Some structures may represent moderate risk to the public if appropriate mitigation measures are not undertaken
Table 12: Structure Stock Condition Rating
BSCI 2003-04 2004-05 2005-06 2006-07 2007-08 2008-09
BSCIav Good Good Good Good Good Good
BSCIcrit Fair Fair Good Fair Fair Fair
The interpretations described in this section are generalisations, more specific statements can only be made if they are supported by appropriate additional data, procedures and analyses. However, reviewing the average and critical condition of the entire stock of structures over the six year period provides some additional insight.
BCI PROJECT SIX YEAR REPORT
September 2010 34 BCI Study_Final.doc
0
30
60
90
120
150
180
210
240
270
300
330
2003-04 2004-05 2005-06 2006-07 2007-08 2008-09
Nu
mb
er
of
Str
uc
ture
s
Year
Total Stock Condition (BCIav)
Very Poor Poor Fair Good Very Good
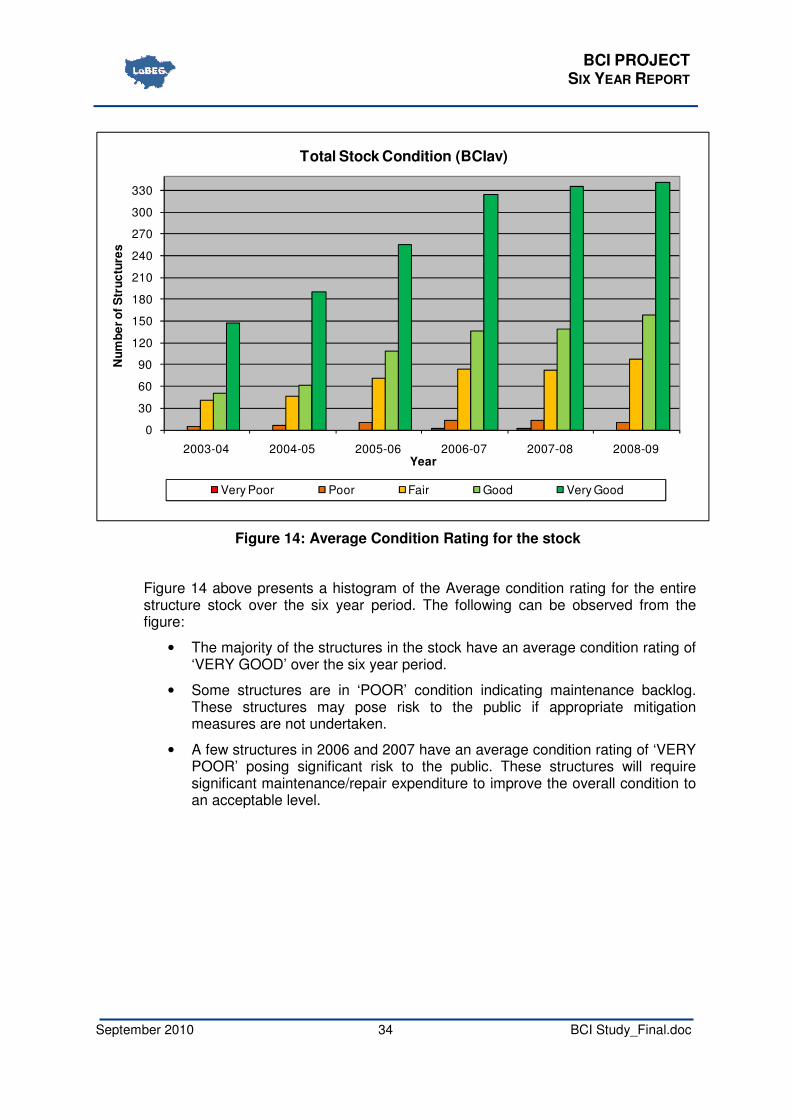
Figure 14: Average Condition Rating for the stock
Figure 14 above presents a histogram of the Average condition rating for the entire structure stock over the six year period. The following can be observed from the figure:
• The majority of the structures in the stock have an average condition rating of ‘VERY GOOD’ over the six year period.
• Some structures are in ‘POOR’ condition indicating maintenance backlog. These structures may pose risk to the public if appropriate mitigation measures are not undertaken.
• A few structures in 2006 and 2007 have an average condition rating of ‘VERY POOR’ posing significant risk to the public. These structures will require significant maintenance/repair expenditure to improve the overall condition to an acceptable level.
BCI PROJECT SIX YEAR REPORT
September 2010 35 BCI Study_Final.doc
0
30
60
90
120
150
180
210
240
270
300
330
2003-04 2004-05 2005-06 2006-07 2007-08 2008-09
Nu
mb
er
of
Str
uc
ture
s
Year
Total Stock Condition (BCIcrit)
Very Poor Poor Fair Good Very Good
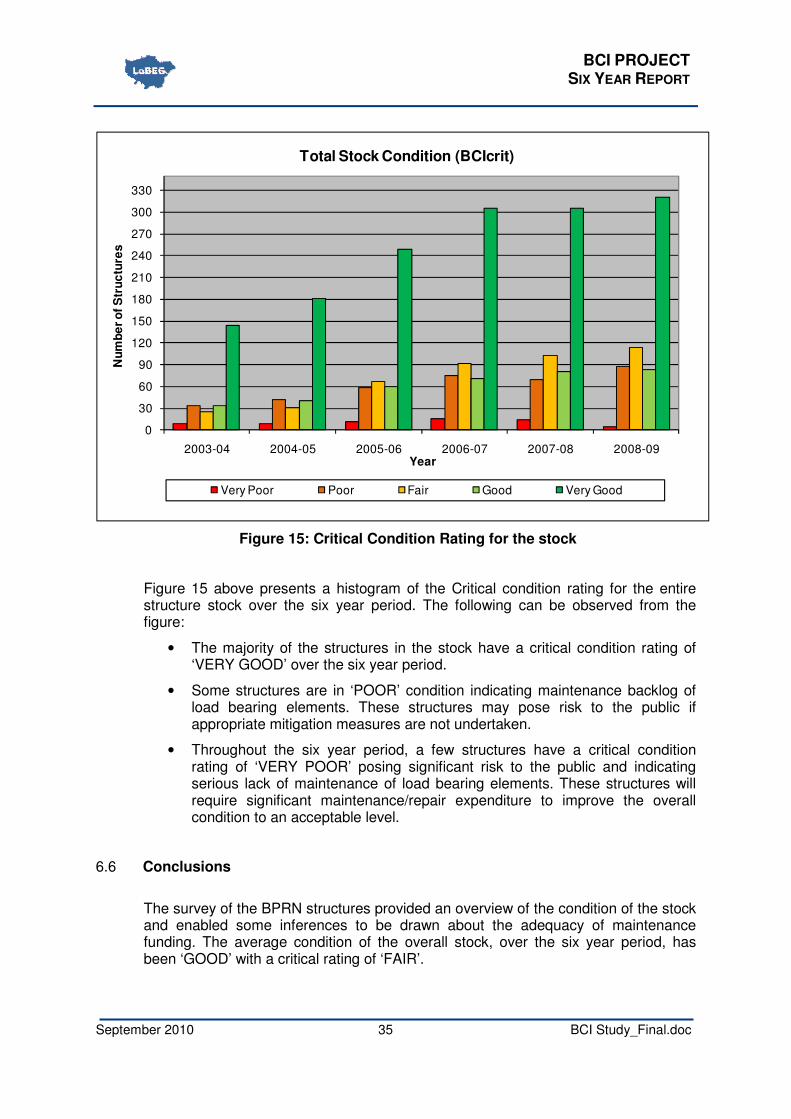
Figure 15: Critical Condition Rating for the stock
Figure 15 above presents a histogram of the Critical condition rating for the entire structure stock over the six year period. The following can be observed from the figure:
• The majority of the structures in the stock have a critical condition rating of ‘VERY GOOD’ over the six year period.
• Some structures are in ‘POOR’ condition indicating maintenance backlog of load bearing elements. These structures may pose risk to the public if appropriate mitigation measures are not undertaken.
• Throughout the six year period, a few structures have a critical condition rating of ‘VERY POOR’ posing significant risk to the public and indicating serious lack of maintenance of load bearing elements. These structures will require significant maintenance/repair expenditure to improve the overall condition to an acceptable level.
6.6 Conclusions
The survey of the BPRN structures provided an overview of the condition of the stock and enabled some inferences to be drawn about the adequacy of maintenance funding. The average condition of the overall stock, over the six year period, has been ‘GOOD’ with a critical rating of ‘FAIR’.
BCI PROJECT SIX YEAR REPORT
September 2010 36 BCI Study_Final.doc
A review of the individual structures in the stock indicated that some structures and load bearing elements have deteriorated to a level significantly below acceptable standards i.e. a condition rating of ‘POOR’/’VERY POOR’. Structures/load bearing elements should not be allowed to deteriorate to this level because this:
• Increases risk to the public;
• Requires risk to be mitigated by temporary measures or essential reactive maintenance in order to maintain safety and serviceability;
• Necessitates funding to be spent on temporary measures or essential reactive maintenance at the expense of preventative maintenance in other areas, thus perpetuating a cycle of deterioration if not arrested by appropriate funding;
• Increases Whole Life Costs when compared to an optimal preventative maintenance approach.
The condition of load bearing elements, and the associated implications on safety and functionality of the BPRN stock, must be monitored closely. Improving the condition of these elements will dominate maintenance expenditure and the implications of this on the remainder of the stock condition must be carefully considered.
Structures currently classified as being in Good and Very Good condition still require appropriate maintenance and should be managed to retain high condition scores.
BCI PROJECT SIX YEAR REPORT
September 2010 37 BCI Study_Final.doc
7 Maintenance Management and Planning
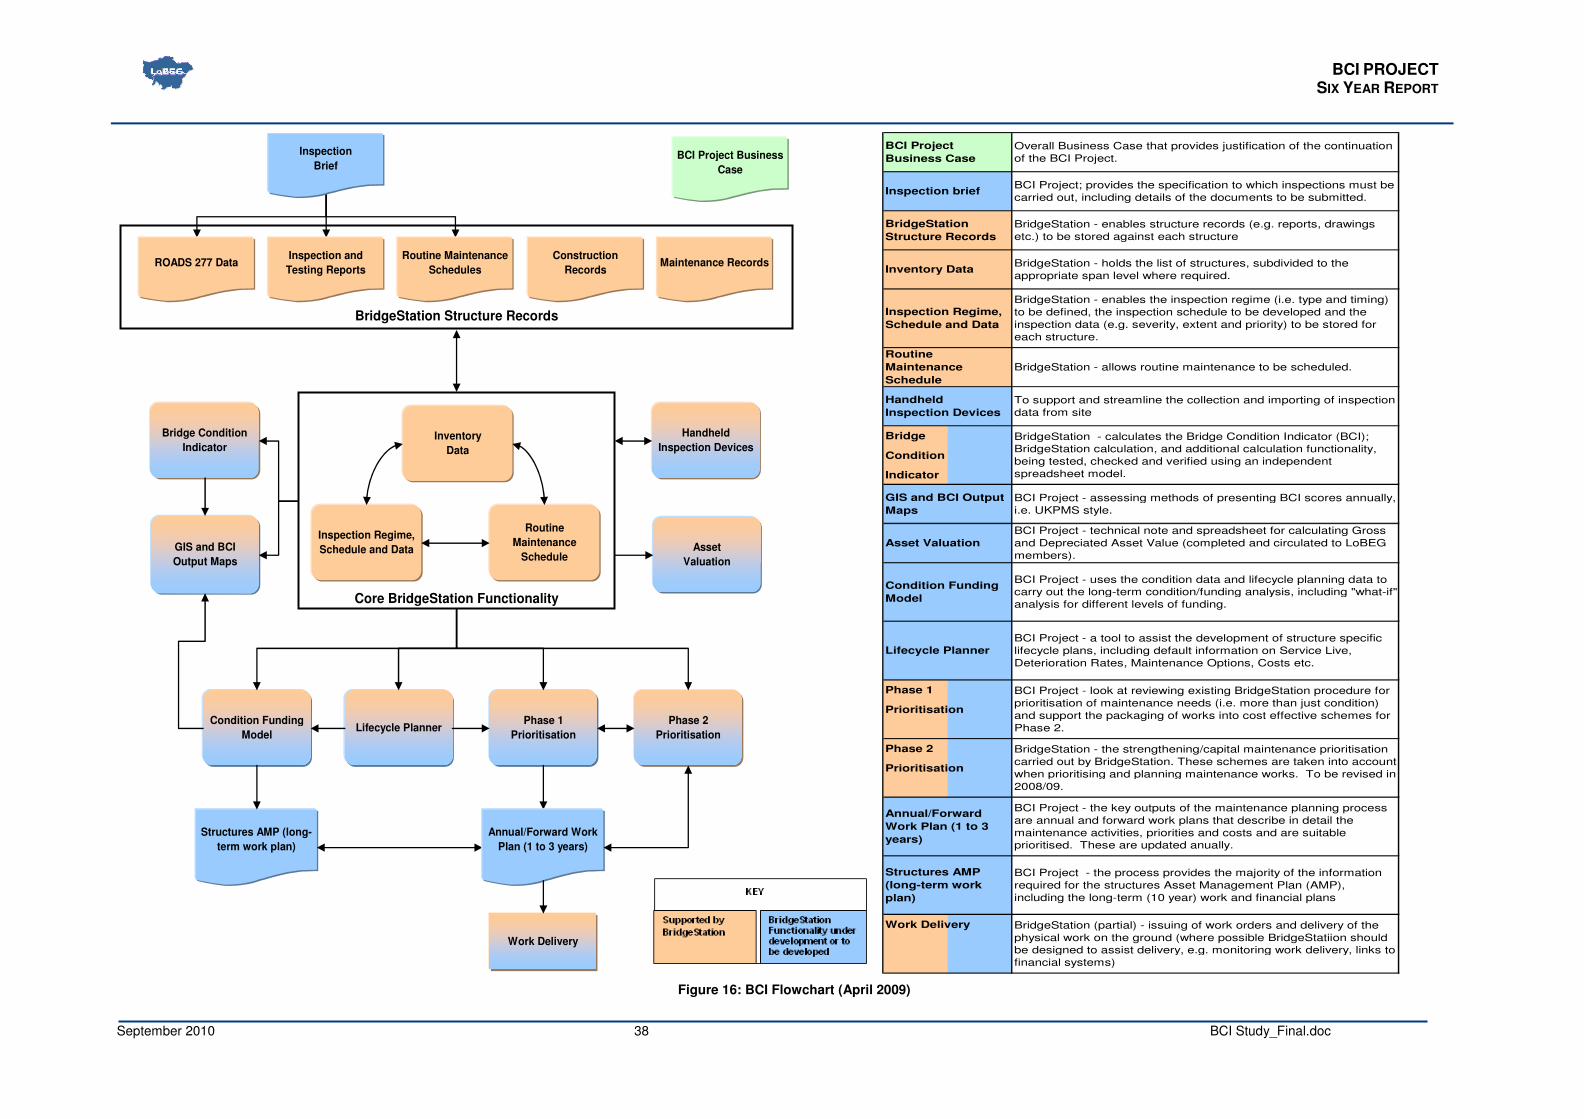
It was acknowledged by LoBEG and TfL that the evaluation of Condition Indicators alone does not identify, or provide justification for appropriate levels of maintenance funding for the BPRN structures. Therefore LoBEG/TfL have developed various tools/processes, described in Figure 16, to:
• Enable best use of the inspection data;
• Assist Bridge Managers to determine and justify appropriate levels of maintenance funding.
• Support effective management of highway structures, i.e. maintenance management and planning processes.
In addition to the tools/processes, LoBEG and TfL have developed a Bridge Management System, ‘BridgeStation’, which is used by all 33 London Boroughs and TfL. This provides a central database to assist all Boroughs in carrying out their maintenance management functions. In addition, BridgeStation is used for the bidding and allocation of Capital funding from TfL to the Boroughs.
Initially, BridgeStation was used as a data depository, however with time; the functionality of BridgeStation has been extended to include a range of additional modules, such as the BCI module, and LoBEG and TfL intend to extend it further to provide additional tools to assist managers in respect of Asset Management., e.g. Lifecycle Planning, Maintenance Prioritisation, etc.
However, it is crucial to understand that all the aforementioned systems, tools/processes are underpinned by consistent and good quality inventory and condition data, i.e. up-to-date and consistent inventory, inspection and assessment data is imperative to support the application of a robust Maintenance Management and Planning Process.
NOTE: The tools/processes that are currently supported by BridgeStation have been colour coded in tan in Figure 16 and those which are currently under development, or will be developed, have been colour coded in blue in Figure 16. The contents of this figure are regularly reviewed and updated; new items are added or removed as appropriate.
BCI PROJECT
SIX YEAR REPORT
September 2010 38 BCI Study_Final.doc
BridgeStation Structure Records
Core BridgeStation Functionality
Condition Funding
ModelLifecycle Planner
Phase 1
Prioritisation
Inspection Regime,
Schedule and Data Asset
Valuation
GIS and BCI
Output Maps
Structures AMP (long-
term work plan)
Work Delivery
Phase 2
Prioritisation
Annual/Forward Work
Plan (1 to 3 years)
Inventory
Data
Routine
Maintenance
Schedule
Bridge Condition
Indicator
Routine Maintenance
Schedules
Construction
RecordsMaintenance Records
Inspection and
Testing ReportsROADS 277 Data
Inspection
Brief
Handheld
Inspection Devices
BCI Project Business
Case
Bridge
Condition
Indicator
Phase 1
Prioritisation
Phase 2
Prioritisation
Work Delivery
Structures AMP
(long-term work
plan)
BCI Project - the process provides the majority of the information
required for the structures Asset Management Plan (AMP),
including the long-term (10 year) work and financial plans
BridgeStation (partial) - issuing of work orders and delivery of the
physical work on the ground (where possible BridgeStatiion should
be designed to assist delivery, e.g. monitoring work delivery, links to
financial systems)
BCI Project - look at reviewing existing BridgeStation procedure for
prioritisation of maintenance needs (i.e. more than just condition)
and support the packaging of works into cost effective schemes for
Phase 2.
BridgeStation - the strengthening/capital maintenance prioritisation
carried out by BridgeStation. These schemes are taken into account
when prioritising and planning maintenance works. To be revised in
2008/09.
Annual/Forward
Work Plan (1 to 3
years)
BCI Project - the key outputs of the maintenance planning process
are annual and forward work plans that describe in detail the
maintenance activities, priorities and costs and are suitable
prioritised. These are updated anually.
Condition Funding
Model
BCI Project - uses the condition data and lifecycle planning data to
carry out the long-term condition/funding analysis, including "what-if"
analysis for different levels of funding.
Lifecycle Planner
BCI Project - a tool to assist the development of structure specific
lifecycle plans, including default information on Service Live,
Deterioration Rates, Maintenance Options, Costs etc.
GIS and BCI Output
Maps
BCI Project - assessing methods of presenting BCI scores annually,
i.e. UKPMS style.
Asset Valuation
BCI Project - technical note and spreadsheet for calculating Gross
and Depreciated Asset Value (completed and circulated to LoBEG
members).
Handheld
Inspection Devices
To support and streamline the collection and importing of inspection
data from site
BridgeStation - calculates the Bridge Condition Indicator (BCI);
BridgeStation calculation, and additional calculation functionality,
being tested, checked and verified using an independent
spreadsheet model.
Inspection Regime,
Schedule and Data
BridgeStation - enables the inspection regime (i.e. type and timing)
to be defined, the inspection schedule to be developed and the
inspection data (e.g. severity, extent and priority) to be stored for
each structure.
Routine
Maintenance
Schedule
BridgeStation - allows routine maintenance to be scheduled.
BridgeStation
Structure Records
BridgeStation - enables structure records (e.g. reports, drawings
etc.) to be stored against each structure
Inventory DataBridgeStation - holds the list of structures, subdivided to the
appropriate span level where required.
BCI Project
Business Case
Overall Business Case that provides justification of the continuation
of the BCI Project.
Inspection briefBCI Project; provides the specification to which inspections must be
carried out, including details of the documents to be submitted.
Figure 16: BCI Flowchart (April 2009)
BCI PROJECT SIX YEAR REPORT
September 2010 39 BCI Study_Final.doc
Each component of the process, illustrated in Figure 16, represents an aspect of bridge management that makes use of inspection data. The components of this process that have been developed to date are:
• Inspection Brief – comprehensive inspection documentation and brief has been produced that seeks to ensure inspectors provide high quality and consistent data. This helped inform the content of the updated Inspection Manual for Highway Structures[2].
• Bridge Condition Indicator – inspection data is being used to calculate the Bridge Condition Indicator and monitor trends over time (at stock level and for structure groups). The essential input to this is up-to-date inspection data.
• Asset Valuation* – a LoBEG Technical Note has been developed that explains how the CSS Asset Valuation guidance (including Depreciation and Gross Replacement Cost) has been interpreted and applied in London. The Depreciation approach described in the Technical Note is based on the Guidance Document for Highway Infrastructure Asset Valuation [14] published by the Roads Liaison Group and has now been superseded by the CIPFA code of practice [13]. However, the Gross Replacement Cost approach described in the technical note is still current. A MS Excel spreadsheet has been released which is intended to be used for evaluating the Gross Replacement Cost (GRC) only. This spreadsheet has been made available nationally through the CIPFA website.
• Phase 1 Prioritisation* – a LoBEG Good Practice Guide has been developed that explains the maintenance prioritisation process; a MS Excel spreadsheet has been released and the process is currently being programmed into BridgeStation. The key input to this is up-to-date inspection data.
• Condition/Funding Model – a model has been produced that enables LoBEG to predict the long-term maintenance needs for bridges and the impact that different levels of spend have on the BCI. A key input to this model is up-to-date inspection data. The model is intended to form the basis of the toolkit that will be developed by DfT to support Asset Management Planning and Asset Valuation (Depreciation, GRC), in order to comply with the CIPFA code of practice [13].
• Lifecycle Planner* – a LoBEG Good Practice Guide has been developed that explains the lifecycle planning process. A MS Excel spreadsheet has been released that supports detailed whole life cost analysis/comparison for individual bridges or group of bridges3. The inspection data (i.e. inventory and condition) provides the starting point for the WLC analysis.
• Creating Structure Inventories* – Consistency is vital to current and developing Bridge Management Techniques and to ensure that these are suitably supported, it is essential that element inventories are created and maintained in a consistent manner. LoBEG have developed a Good Practice Guide (GPG) that describes the approach for creating consistent element inventories and provides guidance on consistent evaluation of Bridge Condition Indicators.
3 It is considered that bridges with similar characteristics may typically behave in a similar
manner and thus have similar maintenance needs and funding requirements. Therefore the lifecycle planner can be adopted for a group of bridges by developing and adopting a lifecycle plan for a representative bridge from the group.
BCI PROJECT SIX YEAR REPORT
September 2010 40 BCI Study_Final.doc
The aforementioned illustrates the importance of up-to-date inspection data in developing, informing and adopting advanced Bridge Management Techniques and highlights the need for consistent good quality inspection data.
*NOTE: The aforementioned documents and tools have been made available on the LoBEG website and can be obtained through LoBEG package co-ordinator Kevin Andrews. LoBEG members can obtain these directly by logging into the members’ area.
BCI PROJECT SIX YEAR REPORT
September 2010 41 BCI Study_Final.doc
8 Conclusions, Lessons Learned and Recommendations
8.1 Conclusions
The survey of the BPRN structures provided an overview of the condition of the stock and an indication of the maintenance backlog that enabled some inferences to be drawn about the adequacy of maintenance funding. The BPRN structures were found to have an Average Condition Indicator rating in the category of ‘GOOD’ and a Critical Indicator rating of ‘FAIR’, indicating that:
• A moderate backlog of maintenance work exists on the structure stock, in particular, the load bearing elements.
• Maintenance work has been historically underfunded which has allowed the structure stock to deteriorate to its current condition. If the maintenance work continues to receive insufficient funds it is likely to result in:
• Continued deterioration of condition of highway structures, which may have an impact on the safety and functionality of these structures in the long-term;
• A significant increase in the maintenance backlog;
• A disproportionate increase in the level of maintenance funding required to arrest and rectify deterioration, i.e. increasing Whole Life Costs of the structures;
8.2 Lessons Learned
During the initial six year period of the BCI project, LoBEG and TfL recognised the need and importance of a robust maintenance management and planning process and started devising tools/processes to support effective management of highway structures. This led to the development of tools/processes described in Section 7, Figure 16.
However, it was recognised that these tools and processes are underpinned by consistent and good quality inventory and condition data. It was observed that a significant amount of inconsistencies exist within the inventory and condition data which have a considerable impact on the BCI values.
This led LoBEG to start developing a Good Practice Guide (GPG) on creating structure inventories in order to achieve consistent practices for creating element inventories, condition reporting and BCI evaluation.
Furthermore, LoBEG and TfL acknowledged that condition indicators provide a high-level overview of the structure stock and are effective when used to monitor trends over time. This would enable authorities to determine whether the stock condition is improving, remains constant or is progressively deteriorating with time. Based on these trends inferences can be made about the adequacy/appropriateness of current and historical maintenance funding levels. However, conclusive statements about the level of funding required to arrest deterioration or improve the condition score cannot be made. This can only be done if the Condition Indicator is linked to Maintenance Management and Planning. Therefore the following tasks were, or are currently being, undertaken:
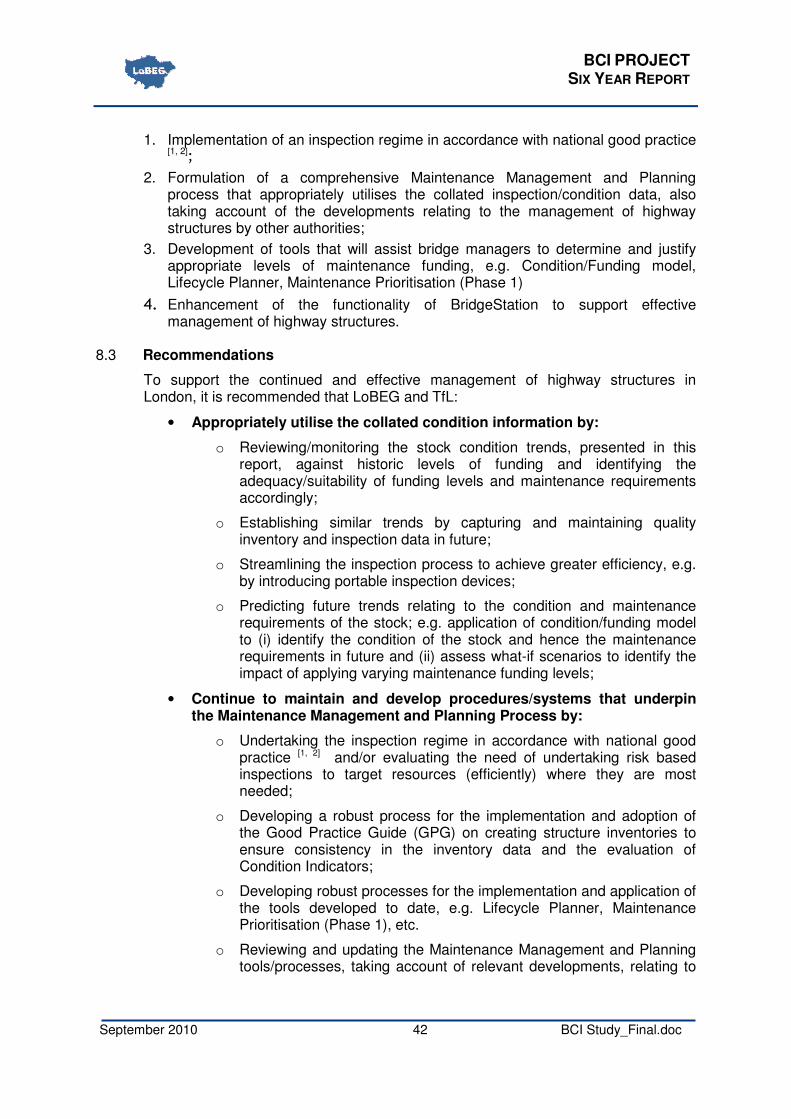
BCI PROJECT SIX YEAR REPORT
September 2010 42 BCI Study_Final.doc
1. Implementation of an inspection regime in accordance with national good practice [1, 2]
;
2. Formulation of a comprehensive Maintenance Management and Planning process that appropriately utilises the collated inspection/condition data, also taking account of the developments relating to the management of highway structures by other authorities;
3. Development of tools that will assist bridge managers to determine and justify appropriate levels of maintenance funding, e.g. Condition/Funding model, Lifecycle Planner, Maintenance Prioritisation (Phase 1)
4. Enhancement of the functionality of BridgeStation to support effective management of highway structures.
8.3 Recommendations
To support the continued and effective management of highway structures in London, it is recommended that LoBEG and TfL:
• Appropriately utilise the collated condition information by:
o Reviewing/monitoring the stock condition trends, presented in this report, against historic levels of funding and identifying the adequacy/suitability of funding levels and maintenance requirements accordingly;
o Establishing similar trends by capturing and maintaining quality inventory and inspection data in future;
o Streamlining the inspection process to achieve greater efficiency, e.g. by introducing portable inspection devices;
o Predicting future trends relating to the condition and maintenance requirements of the stock; e.g. application of condition/funding model to (i) identify the condition of the stock and hence the maintenance requirements in future and (ii) assess what-if scenarios to identify the impact of applying varying maintenance funding levels;
• Continue to maintain and develop procedures/systems that underpin the Maintenance Management and Planning Process by:
o Undertaking the inspection regime in accordance with national good practice [1, 2] and/or evaluating the need of undertaking risk based inspections to target resources (efficiently) where they are most needed;
o Developing a robust process for the implementation and adoption of the Good Practice Guide (GPG) on creating structure inventories to ensure consistency in the inventory data and the evaluation of Condition Indicators;
o Developing robust processes for the implementation and application of the tools developed to date, e.g. Lifecycle Planner, Maintenance Prioritisation (Phase 1), etc.
o Reviewing and updating the Maintenance Management and Planning tools/processes, taking account of relevant developments, relating to

BCI PROJECT SIX YEAR REPORT
September 2010 43 BCI Study_Final.doc
management of highway structures, occurring outside LoBEG and/or London;
• Enhance the performance/functionality of BridgeStation by:
o Updating the system to provide the desired functionality, e.g. updating existing modules to take account of recent developments and coding additional modules based on the tools/processes that are currently being developed;
o Undertaking independent audits of BridgeStation to validate the functionality/outputs of existing and future modules that are intended to support the Maintenance Management and Planning Processes;
• Provide formal training to the bridge engineers/managers, from the 33 boroughs and TfL, to assist them in adopting the tools/processes that underpin the Maintenance Management and Planning Process.
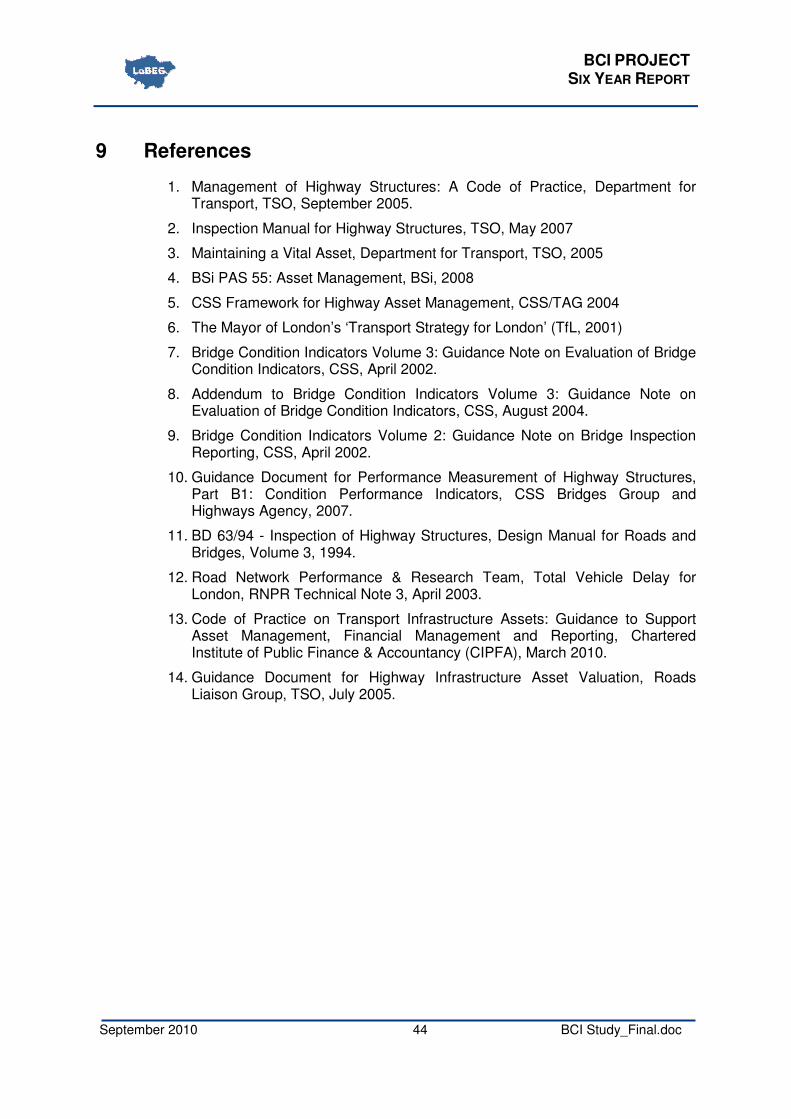
BCI PROJECT SIX YEAR REPORT
September 2010 44 BCI Study_Final.doc
9 References
1. Management of Highway Structures: A Code of Practice, Department for Transport, TSO, September 2005.
2. Inspection Manual for Highway Structures, TSO, May 2007
3. Maintaining a Vital Asset, Department for Transport, TSO, 2005
4. BSi PAS 55: Asset Management, BSi, 2008
5. CSS Framework for Highway Asset Management, CSS/TAG 2004
6. The Mayor of London’s ‘Transport Strategy for London’ (TfL, 2001)
7. Bridge Condition Indicators Volume 3: Guidance Note on Evaluation of Bridge Condition Indicators, CSS, April 2002.
8. Addendum to Bridge Condition Indicators Volume 3: Guidance Note on Evaluation of Bridge Condition Indicators, CSS, August 2004.
9. Bridge Condition Indicators Volume 2: Guidance Note on Bridge Inspection Reporting, CSS, April 2002.
10. Guidance Document for Performance Measurement of Highway Structures, Part B1: Condition Performance Indicators, CSS Bridges Group and Highways Agency, 2007.
11. BD 63/94 - Inspection of Highway Structures, Design Manual for Roads and Bridges, Volume 3, 1994.
12. Road Network Performance & Research Team, Total Vehicle Delay for London, RNPR Technical Note 3, April 2003.
13. Code of Practice on Transport Infrastructure Assets: Guidance to Support Asset Management, Financial Management and Reporting, Chartered Institute of Public Finance & Accountancy (CIPFA), March 2010.
14. Guidance Document for Highway Infrastructure Asset Valuation, Roads Liaison Group, TSO, July 2005.

BCI PROJECT SIX YEAR REPORT
September 2010 Appendix A
Appendix A: CSS Inspection Forms

BCI PROJECT SIX YEAR REPORT
September 2010 Appendix A

BCI PROJECT SIX YEAR REPORT
September 2010 Appendix A
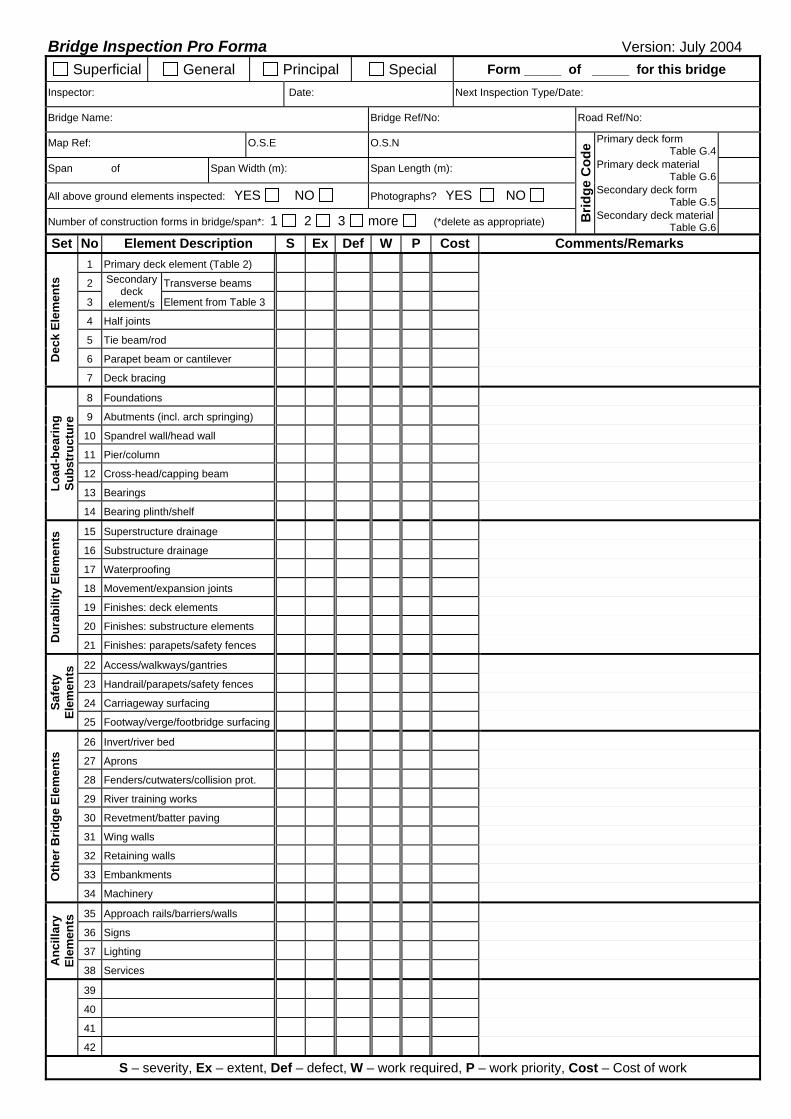
Bridge Inspection Pro Forma Version: July 2004 Superficial General Principal Special Form _____ of _____ for this bridge
Inspector: Date: Next Inspection Type/Date:
Bridge Name: Bridge Ref/No: Road Ref/No:
Map Ref: O.S.E O.S.N Primary deck form Table G.4
Span of Span Width (m): Span Length (m): Primary deck material Table G.6
All above ground elements inspected: YES NO Photographs? YES NO Secondary deck form Table G.5
Number of construction forms in bridge/span*: 1 2 3 more (*delete as appropriate) Brid
ge C
ode
Secondary deck materialTable G.6
Set No Element Description S Ex Def W P Cost Comments/Remarks 1 Primary deck element (Table 2) 2 Transverse beams 3
Secondary deck
element/s Element from Table 3 4 Half joints 5 Tie beam/rod 6 Parapet beam or cantilever D
eck
Elem
ents
7 Deck bracing 8 Foundations 9 Abutments (incl. arch springing)
10 Spandrel wall/head wall 11 Pier/column 12 Cross-head/capping beam 13 Bearings Lo
ad-b
earin
g Su
bstr
uctu
re
14 Bearing plinth/shelf 15 Superstructure drainage 16 Substructure drainage 17 Waterproofing 18 Movement/expansion joints 19 Finishes: deck elements 20 Finishes: substructure elements
Dur
abili
ty E
lem
ents
21 Finishes: parapets/safety fences 22 Access/walkways/gantries 23 Handrail/parapets/safety fences 24 Carriageway surfacing Sa
fety
El
emen
ts
25 Footway/verge/footbridge surfacing 26 Invert/river bed 27 Aprons 28 Fenders/cutwaters/collision prot. 29 River training works 30 Revetment/batter paving 31 Wing walls 32 Retaining walls 33 Embankments O
ther
Brid
ge E
lem
ents
34 Machinery 35 Approach rails/barriers/walls 36 Signs 37 Lighting
Anc
illar
y El
emen
ts
38 Services 39 40 41
42 S – severity, Ex – extent, Def – defect, W – work required, P – work priority, Cost – Cost of work
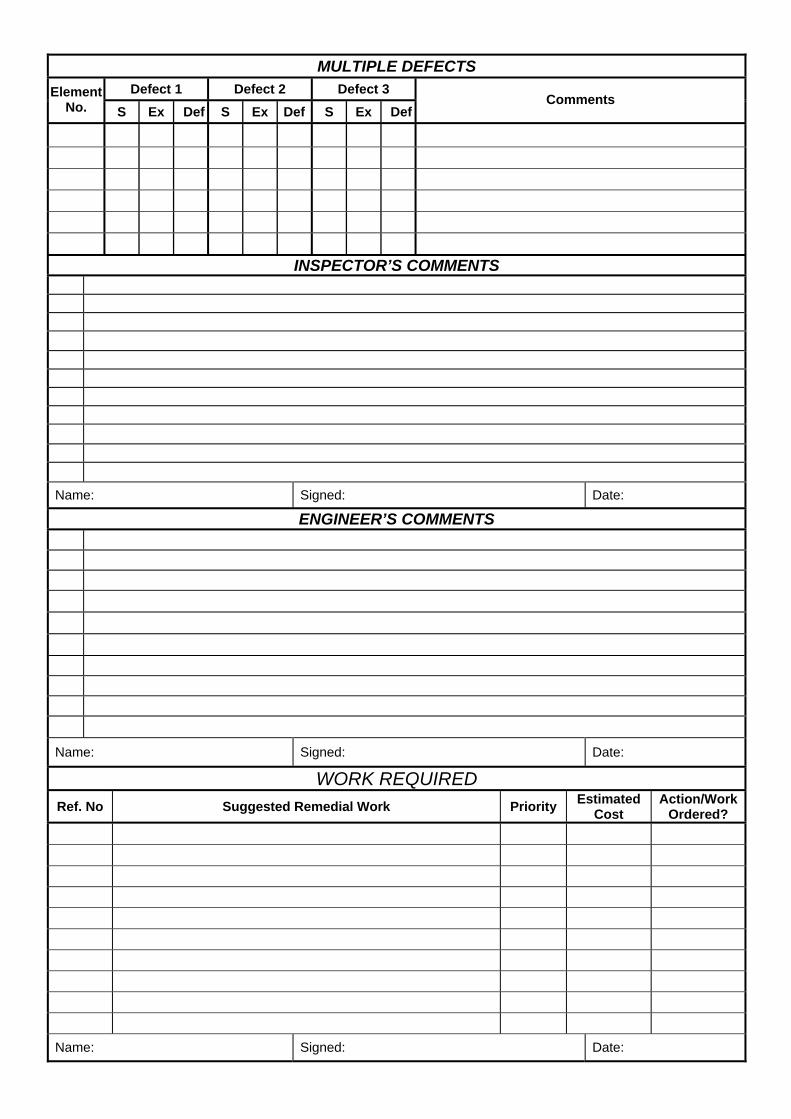
MULTIPLE DEFECTS
Defect 1 Defect 2 Defect 3 Element No. S Ex Def S Ex Def S Ex Def
Comments
INSPECTOR’S COMMENTS
Name: Signed: Date:
ENGINEER’S COMMENTS
Name: Signed: Date:
WORK REQUIRED Ref. No Suggested Remedial Work Priority Estimated
Cost Action/Work
Ordered?
Name: Signed: Date:
BCI PROJECT SIX YEAR REPORT
September 2010 Appendix B
Appendix B: ROADS 277 Form

Structure Name ROADS 277
Min Headroom Clearance under/overHA Structure No HA ST key
*Corporation of London Road NetworkNational Grid Ref E N RO File Reference
* N. Bound/W. Bound Design Load
County/Borough Date of Issue* S. Bound/E. Bound Design standard versionof form
Maintaining Region * Please delete as necessary * Special loading/restriction
Maintaining Agent:
For Structure Date of LastMaterials:Principal Inspection
For Road Surface *Deck/Wall/Mast etc (eg in situ PSC)Structure Owner (if not TfL)Maintaing Agent:Strucure Ref:
Type of Construction (eg Solid Slab)Year Structure Commissioned Is the structure
Susceptible to scour? yes no
Design Office Is the structure on the High Load Route?
Form of Deck (eg Propped Cantilever)yes noDoes the road go over /under*Railway, Canal, River, Road
Is the structure on the Heavy Load Route? yes no
End Supports (eg Skeleton Abutment)Railway Bridge Number
Is the structure scheduledAs an Ancient Monument?Is the River tidal? yes no yes no
Intermediate Supports (eg Slab Wall)Is the River navigable? yes no Name of statutory undertakers having
Services on bridge
Name of Navigation /Drainage Authority
Nature of Foundations (eg Caissons)
*Please delete as necessary
Photograph(s) PTO
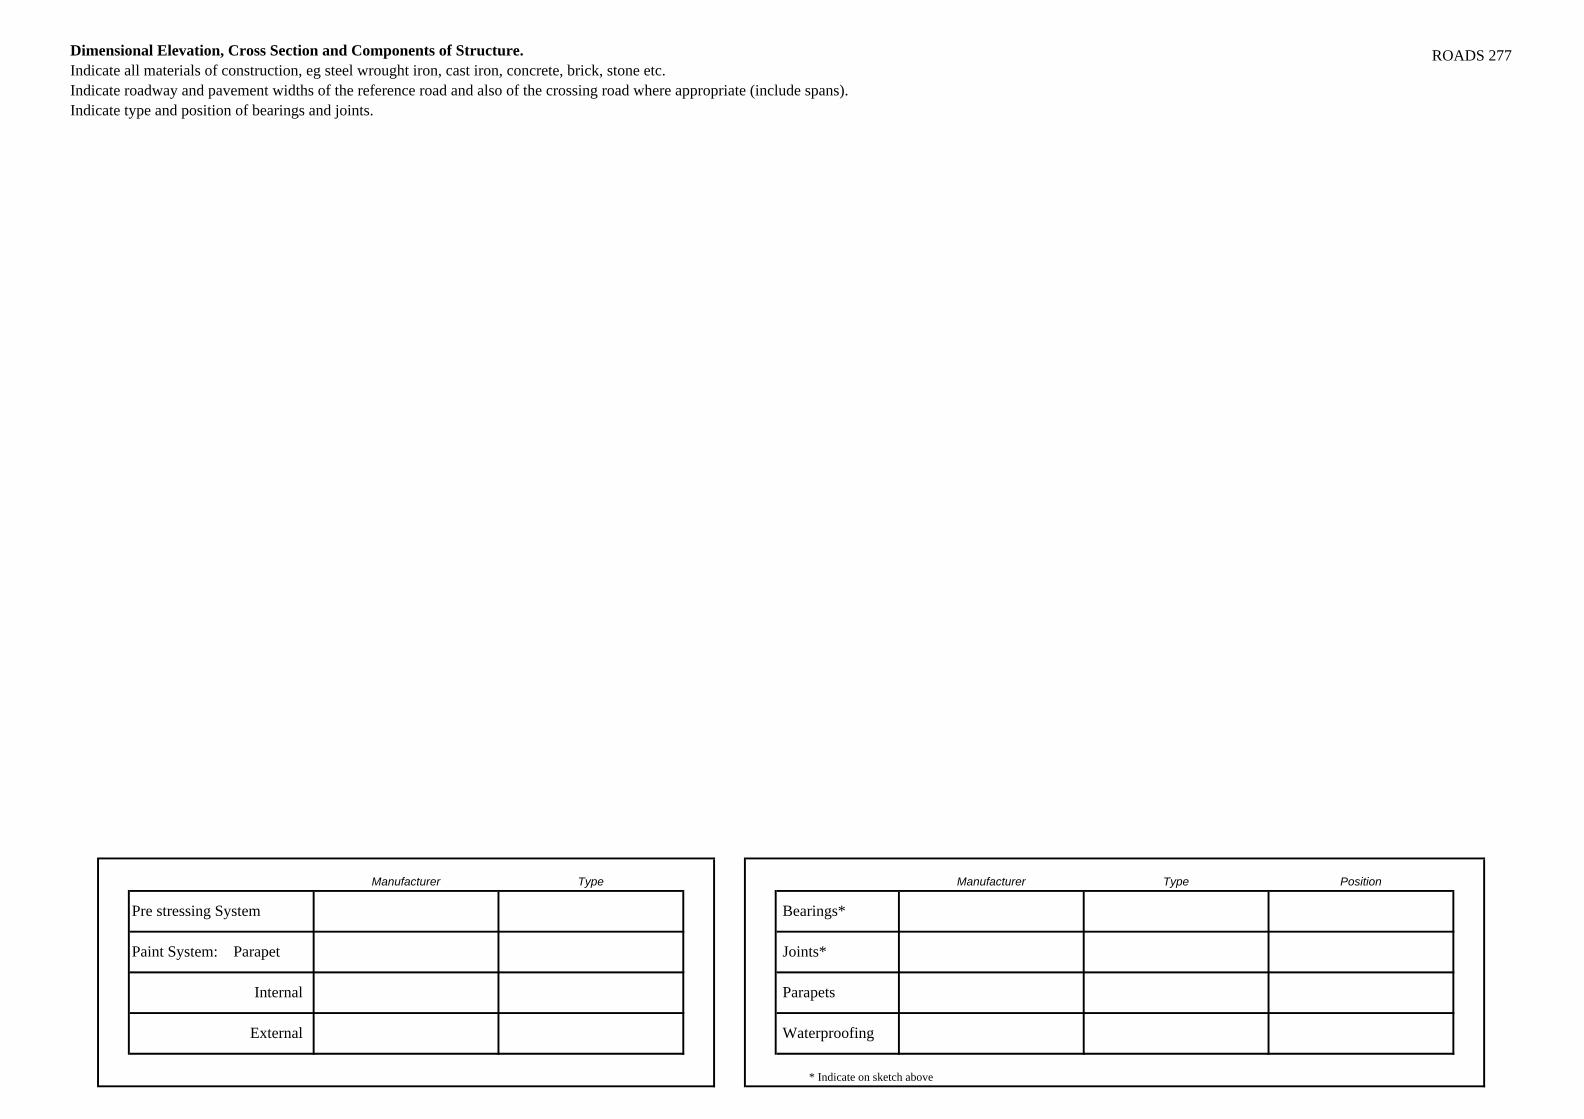
Dimensional Elevation, Cross Section and Components of Structure.Indicate all materials of construction, eg steel wrought iron, cast iron, concrete, brick, stone etc.Indicate roadway and pavement widths of the reference road and also of the crossing road where appropriate (include spans). Indicate type and position of bearings and joints.
ROADS 277
Manufacturer Type Manufacturer Type Position
Pre stressing System Bearings*
Paint System: Parapet Joints*
Internal Parapets
External Waterproofing
* Indicate on sketch above

BCI PROJECT SIX YEAR REPORT
September 2010 Appendix C
Appendix C
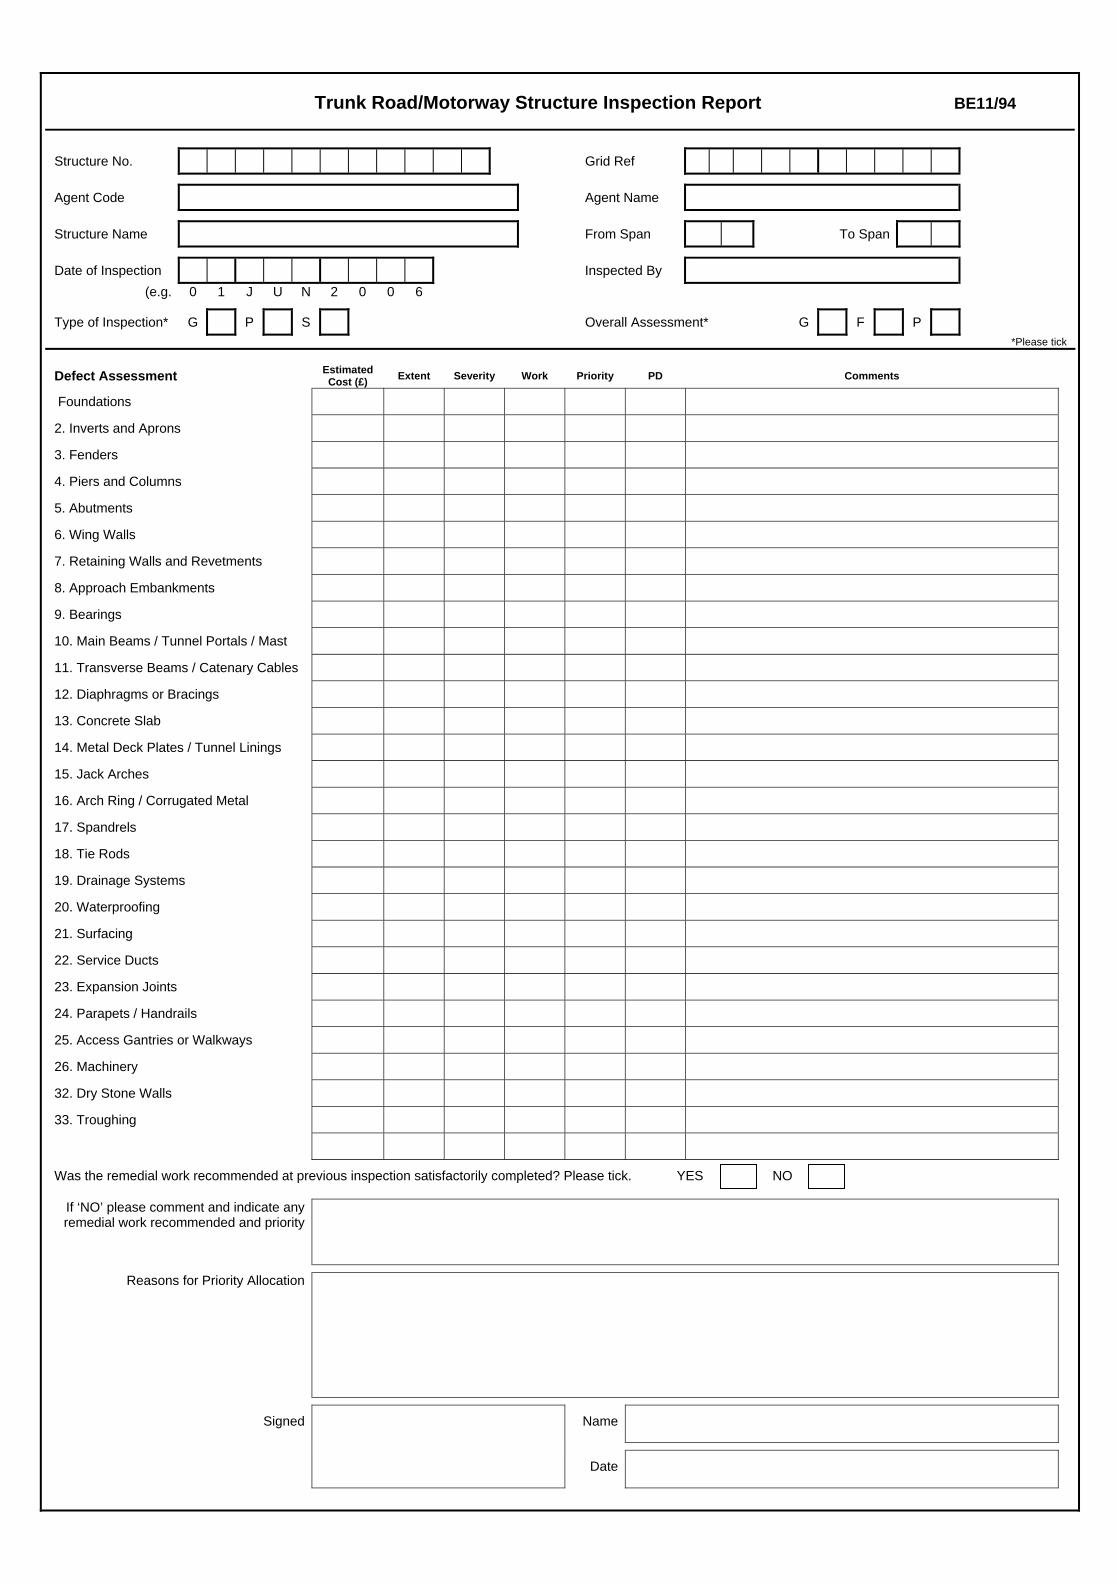
Trunk Road/Motorway Structure Inspection Report BE11/94
Structure No. Grid Ref
Agent Code Agent Name
Structure Name From Span To Span
Date of Inspection Inspected By (e.g. 0 1 J U N 2 0 0 6
Type of Inspection* G P S Overall Assessment* G F P *Please tick
Defect Assessment Estimated Cost (£) Extent Severity Work Priority PD Comments
Foundations
2. Inverts and Aprons
3. Fenders
4. Piers and Columns
5. Abutments
6. Wing Walls
7. Retaining Walls and Revetments
8. Approach Embankments
9. Bearings
10. Main Beams / Tunnel Portals / Mast
11. Transverse Beams / Catenary Cables
12. Diaphragms or Bracings
13. Concrete Slab
14. Metal Deck Plates / Tunnel Linings
15. Jack Arches
16. Arch Ring / Corrugated Metal
17. Spandrels
18. Tie Rods
19. Drainage Systems
20. Waterproofing
21. Surfacing
22. Service Ducts
23. Expansion Joints
24. Parapets / Handrails
25. Access Gantries or Walkways
26. Machinery
32. Dry Stone Walls
33. Troughing
Was the remedial work recommended at previous inspection satisfactorily completed? Please tick. YES NO
If ‘NO’ please comment and indicate any remedial work recommended and priority
Reasons for Priority Allocation
Name
Signed
Date

BCI PROJECT SIX YEAR REPORT
September 2010 Appendix D
Appendix D: Inspection Briefs

LoBEG Structures Condition Survey
Bridge Condition Indicators Phase V Inspections (2007-2008)
Specification

The Royal Borough of Kingston upon Thames
LoBEG Structures Condition Survey
Bridge Condition Indicators Phase V Inspections
(2007-2008)
Specification
SPECIFICATION
1. General
1.1. The Bridge Condition Indicator (BCI) project forms part of the strategy being developed by TfL jointly with LOTAG and LOBEG for asset management across TLRN and the Borough Principal Road Network (BPRN).
1.2. It is important that the highway structures on the BPRN are managed to accord with good practice, to:
• Enable bridge Managers from TfL and the Boroughs to demonstrate that the structures are safe for use and fit for purpose.
• Provide justification for funding on-going maintenance.
• Develop procedures and tools with a view to improving and streamlining management activities.
1.3. The purpose of the BCI Condition survey is to carry out an on-going regime of General and Principal Inspections in accordance with good practice, ie County Surveyor’s Society Inspection procedures and the Code of Practice for Management of Highway Structures – September 2005 and due consideration should also be given to the Inspection Manual for Highway Structures, June 2007.
1.4. This project is the fifth year of the Condition Survey of the BPRN structures.
1.5. The party undertaking the inspections (be they a Borough or a Consultant) are referred to in this contract as the Contractor.
1.6. The Employer’s Representative, Capita Symonds will undertake the project management of the condition survey contract.
2. Scope of the Works
2.1. The Condition Survey project comprises carrying out General and Principal Inspections of the highway structures on the Borough Principal Road Network (BPRN) listed in Appendix 1 and submission of draft and final reports in accordance with the specification herein.

2.2. Where information on the structures listed in Appendix 1 are available, eg inspection reports, assessment reports, Roads 277 forms and any drawings/sketches are included in the accompanying compact disc titled “Phase 5 – Available Information”.
3. Format of General and Principal Inspections
3.1. General and Principal Inspections shall be carried out in accordance with the following documents:
i) The Code of Practice for the Management of Highway Structures – September 2005, Section 6 ‘Inspection Testing and Monitoring.
Copies are available from:
Ivor Moses Capita Symonds Capita Symonds House Wood Street East Grinstead West Sussex RH19 1UU
Tel: 01342 327161 Fax: 01342 315927 E-mail address: [email protected]
ii) Bridge Condition Indicators, Volume 2, Guidance Note on Bridge Inspection Reporting and August 2004 addendum to this document.
Copies are available from:
Richard Wills CSS Honorary Secretary and Treasurer Lincolnshire County Council City Hall Lincoln LN1 1DN
Tel: 01522 553098 Fax: 01522 512335 E-mail address: [email protected]
iii) Inspection Manual for Highway Structures, Volumes 1 & 2.
Copies are available from:
TSO Bookshop E-mail address: http://www.tsoshop.co.uk/bookstore.asp
4. Undertaking Inspections
Public Safety
4.1. If the inspections identifies defects that are considered to have a safety implication and requires urgent attention, the Contractor shall report it to the Employer and Employers Representative immediately.
Access

4.2. The Contractor shall be responsible for liaising with relevant parties to arrange access and traffic management to carry out the inspection work.
4.3. The Contractor shall be responsible for procurement of all access plant and equipment necessary to complete the inspection.
Health and Safety
4.4. Works shall be carried out in compliance with all Statutory Requirements, Approved Codes of Practices and Guidance Notes relevant to Health and Safety at Work with regard to welfare of the operatives as well as the general safety of members of the public and properties.
4.5. The Contractor shall complete the Health and Safety forms and undertake a Risk Assessment using the template contained in Appendix II.
Element Condition Information
4.6. Element condition information shall be recorded during the inspection and reported as set out in Section 5.
4.7. If the inspector considers the elements on a structure to be different to those identified by the previous CSS style inspection, then the inspector shall record these differences on the new inspection pro forma for the particular structure.
5. General and Principal Inspection Reports
Front Cover
5.1. The front cover of all of the reports shall have the LoBEG logo in the top centre of the front page with the structure number, structure name, inspection type and the date located directly beneath as set out in Appendix II. The Contractor may place their logo in the bottom right hand corner of the front page of the report should they so wish.
Disclaimers
5.2. No disclaimers are to be placed on any part of the report without the prior permission of the Employer.
Access Arrangements
5.3. Where other than normal, access arrangements and traffic management are required to carry out the inspections. Information on these shall be included in section 1.3 of the General Inspection Report, and section 1.1 of the Principal Inspection Report for future reference.
Remedial Works
5.4. Advice on the remedial works required, together with cost estimates under the “Works Required” section of CSS Inspection Pro Forma shall be stated. For each defect where remedial work is recommended, a photograph or photographs shall be included in the report with cross reference to the particular defect in the pro forma.
Recommendations for Special Inspections
5.5. If a significant defect is found but the cause, extent and the nature of the remedial works is uncertain, the report shall make recommendations for future Special Inspection to be undertaken describing briefly the objectives and budget estimate for carrying out the special inspection.
5.6. If material testing and/or investigation is considered to be necessary the inspection report must make that recommendation as a further Special Inspection required, stating the type of investigation required, why testing is needed, what type or types of material testing
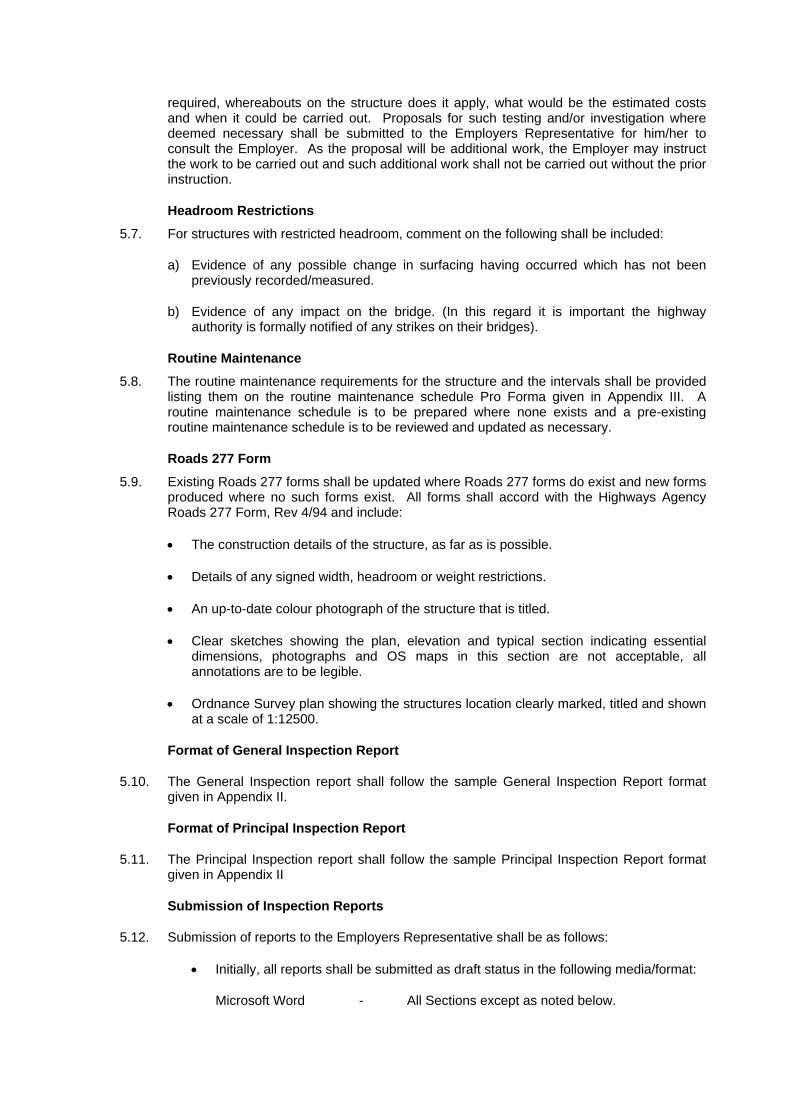
required, whereabouts on the structure does it apply, what would be the estimated costs and when it could be carried out. Proposals for such testing and/or investigation where deemed necessary shall be submitted to the Employers Representative for him/her to consult the Employer. As the proposal will be additional work, the Employer may instruct the work to be carried out and such additional work shall not be carried out without the prior instruction.
Headroom Restrictions
5.7. For structures with restricted headroom, comment on the following shall be included:
a) Evidence of any possible change in surfacing having occurred which has not been previously recorded/measured.
b) Evidence of any impact on the bridge. (In this regard it is important the highway authority is formally notified of any strikes on their bridges).
Routine Maintenance
5.8. The routine maintenance requirements for the structure and the intervals shall be provided listing them on the routine maintenance schedule Pro Forma given in Appendix III. A routine maintenance schedule is to be prepared where none exists and a pre-existing routine maintenance schedule is to be reviewed and updated as necessary.
Roads 277 Form
5.9. Existing Roads 277 forms shall be updated where Roads 277 forms do exist and new forms produced where no such forms exist. All forms shall accord with the Highways Agency Roads 277 Form, Rev 4/94 and include:
• The construction details of the structure, as far as is possible.
• Details of any signed width, headroom or weight restrictions.
• An up-to-date colour photograph of the structure that is titled.
• Clear sketches showing the plan, elevation and typical section indicating essential dimensions, photographs and OS maps in this section are not acceptable, all annotations are to be legible.
• Ordnance Survey plan showing the structures location clearly marked, titled and shown at a scale of 1:12500.
Format of General Inspection Report
5.10. The General Inspection report shall follow the sample General Inspection Report format given in Appendix II.
Format of Principal Inspection Report
5.11. The Principal Inspection report shall follow the sample Principal Inspection Report format given in Appendix II
Submission of Inspection Reports
5.12. Submission of reports to the Employers Representative shall be as follows:
• Initially, all reports shall be submitted as draft status in the following media/format:
Microsoft Word - All Sections except as noted below.

Microsoft Excel - CSS Inspection Form H&S Risk Assessment Form Routine Maintenance Requirement Form Roads277 Form
Draft Reports shall be submitted via email. Reports shall be compressed into a ‘zip’ file, with one zip folder per report and labelled with the full LoBEG structure reference number.
• Format of the structure code
• Reports shall only be submitted as final status when draft reports have been accepted as complete. The final reports shall be submitted in the following media/format:
Microsoft Word - All Sections except as noted below.
Microsoft Excel - CSS Inspection Form H&S Risk Assessment Form Routine Maintenance Requirement Form Roads277 Form
Hard Copy - Full report – with signatures, at A4 size, 277 form at A3
PDF - Full report – with signatures, as per the Hard Copy
Final reports shall be submitted following the folder structure described in appendix V.
6. Programme
6.1. Prior to carrying out the inspection work, the Borough/Consultant shall submit to the Employer’s Representative for his approval a programme of works in bar-chart form for the inspection. The programme should include separate activities for:
a) Inspections
b) Preparation of report
c) Submission of Draft Reports
d) Submission of Final Reports
6.2. The final reports for all the highway structures shall be submitted to the Employer by end of February 2008.
7. Invoicing
7.1. Invoices shall be submitted to the Employer once final reports are approved at the end of each month.

BCI PROJECT SIX YEAR REPORT
September 2010 Appendix E
Appendix E: General Inspection Report Format

STRUCTURE NUMBER BRIDGE
GENERAL INSPECTION
REPORT
Date
Client
Consultant:
Structure Reference: STRUCTURE NUMBER Document Title: General Inspection Report Document Number: Issue Number: 01 Date: date Prepared By: Print Sign ................................................ Authorised By: Print Sign ................................................ Amendment List
Iss. / Rev. Iss. / Rev Date
Remove Insert
Page Iss. / Rev. Page Iss. / Rev.
Filename: Document2
Issue No.One Document No. 3316/DOC/00#

1. SUMMARY OF INSPECTION
1.1. The inspection was carried out by __________ on ___________ . Weather conditions were__________ and the air temperature was___________.
1.2. Description of structure
1.3. Access arrangements
1.4. Conclusions and recommendations
NOTE TO REPORT WRITER
1.1 to 1.4 above not to exceed one page A4 total.
1.4 above to be set out as bullet points and refer to photographic evidence in section 2

2. PICTURES
NOTE TO REPORT WRITER
Any pictures relevant to the inspection should be included here and shall be two photos per page maximum. Photos are to be titled.Photo 1, Photo 2 and so on.
NOTE TO REPORT WRITER
Bridge inspection pro forma and inspection pro forma codes to be inserted here.

NOTE TO REPORT WRITER
Risk assessment pro forma to be inserted here.

NOTE TO REPORT WRITER
Roads 277 form in A3 format to be inserted here.

NOTE TO REPORT WRITER
Routine maintenance form to be inserted here.
BCI PROJECT SIX YEAR REPORT
September 2010 Appendix F
Appendix F: Principal Inspection Report Format
STRUCTURE NUMBER BRIDGE
PRINCIPAL INSPECTION
REPORT
Date
Client
Consultant:
Structure Reference: STRUCTURE NUMBER Document Title: Principal Inspection Report Document Number: Issue Number: 01 Date: date Prepared By: Print Sign ................................................ Authorised By: Print Sign ................................................ Amendment List
Iss. / Rev. Iss. / Rev Date
Remove Insert
Page Iss. / Rev. Page Iss. / Rev.
Filename: Document2
Document No. __________

Principal Inspections of TfL Bridges STRUCTURE NUMBER Principal Inspection Report
CONTENTS
1. INTRODUCTION 4
2. DESCRIPTION OF STRUCTURE 4
3. CONCLUSIONS AND RECOMMENDATIONS 4
4. DETAILED CONDITION REPORT
5. PHOTOGRAPHS
Document No. __________
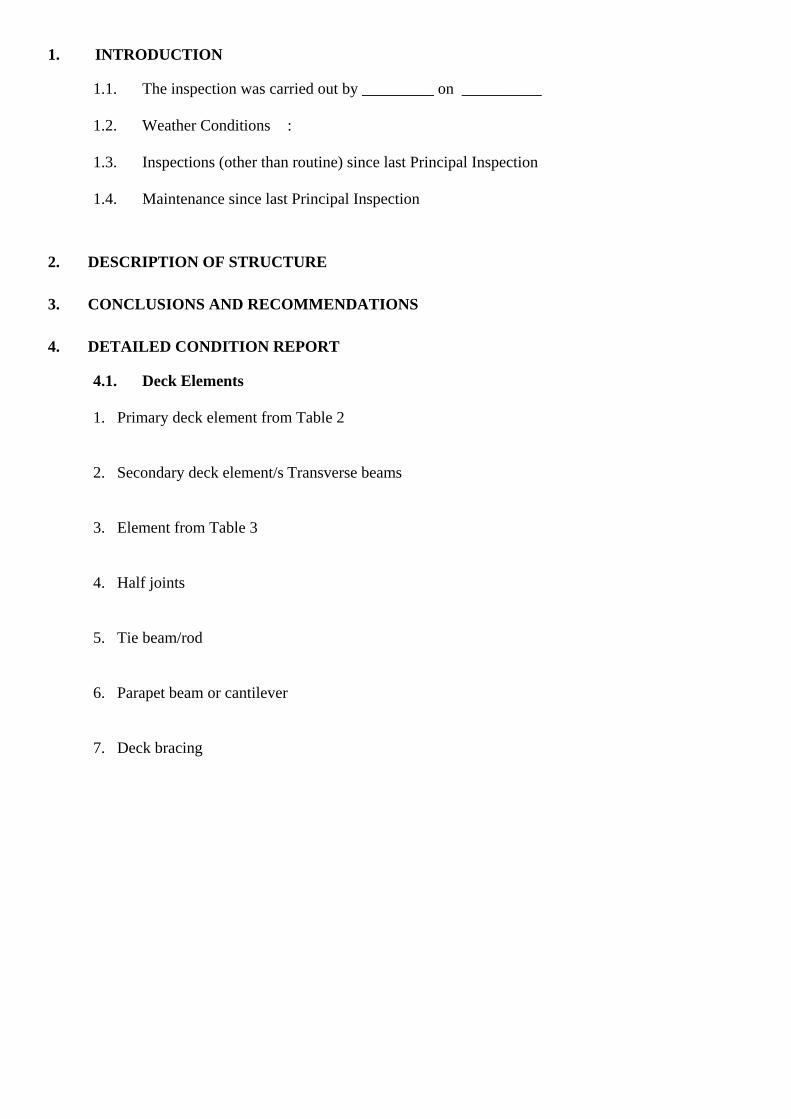
1. INTRODUCTION
1.1. The inspection was carried out by _________ on __________
1.2. Weather Conditions : 1.3. Inspections (other than routine) since last Principal Inspection
1.4. Maintenance since last Principal Inspection
2. DESCRIPTION OF STRUCTURE
3. CONCLUSIONS AND RECOMMENDATIONS
4. DETAILED CONDITION REPORT
4.1. Deck Elements 1. Primary deck element from Table 2
2. Secondary deck element/s Transverse beams
3. Element from Table 3
4. Half joints
5. Tie beam/rod
6. Parapet beam or cantilever
7. Deck bracing

4.2. Load-bearing Substructure 8. Foundations
9. Abutments (incl. arch springing)
10. Spandrel wall/head wall
11. Pier/column
12. Cross-head/capping beam
13. Bearings
14. Bearing plinth/shelf
4.3. Durability Elements 15. Superstructure drainage
16. Substructure drainage
17. Waterproofing
18. Movement/expansion joints
19. Painting: deck elements
20. Painting: substructure elements
21. Painting: parapets/safety fences

4.4. Safety Elements 22. Access/walkways/gantries
23. Handrail/parapets/safety fences
24. Carriageway surfacing
25. Footway/verge/footbridge surfacing
4.5. Other Bridge Elements 26. Invert/river bed
27. Aprons
28. Fenders/cutwaters/collision protection
29. River training works
30. Revetment/batter paving
31. Wing walls
32. Retaining walls
33. Embankments
34. Machinery

4.6. Ancilliary Elements 35. Approach rails/barriers/walls
36. Signs
37. Lighting
38. Services

5. photographs
NOTE TO REPORT WRITER
Any pictures relevant to the inspection should be included here and shall be two photos per page maximum. Photos are to be titled.Photo 1,
Photo 2 and so on.
NOTE TO REPORT WRITER
Bridge inspection pro forma and Inspection pro forma codes to be inserted here.

NOTE TO REPORT WRITER
Risk assessment pro forma to be inserted here.

NOTE TO REPORT WRITER
Roads 277 form in A3 format to be inserted here.

NOTE TO REPORT WRITER
Routine maintenance form to be inserted here.

BCI PROJECT SIX YEAR REPORT
September 2010 Appendix G
Appendix G: Condition Indicators
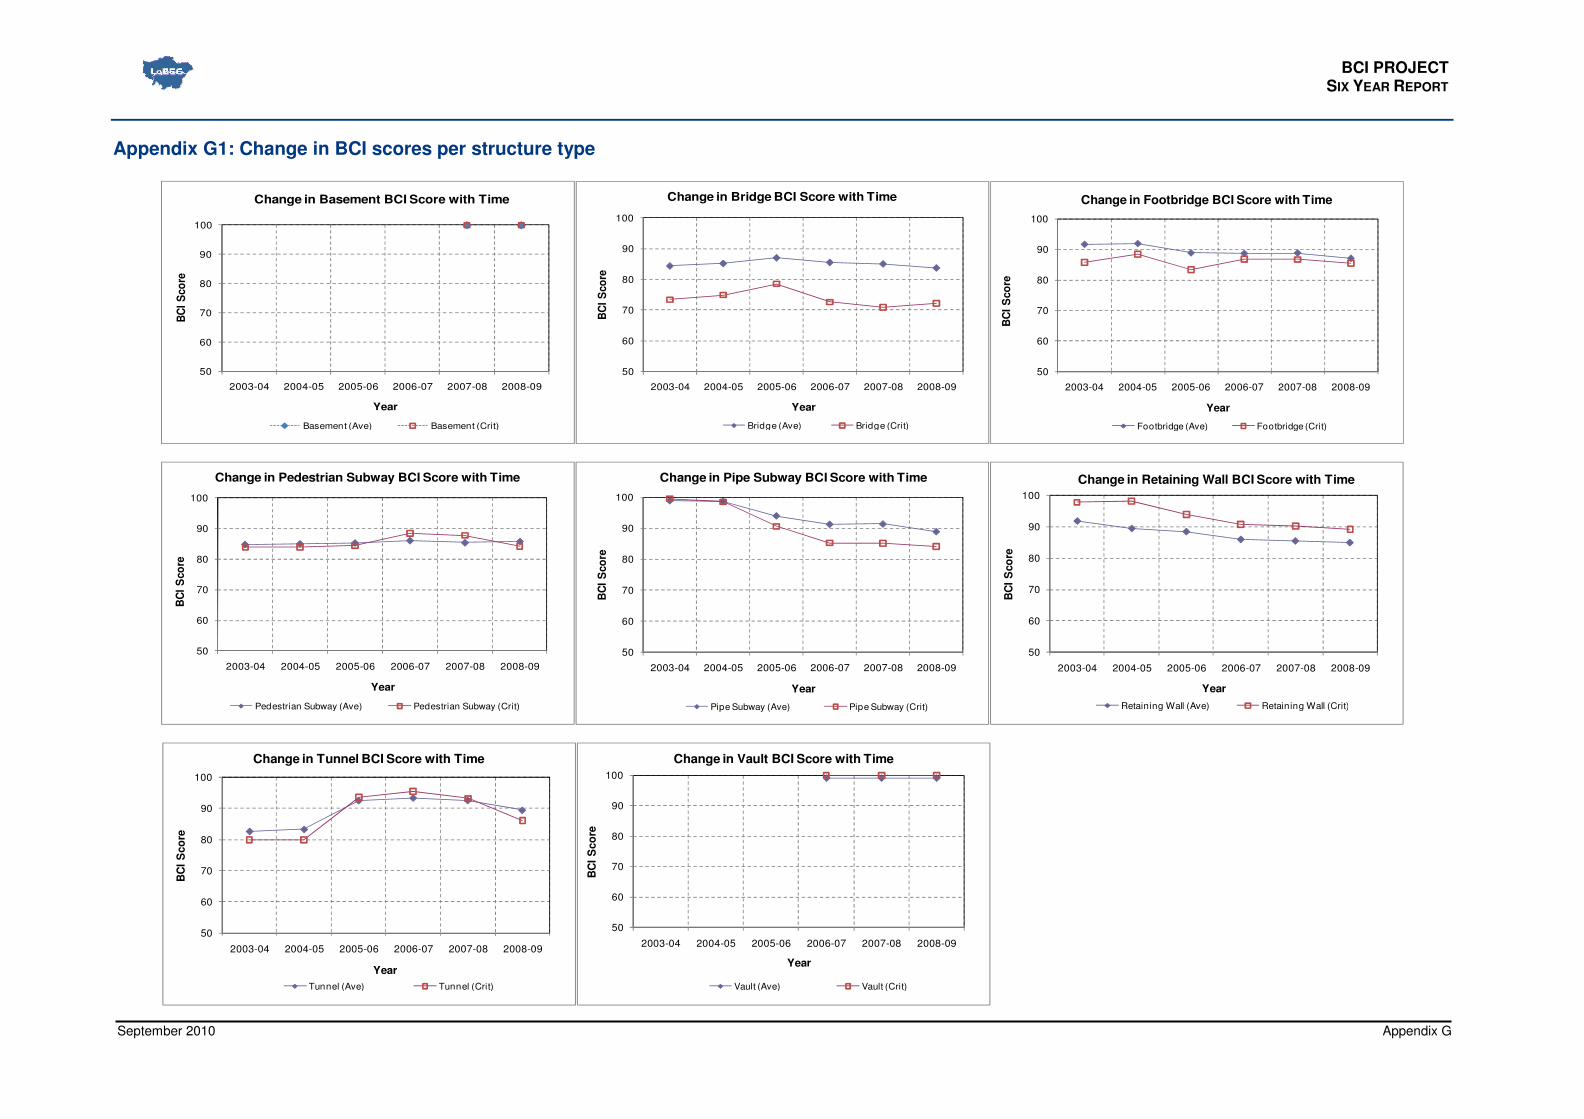
BCI PROJECT SIX YEAR REPORT
September 2010 Appendix G
Appendix G1: Change in BCI scores per structure type
50
60
70
80
90
100
2003-04 2004-05 2005-06 2006-07 2007-08 2008-09
BC
I S
co
re
Year
Change in Basement BCI Score with Time
Basement (Ave) Basement (Crit)
50
60
70
80
90
100
2003-04 2004-05 2005-06 2006-07 2007-08 2008-09
BC
I S
co
re
Year
Change in Bridge BCI Score with Time
Bridge (Ave) Bridge (Crit)
50
60
70
80
90
100
2003-04 2004-05 2005-06 2006-07 2007-08 2008-09
BC
I S
co
re
Year
Change in Footbridge BCI Score with Time
Footbridge (Ave) Footbridge (Crit)
50
60
70
80
90
100
2003-04 2004-05 2005-06 2006-07 2007-08 2008-09
BC
I S
co
re
Year
Change in Pedestrian Subway BCI Score with Time
Pedestrian Subway (Ave) Pedestrian Subway (Crit)
50
60
70
80
90
100
2003-04 2004-05 2005-06 2006-07 2007-08 2008-09
BC
I S
co
re
Year
Change in Pipe Subway BCI Score with Time
Pipe Subway (Ave) Pipe Subway (Crit)
50
60
70
80
90
100
2003-04 2004-05 2005-06 2006-07 2007-08 2008-09
BC
I S
co
re
Year
Change in Retaining Wall BCI Score with Time
Retaining Wall (Ave) Retaining Wall (Crit)
50
60
70
80
90
100
2003-04 2004-05 2005-06 2006-07 2007-08 2008-09
BC
I S
co
re
Year
Change in Tunnel BCI Score with Time
Tunnel (Ave) Tunnel (Crit)
50
60
70
80
90
100
2003-04 2004-05 2005-06 2006-07 2007-08 2008-09
BC
I S
co
re
Year
Change in Vault BCI Score with Time
Vault (Ave) Vault (Crit)
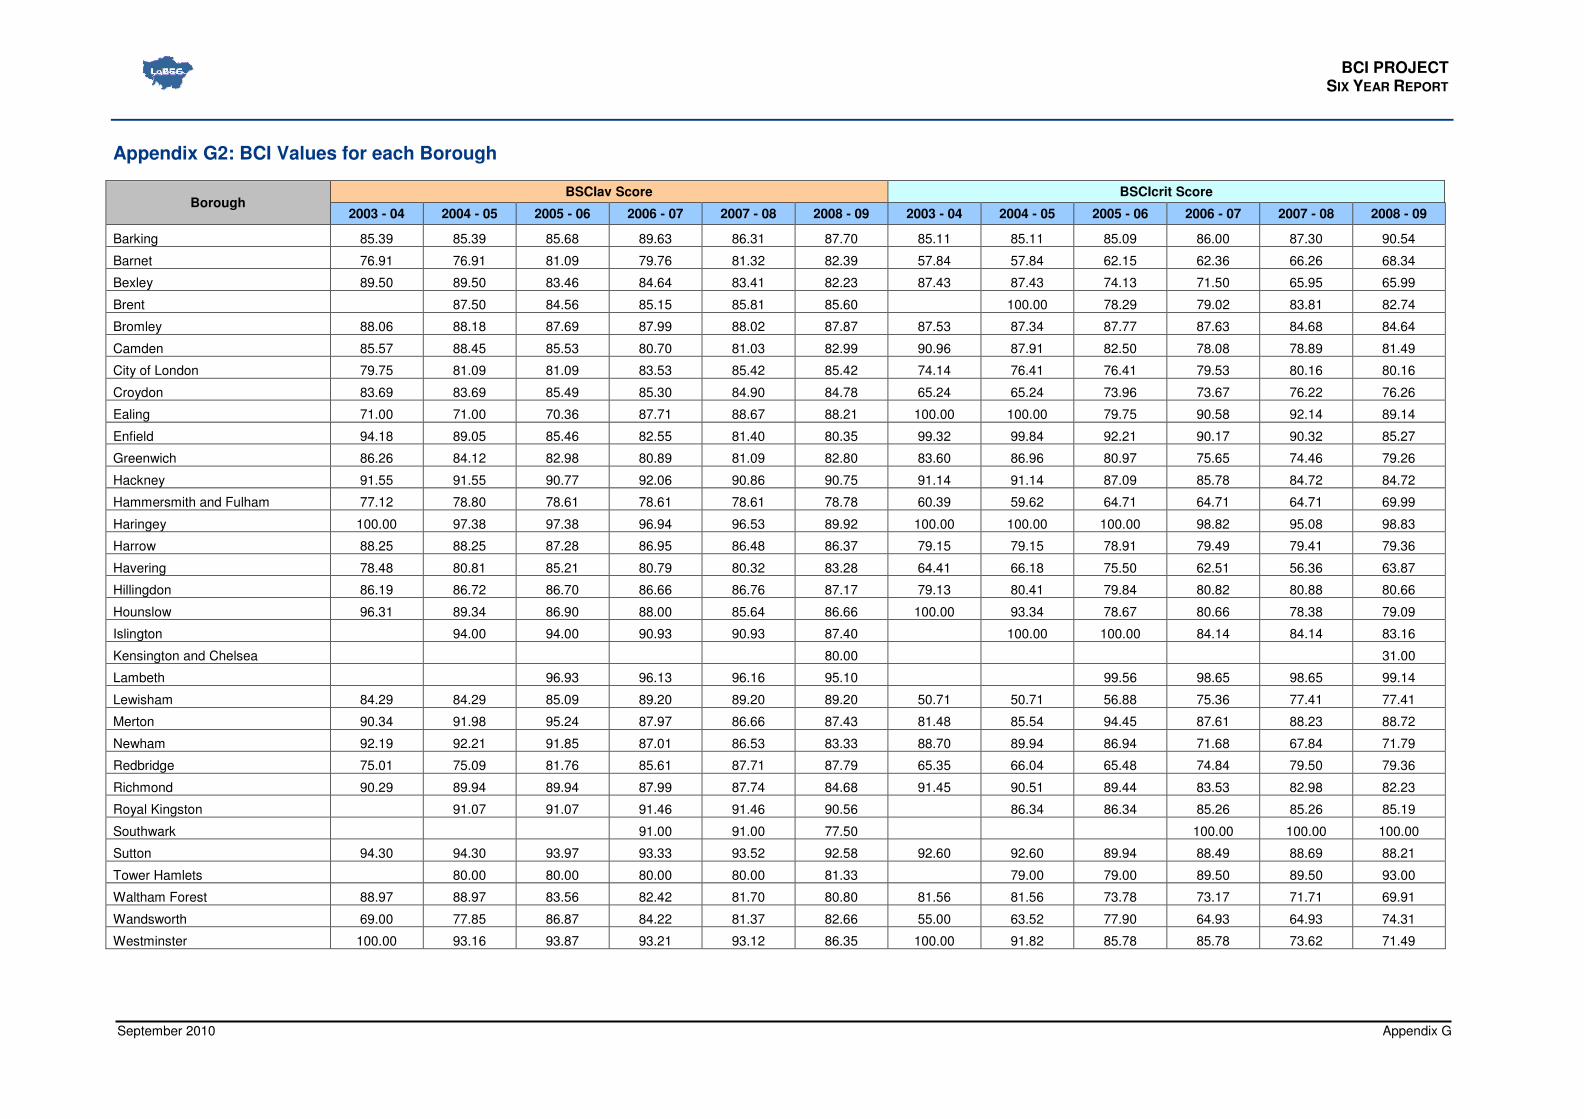
BCI PROJECT SIX YEAR REPORT
September 2010 Appendix G
Appendix G2: BCI Values for each Borough
Borough BSCIav Score BSCIcrit Score
2003 - 04 2004 - 05 2005 - 06 2006 - 07 2007 - 08 2008 - 09 2003 - 04 2004 - 05 2005 - 06 2006 - 07 2007 - 08 2008 - 09
Barking 85.39 85.39 85.68 89.63 86.31 87.70 85.11 85.11 85.09 86.00 87.30 90.54
Barnet 76.91 76.91 81.09 79.76 81.32 82.39 57.84 57.84 62.15 62.36 66.26 68.34
Bexley 89.50 89.50 83.46 84.64 83.41 82.23 87.43 87.43 74.13 71.50 65.95 65.99
Brent 87.50 84.56 85.15 85.81 85.60 100.00 78.29 79.02 83.81 82.74
Bromley 88.06 88.18 87.69 87.99 88.02 87.87 87.53 87.34 87.77 87.63 84.68 84.64
Camden 85.57 88.45 85.53 80.70 81.03 82.99 90.96 87.91 82.50 78.08 78.89 81.49
City of London 79.75 81.09 81.09 83.53 85.42 85.42 74.14 76.41 76.41 79.53 80.16 80.16
Croydon 83.69 83.69 85.49 85.30 84.90 84.78 65.24 65.24 73.96 73.67 76.22 76.26
Ealing 71.00 71.00 70.36 87.71 88.67 88.21 100.00 100.00 79.75 90.58 92.14 89.14
Enfield 94.18 89.05 85.46 82.55 81.40 80.35 99.32 99.84 92.21 90.17 90.32 85.27
Greenwich 86.26 84.12 82.98 80.89 81.09 82.80 83.60 86.96 80.97 75.65 74.46 79.26
Hackney 91.55 91.55 90.77 92.06 90.86 90.75 91.14 91.14 87.09 85.78 84.72 84.72
Hammersmith and Fulham 77.12 78.80 78.61 78.61 78.61 78.78 60.39 59.62 64.71 64.71 64.71 69.99
Haringey 100.00 97.38 97.38 96.94 96.53 89.92 100.00 100.00 100.00 98.82 95.08 98.83
Harrow 88.25 88.25 87.28 86.95 86.48 86.37 79.15 79.15 78.91 79.49 79.41 79.36
Havering 78.48 80.81 85.21 80.79 80.32 83.28 64.41 66.18 75.50 62.51 56.36 63.87
Hillingdon 86.19 86.72 86.70 86.66 86.76 87.17 79.13 80.41 79.84 80.82 80.88 80.66
Hounslow 96.31 89.34 86.90 88.00 85.64 86.66 100.00 93.34 78.67 80.66 78.38 79.09
Islington 94.00 94.00 90.93 90.93 87.40 100.00 100.00 84.14 84.14 83.16
Kensington and Chelsea 80.00 31.00
Lambeth 96.93 96.13 96.16 95.10 99.56 98.65 98.65 99.14
Lewisham 84.29 84.29 85.09 89.20 89.20 89.20 50.71 50.71 56.88 75.36 77.41 77.41
Merton 90.34 91.98 95.24 87.97 86.66 87.43 81.48 85.54 94.45 87.61 88.23 88.72
Newham 92.19 92.21 91.85 87.01 86.53 83.33 88.70 89.94 86.94 71.68 67.84 71.79
Redbridge 75.01 75.09 81.76 85.61 87.71 87.79 65.35 66.04 65.48 74.84 79.50 79.36
Richmond 90.29 89.94 89.94 87.99 87.74 84.68 91.45 90.51 89.44 83.53 82.98 82.23
Royal Kingston 91.07 91.07 91.46 91.46 90.56 86.34 86.34 85.26 85.26 85.19
Southwark 91.00 91.00 77.50 100.00 100.00 100.00
Sutton 94.30 94.30 93.97 93.33 93.52 92.58 92.60 92.60 89.94 88.49 88.69 88.21
Tower Hamlets 80.00 80.00 80.00 80.00 81.33 79.00 79.00 89.50 89.50 93.00
Waltham Forest 88.97 88.97 83.56 82.42 81.70 80.80 81.56 81.56 73.78 73.17 71.71 69.91
Wandsworth 69.00 77.85 86.87 84.22 81.37 82.66 55.00 63.52 77.90 64.93 64.93 74.31
Westminster 100.00 93.16 93.87 93.21 93.12 86.35 100.00 91.82 85.78 85.78 73.62 71.49

BCI PROJECT SIX YEAR REPORT
September 2010 Appendix G
Appendix G3: Trend of BCI Scores for the Boroughs over the six year period
50.00
60.00
70.00
80.00
90.00
100.00
2003 - 04 2004 - 05 2005 - 06 2006 - 07 2007 - 08 2008 - 09
BC
I Sco
re
Year
Change in BSCI scores for Barking
BSCIav BSCIcrit
50.00
60.00
70.00
80.00
90.00
100.00
2003 - 04 2004 - 05 2005 - 06 2006 - 07 2007 - 08 2008 - 09
BC
I Sco
re
Year
Change in BSCI scores for Barnet
BSCIav BSCIcrit
50.00
60.00
70.00
80.00
90.00
100.00
2003 - 04 2004 - 05 2005 - 06 2006 - 07 2007 - 08 2008 - 09
BC
I Sc
ore
Year
Change in BSCI scores for Bexley
BSCIav BSCIcrit
50.00
60.00
70.00
80.00
90.00
100.00
2003 - 04 2004 - 05 2005 - 06 2006 - 07 2007 - 08 2008 - 09
BC
I Sco
re
Year
Change in BSCI scores for Brent
BSCIav BSCIcrit
50.00
60.00
70.00
80.00
90.00
100.00
2003 - 04 2004 - 05 2005 - 06 2006 - 07 2007 - 08 2008 - 09
BC
I Sco
re
Year
Change in BSCI scores for Bromley
BSCIav BSCIcrit
50.00
60.00
70.00
80.00
90.00
100.00
2003 - 04 2004 - 05 2005 - 06 2006 - 07 2007 - 08 2008 - 09
BC
I Sco
re
Year
Change in BSCI scores for Camden
BSCIav BSCIcrit
50.00
60.00
70.00
80.00
90.00
100.00
2003 - 04 2004 - 05 2005 - 06 2006 - 07 2007 - 08 2008 - 09
BC
I Sco
re
Year
Change in BSCI scores for City of London
BCIav BCIcrit
50.00
60.00
70.00
80.00
90.00
100.00
2003 - 04 2004 - 05 2005 - 06 2006 - 07 2007 - 08 2008 - 09
BC
I Sco
re
Year
Change in BSCI scores for Croydon
BCIav BCIcrit
50.00
60.00
70.00
80.00
90.00
100.00
2003 - 04 2004 - 05 2005 - 06 2006 - 07 2007 - 08 2008 - 09
BC
I Sco
re
Year
Change in BSCI scores for Ealing
BCIav BCIcrit
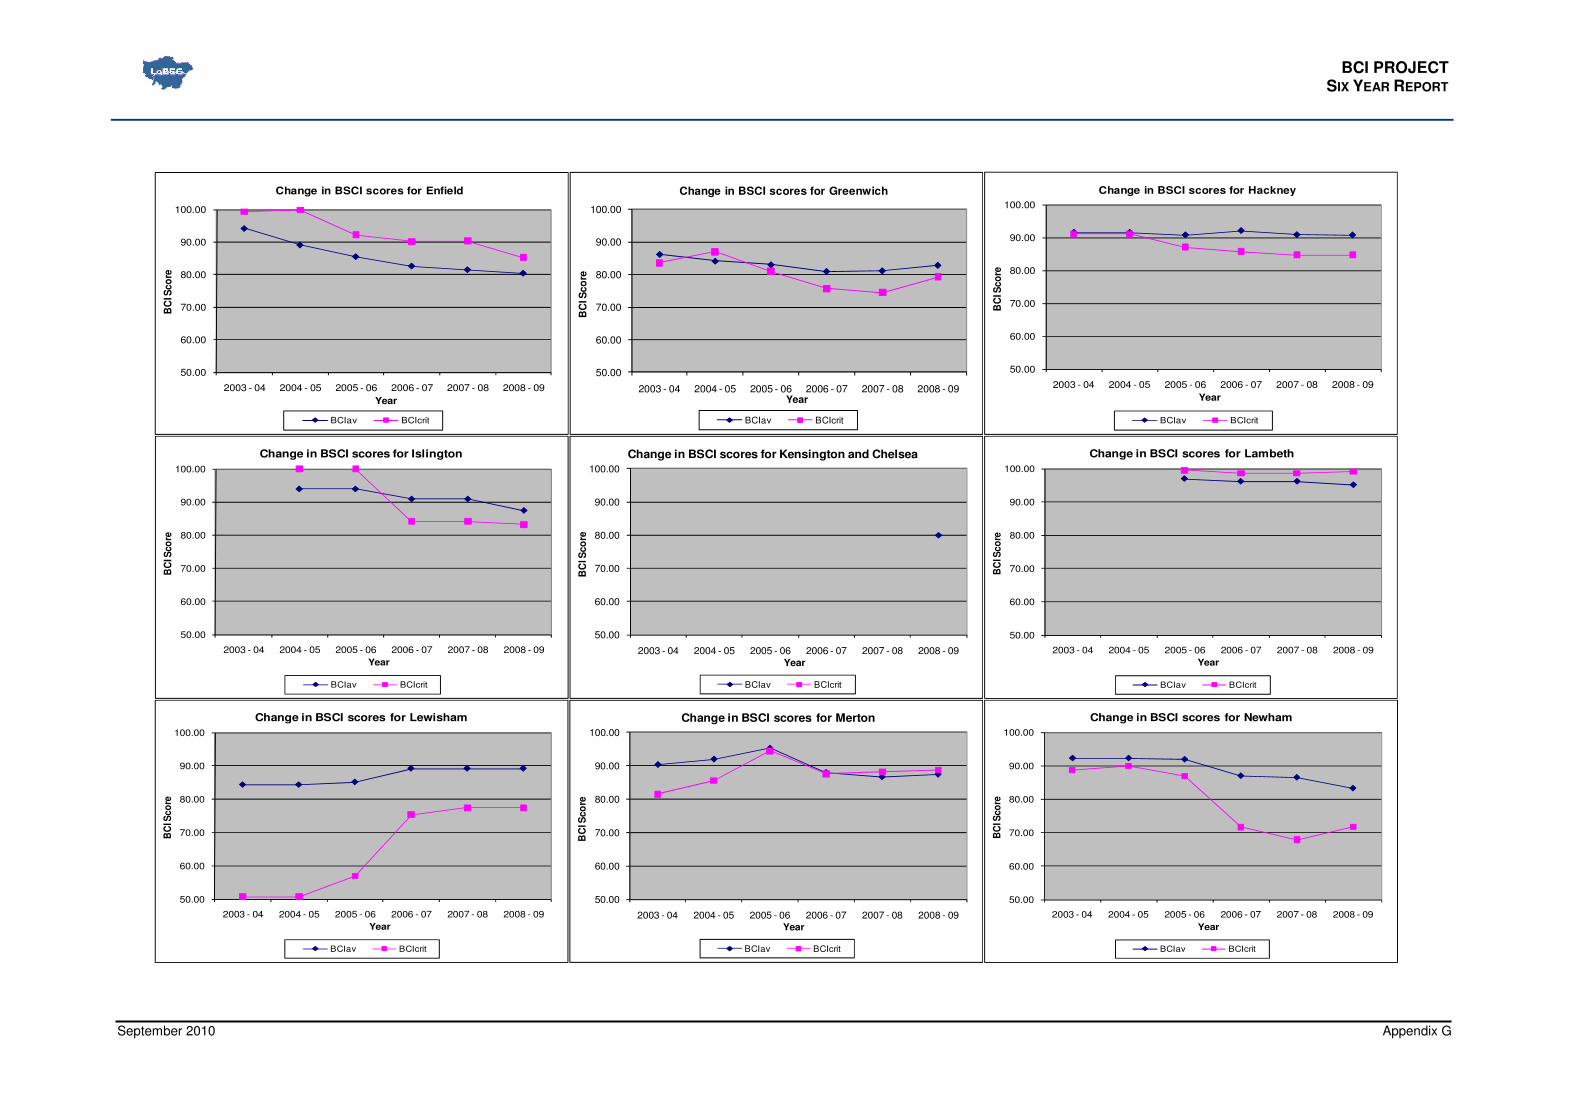
BCI PROJECT SIX YEAR REPORT
September 2010 Appendix G
50.00
60.00
70.00
80.00
90.00
100.00
2003 - 04 2004 - 05 2005 - 06 2006 - 07 2007 - 08 2008 - 09
BC
I Sco
re
Year
Change in BSCI scores for Enfield
BCIav BCIcrit
50.00
60.00
70.00
80.00
90.00
100.00
2003 - 04 2004 - 05 2005 - 06 2006 - 07 2007 - 08 2008 - 09
BC
I Sco
re
Year
Change in BSCI scores for Greenwich
BCIav BCIcrit
50.00
60.00
70.00
80.00
90.00
100.00
2003 - 04 2004 - 05 2005 - 06 2006 - 07 2007 - 08 2008 - 09
BC
I Sco
re
Year
Change in BSCI scores for Hackney
BCIav BCIcrit
50.00
60.00
70.00
80.00
90.00
100.00
2003 - 04 2004 - 05 2005 - 06 2006 - 07 2007 - 08 2008 - 09
BC
I Sco
re
Year
Change in BSCI scores for Islington
BCIav BCIcrit
50.00
60.00
70.00
80.00
90.00
100.00
2003 - 04 2004 - 05 2005 - 06 2006 - 07 2007 - 08 2008 - 09
BC
I Sco
re
Year
Change in BSCI scores for Kensington and Chelsea
BCIav BCIcrit
50.00
60.00
70.00
80.00
90.00
100.00
2003 - 04 2004 - 05 2005 - 06 2006 - 07 2007 - 08 2008 - 09
BC
I Sco
re
Year
Change in BSCI scores for Lambeth
BCIav BCIcrit
50.00
60.00
70.00
80.00
90.00
100.00
2003 - 04 2004 - 05 2005 - 06 2006 - 07 2007 - 08 2008 - 09
BC
I Sco
re
Year
Change in BSCI scores for Lewisham
BCIav BCIcrit
50.00
60.00
70.00
80.00
90.00
100.00
2003 - 04 2004 - 05 2005 - 06 2006 - 07 2007 - 08 2008 - 09
BC
I Sco
re
Year
Change in BSCI scores for Merton
BCIav BCIcrit
50.00
60.00
70.00
80.00
90.00
100.00
2003 - 04 2004 - 05 2005 - 06 2006 - 07 2007 - 08 2008 - 09
BC
I Sco
re
Year
Change in BSCI scores for Newham
BCIav BCIcrit

BCI PROJECT SIX YEAR REPORT
September 2010 Appendix G
50.00
60.00
70.00
80.00
90.00
100.00
2003 - 04 2004 - 05 2005 - 06 2006 - 07 2007 - 08 2008 - 09
BC
I Sco
re
Year
Change in BSCI scores for Redbridge
BCIav BCIcrit
50.00
60.00
70.00
80.00
90.00
100.00
2003 - 04 2004 - 05 2005 - 06 2006 - 07 2007 - 08 2008 - 09
BC
I Sco
re
Year
Change in BSCI scores for Richmond
BCIav BCIcrit
50.00
60.00
70.00
80.00
90.00
100.00
2003 - 04 2004 - 05 2005 - 06 2006 - 07 2007 - 08 2008 - 09
BC
I Sco
re
Year
Change in BSCI scores for Royal Kingston
BCIav BCIcrit
50.00
60.00
70.00
80.00
90.00
100.00
2003 - 04 2004 - 05 2005 - 06 2006 - 07 2007 - 08 2008 - 09
BC
I Sco
re
Year
Change in BSCI scores for Hammersmith and Fulham
BCIav BCIcrit
50.00
60.00
70.00
80.00
90.00
100.00
2003 - 04 2004 - 05 2005 - 06 2006 - 07 2007 - 08 2008 - 09
BC
I Sc
ore
Year
Change in BSCI scores for Haringey
BCIav BCIcrit
50.00
60.00
70.00
80.00
90.00
100.00
2003 - 04 2004 - 05 2005 - 06 2006 - 07 2007 - 08 2008 - 09
BC
I Sco
re
Year
Change in BSCI scores for Harrow
BCIav BCIcrit
50.00
60.00
70.00
80.00
90.00
100.00
2003 - 04 2004 - 05 2005 - 06 2006 - 07 2007 - 08 2008 - 09
BC
I Sco
re
Year
Change in BSCI scores for Havering
BCIav BCIcrit
50.00
60.00
70.00
80.00
90.00
100.00
2003 - 04 2004 - 05 2005 - 06 2006 - 07 2007 - 08 2008 - 09
BC
I Sco
re
Year
Change in BSCI scores for Hilingdon
BCIav BCIcrit
50.00
60.00
70.00
80.00
90.00
100.00
2003 - 04 2004 - 05 2005 - 06 2006 - 07 2007 - 08 2008 - 09
BC
I Sco
re
Year
Change in BSCI scores for Hounslow
BCIav BCIcrit

BCI PROJECT SIX YEAR REPORT
September 2010 Appendix G
50.00
60.00
70.00
80.00
90.00
100.00
2003 - 04 2004 - 05 2005 - 06 2006 - 07 2007 - 08 2008 - 09
BC
I Sco
re
Year
Change in BSCI scores for Southwark
BCIav BCIcrit
50.00
60.00
70.00
80.00
90.00
100.00
2003 - 04 2004 - 05 2005 - 06 2006 - 07 2007 - 08 2008 - 09
BC
I Sco
re
Year
Change in BSCI scores for Sutton
BCIav BCIcrit
50.00
60.00
70.00
80.00
90.00
100.00
2003 - 04 2004 - 05 2005 - 06 2006 - 07 2007 - 08 2008 - 09
BC
I Sco
re
Year
Change in BSCI scores for Tower Hamlets
BCIav BCIcrit
50.00
60.00
70.00
80.00
90.00
100.00
2003 - 04 2004 - 05 2005 - 06 2006 - 07 2007 - 08 2008 - 09
BC
I Sc
ore
Year
Change in BSCI scores for Waltham Forest
BCIav BCIcrit
50.00
60.00
70.00
80.00
90.00
100.00
2003 - 04 2004 - 05 2005 - 06 2006 - 07 2007 - 08 2008 - 09
BC
I Sc
ore
Year
Change in BSCI scores for Wandsworth
BCIav BCIcrit
50.00
60.00
70.00
80.00
90.00
100.00
2003 - 04 2004 - 05 2005 - 06 2006 - 07 2007 - 08 2008 - 09
BS
CI S
co
re
Year
Change in BSCI scores for Westminster
BCIav BCIcrit
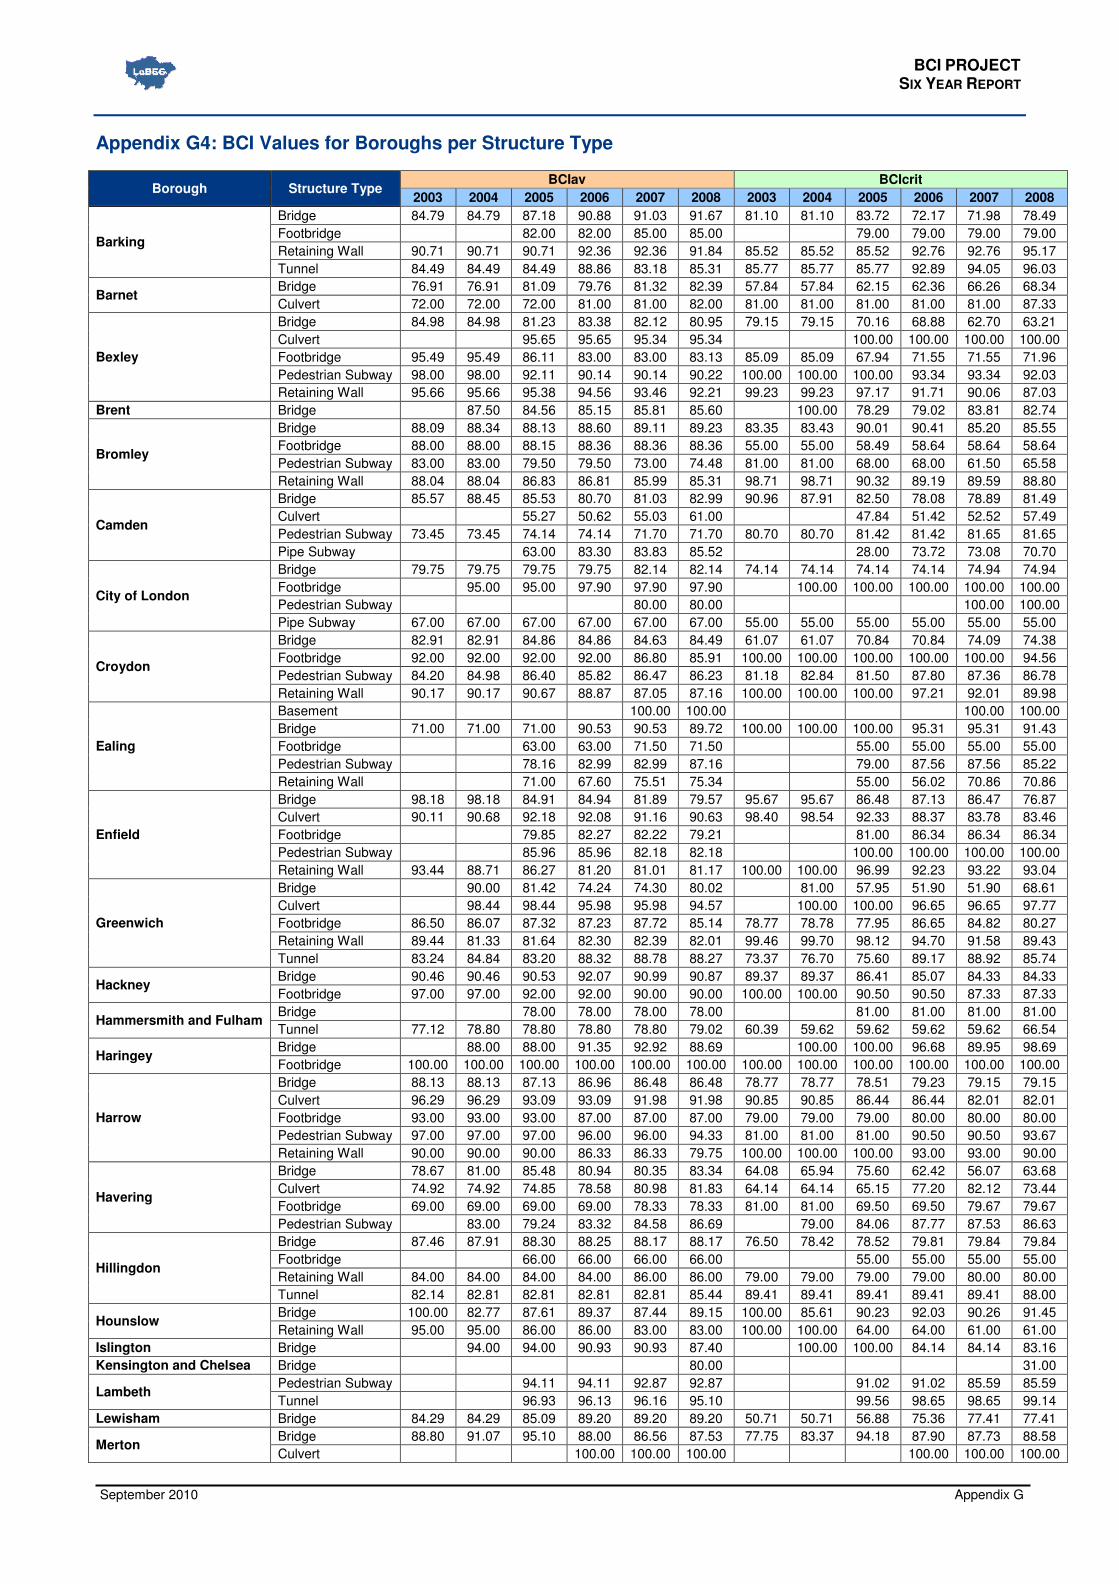
BCI PROJECT SIX YEAR REPORT
September 2010 Appendix G
Appendix G4: BCI Values for Boroughs per Structure Type
Borough Structure Type BCIav BCIcrit
2003 2004 2005 2006 2007 2008 2003 2004 2005 2006 2007 2008
Barking
Bridge 84.79 84.79 87.18 90.88 91.03 91.67 81.10 81.10 83.72 72.17 71.98 78.49
Footbridge 82.00 82.00 85.00 85.00 79.00 79.00 79.00 79.00
Retaining Wall 90.71 90.71 90.71 92.36 92.36 91.84 85.52 85.52 85.52 92.76 92.76 95.17
Tunnel 84.49 84.49 84.49 88.86 83.18 85.31 85.77 85.77 85.77 92.89 94.05 96.03
Barnet Bridge 76.91 76.91 81.09 79.76 81.32 82.39 57.84 57.84 62.15 62.36 66.26 68.34
Culvert 72.00 72.00 72.00 81.00 81.00 82.00 81.00 81.00 81.00 81.00 81.00 87.33
Bexley
Bridge 84.98 84.98 81.23 83.38 82.12 80.95 79.15 79.15 70.16 68.88 62.70 63.21
Culvert 95.65 95.65 95.34 95.34 100.00 100.00 100.00 100.00
Footbridge 95.49 95.49 86.11 83.00 83.00 83.13 85.09 85.09 67.94 71.55 71.55 71.96
Pedestrian Subway 98.00 98.00 92.11 90.14 90.14 90.22 100.00 100.00 100.00 93.34 93.34 92.03
Retaining Wall 95.66 95.66 95.38 94.56 93.46 92.21 99.23 99.23 97.17 91.71 90.06 87.03
Brent Bridge 87.50 84.56 85.15 85.81 85.60 100.00 78.29 79.02 83.81 82.74
Bromley
Bridge 88.09 88.34 88.13 88.60 89.11 89.23 83.35 83.43 90.01 90.41 85.20 85.55
Footbridge 88.00 88.00 88.15 88.36 88.36 88.36 55.00 55.00 58.49 58.64 58.64 58.64
Pedestrian Subway 83.00 83.00 79.50 79.50 73.00 74.48 81.00 81.00 68.00 68.00 61.50 65.58
Retaining Wall 88.04 88.04 86.83 86.81 85.99 85.31 98.71 98.71 90.32 89.19 89.59 88.80
Camden
Bridge 85.57 88.45 85.53 80.70 81.03 82.99 90.96 87.91 82.50 78.08 78.89 81.49
Culvert 55.27 50.62 55.03 61.00 47.84 51.42 52.52 57.49
Pedestrian Subway 73.45 73.45 74.14 74.14 71.70 71.70 80.70 80.70 81.42 81.42 81.65 81.65
Pipe Subway 63.00 83.30 83.83 85.52 28.00 73.72 73.08 70.70
City of London
Bridge 79.75 79.75 79.75 79.75 82.14 82.14 74.14 74.14 74.14 74.14 74.94 74.94
Footbridge 95.00 95.00 97.90 97.90 97.90 100.00 100.00 100.00 100.00 100.00
Pedestrian Subway 80.00 80.00 100.00 100.00
Pipe Subway 67.00 67.00 67.00 67.00 67.00 67.00 55.00 55.00 55.00 55.00 55.00 55.00
Croydon
Bridge 82.91 82.91 84.86 84.86 84.63 84.49 61.07 61.07 70.84 70.84 74.09 74.38
Footbridge 92.00 92.00 92.00 92.00 86.80 85.91 100.00 100.00 100.00 100.00 100.00 94.56
Pedestrian Subway 84.20 84.98 86.40 85.82 86.47 86.23 81.18 82.84 81.50 87.80 87.36 86.78
Retaining Wall 90.17 90.17 90.67 88.87 87.05 87.16 100.00 100.00 100.00 97.21 92.01 89.98
Ealing
Basement 100.00 100.00 100.00 100.00
Bridge 71.00 71.00 71.00 90.53 90.53 89.72 100.00 100.00 100.00 95.31 95.31 91.43
Footbridge 63.00 63.00 71.50 71.50 55.00 55.00 55.00 55.00
Pedestrian Subway 78.16 82.99 82.99 87.16 79.00 87.56 87.56 85.22
Retaining Wall 71.00 67.60 75.51 75.34 55.00 56.02 70.86 70.86
Enfield
Bridge 98.18 98.18 84.91 84.94 81.89 79.57 95.67 95.67 86.48 87.13 86.47 76.87
Culvert 90.11 90.68 92.18 92.08 91.16 90.63 98.40 98.54 92.33 88.37 83.78 83.46
Footbridge 79.85 82.27 82.22 79.21 81.00 86.34 86.34 86.34
Pedestrian Subway 85.96 85.96 82.18 82.18 100.00 100.00 100.00 100.00
Retaining Wall 93.44 88.71 86.27 81.20 81.01 81.17 100.00 100.00 96.99 92.23 93.22 93.04
Greenwich
Bridge 90.00 81.42 74.24 74.30 80.02 81.00 57.95 51.90 51.90 68.61
Culvert 98.44 98.44 95.98 95.98 94.57 100.00 100.00 96.65 96.65 97.77
Footbridge 86.50 86.07 87.32 87.23 87.72 85.14 78.77 78.78 77.95 86.65 84.82 80.27
Retaining Wall 89.44 81.33 81.64 82.30 82.39 82.01 99.46 99.70 98.12 94.70 91.58 89.43
Tunnel 83.24 84.84 83.20 88.32 88.78 88.27 73.37 76.70 75.60 89.17 88.92 85.74
Hackney Bridge 90.46 90.46 90.53 92.07 90.99 90.87 89.37 89.37 86.41 85.07 84.33 84.33
Footbridge 97.00 97.00 92.00 92.00 90.00 90.00 100.00 100.00 90.50 90.50 87.33 87.33
Hammersmith and Fulham Bridge 78.00 78.00 78.00 78.00 81.00 81.00 81.00 81.00
Tunnel 77.12 78.80 78.80 78.80 78.80 79.02 60.39 59.62 59.62 59.62 59.62 66.54
Haringey Bridge 88.00 88.00 91.35 92.92 88.69 100.00 100.00 96.68 89.95 98.69
Footbridge 100.00 100.00 100.00 100.00 100.00 100.00 100.00 100.00 100.00 100.00 100.00 100.00
Harrow
Bridge 88.13 88.13 87.13 86.96 86.48 86.48 78.77 78.77 78.51 79.23 79.15 79.15
Culvert 96.29 96.29 93.09 93.09 91.98 91.98 90.85 90.85 86.44 86.44 82.01 82.01
Footbridge 93.00 93.00 93.00 87.00 87.00 87.00 79.00 79.00 79.00 80.00 80.00 80.00
Pedestrian Subway 97.00 97.00 97.00 96.00 96.00 94.33 81.00 81.00 81.00 90.50 90.50 93.67
Retaining Wall 90.00 90.00 90.00 86.33 86.33 79.75 100.00 100.00 100.00 93.00 93.00 90.00
Havering
Bridge 78.67 81.00 85.48 80.94 80.35 83.34 64.08 65.94 75.60 62.42 56.07 63.68
Culvert 74.92 74.92 74.85 78.58 80.98 81.83 64.14 64.14 65.15 77.20 82.12 73.44
Footbridge 69.00 69.00 69.00 69.00 78.33 78.33 81.00 81.00 69.50 69.50 79.67 79.67
Pedestrian Subway 83.00 79.24 83.32 84.58 86.69 79.00 84.06 87.77 87.53 86.63
Hillingdon
Bridge 87.46 87.91 88.30 88.25 88.17 88.17 76.50 78.42 78.52 79.81 79.84 79.84
Footbridge 66.00 66.00 66.00 66.00 55.00 55.00 55.00 55.00
Retaining Wall 84.00 84.00 84.00 84.00 86.00 86.00 79.00 79.00 79.00 79.00 80.00 80.00
Tunnel 82.14 82.81 82.81 82.81 82.81 85.44 89.41 89.41 89.41 89.41 89.41 88.00
Hounslow Bridge 100.00 82.77 87.61 89.37 87.44 89.15 100.00 85.61 90.23 92.03 90.26 91.45
Retaining Wall 95.00 95.00 86.00 86.00 83.00 83.00 100.00 100.00 64.00 64.00 61.00 61.00
Islington Bridge 94.00 94.00 90.93 90.93 87.40 100.00 100.00 84.14 84.14 83.16
Kensington and Chelsea Bridge 80.00 31.00
Lambeth Pedestrian Subway 94.11 94.11 92.87 92.87 91.02 91.02 85.59 85.59
Tunnel 96.93 96.13 96.16 95.10 99.56 98.65 98.65 99.14
Lewisham Bridge 84.29 84.29 85.09 89.20 89.20 89.20 50.71 50.71 56.88 75.36 77.41 77.41
Merton Bridge 88.80 91.07 95.10 88.00 86.56 87.53 77.75 83.37 94.18 87.90 87.73 88.58
Culvert 100.00 100.00 100.00 100.00 100.00 100.00

BCI PROJECT SIX YEAR REPORT
September 2010 Appendix G
Borough Structure Type BCIav BCIcrit
2003 2004 2005 2006 2007 2008 2003 2004 2005 2006 2007 2008
Retaining Wall 98.00 98.00 98.00 87.00 87.00 82.50 100.00 100.00 100.00 77.50 77.50 67.00
Tunnel 88.00 88.00 100.00 100.00
Newham
Bridge 92.59 92.64 91.94 86.83 86.41 83.09 87.59 87.75 85.97 70.33 66.48 70.62
Culvert 72.00 72.00 75.00 75.00 58.00 58.00 56.50 56.50
Footbridge 90.65 90.65 92.30 92.30 92.14 92.14 94.02 94.02 97.01 97.01 98.01 98.01
Pedestrian Subway 94.00 94.00 94.00 92.50 92.50 87.33 100.00 100.00 100.00 100.00 100.00 93.67
Retaining Wall 87.86 90.44 89.35 89.11 88.77 86.98 100.00 100.00 97.74 97.74 96.99 96.99
Tunnel 92.00 92.00 88.00 88.00 100.00 100.00 90.50 90.50
Redbridge
Bridge 74.75 74.75 81.69 82.45 85.43 86.29 64.65 64.65 64.07 66.35 72.90 73.98
Culvert 87.46 87.46 86.01 90.77 90.67 91.51 85.47 85.47 85.47 89.90 89.90 91.01
Retaining Wall 88.00 83.49 83.49 78.13 77.72 79.88 100.00 100.00 100.00 78.76 75.66 68.03
Tunnel 96.11 96.11 94.47 100.00 100.00 100.00
Richmond Bridge 90.29 89.94 89.94 87.99 87.74 84.68 91.45 90.51 89.44 83.53 82.98 82.23
Pedestrian Subway 79.00 79.00 86.95 86.95 88.19 88.19 65.10 65.10 78.86 78.86 80.08 80.08
Royal Kingston
Bridge 90.87 90.87 91.38 91.38 91.40 81.50 81.50 81.03 81.03 81.11
Culvert 97.45 97.45 91.18 91.18 89.57 85.27 85.27 75.19 75.19 83.46
Footbridge 94.00 94.00 94.00 94.00 87.50 100.00 100.00 100.00 100.00 100.00
Pedestrian Subway 86.11 86.11 87.89 87.89 88.17 81.86 81.86 81.86 81.86 81.86
Retaining Wall 89.88 89.88 90.11 90.11 89.19 94.51 94.51 92.64 92.64 91.91
Southwark Retaining Wall 91.00 91.00 77.50 100.00 100.00 100.00
Sutton
Bridge 96.82 96.82 95.59 95.59 95.87 95.87 100.00 100.00 93.85 93.85 94.14 94.14
Culvert 98.57 92.55 88.63 91.98 91.88 100.00 66.97 59.38 75.89 77.00
Footbridge 94.00 94.00 94.00 94.00 94.00 94.00 58.00 58.00 58.00 58.00 58.00 58.00
Retaining Wall 88.32 88.32 88.32 84.97 84.97 80.08 100.00 100.00 100.00 92.45 92.45 89.94
Tower Hamlets Bridge 80.00 80.00 80.00 80.00 81.33 79.00 79.00 89.50 89.50 93.00
Pedestrian Subway 88.95 88.95 86.24 100.00 100.00 95.03
Waltham Forest Bridge 88.97 88.97 83.56 82.42 81.70 80.80 81.56 81.56 73.78 73.17 71.71 69.91
Culvert 90.00 90.00 90.00 90.00 93.00 93.00 100.00 100.00 100.00 100.00 100.00 100.00
Wandsworth Bridge 69.00 77.85 86.87 84.22 81.28 83.00 55.00 63.52 77.90 65.15 65.15 74.88
Tunnel 84.00 84.00 72.00 58.00 58.00 56.50
Westminster
Bridge 100.00 100.00 95.83 93.70 93.70 96.42 100.00 100.00 84.13 84.13 84.13 90.98
Pedestrian Subway 100.00 100.00 91.81 91.81 91.61 91.23 100.00 100.00 87.03 87.03 85.37 71.32
Pipe Subway 99.19 98.89 95.60 93.13 93.13 89.60 100.00 98.96 93.68 87.89 87.89 86.54
Retaining Wall 100.00 90.06 92.99 92.99 92.03 91.96 100.00 88.11 86.53 86.53 86.53 86.13
Tunnel 94.00 84.92 55.00 68.31
Vault 99.00 99.00 99.00 100.00 100.00 100.00

Richard McFarlane The Royal Borough of Kingston upon Thames Directorate of Environmental Services Guildhall II Kingston upon Thames KT1 1EU Tel: 020 8547 5918 E-mail: [email protected]
Top Related