


Languages
Pages
Legal

7/24/2019 Literatur PH Dan Suhu
http://slidepdf.com/reader/full/literatur-ph-dan-suhu 1/9
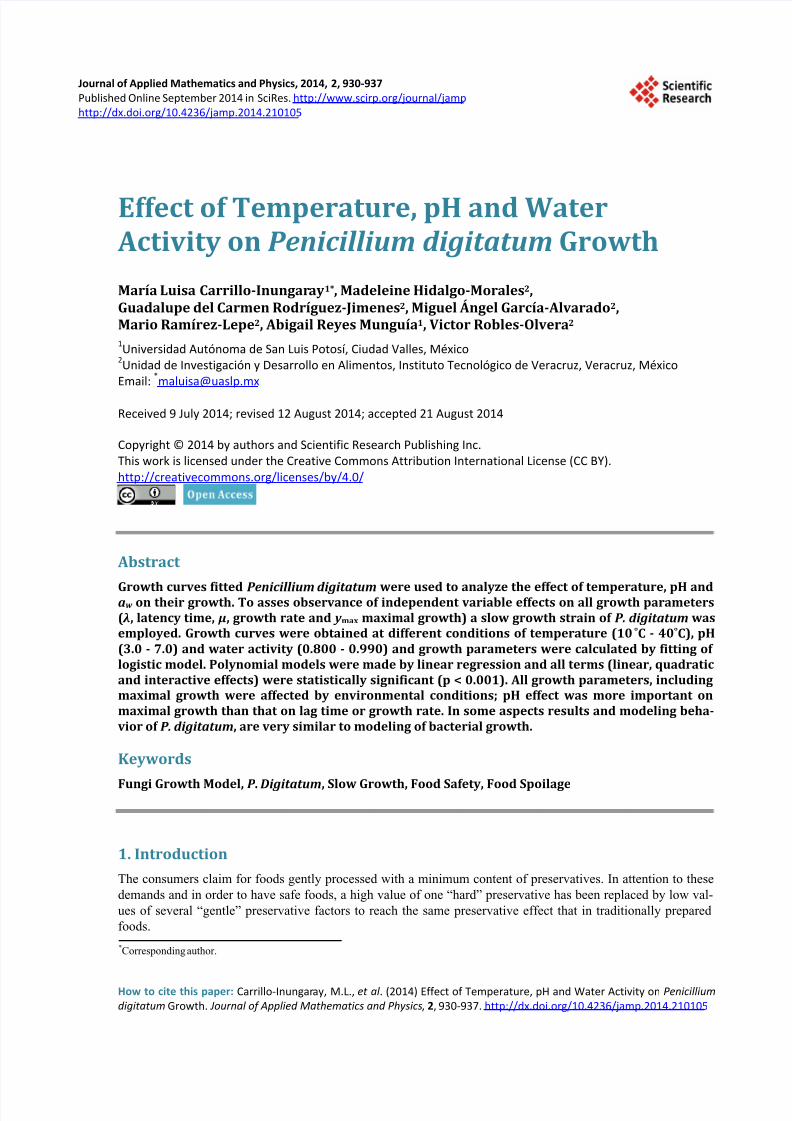
Journal of Applied Mathematics and Physics, 2014, 2, 930-937
Published Online September 2014 in SciRes. http://www.scirp.org/journal/jamp http://dx.doi.org/10.4236/jamp.2014.210105
How to cite this paper: Carrillo-Inungaray, M.L., et al . (2014) Effect of Temperature, pH and Water Activity on Penicillium
digitatum Growth. Journal of Applied Mathematics and Physics, 2, 930-937. http://dx.doi.org/10.4236/jamp.2014.210105
Effect of Temperature, pH and Water Activity on Penicillium digitatum Growth
María Luisa Carrillo-Inungaray1*, Madeleine Hidalgo-Morales2,Guadalupe del Carmen Rodríguez-Jimenes2, Miguel Ángel García-Alvarado2,Mario Ramírez-Lepe2, Abigail Reyes Munguía1, Victor Robles-Olvera2 1Universidad Autónoma de San Luis Potosí, Ciudad Valles, México
2Unidad de Investigación y Desarrollo en Alimentos, Instituto Tecnológico de Veracruz, Veracruz, México
Email:*[email protected]
Received 9 July 2014; revised 12 August 2014; accepted 21 August 2014
Copyright © 2014 by authors and Scientific Research Publishing Inc.
This work is licensed under the Creative Commons Attribution International License (CC BY).
http://creativecommons.org/licenses/by/4.0/
Abstract
Growth curves fitted Penicillium digitatum were used to analyze the effect of temperature, pH andaw on their growth. To asses observance of independent variable effects on all growth parameters( λ, latency time, μ, growth rate and y max maximal growth) a slow growth strain of P. digitatum wasemployed. Growth curves were obtained at different conditions of temperature (10˚C - 40˚C), pH(3.0 - 7.0) and water activity (0.800 - 0.990) and growth parameters were calculated by fitting oflogistic model. Polynomial models were made by linear regression and all terms (linear, quadraticand interactive effects) were statistically significant (p < 0.001). All growth parameters, includingmaximal growth were affected by environmental conditions; pH effect was more important onmaximal growth than that on lag time or growth rate. In some aspects results and modeling beha-vior of P. digitatum, are very similar to modeling of bacterial growth.
Keywords
Fungi Growth Model, P . Digitatum, Slow Growth, Food Safety, Food Spoilage
1. Introduction
The consumers claim for foods gently processed with a minimum content of preservatives. In attention to these
demands and in order to have safe foods, a high value of one “hard” preservative has been replaced by low val-
ues of several “gentle” preservative factors to reach the same preservative effect that in traditionally prepared
foods.
*Corresponding author.
7/24/2019 Literatur PH Dan Suhu
http://slidepdf.com/reader/full/literatur-ph-dan-suhu 2/9
M. L. Carrillo-Inungaray et al .
931
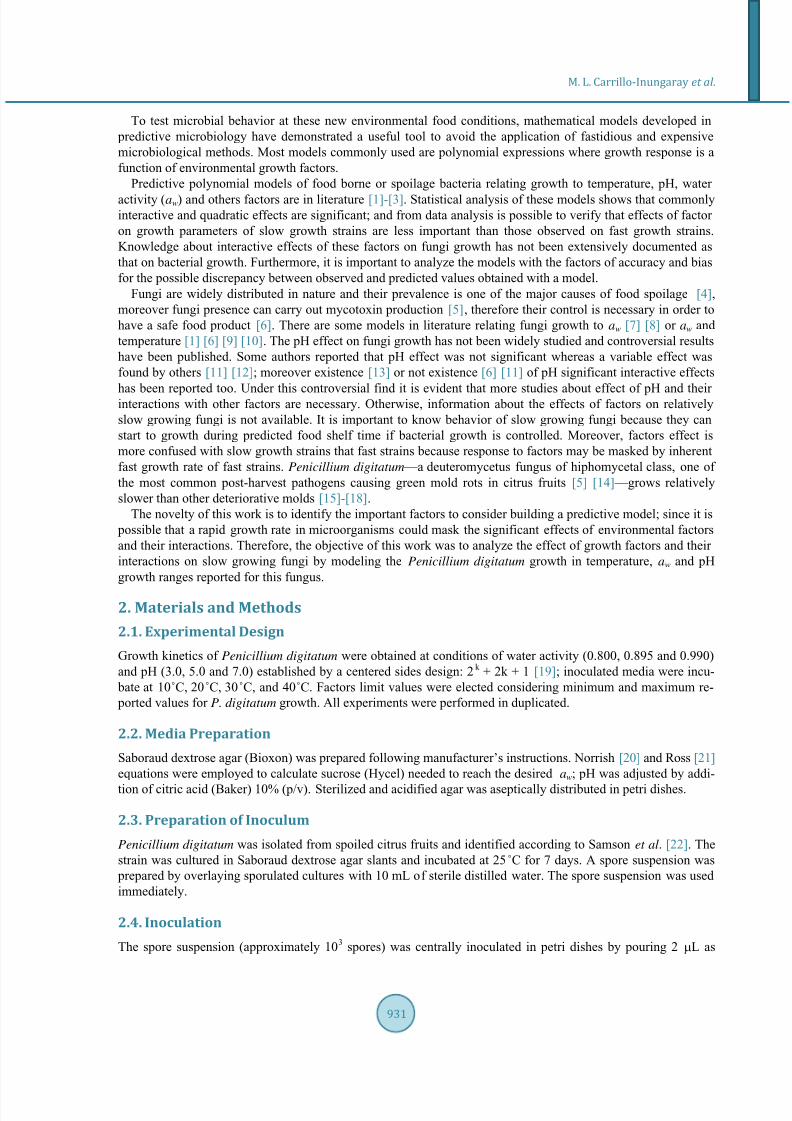
To test microbial behavior at these new environmental food conditions, mathematical models developed in
predictive microbiology have demonstrated a useful tool to avoid the application of fastidious and expensive
microbiological methods. Most models commonly used are polynomial expressions where growth response is a
function of environmental growth factors. Predictive polynomial models of food borne or spoilage bacteria relating growth to temperature, pH, water
activity (aw) and others factors are in literature [1]-[3]. Statistical analysis of these models shows that commonlyinteractive and quadratic effects are significant; and from data analysis is possible to verify that effects of factor
on growth parameters of slow growth strains are less important than those observed on fast growth strains.
Knowledge about interactive effects of these factors on fungi growth has not been extensively documented as
that on bacterial growth. Furthermore, it is important to analyze the models with the factors of accuracy and bias
for the possible discrepancy between observed and predicted values obtained with a model.
Fungi are widely distributed in nature and their prevalence is one of the major causes of food spoilage [4],
moreover fungi presence can carry out mycotoxin production [5], therefore their control is necessary in order to
have a safe food product [6]. There are some models in literature relating fungi growth to aw [7] [8] or aw and
temperature [1] [6] [9] [10]. The pH effect on fungi growth has not been widely studied and controversial results
have been published. Some authors reported that pH effect was not significant whereas a variable effect was
found by others [11] [12]; moreover existence [13] or not existence [6] [11] of pH significant interactive effects
has been reported too. Under this controversial find it is evident that more studies about effect of pH and theirinteractions with other factors are necessary. Otherwise, information about the effects of factors on relatively
slow growing fungi is not available. It is important to know behavior of slow growing fungi because they can
start to growth during predicted food shelf time if bacterial growth is controlled. Moreover, factors effect is
more confused with slow growth strains that fast strains because response to factors may be masked by inherent
fast growth rate of fast strains. Penicillium digitatum —a deuteromycetus fungus of hiphomycetal class, one of
the most common post-harvest pathogens causing green mold rots in citrus fruits [5] [14] —grows relatively
slower than other deteriorative molds [15]-[18].
The novelty of this work is to identify the important factors to consider building a predictive model; since it is
possible that a rapid growth rate in microorganisms could mask the significant effects of environmental factors
and their interactions. Therefore, the objective of this work was to analyze the effect of growth factors and their
interactions on slow growing fungi by modeling the Penicillium digitatum growth in temperature, aw and pH
growth ranges reported for this fungus.
2. Materials and Methods
2.1. Experimental Design
Growth kinetics of Penicillium digitatum were obtained at conditions of water activity (0.800, 0.895 and 0.990)
and pH (3.0, 5.0 and 7.0) established by a centered sides design: 2k + 2k + 1 [19]; inoculated media were incu-
bate at 10˚C, 20˚C, 30˚C, and 40˚C. Factors limit values were elected considering minimum and maximum re-
ported values for P. digitatum growth. All experiments were performed in duplicated.
2.2. Media Preparation
Saboraud dextrose agar (Bioxon) was prepared following manufacturer’s instructions. Norrish [20] and Ross [21]
equations were employed to calculate sucrose (Hycel) needed to reach the desired aw; pH was adjusted by addi-
tion of citric acid (Baker) 10% (p/v). Sterilized and acidified agar was aseptically distributed in petri dishes.
2.3. Preparation of Inoculum
Penicillium digitatum was isolated from spoiled citrus fruits and identified according to Samson et al. [22]. The
strain was cultured in Saboraud dextrose agar slants and incubated at 25˚C for 7 days. A spore suspension was
prepared by overlaying sporulated cultures with 10 mL of sterile distilled water. The spore suspension was used
immediately.
2.4. Inoculation
The spore suspension (approximately 103 spores) was centrally inoculated in petri dishes by pouring 2 µL as
7/24/2019 Literatur PH Dan Suhu
http://slidepdf.com/reader/full/literatur-ph-dan-suhu 3/9
M. L. Carrillo-Inungaray et al .
932
was indicated by Fustier et al. [23] to give a circular inoculum of 2.5 mm of diameter. The inoculated plates
were incubated for 20 days in hermetically closed plastic containers to avoid dehydration.
2.5. Fit of Fungi Growth Curves
The colony size increase was followed by measuring colony diameter every day and this was plotted versus in-cubation time. Growth parameters were calculated by fitting of logistic equation (Equation (1)):
( )max
max
max
0
1 1 e n A t
y y
y
y
µ −
=
+ −
(1)
where ( ) ( )
( )
0,
,n
t A t
t t
λ
λ λ
≤=
− ≥, max y is maximum growth; 0 y , initial inoculums; maxµ , growth rate and
( )n A t is a discontinuity in the time.
2.6. Model Development
Polynomial models relating natural logarithm of P. digitatum growth parameters (growth rate, lag time andmaximum growth) to temperature, aw and pH were built by linear regression. Natural logarithm of growth para-
meters was choose with the purpose of diminish variance and avoid negative lag phases.
2.7. Performance Analysis of Models
Models were analyzed by the accuracy ( AF ) (Equation (2)) and bias factors ( BF ) (Equation (3)), introduced
by Ross [24], modified by Baranyi et al. [25] and as were used by López et al. [26]. These factors were calcu-
lated as follow:
( )2
1exp
n
k
LnP LnO
AF n
=
−
=
∑ (2)
( )1exp
n
k
LnP LnO
BF n
=
−
=
∑ (3)
were P and O are predicted and observed values, respectively, and n is the experimental points number. A bias
factor value greater than 1 indicate that, on average, predicted are greater than observed values; otherwise, an
accuracy factor of 1 indicate a good concordance between predicted and observed values.
3. Results and Discussion
Below are presented the results of the effect of temperature, pH and water activity on Penicillium digitatum-growth.
3.1. Results of Penicillium digitatum Growth
P. digitatum growth was observed in 23 of 36 experimental conditions. Not growth was reported when lag time
was prolonged after an incubation time of 20 days and this occurred at extremes experimental conditions of
temperature, aw or pH. Except for lag time, each growth phase was well described by growth curves and their
shape was concordant with experimental conditions. Generally, when two factors remain constant, effect of third
factor gave curves sufficiently separates to observe effect levels of such factor. Consequently, calculated growth
parameters (Table 1) were coherent and, as it was expected, minimal and maximum growth were observed at
extreme and central conditions, respectively.

7/24/2019 Literatur PH Dan Suhu
http://slidepdf.com/reader/full/literatur-ph-dan-suhu 4/9
M. L. Carrillo-Inungaray et al .
933
Table 1. Growth parameters of Penicillium digitatum at different experimental conditions calculated by logistic model.
Condition Growth parameter
T aw pH (h) (mm⋅h−1) ymax (mm)
10 0.990 3 106.74 0.009 8.49
10 0.990 5 99.732 0.017 7.27
10 0.990 7 292.95 0.023 5.88
20 0.800 5 221.22 0.017 6.12
20 0.800 7 147.97 0.017 13.79
20 0.895 3 112.91 0.009 8.04
20 0.895 5 48.409 0.015 11.17
20 0.895 7 65.246 0.017 14.58
20 0.990 3 6.7422 0.018 26.37
20 0.990 5 5.8246 0.032 21.23
20 0.990 7 15.819 0.041 16.17
30 0.800 5 55.023 0.022 9.2830 0.800 7 34.029 0.021 19.66
30 0.895 3 33.939 0.012 10.83
30 0.895 5 13.454 0.019 14.11
30 0.895 7 16.765 0.020 17.39
30 0.990 3 2.2646 0.022 29.69
30 0.990 5 1.8088 0.038 22.49
30 0.990 7 4.5418 0.047 16.12
40 0.800 7 41.609 0.016 10.17
40 0.990 3 4.0443 0.017 12.13
40 0.990 5 2.9867 0.028 8.64
40 0.990 7 6.9338 0.033 5.83
3.2. Results of Factors Effect on Lag Time
Lag time was measured in most cases where growth was observed, and it was as long as 293 h at extreme condi-
tions. Not correlation was found between lag time and growth rate but generally slowest growth rates match
with long latency times and small maximal growth. Temperature increases of 10˚C caused not proportional re-
duction of latency times, at pH 3 and aw 0.990, lag times are 16 times longer at 10˚C than at 20˚C, and 3 times
longer at 20˚C than 30˚C, but around 0.5 times at 30˚C than at 40˚C. In most conditions, at same temperature and
aw values, lag times are longer at extreme pH (3 and 7) than at central value (pH 5). Repeatedly, lag times are two
or three times longer at pH 7 than a pH 5; whereas those obtained at pH 3 are bigger but very close to those cal-
culated at pH 5 (except for 0.895 aw). Otherwise, lag times are progressively shorter as aw values are increased.
3.3. Results of Factors Effect on Growth Rate
In all tested conditions, growth rates were generally smaller than those reported for other deteriorative fungi [9]
[11] [15] even 10 times smaller than other P. digitatum strains reported by Plaza et al. [19] and Dantigny et al.
[27]. These differences between growth rates observed and those reported in literature can be related primarily
to differences between strains nature.
Growth rate of P. digitatum showed an optimum temperature value between 20˚C and 30˚C, similar to these
reported by Plaza et al. [18]. It was noted that P. digitatum tolerance to experimental extreme temperatures
(10˚C and 40˚C) increased when aw values were increased. Growth rates obtained at pH 5 and 7 were very simi-
lar and higher than those observed at pH 3. These results are concordant with that published by Neumeyer’s
team [28] who established that Pseudomonas growth rate is unaffected by pH in the range pH 5.4 to 8.6. Similar
7/24/2019 Literatur PH Dan Suhu
http://slidepdf.com/reader/full/literatur-ph-dan-suhu 5/9
M. L. Carrillo-Inungaray et al .
934
results have been reported for fungi growth [5] [11] [12], in general, when pH interval studied is around of op-
timal pH range for microorganism growth, not significant lineal or interactive effects were found regardless of
acids nature (acetic, lactic, phosphoric, citric or hydrochloric acids) used to adjust pH. Otherwise, significant ef-
fects were reported when pH range studied is far of optimal region for growth when potassium citrate [13] was
used to buffering media in a pH range of 2.8 to 3.3. With this arguments and bearing in mind the parabolic clas-
sic shape obtained when pH is plotted versus growth rate, it is logic to find significant effects when all pHgrowth range is analyzed. Besides pH interval studied or nature of acid used to adjust pH, differences between
effects could be due also to inherent acid tolerance and optimal growth pH of each microorganism.
3.4. Results of Factors Effect on Maximal Growth
Maximal growth was observed at 30˚C, pH 3 and 0.990 aw values and this growth parameter increased as pH or
aw values were augmented. These results are interesting because maximal growth is commonly limited by nu-
trient availability or toxic metabolites accumulation, and its maximal value is finally reached earlier or later ac-
cording to lag time and growth rate. In consequence, frequently this growth parameter does not show correlation
with environmental factors, in fact, it is common to find in literature only lag time and growth rate models.
3.5. Results of Analysis and Performance of Developed Models
Since P. digitatum is a citrus spoilage fungus, a predictive model of P. digitatum growth on citrus products
should be expected. In this sense, data for building model should be obtained from P. digitatum growth on a
medium of a citrus similar composition, However, when models are created of this way, levels of independent
variable, as pH or aw, are restricted by food nature (because its stability can be affected); consequently, effects of
independent variables cannot be quantified. Therefore, to measure the effect of studied variables, laboratory
culture media are the best option, although the model applicability obtained by this way is limited and validation
tests are necessary before model use. Because the objective of this paper was to analyze independent variables
effect, this last strategy to develop models was used in this work.
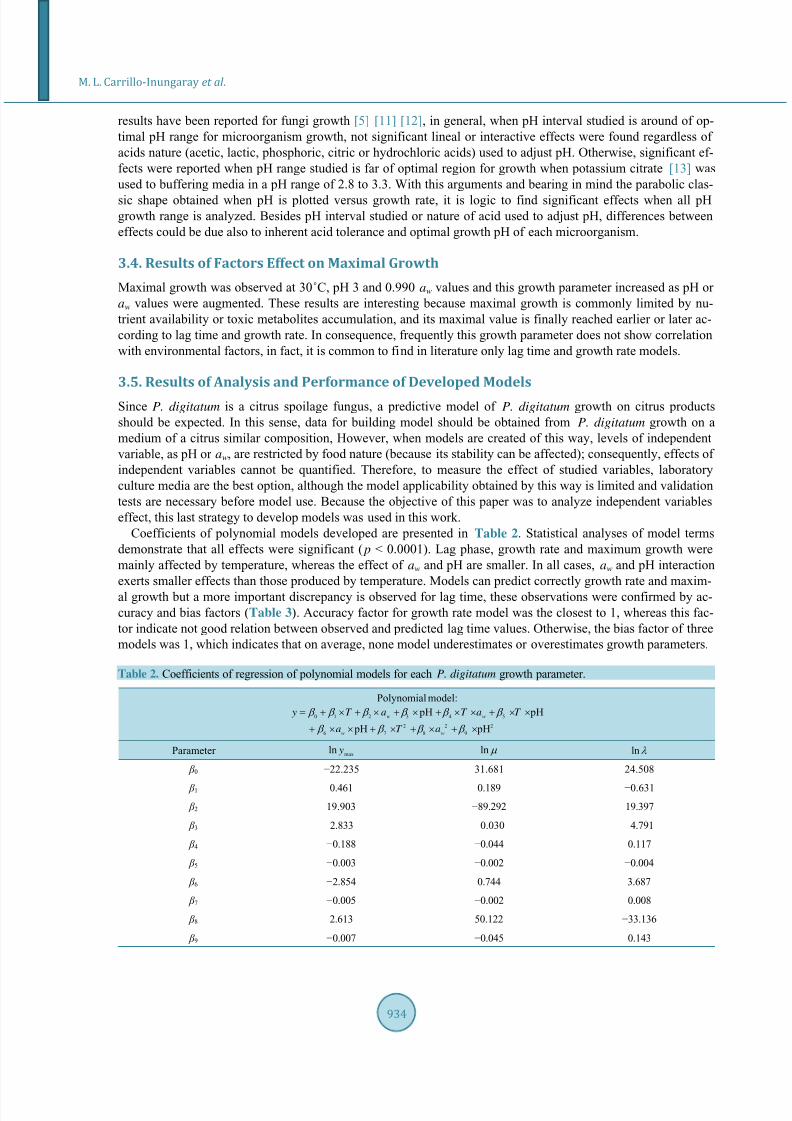
Coefficients of polynomial models developed are presented in Table 2. Statistical analyses of model terms
demonstrate that all effects were significant ( p < 0.0001). Lag phase, growth rate and maximum growth were
mainly affected by temperature, whereas the effect of aw and pH are smaller. In all cases, aw and pH interaction
exerts smaller effects than those produced by temperature. Models can predict correctly growth rate and maxim-
al growth but a more important discrepancy is observed for lag time, these observations were confirmed by ac-
curacy and bias factors (Table 3). Accuracy factor for growth rate model was the closest to 1, whereas this fac-
tor indicate not good relation between observed and predicted lag time values. Otherwise, the bias factor of three
models was 1, which indicates that on average, none model underestimates or overestimates growth parameters.
Table 2. Coefficients of regression of polynomial models for each P. digitatum growth parameter.
Polynomial model:
0 1 2 3 4 5
2 2 2
6 7 8 9
pH pH
pH pH
w w
w w
y T a T a T
a T a
β β β β β β
β β β β
= + × + × + × + × × + × ×
+ × × + × + × + ×
Parameter maxln y lnµ lnλ
β 0 −22.235 31.681 24.508
β 1 0.461 0.189 −0.631
β 2 19.903 −89.292 19.397
β 3 2.833 −0.030 −4.791
β 4 −0.188 −0.044 0.117
β 5 −0.003 −0.002 −0.004
β 6 −2.854 0.744 3.687
β 7 −0.005 −0.002 0.008
β 8 2.613 50.122 −33.136
β 9 −0.007 −0.045 0.143

7/24/2019 Literatur PH Dan Suhu
http://slidepdf.com/reader/full/literatur-ph-dan-suhu 6/9
M. L. Carrillo-Inungaray et al .
935
Table 3. Accuracy and bias factors of polynomial models of P. digitatum growth.
Model Accuracy factor Bias factor
µ 1.28 1.00
λ 2.43 1.00
ymax 1.51 1.00
Predicted curves are generally described between replicates and the variability observed is product of varia-
bility propagation of each predicted growth parameter. As was established previously, the more important dis-
cordance between observed and predicted values was obtained with latency model, results of this nature are
commonly observed in lag time models for bacterial growth models. This discordance is originated by high va-
riability of observed lag time. A more important variability has been previously reported for lag time than for
growth rate [29] and it has been explained because growth rate is one implicit characteristic of the microorgan-
ism, while lag time is more affected by not controlled variables [30] [31] such as time and environmental history.
4. Conclusion
These results suggest that implicit growth rate is an important factor to take into account when a strain is elected
to build a predictive model; it is possible that a fast growth rate could mask significant effects of environmental
factors (such pH) as well as their interactions. These results showed that pH exerts a significant effect, further-
more, interactive and quadratic effects are too significant—at least when citric acid is used to adjust pH, and
they are regularly underrated when fungi growth models are developed. Since the most important effect of pH is
observed on maximal growth, it is important to verify nonexistence of factor effects before omitting the model-
ing on this growth parameter. Nevertheless, further studies on effect of undissociated acid concentration and na-
ture of acid and solute employed to adjust pH and aw, are necessary.
Acknowledgements
Authors would like to tanks Universidad Autónoma de San Luis Potosí, toallstaff at Unidad de Investigación y
Desarrollo en Alimentos of Instituto Tecnológico de Veracruz and to Consejo Nacional de Ciencia y Tecnología
(CONACyT), México, for their support for this work.
References
[1] Cuppers, H.G., Oomes, S. and Brul, S. (1997) A Model for the Combined Effects of Temperature and Salt Concentra-
tion on Growth Rate of Food Spoilage Molds. Applied Environmental Microbiology, 6310, 3764-3769.
[2] Lebert, I., Robles Olvera, V. and Lebert, A. (2000) Application of Polynomial Models to Predict Growth of MixedCultures of Pseudomonas spp. and Listeria in Meat. International Journal Food Microbiology, 61, 27-39.http://dx.doi.org/10.1016/S0168-1605(00)00359-7
[3] Mellefont, L.A., McMeekin, T.A. and Ross, T. (2003) Performance Evaluation of a Model Describing the Effects ofTemperature, Water Activity, pH and Lactic Acid Concentration on the Growth of Escherichia coli. International
Journal Food Microbiology, 821, 45-58. http://dx.doi.org/10.1016/S0168-1605(02)00253-2
[4]
Marcet-Houben, M., Ballester, A.R., De la Fuente, B., Harries, E., González-Candelas, J.M.L. and Gabaldón, T. (2012)
Genome Sequence of the Necrotrophic Fungus Penicillium digitatum, the Main Postharvest Pathogen of Citrus. BMC
Genomics, 13, 646.
[5] Gatto, M.A., Ippolito A., Linsalata, V., Cascatano, N.A., Nigro, F., Vanadia, S. and Di Venere, D. (2011) Activity ofExtracts from Wild Edible Herbs against Postharvest Fungal Diseases of Fruit and Vegetables. Postharvest Biology
and Technology, 61, 72-82. http://dx.doi.org/10.1016/j.postharvbio.2011.02.005
[6] Guynot, M.E., Marin, S., Sanchis, V. and Ramos, A.J. (2003) Modified Atmosphere Packaging for Prevention of MoldSpoilage of Bakery Products with Different pH and Water Activity Levels . Journal of Food Protection, 6610, 1864-1872.
[7] Sautour, M., Dantigny, P., Divies, C. and Bensoussan, M. (2001) A Temperature-Type Model for Describing the Rela-
tionship between Fungal Growth and Water Activity. International Journal Food Microbiology, 67, 63-69.http://dx.doi.org/10.1016/S0168-1605(01)00471-8
[8]
Valik, L., Baranyi, J. and Gorner, F. (1999) Predicting Fungal Growth: The Effect of Water Activity on Penicillium
7/24/2019 Literatur PH Dan Suhu
http://slidepdf.com/reader/full/literatur-ph-dan-suhu 7/9
M. L. Carrillo-Inungaray et al .
936
roqueforti. International Journal Food Microbiology, 47, 141-146.http://dx.doi.org/10.1016/S0168-1605(98)00201-3
[9] Abellana, M., Benedi, J., Sanchis, V. and Ramos, A.J. (1999) Water Activity and Temperature Effects on Germinationand Growth of Eurotium amstelodami, E . chevalieri and E . herbariorum Isolates from Bakery Products. Journalof
Applied Microbiology, 873, 371-380. http://dx.doi.org/10.1046/j.1365-2672.1999.00828.x
[10]
Sautour, M., Soares-Mansur, C., Divies, C., Bensoussan, M. and Dantigny, P. (2002) Comparison of the Effects ofTemperature and Water Activity on Growth Rate of Food Spoilage Moulds. Journal of Industrial Microbiology and
Biotechnology, 286, 311-315. http://dx.doi.org/10.1038/sj.jim.7000248
[11] Gock, M.A., Hocking, A.D., Pitt, J.I. and Poulos, P.G. (2003) Influence of Temperature, Water Activity and pH onGrowth of Some Xerophilic Fungi International Journal Food Microbiology, 811, 11-19.http://dx.doi.org/10.1016/S0168-1605(02)00166-6
[12]
Panagou, E.Z., Skandamis, P.N. and Nychas, G.J.E. (2003) Modeling the Combined Effect of Temperature, pH and a w
on the Growth Rate of Monascus ruber , a Heat-Resistant Fungus Isolated from Green Table Olives. Journal of Applied
Microbiology, 94, 146-156. http://dx.doi.org/10.1046/j.1365-2672.2003.01818.x
[13] Battey, A.S., Duffy, S. and Schaffner, D.W. (2001) Modeling Mould Spoilage in Cold-Filled Ready-to-Drink Beve-rages by Aspergillus niger and Penicillium spinulosum. Food Microbiology, 185, 521-529.
http://dx.doi.org/10.1006/fmic.2001.0438
[14] Daferera, D.J., Ziogas, B.N. and Polissiou, M.G. (2000) GC-MS Analysis of Essential Oils from Some Greek Aromatic
Plants and Their Fungitoxicity on Penicillium digitatum. Journal of Agricultural Food Chemistry, 486, 2576-2581.http://dx.doi.org/10.1021/jf990835x
[15] López-Malo, A., Alzamora, S.M. and Argaiz, A. (1998) Vanillin and pH Synergistic Effects on Mold Growth. Journal
of Food Science, 631, 143-146. http://dx.doi.org/10.1111/j.1365-2621.1998.tb15695.x
[16] Matamoros-Leon, B., Argaiz, A. and López-Malo, A. (1999) Individual and Combined Effects of Vanillin and Potas-sium Sorbate on Penicillium digitatum, Penicillium glabrum, and Penicillium italicum Growth. Journal of Food Pro-
tection, 625, 540-542.
[17] Plaza, P., Usall, J., Teixidó, N. and Viñas, I. (2004) Effect of Water Activity and Temperature on Competing Abilitiesof Common Postharvest Citrus Fungi. International Journal Food Microbiology, 901, 75-82.http://dx.doi.org/10.1016/S0168-1605(03)00292-7
[18] Plaza, P., Usall, J., Teixidó, N. and Viñas, I. (2003) Effect of Water Activity and Temperature on Germination andGrowth of Penicillium digitatum, P. italicum and Geotrichum candidum. Journal of Applied Microbiology, 94, 549-554. http://dx.doi.org/10.1046/j.1365-2672.2003.01909.x
[19]
Montgomery, D.C. (2000) Design and Analysis of Experiments. 5th Edition, John Wiley & Sons, New York.
[20] Norrish, R.S. (1966) An Equation for the Activity Coefficients and Equilibrium Relative Humidities of Water in Con-fectionery Syrups. International Journal of Food Science & Technology, 1, 25-39.http://dx.doi.org/10.1111/j.1365-2621.1966.tb01027.x
[21] Ross, K.D. (1975) Estimation of Water Activity in Intermediate Moisture Foods. Food Technology, 29, 26-34.
[22] Samson, A., Hoekstra, E.S., Frisvad, J.C. and Filtenborg, O. (1995) Introduction to Food-Borne Fungi. 4th Edition,
Centraalbureau voor schimmelcultures, Baarn and Delft, The Netherlands.
[23] Fustier, P., Lafond, A., Champagne, C.P. and Lamarche, F. (1998) Effect of Inoculation Techniques and Relative Hu-midity on the Growth of Molds on the Surfaces of Yellow Layer Cakes. Applied Environmental Microbiology, 641,192-196.
[24] Ross, T. (1996) Indices for Performance Evaluation of Predictive Models in Food Microbiology. Journal of Applied
Bacteriology, 815, 501-508.
[25]
Baranyi, J., Pin, C. and Ross, T. (1999) Validating and Comparing Predictive Models. International Journal of Food Microbiology, 483, 159-166. http://dx.doi.org/10.1016/S0168-1605(99)00035-5
[26] López, S., Prieto, M., Dijkstra, J., Dhanoa, M.S. and France, J. (2004) Statistical Evaluation of Mathematical Modelsfor Microbial Growth. International Journal of Food Microbiology, 963, 289-300.http://dx.doi.org/10.1016/j.ijfoodmicro.2004.03.026
[27]
Dantigny, P., Guilmart, A., Radoi, F., Bensoussan, M. and Zwietering, M. (2005) Modelling the Effect of Ethanol on
Growth Rate of Food Spoilage Moulds. International Journal of Food Microbiology, 98, 261-269.
[28] Neumeyer, K., Ross, T. and Mcmeekin, T.A. (1997) Development of a Predictive Model to Describe the Effects ofTemperature and Water Activity on the Growth of Spoilage Pseudomonads. International Journal of Food Microbiol-
ogy, 38, 45-54. http://dx.doi.org/10.1016/S0168-1605(97)00089-5
[29] McKellar, R.C. and Knight, K. (2000) A Combined Discrete-Continuous Model Describing the Lag Phase of Listeria

7/24/2019 Literatur PH Dan Suhu
http://slidepdf.com/reader/full/literatur-ph-dan-suhu 8/9
M. L. Carrillo-Inungaray et al .
937
monocytogenes. International Journal of Food Microbiology, 54, 171-180.http://dx.doi.org/10.1016/S0168-1605(99)00204-4
[30] Baranyi, J. and Roberts, T.A. (1994) A Dynamic Approach to Predicting Bacterial Growth in Food. International Jour-
nal of Food Microbiology, 23, 277-294. http://dx.doi.org/10.1016/0168-1605(94)90157-0
[31] Parra, R. and Magan, N. (2004) Modelling the Effect of Temperature and Water Activity on Growth of Aspergillus ni-
ger Strains and Applications for Food Spoilage Moulds. Journal of Applied Microbiology, 972, 429-438.http://dx.doi.org/10.1111/j.1365-2672.2004.02320.x
7/24/2019 Literatur PH Dan Suhu
http://slidepdf.com/reader/full/literatur-ph-dan-suhu 9/9
Top Related