


Languages
Pages
Legal


Liquid Transpor tation Fuels from Coal and Biomass
Technological Status, Costs, and Environmental Impacts
Panel on Alternative Liquid Transpor tation Fuels
DOE LDV Workshop 7-26-10Mike Ramage and J im Katzer

CHARGE TO THE ALTF PANEL
• Evaluate technologies for converting biomass and coal to liquid fuels that are deployable by 2020.
• Current and projected costs, and CO2 emissions.• Key R&D and demonstration needs.• Technically feasible supply of liquid fuels
• Estimate the potential supply curve for liquid fuels produced from coal or biomass.
• Evaluate environmental, economic, policy, and social factors that would enhance or impede development and deployment.
• Review other alternative fuels that would compete with coal-based and biomass-based fuels over the next 15 yr.
• No policy recommendations.

PANEL ON ALTERNATIVE LIQUID TRANSPORTATION FUELS
MICHAEL RAMAGE, Chair ExxonMobil R&E Co (retired)G. DAVID TILMAN, Vice Chair U.of Minnesota, DAVID GRAY Noblis, Inc.ROBERT HALL Amoco Corporation (retired)EDWARD HILER Texas A&M University (retired)W.S. WINSTON HO Ohio State UniversityDOUGLAS KARLEN USDA / Iowa State U.JAMES KATZER ExxonMobil R&E Co (retired)MICHAEL LADISCH Purdue U. and Mascoma CorpJOHN MIRANOWSKI Iowa State UniversityMICHAEL OPPENHEIMER Princeton UniversityRONALD PROBSTEIN MITHAROLD SCHOBERT Pennsylvania State UniversityCHRISTOPHER SOMERVILLE Energy BioSciences InstituteGREGORY STEPHANOPOULOS MITJAMES L. SWEENEY Stanford University

As Detailed in the Following Slides, the Panel’s Analyses Showed That
1.About 500 million tons/year of biomass can be sustainably produced in the US without incurring significant direct or indirect greenhouse gas emissions
2.Liquid transportation fuels from coal and biomass have potential to supply 2-3 MBPD of oil equivalent fuels with significantly reduced CO2 emissions by 2035
3.Timely commercial deployment may hinge on adoption of fuel mandates and a carbon price, and on accelerated federal investment in essential technologies
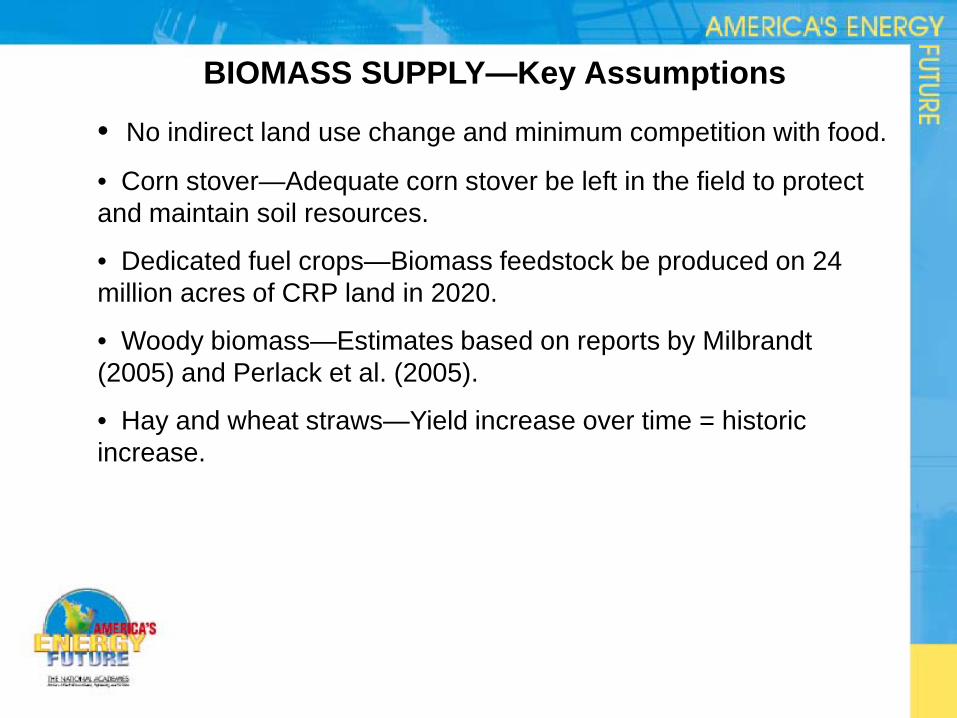
BIOMASS SUPPLY—Key Assumptions
• No indirect land use change and minimum competition with food.
• Corn stover—Adequate corn stover be left in the field to protect and maintain soil resources.
• Dedicated fuel crops—Biomass feedstock be produced on 24 million acres of CRP land in 2020.
• Woody biomass—Estimates based on reports by Milbrandt (2005) and Perlack et al. (2005).
• Hay and wheat straws—Yield increase over time = historic increase.

Estimated Lignocellulosic Feedstock That Could Potentially Be Produced for Biofuel
Feedstock Type Current 2020 Millions of dry tons
Corn stover 076 112Wheat and grass straw 015 018Hay 015 018Dedicated fuel crops 104 164Woody residuesa 110 124Animal manure 006 012Municipal solid waste 090 100
TOTAL 416 548aWoody residues currently used for electricity generation are not included in this estimate.

BIOMASS COSTS
Biomass costs include costs of:
• Nutrient replacement.
• Harvesting and maintenance.
• Transportation and storage.
• Seeding.
• Opportunity costs (for example, cropland rental costs).
The panel reviewed the literature and determined a low cost, a baseline cost, and a high cost. See Appendix H for list of references used.

BIOMASS COSTSDollars per dry ton
Biomass Estimated in 2008a
Projected in 2020
Corn stover 110 086Switchgrass 151 118Miscanthus 123 101Prairie grasses
127 101
Woody biomass
085 072
Wheat straw 070 055a2008 costs = baseline costs
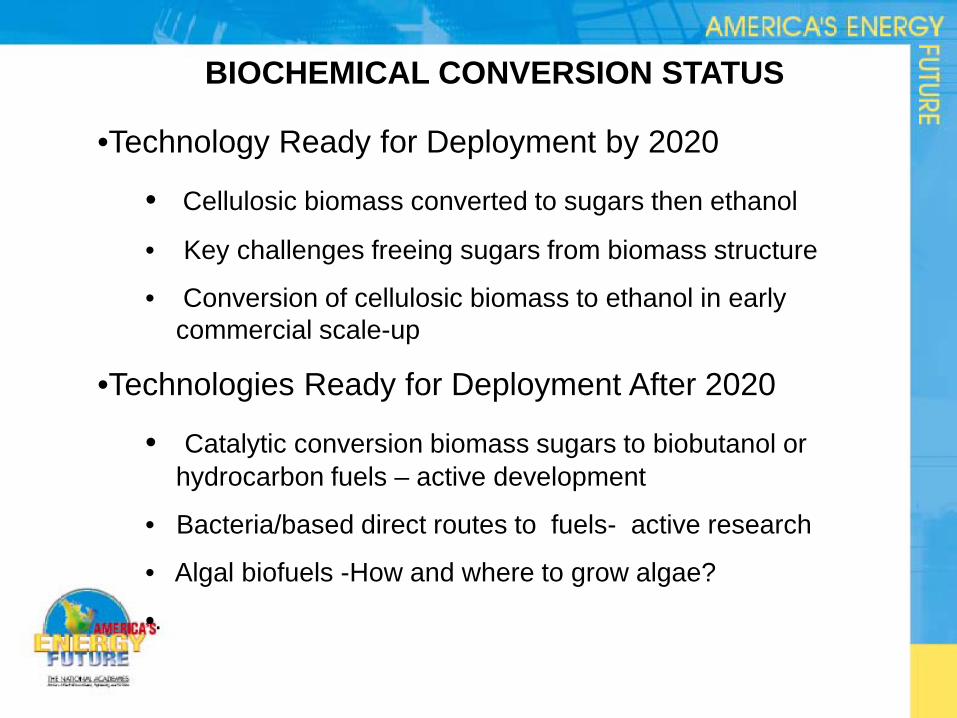
BIOCHEMICAL CONVERSION STATUS
•Technology Ready for Deployment by 2020
• Cellulosic biomass converted to sugars then ethanol
• Key challenges freeing sugars from biomass structure
• Conversion of cellulosic biomass to ethanol in early commercial scale-up
•Technologies Ready for Deployment After 2020
• Catalytic conversion biomass sugars to biobutanol or hydrocarbon fuels – active development
• Bacteria/based direct routes to fuels- active research
• Algal biofuels -How and where to grow algae?
•.

THERMOCHEMICAL CONVERSION STATUS
• Technology Ready for Deployment by 2020
• Indirect Liquefaction
• Gasification, followed by Fischer-Tropsch, or Methanol-to-Gasoline– commercially deployable now
• Integrated Gasification, Fischer-Tropsch, or Methanol-to-Gasoline with CCS needs commercial demonstration now
• Direct Liquefaction looks like a poor choice for the U.S.
• Geologic Storage of CO2 must be demonstrated by 2015, for 2020 deployment
• FeedstocksCoal, Biomass, and Coal + Biomass
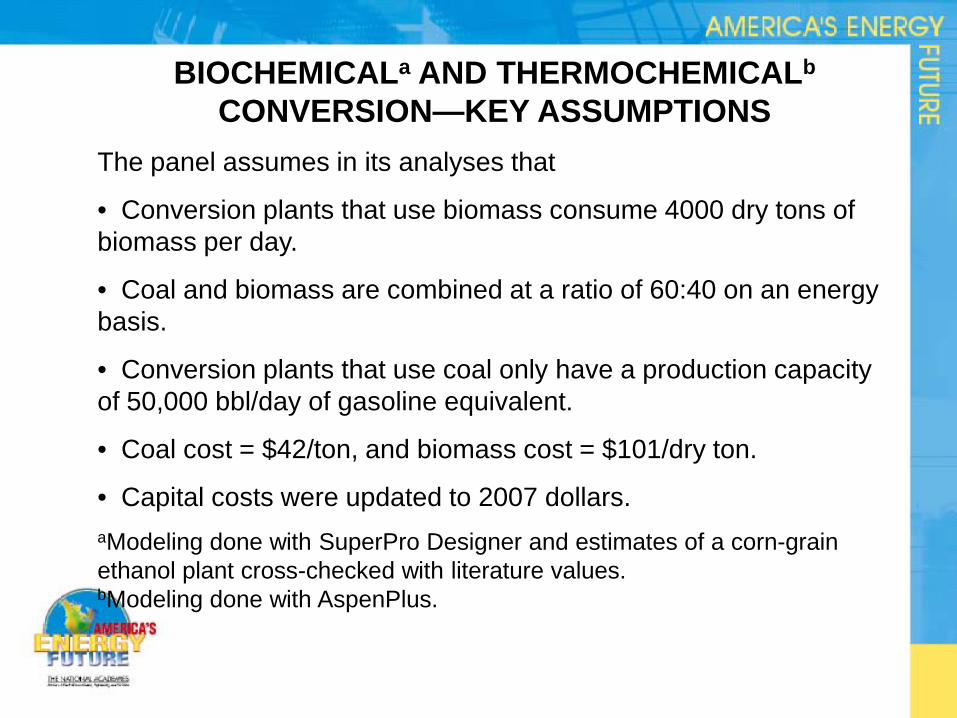
BIOCHEMICALa AND THERMOCHEMICALb
CONVERSION—KEY ASSUMPTIONSThe panel assumes in its analyses that
• Conversion plants that use biomass consume 4000 dry tons of biomass per day.
• Coal and biomass are combined at a ratio of 60:40 on an energy basis.
• Conversion plants that use coal only have a production capacity of 50,000 bbl/day of gasoline equivalent.
• Coal cost = $42/ton, and biomass cost = $101/dry ton.
• Capital costs were updated to 2007 dollars.aModeling done with SuperPro Designer and estimates of a corn-grain ethanol plant cross-checked with literature values.bModeling done with AspenPlus.

COMPARISON OF LIFE-CYCLE COSTS—Effect of a $50/tonne CO2 price
Fuel Product Cost without CO2 Equivalent price ($/bbl of gasoline equivalent)
Cost with CO2 Equivalent price of $50/tonne ($/bbl of gasoline equivalent)
Gasoline at crude-oil price of $60/bbl
075 095
Gasoline at crude-oil price of $100/bbl
115 135
Cellulosic ethanol 115 110
Biomass-to-liquid fuels without carbon capture and storage
140 130
Biomass-to-liquid fuels with carbon capture and storage
150 115
Coal-to-liquid fuels without carbon capture and storage
065 120
Coal-to-liquid fuels with carbon capture and storage
070 090
Coal-and-biomass-to-liquid fuels without carbon capture and storage
095 120
Coal-and-biomass-to-liquid fuels with carbon capture and storage
110 100

COMPARISON OF CO2 LIFE-CYCLE EMISSION

SUPPLY OF CELLULOSIC ETHANOL—TECHNICALLY FEASIBLE

SUPPLY OF COAL-AND-BIOMASS-TO-LIQUID—TECHNICALLY FEASIBLE

SUPPLY OF ALTERNATIVE LIQUID FUELS—COMMERCIAL DEPLOYMENT
Cellulosic Ethanol• 0.5 million bbl of gasoline eq./day by 2020,• Then 1.7 million bbl of gasoline eq./day by 2035.• CO2 emissions close to zero
Coal-and-Biomass-to-Liquid (CBTL) Fuels• CBTL fuels could reach 2.5 million barrels of gasoline
eq./day by 2035.• CO2 emissions close to zero with CCS
Coal-to-Liquid (CTL) Fuels• Then CTL fuels can reach 3 million bbl of gasoline eq./day
by 2035, with a 50 percent increase in US coal production.• If CCS used, CO2 emission equivalent to petroleum fuels

BARRIERS TO DEPLOYMENT
• Developing a well-organized and sustainable cellulosic biofuel industry
• Implementing commercial demonstrations of conversion processes ASAP
• Completing megatonne geologic storage demonstrations ASAP
•Developing more efficient, economical pretreatment and improving enzymes to free up sugars
•Permitting and constructing tens to hundreds of conversion plants
• Approaches that recognize commodity prices, especially oil prices, vary widely.

CONCLUSION
Liquid transportation fuels from coal and biomass have potential to supply 2-3 MBPD of oil equivalent fuels with significantly reduced CO2 emissions by 2035
• And thus play an important role in addressing issues of energy security, supply diversification, and CO2 emissions
• But their commercial deployment by 2020 will require aggressive large-scale demonstration in the next few years.
• Investor confidence will most likely require a carbon price or fuel mandates with specified reductions in GHG emissions

Support for this Project was Provided by
• U.S. Department of Energy • BP America• Dow Chemical Company Foundation• Fred Kavli and the Kavli Foundation • GE Energy• General Motors Corporation• Intel Corporation• W.M. Keck Foundation • Presidents’ Circle Communications Initiative of the National Academies • National Academy of Sciences through the following endowed funds
• Thomas Lincoln Casey Fund• Arthur L. Day Fund• W.K. Kellogg Foundation Fund• George and Cynthia Mitchell Endowment for Sustainability Science• Frank Press Fund for Dissemination and Outreach.

Backup Slides

Additional Information on the America’s Energy Future Effort
•21
www.nationalacademies.org/energy
October 2008May 20, 2009 June 15, 2009 December 9, 2009
Final Report, July 28, 2009America’s Energy Future: Technology and Transformation
Peter D. BlairExecutive DirectorDivision on Engineer ing & Physical SciencesNational Research [email protected]
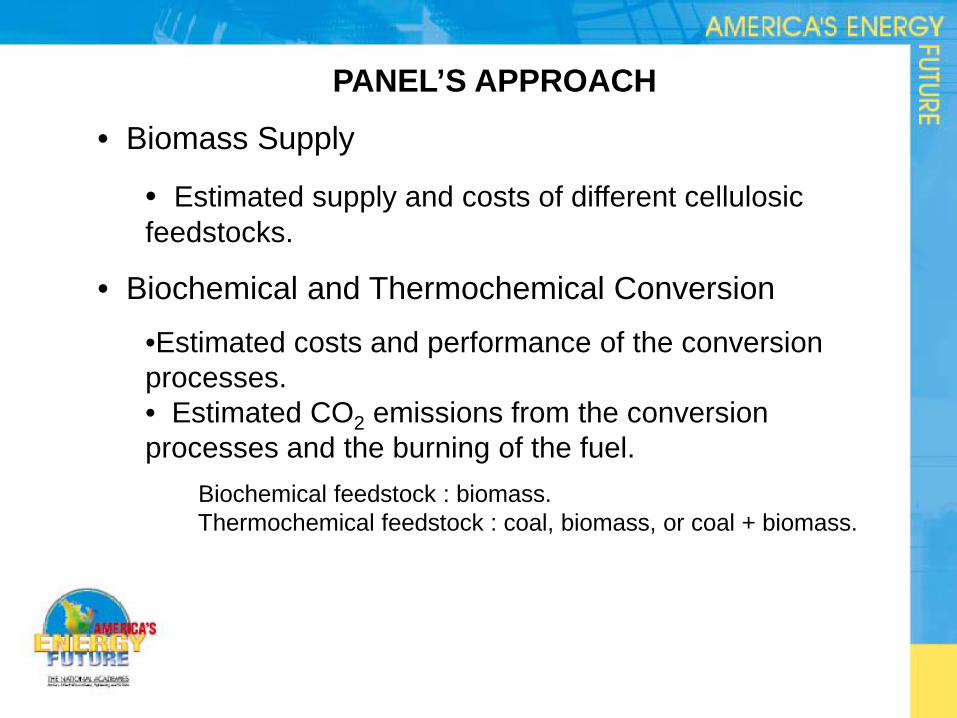
PANEL’S APPROACH
• Biomass Supply
• Estimated supply and costs of different cellulosic feedstocks.
• Biochemical and Thermochemical Conversion
•Estimated costs and performance of the conversion processes.• Estimated CO2 emissions from the conversion processes and the burning of the fuel.
Biochemical feedstock : biomass.Thermochemical feedstock : coal, biomass, or coal + biomass.

PANEL’S APPROACH (cont)
• Compared life-cycle costs and CO2 emissions of biofuels, coal-to-liquid fuels, and coal+biomass-to-liquid fuels on a consistent basis.
• Estimated amount of fuels that is technically feasible to deploy by 2020.
• Estimated market penetration of fuels in 2020 and 2035.
The panel’s analyses include input from Princeton University, University of Minnesota, Massachusetts Institute of Technology, Purdue University, Iowa State University, USDA and others who presented to the panel.

Supply function for biomass feedstocks in 2020

BIOCHEMICAL CONVERSION OF POPLAR TO ETHANOL—KEY ASSUMPTIONS AND COSTSDeployable year Current 2020 2020
Plant Capacity gal/yr 40 M 40 M 100 M
Feedstock rate dt/d 1.5k 1.5k 4 k
Pretreatment yield 80% 85% 85%
Cellulase cost $/gal $0.40 $0.25 $0.25
Ethanol yield, gal/dt 67 78 78
Ethanol production cost ($/gal, gasoline equil)
4.00 3.00 00102.7015010
- SuperPro Designer Modelling – Grain Ethanol Validated

CTLFTWith CCS
CBTLFTWith CCS
BTLFTWith CCS
Coal, tons/day 26,700 3,030 0Biomass, tons/day 0 3,950 3,950Total liquid fuels, bbl/d 50,000 10,000 4,410Specific total plant cost, $/bbl per day
98,900 134,000 147,000
Total liquid fuels cost, $/gal gasoline equivalent
1.64 2.52 3.32
Breakeven oil price, $/bbl 68 103 139FT liquids per petroleum-derived diesel emissions
1 0 -1.4
THERMOCHEMICAL CONVERSION OF COAL, BIOMASS OR COMBINED BIOMASS—KEY ASSUMPTIONS, OUTPUTS, AND COSTS

COMPARISON OF LIFE-CYCLE COSTS

Cost of alternative liquid fuels produced from coal, biomass, or coal and biomass with a CO2 equivalent price of $50/tonne.

EFFECT OF LIFE-CYCLE GREENHOUSE GAS PRICE ON FUEL COST – for $0 and $50/tonne CO2eq price
Fuel Product Cost without CO2 Equivalent Price ($/bbl gasoline equivalent)
Cost with CO2 Equivalent Price of $50/tonne ($/bbl gasoline equivalent)
Gasoline at crude-oil price of $60 and $100/bbl
075, 115 095, 135
Cellulosic ethanol 115 110
BTL without CCS 140 130
CTL with CCS 070 090
CBTL without CCS 095 120
CBTL with CCS 110 100

BARRIERS TO DEPLOYMENT—Conversion
Thermochemical Conversion• Implementing commercial demonstration of
conversion processes integrated with geologic storage ASAP
• Completing Megatonne geologic storage demonstrations to resolve siting, operating, monitoring and regulatory issues, and to establish safety and efficacy
Biochemical Conversion• Implementing commercial demonstration • Developing more efficient, economical pretreatment to
free up sugars from celluloses and hemicelluloses.• Discovering better enzymes that are not subject to
end-product inhibition.

BARRIERS TO DEPLOYMENT—Market Penetration
• Approaches that recognize commodity prices, especially oil prices, vary widely.
• Permitting and constructing tens to hundreds of conversion plants and the associated, water requirements, fuel transport and delivery infrastructure

EFFECT OF LIFE-CYCLE GREENHOUSE GAS PRICE ON FUEL COST – for $0 and $50/tonne CO2eq price
Fuel Product Cost without CO2 Equivalent Price ($/bbl gasoline equivalent)
Cost with CO2 Equivalent Price of $50/tonne ($/bbl gasoline equivalent)
Gasoline at crude-oil price of $60 and $100/bbl
075, 115 095, 135
Cellulosic ethanol 115 110
BTL without CCS 140 130
CTL with CCS 070 090
CBTL without CCS 095 120
CBTL with CCS 110 100
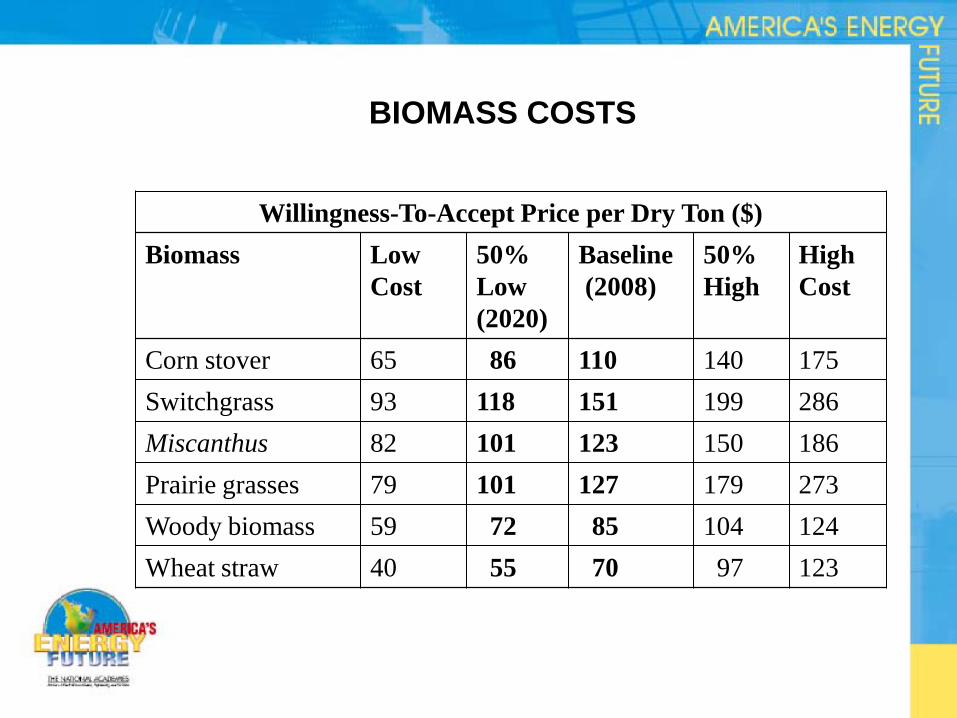
Willingness-To-Accept Price per Dry Ton ($)Biomass Low
Cost50% Low(2020)
Baseline(2008)
50% High
High Cost
Corn stover 65 86 110 140 175Switchgrass 93 118 151 199 286Miscanthus 82 101 123 150 186Prairie grasses 79 101 127 179 273Woody biomass 59 072 085 104 124Wheat straw 40 055 070 097 123
BIOMASS COSTS

Geographic distribution of potential biomass supply for biofuel production. Shading shows the annual supply of all potential biomass feedstocks within a 40-mile radius of any point in the lower 48 states.

Number of sites in the United States with a potential to supply indicated daily amounts of biomass within a 40-mile radius.

BIOCHEMICAL CONVERSION OF POPLAR TO ETHANOL—KEY ASSUMPTIONS AND COSTSVariableDeployable
LowCurrent
Medium 2020
High2020+
Size of conversion plant 40 M gal/yr 40 M gal/yr 40 M gal/yr
Solids loading 18% 21% 25%
Pretreatment yield 80% 85% 95%
Cellulase cost $0.40/gal $0.25/gal $0.10/gal
Ethanol yield, gal/dt 67 78 87
Total capital ($ millions) $223 M $194 M $174 M
Ethanol production cost ($/gal, gasoline equil)
4.00 3.00 00102.30.15010
- SuperPro Designer Modelling – Grain Ethanol Validated
- Biomass feed rate = 1,500,000 DT/Day

Analysis assumes that conversion plants sell net electricity to the grid. Electricity-related CO2 emissions are dependent on the case: IGCC venting CO2 for vent cases, and IGCC-CCS(90%) for CO2 storage cases.
COMPARISON OF CO2 LIFE-CYCLE EMISSION

Estimated Biomass Input Costs in 2020

America’s Energy Future: Technology Opportunities, Risks and Tradeoffs
Committee Subgroups Separately Appointed Panels
Phase I
Phase II
Panel Report on Energy Efficiency
Panel Report on Renewable Electric
Power
Panel Report on Alternative Liquid
Transportation Fuels
The National Academies Summit on America's Energy
Future
Energy Efficiency
Reports
America's Energy Future: Technology Opportunites,
Risks and Tradeoffs
Committee on America's Energy Future
Alternative Fuels
Electric Power Transmission & Distribution
Reference Technology Scenarios
Energy Efficiency Panel
Renewable Electric Power
Panel
Alternative Liquid Transportation
Fuels Panel
Coal to Electricity Generation
Nuclear Power
Renewable Energy
Oil and Natural Gas
•39

SUPPLY OF ALTERNATIVE LIQUID FUELS—COMMERCIAL DEPLOYMENT
Cellulosic Ethanol• If commercial demonstration successful,• Commercial deployment begins in 2015,• Capacity growth = 50 percent each year,• Then 0.5 million bbl of gasoline eq./day by 2020,• Or 1.7 million bbl of gasoline eq./day by 2035.
Coal-and-Biomass-to-Liquid (CBTL) Fuels• If commercial demonstration of CBTL with carbon capture
and storage (CCS) is successful,• First commercial plants start up in 2020,• Capacity growth = 20 percent each year,• Then CBTL fuels could reach 2.5 million barrels of gasoline
eq./day by 2035.

SUPPLY OF ALTERNATIVE LIQUID FUELS—COMMERCIAL DEPLOYMENT
Coal-to-Liquid (CTL) Fuels• If commercial demonstration of CTL plants with CCS is
successful,• First commercial plants start up in 2020,• Growth capacity = 2-3 plants each year,• Then CTL fuels can reach 3 million bbl of gasoline eq./day
by 2035,• U.S. coal production will increase by 50 percent.
Top Related