
![The Personal Software Process(SM) (PSP[SM])cs.txstate.edu/~rp31/papersSP/PSP.pdf · The Personal Software Process(SM) (PSP[SM]) Author: Watts S. Humphrey Keywords: Personal Software](https://static.fdocuments.in/doc/165x107/6015c65ad896bb72ef3d98a2/the-personal-software-processsm-pspsmcs-rp31paperssppsppdf-the-personal.jpg)


Languages
Pages
Legal


Lecture: The Personal Software Process

2
Overview
Personal Software Process assumptions process stages measures and quality strategy results

3
Trademarks and Service Marks
The following are service marks of Carnegie Mellon University.
Capability Maturity Model Integration SM
CMMi SM Team Software Process SM TSP SM Personal Software Process SM
PSP SM
The following are registered trademarks of Carnegie Mellon University
Capability Maturity Model® CMM ®
4
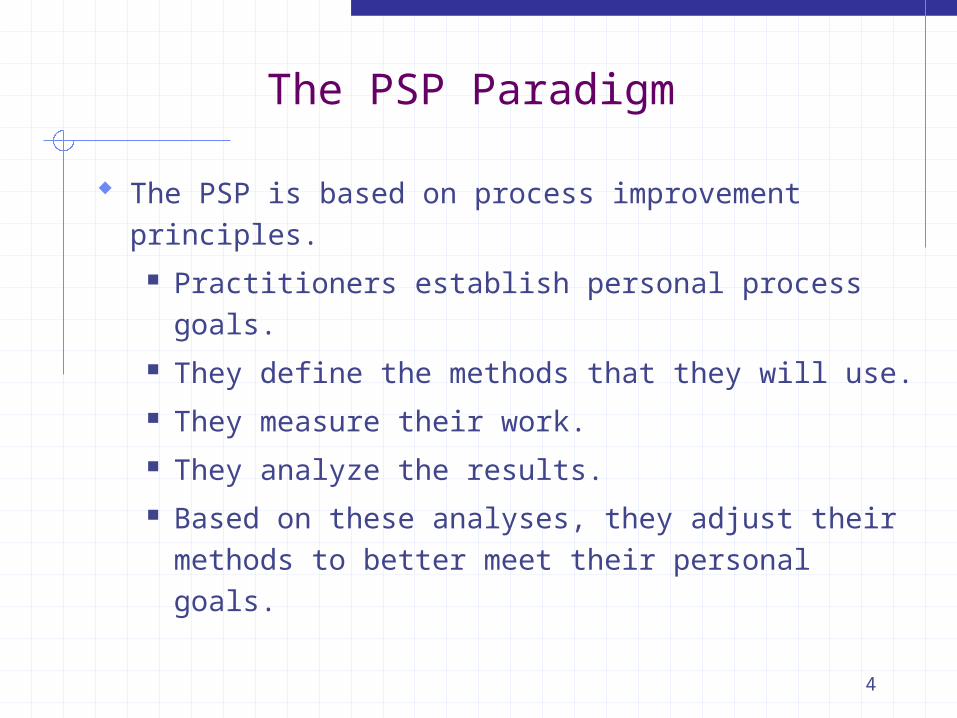
The PSP Paradigm
The PSP is based on process improvement principles.
Practitioners establish personal process goals.
They define the methods that they will use. They measure their work. They analyze the results. Based on these analyses, they adjust their
methods to better meet their personal goals.

5
The PSP Assumptions
Software engineers currently learn software development by developing toy programs.
They develop their own processes since process is not taught in introductory classes.
These toy processes do not provide a suitable foundation for large-scale software development.
To use effective methods consistently, engineers must believe that they are effective.
To believe that they are effective, they must use them.
6
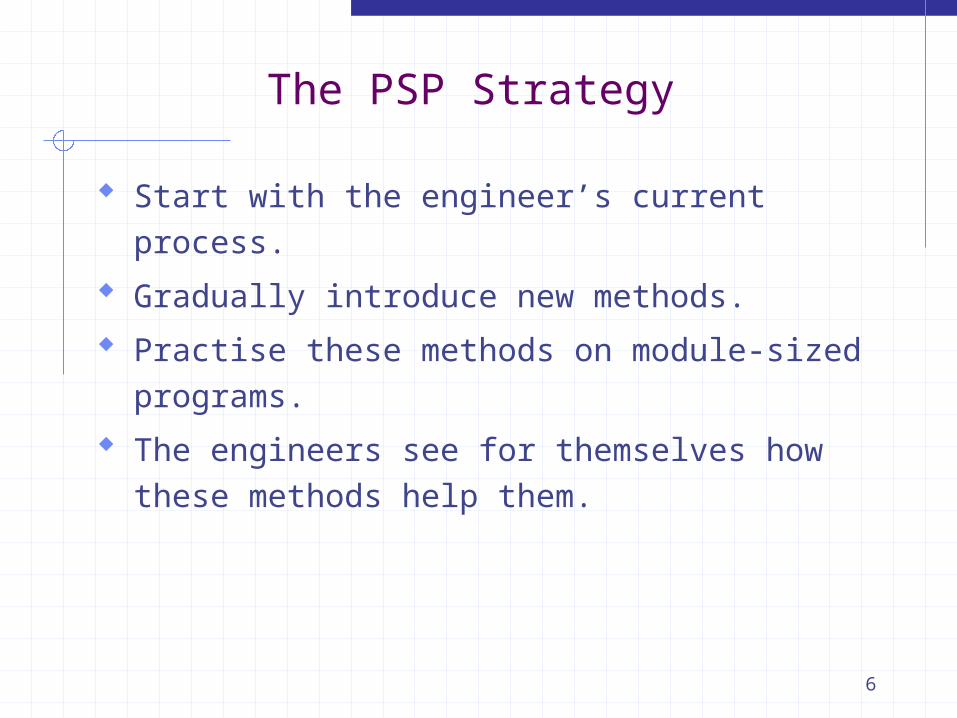
The PSP Strategy
Start with the engineer’s current process.
Gradually introduce new methods.
Practise these methods on module-sized programs.
The engineers see for themselves how these methods help them.

7
PSP Overview -1
The PSP is a process for individuals to use.
It applies to most structured personal tasks: writing small programs or documents defining requirements or processes conducting reviews or tests
It is a software CMM level 5 process for individual engineers.
8
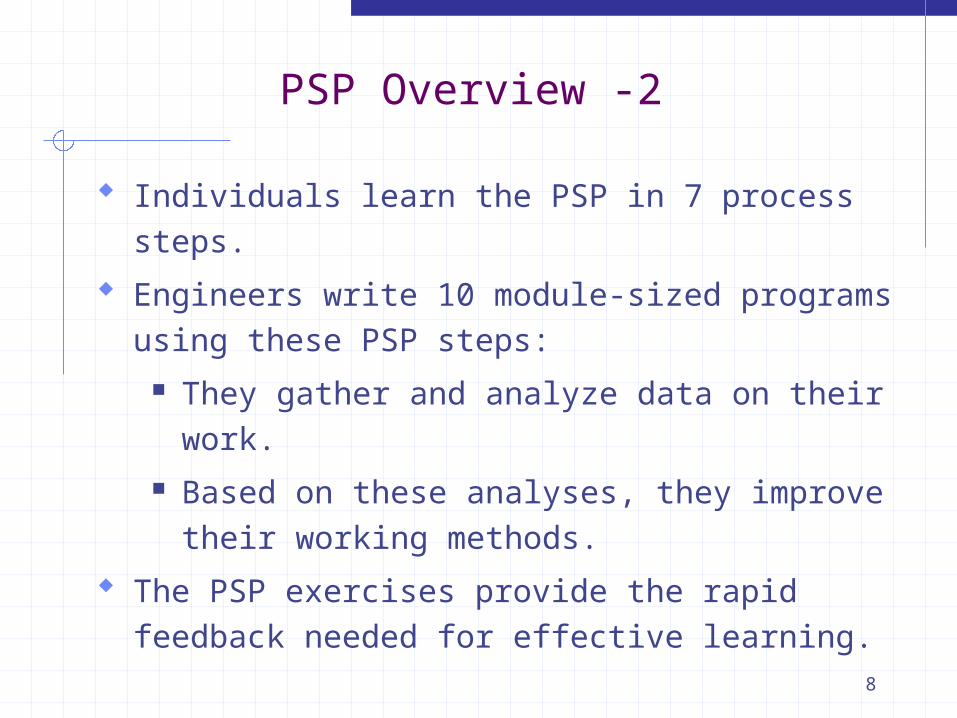
PSP Overview -2
Individuals learn the PSP in 7 process steps.
Engineers write 10 module-sized programs using these PSP steps:
They gather and analyze data on their work. Based on these analyses, they improve their
working methods.
The PSP exercises provide the rapid feedback needed for effective learning.

9
The PSP is an Evolving Process
PSP0Current processBasic measures
PSP1Size estimating
Test report
PSP2Code reviews
Design reviews
PSP3Cyclic development
TeamSoftwareProcess
PSP2.1Design templates
PSP1.1Task planning
Schedule planning
PSP0.1Coding standard
Process improvementproposal
Size measurement

10
PSP0: Personal Measurement
Engineers gather data on the time they spend by phase and the defects they find.
Generates real, personal data and provides the base benchmark for measuring progress.
3 phases: planning, development (design, code, compile, test), post-mortem.
PSP0.1 adds a coding standard, size measurement and a process improvement proposal.

11
PSP Basic Measures
Development time: measured in minutes using a time recording log designed to account for interruptions.
Defects: any change to the design or code to get the program to compile or test correctly; recorded in a defect recording log.
Size: lines of code, used primarily for estimating development time; new, modified and reused code is distinguished.
12
The Basic PSP Elements
Process script
Project plan summary form
Time recording log
Defect reporting log
Defect type standard

13
Process Script
Scripts guide the engineers through the process.• purpose• inputs required• process phases• exit criteria

14
Project Plan Summary
The project plan summary form holds: project plan data actual project results
size
times
defect data cumulative data on all PSP projects to date

15
Time Recording LogStudent JD Veloper Date 7/1Instructor Humphrey Program # 1A
Date Start Stop InterruptionTime
DeltaTime
Phase Comments
7/1 8:00 8:16 5 11 Plan Estimated time
Time Recording Log
Time spent working on each PSP phase is recorded. start time stop time interrupt time phase comments

16
Defect Recording Log
Information on each defect found in reviews, compiling, and test. number type phase injected phase removed find/fix time description

17
The PSP Process Flow
Requirements
Processscripts
Projectplan
summary
Finished product
Project and processdata summary report
Timeand
defectlogs
PSP process
Development
Planning
Design
Code
Compile
Test
Design review
Code review
Postmortem
guide
18
Why measure time usage ? -1
Time is a non-renewable resource! Making realistic plans requires knowing how you
spend your time. Tracking provides a more accurate record than
just relying on your memory. To manage your time, plan your time and then
follow the plan (easier said than done!).

19
Why measure time usage ? -2
Working to a plan helps guide your behaviour: less time procrastinating more focus on the actual task less likely to be distracted more likely to be efficient
Learn from your mistakes by planning better next time.

20
Why Record Defects?
To identify the types of defects you introduce.
To improve your skill as a programmer.
To reduce the number of defects.
Each change you make counts as one defect.

21
Defects
A defect is anything that that detracts from a program’s ability to completely and effectively meet the user’s needs.
A defect is caused by a programmer’s mistake.
Even experienced programmers make a mistake about every 7-10 lines of code they develop.
Defect prevention and removal are essential typically account for 50% of project effort!

22
PSP1: Personal Planning
This step introduces the PROBE method to estimate sizes and development times for new programs based on personal data.
PROBE is based on linear regression with prediction intervals to indicate size and time estimate quality.
PSP1.1 adds schedule and task planning.

23
The Project Planning Framework
PROBE Method
Definerequirements
Produceconceptual
design
Estimatesize
Estimateresources
Produceschedule
Developproduct
Size, resourceschedule
data
Processanalysis
Resourcesavailable
Productivitydatabase
Sizedatabase
Customerneed
Productdelivery
Trackingreports
Customer
Management
Items
Tasks
24
Why Estimate Size?
To make better plans: to more accurately size the job to divide the job into separable elements
To assist in tracking progress: can judge when job scope changes can more accurately measure the work
Value for the PSP: learn estimating methods build estimating skills
25
Size Estimating Principles
Estimating is an uncertain process: No one knows how big the product will be. The earlier the estimate, the less is known. Estimates can be biased by business and
other pressures.
Estimating is an intuitive learning process: Ability improves with experience. Some people will be better at estimating
than others.

26
The PROBE Estimating Method
Conceptualdesign
Start
Identify and size objectsNumber ofmethods
Objecttype
Relativesize
Reusecategories
Estimate other LOC
Estimateprogram size
Calculateprediction interval
Size estimate
Estimateresources
Calculateprediction interval
Resource estimate

27
The Resource Planning Process
Start with a size estimate.
Identify available data.
Use regression when you have more than three sets of data that correlate.
Use data for estimated LOC to actual hours, where available.
Calculate the prediction interval.

28
Schedule Estimating
To make a schedule you need three things: the estimated direct project hours a calendar of available direct hours the order in which the tasks will be done
Then, you need to: estimate the hours needed for each task spread these hours over the calendar of
available hours

29
Schedule Example -1
Jo decides to plan and track the next PSP assignment. Based on her historical data, the planned time for each phase is:
Task planned hrs Cum. hrs
Plan 1.0 1.0
Design 4.5 5.5
Code 5.0 10.5
Compile 0.5 11.0
Test 1.5 12.5
TOTAL 12.5
planned value
8
36
40
4
12
100
Cum. planned
value
8
44
84
88
100

30
Schedule Example -2
Jo knows that she will be able to spend 3.5 hours per day on this assignment and produces the following schedule:
Day No. Direct hours Cum. hours
1 3.5 3.5
2 3.5 7.0
3 3.5 10.5
4 3.5 14
31
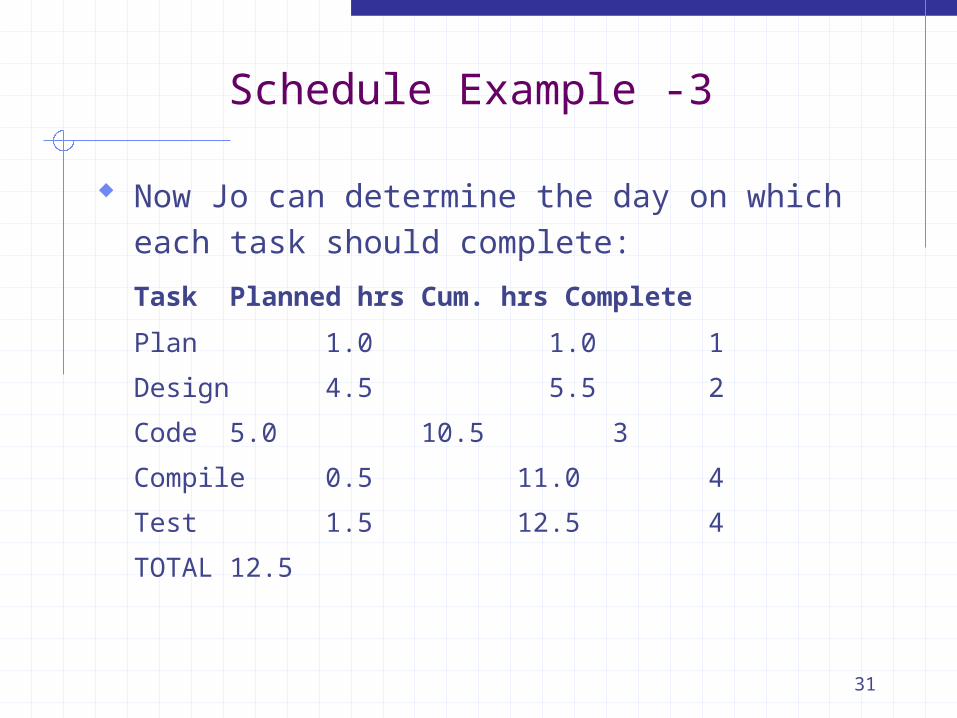
Schedule Example -3
Now Jo can determine the day on which each task should complete:
Task Planned hrs Cum. hrs Complete
Plan 1.0 1.0 1
Design4.5 5.5 2
Code 5.0 10.5 3
Compile 0.5 11.0 4
Test 1.5 12.5 4
TOTAL 12.5
32
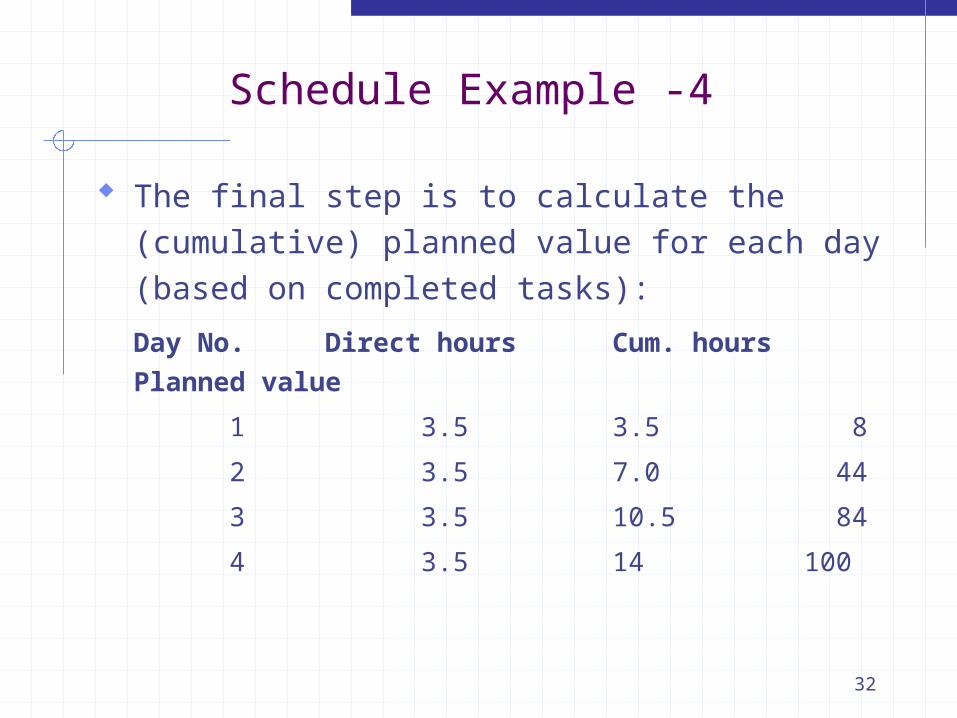
Schedule Example -4
The final step is to calculate the (cumulative) planned value for each day (based on completed tasks):
Day No. Direct hours Cum. hours Planned
value
1 3.5 3.5 8
2 3.5 7.0 44
3 3.5 10.5 84
4 3.5 14 100

33
Schedule Example -5
The schedule can be represented as a chart showed cumulative planned value per day.
As tasks get completed, we can track the earned value.
The earned value of a task is its original planned value, independent of the actual time taken to complete it.
We can also use extrapolation to predict the completion of the project.

34
Planned Value
0
20
40
60
80
100
0 1 2 3 4 5 6 7
Day

35
Earned Value after 3 days
0
20
40
60
80
100
0 1 2 3 4 5 6 7
Day

36
Earned Value Prediction
0
20
40
60
80
100
0 1 2 3 4 5 6 7
Day

37
PSP2: Personal Quality
This step introduces defect management.
Using data from the PSP exercises, engineers construct and use checklists for personal design and code reviews.
From their own data, they see how checklists help personal reviews.
PSP2.1 adds design specification and analysis techniques along with defect prevention, process analyses and process benchmarks.
38
The PSP Quality Strategy -1
In the PSP, defects are the basic quality measure.
Low defect content is an essential prerequisite to a quality software process.
Experienced software engineers typically inject around 100 defects per KLOC.
Low defect products can best be assured at the PSP level.
39
The PSP Quality Strategy -2
The PSP level is where defects are injected, and this is where the engineers should:
remove them determine their causes learn to prevent them
If you want to get a quality product out of test, you must put a quality product into test:
Testing removes only a fraction of the defects. The more defects in the code entering test,
the more defects there are on test exit.

40
The PSP Quality Strategy -3
Data show that it is much more efficient to find defects in reviews than in testing:
In unit test, typically only about 2 to 4 defects are found per hour.
Code reviews typically find about 10 defects/hour.
Experienced reviewers can find 70% or more of the defects in a product.
Unit test rarely exceeds a 50% yield. PSP data show that reviews find 2 to 5 times as
many defects per hour compared to unit test.

41
Why Review before Compile?
The time to do a review is the same before or after compile.
Reviewing first will save compiling time.(typically 12-15% 3-4% of development)
Reviews done after compiling are generally not done as thoroughly.
Compiling is equally effective before or after a review.

42
Estimating Defects
Initially it seems strange to estimate how many defects we expect to inject into our programs - we are trying to develop a defect-free product!
However, it acknowledges the reality that we will make errors and inject defects - the important thing is to minimise their injection and to remove them efficiently.
43
Estimating Defects (cont.)
As with the time estimation over phases, we start by estimating the total number of defects based on estimated program size and our past record of defect injection.
Allocate to phases using the to-date %.
Plan to remove all defects injected!
44
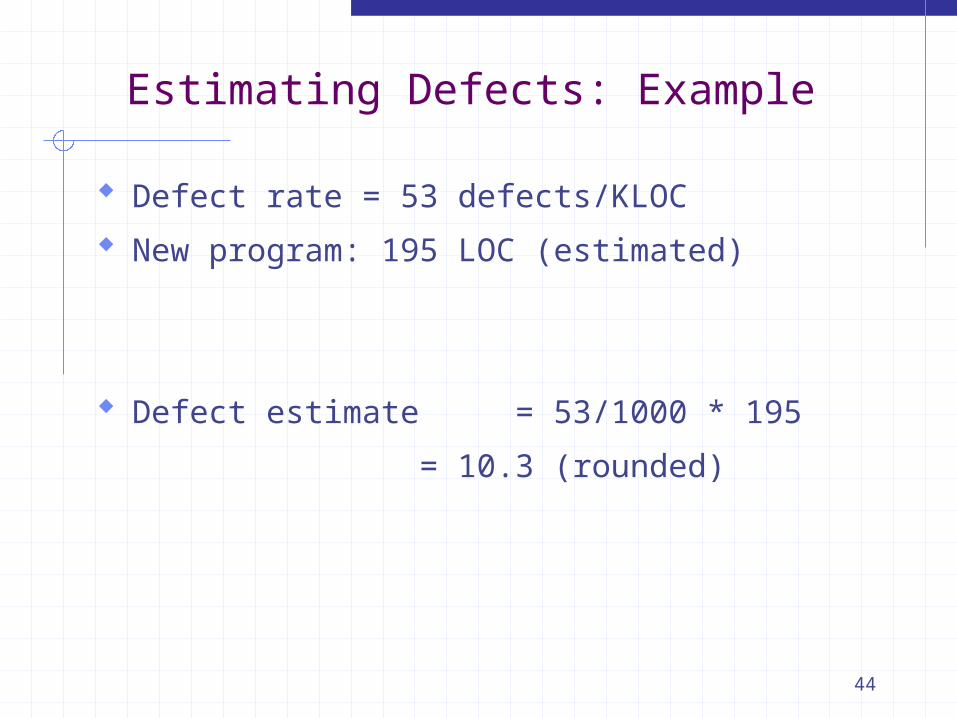
Estimating Defects: Example
Defect rate = 53 defects/KLOC
New program: 195 LOC (estimated)
Defect estimate = 53/1000 * 195
= 10.3 (rounded)

45
Programming Exercises
1A: calculate mean and standard deviation of numbers in a linked list
2A: count LOC in a source program3A: enhance 2A to count total and function LOC4A: calculate linear regression parameters5A: perform numerical integration6A: enhance 4A to calculate prediction interval7A: calculate correlation of 2 linked lists8A: sort a linked list9A: chi-squared test for a normal distribution10A: calculate multiple regression parameters

46
PSP Training Data
Each assignment results in some 70 pieces of data collected by each engineer and collated by instructors to provide feedback.
This study is based on 23 PSP classes consisting of 298 engineers - over 300,000 LOC during more than 15,000 hours - about 22,000 defects were discovered and removed. Each analysis is based on at least 170 cases where complete data was available.
Hayes, W. & Over, J.W., The Personal Software Process (PSP): An Empirical Study of the Impact of PSP on Individual Engineers, (CMU/SEI-97-TR-001), SEI, 1997.

47
1997 SEI Study
Assignment Average
10987654321
0.3
0.4
0.5
0.6
0.7
0.8
0.9
PSP Level Average
Assignment Number
Siz
e E
stim
atio
n A
ccu
racy PROBE size
estimation begins
Size Estimation Results

48
Effort Estimation Results
1997 SEI Study
Assignment AveragePSP Level Average
109876543210.2
0.3
0.4
0.5
0.6
0.7
Assignment Number
Eff
ort
Est
imat
ion
Acc
ura
cy
Linear regression
for effort
estimation begins
49
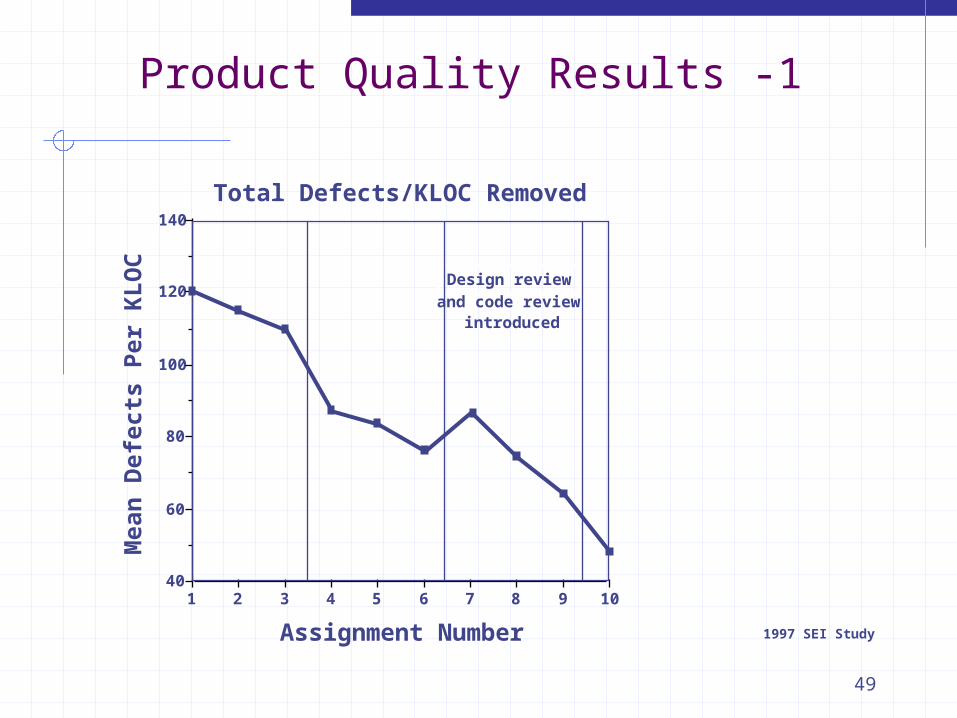
Design review
and code reviewintroduced
Product Quality Results -1
1997 SEI Study
Total Defects/KLOC Removed
1098765432140
60
80
100
120
140
Assignment Number
Mea
n D
efec
ts P
er K
LO
C

50
Product Quality Results -2
1997 SEI Study
Defects/KLOC Removed in Test ± 1 Std. Dev.
109876543210
20
40
60
80
100
120
140
Assignment Number
Design reviewand code review introduced
Defect analysis report written
Mea
n D
efec
ts p
er K
LO
CR
emo
ved
Du
rin
g T
est
51
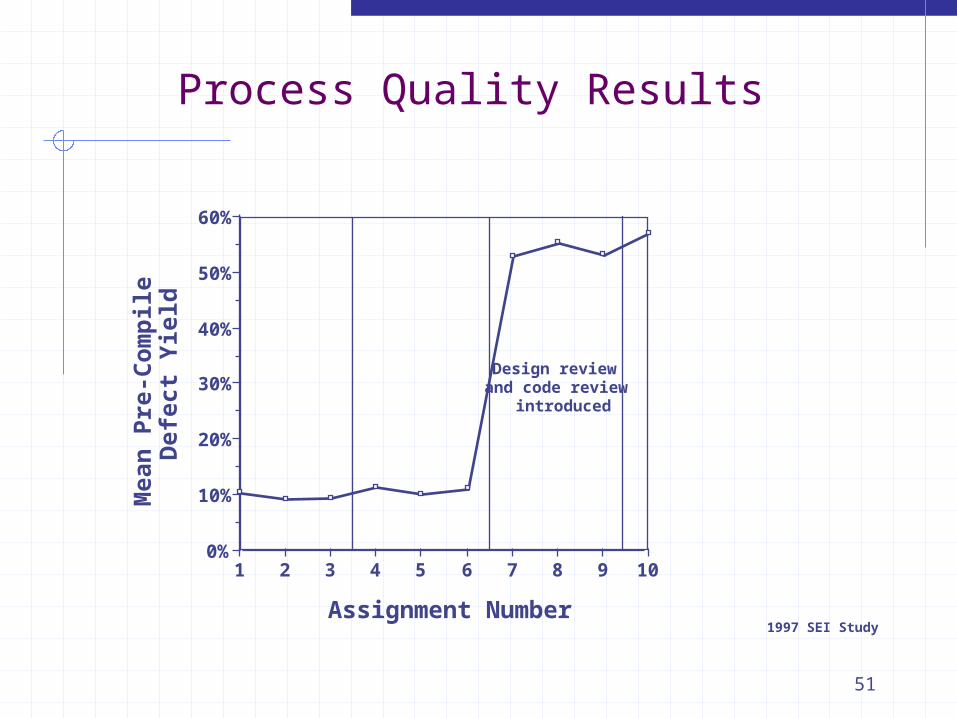
Process Quality Results
1997 SEI Study
109876543210%
10%
20%
30%
40%
50%
60%
Assignment Number
Mea
n P
re-C
om
pil
e
D
efec
t Y
ield
Design reviewand code review introduced
52
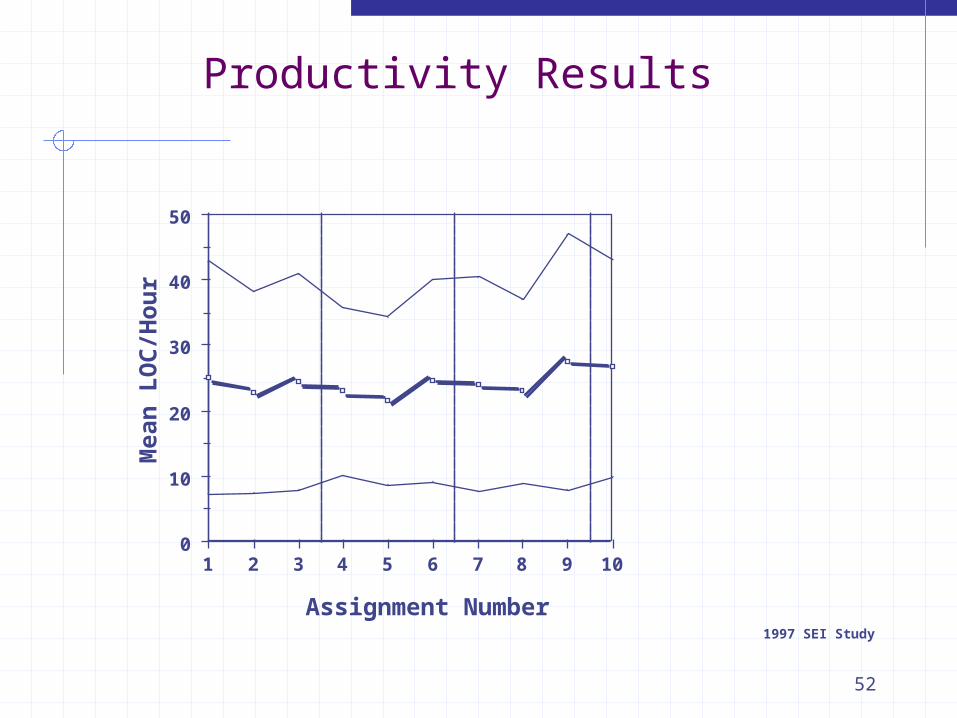
Productivity Results
1997 SEI Study
109876543210
10
20
30
40
50
Assignment Number
Mea
n L
OC
/Ho
ur

53
Advanced Information Services
Project A: PSP introduced after 3 of 9 components
developed (500 - 2200 LOC each) estimating error: 394% -> -10.4% acceptance test defects reduced by 78% productivity improved 7%
54
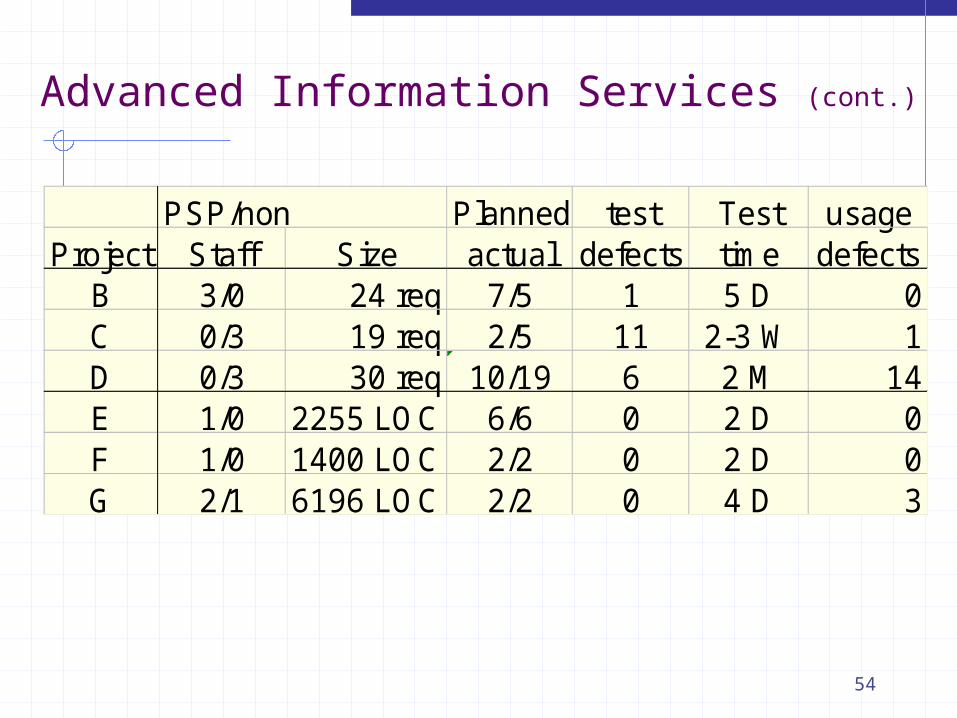
Advanced Information Services (cont.)
PSP/non Planned/ test Test usageProject Staff Size actual defects time defects
B 3/0 24 req 7/5 1 5 D 0C 0/3 19 req 2/5 11 2-3 W 1D 0/3 30 req 10/19 6 2 M 14E 1/0 2255 LOC 6/6 0 2 D 0F 1/0 1400 LOC 2/2 0 2 D 0G 2/1 6196 LOC 2/2 0 4 D 3

55
Motorola
Motorola paging products group - develop one-way numeric and alphanumeric pagers: trained 40 engineers and 22 managers 18 completed maintenance and enhancement
projects (25K LOC), 575 defects total (136 in test)
half in use for between 3 and 18 months with only one defect

56
Union Switch and Signal
Union Switch and Signal, Inc. - process control systems for real-time control of railroad and transit operations.
9 managers and 25 engineers trained.
5 projects (8,400 LOC) all completed on schedule, a total of 57 defects found in test.
in use for between 1 and 9 months with zero defects found in use.
57
Team Software Process
Designed for teams of 2 to 20 PSP-trained software engineers.
Designed to create a process that builds effective teams and optimises team performance throughout a project.
The goal is CMM level 5 team performance.
58
Summary: The Personal Software Process
The PSP is a process designed for individual use, based on scaled-down industrial software practice.
The principal objective of the PSP is to help software engineers to do better work.
The PSP is also designed to demonstrate the value of using defined and measured processes.
Finally, the PSP is intended to help engineers and organizations meet the increasingly stringent demands for quality software systems.
Think of PSP as a level 5 process for individuals.

59
Follow-up Reading
W. Humphrey (Addison Wesley): A Discipline for Software Engineering, 1995 Introduction to the Personal Software
Process, 1997 Introduction to the Team Software Process,
2000
Articles in IEEE Software, May 1996 and IEEE Computer, May 1997
http://www.sei.cmu.edu/tsp
Top Related