


Languages
Pages
Legal

Lecture 9. Continuous Probability Distributions
David R. Merrell90-786 Intermediate Empirical
Methods for Public Policy and Management
Agenda
Normal Distribution Poisson Process Poisson Distribution Exponential Distribution
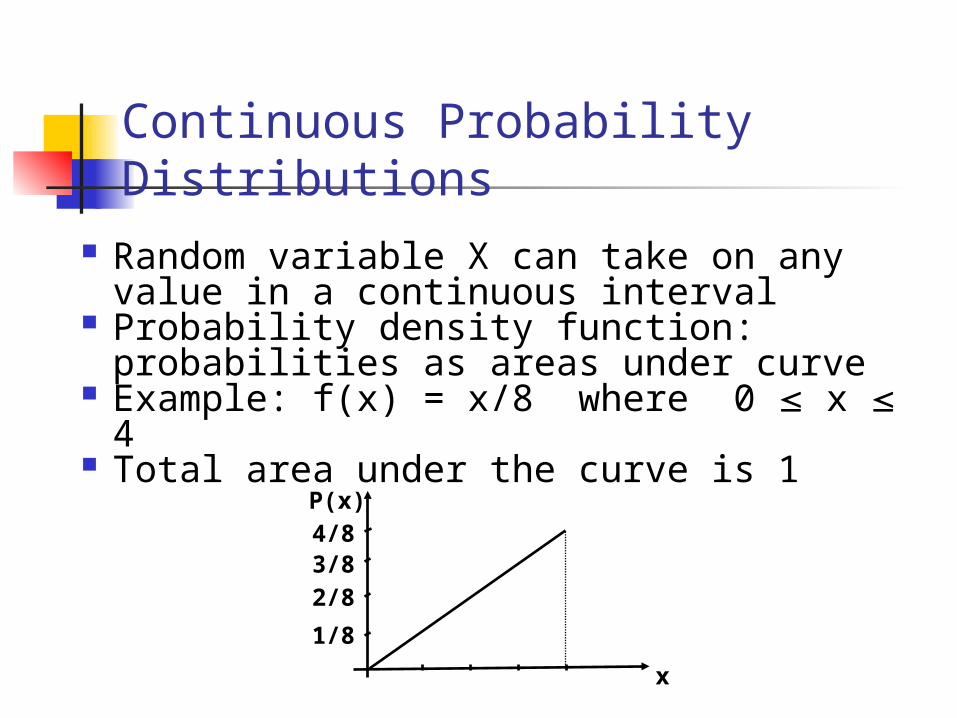
Continuous Probability Distributions
Random variable X can take on any value in a continuous interval
Probability density function: probabilities as areas under curve
Example: f(x) = x/8 where 0 x 4 Total area under the curve is 1
P(x)
1/8
2/83/84/8
x
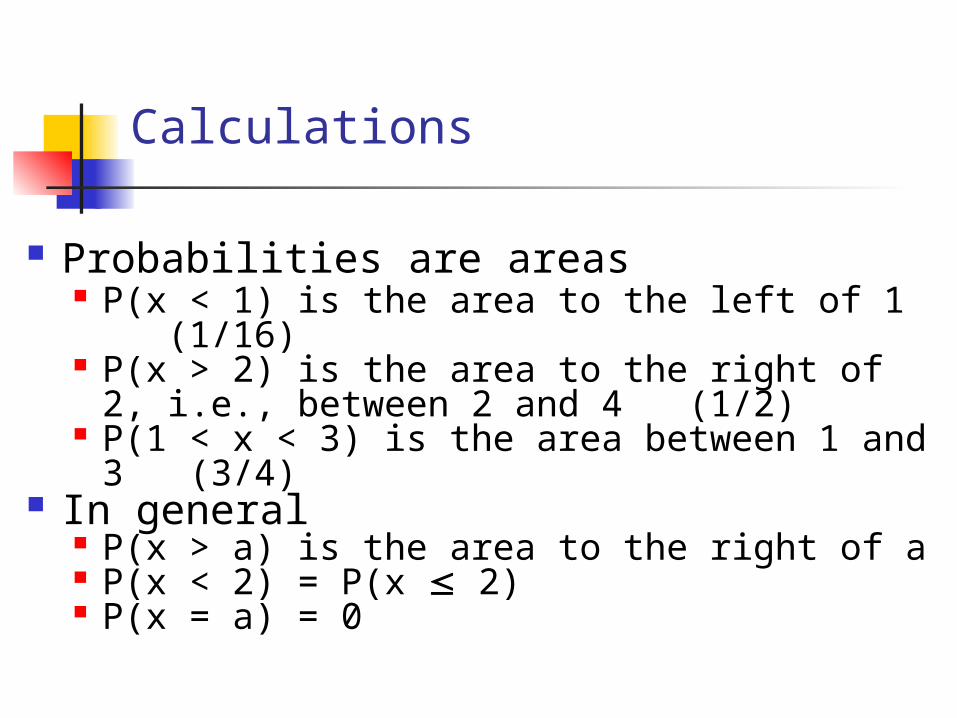
Calculations
Probabilities are areas P(x < 1) is the area to the left of 1 (1/16) P(x > 2) is the area to the right of 2, i.e.,
between 2 and 4 (1/2) P(1 < x < 3) is the area between 1 and 3
(3/4) In general
P(x > a) is the area to the right of a P(x < 2) = P(x 2) P(x = a) = 0
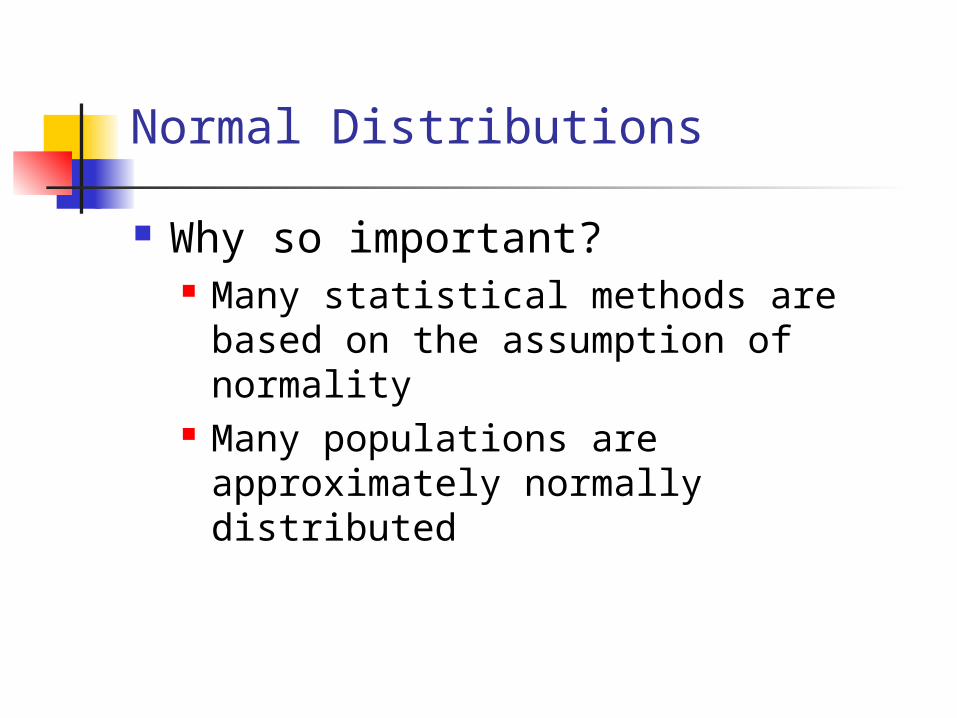
Normal Distributions
Why so important? Many statistical methods are based
on the assumption of normality Many populations are approximately
normally distributed
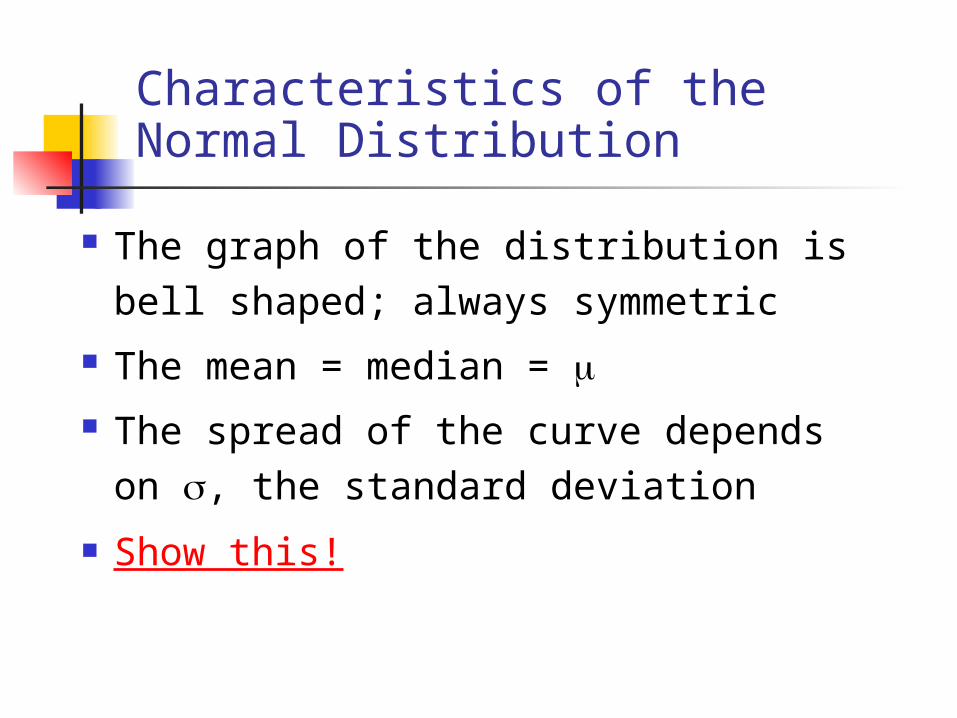
Characteristics of the Normal Distribution
The graph of the distribution is bell shaped; always symmetric
The mean = median = The spread of the curve depends
on , the standard deviation Show this!

The Shape of the Normal and σ
0 10 20 30 40 50 60 70 80 90
= 5
= 10
= 20
X
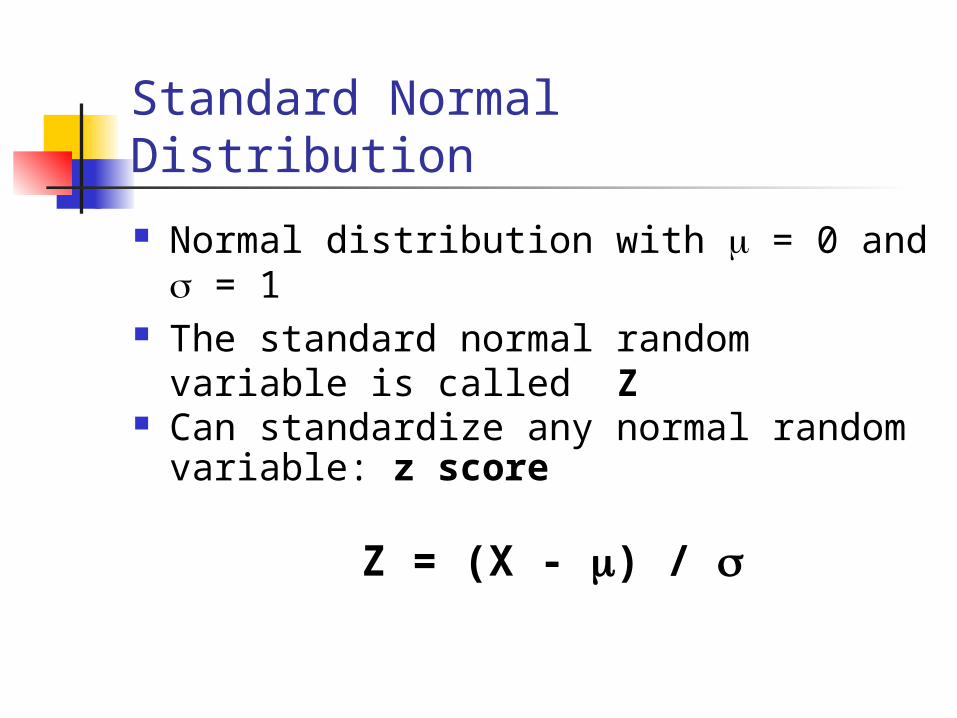
Standard Normal Distribution
Normal distribution with = 0 and = 1 The standard normal random variable is
called Z Can standardize any normal random
variable: z score
Z = (X - ) /

Calculating Probabilities
Table of standard normal distribution PDF template in Excel Example: X normally distributed with
= 20 and = 5 Find:
Probability that x is more than 30 Probability that x is at least 15 Probability that x is between 15 and 25 Probability that x is between 10 and 30
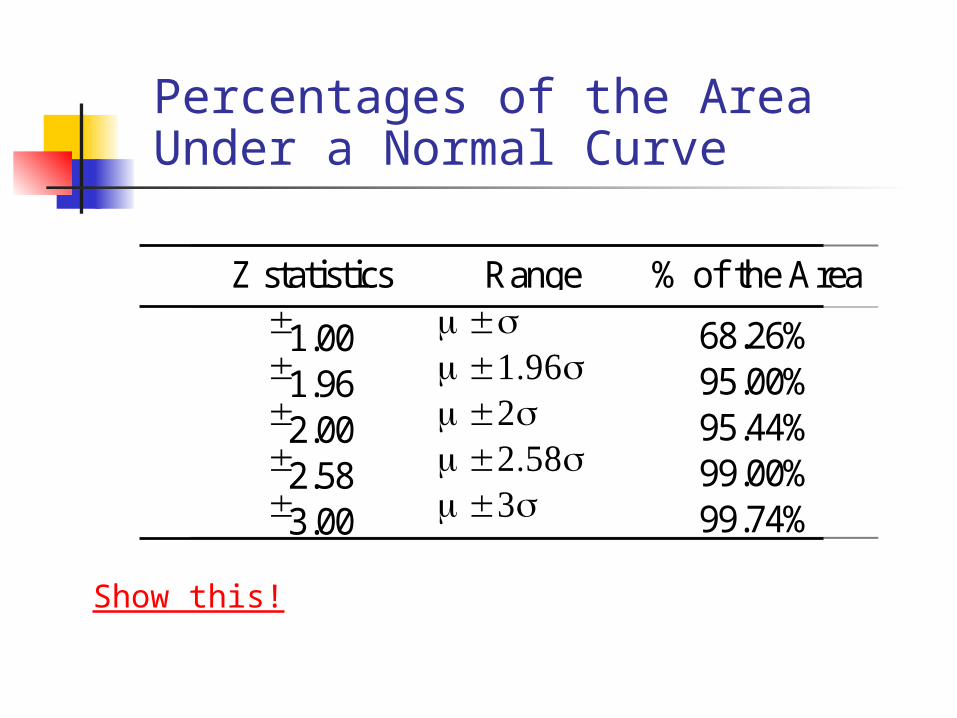
Percentages of the Area Under a Normal Curve
Z statistics Range % of the Area
1.00 68.26%1.96 95.00%2.00 95.44%2.58 99.00%3.00 99.74%
Show this!
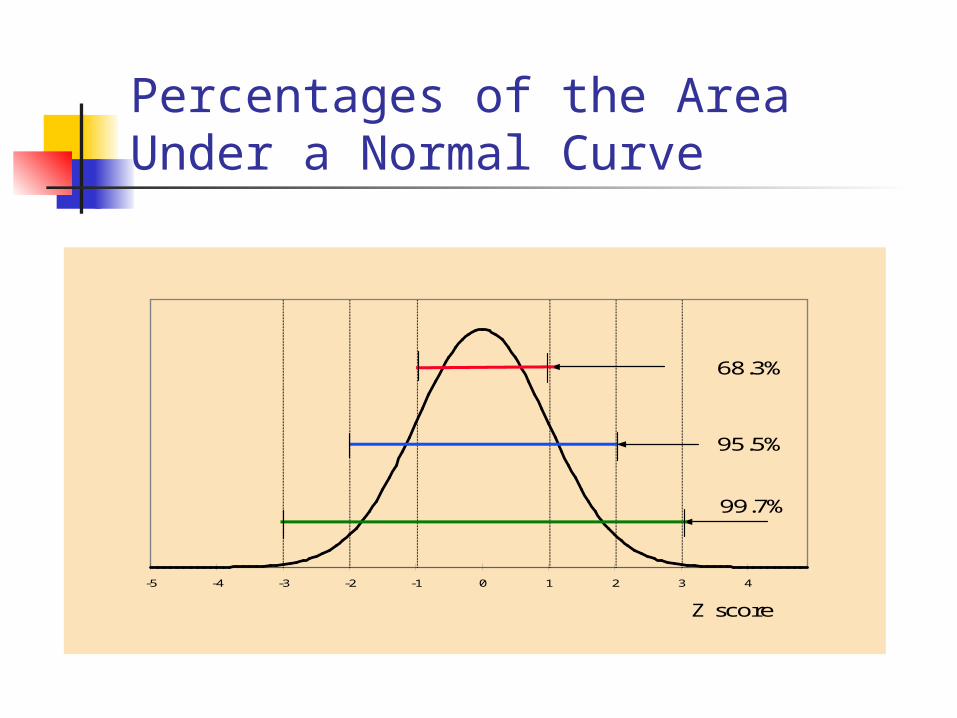
Percentages of the Area Under a Normal Curve
-5 -4 -3 -2 -1 0 1 2 3 4
Z score
68.3%
95.5%
99.7%
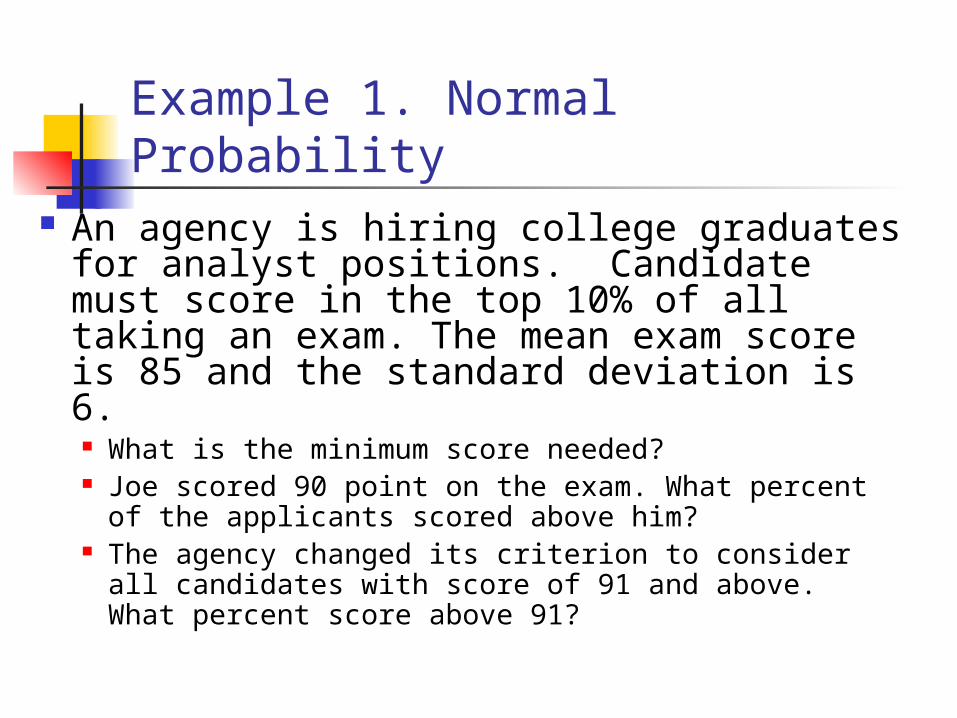
Example 1. Normal Probability
An agency is hiring college graduates for analyst positions. Candidate must score in the top 10% of all taking an exam. The mean exam score is 85 and the standard deviation is 6. What is the minimum score needed? Joe scored 90 point on the exam. What percent
of the applicants scored above him? The agency changed its criterion to consider all
candidates with score of 91 and above. What percent score above 91?
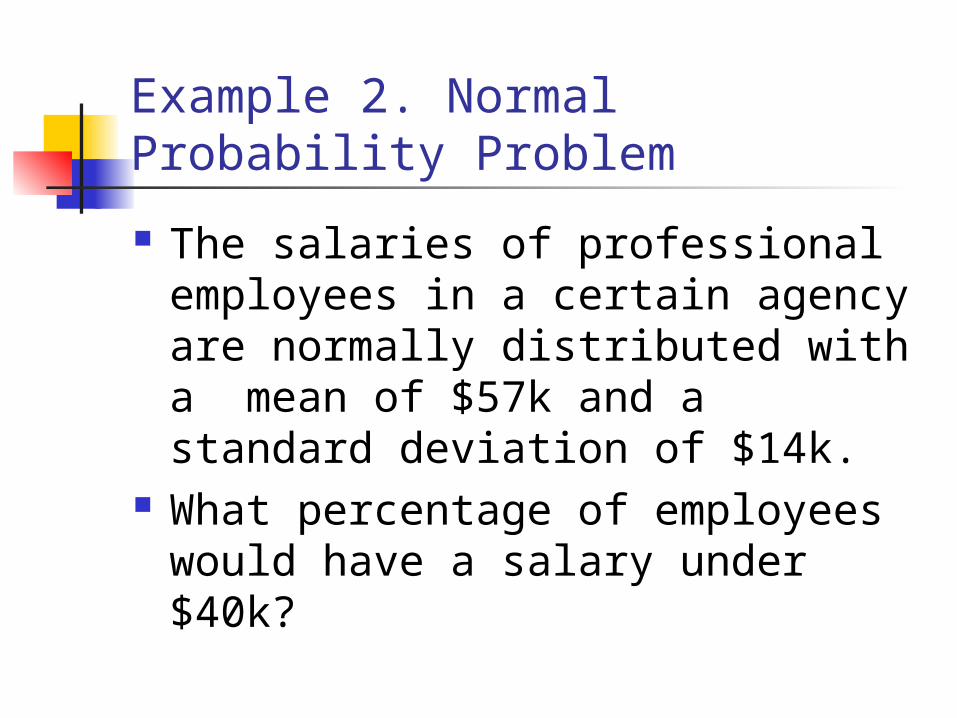
Example 2. Normal Probability Problem
The salaries of professional employees in a certain agency are normally distributed with a mean of $57k and a standard deviation of $14k.
What percentage of employees would have a salary under $40k?
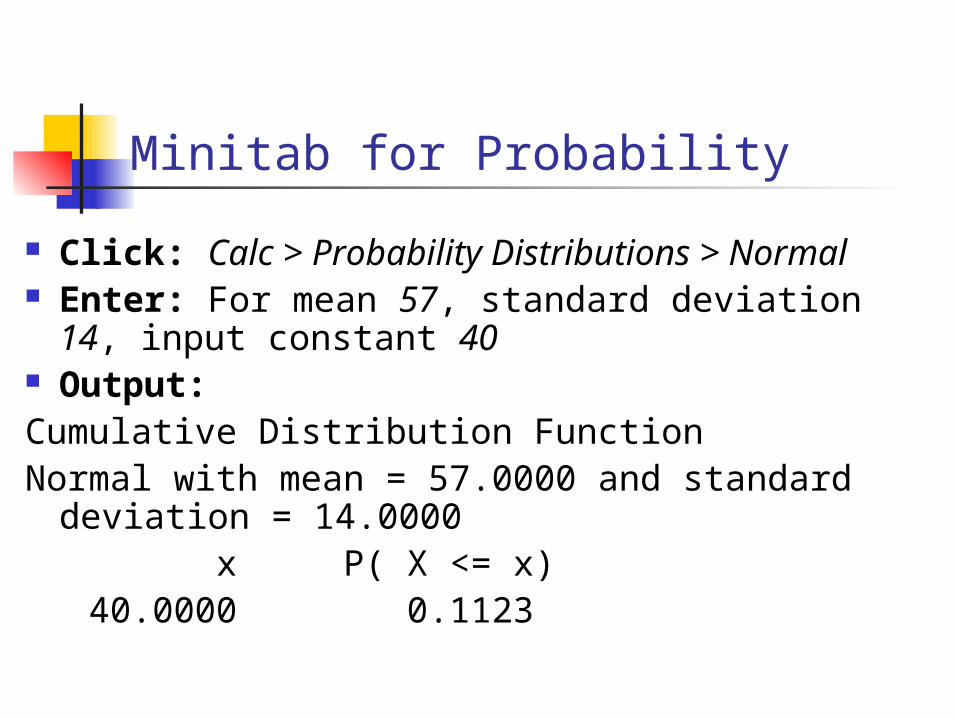
Minitab for Probability
Click: Calc > Probability Distributions > Normal Enter: For mean 57, standard deviation 14,
input constant 40 Output:Cumulative Distribution FunctionNormal with mean = 57.0000 and standard
deviation = 14.0000 x P( X <= x) 40.0000 0.1123
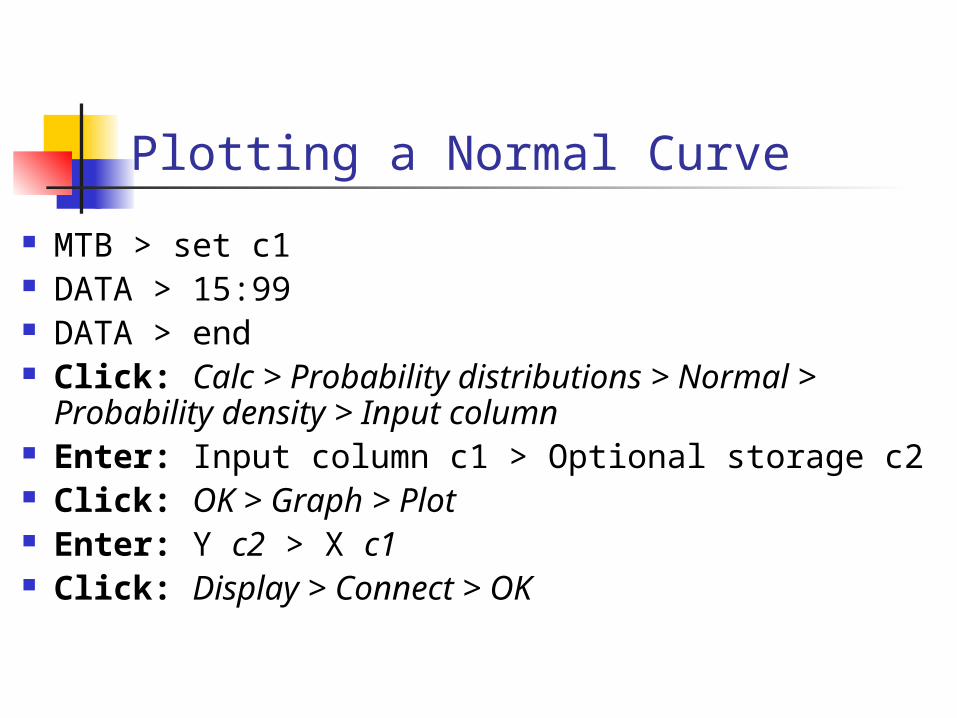
Plotting a Normal Curve
MTB > set c1 DATA > 15:99 DATA > end Click: Calc > Probability distributions > Normal
> Probability density > Input column Enter: Input column c1 > Optional storage c2 Click: OK > Graph > Plot Enter: Y c2 > X c1 Click: Display > Connect > OK
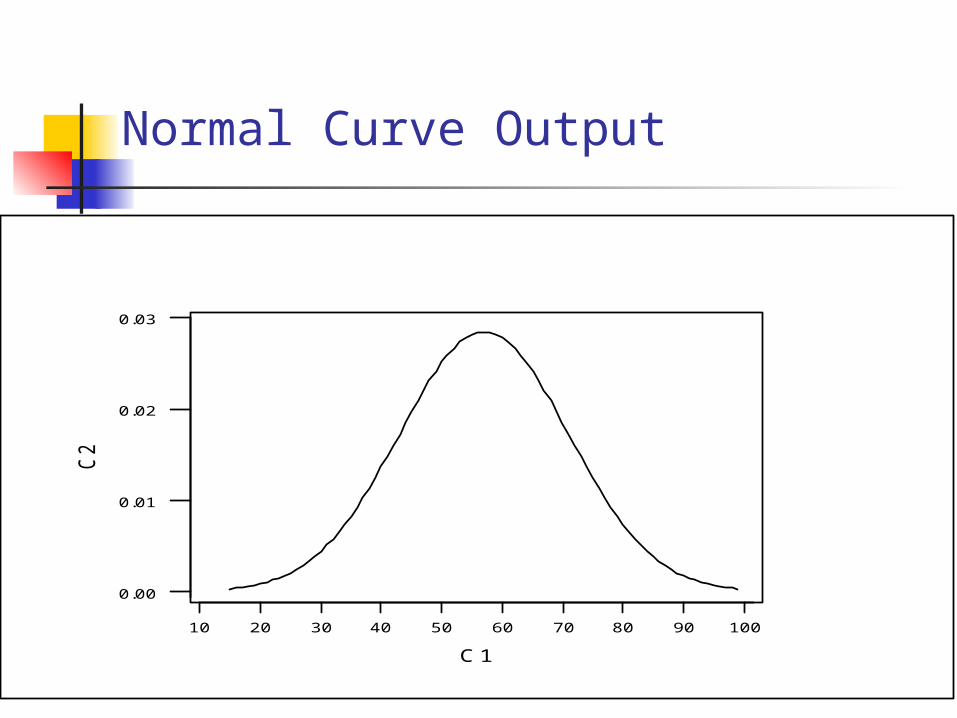
Normal Curve Output
100908070605040302010
0.03
0.02
0.01
0.00
C1
C2
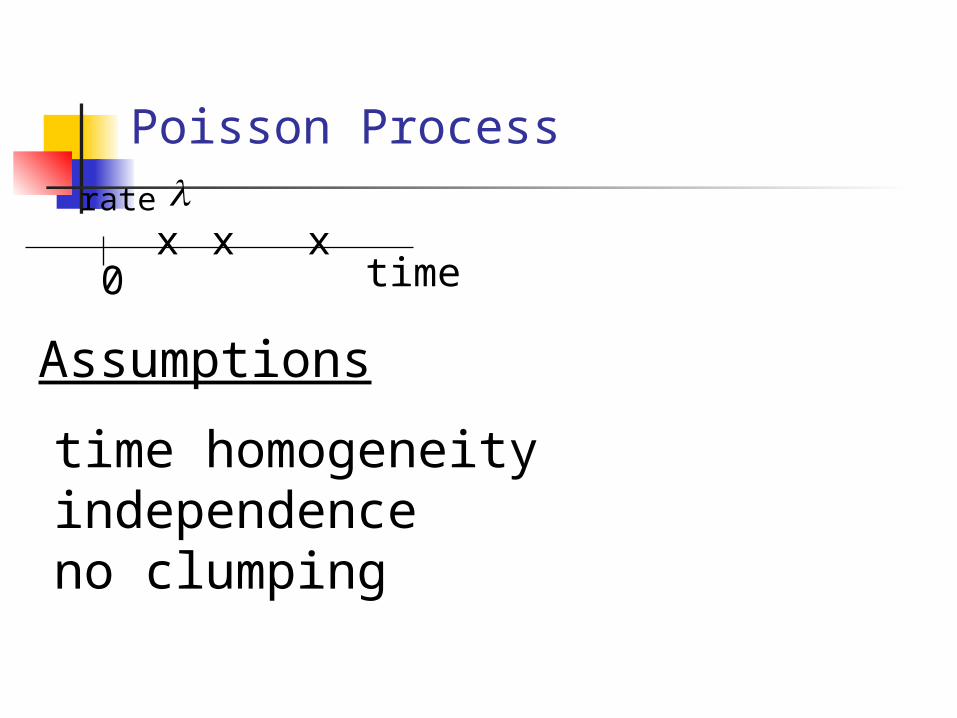
Poisson Process
time homogeneityindependenceno clumping
rate xxx
0 time
Assumptions
Poisson Process
Earthquakes strike randomly over time with a rate of = 4 per year.
Model time of earthquake strike as a Poisson process
Count: How many earthquakes will strike in the next six months?
Duration: How long will it take before the next earthquake hits?
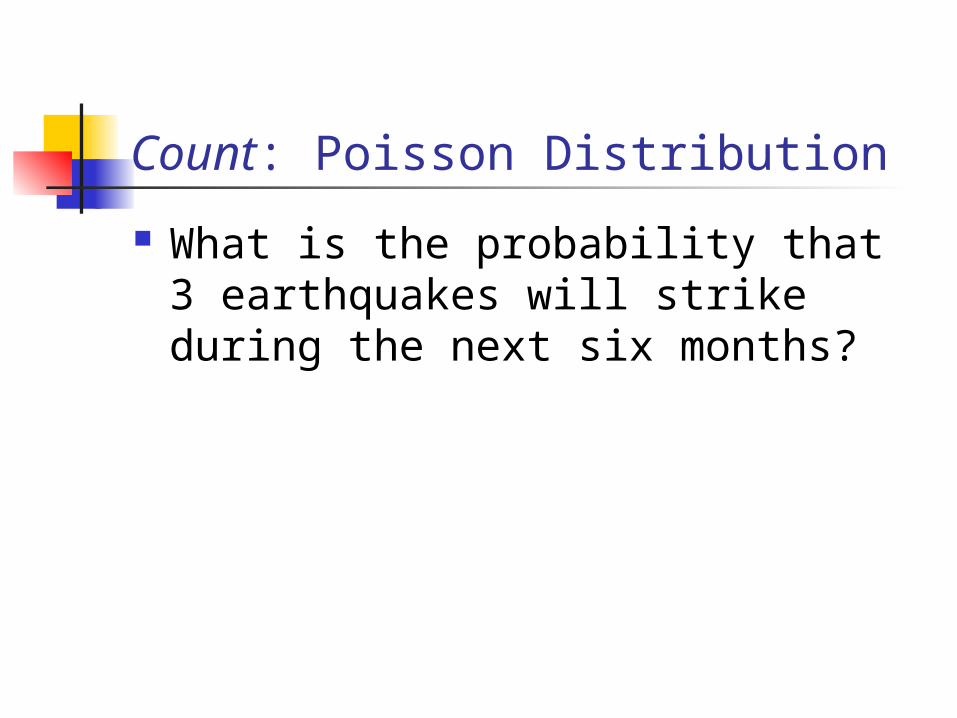
Count: Poisson Distribution
What is the probability that 3 earthquakes will strike during the next six months?
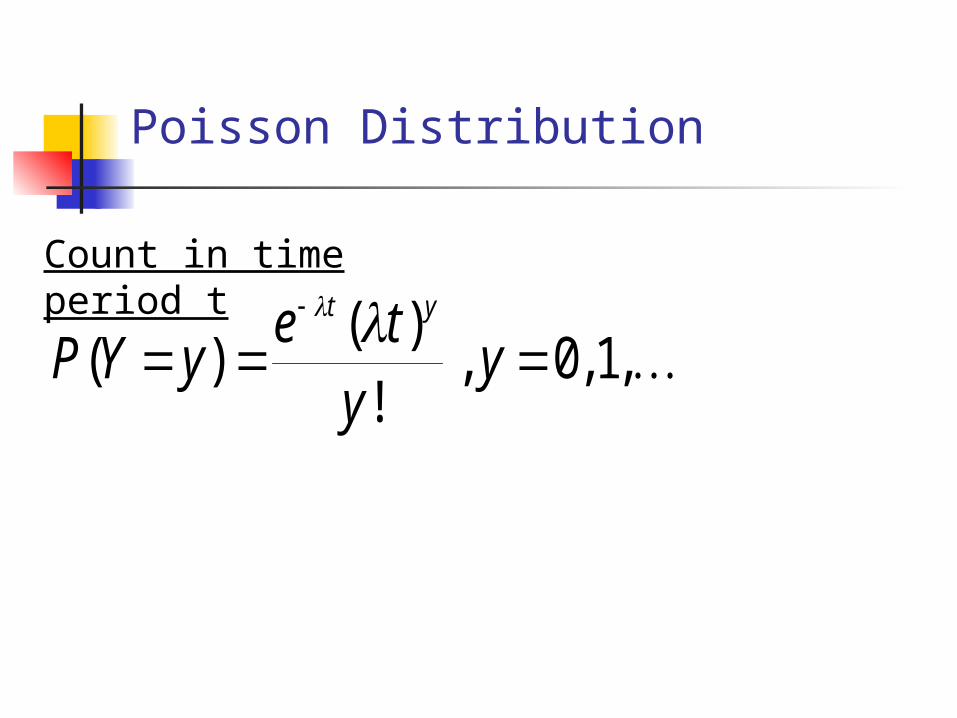
Poisson Distribution
Count in time period t
P Y ye t
yy
t y
( )( )
!, , ,
0 1
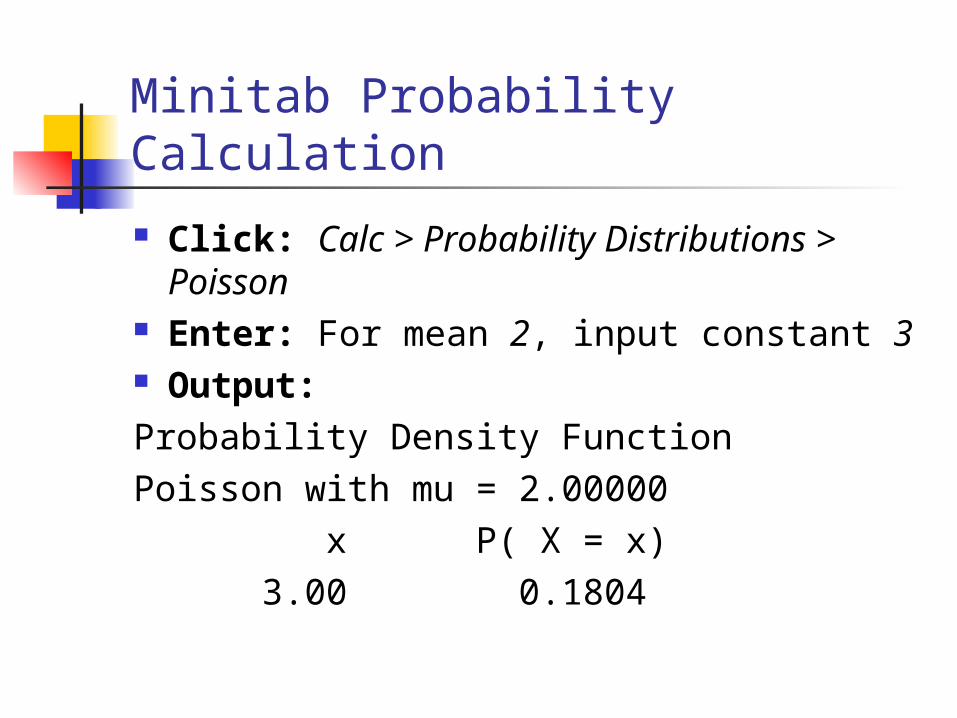
Minitab Probability Calculation
Click: Calc > Probability Distributions > Poisson
Enter: For mean 2, input constant 3 Output:Probability Density FunctionPoisson with mu = 2.00000 x P( X = x) 3.00 0.1804
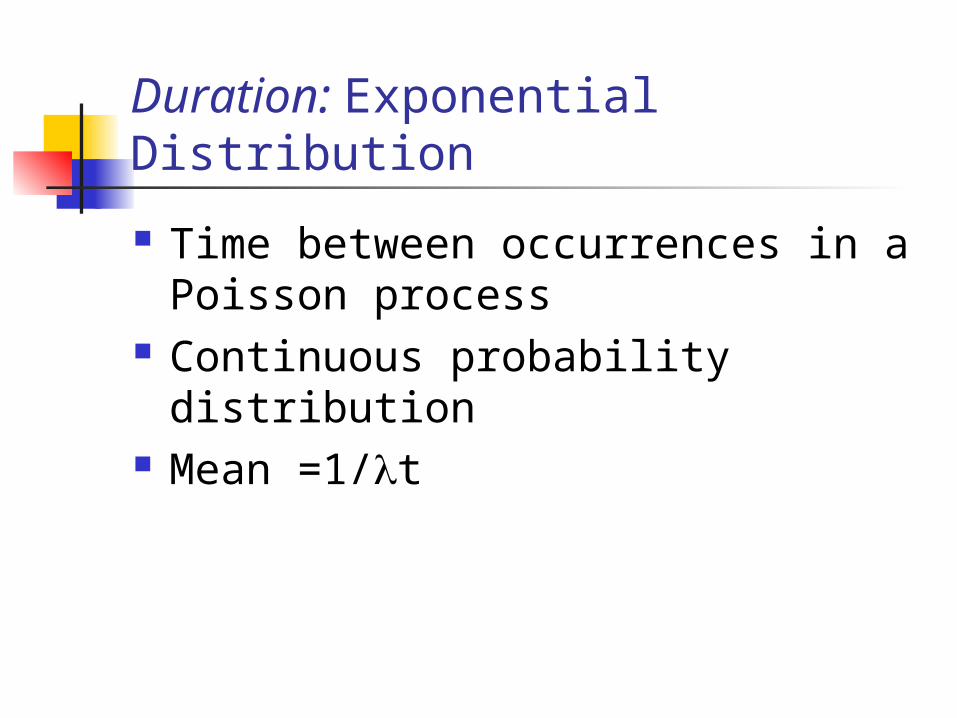
Duration: Exponential Distribution
Time between occurrences in a Poisson process
Continuous probability distribution Mean =1/t
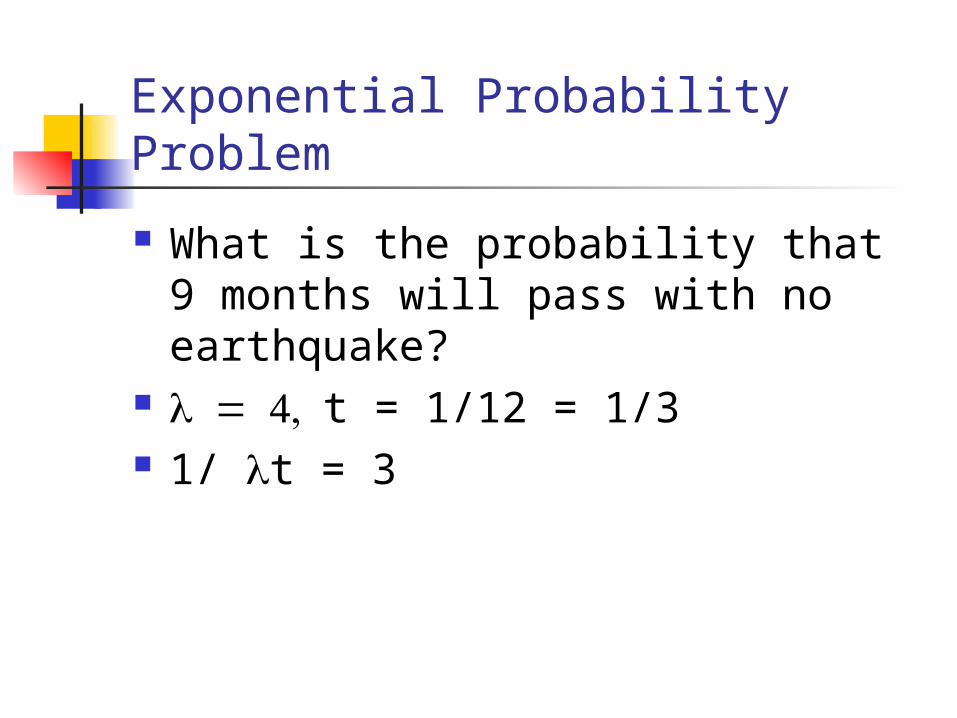
Exponential Probability Problem
What is the probability that 9 months will pass with no earthquake?
t = 1/12 = 1/3 1/ t = 3
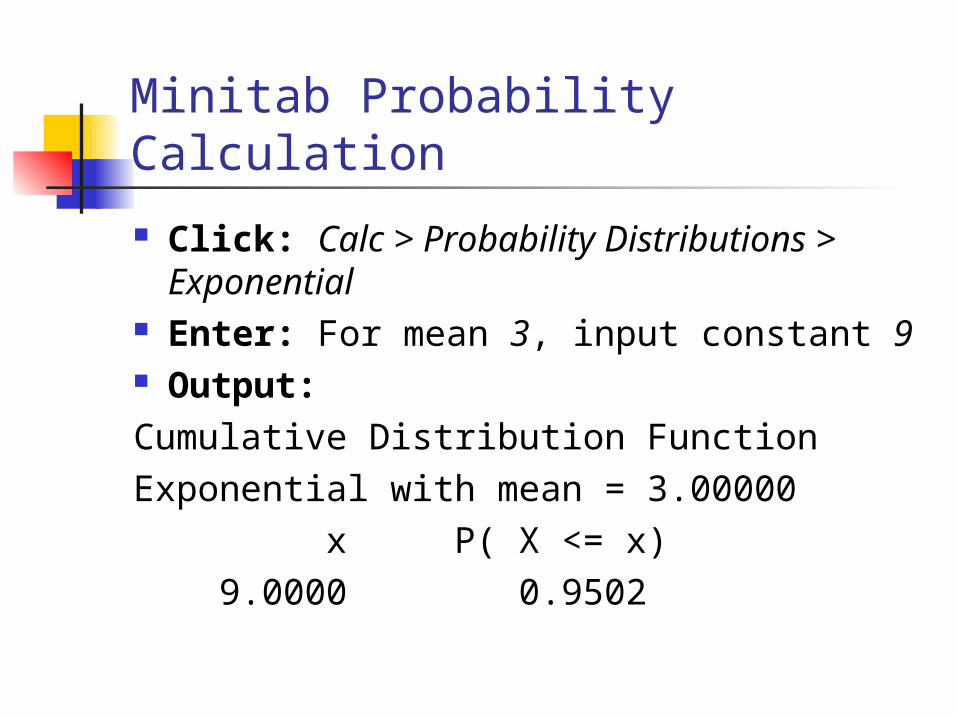
Minitab Probability Calculation
Click: Calc > Probability Distributions > Exponential
Enter: For mean 3, input constant 9 Output:Cumulative Distribution FunctionExponential with mean = 3.00000 x P( X <= x) 9.0000 0.9502
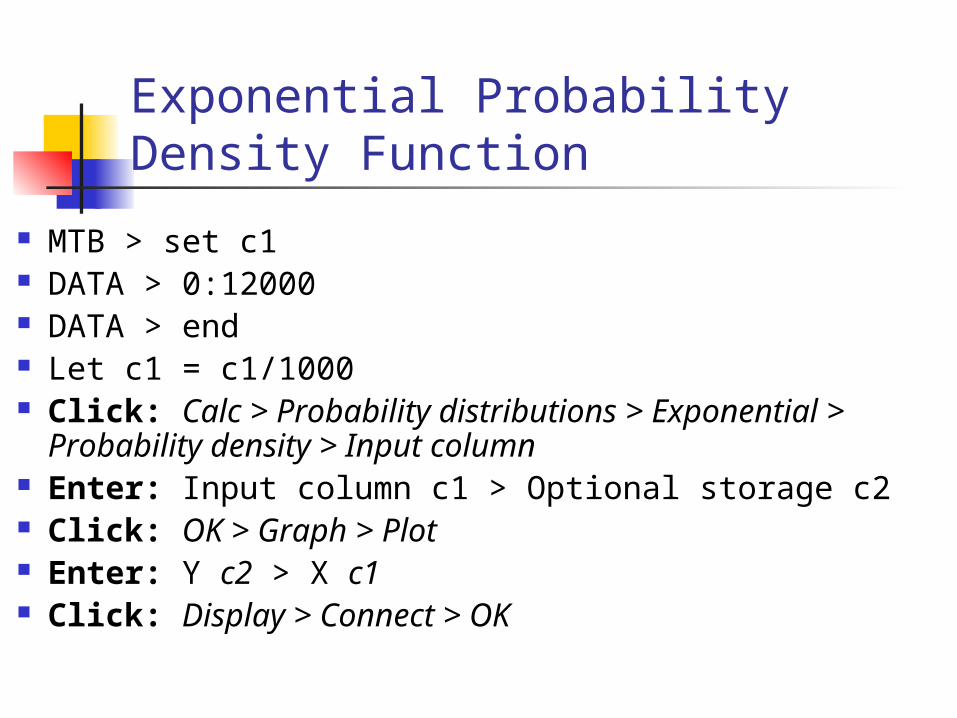
Exponential Probability Density Function
MTB > set c1 DATA > 0:12000 DATA > end Let c1 = c1/1000 Click: Calc > Probability distributions > Exponential
> Probability density > Input column Enter: Input column c1 > Optional storage c2 Click: OK > Graph > Plot Enter: Y c2 > X c1 Click: Display > Connect > OK
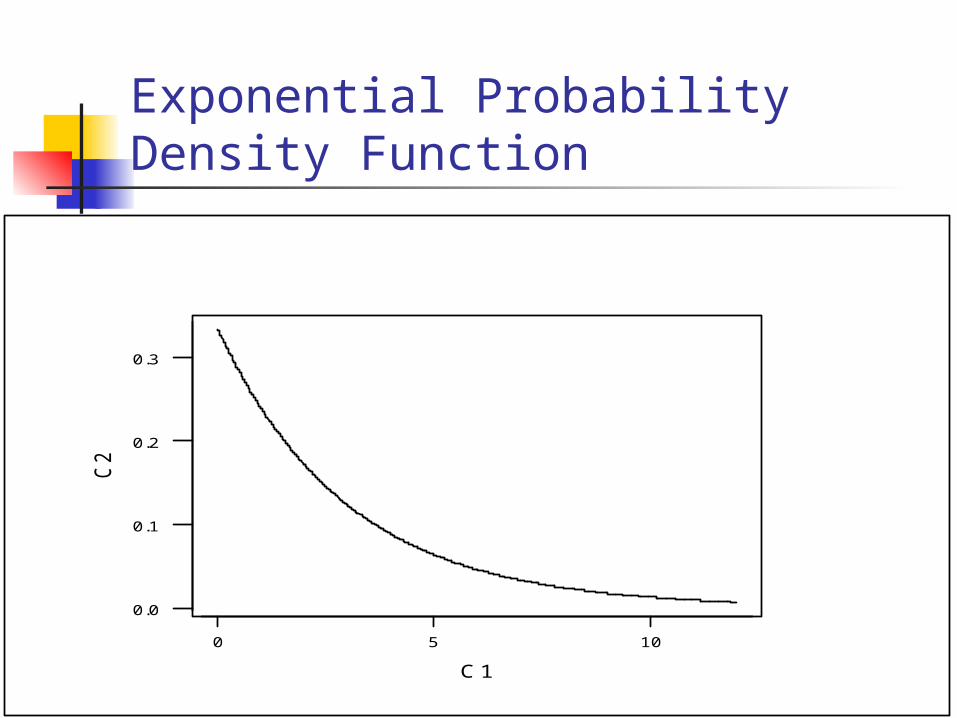
Exponential Probability Density Function
1050
0.3
0.2
0.1
0.0
C1
C2
Next Time: Random Sampling and Sampling
Distributions Normal approximation to binomial distribution Poisson process Random sampling Sampling statistics and sampling distributions Expected values and standard errors of
sample sums and sample means
Top Related