


Languages
Pages
Legal

MET 4300
Lecture 4
Radar and Satellite

In-situ vs. Remote Sensing Sensing : Using instruments/devices to measure
parameters Thermometers measure temperature, radar guns measure the speed
of passing cars
Two categories of sensing devices: in-situ sensing and remote sensing
In-situ sensing: In-situ sensing/measuring devices are in contact with the
medium or object they are sensing. Examples: ASOS, Rawinsonde, buoys, reconnaissance plane, staff
stream gauge

What is Remote Sensing? • Remote Sensing : Remote sensing measurement devices are not in direct contact
with the objects they sense.
Which of the following are In-situ sensors, and which are Remote Sensors?
1. Camera
2. Satellite
3. Hand in water
4. Metal detector
5. X-ray
6. Barometer

Active vs. Passive Remote Sensing Active remote sensors emit
electromagnetic (EM) waves that travel to an object and are reflected back toward the sensor.
Example: X-Ray, Radar, Lidar, Wind profiler
Radar works by transmitting a pulse of EM energy. Objects (raindrops, ice, snow, birds, insects, terrain, and buildings) reflect that energy. Part of the reflected energy is received back at the radar. Once the radar receives the reflected signal, computer programs and meteorologists interpret the signal to determine where it is precipitating.

Active vs. Passive Remote Sensing (Cont.) • Passive remote sensors observe EM waves emitted by
objects. Example: Camera;
Satellite IR, Visible, Passive Microwave sensors
Satellite visible sensors:
visible imagery is available only during daylight hours since sunlight is reflected only during that period.
Satellite IR sensors: Infrared energy is emitted 24 hours a day from the earth’s surface and the atmosphere and is sensed by satellites continuously.

How Does Radar Work? • Radar emits pulses of microwave energy (between two pulses,
there is a waiting/listening time)
• The energy (radar beam) travels until it reaches a target
• Reflected back to antenna
• Time of travel tells distance
• Brightness of echo tells size and/or number of scatterers

The principle components of a weather radar

Transmitter & Antenna
• Transmitter is an electronic component of the radar that creates microwaves that are focused into a narrow beam by an antenna.
• Antenna is the device that sends the radar’s signal into the atmosphere.

Receiver
• To detect and amplify the very weak signals received the antenna.
• Very sensitive, some with dynamic range of 80 or 90 dB
• Logarithmic receiver, digital receiver

Common Weather Radar Computer Displays/Indicators
RHI –Range Height Indicator
Range (km)
Height
(km)
PPI –Plan Position Indicator
R(km)
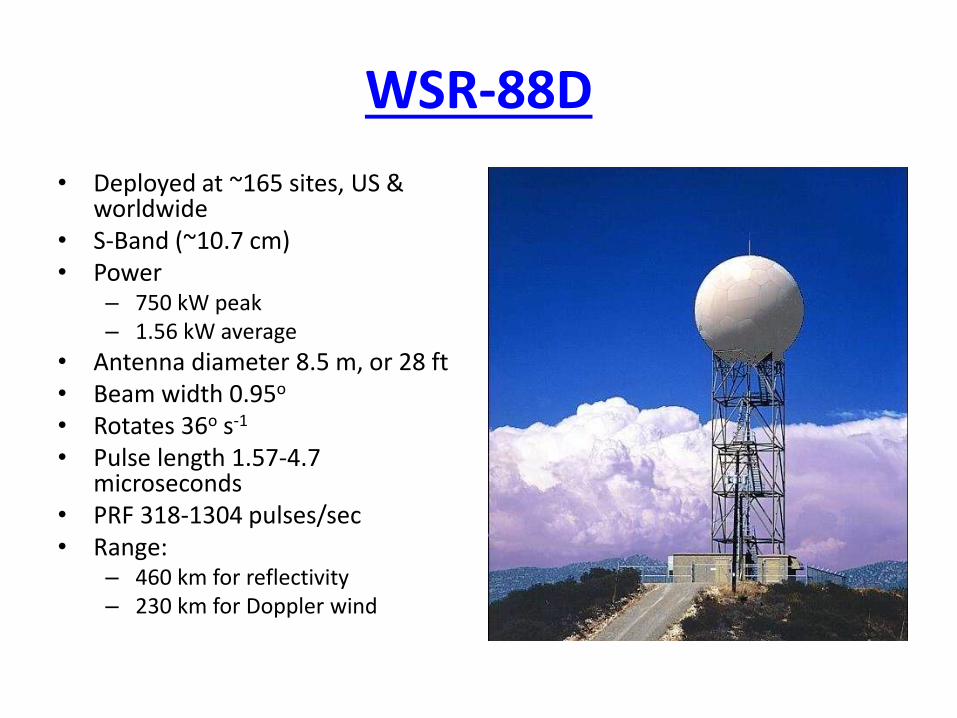
WSR-88D
• Deployed at ~165 sites, US & worldwide
• S-Band (~10.7 cm) • Power
– 750 kW peak – 1.56 kW average
• Antenna diameter 8.5 m, or 28 ft • Beam width 0.95o
• Rotates 36o s-1
• Pulse length 1.57-4.7 microseconds
• PRF 318-1304 pulses/sec • Range:
– 460 km for reflectivity – 230 km for Doppler wind

2.10

What does a Doppler radar measure?
1. the time it takes for the microwave energy to travel from the transmitter
to the target and back to the receiver, which determines the distance to the
precipitation;
2. the pointing angles of the antenna, which determines the altitude of
the precipitation and its geographic location;
3. the amount of microwave energy returned to the radar (scattered
back by the target), which determines the radar reflectivity, then
intensity of the precipitation, and when integrated over time, the total
precipitation;
4. (Specifically for Doppler radar) the frequency shift between the
transmitted signal and the signal received from the target, which
determines the speed of the wind toward or away from the radar. The
latter can be used to detect strong winds, wind shifts, and rotation in the
flow.

65 55 45 35 25 15 5
Reflectivity Factor (dBZ)
Radar reflectivity Z
(dBZ=10 log Z): is a
measure of the power
scattered back to the radar
from objects in the path of a
radar beam
Z depends on 3 parameters:
the size of the precipitation
particles, the type of
particles (ice crystals, hail, or
rain), and the number of
particles in the beam.
Z is proportional to the sum
of the sixth power of the
diameter of all the
particles illuminated by a
pulse provided the particles
are much smaller than the
radar wavelength.

“Precipitation” mode

“Clear air” mode
(often used for snow) Radar parameters set to increase
sensitivity

Precipitation mode scan geometry Severe weather scan geometry
Saves time…fewer elevations

Clear air mode: Fewer elevations, slower antenna rotation to
achieve greater sensitivity for sensing clear air turbulence, insects and clouds, light
drizzle or light snowfall.

Z-R (Reflectivity-Rain) Relationships
bz AR
where z is the radar reflectivity factor (mm6/m3), R is
rain rate (mm/h), and A and b are empirical constants.
Marshall-Palmer Z-R relationship:
Empirical power-law Z-R relationship:
1.6200z R
Z-R relationships are different for different meteorological conditions.
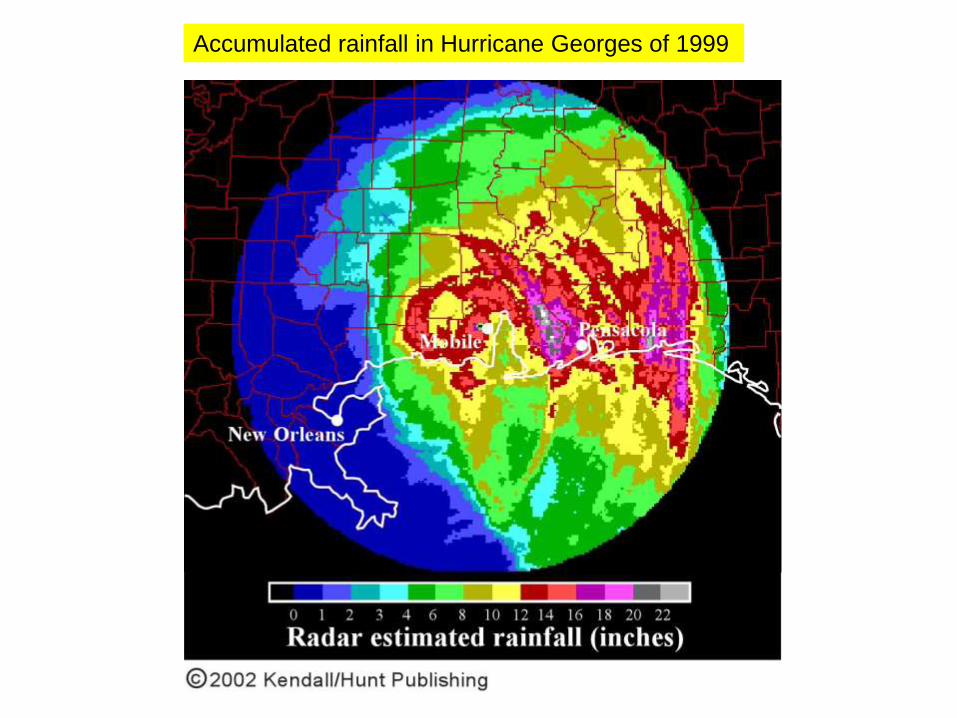
Accumulated rainfall in Hurricane Georges of 1999

Distance (km)
Reflectivity factor (dBZ)
Stratiformarea Convection
BBAlt itude (km)
The bright band: an
enhancement of radar
reflectivity at the melting level
when snowflakes falling
from above aggregate and
develop wet surfaces.
Note convective
and stratiform regions
of squall line. Precipitation
estimates in stratiform
region must be carefully
examined because of
bright band effects

A
B
A
B
A
B
A BA B
(a) (b)
(c)(d)
A BA B A BA B
(a) (b)
(c)(d)
ER-2 EDOP
P-3 TA
Doppler velocity (m/s) Reflectivity (dBZ)
ER-2 EDOP
P-3 TA
Aircraft radar measurements in Hurricane Dennis (2005)
22
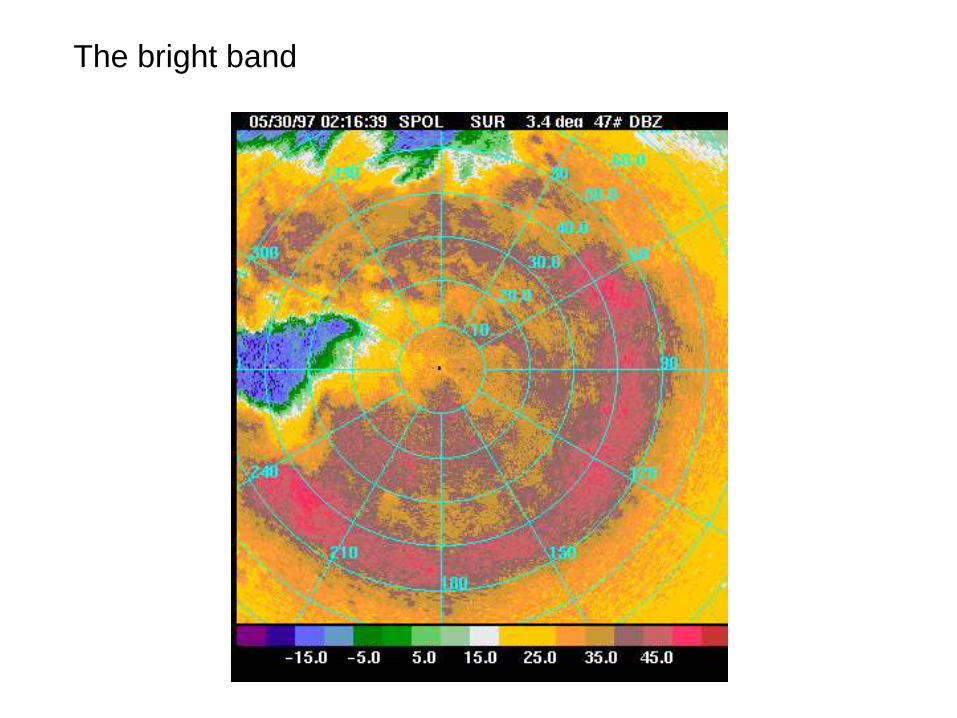
The bright band

An extreme example of bright band contamination of
precipitation estimation.

Reflectivity for hail Rain: usually 20-50 dBZ (sometime could go up to
55 dBZ)
Hail: a general rule: reflectivity>= 60 dBZ, definitely
hail; 50-55 dBZ, possible hail
A flare echo (sometimes called a "hail spike") is
an artifact that sometimes appears on images of
radar reflectivity when large hail is present in
severe thunderstorms. It is due to the EM energy
reflection to the earth surface then reflected back
to the hail stone, then backscattered to the radar.
So its distance from the radar is a bit longer than
the hail echo itself.

Severe thunderstorms over South Dakota, July 23, 2010
The giant hailstone that fell
from a supercell at the town of
Vivian, South Dakota, on July
23, 2010, had a record-
breaking diameter of eight
inches.

Which echo is likely to producing large hail?
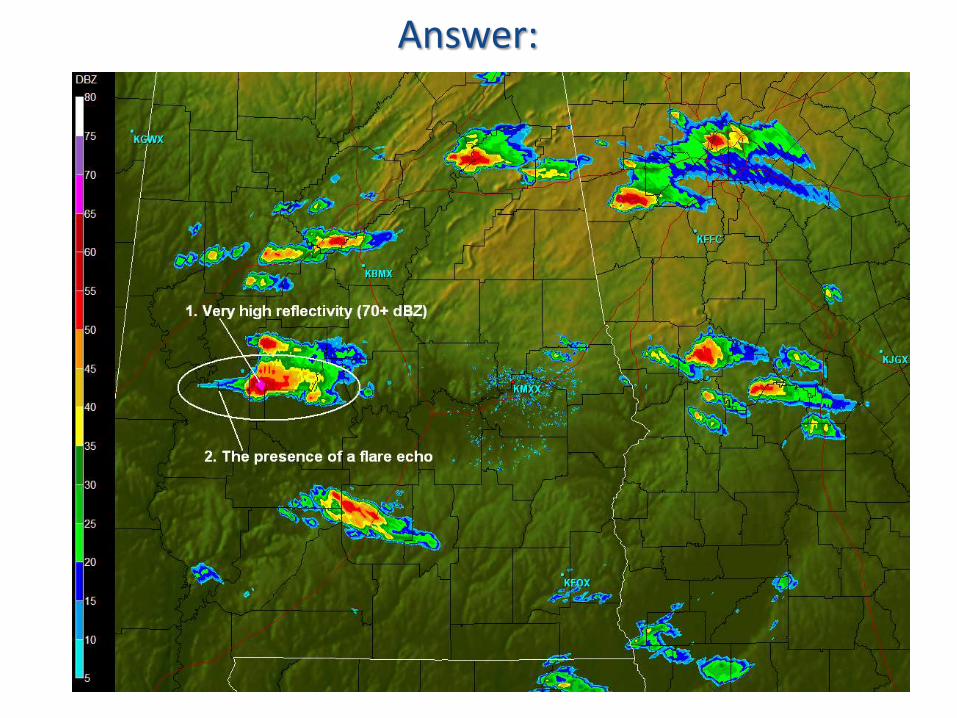
Answer:

Doppler Radial Velocity
A measure of the
component of the
wind along the
direction of the
radar beam

Interpretation of Doppler Velocity Doppler radar viewing configuration (scanning 360 degree at a given elevation angle).

An Example • Get wind profile from Doppler radar PPI display (next a few slides) • Doppler velocity is negative for toward radar, positive for away from radar • Zero value zone means that the wind direction is perpendicular to the radar beam. • The wind speed at a given height is the maximum value around a constant slant
range circle.

Patterns associated with vertical profiles having constant wind directions

Patterns associated with vertical profiles having constant wind directions

Patterns associated with vertical profiles having constant wind directions

Patterns associated with nonuniform horizontal wind fields (difluent)
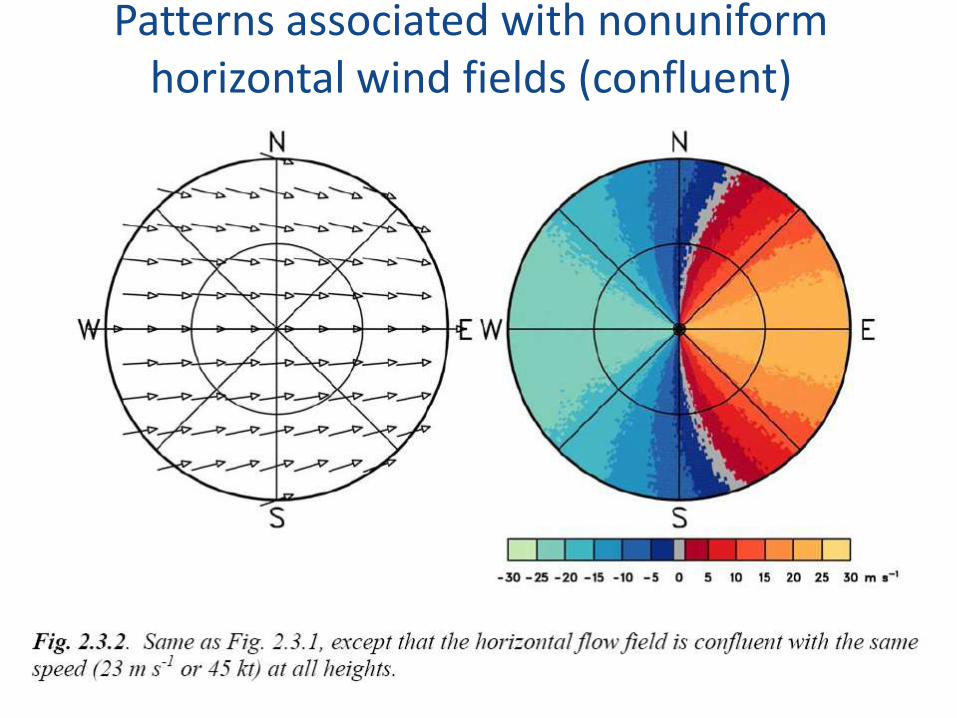
Patterns associated with nonuniform horizontal wind fields (confluent)

Patterns associated with vertical profiles having constant wind speed

Patterns associated with a mesocyclone

Patterns associated
with a tropical cyclone (Max.
real wind speed=60m/s;
Doppler Vmax=30m/s.
Velocity Folding!)
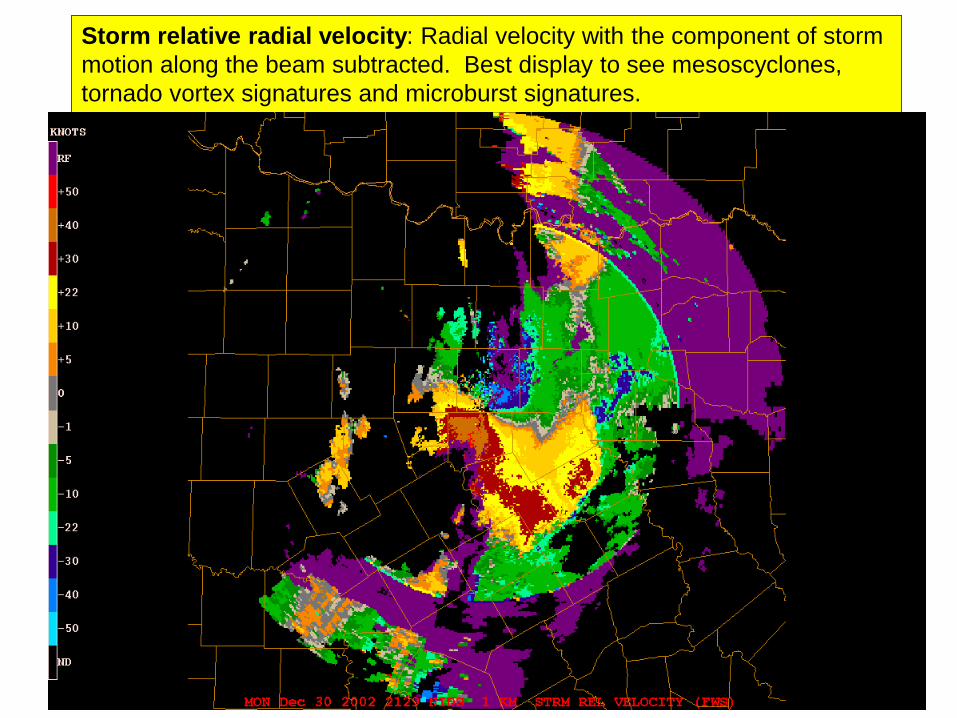
Storm relative radial velocity: Radial velocity with the component of storm
motion along the beam subtracted. Best display to see mesoscyclones,
tornado vortex signatures and microburst signatures.

Radar reflectivity
Radial Velocity
Tornado
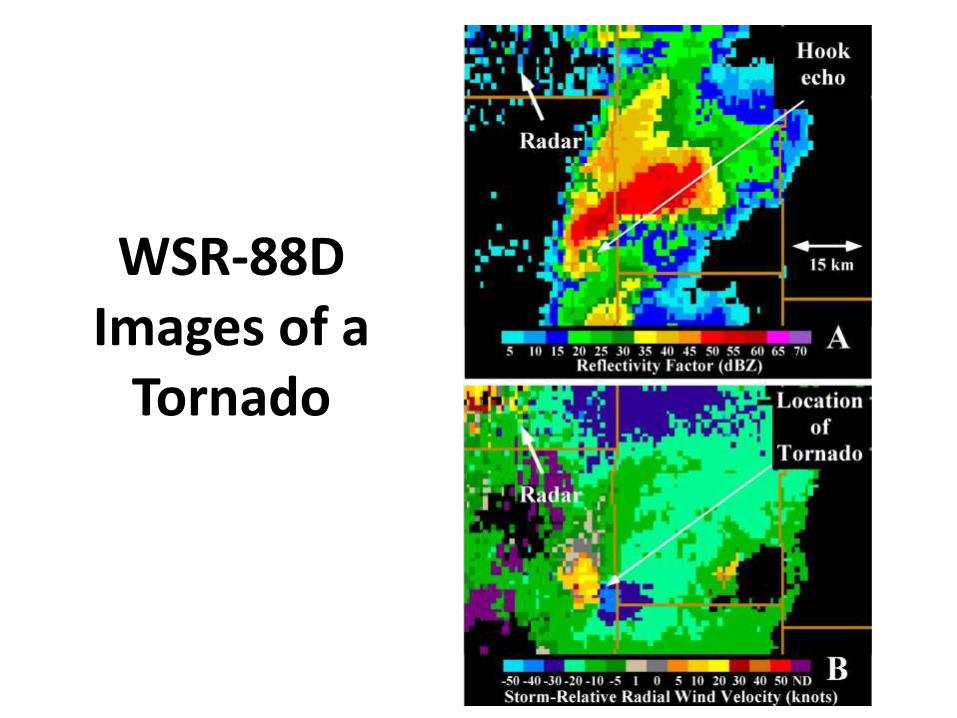
WSR-88D Images of a
Tornado

Wind Profiler Site with RASS (temperature profiler)

Wind Profiling
• A wind profiler is another type of Doppler radar that operates in very high frequency (VHF) and altra high frequency (UHF) radio bands.
• The antenna is an array of cables, called a phased array antenna.
• Energy is scattered by small variations in the atmospheric density associated with turbulence.

Wind Profilers use a three beam system, and measures wind profile
http://www.profiler.noaa.gov/npn/profiler.jsp
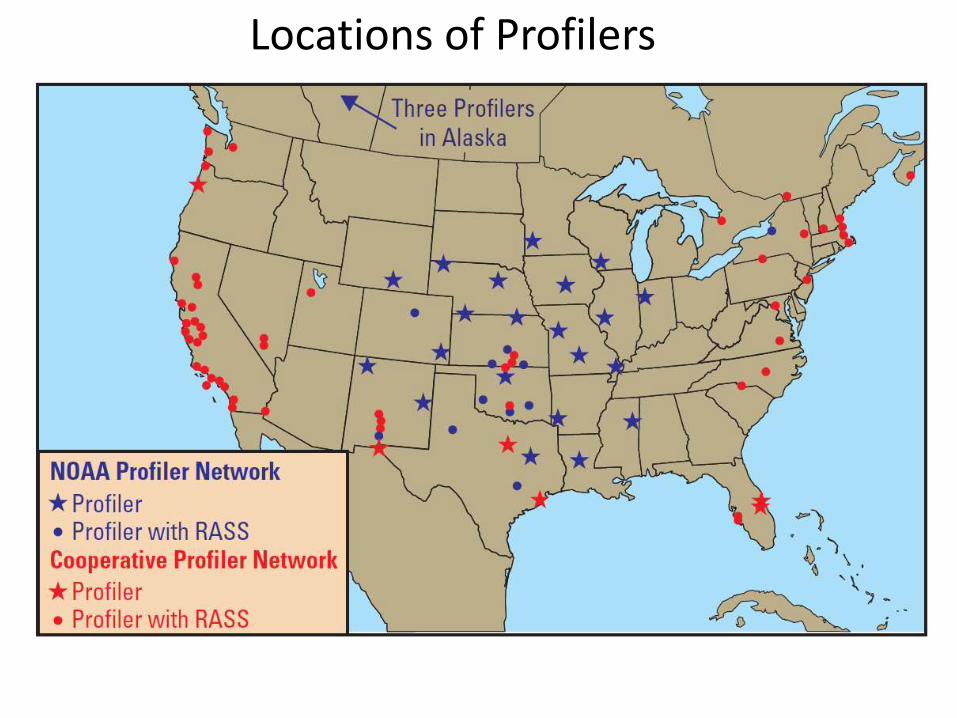
Locations of Profilers

Wind Profiler Data in a Cold Front
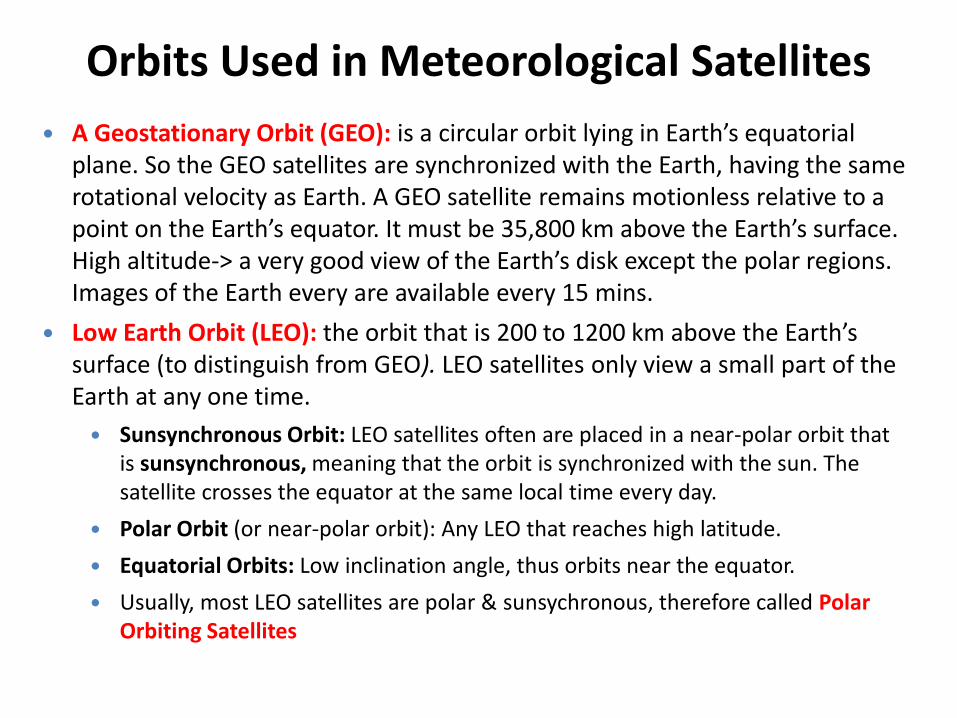
Orbits Used in Meteorological Satellites
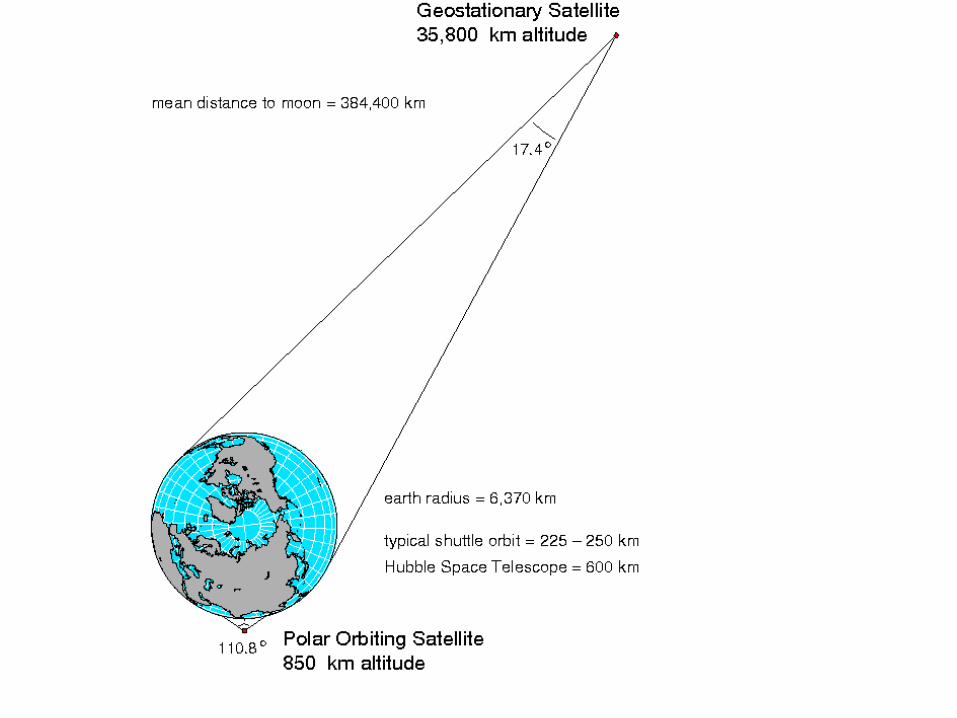
A Geostationary Orbit (GEO): is a circular orbit lying in Earth’s equatorial plane. So the GEO satellites are synchronized with the Earth, having the same rotational velocity as Earth. A GEO satellite remains motionless relative to a point on the Earth’s equator. It must be 35,800 km above the Earth’s surface. High altitude-> a very good view of the Earth’s disk except the polar regions. Images of the Earth every are available every 15 mins.
Low Earth Orbit (LEO): the orbit that is 200 to 1200 km above the Earth’s surface (to distinguish from GEO). LEO satellites only view a small part of the Earth at any one time.
Sunsynchronous Orbit: LEO satellites often are placed in a near-polar orbit that is sunsynchronous, meaning that the orbit is synchronized with the sun. The satellite crosses the equator at the same local time every day.
Polar Orbit (or near-polar orbit): Any LEO that reaches high latitude.
Equatorial Orbits: Low inclination angle, thus orbits near the equator.
Usually, most LEO satellites are polar & sunsychronous, therefore called Polar Orbiting Satellites

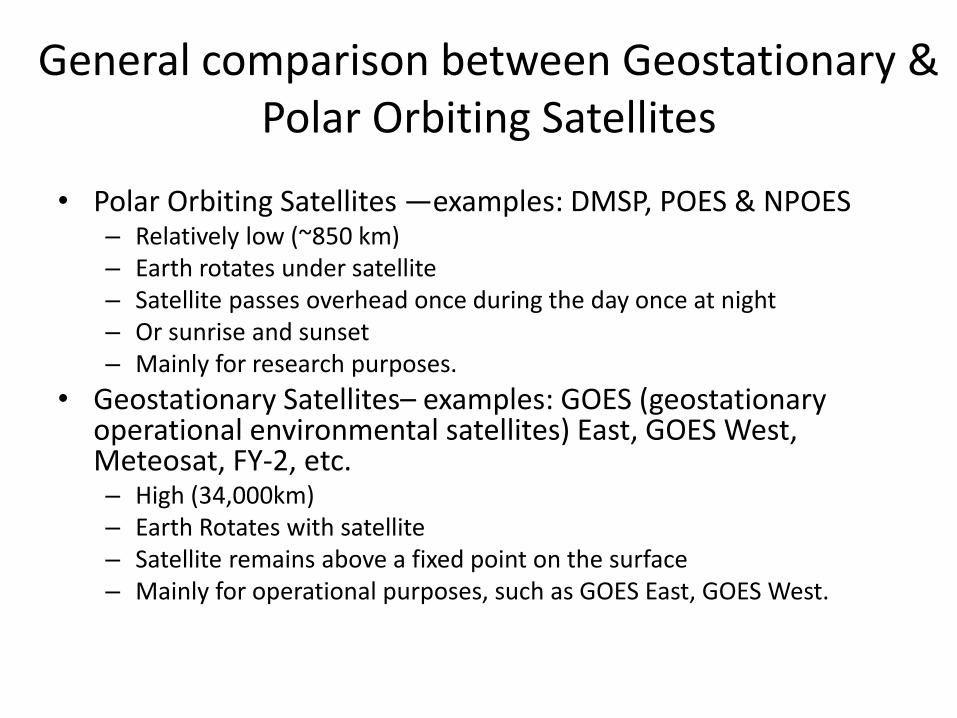
General comparison between Geostationary & Polar Orbiting Satellites
• Polar Orbiting Satellites —examples: DMSP, POES & NPOES – Relatively low (~850 km) – Earth rotates under satellite – Satellite passes overhead once during the day once at night – Or sunrise and sunset – Mainly for research purposes.
• Geostationary Satellites– examples: GOES (geostationary operational environmental satellites) East, GOES West, Meteosat, FY-2, etc. – High (34,000km) – Earth Rotates with satellite – Satellite remains above a fixed point on the surface – Mainly for operational purposes, such as GOES East, GOES West.

Geostationary Satellite
Coverages (prior to 2011)
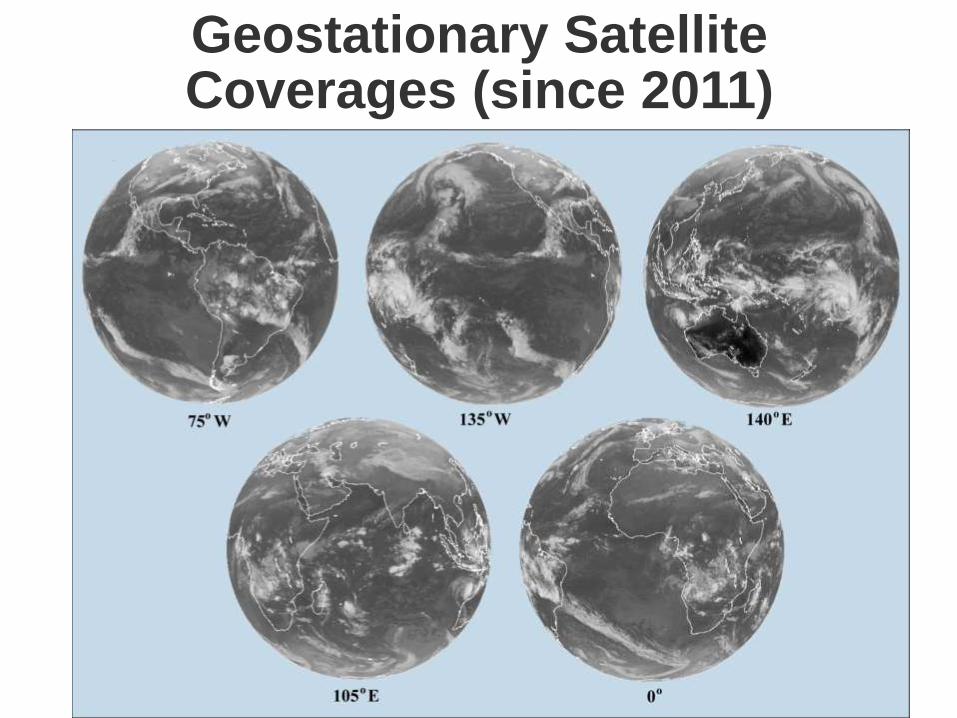
Geostationary Satellite Coverages (since 2011)

Fig. 2. Map of the ground path of one revolution of a typical near-polar
orbiting satellite.
Fig. 3. The orbit of a near polar satellite
as viewed from a point rotating with the
Earth.

Fig. 4. The ground paths of the multiple orbital revolutions during
one day for a near-polar orbiting satellite.
Depending on the ground swath of the satellite, it is possible to adjust the
period (by varying the altitude), and thus the longitudinal displacement, in
such a way as to ensure the observation of any point on the Earth within a
certain time period. Most of the near polar meteorological satellites
ensure complete global coverage of the Earth during one day, thanks to
a ground swath of about 3300 km.

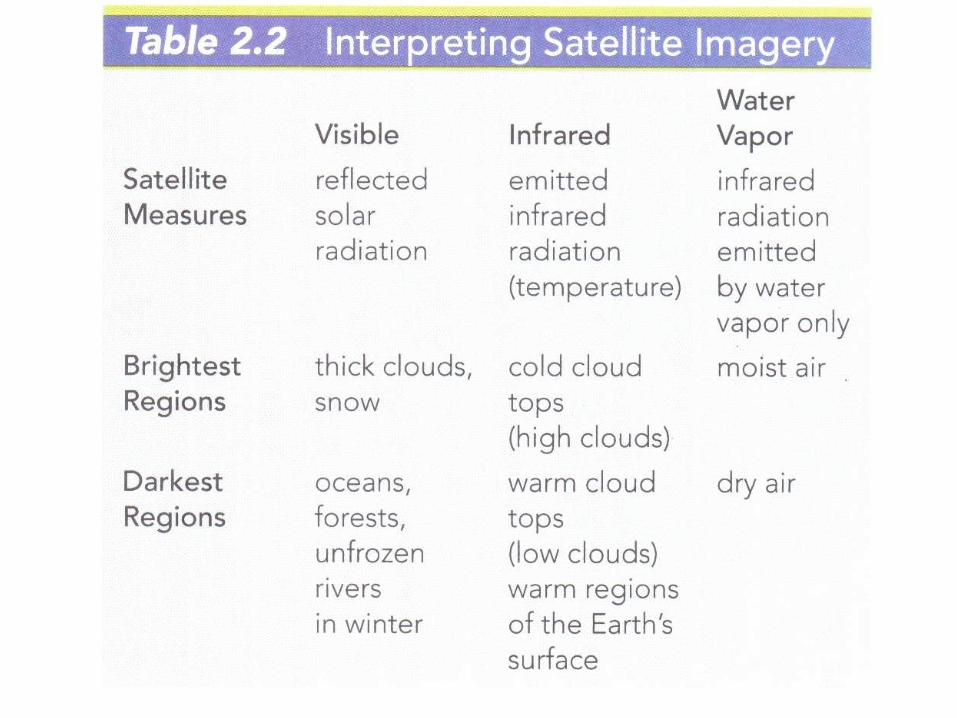
Meteorological Sensors on Geostationary Satellites
• Three electromagnetic frequency bands or channels:
– Visible
– Infrared (IR)
– Water vapor
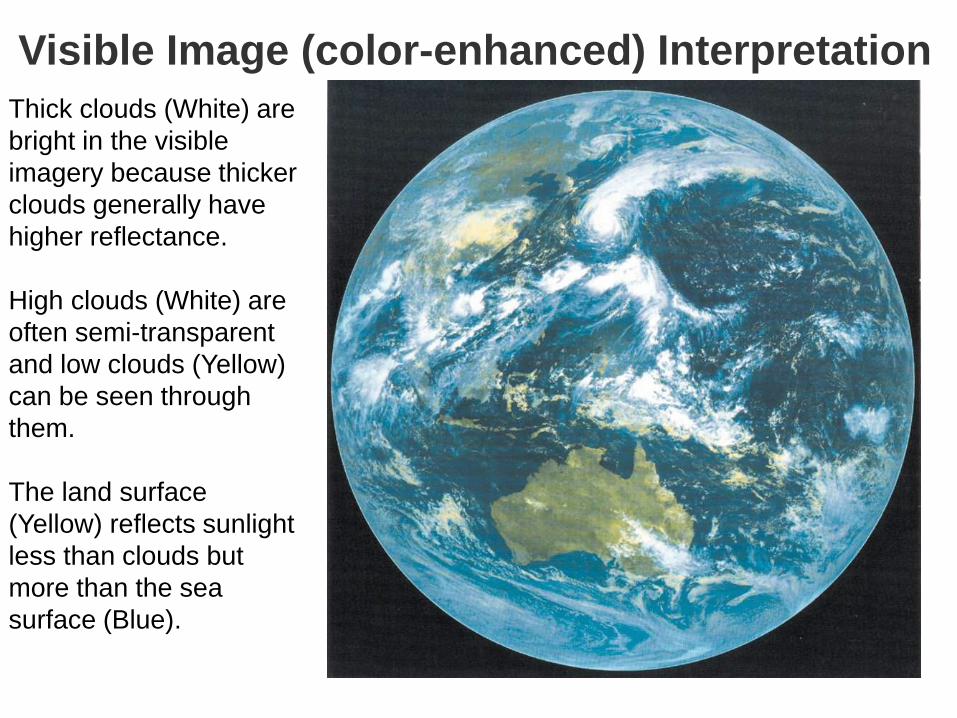
Visible Image (color-enhanced) Interpretation
Thick clouds (White) are
bright in the visible
imagery because thicker
clouds generally have
higher reflectance.
High clouds (White) are
often semi-transparent
and low clouds (Yellow)
can be seen through
them.
The land surface
(Yellow) reflects sunlight
less than clouds but
more than the sea
surface (Blue).

Visible Image (black & white) Interpretation
Brightest regions:
clouds or snow.
Dark gray regions:
surfaces that absorb
most incoming solar
radiation. For example,
oceans & forests. Land
is a little bit brighter than
oceans.
Dark indicated no
reflected radiation --
night.
A winter morning

IR Image (color-enhanced) Interpretation Thick clouds, such as those
associated with the typhoon,
look white (lowest
temperature).
High clouds, which look semi-
transparent in the visible
imagery, are also shown white
or yellow.
Low clouds are displayed as
red. They may have
temperatures close to that of
the underlying ocean and are
more difficult to identify in the
infrared than in the visible
imagery.
The desert in Australia is
much hotter (black) than any
cloud and shows up clearly.
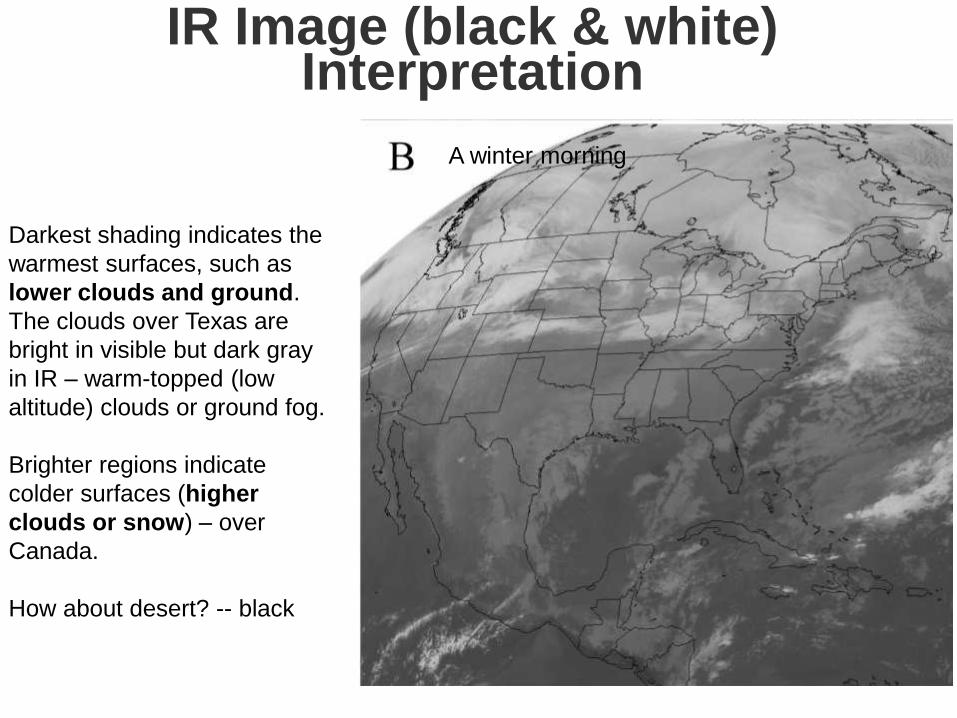
IR Image (black & white) Interpretation
Darkest shading indicates the
warmest surfaces, such as
lower clouds and ground.
The clouds over Texas are
bright in visible but dark gray
in IR – warm-topped (low
altitude) clouds or ground fog.
Brighter regions indicate
colder surfaces (higher
clouds or snow) – over
Canada.
How about desert? -- black
A winter morning

Water Vapor Image (black & white) Interpretation
The brightest regions are moist air
and cloud, while the darkest regions
correspond to very dry air.
The bright/dark boundary indicates
the location of upper troposphere
jetstream. For example, subtropical
jet from central Mexico, across the
Caribbean Sea to the northern tip of
Cuba, and eastward over the
Atlantic.

Water Vapor Image (color-enhanced) Interpretation
The brighter parts show the
moister parts of the upper and mid-
troposphere.
Thick clouds and high clouds are
seen white (similar to IR and visible
images). The earth's surface and
low clouds are undetectable .
Grey shades corresponding to
water vapor amounts are seen
where there are no high and middle
clouds.
In the southern hemisphere, dark
areas can be seen, associated with
dry upper air.
Many vortices of grey shades are
also seen, associated with upper
tropospheric lows.
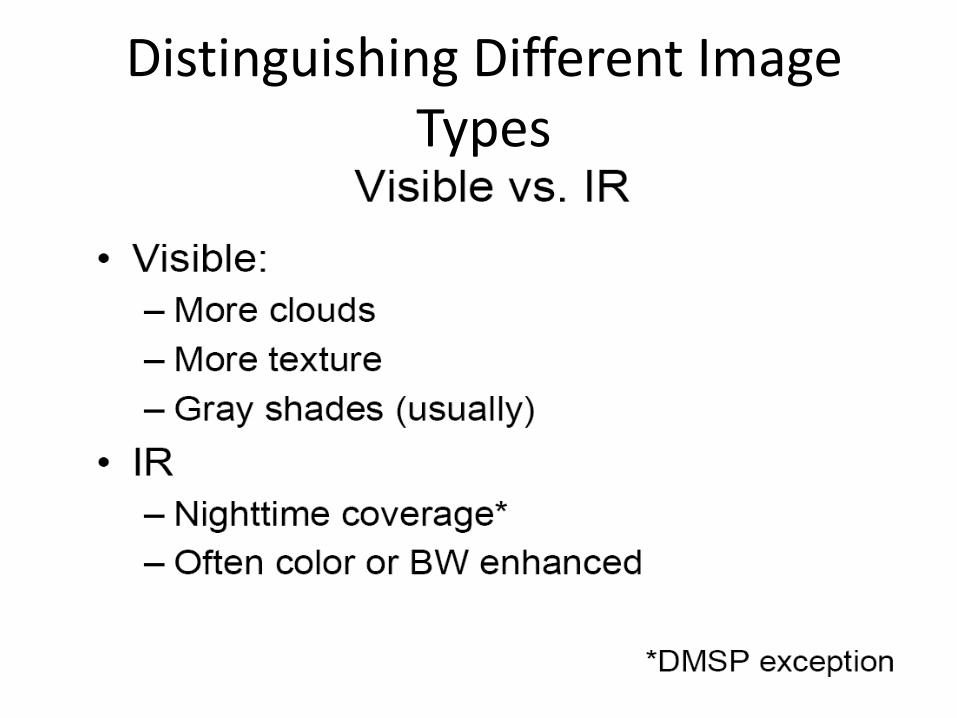
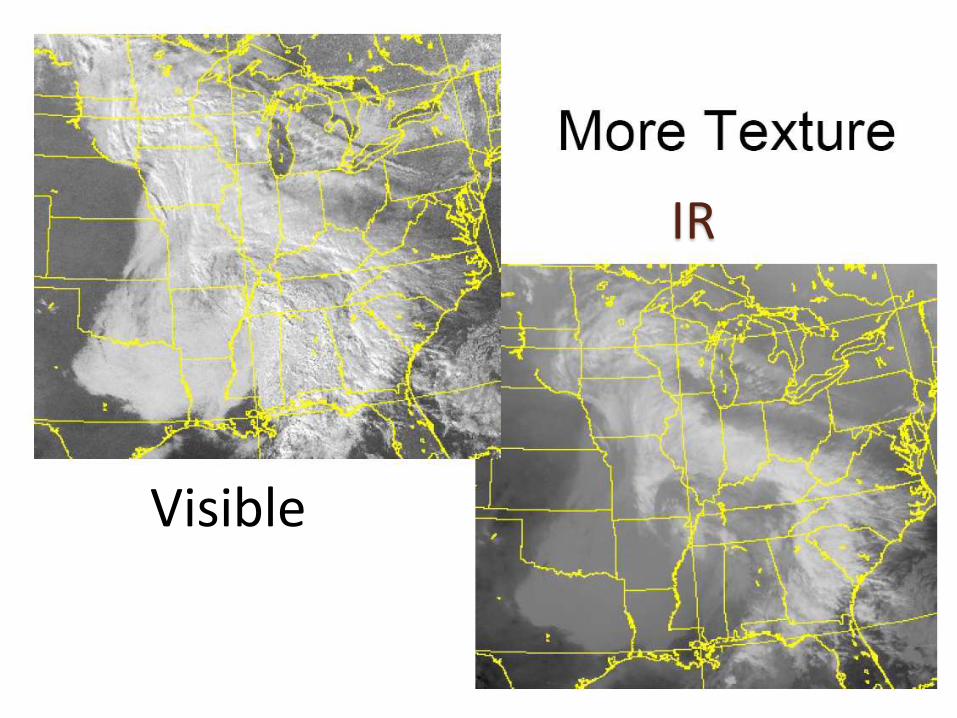
Distinguishing Different Image Types

Visible
US East Coast, 12:15 UTC (7:15 local time), Apr. 6, 2011
IR

Visible IR
IR
Visible

Guess? (12:00UTC, Apr 6, 2011, METEOSAT-9)

Guess? (12:45UTC, Apr. 6, 2011, GOES East)


Answer!

Commercial Aircraft Meteorological Data Reporting (AMDAR) Systems

The US National Lightning Detection Network (NLDN) Detects Locations of Cloud-to-Ground Strokes

The US and Canadian National Lightning Detection Networks
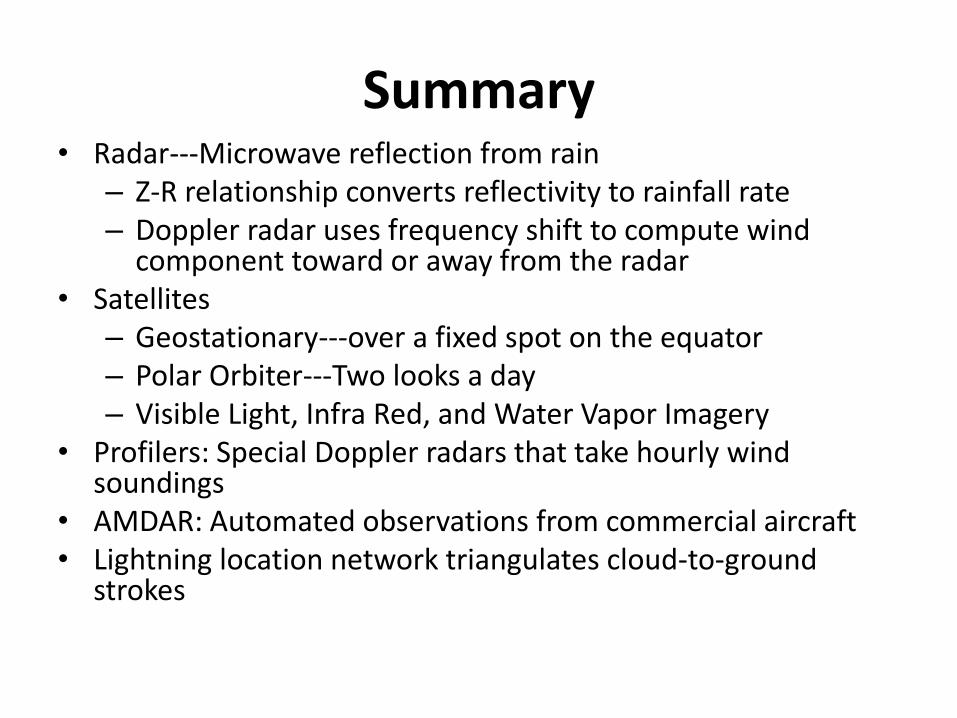
Summary • Radar---Microwave reflection from rain
– Z-R relationship converts reflectivity to rainfall rate – Doppler radar uses frequency shift to compute wind
component toward or away from the radar • Satellites
– Geostationary---over a fixed spot on the equator – Polar Orbiter---Two looks a day – Visible Light, Infra Red, and Water Vapor Imagery
• Profilers: Special Doppler radars that take hourly wind soundings
• AMDAR: Automated observations from commercial aircraft • Lightning location network triangulates cloud-to-ground
strokes
Top Related