


Languages
Pages
Legal

1
Least-cost optimization pathways to the German electricity market with new
energy and environmental policies
Subhash Kumar
*, Reinhard Madlener
Institute for Future Energy Consumer Needs and Behavior (FCN) School of Business and Economics / E.ON Energy Research Center
RWTH Aachen University, Mathieustrasse 10, 52074 Aachen, Germany
* Corresponding author.
E-mail: [email protected], Tel.: +49-2418049840, Fax: +49-2418049829.
Abstract: In recent years the German Federal Government has taken many decisions to ensure
sustainable energy supply in the future. This is evident from the Energy Concept which was
introduced in September 2010. The main aim of this concept is to cut greenhouse gas emissions
by 80% up to 2050 compared to 1990 levels and the renewables to supply the country’s energy
needs in the future. This attempts to find the least cost solutions of electricity supply and CO2
emission reduction up to 2050. A number of scenarios are developed to identify the optimal
solution. The results of the simulation show that 30% energy efficiency scenario is the most
effective in terms of electricity generation as well as CO2 emissions reduction. The
competitiveness of CCS technology depends on the carbon price. The prices required vary from
€10.5/t to €64.5/t, depending on the scenario.
Keywords: Electricity, Germany, LEAP model, Least-cost method, CO2 emissions
1. Introduction:
The German Government set itself ambitious targets for energy and climate policy with the
introduction of an Energy Concept in 2010 (BMWi, 2010). First, greenhouse gas emissions are to
be cut by at least 80% until 2050 compared to 1990 levels. Second, renewables are to supply 80%
of electricity as opposed to the 80% of electricity currently derived from fossil fuels and nuclear
energy. Third, energy consumption is to be reduced by 25% up to 2050 as compared to 2008,
which should already be down 10% by 2020 and energy efficiency increased at different levels.
Final energy consumption in the transport sector is to be reduced by around 40% until 2050
compared to 2005 (BMWi, 2010a). On the other hand, Germany currently imports 88% of its gas
needs and 98% of its oil needs, making it heavily dependent on energy imports. In addition, due
to the Fukushima disaster, Germany decided to abandon nuclear energy altogether by 2022. This
faster withdrawal from nuclear power requires the swifter implementation of the far-reaching
measures defined in the Energy Concept to restructure the energy system. Above all, energy
policy needs to address climate change because energy consumption in Germany accounts for
some 80% of greenhouse gas emissions. For the restructuring of the energy system to be
successful, necessary action must be taken in all the key areas, including measures to accelerate
grid expansion, boost energy efficiency or promote investment in energy research. The rapid shift
towards new energy technology requires huge investments. In this context least cost analysis
becomes an important tool to identify the effective policies.

2
This paper study will focus on the renewable energy technology implementation in German
electricity system up to 2050 and develop different scenarios to investigate the cost effective
energy mix scenario. The main objective or research questions of the study are as follows:
- How many megawatts of power plants are built?
- How many megawatt-hours of each power plant will be dispatched in each time slice of
each year?
- What future configuration of the energy technologies will yield the lowest overall cost to
German electricity system?
- What is the potential of abatement of carbon emissions?
2. Methodology
2.1. LEAP Model
The software used to model the scenarios is the Long-range Energy Alternatives Planning
(LEAP), developed by Charlie Heaps at the Stockholm Environment Institute (Heaps, 2012). LEAP has become widely adopted due to its high level of integration of all aspects of scenarios and its minimal data input requirements to achieve results. In this work, the new capability of the LEAP software tool has been used to calculate the optimal
expansion and dispatch of power plants for German electric system, where optimal is defined as
the energy system with the lowest total net present value of the social costs of the system over the
entire period of calculation (from the base year through to the end year). A least cost system can
optionally be calculated subject to a number of user specified constraints including maximum
annual levels of emissions for any given pollutant (CO2, Sox, Nox, PM10, etc.) and minimum or
maximum capacities for certain plant types. For example, an expansion pathway for an energy
system could be calculated that met a minimum renewable portfolio standard whilst also staying
within a target for reducing greenhouse gas emission.
The optimality of a given pathway may be very sensitive to input assumptions such as future
capital costs, future efficiency assumptions, future fuel costs or future GHG mitigation targets. A
system that is optimal for a country under one set of assumptions may be far from optimal under
another set of assumptions. Generally, the goal in energy planning is not to identify a single
optimal solution, but rather to identify robust energy policies that work well under a range of
plausible input assumptions. We use LEAP’s model scenario capabilities to calculate explore
different optimal solutions under different sets of input assumptions. LEAP includes the
capability to automatically calculate least cost capacity expansion and dispatch of supply-side
Transformation modules.
Various studies have been conducted in recent few years using the LEAP model to forecast
energy supply and demand by developing different scenarios. Shin et al.(2005) analyze the
impacts of landfill gas electricity generation on the energy market, the cost of generating
electricity and greenhouse gases emissions in Korea using LEAP and the associated ‘Technology
and Environmental Database’. Song et al. (2007) studies environmental and economic assessment
according to the energy policy change for climate change agreement and increase of CO2
mitigation technology is accomplished, on the bases of operating data for the CO2 chemical
absorption pilot plant that is installed in the Seoul coal steam power plant in South Korea. Yophy
(2011) provide an overview of energy supply and demand in Taiwan, and a summary of the
historical evolution and current status of its energy policies, as background to a description of the
3
preparation and application of a Long-range Energy Alternatives Planning System (LEAP) model
of Taiwan’s energy sector. The Taiwan LEAP model is used to compare future energy demand
and supply patterns, as well as greenhouse gas emissions, for several alternative scenarios of
energy policy and energy sector evolution. McPherson and Karney (2014) analysed quantitatively
the current status of power generation in Panama and explores various potential future scenarios
and the associated impacts on the system marginal cost, global warming potential and resource
diversity index. To this end, this study applies the scenario development methodology developed
by Schwartz in the context of the energy-economic modeling platform LEAP. Tao et al. (2011)
conducted research on the prospects of low-carbon economic development in China based on
LEAP model. Pan et al. (2013) studied and analysed the emission reduction of chief air pollutants
and greenhouse gases in Beijing based on LEAP model. Kale and Pohekar (2014) developed
electricity demand and supply scenarios for Maharastra (India) up to 2030 by LEAP model. Kim
et al. (2011) developed various scenarios by considering nuclear energy and renewables and
account for the GHG emissions. Takase and Suzuki (2011) studies different alternative options
for nuclear energy and reduction of GHG emissions. Amirnekooei et al. (2012) carried out
demand and supply side analysis by developing different scenarios. Argiro et al. (2012)
developed electricity generation scenarios and its impact on environmental emission in Greece by
using LEAP energy model.
2.2. Scenario Development
To compare with alternative scenarios results, first of all a reference scenario has been developed
by considering the status quo i.e. the demand–supply and policies remains the same as in present
situation. This is based on the direct extrapolation of historical trends and future projections.
All scenarios have been analysed with a discount rate and interest rate of 5%.
The alternative scenarios are:
Mitigation scenario: Each scenario consists of one policy or technology lever explored via multiple sub-scenarios. The
sub-scenarios investigate the effect of varying degrees of success of implementation of the levers.
Energy Efficiency (ENE):
With future technological advances and increased public awareness, the amount of energy used to
complete a given task is expected to decrease. The rate of increase in energy efficiency will be
artificially accelerated through the implementation of policy, such as the EU-led phase-out of
incandescent light bulbs, started in 2009. Energy efficiency will be modelled as a percentage
decrease in demand by the year 2050.Table 1 shows the assumed efficiency in demand sectors.
Table1. Energy Efficiency sub-scenarios
LEAP code Description Data Source
ENE5% 5% increase in energy efficiency Own calculations
ENE10% 10% increase in energy efficiency Own calculations
ENE20% 20% increase in energy efficiency Own calculations
ENE30% 30% increase in energy efficiency Own calculations
Electromobility (EV):

4
The German government already have detailed plans for electromobility in Germany. They
foresee an increase in EV ownership to 1 million by 2020, and 6 million by 2030 (UBA, 2013),
with NPE (2011) projecting 13.2 million by 2050. Although projections are already ambitious, a
scenario for further increases has also been considered. This would see all rail journeys and the
majority of other vehicles become electric by 2050 and is based on the calculations given by
McKinsey & Co. (2010) for meeting GHG reduction targets as shown in Table 2.
Table 2. Electromobility sub-scenarios
LEAP code Description Data Source
EVNPE Government plans for electromobility (NPE, 2011), (UBA, 2013)
EV100% Maximum exploitation of electromobility (McKinsey & Co, 2010)
Nuclear Energy (NUC):
Although the government decided to decommission all nuclear power stations by 2022, it is not
entirely impossible that in future this policy is revised, however unlikely. If CCS failed to
become viable for example, nuclear power may become necessary to meet carbon reduction
targets. Table 3 shows the assumed scenarios for nuclear energy.
Table 3. Nuclear Energy sub-scenarios
LEAP code Description Data Source
NUC2010 Nuclear capacity maintained at 2010 levels Own calculations
NUCFF Nuclear capacity increased to completely
replace fossil fuels by 2050
Own calculations
Solar Energy (SOL)
The solar industry in Germany in reasonably mature, however this is largely due to strong
financial support in the form of a FIT. In this scenario (Table 4) the effect of cutting the FIT is
considered.
Table 4. Solar Energy sub-scenarios
LEAP code Description Data Source
SOLFIT Solar FIT is cut to zero by 2020
Imports (IMP):
We have already seen that Germany is currently very dependent on fossil fuel imports for its
energy supply. These scenarios consider the effects of reducing imports to zero by given dates as
shown in Table 5.
Table5. Imports sub-scenarios
5
LEAP code Description Data Source
IMP2030 Imports reach zero by 2030 Own Calculations
IMP2050 Imports reach zero by 2050 Own Calculations
Carbon Capture & Storage (CCS)
Meeting targets for emissions reductions is very dependent on CCS technology becoming
commercially viable. This is currently expected by approximately 2020, but the effects of
pushing this back by ten years have also been analysed (Table 6).
Table 6. Carbon Capture & Storage sub-scenarios
LEAP code Description Data Source
CCS2020 CCS becomes commercially viable by 2020 Own Calculations
CCS2030 CCS becomes commercially viable by 2030 Own Calculations
Transmission Losses (TRA)
By transmitting power over long distances via sub-terranean High-Voltage DC (HVDC) cables
rather than overhead AC lines, the transmission losses can be reduced by 30-40% (Breuer et al.,
2010). This will be modelled as a reduction in transmission losses from 5.5- 3.5%.
3. Results and Discussion
3.1 Reference Scenario
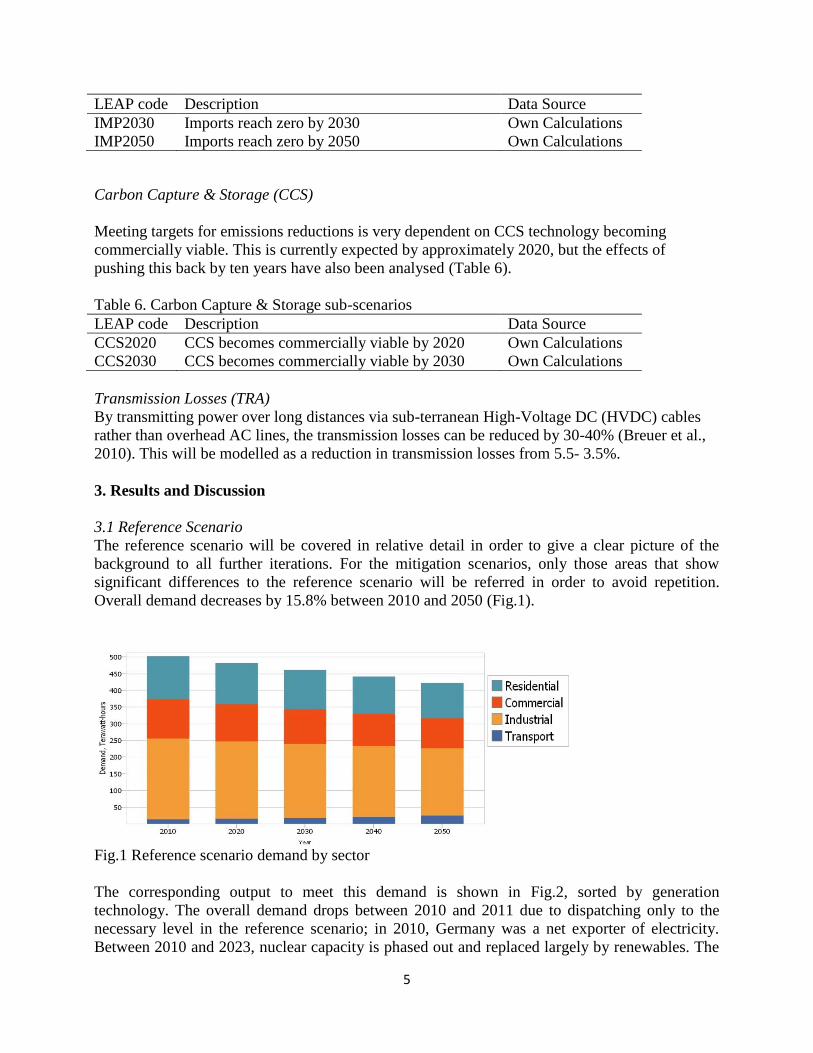
The reference scenario will be covered in relative detail in order to give a clear picture of the
background to all further iterations. For the mitigation scenarios, only those areas that show
significant differences to the reference scenario will be referred in order to avoid repetition. Overall demand decreases by 15.8% between 2010 and 2050 (Fig.1).
Fig.1 Reference scenario demand by sector
The corresponding output to meet this demand is shown in Fig.2, sorted by generation
technology. The overall demand drops between 2010 and 2011 due to dispatching only to the
necessary level in the reference scenario; in 2010, Germany was a net exporter of electricity.
Between 2010 and 2023, nuclear capacity is phased out and replaced largely by renewables. The

6
increases in output from onshore wind and solar would require peak capacity increases of 54.9
GW and 57.7 GW respectively by 2023, however in the reference scenario, capacities remain
constant. This capacity increase would have associated capital costs of nearly €250 bn.
Fig. 2 Reference scenario electrical output by technology
The environmental impact (expressed as 100-year GWP, CO2) of the system initially decreases as
the demand decreases and the transition to renewables is made (Fig. 3), however it increases
again as nuclear is phased out and replaced with fossil fuels before decreasing again with
demand.
Fig. 3 Reference scenario 100-year GWP
3.2 Energy Efficiency
Although in the reference scenario reductions in demand are already observed, these are due to
natural replacement of old equipment. In the energy efficiency scenario, this rate is greatly
increased via incentives. The additional reduction in electricity generation is proportional to the
increase in efficiency. The 30% efficiency increase reduces a huge amount of electricity
requirement as shown in Fig.4. The 20%, 10% and 5% increase of efficiency also shows
corresponding reduction in electricity generation

7
Fig. 4 Energy Efficiency Scenario reduction in electricity generation
3.3. Electromobility
In the reference case, the electrical demand decreases by 16.1%. Increased electromobility leads
to increased electrical demand. Demand in both scenarios is approximately 2% higher than the
reference case in 2030, and by 2050 the NPE case is 17.5% higher and the maximum case is 30%
higher than the reference. In the NPE scenario there is a net decrease of 1.4% compared to 2010,
but for the higher penetration scenario the net change is an increase of 9.1%.
When considered in isolation, the electromobility policies appear detrimental to meeting
emissions targets due to the rise in electrical demand they cause. However, when one considers
that this additional demand is replacing very inefficient and heavily polluting internal combustion
engines, the overall emissions will actually be reduced significantly as shown in Fig.5. This is a
disadvantage of considering only electrical demand, rather than demand for all fuel types.
Fig. 5 Effect of increased electromobility on electrical demand
3.4 Nuclear Energy
Maintaining nuclear capacity at 2010 levels shows a reduction in GWP of approximately 16% by
2050 (Fig.6). By replacing all fossil fuels with nuclear capacity, the GWP is reduced almost to
zero by 2050.

8
Fig. 6 GWP for nuclear scenarios vs. the reference scenario
3.5 Solar Energy
A spike in investment in solar capacity could harm other emerging technologies as investment is
diverted in the short term. Longer-term, a poorly managed cut in FIT could jeopardise the
longevity of the solar power industry. Fortunately, Germany appears to be phasing out their solar
FIT very gradually, rather than making drastic cuts as seen in the UK.
3.6 Imports
Cutting fuel imports shows an increase in renewable energy output, but also in generation from
lignite power plants (Fig.7). Germany has abundant lignite resources and so lignite is not affected
by import curbs.
Fig.7 Effect of import curbs on fuel mix by 2050
3.7 CCS Technology
Over the 40-year period, the GWP of the system is decreased dramatically by introducing CCS,
with the reduction proportional to the year in which it is phased in (Fig. ). The overall GWP is
more than halved if CCS is introduced by 2020. Within the input data, the efficiencies for some
CCS technologies are listed as higher than their respective existing technologies when in fact

9
CCS is likely to reduce the efficiency of the power plant by two percentage points or more. This
is due to the lower efficiency of the older existing power plants, which bring down the average
efficiency for existing technologies.
Fig. 8 Effect of CCS on GWP
3.8 Transmission Losses
Reducing the transmission losses by 2% allows a 2% drop in output, and corresponding
reductions in installed capacity, costs, and GWP.
3.9 Carbon Price
Artificially inflating the carbon price has a negligible effect on the overall system costs, however
it has a major effect on the GWP of the system (Fig. 9) as lower carbon technologies become
more economically competitive.
Fluctuations in carbon price have little effect on overall system costs, therefore there is little
argument against implementing a carbon price floor to incentivise a transition to renewables. The
benefits of a higher carbon price have been seen in many of the other scenarios covered in this
report.

10
Fig. 9 Effect of carbon price on GWP
4. Conclusion
Energy security and environmental emissions are two major problems the world worried about
nowadays. In this paper the case of Germany is taken into account and developed various
scenarios by using LEAP energy model. The German electricity sector today passing through a
transition period to switch to cleaner production as well as time bound nuclear phase-out.
Keeping in view we have develop the scenarios to secure supply of electricity and reduce the
carbon emissions at affordable prices. In reference scenario most of the electricity comes from
the fossil fueled power plants. In case of energy efficiency scenario the electricity generation
reduced drastically in 30% energy efficiency. The decreases in output are entirely in line with the
increase in efficiency, i.e. for a 30% increase in efficiency, there is a corresponding 30% decrease
in outputs. However, by prioritising the retention of renewables, for a 30% increase in efficiency
the GWP of the system is reduced by 84% compared to the reference case. The cost of
constructing new CCS-fitted power stations and retrofitting the technology to existing plants
requires large capital investment. The competitive position of CCS technology is entirely
dependent on the carbon price. From an economic perspective, many of the proposals suggested
are not competitive with the current fuel mix, however many become competitive if the carbon
price is increased. The price required ranges from €10.5/t to €64.5/t, depending on the scenario.
References
Amirnekooei, K., Ardehali, M., Sadri, A., 2012. Integrated resource planning for Iran:
development of reference energy system, forecast and long-term energy–environment plan.
Energy 46, 374-385.
Argiro, R., Christopher, K., Iyer, W., 2012. Modeling the Greek energy system: scenarios of clean
energy use and their implication. Energy Policy 50,711-722.
BMWi, 2010. EnergyConcept 2010.Federal Ministry for economic affairs, Nature Conservation
Building energy BMUB-Federal Ministry for the Environment, and Nuclear Safety.
BMWi, 2010a. Germany’s new energy policy: Heading towards 2050 with secure, affordable and
environmentally sound energy. Federal Ministry of Economics and Technology, Berlin
(Available at: http://www.bmwi.de/EN/Service/publications.html?).
Breuer,W., Rentzmann., Uecker, K., 2010. Highly efficient solutions for smart and bulk power
transmission of Green Technology. 21st World Energy Congress, Montreal, Siemens AG.
11
Heaps, C.G., 2012. LEAP: The Long-range Energy Alternatives Planning System, 2008.
Stockholm Environment Institute (Available at:
http://www.energycommunity.org/default.asp? Action =41).
Kale, R.V., Pohekar, S.D., 2014. Electricity and supply scenarios for Maharastra (India) for 2030:
An application of long range energy alternative planning. Energy Policy 72, 1-13.
Kim, H., Shin, E., Chung, W., 2011. Energy demand and supply, energy policies and energy
security in the Republic of Korea. Energy Policy 39, 6882-6897.
McKinsey & Co. ,2010. Beitrag der Elektromobilität zu langfristigen Klimaschutzzielen und
Implikationen für die Automobilindustrie. Berlin: BMU.
McPherson, M., Karney, B., 2014. Long-term scenario alternatives and their implications: LEAP
model application of Panama’s electricity sector. Energy Policy 68, 146-157.
NPE, 2011. Zweiter Bericht der Nationalen Plattform Elektromobilität. Nationale Plattform
Elektromobilität. Berlin: BMVBS.
Pan, J.P., Xie, Y.B., Li, W., 2013. An analysis of emission reduction of chief air pollutants and
greenhouse gases in Beijing based on the LEAP model. Procedia Environmental Sciences
18,347-352.
Shin, H.C, Park, J.W., Kim, H.S., Shin, E.S., 2005. Environmental and economic assessment of
landfill gas electricity generation in Korea using LEAP model. Energy Policy 33, 1261-1270.
Song, H., Lee, S., Maken, S., Ahn, S., Park, J., Min, B., Koh, W., 2007. Environmental and
economic assessment of the chemical absorption process in Korea using the LEAP model.
Energy Policy 35, 5109-5116.
Takase, K., Suzuki, T., 2011. The Japanese energy sector: current situation and future paths.
Energy Policy 39, 6731-6744.
Tao, Z., Zhao, L., Changxin, Z., 2011. Research on the prospects of low-carbon economic
development in China based on LEAP model. Energy Procedia 5, 695-699.
UBA, 2013. Treibhausgasneutrales Deutschland im Jahr 2050. Bonn: Umweltbundesamt.
Yophy, H., Jeffrey, Y., Chieh-Yu, P., The long-term forecast of Taiwan’s energy supply and
demand: LEAP model application. Energy Policy 39, 6790-6803.
Top Related