![Qinglin Yang Qingkui Zeng arXiv:2110.11646v1 [cs.CR] 22 ...](https://static.fdocuments.in/doc/165x107/620f3df0c5dea80dec76c63b/qinglin-yang-qingkui-zeng-arxiv211011646v1-cscr-22-.jpg)


Languages
Pages
Legal


Leaf Litter Decomposition at Missouri Ozarks Managed Landscape
Qinglin Li
The Objectives:
• 1. Determine mixed leaf litter decomposition rates.
• 2. Quantify mixed leaf litter chemistry composition during decay.
• 3. Identify forest management effects on leaf litter decomposition and leaf litter chemistry.

Introduction
• Decomposition of litter (including root litter) contributes about 70% to the total annual carbon flux, which is estimated at 68 Pg C yr-1. (Raich & Schlesinger, 1992)
• Litter decomposition rates are controlled by environmental conditions, the chemical composition of the litter, and by soil organisms.

Conceptual model for describing plant litter decomposition
Model for chemical changes and rate-regulating factors during decomposition (Berg & Matzner, 1997)
Asymptotic model for estimating limit values for plant litter decomposition. Limited value indicated by the dashed line (Berg and Ekbohm, 1991)
Quantitative models
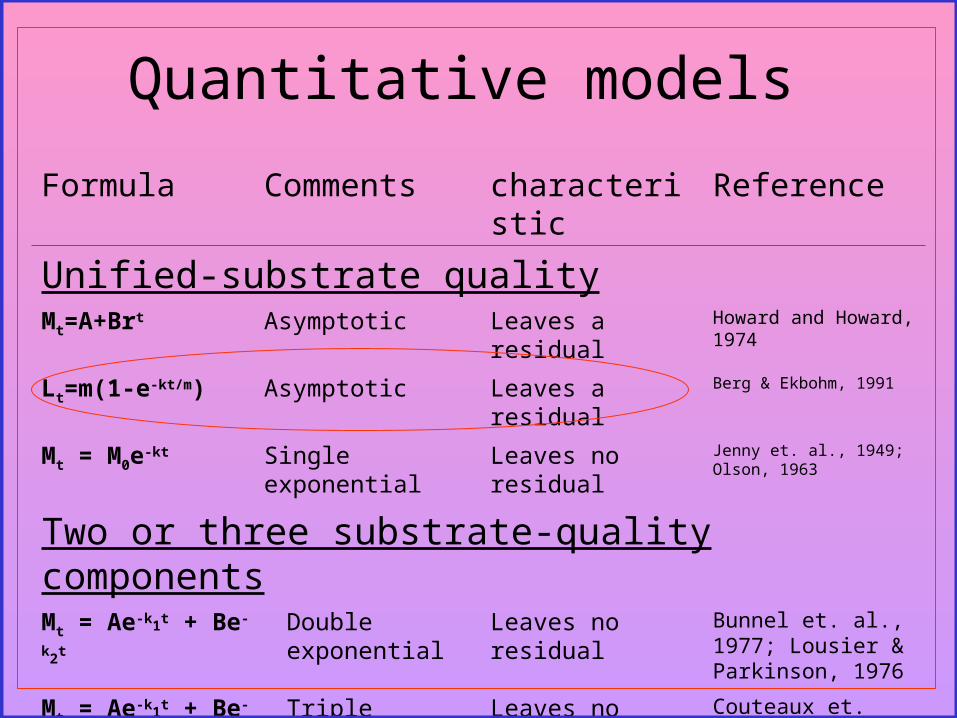
Formula Comments characteristic Reference
Unified-substrate qualityMt=A+Brt Asymptotic Leaves a residual Howard and Howard,
1974
Lt=m(1-e-kt/m) Asymptotic Leaves a residual Berg & Ekbohm, 1991
Mt = M0e-kt Single exponential Leaves no residual Jenny et. al., 1949; Olson, 1963
Two or three substrate-quality componentsMt = Ae-k1t + Be-k2t Double
exponentialLeaves no residual Bunnel et. al., 1977;
Lousier & Parkinson, 1976
Mt = Ae-k1t + Be-k2t + Ce-k3t
Triple exponential Leaves no residual Couteaux et. al., 1998
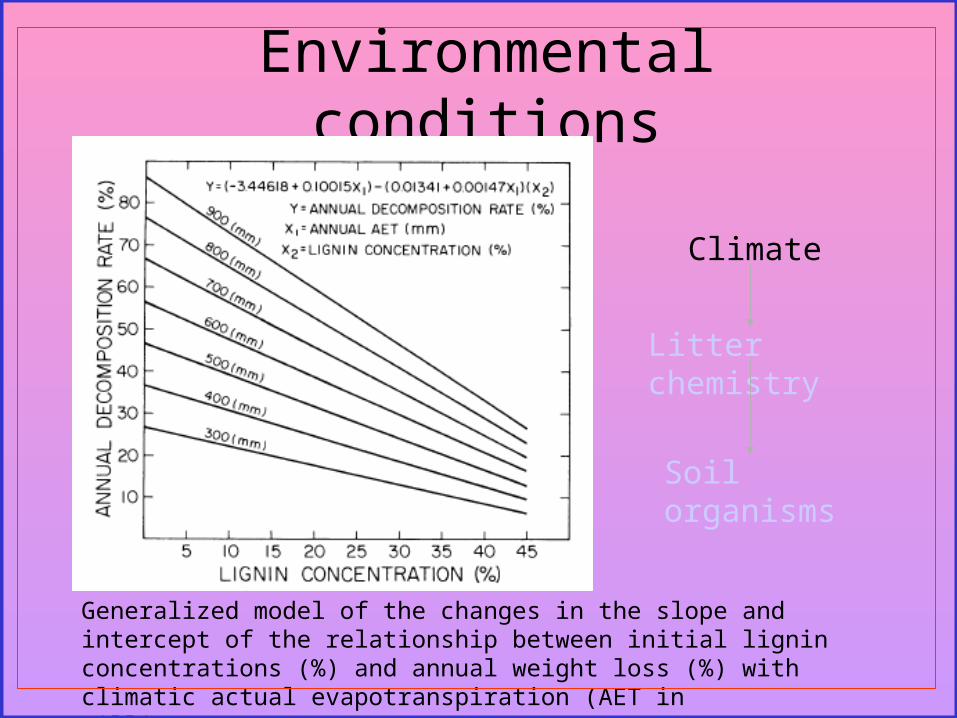
Environmental conditions
Climate
Litter chemistry
Soil organisms
Generalized model of the changes in the slope and intercept of the relationship between initial lignin concentrations (%) and annual weight loss (%) with climatic actual evapotranspiration (AET in millimeters, Meentemeyer, 1978)

Litter Quality
Climate
Litter chemistry
Soil organisms

Enzyme activities
Climate
Litter chemistry
Soil organisms

Manipulation (anthropogenic) effects
• 1. N fertilization
Linear relationships between N and lignin concentrations in needle litter from N-fertilized Scots Pine plot. (Black dots 50 kg N ha-1 yr-1, triangle 100 kg N ha-1 yr-1 , square 150 kg N ha-1 yr-1 , circle – control., Berg and Tamm 1991).

2. Elevated CO2 effects
C:N ratios of mixed-species litter collected from the field open-top chamber experiment from the sandstone (filled circles) and serpentine (open circles) grassland, solid line show 1:1 relationship. (Dukes & Hungate 2002)

3. Forest Management
• I. Clear cuttings had more rapid rate of mass loss. (Gadgil & Gadgil, 1978; Prescott et. al. 2000).
• II. Clear-felling had a large decrease in mass loss relative to a control stand, with first year mass loss of 25 and 37%, respectively. (Cortina & Valejo, 1994)
• III. Whole tree harvesting had the highest mass loss rates comparing to stem and whole tree harvesting with forest floor removal. (Kranabetter & Chapman, 1999)

The hypothesis:
Leaf litter decomposition rate was regulated by species composition, leaf litter chemistry, management activities, or any of the combinations.
Study Site & Design
Even age
Uneven age
No Harvest
Manipulation Type
10 Kilometers
Shannon
Reynolds
Carter
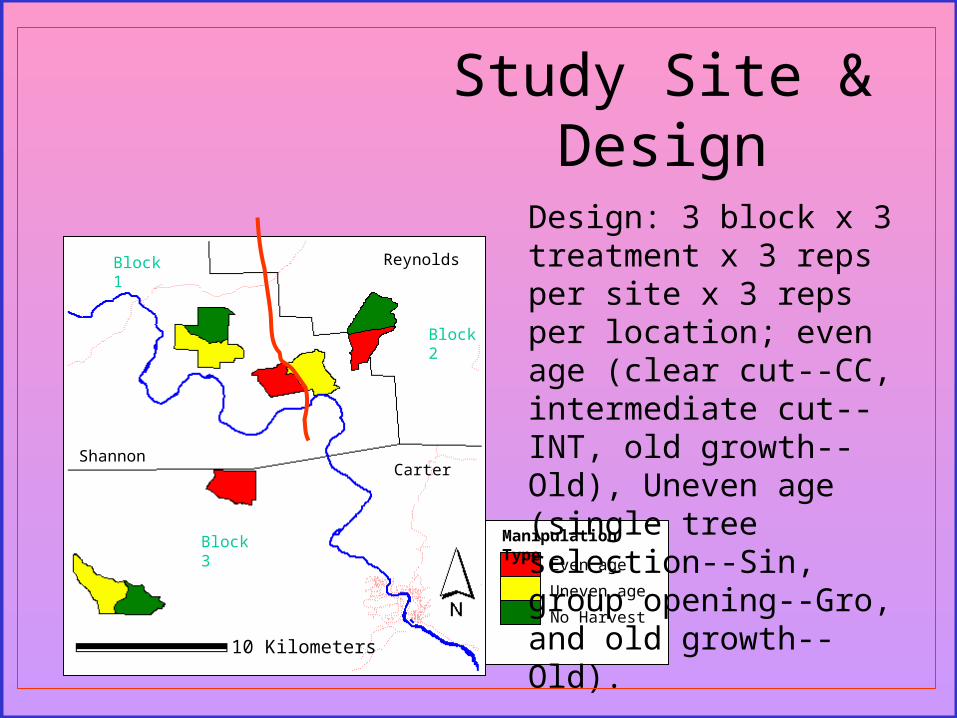
Design: 3 block x 3 treatment x 3 reps per site x 3 reps per location; even age (clear cut--CC, intermediate cut--INT, old growth--Old), Uneven age (single tree selection--Sin, group opening--Gro, and old growth--Old).
Block 1
Block 2
Block 3

Forest type
Forest types at selected decomposition plot– Oak -- O – Oak hickory -- OH– Oak Pine -- OP

Methodology
• 1. Litter bag
– Litter bags were made by vinyl standard mesh.
– 5 gram of mixed litter was put in each bag.
– Litter bags were retrieved after 3, 6, 9, 19 months of field incubation

• 2. Litter chemistry– Soluble in water and ethanol.– Cellulose removed by sulfuric acid digestion– Lignin was acid insoluble.
• 3. Analysis– Repeated analysis– Simple ANOVA
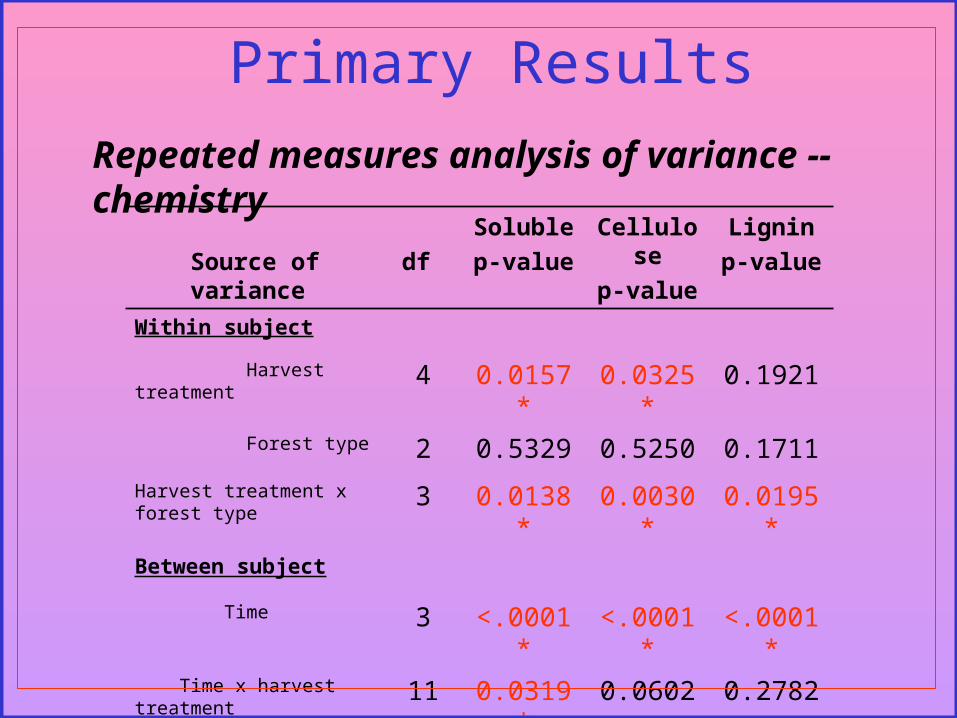
Primary Results
Source of variance df
Soluble
p-value
Cellulose
p-value
Lignin
p-value
Within subject Harvest treatment 4 0.0157* 0.0325* 0.1921 Forest type 2 0.5329 0.5250 0.1711
Harvest treatment x forest type 3 0.0138* 0.0030* 0.0195*
Between subject
Time 3 <.0001* <.0001* <.0001*
Time x harvest treatment 11 0.0319* 0.0602 0.2782
Time x Forest type 6 0.1892 0.2351 0.1358
Repeated measures analysis of variance -- chemistry

Source of variance
df
Soluble
p-value
Cellulose
p-value
Lignin
p-value
Site 1 0.7416 0.2547 0.3313
Harvest treatment 3 0.7344 0.7014 0.9357
Forest type 2 0.2746 0.5173 0.6242
Harvest treatment x forest type 4 0.6475 0.3355 0.3142
Analysis of variance of initial chemistry

Single exponential fit of percentage accumulated mass loss by treatments
Group: y = 89.102e-0.0483x
R2 = 0.945
CC: y = 96.659e-0.0298x
R2 = 0.9481
Single: y = 97.259e-0.0339x
R2 = 0.9908INT: y = 94.693e-0.0252x
R2 = 0.9097
Old: y = 97.536e-0.0374x
R2 = 0.9951
20
40
60
80
100
0 5 10 15 20
months
% a
ccum
ulat
ed m
ass
loss
CC Group INT Old Single

Percentage accumulated mass loss by treatments
0
20
40
60
80
CC INT Group Single Old
Treatments
% a
ccu
mu
late
d m
ass
loss
a
b bc bc c

Percentage accumulated mass loss by forest types
60
65
70
75
80
O OH OP
Forest Type
% a
ccu
mu
late
d m
ass
loss
a
b
c

Treatments effects on chemical components
0
50
100
150
200
250
300
350
CC INT Gro Sin Old
Treatment
rem
aini
ng m
ass
chem
ical
com
pone
nts
(mg) Soluble
Cellulose
Lignin

Conclusion
• Forest management activities had significant effects on leaf litter decomposition. They also had significant effects on leaf litter chemistry during decay courses.
• Initial litter chemistry was not affected by any of the factors in this experiments
• Forest type (species composition) had significant effects on mass losses, however, it had no effects on leaf litter chemistry.
Acknowledgement:• This project was founded by MDC MOFEP research
• Daryl Moorhead provided all the facilities for chemical analysis.
• Field and lab assistants for litter bag retrievals and chemical analysis.
• John Rademacker & Mark Johanson for litter bag preparing and burying
• All LEES lab members assistants

Thank you!
Questions?

• 60 species was cited by Berg for litter decomposition research
• John Blair: measurement of N & C flux in single species litterbags may not reflect actual N & C flux in the field. The differences in N flux between single- and mixed species litterbags can affect ecosystem-level N flux at study site. Single litter bag underestimate of N release about 64% by 75 day, overestimate of N accumulation 183% in litter by 375 day.
Top Related