


Languages
Pages
Legal


Presented by:
The Society for the Protection of NH Forests and
The Nature Conservancy, New Hampshire Chapter
Land Conservation in New Hampshire:
A Snapshot of Progress & Opportunities
A Report Prepared for the New Hampshire
Legislature’s SB 388 Study Committee
October 2014

This report was prepared for the Society for the Protection of New Hampshire Forests and The Nature
Conservancy. Data development and analysis was provided by Dan Sundquist of GreenFire GIS and by
Pete Steckler of TNC. Questions should be directed to Will Abbott at the Forest Society
([email protected]) or Jim O’Brien at The Nature Conservancy ([email protected]).


1
Executive Summary
This report is offered by the Society for the Protection of NH Forests and The Nature Conservancy with
the purpose of providing baseline information on the status of conserved lands in New Hampshire for
consideration by the SB 388 Study Committee. In addition to surveying the current state of conserved
lands, the report provides a summary of strengths and weaknesses of the present portfolio of conserved
lands and identifies opportunities and priorities for future land conservation.
Data Sources
The primary baseline for assessing conserved lands in New Hampshire is the Conservation and Public
Lands database which was updated and released publically by GRANIT in July 2014. Additional
significant tracts of conserved land not yet incorporated into the GRANIT database were added by TNC
staff to increase accuracy.
Many other GIS-based natural and cultural resource databases were assembled to determine the extent
and distribution of resource protection statewide. The majority of these are found in the GRANIT data
library, but others have been made available from various federal and state agencies responsible for
such data.
Highlights of Findings
The most current data from GRANIT for conservation and public lands shows that 1,850,584 acres of
land are in public ownership or permanently protected. This amounts to 32.3% of the state’s land area,
and a gain of nearly 590,000 acres of protected land since 1996 when records were first systematically
developed. Agencies and organizations responsible for conservation land in N.H. are grouped into five
broad categories, as follows:
There are twelve types of protected land in N.H., some of which are not permanent or otherwise
outdated (leases, deed restrictions, reverter clauses). More than 98% of conservation land is in fee
ownership or conservation easement. See table on the next page with a breakdown of area and
percentage of total for each type of protected land.
Agency Type Number of Tracts Total Acres
Percent of
Total
Federal 715 822,252 44.4%
State 1,376 456,840 24.7%
Municipal 4,343 180,280 9.7%
Quasi-Public 230 10,320 0.6%
Private 3,560 380,892 20.6%
10,224 1,850,584

2
The extent and distribution of conserved land in New Hampshire has been grouped into four
classifications: by county, by DRED tourism region, by regional planning commission service area, and by
ecoregion. The data highlight that the extent and distribution of conservation lands varies significantly
across the state. Northern municipalities and counties along with areas of high elevation tend to have
much higher rates of land conservation. More southerly regions and lower elevation zones have far less
area in conservation ownership, even though those areas often have tremendous natural resource
significance and are typically at greater risk of conversion.
See the following four tables on this page and the next for a summary of conserved land in each
category.
County
Total Area
(Ac)
Water Area
(Ac)
Total Land
Area (Ac)
Land
Protected
Percent of
County
Land Area
Belknap 300,787 43,724 257,063 34,425 13.4%
Carroll 635,821 38,837 596,983 252,992 42.4%
Cheshire 466,516 14,160 452,355 101,402 22.4%
Coos 1,171,973 21,919 1,150,054 622,443 54.1%
Grafton 1,119,748 24,653 1,095,095 450,598 41.1%
Hillsborough 571,154 11,600 559,554 105,951 18.9%
Merrimack 611,150 15,802 595,348 114,337 19.2%
Rockingham 465,173 19,558 445,614 73,585 16.5%
Strafford 244,862 10,321 234,541 39,030 16.6%
Sullivan 353,363 9,602 343,761 55,822 16.2%
5,940,547 210,177 5,730,370 1,850,584 32.3%

3
NHDRED Region Total Land Area
Percent State
Land Area
Protected Land
Area
Percent
Protected
Dartmouth/Lake Sunapee 881,552 15.4% 161,427 18.3%
Great North Woods 863,964 15.1% 420,817 48.7%
Lakes Region 953,562 16.6% 172,651 18.1%
Merrimack Valley 824,161 14.4% 132,515 16.1%
Monadnock Region 730,746 12.8% 168,131 23.0%
Seacoast 273,991 4.8% 52,121 19.0%
White Mountains 1,202,395 21.0% 742,923 61.8%
5,730,370 1,850,584 32.3%
Regional Planning Commission Total Land Area
Total Acres
Protected
Percent of
State Land
Area
Percent of
All
Protected
Land
North Country Council 2,152,679 1,174,724 54.6% 63.5%
Lakes Region Planning Commission 733,131 147,536 20.1% 8.0%
Upper Valley/Lake Sunapee Regional Planning Commission 657,012 118,929 18.1% 6.4%
Southwest Region Planning Commission 631,754 147,414 23.3% 8.0%
Central NH Regional Planning Commission 479,675 93,902 19.6% 5.1%
Southern NH Planning Commission 307,057 49,003 16.0% 2.6%
Nashua Regional Planning Commission 202,094 26,084 12.9% 1.4%
Rockingham Planning Commission 236,417 36,462 15.4% 2.0%
Strafford Regional Planning Commission 330,552 56,530 17.1% 3.1%
5,730,370 1,850,584
NH Ecoregion Sub-Sections
Total Land
Area
Percent of
State Land
Area
Area
Protected
Percent
Protected
Coastal Lowland 183,092 3.1% 36,475 19.9%
Coastal Plain 982,145 16.5% 146,647 14.9%
Connecticut Lakes 372,314 6.3% 230,207 61.8%
Mahoosuc-Rangely Lakes 617,709 10.4% 228,335 37.0%
NH Uplands 1,646,741 27.7% 354,497 21.5%
Northern Connecticut River Valley 258,886 4.4% 33,910 13.1%
Sebago-Ossipee Hills and Plain 896,344 15.1% 137,889 15.4%
Vermont Uplands 190,461 3.2% 30,165 15.8%
White Mountains 792,841 13.3% 652,460 82.3%

4
Protection of Drinking Water Supplies
In 2012, there were 1,151 community wells serving approximately 608,000 residents; another 511 wells
serve businesses, schools, industry, and a host of transient uses such a restaurants, motels, ski areas,
and campgrounds, with a population served of more than 128,000. This means that about 46% of the
state’s population and most of our places of employment rely on public drinking water supplies.
Four resource features have been evaluated in order to determine the protection status of drinking
water supplies in New Hampshire: sand and gravel aquifers (groundwater), remaining future site for
potential groundwater wells, and both wellhead and source water protection areas defined by NHDES.
Aquifers
Sand and gravel aquifers are the primary source of community drinking water for one-third of municipal
and other public water supplies (wells) in New Hampshire, and serve more than 600,000 persons
statewide, or about 46% of the state’s population. Aquifers cover about 14% of the state’s land area,
and are slightly more than 14% protected. At present, nearly 24 % of aquifer land area is currently
developed with roads and urban/suburban land uses.
Favorable Sites for Future Wells
NHDES has mapped the areas of the state’s aquifers which are not impacted by potential contamination
sources, and are the most likely locations for future municipal water supply wells pending more detailed
hydro-geological investigation. These areas represent less than 1% of the state’s land area, and are
currently only 23% protected.
Wellhead Protection Areas
NHDES has delineated hydrological-based protection areas around community wells and surface water
intakes at drinking water reservoirs. These protective areas represent somewhat more than 5% of the
state’s land area, and are less than 16% protected at present. A little more than 19% of these areas are
already developed with roads and other land uses, and no regulatory mandate exists to require further
protection of these lands.
Source Water Protection Areas
NHDES had also delineated certain watersheds deemed critical to maintaining water quality within
community drinking water supplies. These areas amount to somewhat more than 7% of the state land
area, and are slightly more than 45% protected. Although most of these watersheds are rural, about
7% of their area is currently developed.
Farmland Protection The status of farmland protection in New Hampshire can be estimated using two sources of data: highly
productive agricultural soils and currently active farming based on land cover information for cropland
and hay/pasture utilization.

5
Highly Productive Agricultural Soils
The most productive soils in N.H. are defined by NRCS soils mapping in two classes: prime agricultural
soils and soils of statewide importance. Together, the two soils groups total somewhat less than 7% of
the state land area, and are approximately 12% protected. These soils are about 20% developed
currently, and unavailable for farming.
Actively Farmed Land
Land cover data released in 2010 shows two levels of farming: actively cropped land and orchards, and
open land maintained for hay or pasture. Statewide, these two classes represent about 4% of the
state’s land area, of which nearly 13% is protected.
Forest Protection
Forest Blocks
Intact forest blocks greater than 500 acres in size, regardless of land ownership pattern, provide
important water quality, wildlife habitat, as well as remote recreational opportunities, as well as the
threshold for long-term economic forest management. Forest blocks greater than 500 acres account
for two-thirds of the land cover in New Hampshire, and are currently about 40% conserved, although
blocks in the lower size ranges close to urban centers are less well conserved (18% for blocks 500 to
5,000 acres).
Forest blocks greater than 5,000 acres represent an important threshold of ecological significance in
term of maintaining the structure, function, and processes of local and regional ecosystems. These
blocks total more than 2.3 million acres statewide, and are currently about 57% protected. Blocks in
the range of 5,000 to 10,000 acres, which are important for ecological linkages among larger blocks, are
only about 27% protected.
Prime Forest Soils
The most productive forest soils in New Hampshire total more than 3.8 million acres, or about 60% of
the state’s land area, and are currently about 22% protected. However, the group of forest soils that
represents the state’s best high-volume white pine growing land totals only about 11% of the these
soils, and is only 14% protected at present.
Habitat Protection
The status of fish and wildlife habitat conservation has been assessed in several ways:
• Protection of broad eco-regions;
• NH Wildlife Action Plan data on habitat quality (terrestrial and aquatic habitats combined;
• NH Wildlife Action Plan data on aquatic habitat quality;
• NH Wildlife Action Plan habitat types;
• Rare species occurrences
• Extent of wetlands protection;
• Extent of floodplain protection; and,
• Habitat conserved by elevation.

6
Habitat Quality
The NH Wildlife Action Plan (NHWAP) data update released in 2010 ranks habitat quality statewide in
three tiers: Tier 1 is best in state, Tier 2 is best in ecoregion, and Tier 3 are supporting landscapes that
work as buffers to protect the integrity of the higher two tiers. Taken together, the three tiers total to
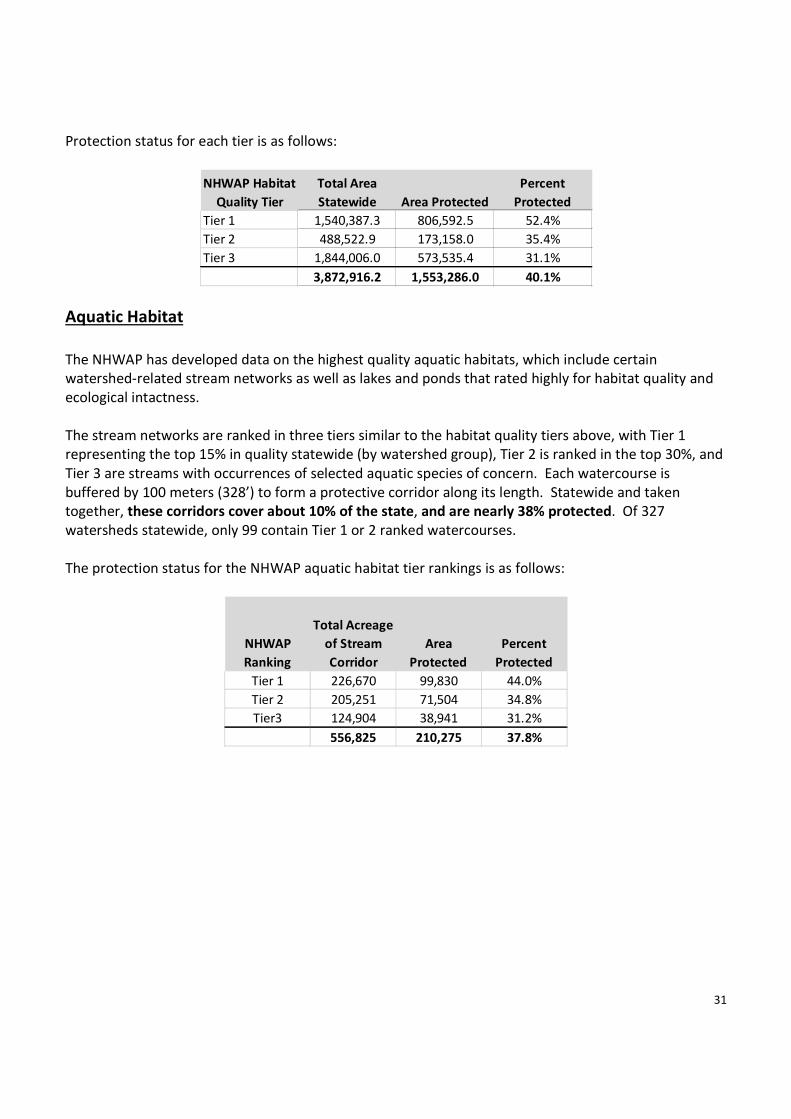
slightly more than 2/3 of the state land area. Protection status for each tier is as follows:
Aquatic Habitat
The NHWAP has developed data on the highest quality aquatic habitats, which include certain
watershed-related stream networks as well as lakes and ponds that rated highly for habitat quality and
ecological intactness.
The stream networks are ranked in three tiers similar to the habitat quality tiers above, with Tier 1
representing the top 15% in quality statewide (by watershed group), Tier 2 is ranked in the top 30%, and
Tier 3 are streams with occurrences of selected aquatic species of concern. Each watercourse is
buffered by 100 meters (328’) to form a protective corridor along its length. Statewide and taken
together, these corridors cover about 10% of the state, and are nearly 38% protected. Of 327
watersheds statewide, only 99 contain Tier 1 or 2 ranked watercourses.
The protection status for the NHWAP aquatic habitat tier rankings is as follows:
Rare Species Occurrences
The New Hampshire Natural Heritage Bureau maintains a database documenting over 4,000 distinct
occurrences of rare plant and animal species in New Hampshire. Approximately 37% of these
occurrences are found on permanently protected or public land, while 63% remain unprotected.
Top-Ranked Lakes and Ponds
As part of the NHWAP, lakes and ponds in New Hampshire were evaluated for habitat quality and
ecological integrity. The top 10 water bodies in each of ten watershed groups were selected based on
size, depth, and acidity, and a 200’ protective buffer was established around each water body which is
critical to maintaining water and habitat quality. Land cover data was used to estimate the amount of
land associated with the buffer that is already developed.
NHWAP Habitat
Quality Tier
Total Area
Statewide Area Protected
Percent
Protected
Tier 1 1,540,387.3 806,592.5 52.4%
Tier 2 488,522.9 173,158.0 35.4%
Tier 3 1,844,006.0 573,535.4 31.1%
3,872,916.2 1,553,286.0 40.1%
NHWAP
Ranking
Total Acreage
of Stream
Corridor
Area
Protected
Percent
Protected
Tier 1 226,670 99,830 44.0%
Tier 2 205,251 71,504 34.8%
Tier3 124,904 38,941 31.2%
556,825 210,275 37.8%

7
The total area of the top-ranked lake/pond buffer is about 14,770 acres statewide, of which 28% is
currently protected. About 28% of the buffer is estimated to be developed by roads and other land
uses.
Wetlands
Wetlands data has been generated using NRCS data for hydric soils – poorly and very poorly drained
soils which are typically classified as wetlands, and include forested as well as marsh, bog, and shrubby
types of wetlands, in combination with National Wetlands Inventory on wetlands types in the state.
The total area of hydric soils and mapped wetlands in N.H. is nearly 772,000 acres, or about 13.5% of the
state land area. These wetlands are currently slightly under 25% protected.
Floodplains and Riparian Areas
Floodplains: Just over 6% of the state is mapped as 100-year floodplain by FEMA (note: FEMA mapping
is not available for Belknap county), of which 21% is protected or in public ownership. Of the 79% of
unprotected floodplains, 7% is developed and 6% is agricultural.
Riparian areas: Riparian areas cover approximately 28% of the state’s land area (not including open
water), of which 30% is protected or in public ownership. Of the 70% unprotected riparian areas, 12%
is developed and 5% is agricultural.
Elevation
Elevation and terrain have a distinct correlation to various habitat types. The elevation classes in the
table below are based on studies of ecological systems in New Hampshire by The Nature Conservancy.
Higher elevations are typically better conserved, largely due to the historic emphasis on conserving
peaks and scenic places in more mountainous areas. The lower terrain (20’ – 800’) in southeastern N.H.
is the least protected, and the most densely populated and developed region of the state.
Recreation Opportunities
Public Access
Coding with regard to public access on conserved lands in the GRANIT conservation and public lands
database indicates that slightly more than 70% of conserved tracts allow public access for hunting,
fishing, and recreation. Another 2% restrict public access in some manner or at certain times. However,
almost 26% of records in the database represent public access as unknown, so it is probable that many
more tracts allow public access.
Elevation Range Total Acres
Percent of Total
State Area
Acres
Protected
Percent
Elevation
Zone
Protected
0 - 20' 17,603 0.3% 4,378 24.9%
20 - 800' 2,146,872 37.5% 316,308 14.7%
800 - 1700' 2,444,925 42.7% 657,532 26.9%
1700 - 2500' 799,604 14.0% 560,780 70.1%
2500 - 3600' 278,237 4.9% 256,293 92.1%
> 3600' 42,709 0.7% 42,671 99.9%

8
The distribution of conserved land has been analyzed for convenient accessibility from the most
populated municipalities in New Hampshire (communities of 10,000 or greater). Nearly 20% of all
conserved land is within a 20-minute drive time of 718,000 persons, or about 54% of the state’s
population. Of communities greater than 20,000 persons (38% of the state’s population), about 10%
of conserved land is closely located.
Regional Recreation Trails
Current data on local and regional recreation trails (hiking, biking, etc.) has mapped nearly 2,700 miles of
trails statewide, of which about 82% lie on conserved land. Rail trails along abandoned railroad rights-
of-way amount to about 443 miles of long-distance recreation opportunity, but are only 30%
protected. Privately maintained long-distance hiking trails (Monadnock-Sunapee Greenway, Sunapee-
Ragged-Kearsarge Greenway, and the Monadnock-Metacomet Trail) total about 150 miles, and are 52%
protected at present.

9
Introduction
Study Purpose
An analysis of the status of conserved lands in New Hampshire has been conducted jointly by the Society
for the Protection of NH Forests and The Nature Conservancy with the purpose of providing baseline
information for consideration by the SB 388 Study Committee.
The primary focus of this analysis is keyed to the following paragraphs of the enabling legislation:
“I. Survey the current composition of conservation lands in New Hampshire including, but not limited to,
the number of acres in conservation, how these lands are distributed geographically, the purposes for
which land is being protected, and what entities hold conservation lands.
VI. Identify strengths and weaknesses of New Hampshire’s current portfolio of public and private
conservation lands, and study whether the state’s approach to land conservation is appropriate to meet
future challenges including, but not limited to, securing current and future drinking water supplies,
maintaining a land base for farming and forestry, protecting fish and wildlife habitat, and providing
outdoor recreation opportunities.” [Emphasis added.]
Each of the topical areas cited in the paragraphs above involves a range of natural resource features
which are addressed below and in the main body of the report.
Report Organization
This report is divided into six major sections, as follows:
Section 1: Overview of Conserved Lands in New Hampshire
Section 2: Protection of Drinking Water Supplies
Section 3: Farmland Protection
Section 4: Forest Protection
Section 5: Habitat Protection
Section 6: Recreation Opportunities
Each section contains several topical areas that are discussed in some detail, and is accompanied by
statistical tables and statewide maps for each resource feature.
Several appendices are also attached to this report in order to provide more detailed information on
certain topical areas, as follows:
• Appendix A includes a map of the state with the names of all municipalities and unincorporated
places in addition to a list by county for geographic reference.
• Appendix B lists the land area, area of conserved land, and percent of land area protected for all
municipalities and unincorporated places.

10
• Appendix C shows a map of the NH Wildlife Action Plan “top 10” lakes and ponds for eleven
watersheds across the state.
Data Sources
The primary baseline data for assessing conserved lands in New Hampshire is the Conservation and
Public Land database which was updated and released publically by GRANIT in July 2014. Additional
significant tracts of conserved land not yet incorporated into the GRANIT database were added by TNC
staff to increase accuracy.
Many other GIS-based natural and cultural resource databases were assembled to determine the extent
and distribution of resource protection statewide. The majority of these are found in the GRANIT data
library, but others have been made available from various federal and state agencies responsible for
such data.
Several natural resource features evaluated in this report have been analyzed to assess the current level
of development associated with those resources. Examples include drinking water protection areas,
aquifers, floodplains, agricultural soils, and so forth. The data utilized is the 2011 NOAA National Land
Cover Dataset, which utilizes satellite imagery and advanced GIS processing to identify various types of
natural and developed land cover. In this study, four land cover types are grouped into “developed
lands”: low, medium, and high intensity development, and developed open space. Many major roads
and highways are included in these land cover types, but smaller local roads typically do not appear. The
resolution of this data is about 1/5 acre, and the overall accuracy assessment is 85%. Therefore, the
land cover data can be considered somewhat coarse, but it also represents the best available data for
the analyses conducted in this study.
11
Section 1: Overview of Conserved Lands in NH
Conserved v. Protected
While the terms “conserved” and “protected” are used inter-changeably in this report, it should be
noted that not all tracts of land found in the NH GRANIT1 conservation and public lands database are
permanently protected by legal means. “Permanently protected” is understood to mean that no
development can take place on the land; however, various uses of the land, including timber harvest and
agricultural uses, are typically allowed except on tracts that are ecologically significant.
Slightly more than 4% of land that is considered to be conserved has no legal protection, but is subject
to mandates to manage for natural land cover; this land includes large tracts such as the Second College
Grant in the North Country (26,770 acres owned by Dartmouth College), and many UNH properties.
Another 1% of land included in the GRANIT database is comprised of town parks and other unprotected
land that are presently more than 50% utilized in non-natural land cover, or may be in the future.
Finally, the status of legal, permanent protection for about 5% of the land considered conserved is
unknown, pending further information gathering.
Therefore, readers should understand that about 90% to 95% of the land GRANIT conservation and
public land database is permanently protected, pending revisions to the database. Data presented in
this report utilize all tracts of land currently mapped and included in the GRANIT database, regardless
of legal protection.
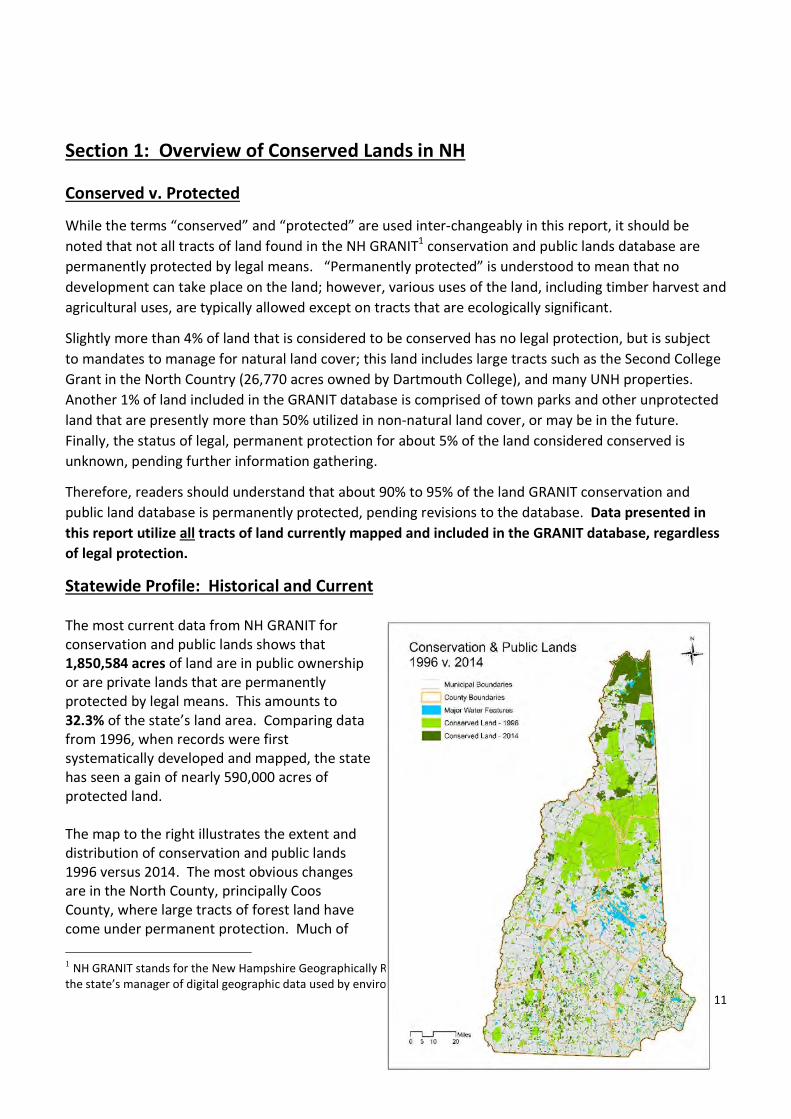
Statewide Profile: Historical and Current
The most current data from NH GRANIT for
conservation and public lands shows that
1,850,584 acres of land are in public ownership
or are private lands that are permanently
protected by legal means. This amounts to
32.3% of the state’s land area. Comparing data
from 1996, when records were first
systematically developed and mapped, the state
has seen a gain of nearly 590,000 acres of
protected land.
The map to the right illustrates the extent and
distribution of conservation and public lands
1996 versus 2014. The most obvious changes
are in the North County, principally Coos
County, where large tracts of forest land have
come under permanent protection. Much of
1 NH GRANIT stands for the New Hampshire Geographically Referenced Analysis and Information Transfer System which is
the state’s manager of digital geographic data used by environmental planners and decision-makers.

12
this land continues to be managed for economic forestry and recreation uses; certain areas are currently
ecological preserves. Other large tracts have been added south of the White Mountain National Forest,
especially in the Lakes Region and centering on the Ossipee Range.
Further south, the pattern of newly protected lands is more diverse and fine-grained, with significant
gains in southwestern New Hampshire and the Seacoast Region. Much of this change has been due to
the efforts of local, regional, and statewide land trusts, often working in partnership.
Role of Various Agencies and Organizations
More than 350 separate agencies and organizations are listed as Primary Protecting Agencies2 in the
GRANIT database, and these are grouped into five broad categories, as follows:
As can be seen in the table, nearly 70% of all conserved and public land is under federal and state
jurisdiction; another 10% is held by municipalities. Private conservation land (land trusts, NGO, etc.)
account for a little more than 20% statewide. Quasi-Public entities, such as water and school districts,
make up the remainder. The detailed map on the next page shows the five agency types statewide.
2 A Primary Protecting Agency is defined as the agency or organization holding the first level of legal protection on conserved
land. Secondary, or “back up” protection interests are also typical on tracts of conservation and public land.
Agency Type Number of Tracts Total Acres
Percent of
Total
Federal 715 822,252 44.4%
State 1,376 456,840 24.7%
Municipal 4,343 180,280 9.7%
Quasi-Public 230 10,320 0.6%
Private 3,560 380,892 20.6%
10,224 1,850,584

13
14
There are twelve types of protected land in N.H., some of which are not permanent or otherwise
outdated (leases, deed restrictions, reverter clauses). More than 98% of conservation land is in fee
ownership or conservation easement.
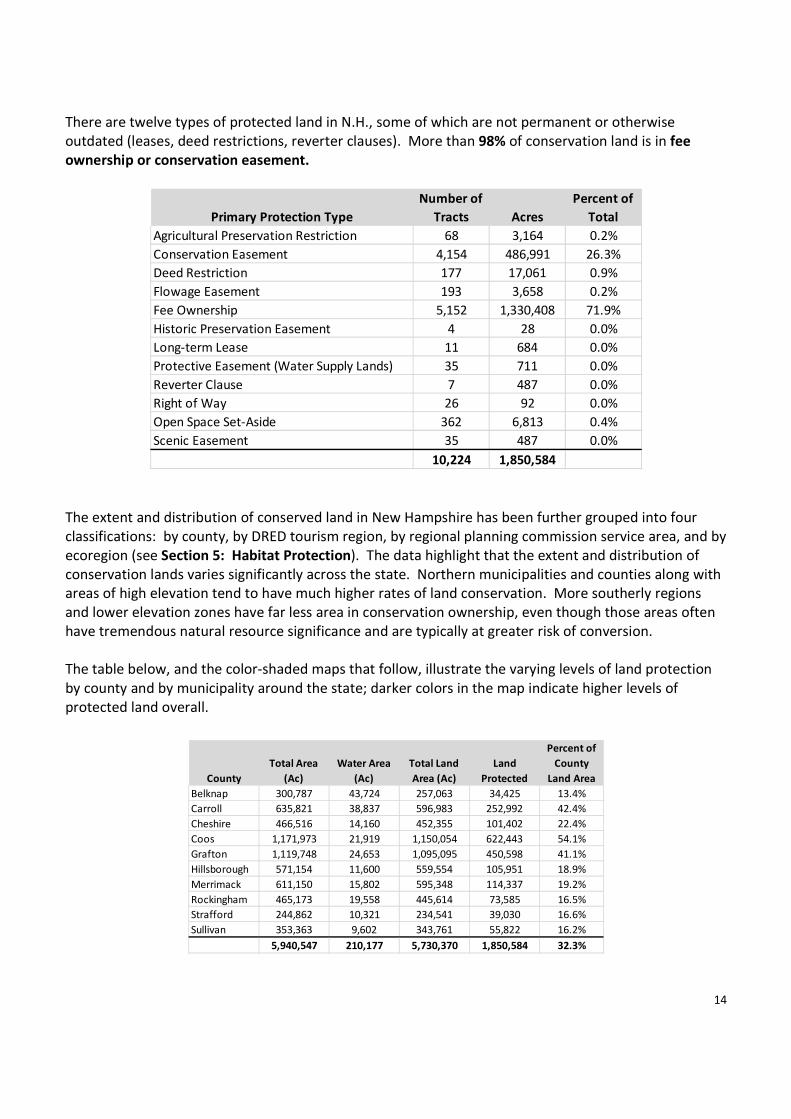
The extent and distribution of conserved land in New Hampshire has been further grouped into four
classifications: by county, by DRED tourism region, by regional planning commission service area, and by
ecoregion (see Section 5: Habitat Protection). The data highlight that the extent and distribution of
conservation lands varies significantly across the state. Northern municipalities and counties along with
areas of high elevation tend to have much higher rates of land conservation. More southerly regions
and lower elevation zones have far less area in conservation ownership, even though those areas often
have tremendous natural resource significance and are typically at greater risk of conversion.
The table below, and the color-shaded maps that follow, illustrate the varying levels of land protection
by county and by municipality around the state; darker colors in the map indicate higher levels of
protected land overall.
Primary Protection Type
Number of
Tracts Acres
Percent of
Total
Agricultural Preservation Restriction 68 3,164 0.2%
Conservation Easement 4,154 486,991 26.3%
Deed Restriction 177 17,061 0.9%
Flowage Easement 193 3,658 0.2%
Fee Ownership 5,152 1,330,408 71.9%
Historic Preservation Easement 4 28 0.0%
Long-term Lease 11 684 0.0%
Protective Easement (Water Supply Lands) 35 711 0.0%
Reverter Clause 7 487 0.0%
Right of Way 26 92 0.0%
Open Space Set-Aside 362 6,813 0.4%
Scenic Easement 35 487 0.0%
10,224 1,850,584
County
Total Area
(Ac)
Water Area
(Ac)
Total Land
Area (Ac)
Land
Protected
Percent of
County
Land Area
Belknap 300,787 43,724 257,063 34,425 13.4%
Carroll 635,821 38,837 596,983 252,992 42.4%
Cheshire 466,516 14,160 452,355 101,402 22.4%
Coos 1,171,973 21,919 1,150,054 622,443 54.1%
Grafton 1,119,748 24,653 1,095,095 450,598 41.1%
Hillsborough 571,154 11,600 559,554 105,951 18.9%
Merrimack 611,150 15,802 595,348 114,337 19.2%
Rockingham 465,173 19,558 445,614 73,585 16.5%
Strafford 244,862 10,321 234,541 39,030 16.6%
Sullivan 353,363 9,602 343,761 55,822 16.2%
5,940,547 210,177 5,730,370 1,850,584 32.3%
15
Note how the difference in scale between the two political subdivisions of the state tell a somewhat
different story in geographic patterns. At municipal scale, Coos County shows a great deal of variability
place-to-place; clearly, it is the White Mountain National Forest that is driving the high levels of
conserved land in Coos, Grafton, and Carroll Counties. Southwestern New Hampshire also exhibits a
large, contiguous area of relatively high land protection, as does parts of the Seacoast Region. In
contrast, many individual communities with relatively low levels of conserved land are also apparent
throughout the state.
Appendix B contains an extensive table of all municipalities and unincorporated places in New
Hampshire listing the land area and the extent of conserved land in each place.
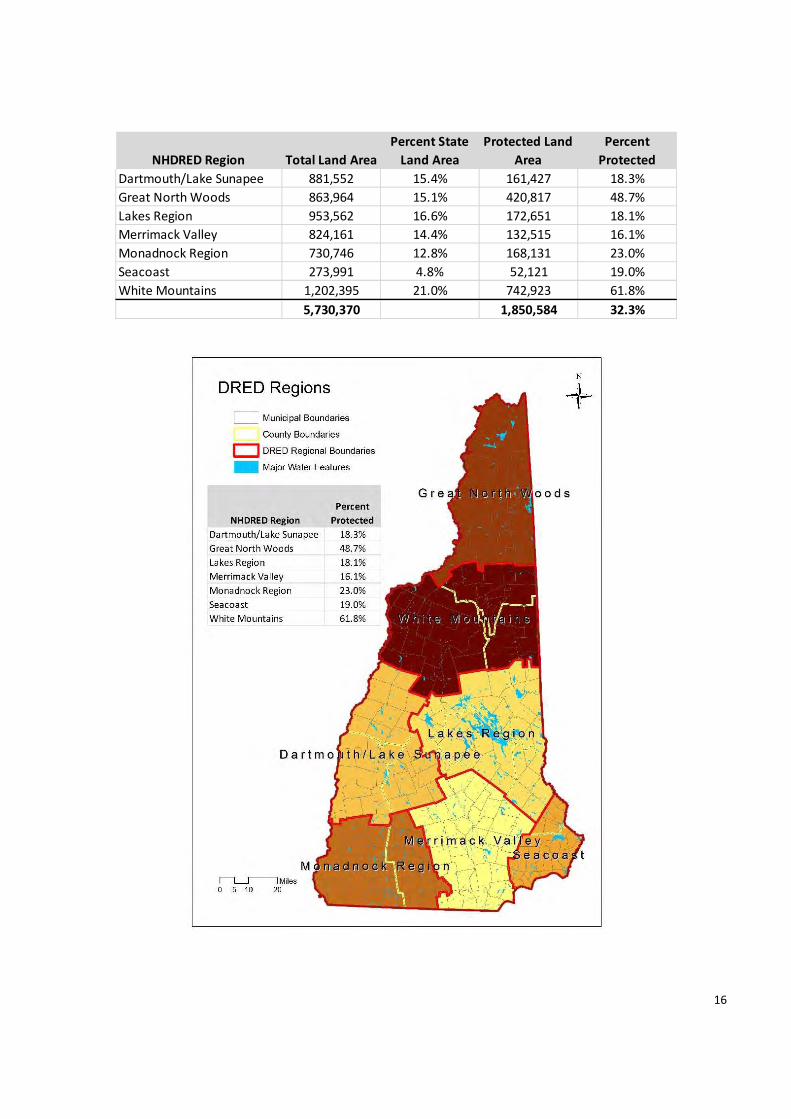
Viewing the data for conserved land by DRED region is one way of looking at the relationship of
protected lands to the economic drivers in each region. The seven DRED regions are delineated for the
most part based on the travel and tourism economy themes and landscapes which vary around the
state. The table below lists each region and the percent of protected land; note that the White
Mountains and the Great North Woods regions have a large share of land in conservation and/or public
status. The Merrimack Valley which is the most highly urbanized has the least land protected.
See also the map that follows for the boundaries of each DRED region and percent protection color-
shaded similar to the county map above.
16
NHDRED Region Total Land Area
Percent State
Land Area
Protected Land
Area
Percent
Protected
Dartmouth/Lake Sunapee 881,552 15.4% 161,427 18.3%
Great North Woods 863,964 15.1% 420,817 48.7%
Lakes Region 953,562 16.6% 172,651 18.1%
Merrimack Valley 824,161 14.4% 132,515 16.1%
Monadnock Region 730,746 12.8% 168,131 23.0%
Seacoast 273,991 4.8% 52,121 19.0%
White Mountains 1,202,395 21.0% 742,923 61.8%
5,730,370 1,850,584 32.3%

17
Section 2: Protection of Drinking Water Supplies
In New Hampshire, we have been blessed with clean water, in large measure due to our extensive
forests, and massive investment in waste water treatment. Clean water and conservation go hand in
hand. Natural lands – our forests and wetlands -- are ideal “pre-treatment plants” that help to ensure
both the quality and the quantity of our drinking water. Conservation of drinking water supplies also
results in protection of other natural resources such as surface waters and wildlife habitat.
Decades ago, at a time when watersheds were only sparsely settled, our major cities and villages created
reservoirs and river intakes to supply their residents with drinking water. Now, with soaring population
growth, our thirst for water has outstripped our clean surface supplies, and we have turned to
groundwater wells. In 2012, there were 1,151 community wells serving approximately 608,000
residents; another 511 wells serve businesses, schools, industry, and a host of transient uses such a
restaurants, motels, ski areas, and campgrounds, with a population served of more than 128,000. This
means that about 46% of the state’s population and most of our places of employment rely on public
drinking water supplies.
The land around our reservoirs and wells is under increasing pressure from development, which
translates into increased risk of contamination. New water sources are also becoming scarce in many
communities, with some towns having to look in neighboring towns for water supplies. The latest
scientific information tells us that the extent of our drinking water supply lands is very limited. Yet,
these scarce lands are being transformed by development, thereby increasing not only the threat of
contamination and the consequent expense of water treatment, but also the difficulty of locating new
water supplies to meet growing demand.
For the purposes of this report, critical water supply lands are defined as high-yield aquifer formations
and the drinking water protection areas delineated by the NH DES Water Division around wellheads and
surface water intakes on rivers and reservoirs that supply public drinking water (wellhead protection
areas and source water protection areas). In many areas of the state, these two features overlay one
another since the volumes of water required in municipal systems are available only in the porous layers
of our extensive sand and gravel aquifers laid down during the retreat the last glacial age. Additional
data is provided below on the remaining future sites for potential groundwater wells on aquifers, as
determined and mapped by NHDES.
Note that bedrock sources of municipal water supply have not proved to be abundant in New Hampshire
due to its geology, so the sand and gravel aquifers represent our best existing and future source of
drinking water.3
3 USGS Assessment of Groundwater Resources in the Seacoast Region of N.H., SIR 2008-5222.
18
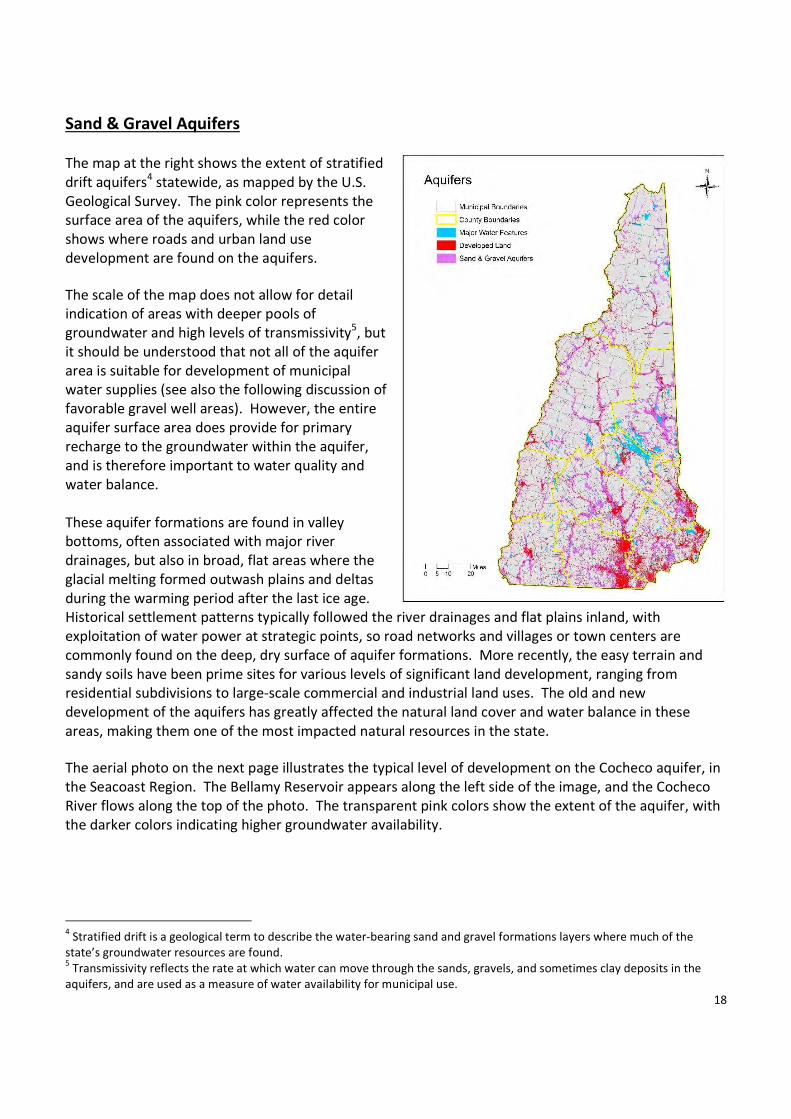
Sand & Gravel Aquifers
The map at the right shows the extent of stratified
drift aquifers4 statewide, as mapped by the U.S.
Geological Survey. The pink color represents the
surface area of the aquifers, while the red color
shows where roads and urban land use
development are found on the aquifers.
The scale of the map does not allow for detail
indication of areas with deeper pools of
groundwater and high levels of transmissivity5, but
it should be understood that not all of the aquifer
area is suitable for development of municipal
water supplies (see also the following discussion of
favorable gravel well areas). However, the entire
aquifer surface area does provide for primary
recharge to the groundwater within the aquifer,
and is therefore important to water quality and
water balance.
These aquifer formations are found in valley
bottoms, often associated with major river
drainages, but also in broad, flat areas where the
glacial melting formed outwash plains and deltas
during the warming period after the last ice age.
Historical settlement patterns typically followed the river drainages and flat plains inland, with
exploitation of water power at strategic points, so road networks and villages or town centers are
commonly found on the deep, dry surface of aquifer formations. More recently, the easy terrain and
sandy soils have been prime sites for various levels of significant land development, ranging from
residential subdivisions to large-scale commercial and industrial land uses. The old and new
development of the aquifers has greatly affected the natural land cover and water balance in these
areas, making them one of the most impacted natural resources in the state.
The aerial photo on the next page illustrates the typical level of development on the Cocheco aquifer, in
the Seacoast Region. The Bellamy Reservoir appears along the left side of the image, and the Cocheco
River flows along the top of the photo. The transparent pink colors show the extent of the aquifer, with
the darker colors indicating higher groundwater availability.
4 Stratified drift is a geological term to describe the water-bearing sand and gravel formations layers where much of the
state’s groundwater resources are found. 5 Transmissivity reflects the rate at which water can move through the sands, gravels, and sometimes clay deposits in the
aquifers, and are used as a measure of water availability for municipal use.

19
Note the modern residential development on
the aquifer, with scattered housing along cul-
de-sacs and loop roads. In the lower right
quarter of the photo are what appear to be
commercial or industrial developments along
an access road. Perhaps most notable, just
west of the pond, is a large gravel extraction
operation, which is typical on aquifer
formations due to the sand and gravel
resources found in glacial outwash features
such as eskers and kames.
Sand and gravel aquifers are the primary source
of community drinking water for one-third of
municipal and other public water supplies
(wells) in New Hampshire, and serve more than
600,000 persons statewide, or about 46% of the state’s population. Aquifers cover about 14% of the
state’s land area, and are slightly more than 14% protected. At present, nearly 24 % of aquifer land
area is currently developed with roads and urban/suburban land uses.
Favorable Sites for Future Wells
NHDES has mapped the areas of the state’s
aquifers which are not currently impacted by
potential contamination sources (developed areas,
roads, known and potential contamination sites,
wetlands, etc.), and are the most likely locations
for future municipal water supply wells pending
more detailed, site-scale hydro-geological
investigation.
Based on the transmissivity of the aquifers (see
discussion above), two thresholds of water
withdrawl rates are included in the NHDES
analysis: 75 gallons per minute (gpm) and 150
gallons per minute (gpm). 75 gpm is considered
the minimum practical water supply for municipal
purposes. The map at the left shows the location
of aquifer areas with potential for 75 gpm wells.

20
These favorable gravel well areas (75 gpm yield)
represent only about 6% of the total sand and gravel
aquifer area statewide, and are less than 1% of the
state’s land area, and are currently only 23% protected.
The complexity and limited areas suitable for future
water well development is shown in the non-specific
inset map to the right. Note that the areas suitable for
150 gpm (red) are much smaller than the areas
delineated for 75 gpm. This is due to the differences in
estimated transmissivity in the sand and gravel aquifers,
as well as the depth of the groundwater “pool” within
the aquifer. The 150 gpm yield areas – the state’s best
potential for future municipal wells and water supplies --
amount to less than 0.5% of the state’s land area, less
than 3% of the total aquifer area statewide, and are
only 25% protected at present.
Wellhead Protection Areas
NHDES has delineated hydrological-based
protection areas around community wells and
surface water intakes at drinking water reservoirs.
These wellhead protection areas (WHPA) are
defined as the surface area from which water is
likely to flow toward and reach a water supply
source (well or intake), and include only community
and non-community, non-transient public water
systems6. The program focus is on land and water
management, not prohibition of land use activities. Water suppliers are required to maintain a small
sanitary radius around the well or intake in a
natural condition, to mitigate against
contamination close to the water source.
6 A public water supply is defined as "a piped water system having its own source of supply, serving 15 or more services or 25
or more people, for 60 or more days per year." Public water systems can be divided into three categories:
� Community public water systems which serve at least 15 service connections used by year-round residents or
regularly serve at least 25 year-round residents;
� Non-transient, Non-community systems which are not community systems and which serve the same 25 people or
more over 6 months per year, i.e., schools, hospitals, businesses; and,
� Transient public water systems serving 25 people or more per day for 60 days or more per year, but not the entire
year, i.e., hotels, restaurants, campgrounds.

21
However, they are not required to maintain the WHPA area in a natural condition. This is
understandable since, for example, a 4,000 foot radius WHPA encompasses nearly 1,200 acres of land
area, and with multiple ownerships and varying land uses, it is unlikely that the entire area can be
permanently protected.
Due to the proximity of wellheads and intakes to one another in
more built-up areas, the WHPA often overlap considerably,
sometimes creating added, complex land management challenges
for water supply owner/operators. However, many WHPA still
have large, undeveloped areas in natural land cover, and to the
extent possible, these areas should be a conservation priority in
the interest of clean water in the future. To illustrate this, the
inset to the left shows a non-specific area of aquifer (pink colors)
with water supply wells (red dots), WHPA (blue outlines), and
protected land (green).
These protective areas represent somewhat more than 5% of the
state’s land area, and are less than 16% protected at present. A little more than 19% of these areas are
already developed with roads and other land uses, and no regulatory mandate exists to require further
protection of these lands.
Source Water Protection Areas
NHDES had also delineated certain watersheds deemed critical to maintaining water quality within
community drinking water supplies. Termed source water protection areas (SWPA), these water supply
protection areas are similar to WHPA but are watershed-based. Since some of the SWPA watersheds
are very large, only the smaller watersheds that typically relate to one or more community water supply
features have been analyzed in this report. The map above shows these SWPA in orange.
These areas amount to somewhat more than 7% of the state land area, and are slightly more than 45%
protected. Although most of these watersheds are rural, about 7% of their area is currently developed.
In total, NHDES data indicate that more than 761,000 persons are served by these SWPA, although this
number includes a share of the population served by wellhead protection areas embedded within the
SWPA (see overlaps of WHPA and SWPA in the map above).
Section 3: Farmland Protection

22
The status of farmland protection in New Hampshire can be estimated using two sources of data: highly
productive agricultural soils and currently active farming based on land cover information for cropland
and hay/pasture utilization. Detailed data on the number of farms, the relative sizes of farms, and their
productivity is found elsewhere in the National Agricultural Statistical Survey (NASS); however, these
data – and the location of farms -- are not available spatially for confidentiality reasons, and cannot be
mapped and analyzed for level of protection.
Highly Productive Agricultural Soils
The most productive soils in N.H. are defined by NRCS soils mapping in two classes: prime agricultural
soils and soils of statewide importance. Together, the two soils groups total somewhat less than 7% of
the state land area, and are approximately 12% protected. These soils are about 20% developed
currently, and unavailable for farming. Note that due to the coarse nature of the land cover data used
in estimating the extent of development, it is probably that the level of conversion of these soils to other
land uses is actually somewhat higher, and it is certainly higher in the southeastern portion of the state
where urbanization has been most intensive.
The National Resources Conservation Service (NRCS) has classified agricultural soils according to criteria
set forth in the Farmland Protection Policy Act of 1981, a program that seeks to minimize the
unnecessary and irreversible conversion of farmland to non-agricultural uses, among other goals. Two
of these soils classifications, taken together, can be viewed as the state’s most productive agricultural
soils. Brief definitions of these two soils classifications7 follow:
• Prime Farmland – The NRCS defines these soils using highly technical physical attributes, but
generally these soils possess the ideal range of moisture capacity, permeability, water table
depth, pH, lack of flooding, and tilth to produce the commonly cultivated crops adapted to New
Hampshire. Cultivation is a key factor in the use of these soils, so row cropping is typical, as with
corn.
• Farmland of Statewide Importance – Land that is not prime, but is considered farmland of
statewide importance for the production of food, deed, fiber, forage and oilseed crops. These
soils have slopes of less than 15%, are not stony, are not wet, generally are deep soils, and are
not excessively drained soils with low water holding capacity. This soil class may be utilized for
row cropping or hay production, depending on site specific conditions.
7 There are two other soils classes: Soils of Local Importance and Unique Farmland that is not discussed here because the
former is so extensive and not of statewide significance to agriculture, and the latter is site scale and is not related to soils
map units but rather the presence of fruit orchards and intensive vegetable production fields.
23
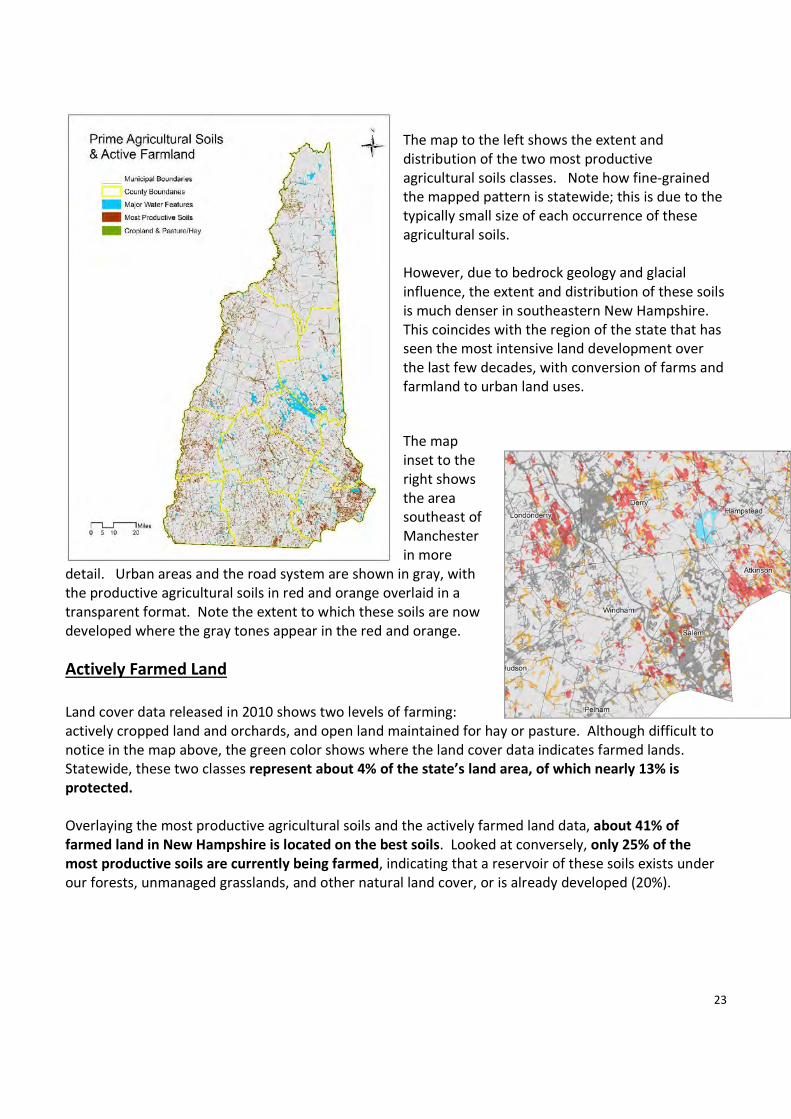
The map to the left shows the extent and
distribution of the two most productive
agricultural soils classes. Note how fine-grained
the mapped pattern is statewide; this is due to the
typically small size of each occurrence of these
agricultural soils.
However, due to bedrock geology and glacial
influence, the extent and distribution of these soils
is much denser in southeastern New Hampshire.
This coincides with the region of the state that has
seen the most intensive land development over
the last few decades, with conversion of farms and
farmland to urban land uses.
The map
inset to the
right shows
the area
southeast of
Manchester
in more
detail. Urban areas and the road system are shown in gray, with
the productive agricultural soils in red and orange overlaid in a
transparent format. Note the extent to which these soils are now
developed where the gray tones appear in the red and orange.
Actively Farmed Land
Land cover data released in 2010 shows two levels of farming:
actively cropped land and orchards, and open land maintained for hay or pasture. Although difficult to
notice in the map above, the green color shows where the land cover data indicates farmed lands.
Statewide, these two classes represent about 4% of the state’s land area, of which nearly 13% is
protected.
Overlaying the most productive agricultural soils and the actively farmed land data, about 41% of
farmed land in New Hampshire is located on the best soils. Looked at conversely, only 25% of the
most productive soils are currently being farmed, indicating that a reservoir of these soils exists under
our forests, unmanaged grasslands, and other natural land cover, or is already developed (20%).

24
Section 4: Forest Protection
Forest Land Area in New Hampshire
The most current report from the USDA Forest Inventory and Analysis for 2012 estimates approximately
4,833,300 acres of forest land in New Hampshire, or about 84.2% of the state’s land area, making New
Hampshire the second most forested state in the nation after Maine. 1960 was the peak in forest area
in the state, with a high of about 87% forest cover. Since then, forest area has declined by nearly 300
square miles due to development --- the conversion of forest land to non-forest uses.
For about the last 150 years, it was agricultural land that was reverting to forest leading to the 1960
high, but in the last two or three decades the trend has been from forests, and farms to a lesser extent,
to a built environment. The ever-expanding infrastructure of residential, commercial, and other land
uses has irretrievably committed that land to those uses. Where farmland may flow to forest, then back
again, the process today is largely a one-way process. All the values associated with the natural
resource base of forests or farmland – timber, food, clean water, wildlife habitat, recreation, and so on –
are lost when this modern conversion takes place.
Forest Blocks
While the estimated amount of forest cover offers an indication of the extent of the resource on the
landscape, the metric is limited in its ability to address issues of fragmentation or how intact the forest
is, and how cohesively the forest is likely to function. . The concept of quantifying and measuring land
cover in contiguous blocks allows one to consider the extent to which forests are capable of carrying out
the functions and processes mentioned in the previous section. In general terms, the more intact
forested land is, the better it is able to provide a resilient resource capable of supporting wildlife habitat,
timber management, water regimes, recreational opportunities, and other amenities.
Forests also provide many invisible amenities, that we are coming to appreciate more and more. Among
these “ecosystem services” provided by forests are abundant clean water and air, the ability to capture
and store atmospheric carbon, and the capacity to mitigate the effects of flooding and other climate-
change related events.
A forest block is an area of intact forest with continuous canopy, without regard to ownership. Thus it
functions as a structural matrix for wildlife habitat, with block-to-block connections being important for
the movement of wildlife. Large forest blocks are also important for the natural management of water
quality and quantity, and as an economic resource to sustainable forestry. Block edges are defined by
highways and local roads, non-forest land uses, and/or by large water feature (rivers and other water
bodies greater than ten acres in size.
Each block includes embedded features of other types of land cover, such as open wetlands, grass, and
shrublands, that while less common on the landscape, serve critical roles in terms of wildlife habitat,
hydrologic cycles, and other important process functions. In this sense, a forest block may also be
thought of as a “natural land cover block” which tends to emphasize the multiple ecosystem functions at
work within what may appear as forested areas from a ground level perspective.
25
A minimum size of 500 acres was selected for this study to favor the mosaic of larger blocks which in
turn reveals forest structure patterns at landscape scale. A block of 500 acres can provide adequate
wildlife habitat for some species, help protect water quality, allow for long-term economic forest
management, and offer a relatively remote recreation experience. Forest blocks greater than 500 acres
account for about two-thirds of the land cover in New Hampshire, and are currently about 42%
conserved, although blocks in the lower size ranges close to urban centers are less well conserved (18%
for blocks 500 to 5,000 acres).
As milestones of greater significance, blocks of 5,000 acres or more represent a minimum for sustainable
economic forest management at regional scale, as well as a minimum size for long-term ecological
significance. These blocks total more than 2.3 million acres statewide, and are currently about 57%
protected. Blocks in the range of 5,000 to 10,000 acres, which are important for ecological linkages
among larger blocks, are only about 28% protected.
Blocks greater than 10,000 acres, and especially greater than 25,000 acres, represent the best scale to
ensure that ecological structure, function, and processes such as soil nutrient accumulation and
formation of old growth forests have sufficient framework to foster true ecological stability over the
long term. Blocks greater than 10,000 acres in size cover 1.9 million acres, and are 63% protected.
The spatial distribution of forest blocks across New Hampshire is shown in the map on the following
page. The gray background shows where the forest cover is fragmented by transportation corridors and
developed land uses, or existing forest blocks are less than 500 acres. The four acreage classes in the
maps are intended to show that while the distribution of smaller blocks in the range of 500 to 1,000
acres is fairly extensive statewide, blocks of 5,000 acres or more are geographically scarce in southern
New Hampshire except for the highlands area that marks the watershed divide of the Connecticut and
Merrimack Rivers, and north of the White Mountain National Forest.

26
Blocks >500 Acres
Blocks >1,000 Acres
Blocks >5,000 Acres
Blocks >10,000 Acres

27
Productive Forest Soils
New Hampshire soils are complex and highly variable due primarily to their glacial origins. The Natural
Resource Conservation Service (NRCS) soil mapping recognizes and inventories these complex patterns
and organized them into a useful and understandable planning tool termed Important Forest Soil
Groups. The objective—a simplified yet accurate tool that will be helpful to natural resource
professionals and landowners.
The most productive forest soils groups are listed and briefly described below. Note that this is a
general overview, and forest species composition vary significantly north to south in New Hampshire.
• Group IA consists of the deeper, loamy, moderately well-drained and well-drained soils.
Generally, these soils are more fertile and have the most favorable soil-moisture conditions.
Successional trends are toward climax stands of shade-tolerant hardwoods such as sugar maple
and beech. The soils in this group are well-suited for growing high-quality hardwood veneer and
sawtimber, especially, sugar maple, white ash, yellow birch, and northern red oak.
• Group IB generally consists of soils that are moderately well-drained and well-drained, sandy or
loamy-over-sandy, and slightly less fertile than those in group 1A. Successional trends are similar
to those in group IA. However, beech is usually more abundant on group IB and is the dominant
species in climax stands. Group IB soils are also well-suited for growing less-nutrient-and-
moisture-demanding hardwoods such as white birch and northern red oak.
• Group IC soils are derived from glacial outwash sand and gravel. The soils are coarse textured
and are somewhat excessively drained to excessively drained and moderately well-drained. Soil
moisture and fertility are adequate for good softwood growth but are limiting for hardwoods.
Successional trends on these soils are toward stands of shade-tolerant softwoods, such as red
spruce and hemlock. These soils are well-suited for high quality softwood sawtimber, especially
white pine in nearly pure stands, and therefore represent the best high-volume white pine soils
in New Hampshire.
Two other, significantly less productive soils groups are also mapped: IIA soils (physical limitations due
to ledge, steep slopes, etc.) and IIB soils (wet). These soils groups are not considered in this analysis.
The table below lists the three most productive forest soils groups with total area statewide. Group 1A
accounts for about 50% of all three soils in terms of overall land area, while Group 1B represents nearly
another 40%. Note that Group 1C – our best high-volume white pine growing soils – are limited to
about 11% of the total area, and are only about 14% protected at present. These soils are typically
found in river valleys along the major highway system, and are easily developed for other land uses.
Group 1C soils are currently more than 27% developed; Groups 1A and 1B are 7% and 8% developed,
respectively.
Forest Soils
Group Total Acres
Percent of
Total
Acres
Protected
Percent
Protected
IA 1,676,050 49.5% 410,187 24.5%
IB 1,331,234 39.3% 283,676 21.3%
IC 377,205 11.1% 52,468 13.9%
3,384,489 746,331 22.1%

28
The map to the right shows the extent and
distribution of the most productive forest soils in
New Hampshire (Groups 1A, 1B, and 1C). Note
that soils mapping is non-existent in large areas
of Grafton and Carroll Counties in the area of the
White Mountain National Forest.
29
Section 5: Habitat Protection
The status of fish and wildlife habitat conservation has been assessed in several ways:
• Protection of broad eco-regions;
• NH Wildlife Action Plan data on habitat quality (terrestrial and aquatic habitats combined;
• NH Wildlife Action Plan data on aquatic habitat quality;
• NH Wildlife Action Plan habitat types;
• Rare species occurrences
• Extent of wetlands protection;
• Extent of floodplain protection; and,
• Habitat conserved by elevation.
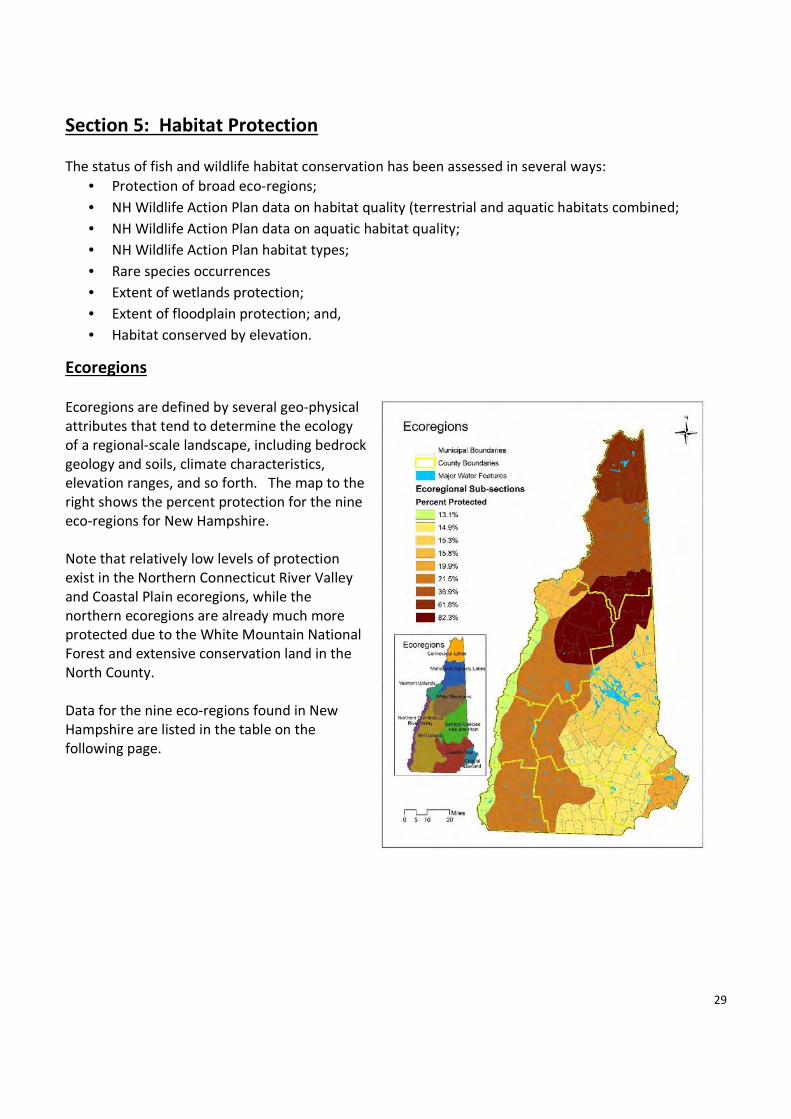
Ecoregions
Ecoregions are defined by several geo-physical
attributes that tend to determine the ecology
of a regional-scale landscape, including bedrock
geology and soils, climate characteristics,
elevation ranges, and so forth. The map to the
right shows the percent protection for the nine
eco-regions for New Hampshire.
Note that relatively low levels of protection
exist in the Northern Connecticut River Valley
and Coastal Plain ecoregions, while the
northern ecoregions are already much more
protected due to the White Mountain National
Forest and extensive conservation land in the
North County.
Data for the nine eco-regions found in New
Hampshire are listed in the table on the
following page.

30
NHWAP Habitat Quality
The NH Wildlife Action Plan (NHWAP) data update released in 2010 ranks habitat quality statewide in
three tiers: Tier 1 is best in state, Tier 2 is best in ecoregion, and Tier 3 are supporting landscapes that
work as buffers to protect the integrity of the higher two tiers. Taken together, the three tiers total to
slightly more than 2/3 of the state land area.
The map to the right is the official NHWAP map
identifying the three-tier approach to classifying
habitat quality statewide.
More information on how the habitat quality tiers have been delineated and the NH Wildlife Action Plan
can be found at:
http://www.wildlife.state.nh.us/Wildlife/wildlife_plan.htm
NH Ecoregion Sub-Sections
Total Land
Area
Percent of
State Land
Area
Area
Protected
Percent
Protected
Coastal Lowland 183,092 3.1% 36,475 19.9%
Coastal Plain 982,145 16.5% 146,647 14.9%
Connecticut Lakes 372,314 6.3% 230,207 61.8%
Mahoosuc-Rangely Lakes 617,709 10.4% 228,335 37.0%
NH Uplands 1,646,741 27.7% 354,497 21.5%
Northern Connecticut River Valley 258,886 4.4% 33,910 13.1%
Sebago-Ossipee Hills and Plain 896,344 15.1% 137,889 15.4%
Vermont Uplands 190,461 3.2% 30,165 15.8%
White Mountains 792,841 13.3% 652,460 82.3%
31
Protection status for each tier is as follows:
Aquatic Habitat
The NHWAP has developed data on the highest quality aquatic habitats, which include certain
watershed-related stream networks as well as lakes and ponds that rated highly for habitat quality and
ecological intactness.
The stream networks are ranked in three tiers similar to the habitat quality tiers above, with Tier 1
representing the top 15% in quality statewide (by watershed group), Tier 2 is ranked in the top 30%, and
Tier 3 are streams with occurrences of selected aquatic species of concern. Each watercourse is
buffered by 100 meters (328’) to form a protective corridor along its length. Statewide and taken
together, these corridors cover about 10% of the state, and are nearly 38% protected. Of 327
watersheds statewide, only 99 contain Tier 1 or 2 ranked watercourses.
The protection status for the NHWAP aquatic habitat tier rankings is as follows:
NHWAP Habitat
Quality Tier
Total Area
Statewide Area Protected
Percent
Protected
Tier 1 1,540,387.3 806,592.5 52.4%
Tier 2 488,522.9 173,158.0 35.4%
Tier 3 1,844,006.0 573,535.4 31.1%
3,872,916.2 1,553,286.0 40.1%
NHWAP
Ranking
Total Acreage
of Stream
Corridor
Area
Protected
Percent
Protected
Tier 1 226,670 99,830 44.0%
Tier 2 205,251 71,504 34.8%
Tier3 124,904 38,941 31.2%
556,825 210,275 37.8%

32
NHWAP Habitat Types
The NHWAP classifies 16 distinct habitat types in
New Hampshire, 15 of which are considered in
this report. Several of these habitat types are
forest types, amounting to 75% of the state’s land
area. One extensive forest type – Hemlock-
Hardwood-Pine – accounts for nearly 40% of all
habitat type land cover.
The map to the right is the official NHWAP habitat
land cover map. Note the range of the
Appalachian Oak-Pine forest type in southeastern
N.H., typical of lower topographic elevation and a
milder climate regime, and compare to the
Northern Hardwood-Conifer forest type in the
northern half of the state, and at higher
elevations.
At the other end of the scale, several habitat
types are found in much smaller and more
localized areas of the state, and can be considered
scarce and unique.
The table that follows lists the habitat types in rank order of rarity, along with the area and percentage
of the habitat type that is currently protected. Several habitat types are less well protected, including
Salt Marsh, Pine Barrens, Peatlands, Floodplain Forests, Marshes & Shrub-Scrub Swamps, and especially,
Grasslands. Note also that the Appalachian Oak-Pine Forest type is only about 19% protected, although
accounts for 10% of the state’s land area.

33
Rare Species Occurrences
New Hampshire's natural landscape supports a diverse assemblage of native plants and animals,
including almost 200 natural community types, about 2,000 plant and tree species, and over 20,000
animal species. Through field surveys and with a comprehensive database, the Natural Heritage Bureau
(NHB) finds, tracks, and facilitates the protection of New Hampshire's rare plants and exemplary natural
communities.
The Bureau's mission, as mandated by the Native Plant Protection Act of 1987, is to determine
protective measures and requirements necessary for the survival of native plant species in the state, to
investigate the condition and degree of rarity of plant species, and to distribute information regarding
the condition and protection of these species and their habitats. The Bureau also maintains information
on rare wildlife in cooperation with the NH Fish & Game Department's Nongame and Endangered
Wildlife Program.
The New Hampshire Natural Heritage Bureau maintains a database documenting over 4,000 distinct
occurrences of rare plant and animal species and exemplary natural communities in New Hampshire.
Approximately 37% of these occurrences are found on permanently protected or public land, while
63% remain unprotected.
Due to the confidential nature of the database, mapping of the NHB plant and animal species database
is not available publicly.
NHWAP Habitat Types
Total Land
Area
Percent of
State Land
Area Area Protected
Percent
Protected
Dunes 192.5 0.003% 123.7 64.3%
Cliffs 5,807.8 0.1% 5,445.2 93.8%
Salt Marsh 6,692.2 0.1% 1,721.6 25.7%
Alpine 7,716.8 0.1% 7,692.3 99.7%
Pine Barrens 18,664.3 0.3% 4,695.7 25.2%
Rocky Ridge/Talus Slopes 28,049.2 0.5% 18,669.5 66.6%
Peatlands 57,111.5 1.0% 19,799.6 34.7%
Floodplain Forests 112,705.1 2.0% 37,480.9 33.3%
Marsh & Shrub Wetlands 142,073.3 2.5% 39,597.4 27.9%
Grasslands >25 Acres 232,385.1 4.1% 28,687.4 12.3%
High Elevation Spruce-Fir Forest 243,264.4 4.2% 228,958.4 94.1%
Appalachian Oak-Pine Forest 576,639.6 10.1% 107,681.2 18.7%
Lowland Spruce-Fir Forest 770,051.7 13.4% 362,692.0 47.1%
Northern Hardwood-Conifer 1,027,549.5 17.9% 566,813.6 55.2%
Hemlock-Hardwood-Pine Forest 2,263,495.0 39.5% 471,214.9 20.8%
5,492,398.2 1,901,273.5 34.6%
Note: Habitat area does not include water area or developed land.
NHWAP Habitat Types in Rank Order of Rarity

34
Top-Ranked Lakes and Ponds
As part of the NHWAP, lakes and ponds in New
Hampshire were evaluated for habitat quality and
ecological integrity. The top 10 water bodies in
each of ten watershed groups were selected based
on size, depth, and acidity, and a 200’ protective
buffer was established around each water body
which is critical to maintaining water and habitat
quality. Land cover data was used to estimate the
amount of land associated with the buffer that is
already developed.
The map at the right shows the 109 water bodies
ranked in the “top 10” lakes and ponds statewide.
Several of these water bodies are large in size, and
familiar – Squam Lake, Ossipee Lake, Wentworth
Lake being examples. Many of the water bodies are
much smaller, often classified as a pond and located
in remote, undeveloped areas of the state. See
Appendix C for a larger version of this map with the
list of lakes and ponds by municipality.
The total area of the top-ranked lake/pond buffer is about 14,770 acres statewide, of which 28% is
currently protected. About 28% of the buffer is estimated to be developed by roads and other land
uses.
Wetlands
The functional values of wetlands are well understood and broadly documented. Formerly regarded as
useless land and subject to extensive dredging and filling, the many ecosystem services (stormwater
storage, biological filtration and water quality enhancement, etc.) and complex wildlife habitat and
ecological systems are now recognized as critical natural resources in the broader landscape.
The availability of digital soils mapping statewide in New Hampshire has also made it possible to map
hydric soils8, which underlie and surround what we see in the physical environment as marshes, beaver
flows, and forested wetlands, and extends the geography of wetlands mapping significantly beyond the
earlier mapping of visible wetlands by the federal government as part of the National Wetlands
Inventory (NWI)9
8 Hydric soils are classified by the NRCS as poorly drained and very poorly drained.
9 NWI wetlands mapping relied primarily upon aerial photo interpretation to locate wetlands.

35
For the purposes of this study, both hydric soils
data and the NWI wetlands mapping are used,
with overlaps between the two datasets removed
to generate a single calculation for wetlands in
New Hampshire. There are about 495,000 acres of
hydric soils statewide, plus just over 277,000 acres
of separately mapped NWI wetlands10
, Therefore,
the aggregate total of soils data and wetlands is
actually a little more than 772,000 acres
statewide, or about 13.5% of the state’s land
base. About 25% of these wetlands is currently
protected.
The map to the left shows the distribution of
wetlands – both hydric soils and NWI wetlands –
statewide.
Although the mapped data are somewhat fine-
grained, the rather even extent of wetlands and
hydric soils is evident. The lack of soils data on the
White Mountain National Forest creates the
emptiness in that area. Note the density of
wetlands in the Seacoast region, where the flat
coastal lowlands left by the glacial age are favor
the creation of wetlands. Hydric soils (orange) also
appear more abundant in the North Country. This
is due in part to the unique landforms and soils of
the area.
Floodplains and Riparian Areas
Floodplains have been mapped statewide by FEMA
as floodways and flood zones that vary depending
upon the severity of storms (FEMA mapping is not
available digitally for Belknap county). For this
study, the focus is on 100-year floodplains, which
10
This number reflects only estuarine, marine and palustrine wetlands. Riverine and lacustrine are not counted since they
fall in the surface water area of the state.
36
have a statistical probability of 1% per year of flooding to the full extent of the zone11
.
Floodplains are critical conduits of flood waters, especially along larger water courses, and also perform
flood storage functions that reduce the severity of flooding downstream. Floodplains are also important
and unique wildlife habitat, and are home to several natural communities such as floodplain forests.
Just over 6% of the state is mapped as 100-year floodplain by FEMA, of which 21% is protected or in
public ownership. Of the 79% of unprotected floodplains, 7% is developed and 6% is agricultural.
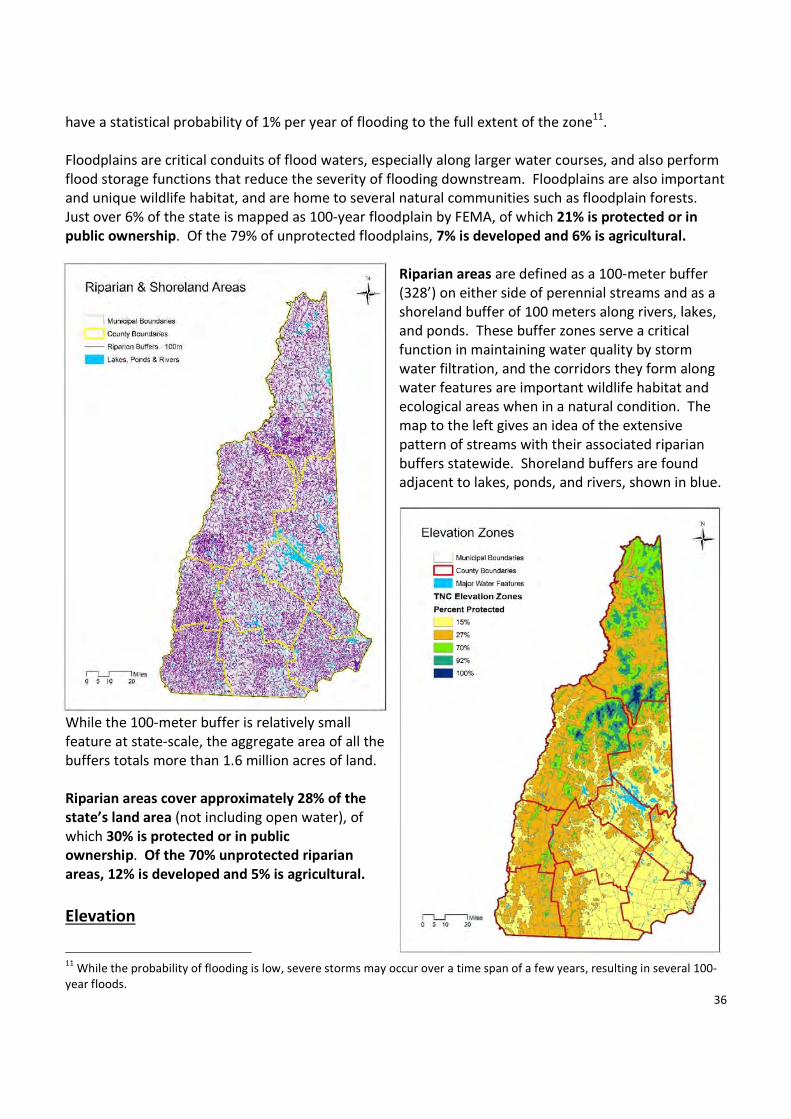
Riparian areas are defined as a 100-meter buffer
(328’) on either side of perennial streams and as a
shoreland buffer of 100 meters along rivers, lakes,
and ponds. These buffer zones serve a critical
function in maintaining water quality by storm
water filtration, and the corridors they form along
water features are important wildlife habitat and
ecological areas when in a natural condition. The
map to the left gives an idea of the extensive
pattern of streams with their associated riparian
buffers statewide. Shoreland buffers are found
adjacent to lakes, ponds, and rivers, shown in blue.
While the 100-meter buffer is relatively small
feature at state-scale, the aggregate area of all the
buffers totals more than 1.6 million acres of land.
Riparian areas cover approximately 28% of the
state’s land area (not including open water), of
which 30% is protected or in public
ownership. Of the 70% unprotected riparian
areas, 12% is developed and 5% is agricultural.
Elevation
11
While the probability of flooding is low, severe storms may occur over a time span of a few years, resulting in several 100-
year floods.

37
Elevation and terrain have a distinct correlation to various habitat types. The elevation classes in the
table below are based on studies of ecological systems in New Hampshire by The Nature Conservancy.
Higher elevations are typically better conserved, largely due to the historic emphasis on conserving
peaks and scenic places in more mountainous areas.
The table below lists the elevation ranges, the extent of land area for each, and the current status of
protection
The lower terrain (20’ – 800’) in southeastern N.H. is the least protected, and the most densely
populated and developed region of the state.
Elevation Range Total Acres
Percent of Total
State Area
Acres
Protected
Percent
Elevation
Zone
Protected
0 - 20' 17,603 0.3% 4,378 24.9%
20 - 800' 2,146,872 37.5% 316,308 14.7%
800 - 1700' 2,444,925 42.7% 657,532 26.9%
1700 - 2500' 799,604 14.0% 560,780 70.1%
2500 - 3600' 278,237 4.9% 256,293 92.1%
> 3600' 42,709 0.7% 42,671 99.9%

38
Section 6: Recreation Opportunities
Public Access to Conserved Land
There is a general perspective that any and all conserved land is open to public access. This is true in
most cases on federal, state, and municipal land which is held in the public trust, as well as much of the
privately held protected land in New Hampshire. However, public access to some land, especially
privately-owned land under conservation easements or other forms of permanent protection, is
restricted or not allowed.
Coding with regard to public access on conserved lands in the GRANIT conservation and public lands
database indicates that slightly more than 70% of conserved tracts allow public access for hunting,
fishing, and recreation. Another 4% either restrict public access in some manner or at certain times, or
do not allow public access, either for privacy reasons or land management considerations. However,
almost 26% of records in the database represent public access as unknown, so it is probable that many
more tracts allow public access. Adequate funding for the GRANIT program which manages the
conservation and public lands database would allow for a more accurate assessment of public access to
conserved land.
While abundant recreation opportunities exist on
conserved land statewide, a question remains as to
how well-served are the more populated regions of
the state by the existing network of protected lands.
In order to better understand this question, the
distribution of conserved land has been analyzed for
convenient accessibility from the most populated
municipalities in New Hampshire (communities of
10,000 or greater).
Convenient access here is defined as a 20-minute
drive from home, or about 10 miles at rural road
speeds. This travel radius is likely more preferable
for families and/or individuals with busy schedules,
but who wish to enjoy natural surroundings close to
home.
The map at the left shows 29 cities and towns in
New Hampshire with a population of 10,000 persons
or more (yellow). The red circles represent a 10-
mile radius from the center of each community. As
can be seen, the more populated communities are
typically located in the southeastern portion of the
state.

39
Factoring in the latest population data from NH
Office of Energy and Planning, nearly 20% of all
conserved land is within a 20-minute drive time of
718,000 persons, or about 54% of the state’s
population.
Of communities greater than 20,000 persons (38%
of the state’s population), about 10% of conserved
land is closely located. See map to right.
Regional Trails Systems
Current data collected by various agencies and organizations on local and regional recreation trails
(hiking, biking, XC skiing, snowshoeing, ATV use, etc.) has mapped nearly 2,700 miles of trails statewide,
of which about 82% lie on conserved land, as can be seen on the map to the right. A great majority of
these trail systems lie on state and federal lands. Municipal and privately-held lands also commonly
offer public access to trail systems at the local level; however, many of these trails are only locally
known and maintained, and they have not yet been mapped statewide.
In addition to multiple-use trails mentioned above, the state enjoys an extensive system of snowmobile
trails, some of which link region-to-region across the state. Since these networks are privately
maintained for the most part, depend upon landowner permission on private land, and are not typically
available for summer use, that aspect of New Hampshire’s recreational trails is not considered in this
study. However, it should be noted that many municipal, state, and federal trails are also devoted to
snowmobile and other winter trails uses.
Two other significant trail systems include rail trails and long-distance through hiking trails.
Rail trails are found along abandoned railroad rights-of-way that have been minimally developed to
support hiking and biking uses. Many of these former railroad rights-of-way have been acquired by the
state, allowing users to traverse long distances at easy grades. The state’s rail trail system is in a
developmental stage in New Hampshire, with needed improvements (bridges, access acquisition, etc.)
waiting for funding to complete various links, especially in the more urban areas around Concord and
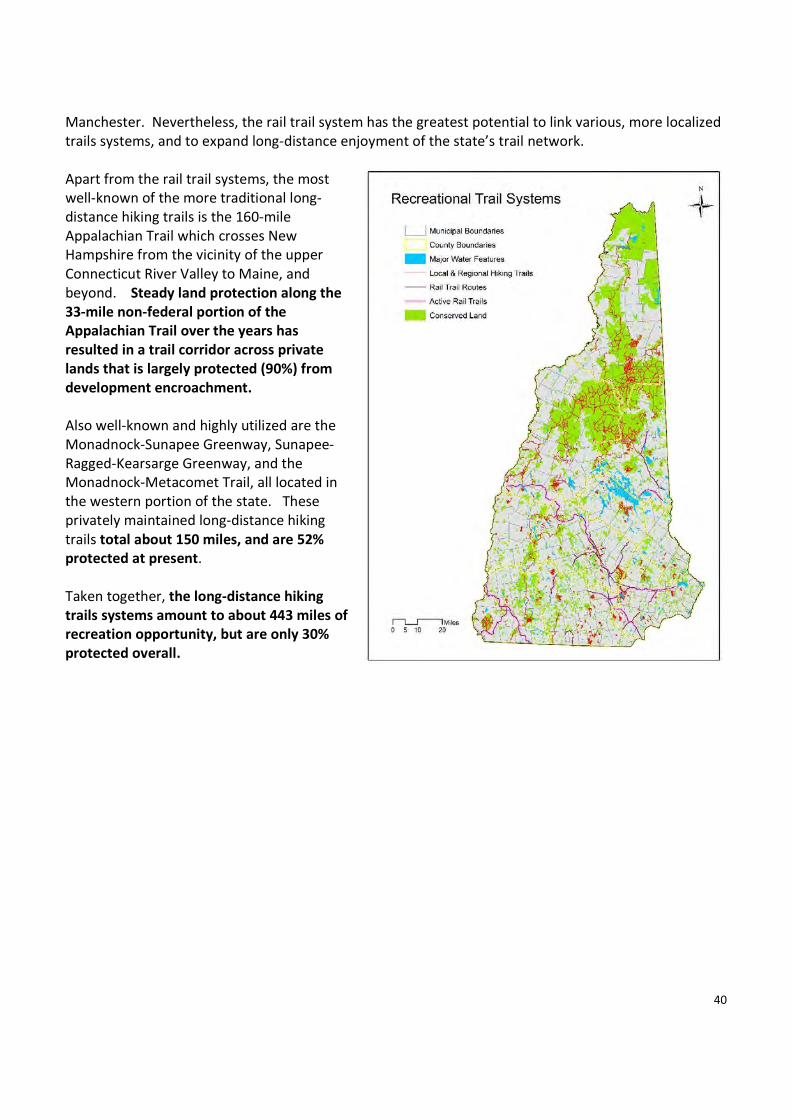
40
Manchester. Nevertheless, the rail trail system has the greatest potential to link various, more localized
trails systems, and to expand long-distance enjoyment of the state’s trail network.
Apart from the rail trail systems, the most
well-known of the more traditional long-
distance hiking trails is the 160-mile
Appalachian Trail which crosses New
Hampshire from the vicinity of the upper
Connecticut River Valley to Maine, and
beyond. Steady land protection along the
33-mile non-federal portion of the
Appalachian Trail over the years has
resulted in a trail corridor across private
lands that is largely protected (90%) from
development encroachment.
Also well-known and highly utilized are the
Monadnock-Sunapee Greenway, Sunapee-
Ragged-Kearsarge Greenway, and the
Monadnock-Metacomet Trail, all located in
the western portion of the state. These
privately maintained long-distance hiking
trails total about 150 miles, and are 52%
protected at present.
Taken together, the long-distance hiking
trails systems amount to about 443 miles of
recreation opportunity, but are only 30%
protected overall.
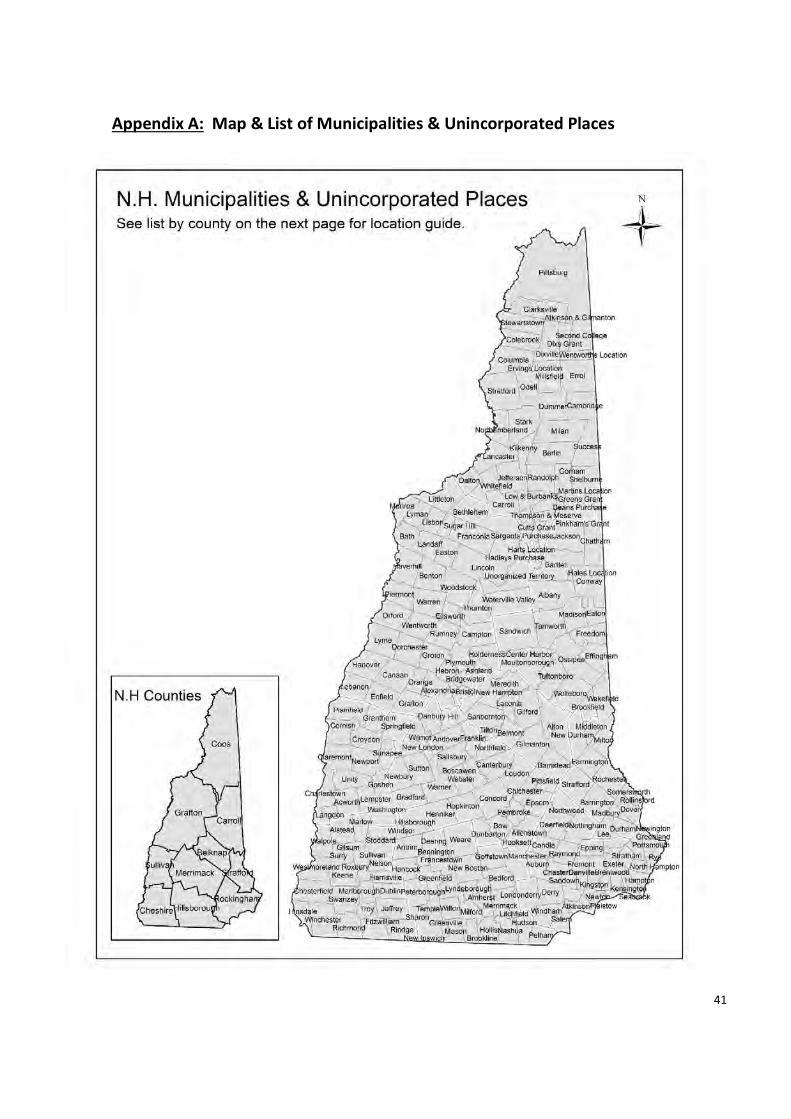
41
Appendix A: Map & List of Municipalities & Unincorporated Places
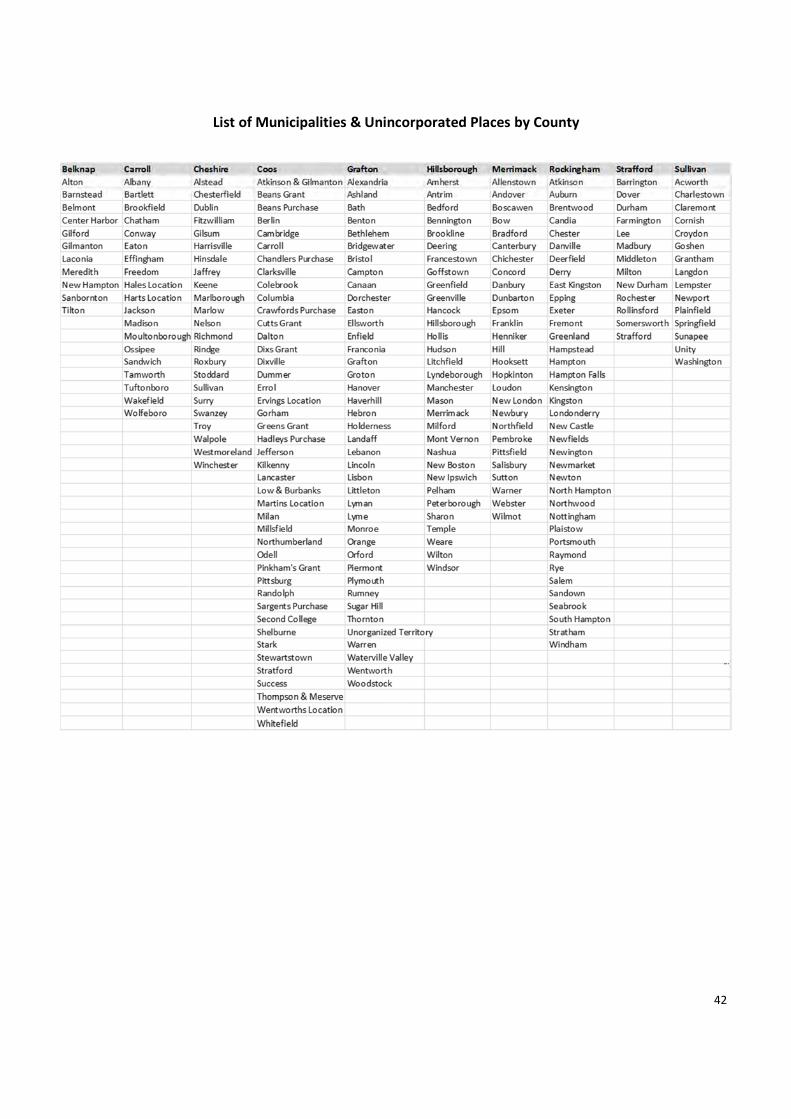
42
List of Municipalities & Unincorporated Places by County

43
Appendix B: List of Municipalities and Land Area Currently Protected
County Municipality Total Area (Ac) Water Area (Ac)
Total Land Area
(Ac) Land Protected
Percent of
Municipal Land
Area
Belknap Alton 53,230.7 12,524.0 40,706.7 5,016.4 12.3%
Belknap Barnstead 28,758.7 1,401.4 27,357.4 1,113.7 4.1%
Belknap Belmont 20,427.6 1,175.1 19,252.5 997.5 5.2%
Belknap Center Harbor 10,394.5 1,882.7 8,511.7 826.2 9.7%
Belknap Gilford 34,243.8 9,423.4 24,820.4 6,938.9 28.0%
Belknap Gilmanton 38,127.3 1,290.0 36,837.3 6,589.4 17.9%
Belknap Laconia 16,712.3 3,974.1 12,738.2 1,228.1 9.6%
Belknap Meredith 34,919.8 9,227.0 25,692.8 3,932.7 15.3%
Belknap New Hampton 24,560.1 979.8 23,580.3 3,266.6 13.9%
Belknap Sanbornton 31,774.5 1,391.5 30,383.0 4,416.6 14.5%
Belknap Tilton 7,637.8 455.2 7,182.6 98.7 1.4%
Carroll Albany 48,475.7 347.5 48,128.3 42,438.0 88.2%
Carroll Bartlett 47,882.5 237.0 47,645.4 31,718.5 66.6%
Carroll Brookfield 14,880.4 266.1 14,614.3 2,480.5 17.0%
Carroll Chatham 36,639.3 347.9 36,291.4 29,743.7 82.0%
Carroll Conway 45,886.7 1,353.9 44,532.8 11,761.4 26.4%
Carroll Eaton 16,383.2 795.1 15,588.1 2,686.0 17.2%
Carroll Effingham 25,556.0 715.1 24,840.9 6,532.8 26.3%
Carroll Freedom 24,262.0 2,187.6 22,074.4 4,844.8 21.9%
Carroll Hales Location 1,594.4 0.0 1,594.4 1,303.0 81.7%
Carroll Harts Location 12,302.5 60.3 12,242.3 10,813.8 88.3%
Carroll Jackson 42,758.2 11.2 42,747.0 33,235.8 77.8%
Carroll Madison 26,157.4 1,422.3 24,735.1 3,364.6 13.6%
Carroll Moultonborough 48,048.5 9,817.3 38,231.1 14,100.1 36.9%
Carroll Ossipee 48,168.7 2,947.6 45,221.1 9,064.0 20.0%
Carroll Sandwich 60,251.1 1,948.0 58,303.1 25,593.8 43.9%
Carroll Tamworth 38,812.7 648.1 38,164.6 14,704.2 38.5%
Carroll Tuftonboro 31,638.6 5,697.3 25,941.3 5,049.6 19.5%
Carroll Wakefield 28,717.2 3,373.2 25,344.0 1,025.0 4.0%
Carroll Wolfeboro 37,405.7 6,662.0 30,743.6 2,532.0 8.2%
Cheshire Alstead 25,211.0 368.6 24,842.3 1,438.7 5.8%
Cheshire Chesterfield 30,427.9 1,185.4 29,242.5 7,165.4 24.5%
Cheshire Dublin 18,553.1 574.1 17,979.0 5,225.6 29.1%
Cheshire Fitzwilliam 23,059.9 844.8 22,215.1 1,274.9 5.7%
Cheshire Gilsum 10,681.9 47.1 10,634.8 1,676.0 15.8%
Cheshire Harrisville 12,945.5 934.0 12,011.5 2,731.7 22.7%
Cheshire Hinsdale 14,497.3 1,419.7 13,077.6 1,585.8 12.1%
Cheshire Jaffrey 25,708.6 1,131.4 24,577.3 7,665.7 31.2%
Cheshire Keene 23,867.5 226.3 23,641.3 4,913.6 20.8%
Cheshire Marlborough 13,212.1 130.7 13,081.5 2,580.0 19.7%
Cheshire Marlow 16,921.6 214.4 16,707.2 2,144.6 12.8%
Cheshire Nelson 14,898.2 841.4 14,056.8 4,280.5 30.5%
Cheshire Richmond 24,152.4 90.4 24,062.0 2,988.5 12.4%
Cheshire Rindge 25,469.0 1,694.3 23,774.7 4,624.8 19.5%

44
County Municipality Total Area (Ac) Water Area (Ac)
Total Land Area
(Ac) Land Protected
Percent of
Municipal Land
Area
Coos Shelburne 31,212.0 493.4 30,718.6 16,498.6 53.7%
Coos Stark 38,222.0 535.5 37,686.4 27,733.2 73.6%
Coos Stewartstown 30,019.3 370.8 29,648.4 8,342.1 28.1%
Coos Stratford 51,231.7 446.4 50,785.3 24,549.3 48.3%
Coos Success 36,491.7 299.0 36,192.7 7,039.6 19.5%
Coos Thompson & Meserve 11,848.9 0.0 11,848.9 11,792.2 99.5%
Coos Wentworths Location 12,326.2 531.4 11,794.8 11,679.8 99.0%
Coos Whitefield 22,232.0 294.2 21,937.8 2,853.3 13.0%
Grafton Alexandria 27,921.3 97.4 27,823.9 4,085.6 14.7%
Grafton Ashland 7,533.8 309.3 7,224.5 1,094.6 15.2%
Grafton Bath 24,684.2 529.3 24,155.0 727.4 3.0%
Grafton Benton 31,201.7 130.4 31,071.2 27,603.8 88.8%
Grafton Bethlehem 58,206.1 167.2 58,038.9 32,627.5 56.2%
Grafton Bridgewater 13,890.3 117.6 13,772.7 391.1 2.8%
Grafton Bristol 14,022.2 3,277.5 10,744.7 905.4 8.4%
Grafton Campton 33,620.1 392.4 33,227.7 3,742.1 11.3%
Grafton Canaan 35,276.1 1,194.7 34,081.4 2,656.3 7.8%
Grafton Dorchester 28,890.0 325.5 28,564.5 3,649.5 12.8%
Grafton Easton 19,934.1 0.0 19,934.1 13,625.7 68.4%
Grafton Ellsworth 13,781.3 50.4 13,730.9 11,648.8 84.8%
Grafton Enfield 27,615.7 1,752.8 25,862.9 5,958.1 23.0%
Grafton Franconia 42,124.2 82.0 42,042.2 31,067.1 73.9%
Grafton Grafton 27,139.1 502.2 26,636.8 2,112.6 7.9%
Grafton Groton 26,085.3 32.6 26,052.6 4,369.2 16.8%
Grafton Hanover 32,087.2 640.2 31,447.0 8,104.7 25.8%
Grafton Haverhill 33,510.0 801.4 32,708.5 3,737.9 11.4%
Grafton Hebron 12,150.5 1,437.8 10,712.8 1,286.3 12.0%
Grafton Holderness 22,970.4 3,430.4 19,540.0 4,964.1 25.4%
Grafton Landaff 18,223.7 64.4 18,159.3 5,130.6 28.3%
Grafton Lebanon 26,415.3 674.2 25,741.1 2,999.5 11.7%
Grafton Lincoln 83,844.1 273.8 83,570.3 79,788.5 95.5%
Grafton Lisbon 17,065.6 240.0 16,825.6 128.8 0.8%
Grafton Littleton 34,555.5 2,559.5 31,996.0 2,717.9 8.5%
Grafton Lyman 18,355.9 131.8 18,224.2 1,520.6 8.3%
Grafton Lyme 35,215.9 694.3 34,521.7 12,587.2 36.5%
Grafton Monroe 15,249.0 894.6 14,354.4 456.8 3.2%
Grafton Orange 14,799.8 24.4 14,775.4 5,645.3 38.2%
Grafton Orford 30,578.0 815.6 29,762.4 3,145.0 10.6%
Grafton Piermont 25,582.3 818.6 24,763.7 5,796.7 23.4%
Grafton Plymouth 18,232.7 241.7 17,990.9 1,504.3 8.4%
Grafton Rumney 27,270.3 544.0 26,726.3 12,649.2 47.3%
Grafton Sugar Hill 11,027.6 103.5 10,924.1 1,798.3 16.5%
Grafton Thornton 32,443.6 293.0 32,150.6 15,471.9 48.1%
Grafton Unorganized Territory 40,924.7 83.1 40,841.6 40,844.7 100.0%
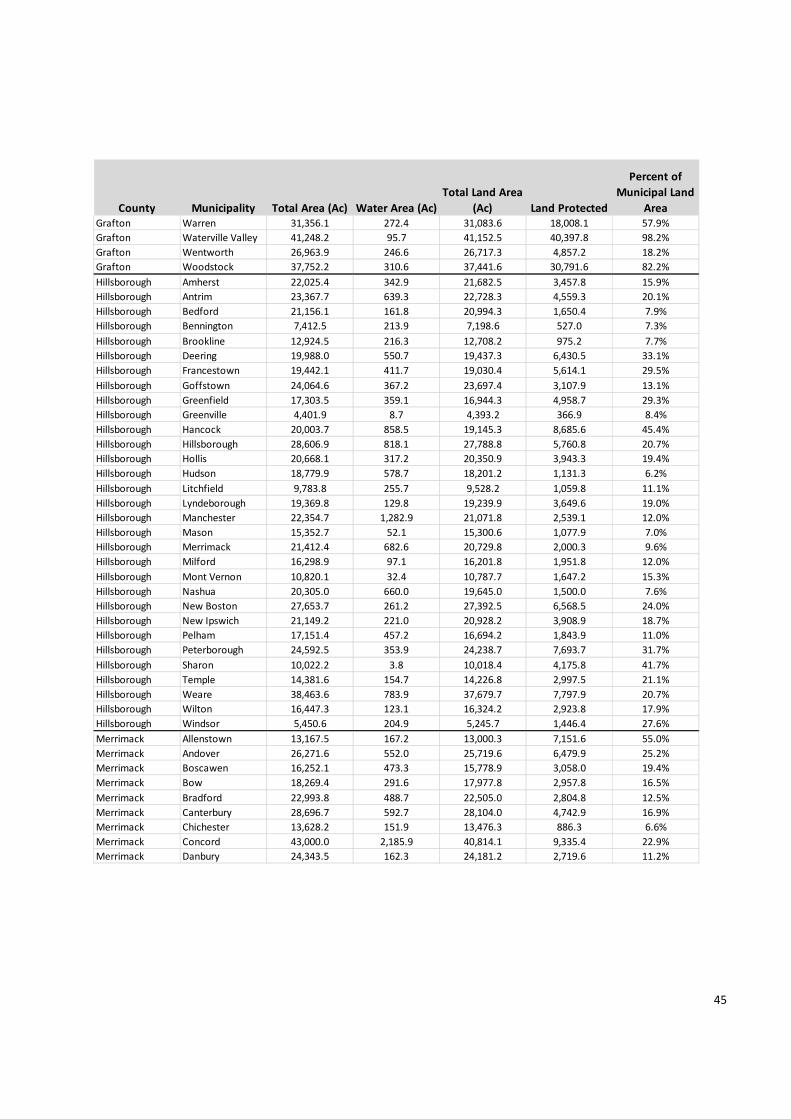
45
County Municipality Total Area (Ac) Water Area (Ac)
Total Land Area
(Ac) Land Protected
Percent of
Municipal Land
Area
Grafton Warren 31,356.1 272.4 31,083.6 18,008.1 57.9%
Grafton Waterville Valley 41,248.2 95.7 41,152.5 40,397.8 98.2%
Grafton Wentworth 26,963.9 246.6 26,717.3 4,857.2 18.2%
Grafton Woodstock 37,752.2 310.6 37,441.6 30,791.6 82.2%
Hillsborough Amherst 22,025.4 342.9 21,682.5 3,457.8 15.9%
Hillsborough Antrim 23,367.7 639.3 22,728.3 4,559.3 20.1%
Hillsborough Bedford 21,156.1 161.8 20,994.3 1,650.4 7.9%
Hillsborough Bennington 7,412.5 213.9 7,198.6 527.0 7.3%
Hillsborough Brookline 12,924.5 216.3 12,708.2 975.2 7.7%
Hillsborough Deering 19,988.0 550.7 19,437.3 6,430.5 33.1%
Hillsborough Francestown 19,442.1 411.7 19,030.4 5,614.1 29.5%
Hillsborough Goffstown 24,064.6 367.2 23,697.4 3,107.9 13.1%
Hillsborough Greenfield 17,303.5 359.1 16,944.3 4,958.7 29.3%
Hillsborough Greenville 4,401.9 8.7 4,393.2 366.9 8.4%
Hillsborough Hancock 20,003.7 858.5 19,145.3 8,685.6 45.4%
Hillsborough Hillsborough 28,606.9 818.1 27,788.8 5,760.8 20.7%
Hillsborough Hollis 20,668.1 317.2 20,350.9 3,943.3 19.4%
Hillsborough Hudson 18,779.9 578.7 18,201.2 1,131.3 6.2%
Hillsborough Litchfield 9,783.8 255.7 9,528.2 1,059.8 11.1%
Hillsborough Lyndeborough 19,369.8 129.8 19,239.9 3,649.6 19.0%
Hillsborough Manchester 22,354.7 1,282.9 21,071.8 2,539.1 12.0%
Hillsborough Mason 15,352.7 52.1 15,300.6 1,077.9 7.0%
Hillsborough Merrimack 21,412.4 682.6 20,729.8 2,000.3 9.6%
Hillsborough Milford 16,298.9 97.1 16,201.8 1,951.8 12.0%
Hillsborough Mont Vernon 10,820.1 32.4 10,787.7 1,647.2 15.3%
Hillsborough Nashua 20,305.0 660.0 19,645.0 1,500.0 7.6%
Hillsborough New Boston 27,653.7 261.2 27,392.5 6,568.5 24.0%
Hillsborough New Ipswich 21,149.2 221.0 20,928.2 3,908.9 18.7%
Hillsborough Pelham 17,151.4 457.2 16,694.2 1,843.9 11.0%
Hillsborough Peterborough 24,592.5 353.9 24,238.7 7,693.7 31.7%
Hillsborough Sharon 10,022.2 3.8 10,018.4 4,175.8 41.7%
Hillsborough Temple 14,381.6 154.7 14,226.8 2,997.5 21.1%
Hillsborough Weare 38,463.6 783.9 37,679.7 7,797.9 20.7%
Hillsborough Wilton 16,447.3 123.1 16,324.2 2,923.8 17.9%
Hillsborough Windsor 5,450.6 204.9 5,245.7 1,446.4 27.6%
Merrimack Allenstown 13,167.5 167.2 13,000.3 7,151.6 55.0%
Merrimack Andover 26,271.6 552.0 25,719.6 6,479.9 25.2%
Merrimack Boscawen 16,252.1 473.3 15,778.9 3,058.0 19.4%
Merrimack Bow 18,269.4 291.6 17,977.8 2,957.8 16.5%
Merrimack Bradford 22,993.8 488.7 22,505.0 2,804.8 12.5%
Merrimack Canterbury 28,696.7 592.7 28,104.0 4,742.9 16.9%
Merrimack Chichester 13,628.2 151.9 13,476.3 886.3 6.6%
Merrimack Concord 43,000.0 2,185.9 40,814.1 9,335.4 22.9%
Merrimack Danbury 24,343.5 162.3 24,181.2 2,719.6 11.2%

46
County Municipality Total Area (Ac) Water Area (Ac)
Total Land Area
(Ac) Land Protected
Percent of
Municipal Land
Area
Merrimack Dunbarton 20,045.7 276.9 19,768.8 5,278.1 26.7%
Merrimack Epsom 22,152.8 251.3 21,901.5 1,866.0 8.5%
Merrimack Franklin 18,661.6 1,118.6 17,543.0 3,471.6 19.8%
Merrimack Henniker 28,671.9 564.3 28,107.6 4,866.3 17.3%
Merrimack Hill 17,107.1 106.2 17,000.9 5,094.2 30.0%
Merrimack Hooksett 23,760.7 684.1 23,076.6 4,211.3 18.2%
Merrimack Hopkinton 28,851.7 1,135.5 27,716.2 8,031.4 29.0%
Merrimack Loudon 29,896.7 368.3 29,528.4 2,463.1 8.3%
Merrimack New London 16,267.9 2,041.3 14,226.6 2,726.8 19.2%
Merrimack Newbury 24,382.7 1,515.4 22,867.2 7,726.0 33.8%
Merrimack Northfield 18,485.8 201.1 18,284.6 197.1 1.1%
Merrimack Pembroke 14,597.3 210.7 14,386.6 479.1 3.3%
Merrimack Pittsfield 15,558.8 303.4 15,255.3 725.7 4.8%
Merrimack Salisbury 25,468.4 202.4 25,266.0 5,126.6 20.3%
Merrimack Sutton 27,734.9 665.7 27,069.2 3,540.3 13.1%
Merrimack Warner 35,502.2 328.5 35,173.6 9,833.2 28.0%
Merrimack Webster 18,425.8 625.3 17,800.6 4,320.0 24.3%
Merrimack Wilmot 18,955.5 137.3 18,818.2 4,243.7 22.6%
Rockingham Atkinson 7,258.5 75.6 7,182.9 778.0 10.8%
Rockingham Auburn 18,438.0 2,170.1 16,267.9 4,833.3 29.7%
Rockingham Brentwood 10,863.0 84.5 10,778.6 2,913.3 27.0%
Rockingham Candia 19,557.2 165.7 19,391.5 2,419.0 12.5%
Rockingham Chester 16,717.8 61.4 16,656.4 1,311.5 7.9%
Rockingham Danville 7,569.4 123.8 7,445.7 667.0 9.0%
Rockingham Deerfield 33,347.8 680.9 32,666.8 6,881.6 21.1%
Rockingham Derry 23,225.7 458.0 22,767.7 2,303.5 10.1%
Rockingham East Kingston 6,380.8 43.4 6,337.3 999.1 15.8%
Rockingham Epping 16,775.7 212.0 16,563.7 3,298.7 19.9%
Rockingham Exeter 12,812.9 190.8 12,622.1 3,703.0 29.3%
Rockingham Fremont 11,142.4 88.8 11,053.6 856.8 7.8%
Rockingham Greenland 8,523.9 1,774.5 6,749.3 1,438.6 21.3%
Rockingham Hampstead 9,014.2 425.3 8,588.8 1,598.9 18.6%
Rockingham Hampton 9,072.8 680.8 8,392.0 910.2 10.8%
Rockingham Hampton Falls 8,078.0 290.1 7,787.9 1,168.4 15.0%
Rockingham Kensington 7,667.8 0.0 7,667.8 1,769.4 23.1%
Rockingham Kingston 13,450.3 923.5 12,526.8 2,313.1 18.5%
Rockingham Londonderry 26,958.2 42.2 26,916.0 3,461.0 12.9%
Rockingham New Castle 1,347.6 840.5 507.1 110.6 21.8%
Rockingham Newfields 4,646.7 98.7 4,548.0 1,262.8 27.8%
Rockingham Newington 7,916.8 2,675.5 5,241.2 1,343.4 25.6%
Rockingham Newmarket 9,080.3 1,012.8 8,067.6 1,991.2 24.7%
Rockingham Newton 6,364.9 94.0 6,270.9 787.7 12.6%
Rockingham North Hampton 8,922.8 19.9 8,903.0 1,195.8 13.4%
Rockingham Northwood 19,357.0 1,310.5 18,046.4 3,065.9 17.0%
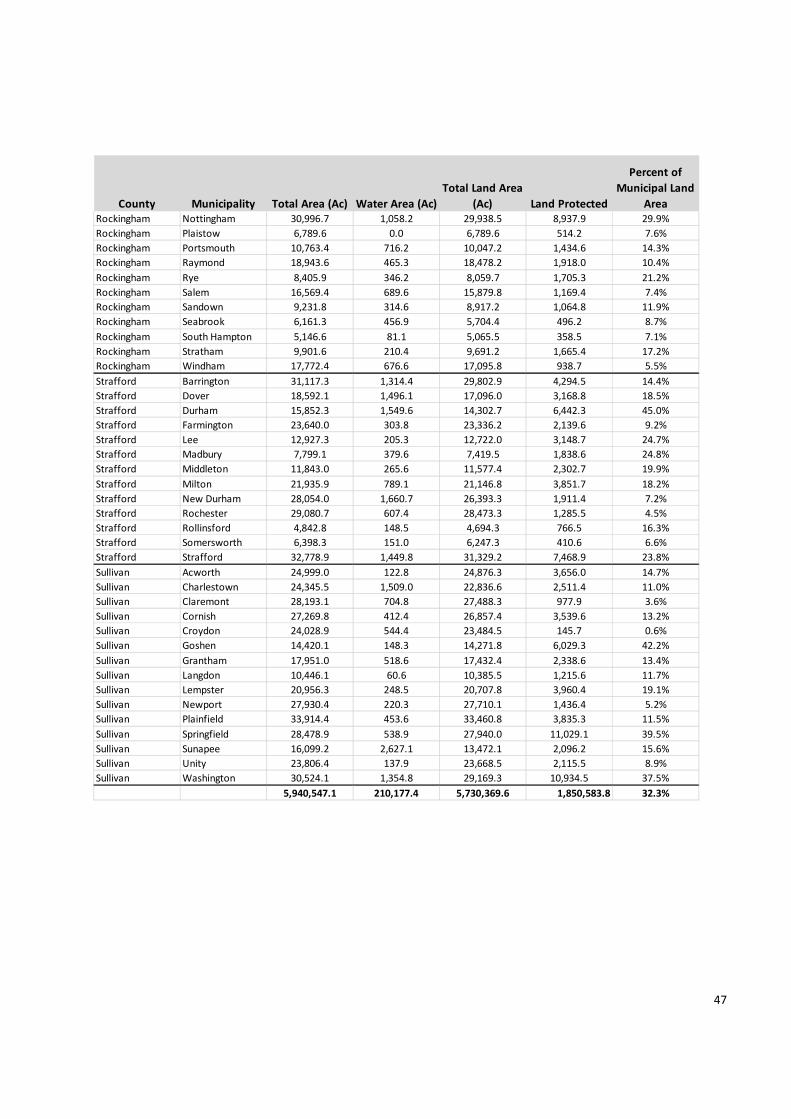
47
County Municipality Total Area (Ac) Water Area (Ac)
Total Land Area
(Ac) Land Protected
Percent of
Municipal Land
Area
Rockingham Nottingham 30,996.7 1,058.2 29,938.5 8,937.9 29.9%
Rockingham Plaistow 6,789.6 0.0 6,789.6 514.2 7.6%
Rockingham Portsmouth 10,763.4 716.2 10,047.2 1,434.6 14.3%
Rockingham Raymond 18,943.6 465.3 18,478.2 1,918.0 10.4%
Rockingham Rye 8,405.9 346.2 8,059.7 1,705.3 21.2%
Rockingham Salem 16,569.4 689.6 15,879.8 1,169.4 7.4%
Rockingham Sandown 9,231.8 314.6 8,917.2 1,064.8 11.9%
Rockingham Seabrook 6,161.3 456.9 5,704.4 496.2 8.7%
Rockingham South Hampton 5,146.6 81.1 5,065.5 358.5 7.1%
Rockingham Stratham 9,901.6 210.4 9,691.2 1,665.4 17.2%
Rockingham Windham 17,772.4 676.6 17,095.8 938.7 5.5%
Strafford Barrington 31,117.3 1,314.4 29,802.9 4,294.5 14.4%
Strafford Dover 18,592.1 1,496.1 17,096.0 3,168.8 18.5%
Strafford Durham 15,852.3 1,549.6 14,302.7 6,442.3 45.0%
Strafford Farmington 23,640.0 303.8 23,336.2 2,139.6 9.2%
Strafford Lee 12,927.3 205.3 12,722.0 3,148.7 24.7%
Strafford Madbury 7,799.1 379.6 7,419.5 1,838.6 24.8%
Strafford Middleton 11,843.0 265.6 11,577.4 2,302.7 19.9%
Strafford Milton 21,935.9 789.1 21,146.8 3,851.7 18.2%
Strafford New Durham 28,054.0 1,660.7 26,393.3 1,911.4 7.2%
Strafford Rochester 29,080.7 607.4 28,473.3 1,285.5 4.5%
Strafford Rollinsford 4,842.8 148.5 4,694.3 766.5 16.3%
Strafford Somersworth 6,398.3 151.0 6,247.3 410.6 6.6%
Strafford Strafford 32,778.9 1,449.8 31,329.2 7,468.9 23.8%
Sullivan Acworth 24,999.0 122.8 24,876.3 3,656.0 14.7%
Sullivan Charlestown 24,345.5 1,509.0 22,836.6 2,511.4 11.0%
Sullivan Claremont 28,193.1 704.8 27,488.3 977.9 3.6%
Sullivan Cornish 27,269.8 412.4 26,857.4 3,539.6 13.2%
Sullivan Croydon 24,028.9 544.4 23,484.5 145.7 0.6%
Sullivan Goshen 14,420.1 148.3 14,271.8 6,029.3 42.2%
Sullivan Grantham 17,951.0 518.6 17,432.4 2,338.6 13.4%
Sullivan Langdon 10,446.1 60.6 10,385.5 1,215.6 11.7%
Sullivan Lempster 20,956.3 248.5 20,707.8 3,960.4 19.1%
Sullivan Newport 27,930.4 220.3 27,710.1 1,436.4 5.2%
Sullivan Plainfield 33,914.4 453.6 33,460.8 3,835.3 11.5%
Sullivan Springfield 28,478.9 538.9 27,940.0 11,029.1 39.5%
Sullivan Sunapee 16,099.2 2,627.1 13,472.1 2,096.2 15.6%
Sullivan Unity 23,806.4 137.9 23,668.5 2,115.5 8.9%
Sullivan Washington 30,524.1 1,354.8 29,169.3 10,934.5 37.5%
5,940,547.1 210,177.4 5,730,369.6 1,850,583.8 32.3%

48
Appendix C: NHWAP “Top 10” Lakes and Ponds Map & List
Top Related