


Languages
Pages
Legal


128
Chapter - V
LABOUR DOWNSIZING: A CASE STUDY OF PUBLIC
SECTOR INDUSTRIES IN MYSORE DISTRICT
Contents
• Introduction
• Objectives
• Mysore District: A Profile
• An Economic and Industrial profile of Mysore district
• Public sector industries in Mysore District
- A brief profile of KSIC
- A brief profile of KSDL
• Labour Downsizing in Public Sector Industries in Mysore District
- Labour downsizing in KSIC
- Labour downsizing in KSDL
• Analysis of Data
• Summary

129
Chapter - V
LABOUR DOWNSIZING: A CASE STUDY OF PUBLIC SECTOR
INDUSTRIES IN MYSORE DISTRICT
Introduction
Mysore district is a hub of Industrial activities with six Public sector
undertakings and 64 registered Medium and Large units. The DIC is acting as a
single window agency in coordinating all the industry related activities in the district.
The district has the oldest industrial enterprises along with the emerging Wipro and
Infosys. Besides, the district has four industrial area developed by KIABD with a
fully fledged industrial infrastructure. The district is purposively selected to study the
issues relating to Labour downsizing in Public sector undertakings. This type of
Micro level analysis and disaggregated information at the industrial level will enable a
better understanding of the issue in the background of Global, National and State level
experiences. Moreover the deductive reasoning followed in the study will enhance
the empirical validity of the study.
Mysore city has housed all the six Public sector enterprises because of
congenial industrial ambience, salubrious climate, and excellent labour relations and
more importantly, skilled manpower has been instrumental in attracting investments
to the city. Today, Mysore is driving domestic growth, crafting careers and creating
wealth through a potent mix of resource based, skill based, technology and knowledge
based products and services. Mysore has an enduring tradition of tapping technology
to trace a steady growth curve across diverse sectors of the economy. Undoubtedly
Mysore carries the enviable tag of being the apple of the most technology savvy State
i.e. Karnataka.

130
The Mysore industrial zone is a fine blend of industries and educational
institutions known for excellence. Since ages, Mysore is known for its traditional silk
sarees, exotic sandalwood oil and incense. Mysore silk is well known for its quality
and everlasting luster. The sandalwood and rosewood carved articles are the major
attractions of the city.
Industries in Mysore district are mainly concentrated around the cities of
Mysore and Nanjangud. The Karnataka Industrial areas Development Board
(KIADB), has established six industrial areas in Mysore district to encourage
industrial development of the district. These are located in Belagola, Belawadi,
Hebbal (Electronic City), Hootagalli, Nanjangud and Thandavapur.
Objectives
This chapter is an attempt to analyze the status of Labour and the downsizing
in Public sector industries in Mysore District. The specific objectives of this chapter
are as follows:-
• To find out the nature and magnitude problem of Labour downsizing in Public
sector industries in Mysore District.
• To understand the dynamics of VRS scheme in Public sector industries of
Mysore District from both the worker and the management perspective.
In brief, this chapter intends to discuss the issues of Labour downsizing from
the regional perspective and at the disaggregated level. Hence, the empirical study of
Labour downsizing in Public sector units of Mysore district is expected to throw light
on the field level experience of the issue which can stimulate good policy signals.

131
Mysore District: A Profile
Mysore is located at 12°18'N 76°39'E / 12.30°N 76.65°E and has an average
altitude of 770 meters (2,526 ft). It is situated in the southern region of the state of
Karnataka, at the base of the Chamundi Hills and spreads across an area of 128.42
km2 (50 sq mi).
According to Hindu mythology, the area around Mysore was known as
Mahishuru and was ruled by a demon, Mahishasura. The demon was killed by the
Goddess Chamundeshwari, whose temple is situated atop the Chamundi Hills.
Mahishuru later became Mahisuru and finally came to be called Maisuru, its present
name in the Kannada language. The anglicized form of the name is Mysore. In
December 2005, the Government of Karnataka announced its intention to change the
English name of the city to Mysuru. This has been approved by the Government of
India, and from November 1st 2007, ‘Mysuru’ came into vogue68.
The name Mysore is often used to refer Mysore district, Mysore sub-district,
Mysore city and in historic contest the Mysore kingdom that spanned most of the
present day Karnataka state. Here the Mysore city which is also the administrative
headquarters of Mysore district. This is a midsized South Indian city with a
population of about 7.8 Lakh (780 thousand) and spanning an area of 128 sq km
(about 50 sq miles). This is the second largest city in Karnataka after Bangalore, the
state capital. With about 2.5 million visitors every year, Mysore is one of the most
visited cities in India.
68 . District at a glance, 2012.

132
An Economic and Industrial Profile of Mysore District
The district is situated at a distance of 146 kms from Bangalore. The cultural
capital of Karnataka situated between the rivers Kaveri and Kabini. Spread across 7
taluks namely Mysore, Tirumakudalu Narasipura, Nanjangud, Heggadadevanakote,
Hunsur, Piriyapatna and Krishnarajanagara and also known as the cultural hub of
Karnataka. Mysore is emerging as the next IT hub of India with the presence of giant
software companies like Infosys, Wipro. Traditionally, Mysore has been home to
industries such as weaving, sandalwood carving, bronze-work, and the production of
lime and salt. The planned industrial growth of the city and the state was first
envisaged in the Mysore Economic Conference, held in 1911. This led to the
establishment of industries such as the Mysore Sandalwood Oil Factory in 1917 and
the Sri Krishnarajendra Mills in 192069.
For the industrial development of the city, the Karnataka Industrial Areas
Development Board (KIADB) has established four industrial areas in and around
Mysore, in the Belagola, Belawadi, Hebbal (Electronic City) and Hootagalli areas.
Major industrial companies in Mysore Karnataka include Infosys, Bharat Earth
Movers, J. K. Tyres, Wipro, Falcon Tyres, Larsen & Toubro, and Theorem India.
There were setbacks when motorcycle manufacturer Ideal Jawa and the Sri
Krishnarajendra Mills closed. Efforts have been made to revive them, such as the
takeover of the Krishnarajendra Mills by the Atlantic Spinning and Weaving Mills,
but they have run into other problems.
Since 2003, information technology companies have been creating bases in
Mysore, with the city contributing Rs. 1100 Crores (US$220 million) to Karnataka's
69 District Economic profile, 2011.

133
IT exports in the financial year 2007–2008. Infosys has established one of the largest
technical training centers in the world and Wipro has established its Global Service
Management Center (GSMC) at Mysore. Non-IT related services have been
outsourced from other countries to companies in Mysore.
The growth of the information technology industry in the first decade of the
21st century has resulted in the Mysore Karnataka emerging as the second largest
software exporter in Karnataka, next to Bangalore. The city contributed Rs. 1363
crore (US$275 million) to Karnataka’s IT exports in the financial year 2009–2010.
Public sector industries in Mysore District
The proposed study was intended to the problem of labour downsizing and
labour restructuring in public sector industries in Mysore district. So in this regard if
PSUs in Mysore district are considered, the major public sector industries are Bharath
Earth Movers Limited (BEML), a Central government undertaking Karnataka Silk
Industries Corporation (KSIC), Karnataka State Electronics Development Corporation
Limited (KEONICS), Karnataka Soap and Detergent Limited (KSDL), Mysore Paints
and Varnish Limited (MPVL). The BEML is one of the major Central Public Sector
Undertakings and the other four industries are governed by the State government. In
the chapter only State government undertakings are considered and thus BEML is
excluded. Further, KEONICS - an electronic training center, which is providing
computer training programme to the poor and backward classes, has to two
administrative officers holding substantive posts and the trainers are appointed on
contract basis. Therefore, the question of Labour downsizing does not apply to
KEONICS. Similarly as per the annual records MPVL, labour downsizing is not

134
attempted. Therefore only in two Public enterprises namely KSIC and KSDL, where
the VRS cases of Labour downsizing are reported were considered and samples were
drawn from theses two public enterprises. In the subsequent section of the chapter the
case study of Labour downsizing has been dealt. Firstly the experience of KSIC is
discussed followed by case of KSDL. Due to uneven nature of phenomenon of labour
downsizing owing to various social and moral policy issues there is unavailability of
data over a time series, thus the analysis of uneven set of data was a herculean task
and this has limited the scope of using rigorous econometric and statistical tool in the
data analysis. So, simple percentages and charts are widely used to systematically
analyze the data available. Before attempting to study the labour downsizing
experiences of the two industries a brief profile of these industries are discussed as a
precursor for further discussion.
1. A brief profile of Karnataka Silk Industries Corporation (KSIC)
The silk weaving factory in Mysore, presently owned by KSIC, was
established in the year 1912 by the Maharaja of Mysore province. Initially the silk
fabrics were manufactured & supplied to meet the requirements of the royal family
and ornamental fabrics to their armed forces.
The unit was started with 10 looms and gradually increased to 44 looms over a
period. The looms and preparatory machines were imported from Switzerland and
was the first of its kind in India. After India gained Independence the Mysore state
Sericulture Department took control of the silk weaving factory.
In 1980 the Silk weaving factory was handed over to Karnataka Silk Industries
Corporation Ltd., a Govt. of Karnataka enterprise and is popularly known as KSIC.

135
The takeover was enthused by effecting modernization & expansion assisted by the
World Bank to the tune of Rs. 27.30 crore integrated under Karnataka sericulture
project. KSIC is the only organization in the country commanding the entire gamut
of silk production right from reeling of cocoons to the weaving of pure silk fabric of
various shades and designs, all under one roof. KSIC uses only high quality pure
natural silk and 100% pure gold zari. The zari never tarnish and will look fresh even
over a long period of usage. KSIC is the only organization to give guarantee for its
zari saree in the form of embroidered code number which is unique to each saree.
KSIC has two modern factories engaged in manufacturing silk goods right
from raw silk yarn to silk fabrics. The factories are located in T. Narasipura &
Mysore both in the state of Karnataka, India. The units manufacture raw silk yarn
and transfer to meet the raw material requirement of silk weaving factory in Mysore.
The raw silk yarn Filatures obtained from T. Narasipura factory is put through various
process and Quality silk products are produced for end user consumption. The
following table no 5.1 and chart no 5.1 depicts the performance of KSIC over a period
of eight years.

136
Table No: 5.1: Performance of Karnataka Silk Industries Corporation
Year
Karnataka Silk Industries Corporation (Rs. in Lakhs)
Zari Printed Dress
Materials Total
Meters Gross Sales
Discount
Rs. Net Sales
Rs.
2003-2004 67584 6436 59300.90 466410.90 3121.60 631.20 2490.40
2004-2005 53119 2704 18970.30 325996.80 2402.44 379.54 2022.90
2005-2006 66497 2209 13828.35 391464.10 3382.77 574.13 2810.69
2006-2007 66,701 2,514 7,623.44 388,305.94 407,088,848 73,801,503 333,585,500
2007-2008 71851 3644 8927.40 424,149.90 502,386,840 100,211,073 402,175,767
2008-2009 64724 6923 9613.10 403,671.60 603,902,880 146,825,621 457,077,259
2009-2010 65843 10284 8659.10 444,646.60 661,333,332 142,567,967 518,765,365
2010-2011 27547 2534 3292.85 282,543,251 282,543,251 54,104,249 228,439,002
Source: www.ksic.com
Chart No: 5.1: Performance of KSIC in Gross sales, Discount and Net sales
0
10000000
20000000
30000000
40000000
50000000
60000000
70000000
Performanc e of KSIC
Gross Sales
Performanc e of KSIC
Discount Rs.
Performanc e of KSIC Net
Sales Rs.
Year
Rs
in
Lakh

137
Silk Weaving Factory
The Factory is located in the heart of the Mysore city. The factory has
an installed capacity of 8, 00,000 Meters per annum. The factory which was started
with 10 looms in 1930 under the rulers of erstwhile Mysore Kingdom, now owns
more than 159 looms, two Warping machines & Pirn Machines and a number of
Preparatory Machines.
KSIC silk products are well appreciated in the market due to its 100% pure
silk blended with 100% pure gold Zari (65% of silver & 0.65% of Gold). The sarees
manufactured are of unmatched quality in varieties to suit the customer tastes viz:
Crepe-de-chine, Georgette, Zari printed crepe silk sarees, semi crepe sarees. The
sarees come in a splash of over 100 different colors and any number of design
combinations. Some of the design combinations are: Embroidery Design saree, Big
Butta Pall Zari, Rich Pall Sari Saree, Jowar Border Saree, Small Mango Saree, Zari
Printed Saree, Saree Tissue Saree, Traditional Zari Saree, Checked Zari Saree, Mango
Border Saree, Sunrise Design saree, Butta Pallu Saree, Double Line Checks Sarees
etc.,.
To protect esteemed customers from imitation of KSIC silks, KSIC have given
a special embroidered number for each one of the sarees with a unique number and
hologram. Other products of silk include soft silks, hankeys, Neck Ties, Stoles,
Cravats, dupion fabrics etc.

138
2. A brief profile of Karnataka Soap and Detergent Limited
Indian Sandalwood was abundantly available in the forests of Western Ghats.
Until 1900, the world extracted from the forest was exported to foreign countries for
distillation of sandalwood oil for use in perfume making, soap making etc., the
sandalwood oil was known as “East Indian Sandalwood oil”.
At the time of World War I, Sandal wood export was affected and hence the
stock of Sandalwood was started accumulating at Forest Kitties, in order to liquidate
the huge stock of sandalwood. Then the Maharaja of Mysore, his highness Sri.
Krishna Raja Wodeyar and Engineer Statesmen, Sir. M. Vishweswarayya planned
and started a Sandal Oil extraction plant at Bangalore in the year 1916. In the year
1917 it was shifted to Mysore, in the existing place. In 1944 the Shimoga division of
Sandalwood oil distillation was started. The main objective was to distill Sandalwood
oil for export purpose and to make use of it for production of “Mysore Sandal Soap”.
The above arrangement continued for 6 to 7 decades. During the late eighties,
sandalwood availability was started dwindling.
Earlier sandalwood was allotted to KSDL by Karnataka Forest Department at
administered prices (Rs. 1.44 lakh for Heart wood such as roots, jag etc., and Rs
78,500/- for mixed wood). Now for the last about six years the supply of Sandalwood
to KSDL on administration price was stopped and the Karnataka Forest Department
started selling the sandalwood by public auction similar to the sandal wood auction in
way being conducted by the Tamil Nadu Forest Department for the last several years.
Now, KSDL is participating in the Tamil Nadu state and Karnataka state sandalwood
auction and buying the sandalwood required for extraction of sandalwood oil for
soaps production. About 124 mts of rough sandalwood was procured from

139
Maharashtra Forest Department during the year 2006-07 and 2007-08. This rough
sandalwood was subjected to dressed process and obtained about 40 mts of Heart
woods mixed wood. After processing of these heartwoods mixed wood about
1000kgs of crude oil was obtained.
For the about seven years, KSDL is not selling sandalwood oil and almost
entire quantity of oil produced out of the available sandalwood is being used for
captive consumption for soap production ad KSDL, Bangalore. A small pack like
5gms of sandalwood oil is being sold for individual customer use.
Production Facilities
The Mysore unit was originally equipped with 26 numbers of Copper
distillation stills which were replaced with stainless steel stills and condensers. At
present, it had around eight stainless steel distillation stills capable to produce around
10,000 kilo grams of sandalwood oil per annum.
Quality of Mysore Sandalwood oil
The quality of Mysore sandalwood oil confirms to ISI Agmark standards. The
Chief constituent amounting to 90 or more percent of the oil is sandal, a mixture of
two primary sequirterpene alcohols (C15H24O) viz alpha and beta Sanitation, in which
alpha form in predominate. These are responsible for pleasant, sweet and
characteristic long lasting woody odious of the oil.

140
Labour Downsizing in Public sector industries in Mysore District
The case study is an attempt to throw light on the nature and magnitude of
labour downsizing in the study district in order to study the impact of Labour Exit
policy and its impact on the labour as well as the performance of the study units. The
study area is Mysore district which has named six PSUs, out of which Downsizing
through VRS has taken place only in two industries namely KSIC and KSDL as
mentioned in the beginning of the chapter.
1. Karnataka Silk Industry Corporation
2. Karnataka Soap and Detergent Limited
The two case study units have offered two types of VRS packages namely
Mass VRS and VRS with golden handshake. In case of mass VRS all those workers
who have put in a service of more than 30 years were offered VRS whether they liked
it or not. In a sense it was a kind of forced retirement and not voluntary. No option
was given to them except ‘Exit’. The workers who wanted to take up VRS but have
not completed 30 years of service were offered VRS under Golden Handshake that
means apart from their regular VRS dues, additional amount of Rupee One lakh was
given. In fact this can be regarded as genuine VRS cases.
1. Labour downsizing in Karnataka Silk Industry Corporation
The Labour exit policy has also its shadows in the Public sector industries of
Mysore district. During the first decade of Economic Reforms, there were no cases of
labour downsizing at KSIC. However it was during this period where the entire
nation was bubbling with protests of various kinds against the anti-labour policy in

141
the background of liberalization. As per the table 5.2, in the second decade,
particularly in the year 2004, out of 585 employees, 241 individuals i.e. 41.18% of the
total work force opted for VRS. Then till 2010 no cases of VRS has been witnessed as
evidenced by the table 5.2.
Table No: 5.2: Staff and Workers strength in KSIC with VRS and Retirement
Year Workers
Strength
Staff
Strength Total VRS Employees Retired
31.12.2001 680 160 840 0 0
31.12.2002 657 159 816 0 34
31.12.2003 514 159 773 0 0
31.12.2004 465 120 585 241 0
31.12.2005 461 115 576 0 05
31.12.2006 429 115 544 0 0
31.12.2007 413 147 560 0 0
31.12.2008 409 133 542 0 0
31.12.2009 397 141 538 0 0
31.12.2010 394 137 531 0 0
Total 4819 1386 6305 241 39
Source: Karnataka Silk Industries Corporation, Mysore Division
Only the year 2004 saw the peak of VRS scheme in KSIC and the primary
data elicited from respondents reveal that in the year 2004 there was fear of lockout
and that influenced the workers and the staff to opt for VRS. The employees with the
fear of future economic security in the wake of industrial lockout saw VRS as a better
option beforehand. Further declaration of additional one lakh with VRS amount and
offer of VRS with golden handshake by the industry boosted their decision for VRS.
142
For this reason, nearly 42% of the total workforce of KSIC availed VRS. Even the
trade unions were passive and absolutely there was no effort on the part of the trade
unions to save jobs and also there were no traces of collective bargaining; which made
a conductive environment for both workers as well as the industry to move ahead with
VRS scheme.
2. Labour downsizing in Karnataka Soap and Detergent Limited:
(KSDL)
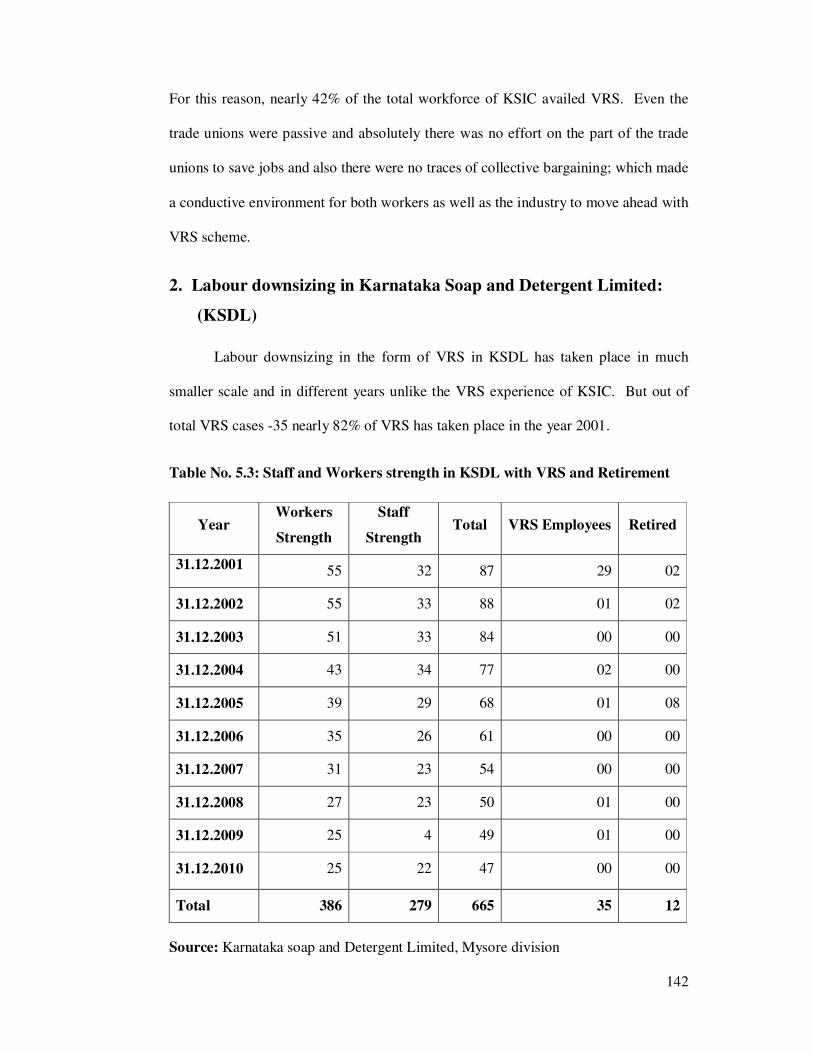
Labour downsizing in the form of VRS in KSDL has taken place in much
smaller scale and in different years unlike the VRS experience of KSIC. But out of
total VRS cases -35 nearly 82% of VRS has taken place in the year 2001.
Table No. 5.3: Staff and Workers strength in KSDL with VRS and Retirement
Year Workers
Strength
Staff
Strength Total VRS Employees Retired
31.12.2001 55 32 87 29 02
31.12.2002 55 33 88 01 02
31.12.2003 51 33 84 00 00
31.12.2004 43 34 77 02 00
31.12.2005 39 29 68 01 08
31.12.2006 35 26 61 00 00
31.12.2007 31 23 54 00 00
31.12.2008 27 23 50 01 00
31.12.2009 25 4 49 01 00
31.12.2010 25 22 47 00 00
Total 386 279 665 35 12
Source: Karnataka soap and Detergent Limited, Mysore division

143
VRS in KSDL
In Karnataka Soap and Detergent Limited, the year 2001 is the year of VRS
scheme. Because only in the year 2001 the number of VRS was high i.e., 29
employees was under the scheme of VRS. In 2004 only two members have opted for
VRS and only one individual availed VRS in the years 2002, 2003, 2006, 2007 and
2010.
Analysis of Data
In this section, the primary data collected from these two PSUs in Karnataka
has been dealt with. Here due to vague information regarding the whereabouts of the
population i.e. persons who had opted for VRS in both industries and also due to the
fact that relative number of VRS optees is larger in KSIC -241 individuals in
comparison to VRS optees in KSDL which is only 35, it was assumed that
comparison between the two would lead to unconcluded results and hence the primary
data elicited from both industries were merged and thus a intra-comparison between
the samples from both industries was not attempted but data was analyzed by merging
the primary data from both industries in question.
Table No. 5.4: Distribution of samples in the selected industries
Name of the
Industry
Number of persons
opted for VRS Percent
KSDL 9 10
KSIC 81 90
Total 90 100.00

144
The above table no 5.4 reveals the number of labourers opted for VRS scheme
in KSDL and KSIC. A total number of 90 persons (9 from KSDL and 81 from KSIC)
constitute the sample size of this study. The sample form KSDL comprises only 10%
of the total sample and remaining 90% is from KSIC. This is for the reason that KSIC
has relatively huge number of VRS optees and were available during the primary data
survey.
Table No. 5.5: Age of the respondents
Age of the respondent Frequency Percent
45 to 50 yrs 04 4.4
51 to 55 yrs 48 53.3
56 to 60 yrs 30 33.3
61 to 65 yrs 08 8.8
Total 90 100.00
Chart No. 5.2: Percentage wise the Age of the respondents
0
10
20
30
40
50
60
45-50yrs 51-55yrs 56-60yrs 61-65 yrs
Percentage of the respondents under
different age groups
Percent
145
The table no 5.5 and chart no 5.2 indicate the distribution of the respondents
based on different age groups. The age group of 51-55 years comprises majority of
the respondents that is 53.3% followed by 56-60 years age group with 33.3%.
Subsequently with the age group 61-65 years follows and lastly the age group 45-50
years has the least share that is 4.4% of the total VRS optees.
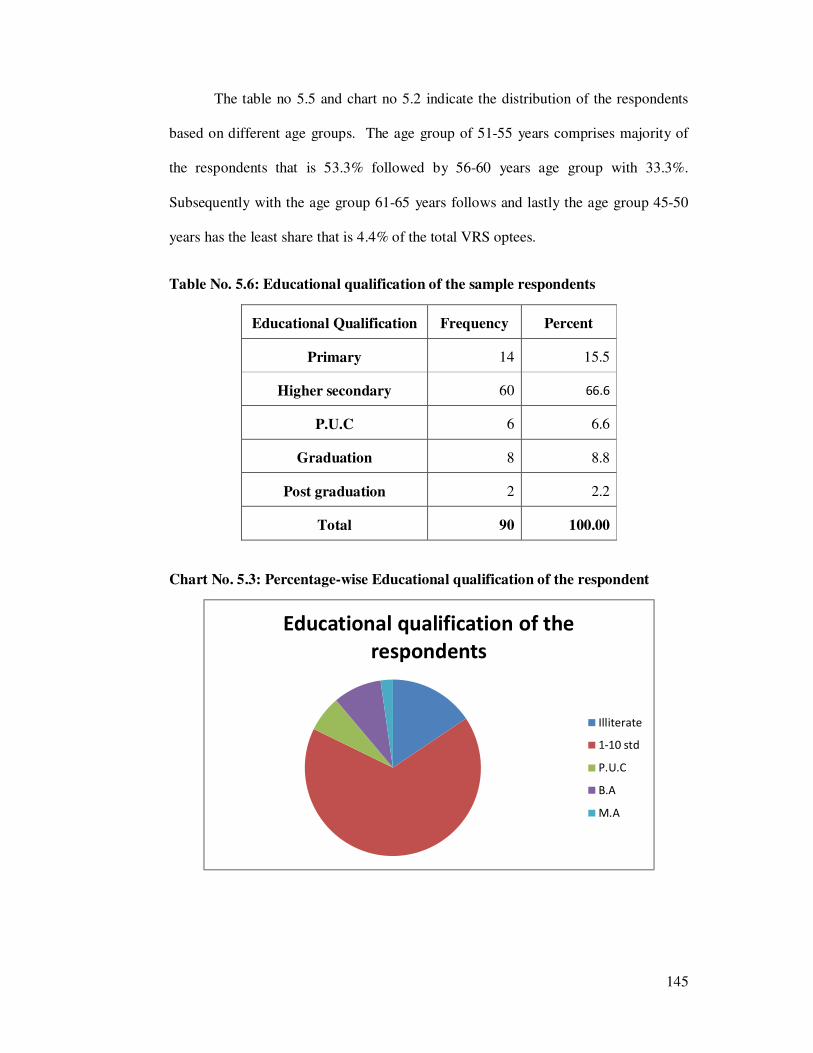
Table No. 5.6: Educational qualification of the sample respondents
Educational Qualification Frequency Percent
Primary 14 15.5
Higher secondary 60 66.6
P.U.C 6 6.6
Graduation 8 8.8
Post graduation 2 2.2
Total 90 100.00
Chart No. 5.3: Percentage-wise Educational qualification of the respondent
Educational qualification of the
respondents
Illiterate
1-10 std
P.U.C
B.A
M.A

146
Through the table no 5.6 and chart no5.3 depicting the distribution of
respondents based on their educational qualification, it can be inferred that more than
half i.e. 66.6% of the respondents have only elementary education i.e. 1 to 10th
standard. Contradictorily the percentage of respondents possessing highest
educational qualification i.e. M.A among the respondents is least at 2.2% of total
respondents.
Table No. 5.7: Year of joining Service of the respondent
Year of joining Frequency Percent
1950-1960 3 3.3
1961-1970 4 4.4
1971-1980 55 61.1
1981-1990 38 42.2
Total 90 100.00
Chart No. 5.4: Decomposition of respondents' year of joining service (in percent)
0
10
20
30
40
50
60
70
1951-60 1961-70 1971-80 1981-90
Decomposition of respondents' year of
joining service (in percent)
Percent

147
The above table no 5.7 and chart no 5.4 reveals that the 3.3 per cent and 4.4
percent of respondents who have joined service in the year 1950-60 and 1961-1970
respectively have taken VRS and respondents joining service in 1971-1980 stand as
majority with 61.1%. This trend among this group can be attributed to the fact that
they are still rich in human capital with age ranging from 30-35 and may have better
job prospects than any other groups because the last group of 1981-1990 are those
who have just entered labour market and without required experience may resist to
take VRS and those in other older groups find it difficult to re enter the labour market.
Table No: 5.8: Classification of Respondents by Nature of work
Nature of Work Number of respondents Percent
Accountants 6 6.6
Auditing 9 10.0
Boiler Machine 2 2.2
Clerk, Store keeper 1 1.1
Cone Winding 20 22.2
Design Maintainer 3 3.3
Dyeing 5 5.5
Finishing section 5 5.5
Machine work 3 3.3
Oil section 5 5.5
Sales unit 6 6.6
Senior Asst. 3 3.3
Store Keeper 2 2.2
Supervision 17 18.8
Winding/ Viewing 3 3.3
Total 90 100.00
Source: KSIC and KSDL, 2011

148
Chart No 5.5: Distribution of respondents under different types of work
(in percent)
Table no 5.8 and chart no 5.5 state the distribution of respondents on the basis
of type of work they used to perform. About 22.2% of the total respondents, used to
operate as cone winders followed by supervisors or viewers with 18.8% and the least
percentage are for the share of clerical or store keeping work. The rest of the
categories of respondents share a moderately similar percentage.
Table no: 5.9: Pay scale of respondent in both industries
Pay scale Number of
respondents Percent
1000 - 1999 37 41.1
2000 - 3999 32 35.5
4000 - 5999 03 3.3
6000 –7999 02 2.2
8000 – 10000 16 17.8
10000 and above - -
Total 90 100.00
0
5
10
15
20
25
Distribution of respondents under
different types of work (in percent)
Percent

149
Chart No: 5.6: Distribution of respondents under different groups of pay scale
(in percents)
The table no 5.9 and chart no 5.6 which are related to the pay scale of
respondents show that majority i.e. nearly 76% out of total respondents come under
the lower pay scale, ranging between 1000-4000. Also the other pay scale groups
where workers are concentrated are in the relative high pay scale range of 8000-9999
i.e. with 17.8%.
Table No: 5.10: Family size of the respondents both in KSIC and KSDL.
The below table shows that, the total number of members were consists in the
family. And it also helps us to find out which groups of the family were under VRS
scheme.
Distribution of respondents under different groups
of pay scale (in percents)
1000-1999
2000-3999
4000-5999
6000-7999
8000-9999

150
Members in the family No. of families Percent
01 – 03 02 2.2
04 – 06 58 64.4
07 – 09 26 28.8
10 & above 04 4.5
Total 90 100.00
Chart No. 5.7: Distribution of respondents under different family size (in
percents)
From the table no 5.10 and chart no 5.7, it can be really understood that the
number of members in the family ranging from 04 to 06 and 07 to 09, constitute the
highest share, 64.4 per cent and 28.8 per cent respondents who have opted VRS. But
the share of families consisting of 01-03 and 10 & above members, are 2.2 and 4.5 per
cent respectively.
0
10
20
30
40
50
60
70
01 – 03 04 – 06 07 -- 09 10 & above
Distribution of respondents under different family size
(in percents)
Percent

151
Table No. 5.11: Classification of reasons stated by respondents for opting VRS
Sl.
No. Reason behind VRS
Number of
respondents Percentage
1 Clearing previous financial commitments 44 48.8
2 Construction of House or purchasing plots 04 4.4
3 Social commitments (Daughter’s Marriage
purposes)
21 23.3
4 Fixed deposit or Other investments 02 2.2
5 Health purposes 17 18.8
6 Unfavorable working environment 02 2.2
7 Miscellaneous purposes - -
Total 90 100
Chart no 5.8 Classification of reasons stated by respondents for opting VRS
The above table no 5.11 and the chart no 5.8 reveal the reasons stated by the
respondents for opting VRS. Majority of respondents i.e. 48.8% have stated
repayment of loans as the main reason for opting VRS, and 23.3% of the total
respondents have opted for VRS due to Social commitments like daughter’s marriage
Clearing previous financial
commitments
House construction
Social commitments
Fixed deposits
Health purposes
Unfavourable working
conditions

152
etc, further 18.8% of respondents stated that VRS amount was utilized towards health
or medical expenses, 4.4% of respondents have availed the VRS amount in order to
construct houses or buy plots and lastly 2.2% of the respondents availed the VRS
amount to open a fixed deposit and another 2.2% of respondents have opted for VRS
due to unfavorable working conditions.
Table No. 5.12: Level of satisfaction of respondents Post VRS in KSIC and
KSDL
Level of satisfaction Post VRS Number of respondents Percent
Satisfied to a very small extent 03 03.3
Satisfied to a small extent - -
Satisfied neither to a small or great extent - -
Satisfied to a great extent 77 85.5
Satisfied to a very great extent 10 11.1
Total 90 100
Chart No: 5.9 Level of work satisfaction of respondents Post VRS
Level of work satisfaction of repondents Post
VRS
Satisfied to a very small
extent
Satisfied to a small extent
Satisfied neither to a
small or great extent
Satisfied to a great extent
Satisfied to a very great
extent

153
The table no 5.12 and chart no 5.9 state that nearly 85.5 per cent of the
respondents are satisfied post VRS to a greater extent and 11.1 per cent of
respondents were satisfied to very great extent and only 3.3 per cent out of total
respondents were satisfied to a very small extent post VRS.
Table No. 5.13: VRS amount of sample of respondents
Amount of VRS Frequency Percent
10,000 – 1,00,000 02 2.2
1,00,000 – 3,00,000 66 73.3
3,00,000 – 6,00,000 05 5.5
6,00,000 – 9,00,000 02 2.2
9,00,000 & above 15 16.6
Total 90 100.00
Chart No: 5.10 Distribution of the respondents under different amount of VRS
0
10
20
30
40
50
60
70
80
10,000 –
1,00,000
1,00,000 –
3,00,000
3,00,000 –
6,00,000
6,00,000 –
9,00,000
9,00,000 &
above
in p
erc
en
tag
e
VRS amount of the respondents
Percent

154
As per the table no 5.13 and chart no 5.10 it can be inferred that majority of
total respondents i.e. 73.3% have availed VRS amount ranging from 1,00,000 to
3,00,000 lakh, followed by the amount 9, 00,000 and above i.e. 16.6% out of the total
respondents. The amount ranging between 3,00,000 to 6,00,000 lakh is availed by
only 5.5% whereas amount 10,000 to 1 lakh and 6,00,000 to 9,00,000 is received by
only2.2% of the total respondents.
Respondents’ response on provision of counseling before VRS was
offered
Nearly 94% of respondents asserted that they were not provided any kind of
counseling as to the options they will have on opting VRS and only 6% of the total
respondents stated they were counseled before they opted VRS. Chart no 5.13 depicts
the responses of the respondents.
Chart 5.11: Respondents' response on provision of counselling before VRS was
offered
No
94%
Yes
6%
Chart 5.11- Respondents' response on provision of
counseling before VRS was offered

155
Respondents’ responses on re-entry to labour market:
Out of the total respondents nearly 62.5% have re-entered labour market post
VRS and 37.5% of them have not been able to re enter the labour market as depicted
in chart no 5.12
Chart no 5.12: Re entry to labour market
Out of this 37.5% nearly 87% of them are willing to re-enter labour market
whereas 13% of them responded that they are not willing to re-enter labour market as
depicted under
0.00%
10.00%
20.00%
30.00%
40.00%
50.00%
60.00%
70.00%
yes no
Chart no 5.12: Re entry to labour market
Re entry to labour market

156
Chart No. 5.13: Respondents willingness to re-enter labour market
Improvement in the financial condition of respondents Post VRS
As per the chart no 5.13 nearly 78.5% of the total respondents opined that their
financial condition post VRS is not satisfactory or it has not improved and it was only
21.5% respondents who stated that post VRS their financial conditions have
improved.
Chart No 5.14 Improvement in financial condition of respondents post VRS
Respondents willingness to re-enter labour
market
yes
no
Improved not improved
Improvement in financial
condition of respondents
Post VRS
21.50% 78.50%
0.00%
10.00%
20.00%
30.00%
40.00%
50.00%
60.00%
70.00%
80.00%
90.00%
100.00%
in p
erc
en
tag
e
Improvement in financial condition of respondents Post
VRS

157
Improvement in the Post VRS Financial condition
As per the chart no 5.14 nearly 78.5% of the total respondents opined that their
financial condition post VRS is not satisfactory or it has not improved and it was only
21.5% respondents who stated that post VRS their financial conditions have
improved.
Improvement in the social status of respondents Post VRS
As per the chart no 5.15 nearly 47% of the total respondents affirmed that their
social status has been very bad Post VRS, 31.5% stated their social status to be bad,
13.5% maintained that their social status has been normal or static involving no
changes and further for about 5% of respondents mentioned that their social status
Post VRS has been good and only 3% disclosed that their social status to be very good
Post VRS.
Chart No 5.15: Improvement in social status of respondent Post VRS
0.00%
5.00%
10.00%
15.00%
20.00%
25.00%
30.00%
35.00%
40.00%
45.00%
50.00%
Very
good
Good Normal Bad Very bad
Improvement in Social Status of respondents Post VRS
Improvement in Social Status
of respondents Post VRS

158
Level of contentment in life of the respondents Post VRS
As per the chart no 5.16 nearly 54% of the total respondents acknowledged
that their level of contentment in life Post VRS has been to a very small extent, 25%
stated their level of contentment in life Post VRS to be a small extent, 10%
maintained that their level of contentment in life Post VRS has been neutral involving
no changes and further for about 7% of respondents declared that level of contentment
in life Post VRS has been to a great extent and finally it was only 5% of respondents
who believed level of contentment in life Post VRS to be to a very great extent.
Chart No 5.16: Improvement in the level of contentment in life Post VRS
Summary
An economic and industrial profile of the case study district Mysore provides
a prelude for the field study. Out of the five state owned manufacturing units in the
district only two industries namely KSDL and KSIC where labour downsizing has
taken place, are selected for the study. The profile of these two units is presented. An
54%
25%
10%
7%5%
Improvement in the level of contentment in life Post VRS
To a very small extent
To a small extent
Neither to small or great
To a great extent
To a very great extent

159
attempt has been made to capture the opinion from all the stake holders of the labour
downsizing namely VRS optees, management and the trade union office bearers as
well as members in the case study district. The scheduled questionnaire has
incorporated the objectives as well as the hypotheses set for the in depth analysis.
The field data as well as the qualitative observations have constituted the backbone of
the policy suggestions.
Top Related