


Languages
Pages
Legal


Karnataka Secondary ECucation Examination Board6th Cross. Malleswaram. Bangalore
STAffiSffiOS DETAM$ CIF S,S,L,CI EXAfufl " NfAROHIA]PRilI 2ON9
KSEEB has been witnessed for the unprecedented changes in accordance withthe advanced technology and the. present situations. Under the project ofPRAGATHI-IO KSEEB has digitalised all the services of Board includingevaluation process, which is very much appreciated by the teachers, parents andstudents across Karnataka. Through Digitisation process, Board is succeeded indelivering many services to the doorstep of parents and students with ease ofacceptability.
{: SSLC Final Examination of March/April-20l9 was held from 21.03.2019 to
04.04.2019 in2847 Examination Centres across the State.
2. 825468 students attended the examination.
CCERF - Regular Fresh Students 738569CCEPF - Private Fresh Students 2t381CCERR - Regular Repeater Students 57604CCEPR - Private Repeater Students 7914
Total 825468
3. Evaluation was held in 228 centres of all 34 educational districts from
10.04.2019 to 25.04.2019. And 58876 evaluators were deployed.
4. Students individual results can be viewed in the following Website
addresses. And also option has given to print Provisional Marks Statement.
Karnataka Secondary EducationExamination Board
http:/lkseeb.kar.nic. inc
f.
Bangalore Division 7t Mysore Division 50
Belagavi Division 63 Gulbarga Division 44
N ,T|l
l-a

5. SMS will be sent to the Student's Registered Mobile numbers on 30.04.2019
afteuroon
6. Schools Consolidated Result Sheet ivill be downloaded in School Login ofKSEEB website i.e http:/&seeb.kar.nic.in on 30.04.2019 and results will be
announced in all High Schools on the same day.
7. Particulars regarding exam results.
Table 7(1)Over All results
Year Appeared Passed Percentage
2018-t9 825468 608336 73.70
20t7-r8 838088 602802 7 t.93
T*te7(2)School Type Wise R.esults ( Regular Fresh Students Only)
sl.No
Type Of School No. OfSchools
Appeared Passed Percentage
1 Govt 5202 278544 2t6844 77.84
2 Aided 3243 200888 1551 I 1 77.21
J Unaided 6002 259137 2t4360 82.72
Total 14447 738s69 5863 15 79.38
3
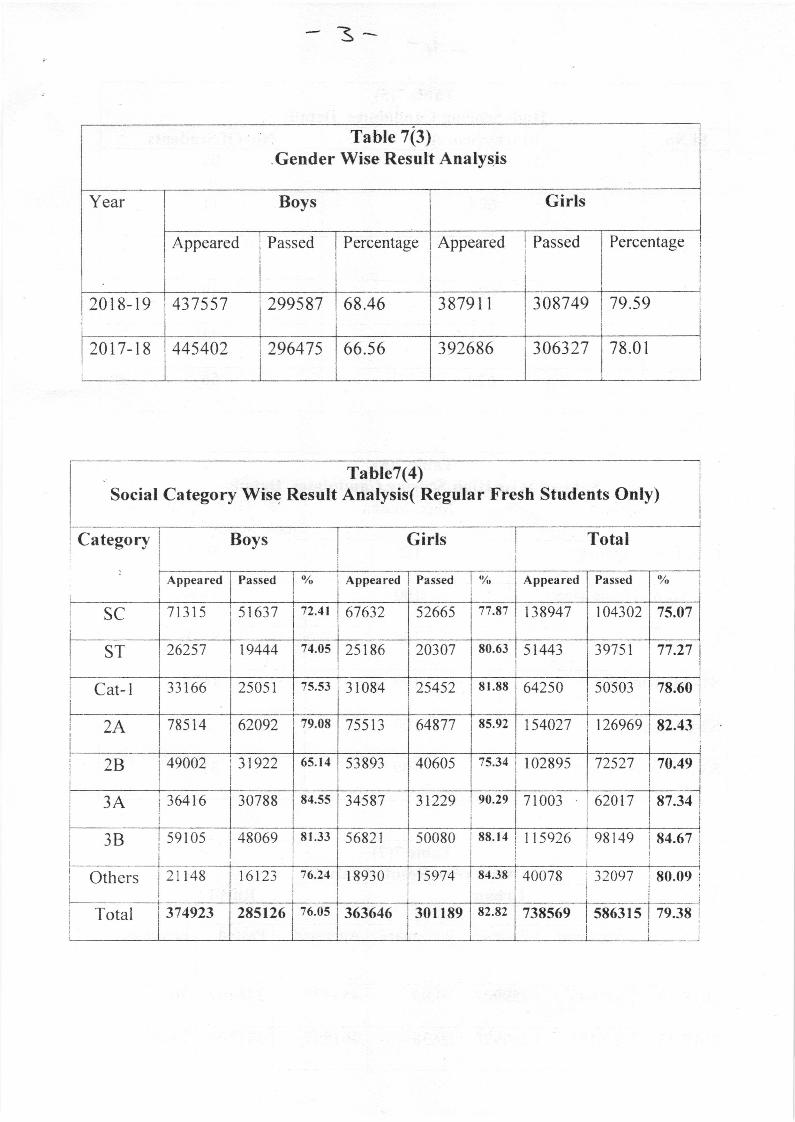
Table 7(3)Gender Wise Result Analysis
Year Boys Girls
Appeared Passed Percentage Appeared I Passed Percentage
2018-19 437 557 299587 68.46 3879 I l 3087 49 79.59
2A17-18 445402 296475 66.56 392686 306327 78.01
Table?(4)Social Category Wise Result Analysis( Regular Fresh Students Only)
Boys Girls Total
Appeared Passed " Appeared Passed lt//o Appeared Passed
SC I t3t5 51637 12.4t 61632 52665 77.87 138947 r 04302 75.07
ST 26257 19444 74.05 25186 20307 80.63 51443 39151 77.27
Cat- I 33166 2505 1 75.53 31084 25452 81.88 642s4 s0503
2A 78514 62092 79.08 755t3 64877 85.92 154027 I 26969 iI
I
82.13
2B 49002 3 I 922 65.1 4 s3893 40605 zs.s+ | 102895I
I
72527 70.49
36416 30788 84.55 34587 31229 90.29 71003 62017 87.34
3B 591 05 48069 8 r.33 s6821 s0080 88. I 4II
II
I I 5 926 98 49
Others 21148 16123 76.24 I 8930 1 5974 84.3tt
Total 314923 285126 76.05 363646 301 189 E2.E2 738569 s863r 5
Category
3A
t//o
78.60
114.67
40078 32097 80.09
79.38
II
I
i
II
I
I I
I

L+
J
" Table 7(5)High Scoring Candidates Details
Sl.No No. Of StudentsI 625 02
2 624 11
623 t9
4 622 39
5 621 43
6 620 56
Table 7(6)Subiect Wise Hieh Scoring Candidates Details
Subject Max. Marks No. Of Students Whohave Scored Max. Marks
Ll - First Language t'25 8624
L2- Second Language 100 3404
L3- Third Language 100 8 138
S 1- Mathematics 100 1626
S2-Science 100 226
53- Social Science 100 3l4l
Table 7(7)Area Wise Result Analysis
Year Urban Rural
Appeared Passed Percentage Appeared Passed Percentage
2018-19 371445 259927 70.05 454423 348409 76.67
2At7-18 376191 260998 69.38 461897 341844 74.00
'Marks Scored

;-
. Table 7(8)Medium Wise Result Analysis
Sl.No Medium 2A19 2f,18
Appeared Passed Percentage Appeared Passed Percentage
I Kannada 493 l 00 346103 70.t9 510949 343999 67.33
2 English 294836 23847r 80.88 288202 234499 81.23
3 IJrdu 24983 14958 79.87 25465 57.29
4 Marathi I 1956 8473 70.87 12773 9689 7 5.86
5 Telugu 303 185 61.06 343 224 65.31
6 Tamil 122 64 52.46 171 85 49.71
7 Hindi 168 82 48.81 185 tt7 63.24
Total 825468 608336 73.70 838088 602802 71.93
Table 7(9)Grade Wise Result Analysis - CCERF Students
Grade 2019 2018
No. OfStudents
Percentage No. OfStudents
Percentage
A* 351 l8 4.25 33046 4.44
A 1093 16 13.24 107045 14.38
B* I 5400 I 18.65 ts1928 24.41
B r62892 t9.73 1 606 l3 21.57
G* 107t65 12.98 109509 t4.71
G 17823 2.15 19376 2.60
i
l 4589

(
- Table.T(10)l00o/o and 7*ro Pergentage Results
Type OfSchool
l00o/o Zero Percentage
2018-19 2017-18 2018-19 20tt-18
Govt. 593 t02 0 06
Aided 130 414 09 02
Unaided 903 826 37 35
Total 1626 1342 46 43
Table 7(ll)Private Candidates Age wise Results Analysis - CCEPF
Age Appeared Passed Percentage
15 To 20 Years rt949 481 4.03
2l To 25 Years 3965 91. 2.29
26 To 30 Years nsa 4l r.74
31 To 35 Years t76t 27 1.53
36 To 40 Years e04 t2 1.32
4l To 45 Years 3t4 05 1.59
46 To 50 Years ll0 0 0
Above 50 Years 28 0 0
Total 21381 657 3.07

1-
Differentty Abred t#::[ lt3],, Anarysis - ccERF
Disability Appeared Passed Percentage
MentallyChallenged
320 130 40.63
VisuallyImpaired
379 332 87.60
HearingImpaired
775 504 6s.03
MultipleDisorder
53 30 56.60
OtherAilment
766 507 66.r9
PhysicallyChallenged
857 594 69.31
MultipleDisability
0l 01 100
SpecificLearningDisability
532 396 74.44
?.t&-gl 3683 2494 67.71
34.04.2019
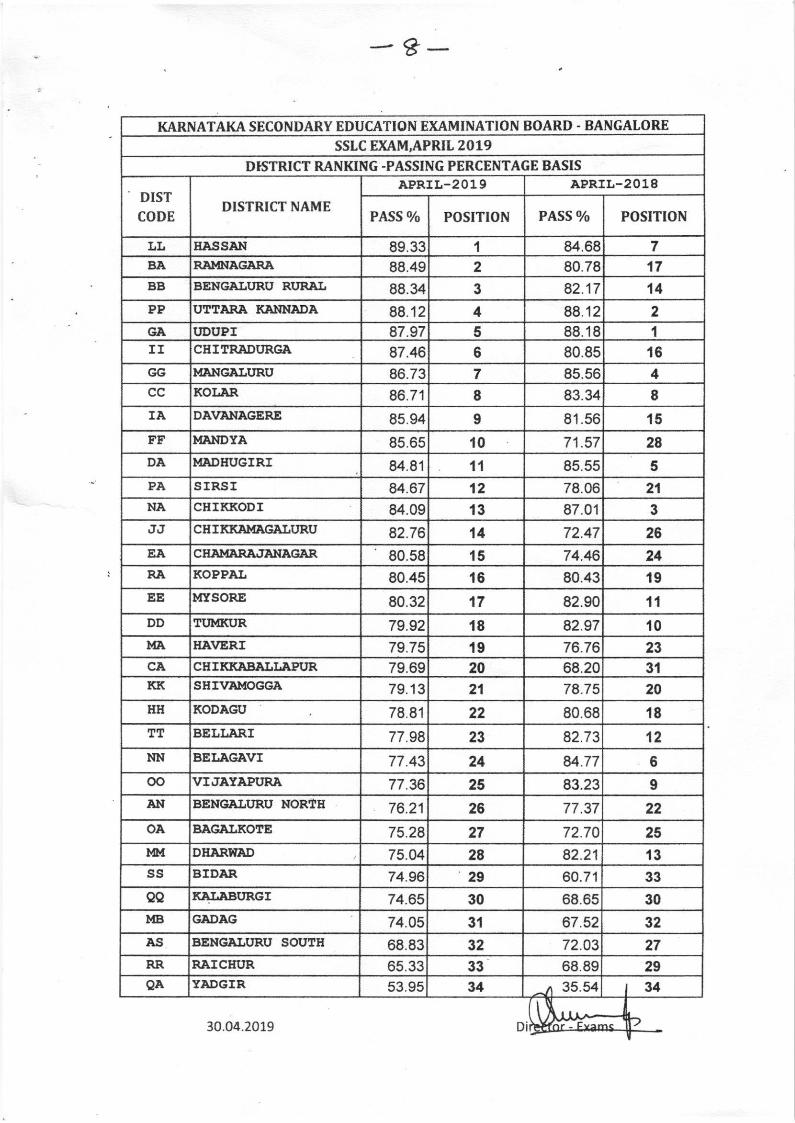
KARNATAKA SECONDARY EDUCATION EXAMINATION BOARD - BANGALORE
SSLC EXAM,APRIL 2019D}STRICT RANKING -PASSING PERCENTAGE BASTS
APRIL-2018APRIL-2019
POSITION PASS Yo POSITIONDISTCODE
DISTRICT NAMEPASS %
84.68 7Lt HASSAN 89.33 1
2 80.78 17BA R,AMNAGARA 88.49
82.17 't4BB BENGAII'RU RI'R,AI, 88.34 3
PP UTTAR]A KN{NADA 88. 12 4 88.12 2
88.18 1GA UDUPI 87.97 5II CHITR,ADURGA 87.46 6 80.85 16GG MANGAI,URU 86.73 7 85.56 4cc KOI.AR 86.71 I 83.34 8IA 85.94 I 81.56 15
FF MANDYA 85 65 10 71.57DA MADHI'GIRI 84.81 11 85.55 5
PA S IRSI 84.67 12 78.06 21
NA CHIKKOD I 84.09 13 87.01 3
JJ CHIKICAIB.GAIIJRU 82.76 14 72.47 26EA CHAMAR,A,'ANAGAR 80.58 15 74.46 24RA KOPPAI 80.45 16 80.43 19EE MYSORE 80.32 17 82.90 11
DD TI'MKUR 79.92 l8 82.97 10MA }IAVERI 79.75 19 76.76 23CA CHIKKABAI,I,APUR 79.69 20 68.20 31KK SHMIr{OGGA 79.13 21 78.75 20HH KODAGU 78.81 22 80.68 18TT BELLARI 77.98 23 82.73 12
BEI.AGAVI 77.43 84.77 6
oo \,I;IAYAPI'R.A 77.36 25 83.23 9AN BENGAI.T'RU NORTII 76.21 77.37 22
OA BAGA],KOTE 75.28 27 72.70 25MM DHARWAD 75.04 28 82.21 t3ss BIDAR 74.96 29 60.7'l 33
aa KAI.ABURGI 74.65 30 68.65 30MB GADAG 74.05 31 67.52 32AS BENGAIJURU SOUTH 68.83 32 72.O3 27RR P"AI CIIUR 65.33 33 68.89 299A YADGIR 53.95 34 11 35.54 134
30.04.2019 Di
-g-
DAVANAGERE
28
NN 24
26

au)KARNATAKA SECONDARY EDUCATION EXAMINATION BOARD . BANGALORE
SSLC EXAM,APRIL 2019.DISTRICT RANKING.QUALITY RESULT BASIS
APBIL-2019 APRIL-2018
PASS % POSITIONDISTRICT NAME AVG
WETG
HTAGE
POSITION
DISTCODE
84.68 7LL HASSAN 81.88 1
179.21 2 88.18GA UDUPI
78.78 3 82.17 14BB BENGALURU RURAL
4 88.12 2PP UTTARA KANNADA 77.41
85.56 4MANGATURU 76,94 5GG
b 80.85 16I CHITRADURGA 76.14
83.34 Icc KOLAR 75.95 7
FF MANDYA 75.79 I 71.57
80.78 17BA RAMNAGARA 75.61 I21srRsr 75.44 l0 78.06PA
75.37 't1 81.56 l5IA DAVANAGERE
12 85.55 5DA MADHUG IRI 75.20
JJ CHIKKAMAGALURU 74.94 13 72.47 26
CHIKKODI 74.24 't4 87.01 3NA
{9RA KOPPAL 71.67 15 80.43
71.32 16 42.97 10DD TUMKUR
76.76 23MA HAVERI 70.57 17
EE MYSORE 70.23 18 82.90 11
CA CHIKKABATLAPUR 70.1 I 19 68 20 31
69.74 20 78.75 20KK SHIVAMOGGA
AN EENGALURU NORTH 69.51 21 77 37 22
HH 69.16 22 80.68KODAG U
68.54 23 74.46 24
TT BELLARI 68.07 24 82.73 12
NN BELAGAVI 67.94 25 84.77 6
oo VIJAYAPURA 67.61 26 83 23 9
S5 BIDAR 65.94 27 60.7'r
OA EAGALKOTE 65.88 28 72.70 25
aa KALABURGI 65.82 29 68.65 30
MB GADAG 65.66 30 67 52
DHARWAD 64.97 31 82.21 13
AS BENGALURU SOUTH 62.22 32 72.03 27
RR RAICHUR 59.21 33 68,89 29
QA YADGIR 50.00 34 n 35.54 134
30.04.2019 Di or- Exa
28
18
EA CHAMARAJANAGAR
33
32
Top Related