


Languages
Pages
Legal

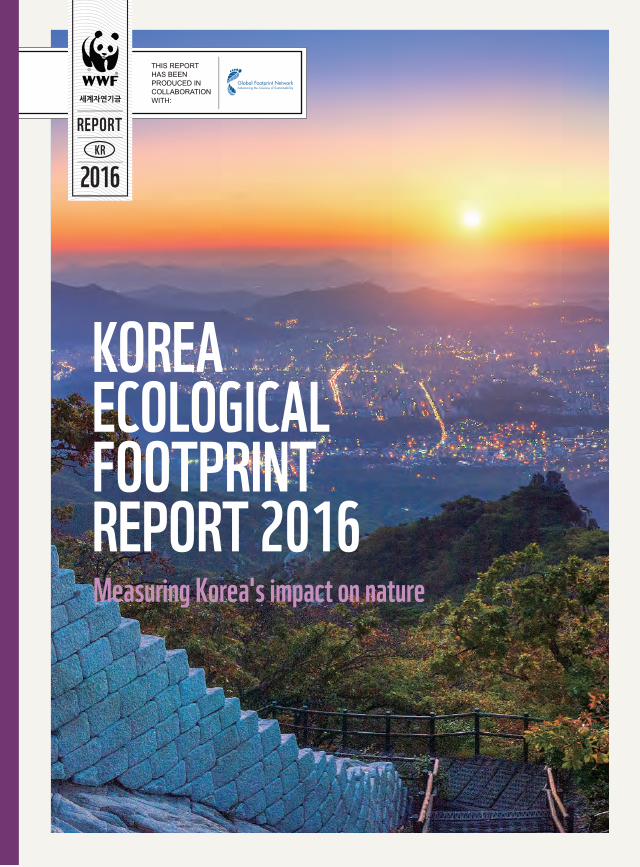
KOREAECOLOGICALFOOTPRINTREPORT 2016Measuring Korea's impact on nature
Korea Ecological Footprint Report 2016 3
CONTENTSForeword 2
Executive Summary 3
Measuring Humanity’s Impact on NatureBiocapacity 6
Ecological Footprint 8
Global hectares 11
The State of the PlanetWorld biocapacity and Ecological Footprint 14
Ecological creditors and debtors 16
Which countries are in the top 10? 18
How does our region compare? 20
Trends for our neighbouring countries 21
The Path to Sustainable Development Human development and biocapacity 24
GDP and the Ecological Footprint: Living well 26
within the means of nature
30
32
34
36
38
40
The State of KoreaHow much nature does Korea have? 1961 to
now Carbon Footprint: The biggest componentClimate change impacts
Time to phase out fossil fuels
Our trading partners are in deficit
Breaking down the Korean lifestyle
Consumption hotspots 42
One Planet LivingOne Planet Perspective 46
Choosing our future 48
References 50
WWF-KoreaWWF is one of the world’s largest and most experienced independent conservation organizations, with over 5 million supporters and a global network active in more than 100 countries. WWF’s mission is to stop the degradation of the planet’s natural environment and to build a future in which humans live in harmony with nature, by conserving the world’s biological diversity, ensuring that the use of renewable natural resources is sustainable, and promoting the reduction of pollution and wasteful consumption. In 2014, after 10 years of conservation work in Korea, WWF-Korea was launched in 2014, based in Seoul.
Global Footprint NetworkGlobal Footprint Network is a research organization that is changing how the world manages its natural resources and responds to climate change. Since 2003 we’ve engaged with more than 50 nations, 30 cities, and 70 global partners to deliver scientific insights that have driven high-impact policy and investment decisions. Together, we’re creating a future where all of us can thrive within our planet’s limits.
ContributorsWWF-Korea: HyeJin An, Alasdair Forman, Haeseung Sung Global Footprint Network: Amanda Diep, Krina Huang, Katsunori Iha, Ronna Kelly, David Lin, Jon Martindill, Sara Melziade, Mathis Wackernagel
Special thanks for review and support toJae C. Choe, Jill Forman, Christopher Hails, Hyojung Kim, Junghyun Kim, Seungwoo Lee, Jean-Paul Paddack, Olivia Sánchez Badini, Sung hwan Son
Design by Bestseller BananaFront cover photo: © Guitar photographer / Shutterstock.com
Publication detailsPublisher: Simon Yoon, CEO, WWF-KoreaPublished in June 2016 by WWF-Korea – World Wide Fund For Nature (Formerly World Wildlife Fund), Seoul, Republic of Korea (“WWF”)Please refer to “Korea Ecological Footprint Report 2016: Supplementary Technical Report” at wwfkorea.or.kr/footprint for the further questions.Any reproduction in full or in part of this publication must be in accordance with the rules below, and mention the title and credit the above mentioned publisher as the copyright owner.Recommended citation: WWF-Korea. 2016. Korea Ecological Footprint Report 2016: Measuring Korea's impact on nature© Text and graphics 2016 WWF-Korea All rights reserved.
Korea Ecological Footprint Report 2016 2
Korea Ecological Footprint Report 2016 2 Korea Ecological Footprint Report 2016 3
FOREWORD EXECUTIVE SUMMARYThis report explores how much nature we have and how much we use, in Korea and the world. It invites the Korean government, business sector and public to rethink the country’s roles and vulnerabilities in a world with increasing resource constraints and climate change threats. It encourages all to create strategies to help Korea overcome these imminent challenges.
The Ecological Footprint framework measures human demand for and the ecosystems’ supply of natural resources and services such as food, wood, cotton for clothing, space for cities and roads, and carbon dioxide sequestration. This demand is met both domestically and by distant locations around the world. Measuring Korea’s demand on nature helps us understand our past and where we need to head for a better future.
This report’s key findings include:• On average, Korean residents have an Ecological Footprint eight times
larger than what their country’s ecosystems can provide (biocapacity).• Fisheries are the largest component of Korea’s biocapacity.• The carbon Footprint makes up 73 per cent of Korea’s Ecological Footprint,
substantially larger than the world average of 60 per cent. Transitioning to renewable energy is one of the most powerful ways for Korea to reduce its greenhouse gas emissions and Ecological Footprint.
• Korea’s top trade partners are running ecological deficits (United States and Japan) or have high and growing Ecological Footprints (Australia, Canada and Russia).
• The top three “hotspots” within Korea’s Ecological Footprint are: food; personal transportation; and household energy use (electricity, gas and other fuels).
• Individuals can make several choices every day related to energy, food, water, wood and paper, and transportation that combined can make a large difference.
• The government and business sectors can employ innovative solutions to help contribute to a more sustainable Korea and world.
Resource security is becoming increasingly important for the world, and for Korea. As one of the most innovative countries, Korea is well positioned to build a resource-efficient economy that provides for a thriving society within the means of nature. WWF’s One Planet Perspective suggests a way to such a sustainable future.
Measuring Korea’s demand on nature helps us understand our past and where we need to head for a better future.
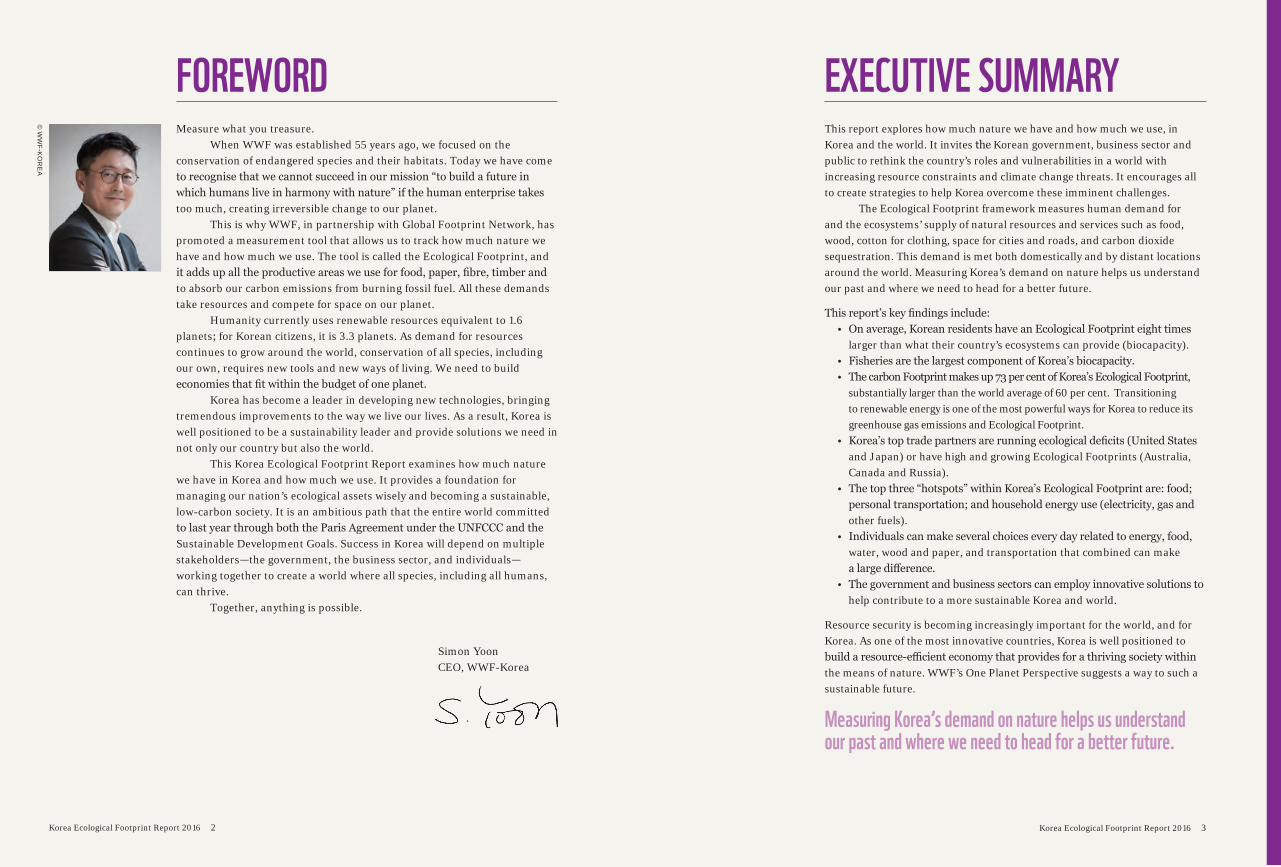
Measure what you treasure.When WWF was established 55 years ago, we focused on the
conservation of endangered species and their habitats. Today we have come to recognise that we cannot succeed in our mission “to build a future in which humans live in harmony with nature” if the human enterprise takes too much, creating irreversible change to our planet.
This is why WWF, in partnership with Global Footprint Network, has promoted a measurement tool that allows us to track how much nature we have and how much we use. The tool is called the Ecological Footprint, and it adds up all the productive areas we use for food, paper, fibre, timber and to absorb our carbon emissions from burning fossil fuel. All these demands take resources and compete for space on our planet.
Humanity currently uses renewable resources equivalent to 1.6 planets; for Korean citizens, it is 3.3 planets. As demand for resources continues to grow around the world, conservation of all species, including our own, requires new tools and new ways of living. We need to build economies that fit within the budget of one planet.
Korea has become a leader in developing new technologies, bringing tremendous improvements to the way we live our lives. As a result, Korea is well positioned to be a sustainability leader and provide solutions we need in not only our country but also the world.
This Korea Ecological Footprint Report examines how much nature we have in Korea and how much we use. It provides a foundation for managing our nation’s ecological assets wisely and becoming a sustainable, low-carbon society. It is an ambitious path that the entire world committed to last year through both the Paris Agreement under the UNFCCC and the Sustainable Development Goals. Success in Korea will depend on multiple stakeholders—the government, the business sector, and individuals— working together to create a world where all species, including all humans, can thrive.
Together, anything is possible.
© W
WF-K
OR
EA
Simon YoonCEO, WWF-Korea
Korea Ecological Footprint Report 2016 4 Korea Ecological Footprint Report 2016 5
© C
J Nattanai / S
hutterstock.com
CHAPTER 1:
MEASURING HUMANITY’SIMPACT ON NATUREHow much nature do we have and how much do we use?
Korea Ecological Footprint Report 2016 6 Korea Ecological Footprint Report 2016 7
BIOCAPACITYThe Republic of Korea has experienced rapid economic expansion over the past five decades. The country has grown to become the 13th largest economy in the world (World Bank, 2016b), while ranking as the 105th country in the world based on land area (World Bank, 2016a). This growth has brought tremendous improvements to the way Koreans live their lives.
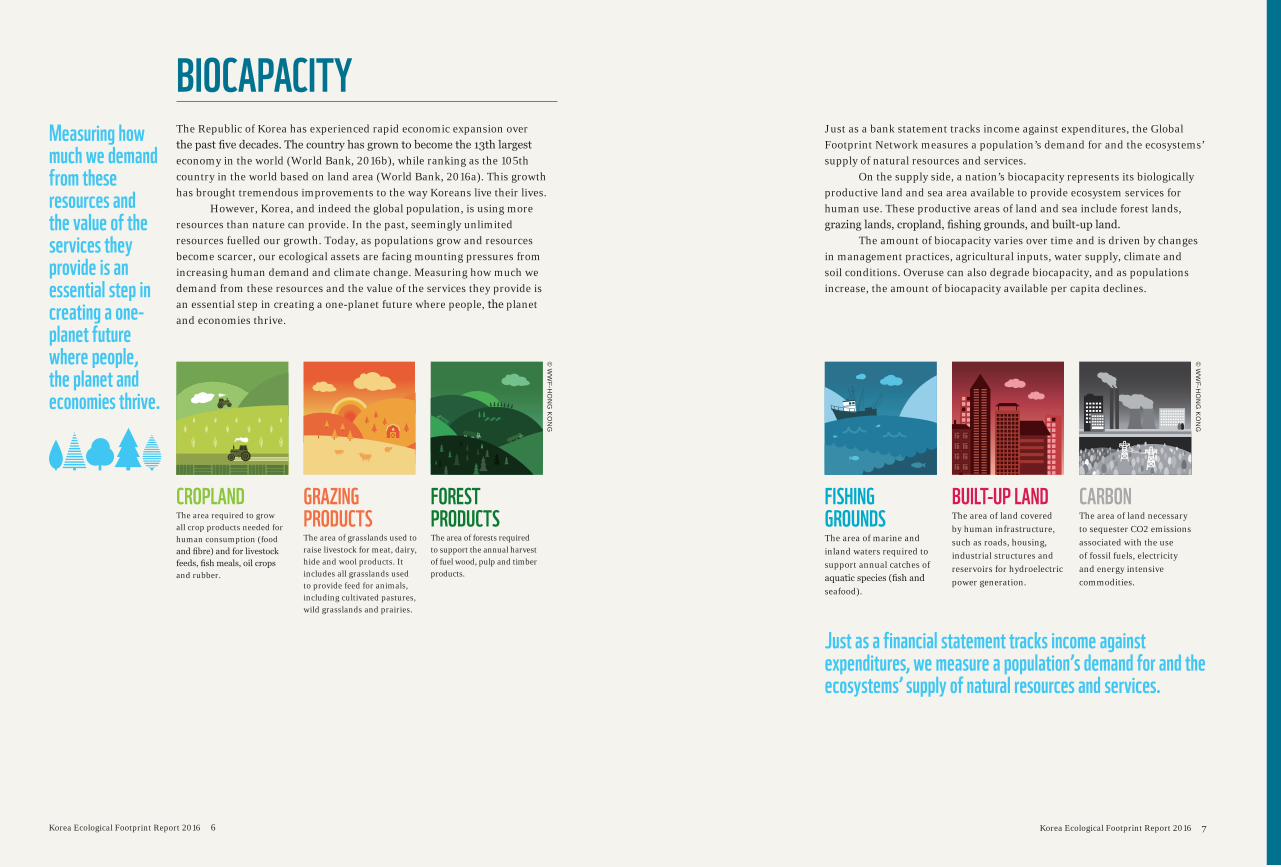
However, Korea, and indeed the global population, is using more resources than nature can provide. In the past, seemingly unlimited resources fuelled our growth. Today, as populations grow and resources become scarcer, our ecological assets are facing mounting pressures from increasing human demand and climate change. Measuring how much we demand from these resources and the value of the services they provide is an essential step in creating a one-planet future where people, the planet and economies thrive.
Just as a bank statement tracks income against expenditures, the Global Footprint Network measures a population’s demand for and the ecosystems’ supply of natural resources and services.
On the supply side, a nation’s biocapacity represents its biologically productive land and sea area available to provide ecosystem services for human use. These productive areas of land and sea include forest lands, grazing lands, cropland, fishing grounds, and built-up land.
The amount of biocapacity varies over time and is driven by changes in management practices, agricultural inputs, water supply, climate and soil conditions. Overuse can also degrade biocapacity, and as populations increase, the amount of biocapacity available per capita declines.
Just as a financial statement tracks income against expenditures, we measure a population’s demand for and the ecosystems’ supply of natural resources and services.
Measuring how much we demand from these resources and the value of the services they provide is an essential step in creating a one-planet future where people, the planet and economies thrive.
CROPLANDThe area required to grow all crop products needed for human consumption (food and fibre) and for livestock feeds, fish meals, oil crops and rubber.
GRAZING PRODUCTSThe area of grasslands used to raise livestock for meat, dairy, hide and wool products. It includes all grasslands used to provide feed for animals, including cultivated pastures, wild grasslands and prairies.
FOREST PRODUCTSThe area of forests required to support the annual harvest of fuel wood, pulp and timber products.
© W
WF-H
ON
G K
ON
G
FISHING GROUNDSThe area of marine and inland waters required to support annual catches of aquatic species (fish and seafood).
BUILT-UP LANDThe area of land covered by human infrastructure, such as roads, housing, industrial structures and reservoirs for hydroelectric power generation.
CARBONThe area of land necessary to sequester CO2 emissions associated with the use of fossil fuels, electricity and energy intensive commodities.
© W
WF-H
ON
G K
ON
G
Korea Ecological Footprint Report 2016 8 Korea Ecological Footprint Report 2016 9
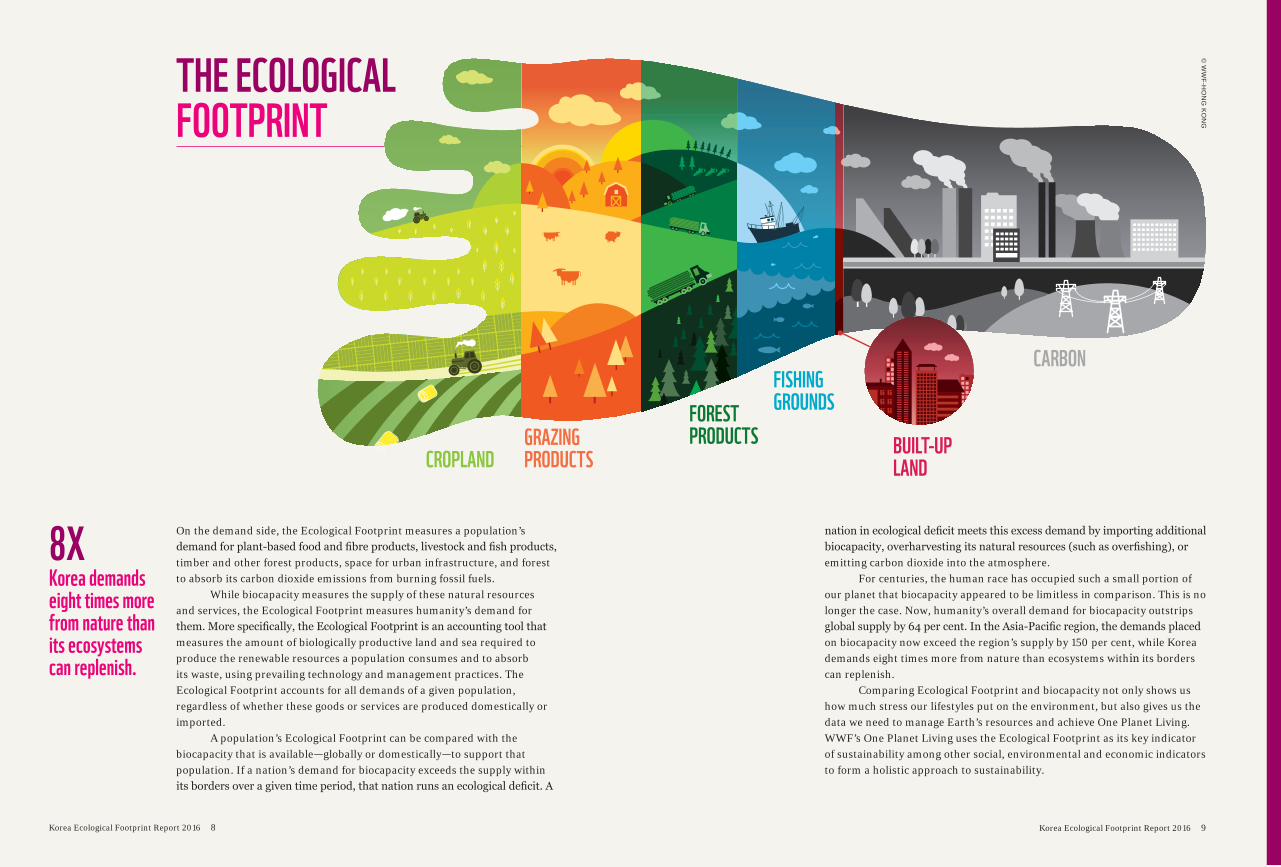
On the demand side, the Ecological Footprint measures a population’s demand for plant-based food and fibre products, livestock and fish products, timber and other forest products, space for urban infrastructure, and forest to absorb its carbon dioxide emissions from burning fossil fuels.
While biocapacity measures the supply of these natural resources and services, the Ecological Footprint measures humanity’s demand for them. More specifically, the Ecological Footprint is an accounting tool that measures the amount of biologically productive land and sea required to produce the renewable resources a population consumes and to absorb its waste, using prevailing technology and management practices. The Ecological Footprint accounts for all demands of a given population, regardless of whether these goods or services are produced domestically or imported.
A population’s Ecological Footprint can be compared with the biocapacity that is available—globally or domestically—to support that population. If a nation’s demand for biocapacity exceeds the supply within its borders over a given time period, that nation runs an ecological deficit. A
nation in ecological deficit meets this excess demand by importing additional biocapacity, overharvesting its natural resources (such as overfishing), or emitting carbon dioxide into the atmosphere.
For centuries, the human race has occupied such a small portion of our planet that biocapacity appeared to be limitless in comparison. This is no longer the case. Now, humanity’s overall demand for biocapacity outstrips global supply by 64 per cent. In the Asia-Pacific region, the demands placed on biocapacity now exceed the region’s supply by 150 per cent, while Korea demands eight times more from nature than ecosystems within its borders can replenish.
Comparing Ecological Footprint and biocapacity not only shows us how much stress our lifestyles put on the environment, but also gives us the data we need to manage Earth’s resources and achieve One Planet Living. WWF’s One Planet Living uses the Ecological Footprint as its key indicator of sustainability among other social, environmental and economic indicators to form a holistic approach to sustainability.
THE ECOLOGICAL FOOTPRINT
GRAZING PRODUCTS BUILT-UP
LAND
CARBON
FOREST PRODUCTS
FISHING GROUNDS
CROPLAND
© W
WF-H
ON
G K
ON
G
8XKorea demands eight times more from nature than its ecosystems can replenish.
Korea Ecological Footprint Report 2016 10 Korea Ecological Footprint Report 2016 11
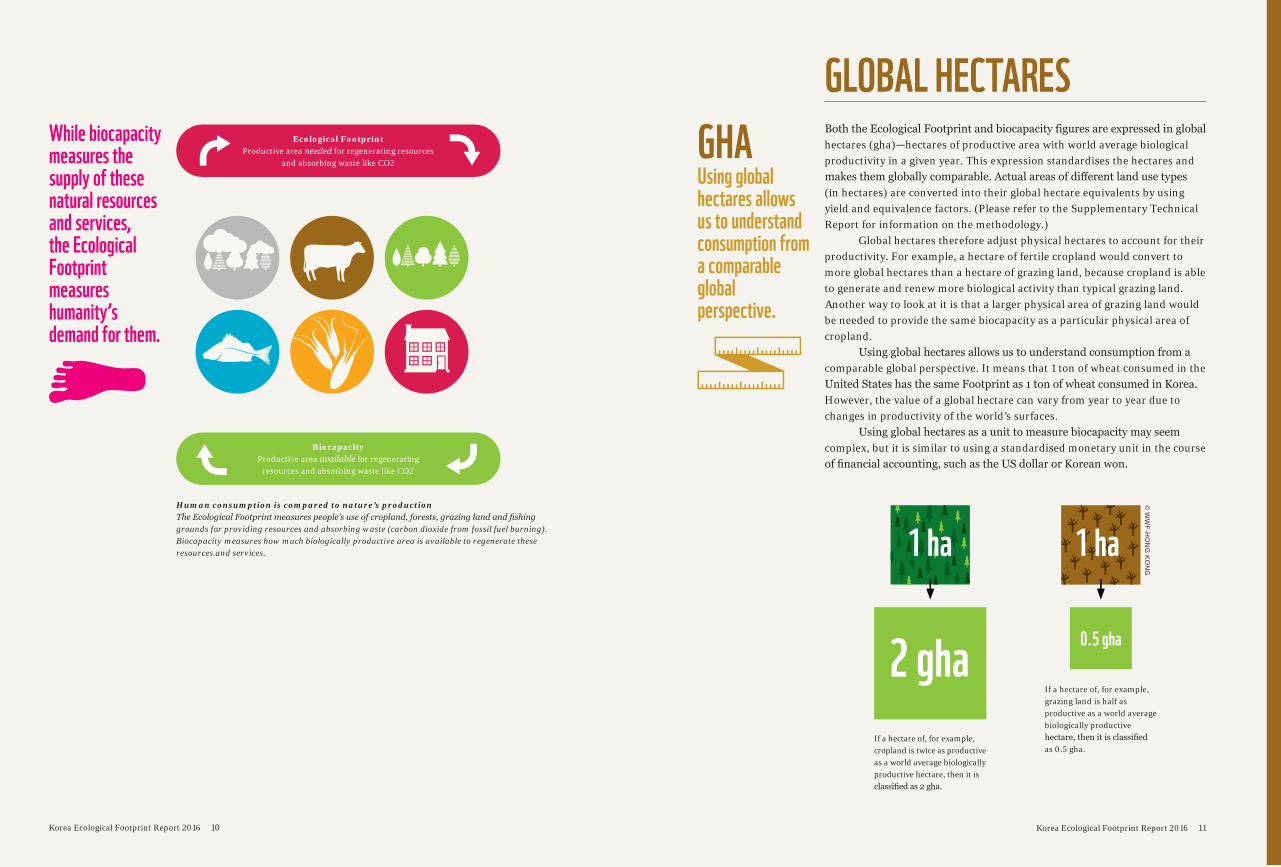
Human consumption is compared to nature’s productionThe Ecological Footprint measures people’s use of cropland, forests, grazing land and fishing grounds for providing resources and absorbing waste (carbon dioxide from fossil fuel burning). Biocapacity measures how much biologically productive area is available to regenerate these resources and services.
Ecological FootprintProductive area needed for regenerating resources
and absorbing waste like CO2
BiocapacityProductive area available for regenerating
resources and absorbing waste like CO2
Both the Ecological Footprint and biocapacity figures are expressed in global hectares (gha)—hectares of productive area with world average biological productivity in a given year. This expression standardises the hectares and makes them globally comparable. Actual areas of different land use types (in hectares) are converted into their global hectare equivalents by using yield and equivalence factors. (Please refer to the Supplementary Technical Report for information on the methodology.)
Global hectares therefore adjust physical hectares to account for their productivity. For example, a hectare of fertile cropland would convert to more global hectares than a hectare of grazing land, because cropland is able to generate and renew more biological activity than typical grazing land. Another way to look at it is that a larger physical area of grazing land would be needed to provide the same biocapacity as a particular physical area of cropland.
Using global hectares allows us to understand consumption from a comparable global perspective. It means that 1 ton of wheat consumed in the United States has the same Footprint as 1 ton of wheat consumed in Korea. However, the value of a global hectare can vary from year to year due to changes in productivity of the world’s surfaces.
Using global hectares as a unit to measure biocapacity may seem complex, but it is similar to using a standardised monetary unit in the course of financial accounting, such as the US dollar or Korean won.
GLOBAL HECTARESWhile biocapacity measures the supply of these natural resources and services, the Ecological Footprint measures humanity’s demand for them.
If a hectare of, for example, cropland is twice as productive as a world average biologically productive hectare, then it is classified as 2 gha.
1 ha
2 ghaIf a hectare of, for example, grazing land is half as productive as a world average biologically productive hectare, then it is classified as 0.5 gha.
© W
WF-H
ON
G K
ON
G
GHAUsing global hectares allows us to understand consumption from a comparable global perspective.
0.5 gha
1 ha
© A
ndrew Kerr / W
WF-C
anon ©
NA
SA
CHAPTER 2:
THE STATE OF THE PLANETCan the world’s ecological assets meet humanity’s demand?

Korea Ecological Footprint Report 2016 14 Korea Ecological Footprint Report 2016 15
Until the 1970s, the Earth was able to generate more natural resources and services than humanity consumed in a single year. In fact, the world’s total biocapacity has increased slightly since 1961 due to improved efficiencies in agricultural practices. However, population expansion has required ecological resources and services to be shared among an increasing number of people.
For nearly half a century, humanity has been in ecological “overshoot,” which means the demand for our planet’s resources and services has exceeded what Earth can regenerate. Global ecological overshoot translates into the liquidation of natural assets and ever-tightening resource constraints, ultimately resulting in greater economic risk.
The consequences of being in overshoot include depleted fisheries, deforestation, biodiversity loss and climate change. In just four decades, vertebrate wildlife populations have declined, on average, by more than 50 per cent, as measured by the Living Planet Index in WWF’s biennial Living Planet Report. This is why WWF focuses its efforts on biodiversity and the Ecological Footprint to help stop the degradation of our planet’s natural environment and build a future in which all species live in harmony with nature.
The carbon Footprint is the most rapidly growing component of the global Ecological Footprint, and is nearly three times larger than it was in 1961. Reducing humanity’s carbon Footprint is the most essential step we can take to reduce overshoot and achieve One Planet Living.
EARTH OVERSHOOT DAYEarth Overshoot Day marks the date in a given year when humanity’s demand on nature exceeds what Earth can regenerate in that entire year. We maintain this deficit by liquidating stocks of ecological resources and accumulating waste, primarily carbon dioxide in the atmosphere. Earth Overshoot Day has moved from early October in 2000 to August 8 in 2016.
Figure 1: World total biocapacity and Ecological Footprint
WORLD BIOCAPACITY AND ECOLOGICAL FOOTPRINT
For nearly half a century, humanity has been in ecological “overshoot,” which means the demand for our planet’s resources and services has exceeded what Earth can regenerate.
Key
Ecological Footprint Biocapacity
Glo
bal H
ecta
res
(bill
ions
)
25
0
5
10
15
20
1961 201219951978
Figure 2: World total Ecological Footprint by land type
Key
CarbonFishing grounds
CroplandBuilt-up landForest ProductsGrazing products
Glo
bal H
ecta
res
(bill
ions
)
25
0
5
10
15
20
1961
1966
1971
1976
1981
1986
1991
1996
2001
2006
2012
Korea Ecological Footprint Report 2016 16 Korea Ecological Footprint Report 2016 17
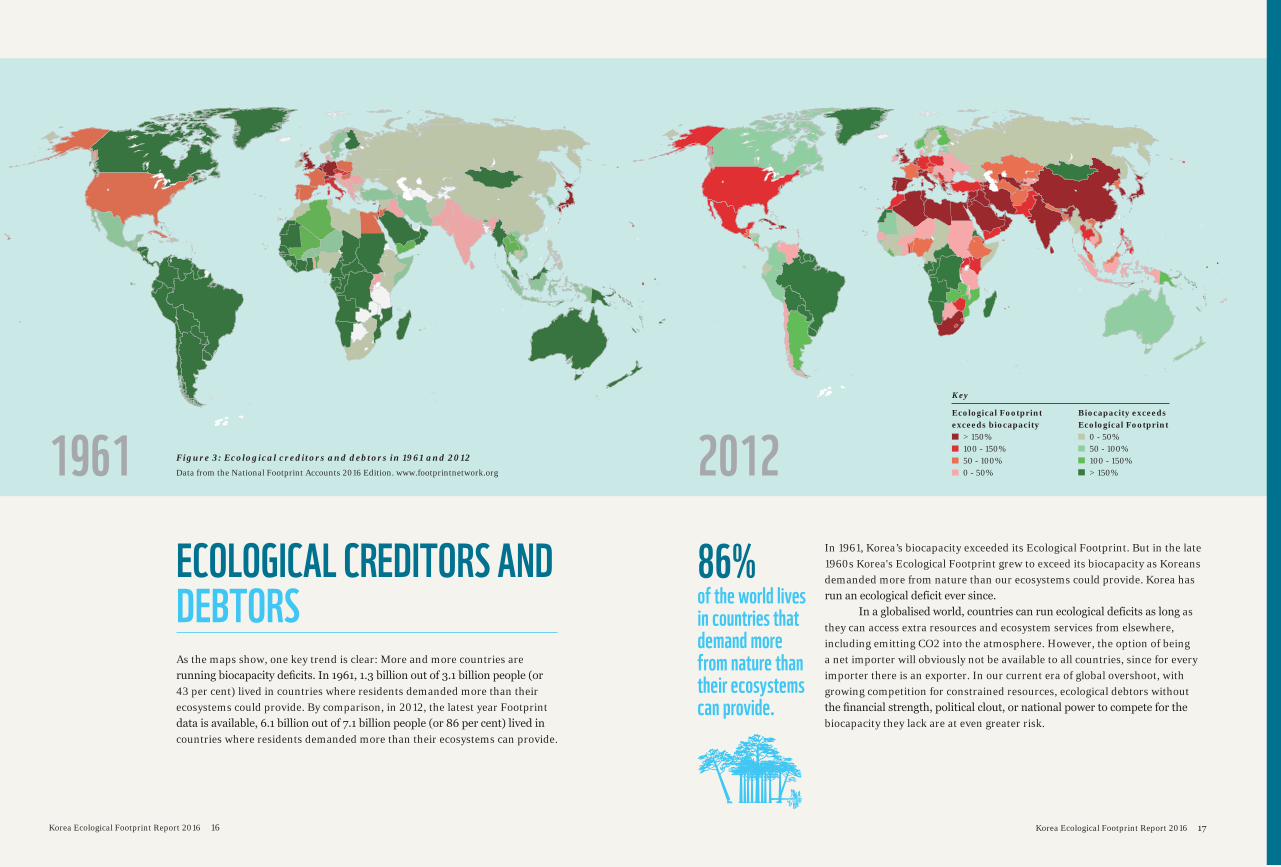
In 1961, Korea’s biocapacity exceeded its Ecological Footprint. But in the late 1960s Korea's Ecological Footprint grew to exceed its biocapacity as Koreans demanded more from nature than our ecosystems could provide. Korea has run an ecological deficit ever since.
In a globalised world, countries can run ecological deficits as long as they can access extra resources and ecosystem services from elsewhere, including emitting CO2 into the atmosphere. However, the option of being a net importer will obviously not be available to all countries, since for every importer there is an exporter. In our current era of global overshoot, with growing competition for constrained resources, ecological debtors without the financial strength, political clout, or national power to compete for the biocapacity they lack are at even greater risk.
As the maps show, one key trend is clear: More and more countries are running biocapacity deficits. In 1961, 1.3 billion out of 3.1 billion people (or 43 per cent) lived in countries where residents demanded more than their ecosystems could provide. By comparison, in 2012, the latest year Footprint data is available, 6.1 billion out of 7.1 billion people (or 86 per cent) lived in countries where residents demanded more than their ecosystems can provide.
86%of the world lives in countries that demand more from nature than their ecosystems can provide.
ECOLOGICAL CREDITORS AND DEBTORS
1961 2012Data from the National Footprint Accounts 2016 Edition. www.footprintnetwork.org
Figure 3: Ecological creditors and debtors in 1961 and 2012
Key
Ecological Footprintexceeds biocapacity
> 150%100 - 150%50 - 100%0 - 50%
Biocapacity exceedsEcological Footprint
0 - 50%50 - 100%100 - 150%> 150%
Korea Ecological Footprint Report 2016 18 Korea Ecological Footprint Report 2016 19
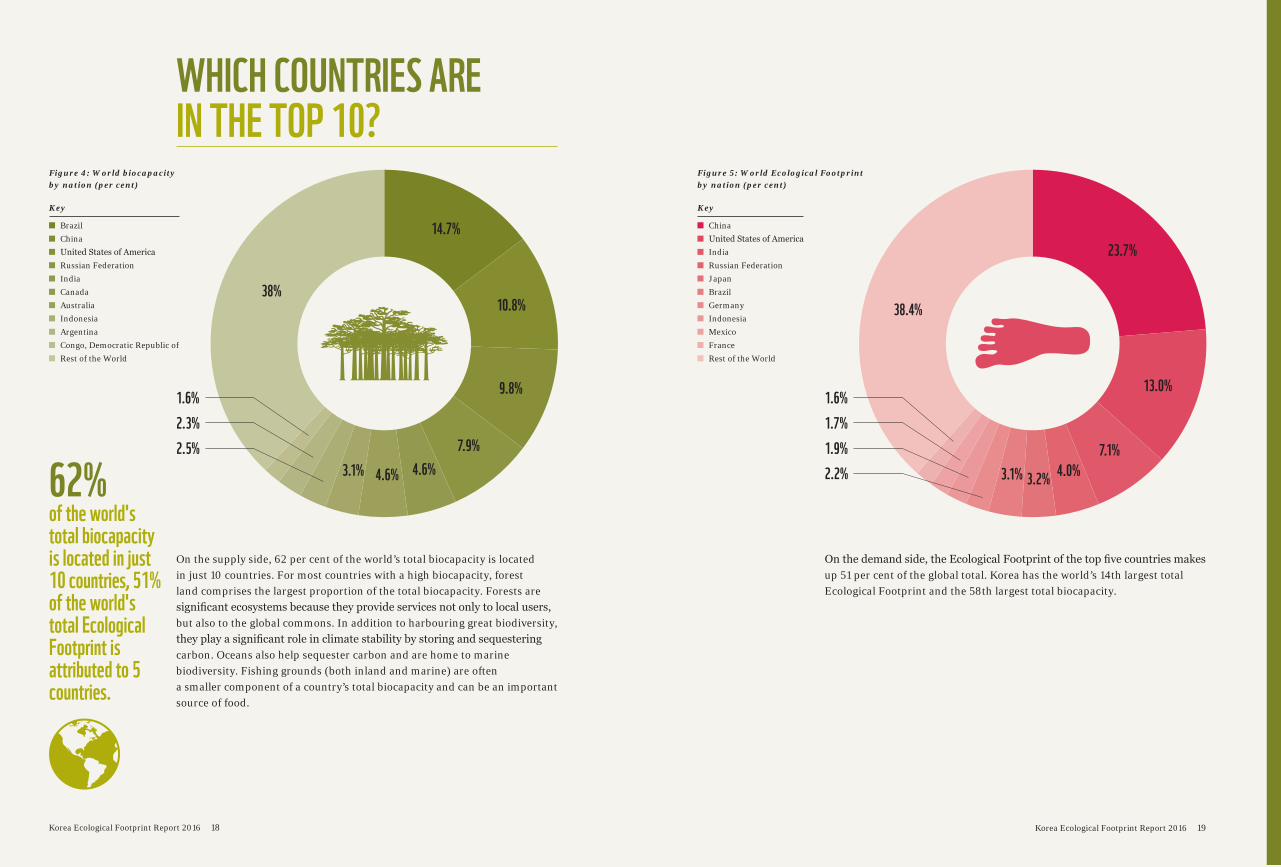
WHICH COUNTRIES ARE IN THE TOP 10?
On the demand side, the Ecological Footprint of the top five countries makes up 51 per cent of the global total. Korea has the world’s 14th largest total Ecological Footprint and the 58th largest total biocapacity.
Figure 5: World Ecological Footprintby nation (per cent)
Figure 4: World biocapacityby nation (per cent)
On the supply side, 62 per cent of the world’s total biocapacity is located in just 10 countries. For most countries with a high biocapacity, forest land comprises the largest proportion of the total biocapacity. Forests are significant ecosystems because they provide services not only to local users, but also to the global commons. In addition to harbouring great biodiversity, they play a significant role in climate stability by storing and sequestering carbon. Oceans also help sequester carbon and are home to marine biodiversity. Fishing grounds (both inland and marine) are often a smaller component of a country’s total biocapacity and can be an important source of food.
62%of the world's total biocapacity is located in just 10 countries, 51% of the world's total Ecological Footprint is attributed to 5 countries.
Key
Brazil China United States of America Russian Federation India Canada Australia Indonesia Argentina Congo, Democratic Republic of Rest of the World
Key
China United States of America India Russian Federation Japan Brazil Germany Indonesia Mexico France Rest of the World
38%
3.1% 4.6% 4.6%7.9%
9.8%
10.8%
14.7%23.7%
3.1% 3.2% 4.0%7.1%
13.0%
38.4%
1.6%2.3%2.5%
1.6%1.7%1.9%2.2%
Korea Ecological Footprint Report 2016 20 Korea Ecological Footprint Report 2016 21
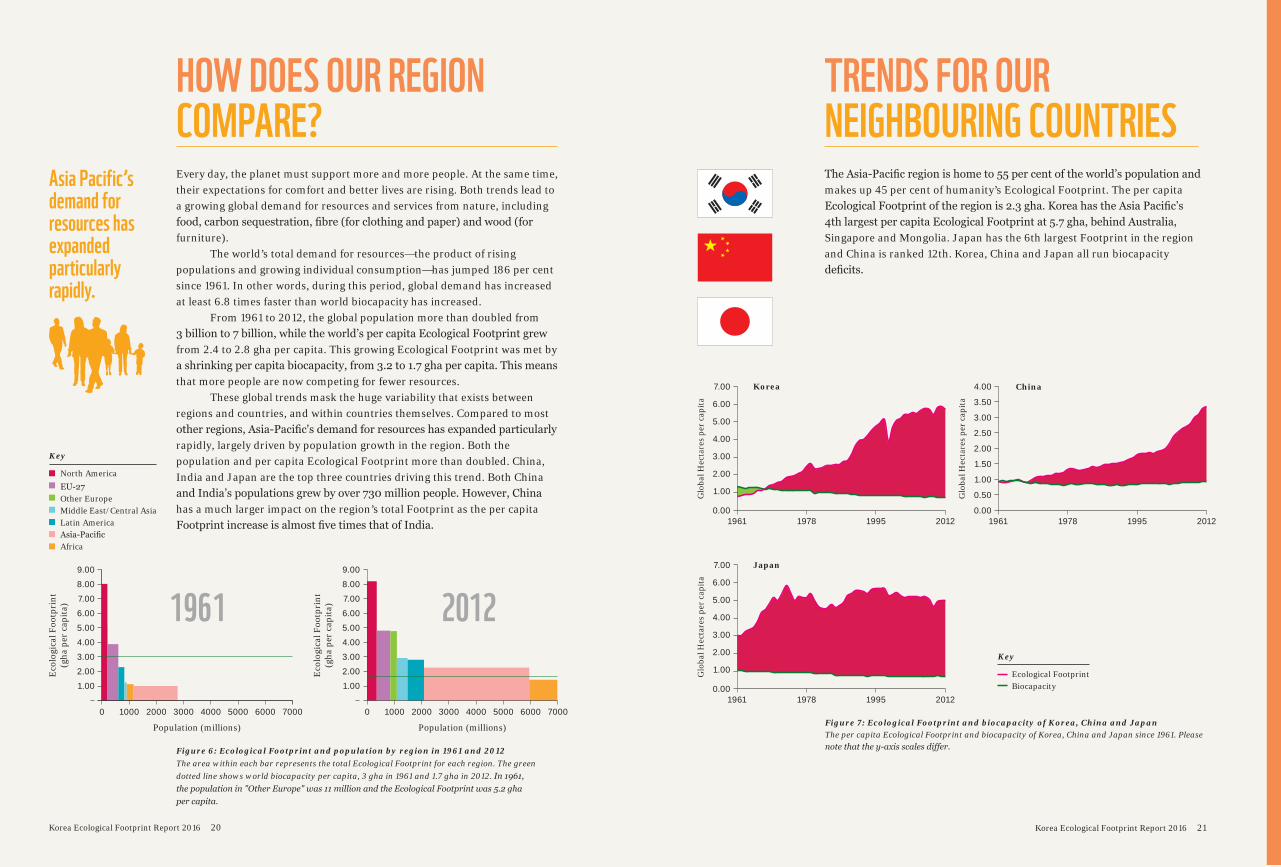
HOW DOES OUR REGION COMPARE?
TRENDS FOR OUR NEIGHBOURING COUNTRIES
Every day, the planet must support more and more people. At the same time, their expectations for comfort and better lives are rising. Both trends lead to a growing global demand for resources and services from nature, including food, carbon sequestration, fibre (for clothing and paper) and wood (for furniture).
The world’s total demand for resources—the product of rising populations and growing individual consumption—has jumped 186 per cent since 1961. In other words, during this period, global demand has increased at least 6.8 times faster than world biocapacity has increased.
From 1961 to 2012, the global population more than doubled from 3 billion to 7 billion, while the world’s per capita Ecological Footprint grew from 2.4 to 2.8 gha per capita. This growing Ecological Footprint was met by a shrinking per capita biocapacity, from 3.2 to 1.7 gha per capita. This means that more people are now competing for fewer resources.
These global trends mask the huge variability that exists between regions and countries, and within countries themselves. Compared to most other regions, Asia-Pacific's demand for resources has expanded particularly rapidly, largely driven by population growth in the region. Both the population and per capita Ecological Footprint more than doubled. China, India and Japan are the top three countries driving this trend. Both China and India’s populations grew by over 730 million people. However, China has a much larger impact on the region’s total Footprint as the per capita Footprint increase is almost five times that of India.
Asia Pacific’s demand for resources has expanded particularly rapidly.
The Asia-Pacific region is home to 55 per cent of the world’s population and makes up 45 per cent of humanity’s Ecological Footprint. The per capita Ecological Footprint of the region is 2.3 gha. Korea has the Asia Pacific’s 4th largest per capita Ecological Footprint at 5.7 gha, behind Australia, Singapore and Mongolia. Japan has the 6th largest Footprint in the region and China is ranked 12th. Korea, China and Japan all run biocapacity deficits.
Key
North AmericaEU-27Other EuropeMiddle East/Central AsiaLatin AmericaAsia-Pacific
Africa
Population (millions)
Eco
logi
cal F
ootp
rint
(gha
per
cap
ita) 2012
9.008.007.006.005.004.003.002.001.00
0 1000 2000 3000 4000 5000 6000 7000
Eco
logi
cal F
ootp
rint
(gha
per
cap
ita)
Population (millions)
19619.008.007.006.005.004.003.002.001.00
0 1000 2000 3000 4000 5000 6000 7000
Korea7.00
6.00
5.00
4.00
3.00
2.00
1.00
0.001961 1978 1995 2012
Glo
bal H
ecta
res
per
capi
ta
Figure 7: Ecological Footprint and biocapacity of Korea, China and JapanThe per capita Ecological Footprint and biocapacity of Korea, China and Japan since 1961. Please note that the y-axis scales differ.
Key
Ecological Footprint Biocapacity
Japan7.00
6.00
5.00
4.00
3.00
2.00
1.00
0.001961 1978 1995 2012
Glo
bal H
ecta
res
per
capi
ta
China
Glo
bal H
ecta
res
per
capi
ta
4.00
3.50
3.00
2.50
1.50
2.00
1.00
0.50
0.001961 1978 1995 2012
Figure 6: Ecological Footprint and population by region in 1961 and 2012 The area within each bar represents the total Ecological Footprint for each region. The green dotted line shows world biocapacity per capita, 3 gha in 1961 and 1.7 gha in 2012. In 1961, the population in "Other Europe" was 11 million and the Ecological Footprint was 5.2 gha per capita.
© A
ndrew Kerr / W
WF-C
anon ©
JIPE
N / S
hutterstock.com
CHAPTER 3:
THE PATH TO SUSTAINABLEDEVELOPME NTBuilding a future where people and nature can thrive.
Korea Ecological Footprint Report 2016 24 Korea Ecological Footprint Report 2016 25
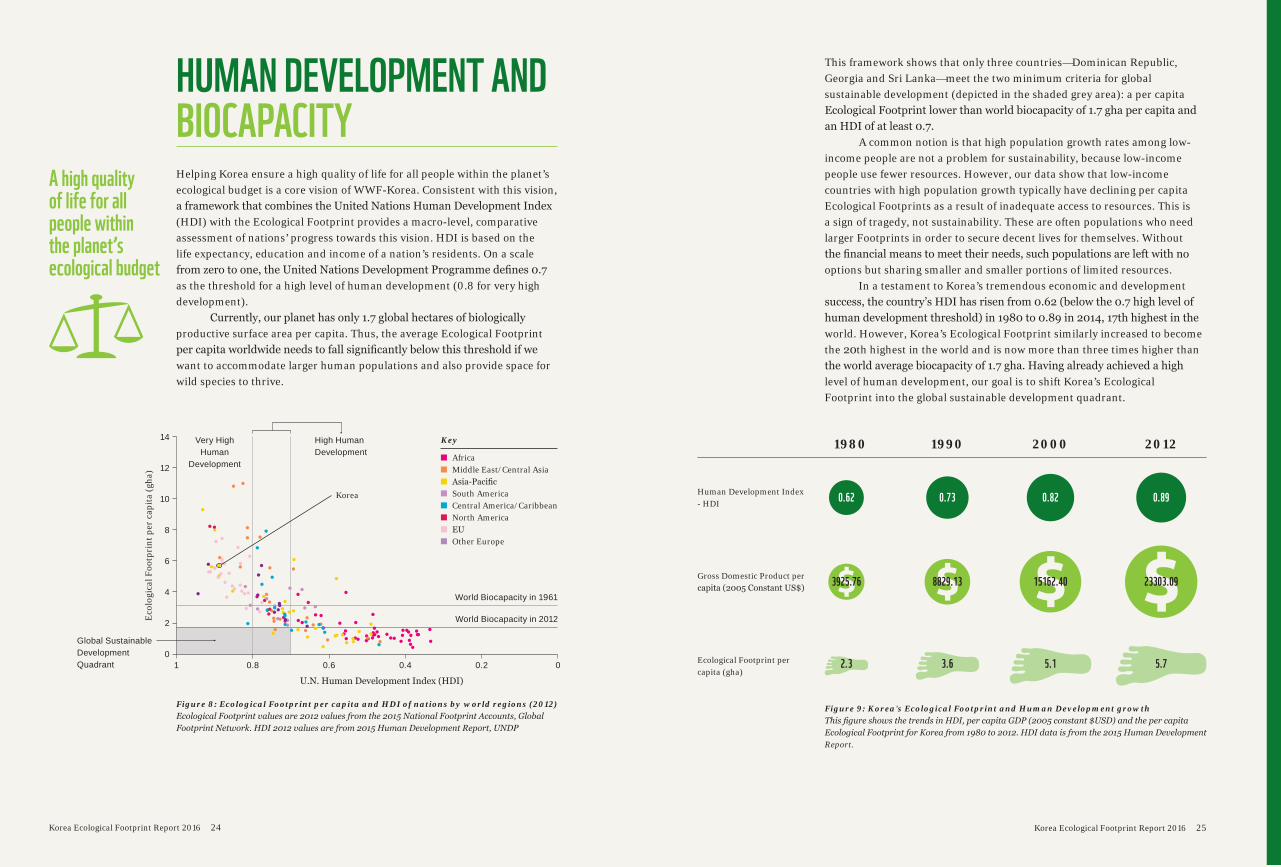
Helping Korea ensure a high quality of life for all people within the planet’s ecological budget is a core vision of WWF-Korea. Consistent with this vision, a framework that combines the United Nations Human Development Index (HDI) with the Ecological Footprint provides a macro-level, comparative assessment of nations’ progress towards this vision. HDI is based on the life expectancy, education and income of a nation’s residents. On a scale from zero to one, the United Nations Development Programme defines 0.7 as the threshold for a high level of human development (0.8 for very high development).
Currently, our planet has only 1.7 global hectares of biologically productive surface area per capita. Thus, the average Ecological Footprint per capita worldwide needs to fall significantly below this threshold if we want to accommodate larger human populations and also provide space for wild species to thrive.
HUMAN DEVELOPMENT AND BIOCAPACITY
A high quality of life for all people within the planet’s ecological budget
Figure 9: Korea's Ecological Footprint and Human Development growthThis figure shows the trends in HDI, per capita GDP (2005 constant $USD) and the per capita Ecological Footprint for Korea from 1980 to 2012. HDI data is from the 2015 Human Development Report.
0.890.820.730.62
2.3 3.6 5.1 5.7
3925.76 8829.13 15162.40 23303.09
Human Development Index- HDI
Gross Domestic Product per capita (2005 Constant US$)
Ecological Footprint per capita (gha)
1980 1990 2000 2012
This framework shows that only three countries—Dominican Republic, Georgia and Sri Lanka—meet the two minimum criteria for global sustainable development (depicted in the shaded grey area): a per capita Ecological Footprint lower than world biocapacity of 1.7 gha per capita and an HDI of at least 0.7.
A common notion is that high population growth rates among low-income people are not a problem for sustainability, because low-income people use fewer resources. However, our data show that low-income countries with high population growth typically have declining per capita Ecological Footprints as a result of inadequate access to resources. This is a sign of tragedy, not sustainability. These are often populations who need larger Footprints in order to secure decent lives for themselves. Without the financial means to meet their needs, such populations are left with no options but sharing smaller and smaller portions of limited resources.
In a testament to Korea’s tremendous economic and development success, the country’s HDI has risen from 0.62 (below the 0.7 high level of human development threshold) in 1980 to 0.89 in 2014, 17th highest in the world. However, Korea’s Ecological Footprint similarly increased to become the 20th highest in the world and is now more than three times higher than the world average biocapacity of 1.7 gha. Having already achieved a high level of human development, our goal is to shift Korea’s Ecological Footprint into the global sustainable development quadrant.
Figure 8: Ecological Footprint per capita and HDI of nations by world regions (2012) Ecological Footprint values are 2012 values from the 2015 National Footprint Accounts, Global Footprint Network. HDI 2012 values are from 2015 Human Development Report, UNDP
Key
AfricaMiddle East/Central AsiaAsia-PacificSouth AmericaCentral America/Caribbean North AmericaEUOther Europe
Eco
logi
cal F
ootp
rint
per
cap
ita
(gha
)
U.N. Human Development Index (HDI)
Global Sustainable DevelopmentQuadrant
Korea
1
Very HighHuman
Development
High Human Development
World Biocapacity in 1961
World Biocapacity in 2012
0.8 0.6 0.4 0.2 0
14
12
10
8
6
4
2
0
Korea Ecological Footprint Report 2016 26 Korea Ecological Footprint Report 2016 27
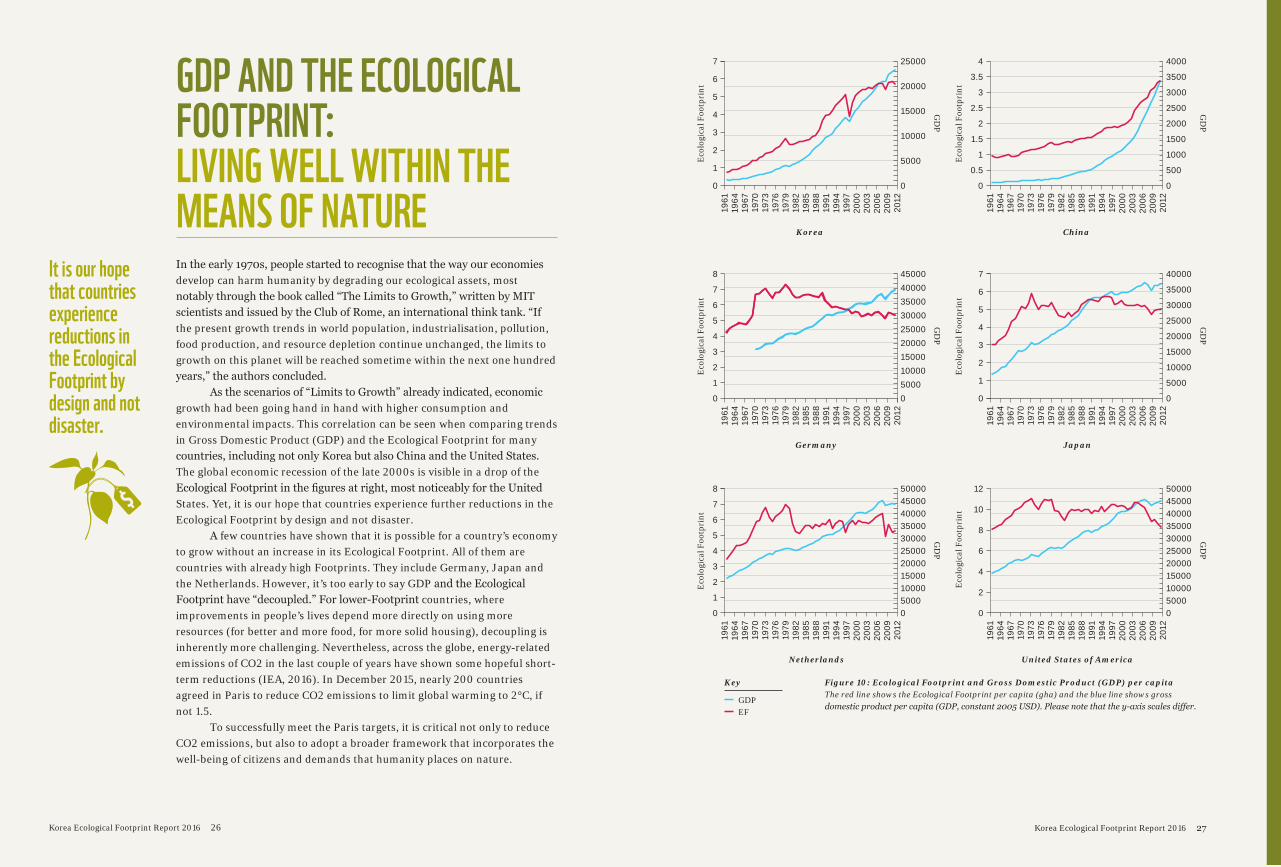
GDP AND THE ECOLOGICAL FOOTPRINT: LIVING WELL WITHIN THE MEANS OF NATUREIn the early 1970s, people started to recognise that the way our economies develop can harm humanity by degrading our ecological assets, most notably through the book called “The Limits to Growth,” written by MIT scientists and issued by the Club of Rome, an international think tank. “If the present growth trends in world population, industrialisation, pollution, food production, and resource depletion continue unchanged, the limits to growth on this planet will be reached sometime within the next one hundred years,” the authors concluded.
As the scenarios of “Limits to Growth” already indicated, economic growth had been going hand in hand with higher consumption and environmental impacts. This correlation can be seen when comparing trends in Gross Domestic Product (GDP) and the Ecological Footprint for many countries, including not only Korea but also China and the United States. The global economic recession of the late 2000s is visible in a drop of the Ecological Footprint in the figures at right, most noticeably for the United States. Yet, it is our hope that countries experience further reductions in the Ecological Footprint by design and not disaster.
A few countries have shown that it is possible for a country’s economy to grow without an increase in its Ecological Footprint. All of them are countries with already high Footprints. They include Germany, Japan and the Netherlands. However, it’s too early to say GDP and the Ecological Footprint have “decoupled.” For lower-Footprint countries, where improvements in people’s lives depend more directly on using more resources (for better and more food, for more solid housing), decoupling is inherently more challenging. Nevertheless, across the globe, energy-related emissions of CO2 in the last couple of years have shown some hopeful short-term reductions (IEA, 2016). In December 2015, nearly 200 countries agreed in Paris to reduce CO2 emissions to limit global warming to 2°C, if not 1.5.
To successfully meet the Paris targets, it is critical not only to reduce CO2 emissions, but also to adopt a broader framework that incorporates the well-being of citizens and demands that humanity places on nature.
It is our hope that countries experience reductions in the Ecological Footprint by design and not disaster.
Figure 10: Ecological Footprint and Gross Domestic Product (GDP) per capitaThe red line shows the Ecological Footprint per capita (gha) and the blue line shows gross domestic product per capita (GDP, constant 2005 USD). Please note that the y-axis scales differ.
Key
GDP EF
Korea
7 25000
20000
15000
10000
5000
6
5
4
3
2
1
0 0
1961
1964
1967
1970
1973
1976
1979
1982
1985
1988
1991
1994
1997
2000
2003
2006
2009
2012
China
4000
3500
3000
2500
2000
1500
1000
500
4
3.5
3
2.5
2
1.5
1
0
0.5
0
1961
1964
1967
1970
1973
1976
1979
1982
1985
1988
1991
1994
1997
2000
2003
2006
2009
2012
Eco
logi
cal F
ootp
rint
Eco
logi
cal F
ootp
rint
GD
P
Germany
8
7
45000400003500030000250002000015000100005000
6
5
4
3
2
1
0 0
1961
1964
1967
1970
1973
1976
1979
1982
1985
1988
1991
1994
1997
2000
2003
2006
2009
2012
Eco
logi
cal F
ootp
rint
GD
P
Netherlands
8
7
6
5
4
3
2
1
0
50000450004000035000300002500020000150001000050000
1961
1964
1967
1970
1973
1976
1979
1982
1985
1988
1991
1994
1997
2000
2003
2006
2009
2012
Eco
logi
cal F
ootp
rint
GD
P
Japan
7
6
5
4
3
2
1
0
40000
35000
30000
25000
20000
15000
10000
5000
0
1961
1964
1967
1970
1973
1976
1979
1982
1985
1988
1991
1994
1997
2000
2003
2006
2009
2012
Eco
logi
cal F
ootp
rint
GD
PG
DP
United States of America
12
10
8
6
4
2
0
50000450004000035000300002500020000150001000050000
1961
1964
1967
1970
1973
1976
1979
1982
1985
1988
1991
1994
1997
2000
2003
2006
2009
2012
GD
P
Eco
logi
cal F
ootp
rint
© P
Kphotograph / S
hutterstock.com
CHAPTER 4:
THE STATE OF KOREACan Korea’s ecological assets meet its residents’ demand?
Korea Ecological Footprint Report 2016 30 Korea Ecological Footprint Report 2016 31
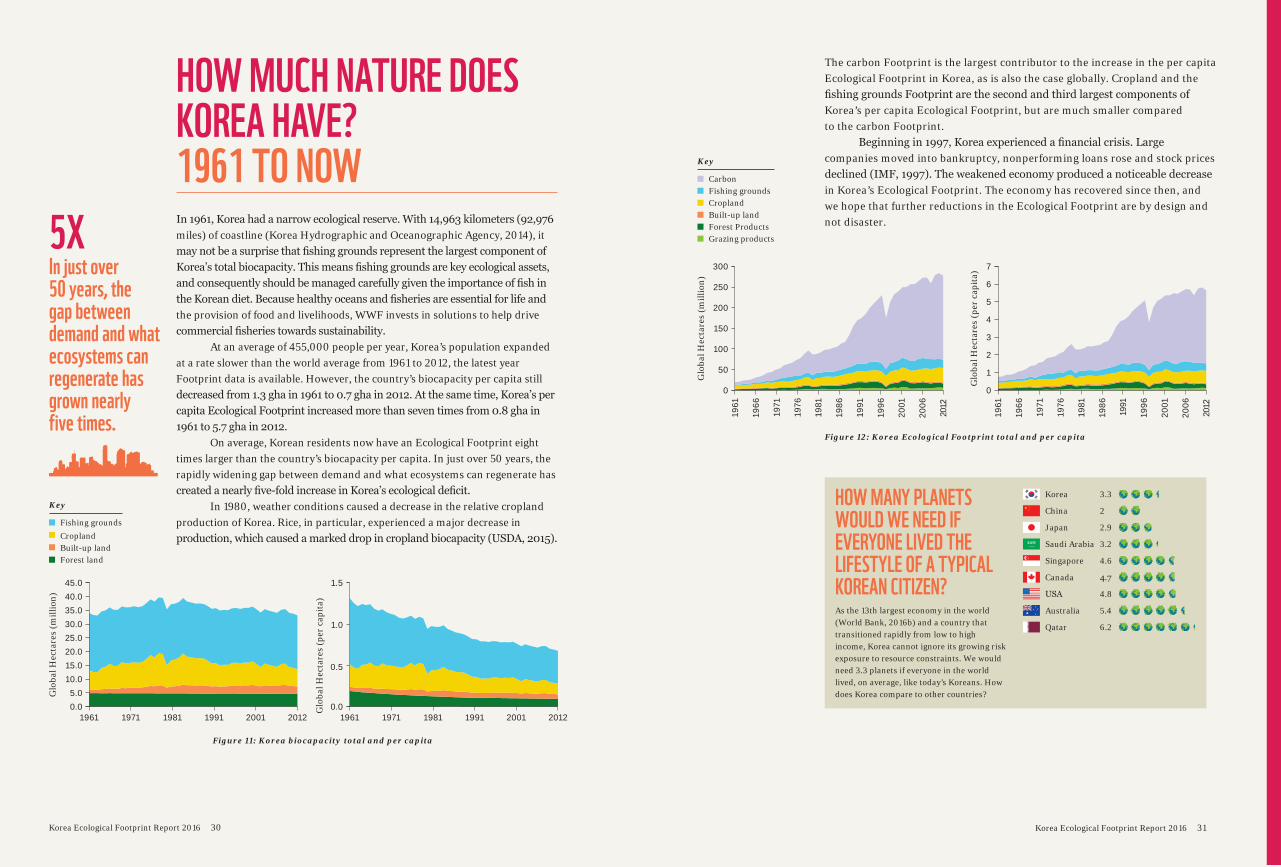
In 1961, Korea had a narrow ecological reserve. With 14,963 kilometers (92,976 miles) of coastline (Korea Hydrographic and Oceanographic Agency, 2014), it may not be a surprise that fishing grounds represent the largest component of Korea’s total biocapacity. This means fishing grounds are key ecological assets, and consequently should be managed carefully given the importance of fish in the Korean diet. Because healthy oceans and fisheries are essential for life and the provision of food and livelihoods, WWF invests in solutions to help drive commercial fisheries towards sustainability.
At an average of 455,000 people per year, Korea’s population expanded at a rate slower than the world average from 1961 to 2012, the latest year Footprint data is available. However, the country’s biocapacity per capita still decreased from 1.3 gha in 1961 to 0.7 gha in 2012. At the same time, Korea’s per capita Ecological Footprint increased more than seven times from 0.8 gha in 1961 to 5.7 gha in 2012.
On average, Korean residents now have an Ecological Footprint eight times larger than the country’s biocapacity per capita. In just over 50 years, the rapidly widening gap between demand and what ecosystems can regenerate has created a nearly five-fold increase in Korea’s ecological deficit.
In 1980, weather conditions caused a decrease in the relative cropland production of Korea. Rice, in particular, experienced a major decrease in production, which caused a marked drop in cropland biocapacity (USDA, 2015).
HOW MUCH NATURE DOES KOREA HAVE?1961 TO NOW
5XIn just over 50 years, the gap between demand and what ecosystems can regenerate has grown nearly five times.
The carbon Footprint is the largest contributor to the increase in the per capita Ecological Footprint in Korea, as is also the case globally. Cropland and the fishing grounds Footprint are the second and third largest components of Korea’s per capita Ecological Footprint, but are much smaller comparedto the carbon Footprint.
Beginning in 1997, Korea experienced a financial crisis. Large companies moved into bankruptcy, nonperforming loans rose and stock prices declined (IMF, 1997). The weakened economy produced a noticeable decrease in Korea’s Ecological Footprint. The economy has recovered since then, and we hope that further reductions in the Ecological Footprint are by design andnot disaster.
Glo
bal H
ecta
res
(per
cap
ita)
Figure 11: Korea biocapacity total and per capita
Key
Fishing grounds Cropland
Built-up landForest land
Glo
bal H
ecta
res
(mill
ion)
45.040.035.030.025.020.015.010.05.00.0
1961 1971 1981 1991 2001 2012
1.5
1.0
0.5
0.01961 1971 1981 1991 2001 2012
Figure 12: Korea Ecological Footprint total and per capita
Glo
bal H
ecta
res
(mill
ion)
Glo
bal H
ecta
res
(per
cap
ita)
300
250
200
150
100
50
0
1961
1966
1971
1976
1981
1986
1991
1996
2001
2006
2012
7
6
5
4
3
2
1
0
1961
1966
1971
1976
1981
1986
1991
1996
2001
2006
2012
HOW MANY PLANETS WOULD WE NEED IF EVERYONE LIVED THE LIFESTYLE OF A TYPICAL KOREAN CITIZEN?As the 13th largest economy in the world (World Bank, 2016b) and a country that transitioned rapidly from low to high income, Korea cannot ignore its growing risk exposure to resource constraints. We would need 3.3 planets if everyone in the world lived, on average, like today’s Koreans. How does Korea compare to other countries?
Korea
China
Japan
Saudi Arabia
Singapore
Canada
USA
Australia
Qatar
3.3
2
2.9
3.2
4.6
4.7
4.8
5.4
6.2
Key
CarbonFishing grounds
CroplandBuilt-up landForest ProductsGrazing products
Korea Ecological Footprint Report 2016 32 Korea Ecological Footprint Report 2016 33
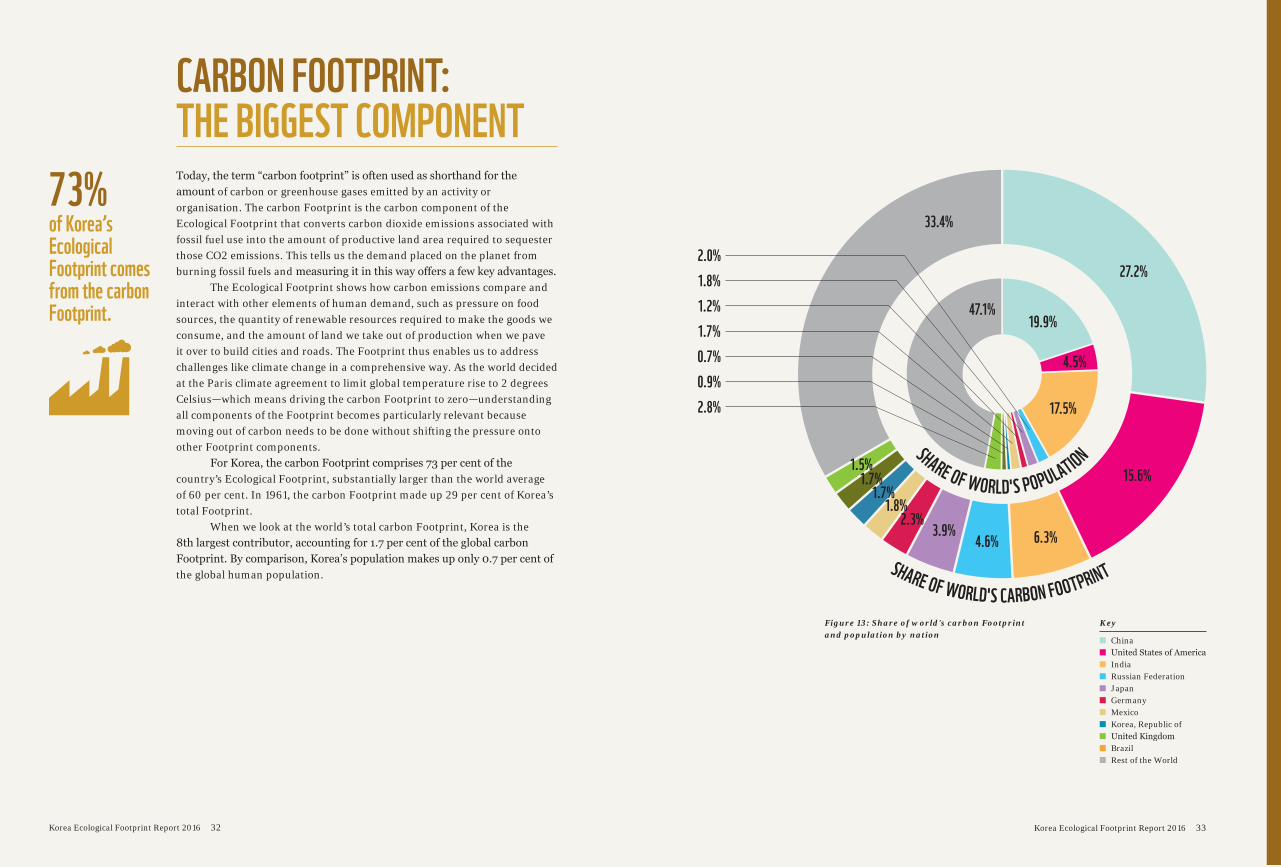
Today, the term “carbon footprint” is often used as shorthand for the amount of carbon or greenhouse gases emitted by an activity or organisation. The carbon Footprint is the carbon component of the Ecological Footprint that converts carbon dioxide emissions associated with fossil fuel use into the amount of productive land area required to sequester those CO2 emissions. This tells us the demand placed on the planet from burning fossil fuels and measuring it in this way offers a few key advantages.
The Ecological Footprint shows how carbon emissions compare and interact with other elements of human demand, such as pressure on food sources, the quantity of renewable resources required to make the goods we consume, and the amount of land we take out of production when we pave it over to build cities and roads. The Footprint thus enables us to address challenges like climate change in a comprehensive way. As the world decided at the Paris climate agreement to limit global temperature rise to 2 degrees Celsius—which means driving the carbon Footprint to zero—understanding all components of the Footprint becomes particularly relevant because moving out of carbon needs to be done without shifting the pressure onto other Footprint components.
For Korea, the carbon Footprint comprises 73 per cent of the country’s Ecological Footprint, substantially larger than the world average of 60 per cent. In 1961, the carbon Footprint made up 29 per cent of Korea’s total Footprint.
When we look at the world’s total carbon Footprint, Korea is the 8th largest contributor, accounting for 1.7 per cent of the global carbon Footprint. By comparison, Korea’s population makes up only 0.7 per cent of the global human population.
73%of Korea’s Ecological Footprint comes from the carbon Footprint.
CARBON FOOTPRINT: THE BIGGEST COMPONENT
Figure 13: Share of world's carbon Footprint and population by nation
2.0%1.8%1.2%1.7%0.7%0.9%2.8%
19.9%
4.5%
17.5%
47.1%
33.4%
1.5%
1.8%2.3%
3.9%4.6% 6.3%
15.6%
27.2%
1.7%1.7%
Key
ChinaUnited States of America
IndiaRussian Federation
Japan Germany Mexico
Korea, Republic ofUnited Kingdom
BrazilRest of the World
Korea Ecological Footprint Report 2016 34 Korea Ecological Footprint Report 2016 35
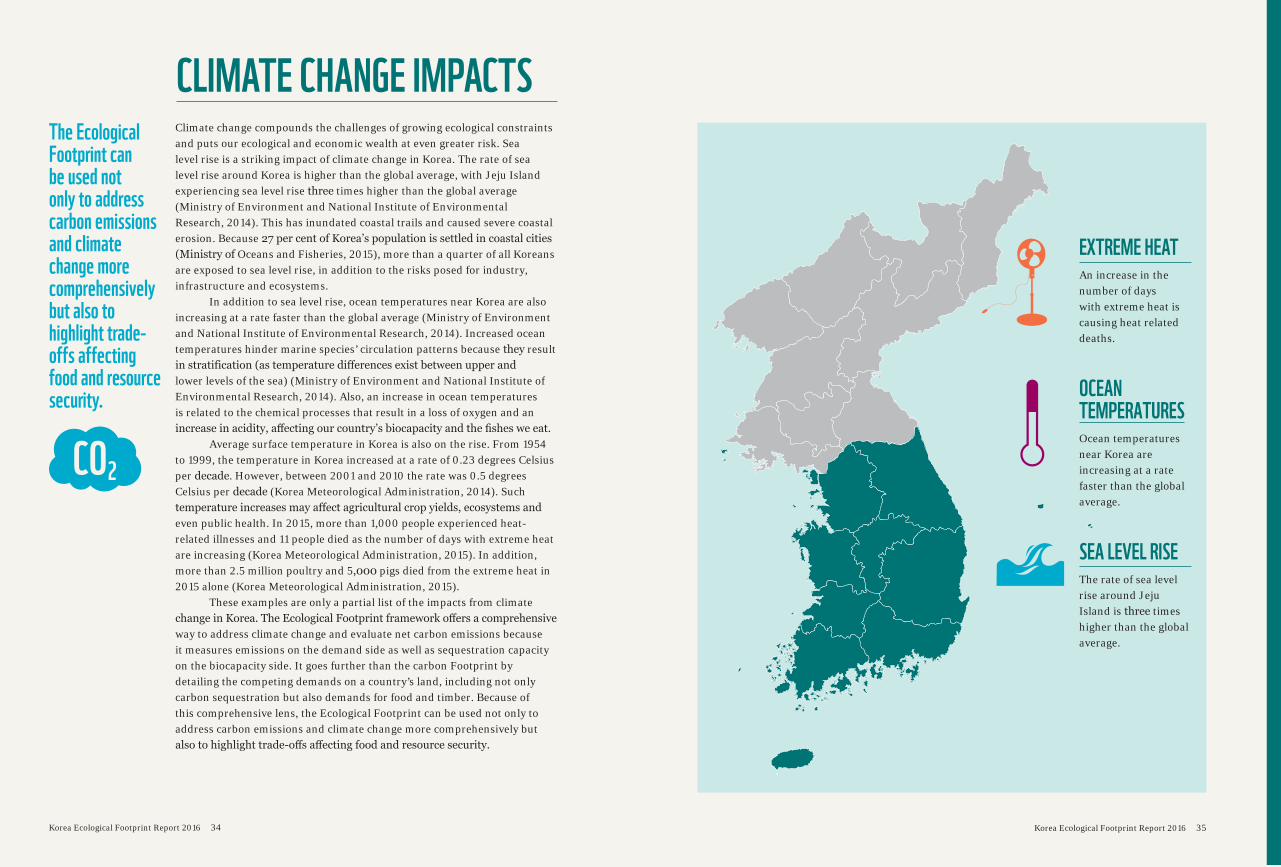
Climate change compounds the challenges of growing ecological constraints and puts our ecological and economic wealth at even greater risk. Sea level rise is a striking impact of climate change in Korea. The rate of sea level rise around Korea is higher than the global average, with Jeju Island experiencing sea level rise three times higher than the global average (Ministry of Environment and National Institute of Environmental Research, 2014). This has inundated coastal trails and caused severe coastal erosion. Because 27 per cent of Korea’s population is settled in coastal cities (Ministry of Oceans and Fisheries, 2015), more than a quarter of all Koreans are exposed to sea level rise, in addition to the risks posed for industry, infrastructure and ecosystems.
In addition to sea level rise, ocean temperatures near Korea are also increasing at a rate faster than the global average (Ministry of Environment and National Institute of Environmental Research, 2014). Increased ocean temperatures hinder marine species’ circulation patterns because they result in stratification (as temperature differences exist between upper and lower levels of the sea) (Ministry of Environment and National Institute of Environmental Research, 2014). Also, an increase in ocean temperatures is related to the chemical processes that result in a loss of oxygen and an increase in acidity, affecting our country’s biocapacity and the fishes we eat.
Average surface temperature in Korea is also on the rise. From 1954 to 1999, the temperature in Korea increased at a rate of 0.23 degrees Celsius per decade. However, between 2001 and 2010 the rate was 0.5 degrees Celsius per decade (Korea Meteorological Administration, 2014). Such temperature increases may affect agricultural crop yields, ecosystems and even public health. In 2015, more than 1,000 people experienced heat-related illnesses and 11 people died as the number of days with extreme heat are increasing (Korea Meteorological Administration, 2015). In addition, more than 2.5 million poultry and 5,000 pigs died from the extreme heat in 2015 alone (Korea Meteorological Administration, 2015).
These examples are only a partial list of the impacts from climate change in Korea. The Ecological Footprint framework offers a comprehensive way to address climate change and evaluate net carbon emissions because it measures emissions on the demand side as well as sequestration capacity on the biocapacity side. It goes further than the carbon Footprint by detailing the competing demands on a country’s land, including not only carbon sequestration but also demands for food and timber. Because of this comprehensive lens, the Ecological Footprint can be used not only to address carbon emissions and climate change more comprehensively but also to highlight trade-offs affecting food and resource security.
CLIMATE CHANGE IMPACTSThe Ecological Footprint can be used not only to address carbon emissions and climate change more comprehensively but also to highlight trade-offs affecting food and resource security.
EXTREME HEATAn increase in the number of days with extreme heat is causing heat related deaths.
OCEAN TEMPERATURESOcean temperatures near Korea are increasing at a rate faster than the global average.
SEA LEVEL RISEThe rate of sea level rise around Jeju Island is three times higher than the global average.
Korea Ecological Footprint Report 2016 36 Korea Ecological Footprint Report 2016 37
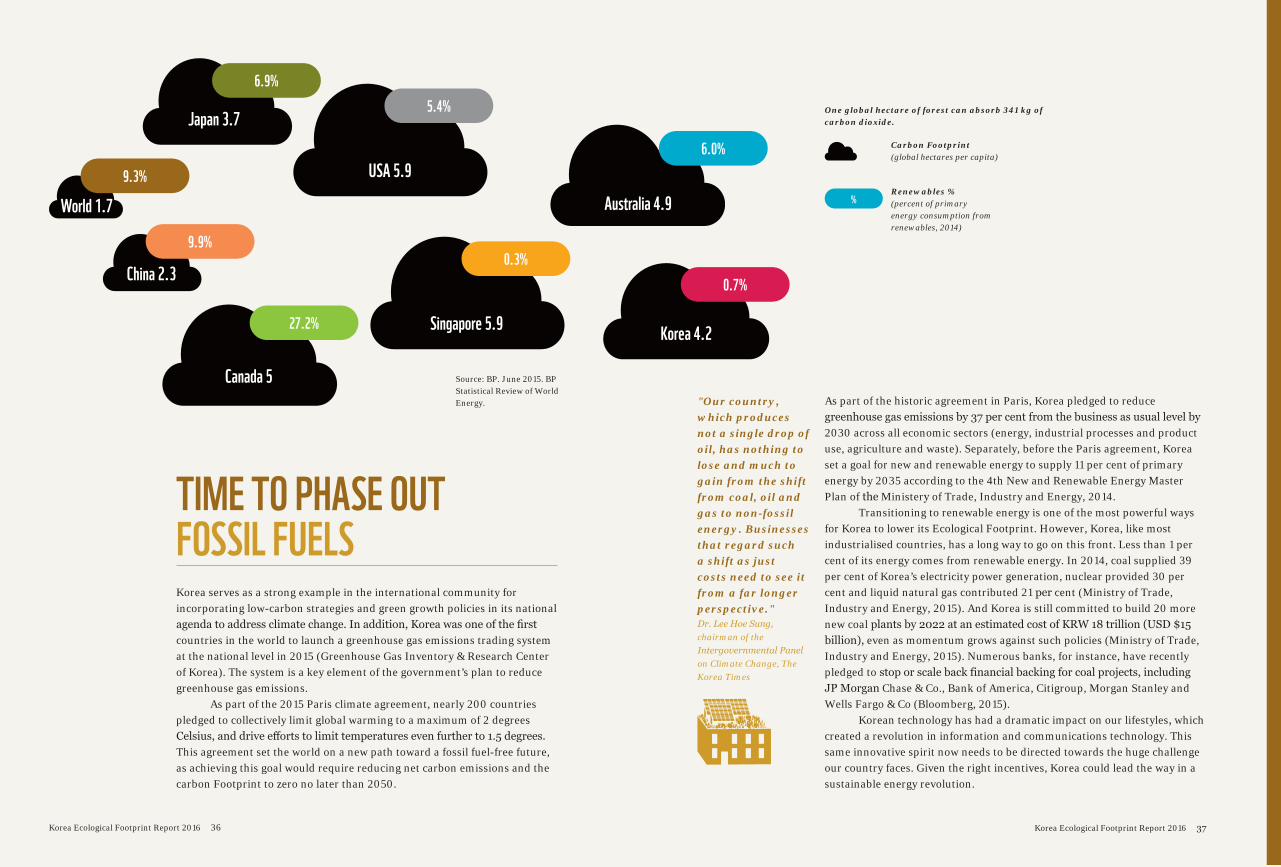
Australia 4.9
6.0%
Korea serves as a strong example in the international community for incorporating low-carbon strategies and green growth policies in its national agenda to address climate change. In addition, Korea was one of the first countries in the world to launch a greenhouse gas emissions trading system at the national level in 2015 (Greenhouse Gas Inventory & Research Center of Korea). The system is a key element of the government’s plan to reduce greenhouse gas emissions.
As part of the 2015 Paris climate agreement, nearly 200 countries pledged to collectively limit global warming to a maximum of 2 degrees Celsius, and drive efforts to limit temperatures even further to 1.5 degrees. This agreement set the world on a new path toward a fossil fuel-free future, as achieving this goal would require reducing net carbon emissions and the carbon Footprint to zero no later than 2050.
As part of the historic agreement in Paris, Korea pledged to reduce greenhouse gas emissions by 37 per cent from the business as usual level by 2030 across all economic sectors (energy, industrial processes and product use, agriculture and waste). Separately, before the Paris agreement, Korea set a goal for new and renewable energy to supply 11 per cent of primary energy by 2035 according to the 4th New and Renewable Energy Master Plan of the Ministery of Trade, Industry and Energy, 2014.
Transitioning to renewable energy is one of the most powerful ways for Korea to lower its Ecological Footprint. However, Korea, like most industrialised countries, has a long way to go on this front. Less than 1 per cent of its energy comes from renewable energy. In 2014, coal supplied 39 per cent of Korea’s electricity power generation, nuclear provided 30 per cent and liquid natural gas contributed 21 per cent (Ministry of Trade, Industry and Energy, 2015). And Korea is still committed to build 20 more new coal plants by 2022 at an estimated cost of KRW 18 trillion (USD $15 billion), even as momentum grows against such policies (Ministry of Trade, Industry and Energy, 2015). Numerous banks, for instance, have recently pledged to stop or scale back financial backing for coal projects, including JP Morgan Chase & Co., Bank of America, Citigroup, Morgan Stanley and Wells Fargo & Co (Bloomberg, 2015).
Korean technology has had a dramatic impact on our lifestyles, which created a revolution in information and communications technology. This same innovative spirit now needs to be directed towards the huge challenge our country faces. Given the right incentives, Korea could lead the way in a sustainable energy revolution.
TIME TO PHASE OUT FOSSIL FUELS
USA 5.9
5.4%Japan 3.7
6.9%
World 1.79.3%
Singapore 5.9
0.3%
Carbon Footprint(global hectares per capita)
Renewables % (percent of primary energy consumption from renewables, 2014)
%
Korea 4.2
0.7%
Canada 5
27.2%
China 2.3
9.9%
"Our country, which produces not a single drop of oil, has nothing to lose and much to gain from the shift from coal, oil and gas to non-fossil energy. Businesses that regard such a shift as just costs need to see it from a far longer perspective." Dr. Lee Hoe Sung, chairman of the Intergovernmental Panel on Climate Change, The Korea Times
One global hectare of forest can absorb 341 kg of carbon dioxide.
Source: BP. June 2015. BP Statistical Review of World Energy.
Korea Ecological Footprint Report 2016 38 Korea Ecological Footprint Report 2016 39
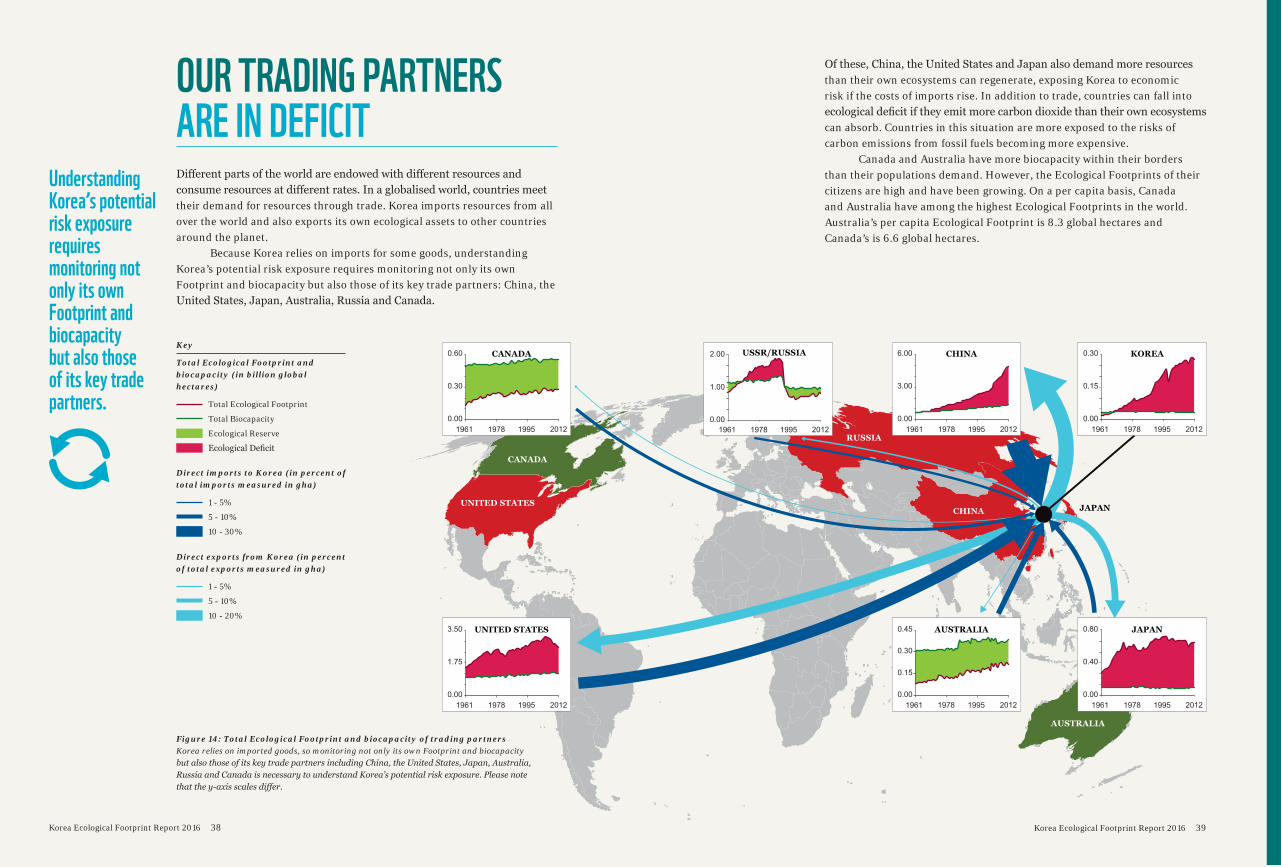
Understanding Korea’s potential risk exposure requires monitoring not only its own Footprint and biocapacity but also those of its key trade partners.
Of these, China, the United States and Japan also demand more resources than their own ecosystems can regenerate, exposing Korea to economic risk if the costs of imports rise. In addition to trade, countries can fall into ecological deficit if they emit more carbon dioxide than their own ecosystems can absorb. Countries in this situation are more exposed to the risks of carbon emissions from fossil fuels becoming more expensive.
Canada and Australia have more biocapacity within their borders than their populations demand. However, the Ecological Footprints of their citizens are high and have been growing. On a per capita basis, Canada and Australia have among the highest Ecological Footprints in the world. Australia’s per capita Ecological Footprint is 8.3 global hectares and Canada’s is 6.6 global hectares.
OUR TRADING PARTNERS ARE IN DEFICITDifferent parts of the world are endowed with different resources and consume resources at different rates. In a globalised world, countries meet their demand for resources through trade. Korea imports resources from all over the world and also exports its own ecological assets to other countries around the planet.
Because Korea relies on imports for some goods, understanding Korea’s potential risk exposure requires monitoring not only its own Footprint and biocapacity but also those of its key trade partners: China, the United States, Japan, Australia, Russia and Canada.
Key
Total Ecological Footprint and biocapacity (in billion global hectares)
Total Ecological Footprint
Total Biocapacity
Ecological Reserve
Ecological Deficit
Direct imports to Korea (in percent of total imports measured in gha)
1 - 5%
5 - 10%
10 - 30%
Direct exports from Korea (in percent of total exports measured in gha)
1 - 5%
5 - 10%
10 - 20%
Figure 14: Total Ecological Footprint and biocapacity of trading partners Korea relies on imported goods, so monitoring not only its own Footprint and biocapacity but also those of its key trade partners including China, the United States, Japan, Australia, Russia and Canada is necessary to understand Korea’s potential risk exposure. Please note that the y-axis scales differ.
Korea Ecological Footprint Report 2016 40 Korea Ecological Footprint Report 2016 41
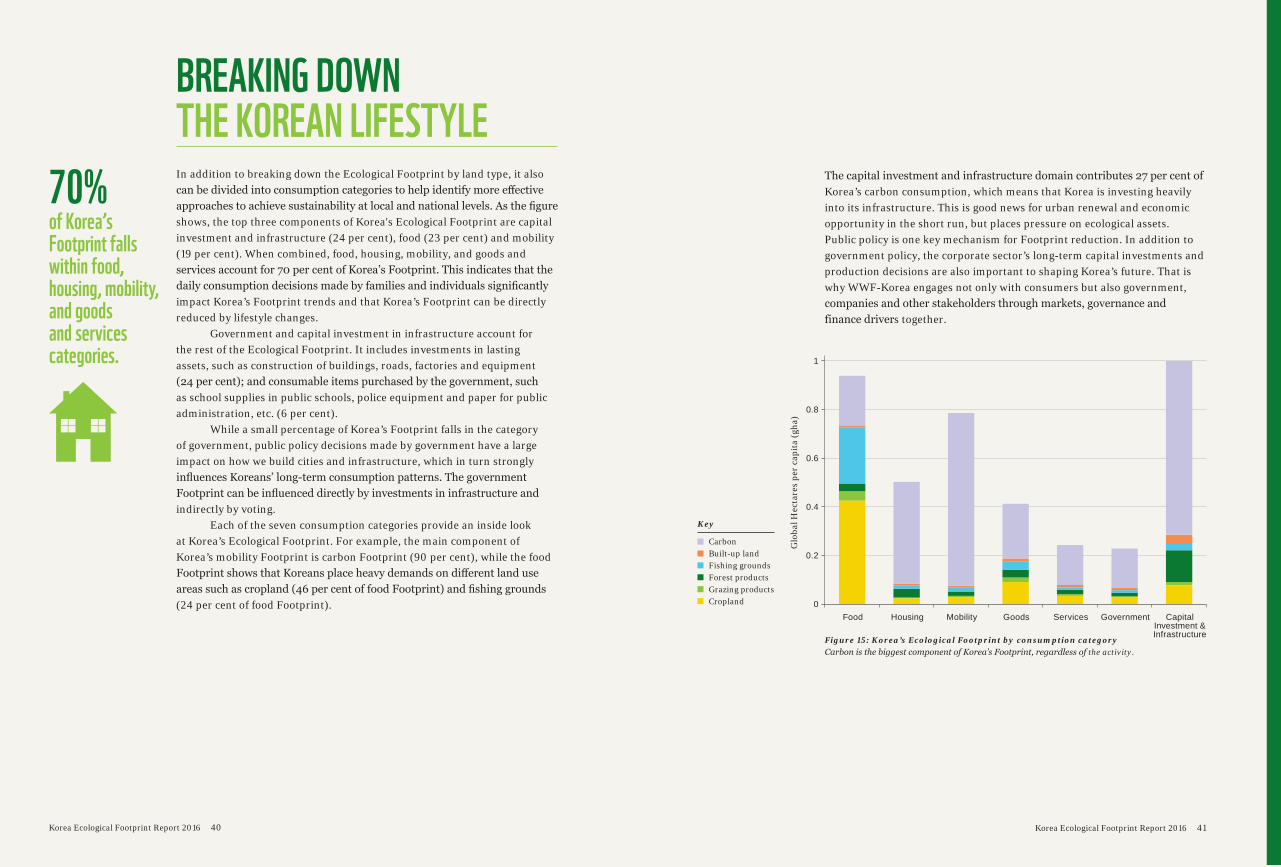
In addition to breaking down the Ecological Footprint by land type, it also can be divided into consumption categories to help identify more effective approaches to achieve sustainability at local and national levels. As the figure shows, the top three components of Korea's Ecological Footprint are capital investment and infrastructure (24 per cent), food (23 per cent) and mobility (19 per cent). When combined, food, housing, mobility, and goods and services account for 70 per cent of Korea’s Footprint. This indicates that the daily consumption decisions made by families and individuals significantly impact Korea’s Footprint trends and that Korea’s Footprint can be directly reduced by lifestyle changes.
Government and capital investment in infrastructure account for the rest of the Ecological Footprint. It includes investments in lasting assets, such as construction of buildings, roads, factories and equipment (24 per cent); and consumable items purchased by the government, such as school supplies in public schools, police equipment and paper for public administration, etc. (6 per cent).
While a small percentage of Korea’s Footprint falls in the category of government, public policy decisions made by government have a large impact on how we build cities and infrastructure, which in turn strongly influences Koreans’ long-term consumption patterns. The government Footprint can be influenced directly by investments in infrastructure and indirectly by voting.
Each of the seven consumption categories provide an inside look at Korea’s Ecological Footprint. For example, the main component of Korea’s mobility Footprint is carbon Footprint (90 per cent), while the food Footprint shows that Koreans place heavy demands on different land use areas such as cropland (46 per cent of food Footprint) and fishing grounds (24 per cent of food Footprint).
BREAKING DOWN THE KOREAN LIFESTYLE
70% of Korea’s Footprint falls within food, housing, mobility, and goods and services categories.
The capital investment and infrastructure domain contributes 27 per cent of Korea’s carbon consumption, which means that Korea is investing heavily into its infrastructure. This is good news for urban renewal and economic opportunity in the short run, but places pressure on ecological assets. Public policy is one key mechanism for Footprint reduction. In addition to government policy, the corporate sector’s long-term capital investments and production decisions are also important to shaping Korea’s future. That is why WWF-Korea engages not only with consumers but also government, companies and other stakeholders through markets, governance and finance drivers together.
Figure 15: Korea’s Ecological Footprint by consumption categoryCarbon is the biggest component of Korea’s Footprint, regardless of the activity.
Key
CarbonBuilt-up landFishing groundsForest products Grazing products
Cropland
Glo
bal H
ecta
res
per
capi
ta (g
ha)
1
0.8
0.6
0.4
0.2
0Food Housing Mobility Goods Services Government Capital
Investment &Infrastructure
Korea Ecological Footprint Report 2016 42 Korea Ecological Footprint Report 2016 43
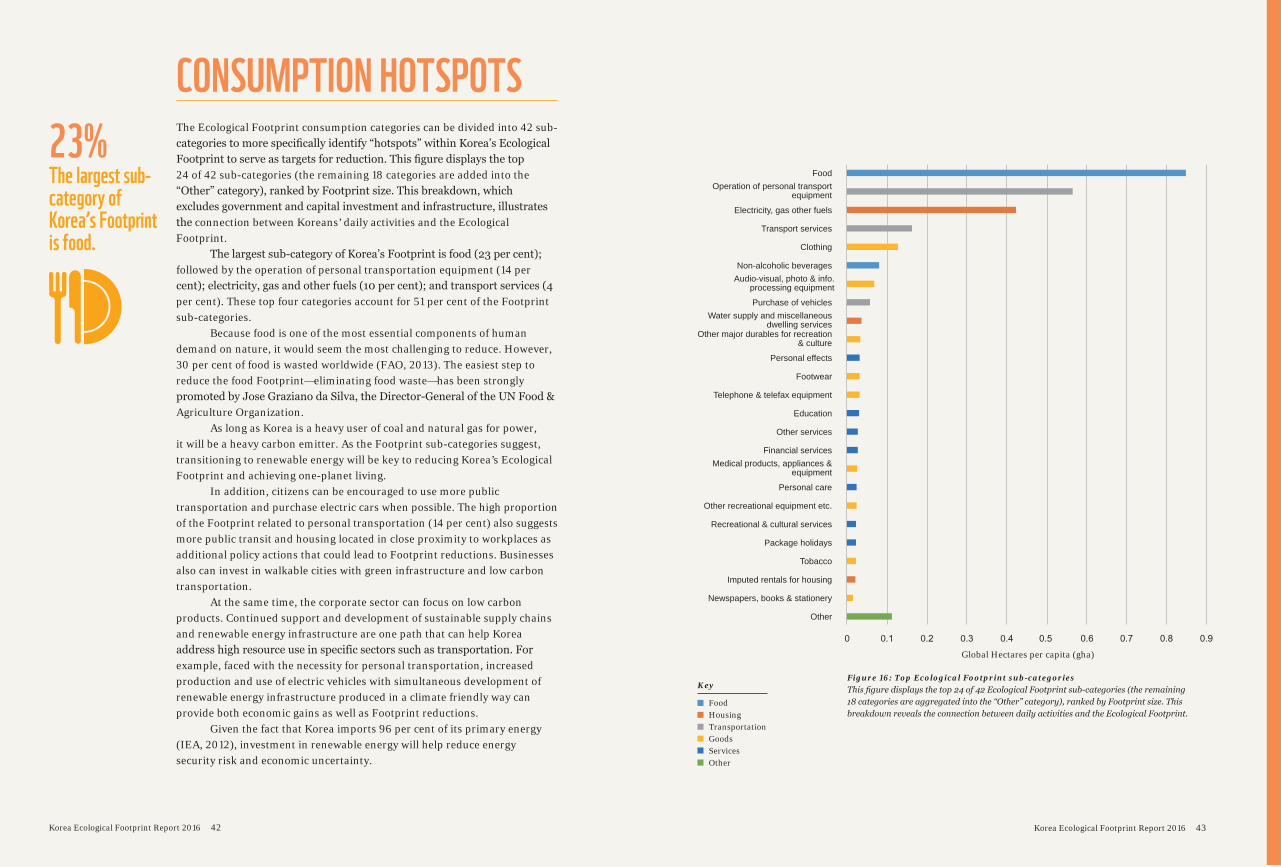
The Ecological Footprint consumption categories can be divided into 42 sub-categories to more specifically identify “hotspots” within Korea’s Ecological Footprint to serve as targets for reduction. This figure displays the top 24 of 42 sub-categories (the remaining 18 categories are added into the “Other” category), ranked by Footprint size. This breakdown, which excludes government and capital investment and infrastructure, illustrates the connection between Koreans’ daily activities and the Ecological Footprint.
The largest sub-category of Korea’s Footprint is food (23 per cent); followed by the operation of personal transportation equipment (14 per cent); electricity, gas and other fuels (10 per cent); and transport services (4 per cent). These top four categories account for 51 per cent of the Footprint sub-categories.
Because food is one of the most essential components of human demand on nature, it would seem the most challenging to reduce. However, 30 per cent of food is wasted worldwide (FAO, 2013). The easiest step to reduce the food Footprint—eliminating food waste—has been strongly promoted by Jose Graziano da Silva, the Director-General of the UN Food & Agriculture Organization.
As long as Korea is a heavy user of coal and natural gas for power, it will be a heavy carbon emitter. As the Footprint sub-categories suggest, transitioning to renewable energy will be key to reducing Korea’s Ecological Footprint and achieving one-planet living.
In addition, citizens can be encouraged to use more public transportation and purchase electric cars when possible. The high proportion of the Footprint related to personal transportation (14 per cent) also suggests more public transit and housing located in close proximity to workplaces as additional policy actions that could lead to Footprint reductions. Businesses also can invest in walkable cities with green infrastructure and low carbon transportation.
At the same time, the corporate sector can focus on low carbon products. Continued support and development of sustainable supply chains and renewable energy infrastructure are one path that can help Korea address high resource use in specific sectors such as transportation. For example, faced with the necessity for personal transportation, increased production and use of electric vehicles with simultaneous development of renewable energy infrastructure produced in a climate friendly way can provide both economic gains as well as Footprint reductions.
Given the fact that Korea imports 96 per cent of its primary energy (IEA, 2012), investment in renewable energy will help reduce energy security risk and economic uncertainty.
CONSUMPTION HOTSPOTS23%The largest sub-category of Korea’s Footprint is food.
Key
Food Housing Transportation Goods Services Other
Operation of personal transport equipment
Electricity, gas other fuels
Transport services
Clothing
Purchase of vehicles
Non-alcoholic beverages
Education
Other services
Financial services
Telephone & telefax equipment
Personal care
Personal effects
Recreational & cultural services
Other recreational equipment etc.
Imputed rentals for housing
Package holidays
Footwear
Tobacco
Newspapers, books & stationery
0 0.1 0.2 0.7 0.8 0.9
Audio-visual, photo & info. processing equipment
Water supply and miscellaneous dwelling services
Other major durables for recreation & culture
Medical products, appliances & equipment
Food
Other
Figure 16: Top Ecological Footprint sub-categoriesThis figure displays the top 24 of 42 Ecological Footprint sub-categories (the remaining 18 categories are aggregated into the “Other” category), ranked by Footprint size. This breakdown reveals the connection between daily activities and the Ecological Footprint.
0.3 0.4 0.5 0.6
Global Hectares per capita (gha)
Korea Ecological Footprint Report 2016 45
© Freedom
Man / S
hutterstock.com
CHAPTER 5:
ONE PLANET LIVINGTime to innovate for people, planet and prosperity.
Korea Ecological Footprint Report 2016 46 Korea Ecological Footprint Report 2016 47
Living well within nature’s limits is possible for Korea. Korea is one of Asia’s most innovative countries, driving rapid development and improvement in the quality of life in a relatively short time period. Human ingenuity enables us to build a resource-efficient economy that provides for a thriving society within the means of nature. In a world of climate change and resource constraints, such an economy will become any nation’s strongest asset.
The current potential for Footprint reductions in Korea is vast. At the same time, for a whole country to transform requires significant foresight and effort. The first step is identifying and evaluating opportunities to pinpoint options that are economically and politically desirable.
A clear public policy strategy, with identified benefits and a bold vision, can enable a successful transformation. Fortunately, Korea is no stranger to innovation. In fact, its proven track record at driving rapid development to become a world-class technology leader gives it a significant advantage over many nations in the world.
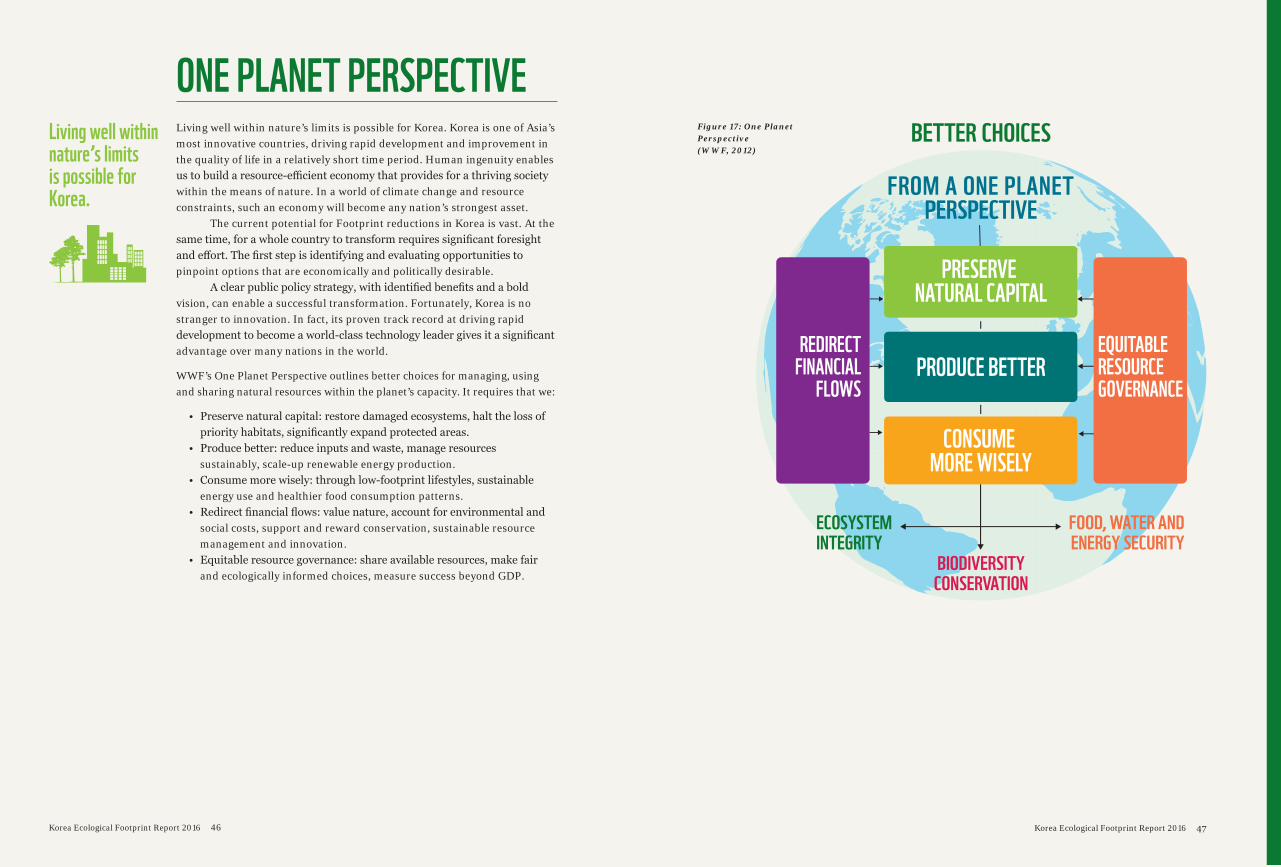
WWF’s One Planet Perspective outlines better choices for managing, using and sharing natural resources within the planet’s capacity. It requires that we:
• Preserve natural capital: restore damaged ecosystems, halt the loss ofpriority habitats, significantly expand protected areas.
• Produce better: reduce inputs and waste, manage resourcessustainably, scale-up renewable energy production.
• Consume more wisely: through low-footprint lifestyles, sustainableenergy use and healthier food consumption patterns.
• Redirect financial flows: value nature, account for environmental andsocial costs, support and reward conservation, sustainable resourcemanagement and innovation.
• Equitable resource governance: share available resources, make fairand ecologically informed choices, measure success beyond GDP.
ONE PLANET PERSPECTIVEFigure 17: One Planet Perspective(WWF, 2012)
Living well within nature’s limitsis possible for Korea.
Korea Ecological Footprint Report 2016 48 Korea Ecological Footprint Report 2016 49
CHOOSING OUR FUTURE Our natural resources are finite. But the possibilities are not.
1. Develop an exciting new long-term vision for Korea, wherepeople prosper in harmony with natureFuture success starts with having the right long-term vision. A vision that recognises Korea’s future prosperity can only be achieved by balancing economic, social and environmental dimensions. A critical first step could be bringing key stakeholders together to explore whether these current Footprint trends are a top-priority risk for Korea, and whether new development pathways to deliver economic and social success are possible.
This step can align perfectly with Korea’s recent commitment to the new 2030 UN Sustainable Development Goals (SDGs), which similarly challenges all the countries of the world to better balance the needs of people, prosperity, and the planet. Korea is well positioned to take a leading role in the coming year to demonstrate how this can be done.
2. Ensure nature’s value is recognisedOne important challenge is enabling decision makers to better recognise the importance of ecological assets in the most important decisions. Decisions on key issues such as food, water and energy security need to carefully weigh the impacts in terms of economic, social and environmental factors. Action is needed to strengthen awareness, information and data-driven decision-making tools that can enable smarter choices to manage our natural capital.
For example, Korea has significant natural assets in its of fisheries and fishing grounds—an important foundation to future growth, jobs and food security. However, these assets are being rapidly depleted at the risk of future generations. Alternative solutions are possible that could better safeguard growth, jobs and fisheries—if we took all the factors into account.
3. Build a clear roadmap that focuses on the most critical issuesThis report highlights that certain Footprint issues are more important than others. It is important that stakeholders come together, agree on the most pressing issues, and ensure robust action is taken on those.
For example, it is clear that decisive action is needed on our carbon Footprint and climate change. The Paris international conference on climate change reinforced that current 2030 commitments by countries and companies are not sufficient, so a discussion is needed on how more can be done to reduce greenhouse gas emissions. Once again alternative solutions are possible from exploring the potential of renewable energy to improving energy efficiency to a range of other options. How can we build a clear sustainability roadmap that helps guide us to a better future?
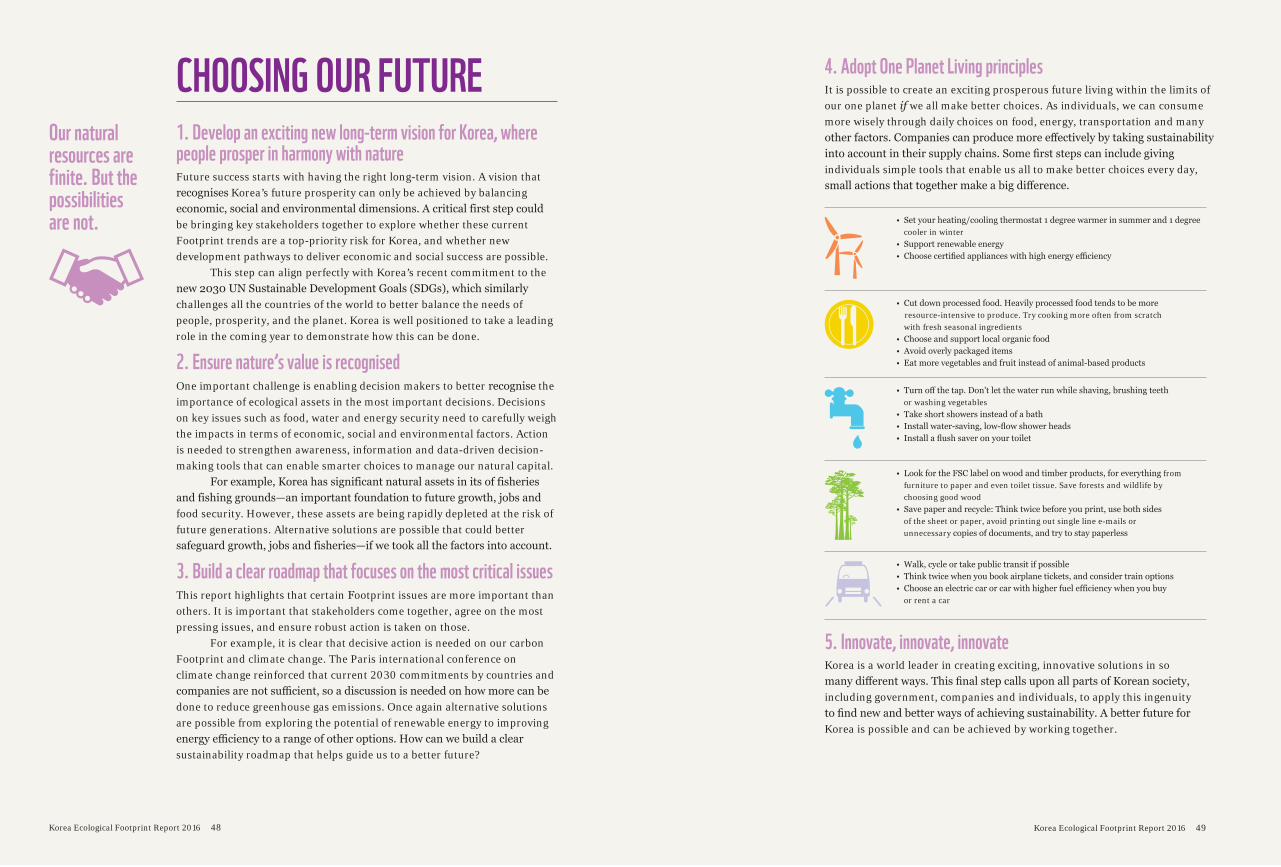
4. Adopt One Planet Living principlesIt is possible to create an exciting prosperous future living within the limits of our one planet if we all make better choices. As individuals, we can consume more wisely through daily choices on food, energy, transportation and many other factors. Companies can produce more effectively by taking sustainability into account in their supply chains. Some first steps can include giving individuals simple tools that enable us all to make better choices every day, small actions that together make a big difference.
5. Innovate, innovate, innovateKorea is a world leader in creating exciting, innovative solutions in so many different ways. This final step calls upon all parts of Korean society, including government, companies and individuals, to apply this ingenuity to find new and better ways of achieving sustainability. A better future for Korea is possible and can be achieved by working together.
• Set your heating/cooling thermostat 1 degree warmer in summer and 1 degree cooler in winter
• Support renewable energy• Choose certified appliances with high energy efficiency
• Cut down processed food. Heavily processed food tends to be moreresource-intensive to produce. Try cooking more often from scratch with fresh seasonal ingredients
• Choose and support local organic food• Avoid overly packaged items• Eat more vegetables and fruit instead of animal-based products
• Turn off the tap. Don't let the water run while shaving, brushing teethor washing vegetables
• Take short showers instead of a bath• Install water-saving, low-flow shower heads• Install a flush saver on your toilet
• Look for the FSC label on wood and timber products, for everything from furniture to paper and even toilet tissue. Save forests and wildlife by choosing good wood
• Save paper and recycle: Think twice before you print, use both sides of the sheet or paper, avoid printing out single line e-mails or unnecessary copies of documents, and try to stay paperless
• Walk, cycle or take public transit if possible• Think twice when you book airplane tickets, and consider train options• Choose an electric car or car with higher fuel efficiency when you buy
or rent a car
© N
asa
Together PossibleKorea Ecological Footprint Report 2016 50
REFERENCESBloomberg, 2015. http://www.bloomberg.com/news/articles/2016-03-07/jpmorgan-won-t-finance-new-coal-mines-that-worsen-climate-change
BP, 2015. Statistical Review of World Energy. http://www.bp.com/content/dam/bp/pdf/energy-economics/statistical-review-2015/bp-statistical-review-of-world-energy-2015-full-report.pdf
FAO, 2013. Food wastage footprint impacts on natural resources. http://www.fao.org/docrep/018/i3347e/i3347e.pdf
Greenhouse Gas Inventory & Research Center of Korea. http://www.gir.go.kr/eng/index.do;js essionid=o3PbPEaLzqgdcjFGR2GKiTymczRJTh16Vb1JK4TPalLXWwXiSXjEUQ0uYkArbgzv.og_was_ servlet_engine1?menuId=11
Human Development Report, 2015. http://hdr.undp.org/sites/all/themes/hdr_theme/country-notes/KOR.pdf
IEA, 2012. Energy Policies of IEA Countries: The Republic of Korea. https://www.iea.org/publications/freepublications/publication/Korea2012_free.pdf
IEA, 2016. Decoupling of global emissions and economic growth confirmed. https://www. iea.org/newsroomandevents/pressreleases/2016/march/decoupling-of-global-emissions-and-economic-growth-confirmed.html
IMF, 1997. Press Release Number 97/55. http://www.imf.org/external/np/sec/pr/1997/pr9755.htm
Korea Meteorological Administration, 2014. http://www.korea.kr/archive/expDocView.do?docId=36105
Korea Meteorological Administration, 2015. http://www.climate.go.kr/home/cc_data/2015/2015_abnormal_climate_report.pdf
Korea Ministry of Environment and National Institute of Environmental Research, 2014. http://www.climate.go.kr/home/cc_data/2015/cc_report/climate_change_report(korean)2014_(effect_ adaptation).pdf
Korea Ministry of Environment, Climate change. http://eng.me.go.kr/eng/web/index.do?menuId=202&findDepth=1
Korea Ministry of Environment, Greenhouse gas emissions trading scheme. http://eng. me.go.kr/eng/web/index.do?menuId=450&findDepth=1
Korea Ministry of Oceans and Fisheries, 2015. http://www.coast.kr/coastAdmin/research/finalReport.do#
Korea Ministry of Trade, Industry and Energy, 2014. The 4th Renewable Energy Plan. http://motie.go.kr/common/download.do?fid=bbs&bbs_cd_n=16&bbs_seq_n=79321&file_seq_n=346
Korea Ministry of Trade, Industry and Energy, 2015. The 7th Electricity Supply Plan. http://www.motie.go.kr/common/download.do?fid=bbs&bbs_cd_n=81&bbs_seq_n=157410&file_seq_n=75
National Geographic Information Institute, Blank map. http://www.ngii.go.kr/child/contents/contentsView.do?rbsIdx=33
The Korea Times, 2016. ‘Today, not tomorrow, is time to act.’ http://www.koreatimes.co.kr/www/news/nation/2016/01/116_196612.html
The World Bank a, Land Area data, 2016. http://data.worldbank.org/indicator/AG.LND.TOTL. K2?order=wbapi_data_value_2015+wbapi_data_value+wbapi_data_value-last&sort=desc
The World Bank b, World Development Indicators, 2016. http://data.worldbank.org/data-catalog/GDP-ranking-table
USDA Economic Research Service, 2015. South Korea Rice Self-Sufficiency. http://www.ers. usda.gov/topics/international-markets-trade/countries-regions/south-korea/policy.aspx
WWF, 2014. Living Planet Report 2014. http://wwf.panda.org/about_our_earth/all_publications/living_planet_report/
WWFKOREA.OR.KR KOREA ECOLOGICAL FOOTPRINT REPORT 2016
KR
© 1986 Panda symbol WWF – World Wide Fund For Nature (Formerly World Wildlife Fund)® “WWF” is a WWF Registered Trademark.
KOREA ECOLOGICAL FOOTPRINT REPORT 2016 IN NUMBERS
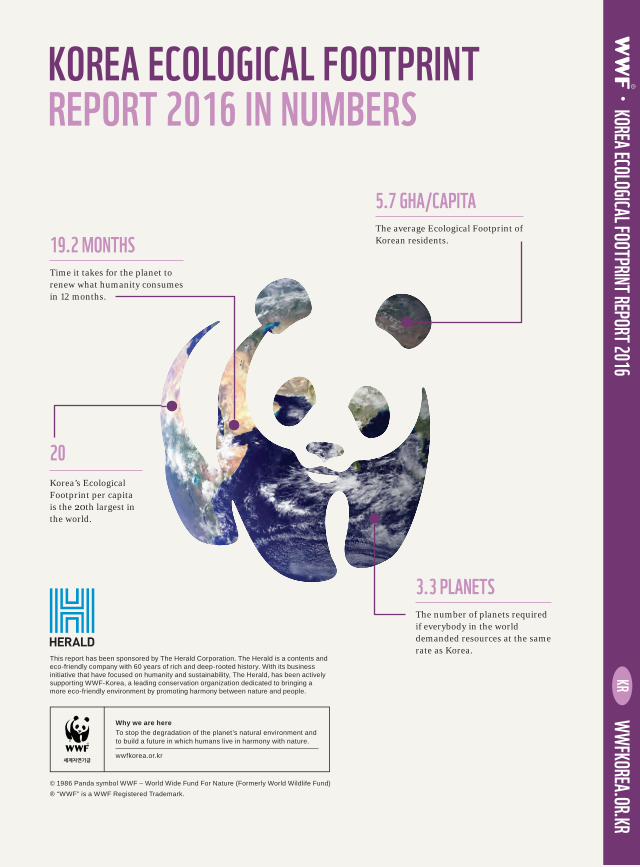
5.7 GHA/CAPITAThe average Ecological Footprint of Korean residents.19.2 MONTHS
Time it takes for the planet to renew what humanity consumes in 12 months.
3.3 PLANETSThe number of planets required if everybody in the world demanded resources at the same rate as Korea.
20Korea’s Ecological Footprint per capita is the 20th largest in the world.
This report has been sponsored by The Herald Corporation. The Herald is a contents and eco-friendly company with 60 years of rich and deep-rooted history. With its business initiative that have focused on humanity and sustainability, The Herald, has been actively supporting WWF-Korea, a leading conservation organization dedicated to bringing a more eco-friendly environment by promoting harmony between nature and people.
Why we are hereTo stop the degradation of the planet’s natural environment and to build a future in which humans live in harmony with nature.
wwfkorea.or.kr
Top Related