


Languages
Pages
Legal


Know Thy Emissions Before Others DoOdor Reduction | Greenhouse Gas Emissions Reductions | Improved Compliance Record
MWCC Presentation | July 13, 2021

Active in 14+ states, five investor-owned waste companies and various municipalities
Aerial OpsSnifferDRONE™ for emissions monitoring
Aerial surveying/mapping for airspace, density calcs, cut/fill, etc.
Aerial Imagery (thermal, multi-spectral, RGB)
Manual OpsSurface emissions monitoring & penetration inspection for compliance – active in 7 states
Asset inventory – identification, tagging & inspection
GIS ServicesEsri licensing, development, and back-end support
Now working in Missouri!
© 2021 Sniffer Robotics, LLC

The Challengethe “Whack-A-Mole” trap

Greater scrutiny is coming…
• Technology is rapidly improving, and stakeholders are quickly adopting
• Increased regulation (penetration inspection, etc.)• Increased scrutiny and accountability for emissions with
increased public exposure risk
https://www.reuters.com/business/sustainable-business/methane-menace-aerial-survey-spots-super-emitter-landfills-2021-06-18/
Meeting current regulation may not be enough
June 18, 2021
“Everyone should be profiling their assets” in preparation for future emissions scrutiny.
Worthing F Jackman, President & CEO Waste ConnectionsWaste Expo 2021, Tuesday, June 29th, 2021
© 2021 Sniffer Robotics, LLC

A comprehensive approachTHIRD-PARTY SPECIALIST FOR EMISSIONS MONITORING IS RECOMMENDED

Site Profiles – Methane EmissionsSniffer’s Comprehensive Landfill Cover Integrity Assessment (LCIA)
• Methane data collection (SnifferDRONE) • Cover integrity
• Manual verification• Penetration logging &
inspection1 2
3.
© 2021 Sniffer Robotics, LLC

Site Profiles – Methane EmissionsSniffer’s Comprehensive Landfill Cover Integrity Assessment (LCIA)
• Data to Actionable Information• Trends and Analytics• Geospatial Analysis• Dynamic Viewing and Reporting
3
Sniffer Field Ops™• Automates data collection and
reporting• Serves to ensure quality of work• You see what our technician sees• Automated alerts when exceedances
are found
SnifferVIEW™KPI Dashboard Viewer
• Operational dashboard• High-level view of multiple locations – KPIs and active tracking• Highly flexible and customizable for additional content
Final Reports
© 2021 Sniffer Robotics, LLC

Data can be problematic but,
information is our friendA GIS systems approach
Aggregated data for an analytical scorecard
Holistic view provides better perspective, better identifies the real issue(s), helps to prioritize actions, identifies trends, and helps in predictive modeling
Scorecard approach based on exceedances measured throughout the year categorized according to the following methodology
Stability – are the exceedances consistent?
Trend – are the exceedance concentrations increasing/decreasing?
Risk – are the locations problematic and/or hazardous?
Surface Emissions by 100’ grid - TREND
Cover Penetrations - RISK© 2021 Sniffer Robotics, LLC

Surface Emissions Monitoring Current State – Safety Risk
Potential HazardsTechnician risks while managing challenging field conditions
Fatigue
Injuries
Exposure
Insect, animals…
Potential exposure to high-levels of hazardous gases
Ticks, spiders, scorpions & other
Insects
Snakes
Ice & Snow Drifts
Mud
Trip & fall hazards
The elements
Alligators & other animals
Thick & high brush
© 2021 Sniffer Robotics, LLC

Surface Emissions MonitoringEfficiency & Effectiveness – Opportunity for Improvement
Performance lacks consistency • Interpretation in the method
• Technician training, performance, subjectivity
• Credibility issue?
Actual walking path: 350 acres = 57 miles
TimePlanning: ~15 miles per 100 acres (10-hour day/technician)
Actual: 40 +/- 5 manhours to walk 57 miles (350 acres) for SEM
surface scan
< 10% of the inspected area is problematic
Imperfect method, but solutions can improve performance
Objectives:
• Improve safety
• Improve consistency in application
• Attack the 90% of wasted time
© 2021 Sniffer Robotics, LLC

© 2021 Sniffer Robotics, LLC
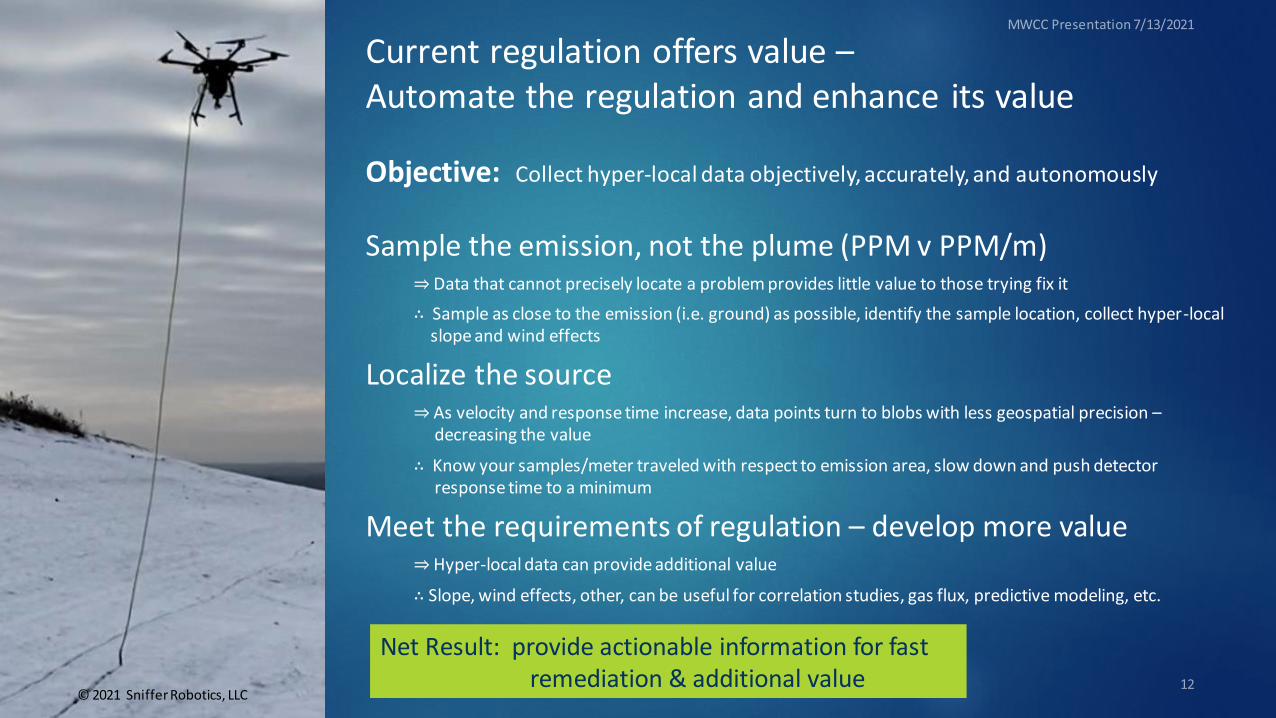
Current regulation offers value –Automate the regulation and enhance its value
Objective: Collect hyper-local data objectively, accurately, and autonomously
Sample the emission, not the plume (PPM v PPM/m)⇒ Data that cannot precisely locate a problem provides little value to those trying fix it
∴ Sample as close to the emission (i.e. ground) as possible, identify the sample location, collect hyper-localslope and wind effects
Localize the source⇒ As velocity and response time increase, data points turn to blobs with less geospatial precision –
decreasing the value
∴ Know your samples/meter traveled with respect to emission area, slow down and push detectorresponse time to a minimum
Meet the requirements of regulation – develop more value⇒Hyper-local data can provide additional value
∴ Slope, wind effects, other, can be useful for correlation studies, gas flux, predictive modeling, etc.
Net Result: provide actionable information for fastremediation & additional value
© 2021 Sniffer Robotics, LLC

SnifferDRONE
Operating conditions
• 14°F to 104°F• <8m/s (18mph) ground wind speed• No precipitation
Cover Systems • Final, intermediate, temp covers• Aggressive slopes• High/dense vegetation¹
Cover Integrity capability
• 4K FPV video & imagery• Ability to deviate from flight plan during flight to inspect area
Compliance • 5-10 cm from ground surface during operation• Meets detector requirements, flow rate, response time, calibration procedures,
and sensor accuracy• Method allows for flight paths consistent with regulatory & operational
requirements• Measures and reports methane concentration in PPM
Safety features • “Break-away” tail• Active piloting for obstacle avoidance• Intrinsically safe, if required
Accuracy • More effective at identifying leaks than manual• >90% of all leaks reported by the SnifferDRONE can be manually verified• SnifferDRONE reported leaks can be manually identified within 20’ (average). 95%
of all leaks can be manually identified within 45’.
Effectiveness • Infinite flight planning capabilities (30m, 15m, etc.)• Greater control in area to be scanned• Can be utilized in areas and conditions that are hazardous for technicians
• Flying at 6m AGL, the SnifferDRONE in close proximity to airports within controlled airspace.
Efficiency • Surface scan in 1/3 the manhours as manual• Overall operation in half the manhours (verification + penetrations)
SnifferDRONE™Automated means for methane data collection
Compliant | Safer | More accurate, efficient, effective
¹ General rule of thumb, if a technician can walk through it, SnifferDRONE can successfully perform.
The Industry’s Best Available Technology
© 2021 Sniffer Robotics, LLC

Emissions monitoring in hazardous areas
SnifferDRONE™ “extras”Cover integrity during flight ops
© 2021 Sniffer Robotics, LLC

Pre-programmed flight path (30m)
Manual Verification (surface)
Manual Verification (penetration)
PPM measurement provides specificity
25’ / avg
44’ / 95% Quality Assurance: geospatial buffer (30m shaded area) from actual flight path
Area where flight path spacing exceeded 30m
Objective Data Precise & Accurate Localized & Verifiable Repeatable Quality Assurance
© 2021 Sniffer Robotics, LLC

Case Study
“Sniffer is my truth detector”
SnifferDRONE data aggregated in 100’ grids (Max PPM)
October 2019
January 2020
February 2020
April 2020
May 2020
Jun 2020
October 2019
January 2020
February 2020
April 2020
May 2020
Jun 2020
October 2019
January 2020
February 2020
April 2020
May 2020
Jun 2020
October 2019
January 2020
February 2020
April 2020
May 2020
Jun 2020
October 2019
January 2020
February 2020
April 2020
May 2020
Jun 2020
October 2019
January 2020
February 2020
April 2020
May 2020
Jun 2020
October January February April May June SeptemberAugust
• Investor owned NSPS XXX MSW site• Location: Great Lakes• ~120 acres
Challenged site with ongoing odor and compliance issues whose manual surface emissions monitoring results (4-6 exceedances/qtr) did not provide necessary information to help resolve the issues.
Safer: Reduced onsite technician(s) labor by half
More efficient: Obtained results in half the manhours
More effective:
• Identified more leak locations vs. manual
• A contributing factor in reducing onsite odors and
improving compliance record
• A major contributor in improving credibility with
stakeholders
• Used to help design gas collection system, temporary
cover system, and verify their efficiencies
Results
Qualitative heat map superimposed over the gas collection system design identified an area requiring new gas
collection branch.
On average, <0.5% of all data collected by the SnifferDRONE is > 500 PPM~1% of all data collected is 200 PPM > < 499 PPM
© 2021 Sniffer Robotics, LLC

Case Study
“Game Changer”• Investor owned NSPS WWW MSW site• Location: Texas• ~140 acres
Issue:
• Continued odor complaints from neighbors to the north
• Quarterly surface emissions monitoring produced <10 exceedances performed by national engineering firm – managed by onsite gas developer
Results:
• Established new baseline for emissions (note: many were in non-NSPS area)
• Exceedances measured at 30% of all penetrations
• 180 locations with exceedance (42% penetrations, 38% surface)
• Confirmed need for gas collection system in recently closed area
• Area of largest methane concentrations correlated to area of highest H2S emissions
• Identified the problem and a means to verify remediation performance (follow-up inspection planned in August)
© 2021 Sniffer Robotics, LLC

Case Study
New baseline for quarterly SEM
Q2 Manual SEM (2)
>500 PPM
200 PPM >< 500 PPM
SnifferDRONE
Investor owned NSPS WWW MSW site
Location: Southeastern US
~130 acres
Corporate
initiative to better
understand
quarterly SEM
performance and
overall emissions
© 2021 Sniffer Robotics, LLC

Case Study
“Exceeded our expectations”Public NSPS WWW MSW site
Location: Caribbean
Acreage: 60
Objective: SnifferDRONE SEM scan over the entire site for compliance purposes
RESULTS
• Safer: Greatly reduced technician exposure to hazardous conditions
• More Efficient: SnifferDRONE was able to scan nearly twice as more area than what was scanned manually, at half the manhours
• More Effective:
• Identified low-level emissions + elevated methane concentrations over the full cover
• Images of the cover, geospatially referenced for cover integrity studies
• Provided raw data with analytics in SnifferVIEW™ for customer analysis
Site Challenges included 2:1 slopes, dense vegetation, surface fires, surface obstacles, controlled airspace from international airport in close proximity.
Manual SEM over the entire site has not been possible due to site conditions.
© 2021 Sniffer Robotics, LLC

Speed is a virtueTools to inform. Inform for Action.
Sniffer Field Ops™
• Photographs, observations, and other data
• Automates data collection and reporting
• Serves to ensure quality of work• You see what our technician sees,
instantaneously• Automated alerts when
exceedances are found Sniffer provides customization, app development, back-end support, and licenses
for Esri solutions
Sniffer Symbology
A Sniffer developed software app for field operations
© 2021 Sniffer Robotics, LLC

Built to serve…
• Improve operational effectiveness
• Identify odor sources and verify
• Improve gas collection efficiency and verify
• Establish new baseline for emissions monitoring
• Prepare for future scrutiny
Our FocusUS EPA approval of
SnifferDRONE method for surface emissions
monitoringAerial Ops | Field Ops | GIS Services
Sniffer Robotics LLCwww.snifferrobotics.com
[email protected] | 855/476-4333
Top Related