


Languages
Pages
Legal


G
0 «
<>, ,i.b"
~ 0
0
~', '-'\\ "
<)
r t, <9
I
I G' , , "', I, i
/
0 () " .@
.
~
'" 11 0 ,.. "-
elY
<" --. D <Q
If you have issues viewing or accessing this file contact us at NCJRS.gov.

KENTUCKY STATE POLICE RESEARCH AND DEVELOPMENT SECTION
KENTUCKY STATE POLICE
PURSUIT STUDY, 1989-90
By
Steve Oechs1i
* * * * * *
Captain Randy Overstreet, Commander
U.S. Department of Justice National Institute of Justice
June 1990
125701
This document has been reproduced exactly as received from the person or organization originating it. Points of view or opinions stated in this document are those of the authors and do not necessarily represent the official position or policies of thG National Institute of Justice.
Permission to reproduce this copyrighted material has been granted by
Kentuckt State Police
to the National Criminal Justice Reference Service (NCJRS).
Further reproduction outside of the NCJRS system requires permission of the copyright owner.

..
KENTUCKY STATE POLICE PURSUIT STUDY 1989-90
Statistical analyses of police pursuit driving have typically been
approached from a largely urban or suburban service population perspective.
The California 6ighway Patrol study (1983) is perhaps the most widely-known of
these studies, followed by the Alpert-Dunham studies examining pursuit driving
data from the Metro-Dade County Police Department in Miami, Florida (1985-87).
Other recent pursuit driving studies have focused on Mesa, Arizonaj Nassau
County, . New York ; .Phoenix i Arizona i and St. Petersburg·, Florida.
The Kentucky State Police is the primary and, in some cases, the only
police department serving the smaller cities and the rural areas of Kentucky.
Thinking that a statistical analysis of police pursuit driving from d rural
police department perspective could prove insightful, this agency began
compiling pursuit driving data from intra-agency teletypes in 1989. Now, with
the first twelve months of data assembled, it is possible to state the
contrasts and similarities apparent between urban and rural police pursuit
driving.
DEFINITION
For the purposes of this study, a "PURSUIT" is defined as: "AN ACTIVE
ATTEMPT BY A LAW ENFORCEHENT OFFICER ON DUTY IN A PATROL CAR TO APPREHEND ONE
OR MORE OCCUPANTS OF A MOVING MOTOR VEHICLE, PROVIDING THE DRIVER OF SUCH
VEHICLE IS AWARE OF THE ATTEMPT AND IS RESISTING APPREHENSION BY MAINTAINING OR
INCREASING HIS SPEED OR BY IGNORING THE LAW ENFORCEMENT OFFICER'S ATTEMPT TO
STOP HIM."

- ~~--------
COMPARISON OF URBAN AND RURAL POLICE DEPARTMENT RESULTS
As an overview to the 1989-90 Kentucky State Police pursuit driving data, a
direct comparison with the 1985-86 Metro-Dade County Police Department is
useful. Table I shows, in the category "DURATION IN MINUTES," a tendency in
the urban policy department towards more short-duration pursuits and fewer
long-duration pursuits than the rural police department. 77.7% of the urban
agency pursuits lasted 0-5 minutes, versus 65.5% of the rural agency pursuits.
More significantly, only 6 .. 5% of the urban agency pursuits extended 11 or more
minutes, while 17.5% of the rural agency pursuits lasted that long.
In the "REASON fOR PURSUIT" category, the urban agency pursuit is shown to
be instigated more often for Traffic offenses, a BOLO, a Felony offense or
Other (such as equipment violations) than a pursuit in its rural agency
counterpart. Conversely, by a margin of 4.0% to 32.3%, the urban agency
pursuit is much less likely than a rural agency pursuit to be instigated by
Reckless Driving/DUI.
In the "OUTCOME OF PURSUIT" category, the urban agency pursuit is less
likely, by 61.8% to 77.9%, to result in an arrestj is more likely, by 37.2% to
21.7% to result in an escapej and is more likely, by 1.0% to 0.4%, to result in
a death than a rural agency pursuit. Also, while 14.3% of urban agency
pursuits result in personal injury, only 5.5% of rural agency pursuits result
in same.
A "FORCIBLE STOP" is less likely to be utilized in the urban agency pursuit
than the rural agency pursuit by a margin of 7.0% to 11.5%, yet, the likelihood
of accident illustrated by "TOTAL ACCIDENTS/TOTAL PURSUITS" is more probable in
the urban agency pursuit by a margin of one (1) accident per 2.9 pursuits to
2

KENTUCKY STATE POLICE PURSUITS 5/1/89 - 4/30/90
TABLE I
METRO-DADE CO. P.D. KENTUCKY STATE POLICE 8/1/85 - 7/31/86 5/1/89 - 4/30/90
NUMBER OF PURSUITS 398 (lOO.O%) 235 (100.0%)
DURATION IN MINUTES - 0-5 309 (77.7) 154 (65.5) - 6-10 63 (15.8) 40 (17.0) - 11+ 26 (6.5) 41 (17.5)
REASON FOR PURSUIT - Traffic 241 (60.5) 98 {41. 8} - BOLO 52 (13.1) 20 (8.5) - Felony 35 (8.8) 13 (5.5) - Reckless/DUr 16 (4.0) 76 (32.3) - Other 54 (13.6) 28 (11. 9)
w
OUTC0l1E OF PURSUIT - Arrest 246 (61. 8) 183 (77.9) - Escape 148 (37.2) 51 (21. 7) - Death* 4 (1. 0) 1 (0.4)
- Accident N.A. N.A. 53 (22.6) - No Accident N.A. N.A. 182 (77.4)
- Injury 57 (14.3) 13 (5.5) - No Injury 341 (85.1) 235 (94.5)
FORCIBLE STOPS - Yes 28 (7.0) 27 (II. 5) _. No 370 (93.0) 208 (88.5)
TOTAL ACCIDENTS/TOTAL PURSGITS 135/398 (1/2.9) 68/235 (1/3.5)
TOTAL INJURIES/TOTAL PURSUITS N.A. 17/235 (1/13.8)
*Excluded from Arrest count.

----------- ----------_ .. _._.-.. _--------------
one (1) accident per 3.5 pursuits.
COMPARISON OF RURAL POLICE DEPARTMENT PURSUITS - WITHOUT AND WITH ACCIDENT
Beyond the comparison of urban and rural police department pursuit driving
data, a second focus of the Kentucky State Police study was a comparative
analysis of what types of pursuits lend themselves to an incidence of accident
and, hence, injury, and what types don't. Table II shows, in the category
"MONTH OF YEAR," that the plural i ty of pursuits without accident occ'urs in
April, while the plurality of pursuits with accident occurs in December.
Saturday is the "DAY OF WEEK n that any pursuit is most likely to occur -
without or with accident. The 6-hour period from 18:01 to 24:00 is the "TIME
OF DAY" that any pursuit is most likely to occur.
77.6% of pursuits without accident take place on a 2-lane "TYPE OF ROADWAY"
while a virtually-identical 77.4% of pursuits with accident also occur on
2-lane roadway. A 46.2% plurality of pursuits without accident and a 56.6%
majority of pursuits with accident range in the 61-90 MPH "TOP SPEED
(SUSPECT)." Interestingly, among the 235 reported pursuits in this study, only
one involved an estimated suspect vehicle speed in excess of 120 MPHi this
pursuit did not involve an accident. Conversely, 23.6% of pursuits without
accident and 17.0% of pursuits with accident range in the 0-60 MPH "TOP SPEED
(SUSPECT}."
Under "POLICE UNITS INVOLVED," 60.0% of pursuits without accident and 49.0%
of pursuits with accident involve only one police unit. A clearer difference
emerges when four or more police units are involved: then, 13.7t of pursuits
without accident are found in this category versus 30.2% of pursuits with
4

KENTUCKY STATE POLICE PURSUITS S/1/89 - 4/30/90
TABLE II
TOTAL JAN FEB MAR APR MAY JUN JUL AUG SEP OCT NOV DEC I I I PURSUITS lS2 19 14 22 26 16 10 19 10 S 13 18 10 I WITHOUT ACCIDENT (100.0t) (10.4 ) (7.7) (12.2) (14.3) (8.S) (5.S) (10.4) (S.S) (2.7) (7.1 ) (9.9) (S.S) I I I PURSUITS S3 3 7 S 7 3 5 S 2 4 1 3 8 I 'WITH ACCIDENT (100.0t) (S.7) (B.2) (9.4) (13.2) (S.7) (9.4) (9.4) (3.S) (7.S) (1. 9) (S.7) (lS.l}1 I I ALL 23S 22 21 27 33 19 lS 24 12 9 14 21 IS I PURSUITS (lOO.Ot) (9.4) (S.9) (11. S) (14.0) (S.l) (6.4) (10.2) (S.l ) (3.S) (6.0) (S.9) (7.7) I
l.n

KENTUCKY STATE POLICE PURSUITS 5/1/S9 - 4/30/90 TABLE II (cont.)
TOTAL DAY OF WEEK
SU M T W TH F SA
PURSUITS 182 44 14 18 11 12 29 64 WITHOUT ACCIDENT (100.0%) (24.2) (7.7) (9.9) (6.0) (6.6) (15.9) (29.7)
PURSUITS 53 10 2 2 3 6 12 18 ':'lITH ACCIDENT (lOO.O%) (lS.9) (3.8) (3. S) (5.7) (1l.3) (22.6) {33.9}
ALL 235 54 16 20 14 IS 41 72 PURSUITS (100.0%) (23.0) (6.8)
0'> (8.5) (6.0) (7.7) \11.4) pO.3)}

TOTAL
PURSUITS 182 WITHOUT ACCIDENT (lOO.Ot)
PURSUITS 53 WITH ACCIDENT (100.0%)
ALL 235 PURSUITS (100.0%)
-...I
KENTUCKY STATE POLICE PURSUITS 5/1/89 - 4/30/90 TABLE II (cont.)
TIME OF DAY
00:01-06:00 06:01-12:00 12:01-18:00
50 11 31 (27.5) (6.0) (17.0)
18 4 7 (33.9) (7.5) (13.2)
68 15 38 (28.9) (6.4) (16.2)
18:01-24:00
90 (49.5)
24 (45.4)
114 (48.S)

KENTUCKY STATE POLICE PURSUITS 5/1/89 - 4/30/90 TABLE II (cont.)
TOTAL TYPE OF ROADWAY TOP SPEED (SUSPECT)
1&2 LN 2 LN 2&4LN 4 LN 0-60 61-90 91-120 121+
PURSUITS 182 9 141 9 23 43 84 ~ i~ 1 WITHOUT ACCIDENT (100.0%) (4.9) (77 .6) (4.9) (12.6) (23.6) (46.2) (29.7) (O.5}
PURSUITS 53 3 41 4 5 9 30 14 0 WITH ACCIDENT (100.0%) (5.7) (77.4) (7.5 ) (9.4) (l7.0) (56.6) (26.4) (O.O)
ALL 235 12 182 13 28 52 114 68 1 PURSUITS (100.0%) (5.0) (77 .6) (5.5) (11. 9) (22.1) (48.6) (28.9) (0.4)
(XI

KENTUCKY STATE POLICE PURSUITS 5/1/89 - 4/30/90 TABLE II (cont.)
TOTAL POLICE UNITS INVOLVED DURATION IN MINUTES I I
ONE TWO THREE FOUR+ RANGE AVG. 0-5 6-10 11+ RANGE AVG. I I I
PURSUITS lS2 109 29 19 25 1-17 2.2 125 30 27 .5-62 6.2 I WITHOUT ACCIDENT (100.0t) (60.0) (15.9) (10.4 ) (13.7) (6S.7) (16.5) {14.8} I
I I
PURSUITS 53 26 8 3 16 1-17 3.2 29 10 14 1-48 9.8 I WITH ACCIDENT (lOO.Ot) (49.0) (lS.l) (5.7) (30.2 ) (54.7) (lS.9) (26.4) I
I I
ALL 235 135 37 22 41 1-17 2.4 154 40 41 .5-62 7.0 I PURSUITS (lOO.Ot) (57.4) (15.7) (9.4) (17.5) (65.5) (17.0) (17.5) I
\0

KENTUCKY STATE POLICE PURSUITS 5/1/89 - 4/30/90 TABLE II (cont.)
TOTAL REASON FOR PURSUIT
TRAFFIC BOLO FELONY RECKLESS/DUI OTHER
PURSUITS 182 81 13 9 57 22 WITHOUT ACCIDENT (100.0%) (44.5) (7.1) (4.9) (31. 3) (12.2)
PURSUITS 53 17 7 4 19 6 WITH ACCIDENT (lOO.O%) (32.2) {13.2} (7.5 ) (35.8) (11. 3)
ALL 235 98 20 13 76 28 PURSUITS (lOO.Ot) {41. 8} (8.5) (5.S) (32.3) (11.9)
..... 0

KENTUCKY STATE POLICE PURSUITS 5/1/89 - 4/30/90 TABLE II (cont.)
TOTAL OUTCOME OF PURSUIT FORCIBLE STOP ALCOHOL OR DRUGS
ARREST ESCAPE DEATH* YES. NO YES NO
PURSUITS 182 139 43 0 13 169 83 99 WITHOUT ACCIDENT (100.0%) (76.4) (23.6) (0.0) (7.1 ) (92.9) (45.6) (54.4)
PURSUITS 53 44 8 1 14 39 32 21 WITH ACCIDENT (100.0%) (83.0) (15.1) (1. 9) (26.4 ) (73.6) (60.4) (39.6)
ALL 235 183 51 1 27 208 115 120 PURSUITS (100.0~) (77.9) (21. 7) (0.4 ) (11. 5) (88.5) {48.9) (51.1 )
.....
.....
*Excluded from Arrest count.

accident. The average pursuit without accident involved 2.2 police units
versus 3.2 units for the average pursuit with accident.
The majority of all pursuits, as shown under "DURATION IN MINUTES," lasts
0-5 minutes. There is an inclination for pursuits without accidents to be
shorter in duration than pursuits with accidents; this is most plainly
evidenced by a comparison of the 14.8% of pursuits without accident extending
11 or more minutes versus the 26.4% of pursuits with accident extending into
the same range. The average pursuit without accident lasted 6.2 minutes versus
9.8 minutes for the average pursuit with accident.
A Traffic violation was the "REASON FOR PURSUIT" for the plurality of
pursuits without accident, while Reckless Driving/DUI was the instigating
incident for the plurality of pursuits with accident. In the same "REASON FOR
PURSUIT" category. pursuits with accidents are more likely to ensue from a
BOLO, a Felony offense, or Reckless Driving/OUr than pursuits without
accidents, and less likely to ensue from Traffic offenses or Other (such as
equipment violations).
Regarding the "OUTCOME OF PURSUIT," the driver of the suspect vehicle was
arrested in 76.4% of the pursuits without accident and in 83.0% of the pursuits
with accident. A darker way of looking at this is that, if the goal of a
pursuit is immediate apprehension, 23.6% of pursuits without accident and 17.0%
of pursuits with accidents accomplish nothing. The ultimate in futility occurs
when the suspect vehicle crashes and the suspect still manages to flee the
scene on foot; this scenario plays out in 9.4% of pursuits with accidents.
Overall, a "FORCIBLE STOP" had to be employed in 7.7% of the pursuits without
accidents and in 28.3% of the pursuits with accidents.
Nearly half - 45.6% - of the pursuits without accidents were related to
12
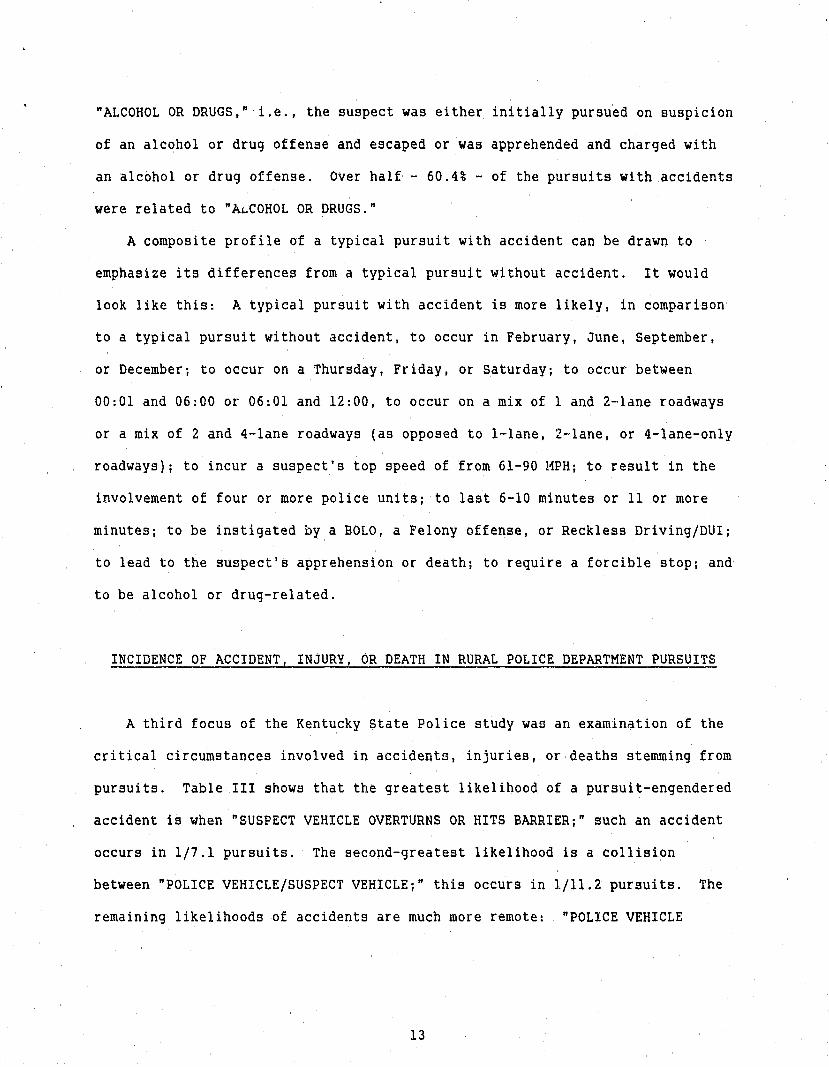
"ALCOHOL OR DRUGS," i.e., the suspect was either initially pursued on suspicion
of an alcohol or drug offense and escaped or was apprehended and charged with
an alcohol or drug offense. Over half - 60.4% - of the pursuits with accidents
were related to "A~COHOL OR DRUGS."
A composite profile of a typical pursuit with accident can be drawn to
emphasize its differences from a typical pursuit without accident. It would
look like this: A typical pursuit with accident is more likely, in comparison
to a typical pursuit without accident, to occur in February, June, September,
or December; to occur on a Thursday, Friday, or Saturday; to occur between
00:01 and 06:00 or 06:01 and 12:00, to occur on a mix of 1 and 2-lane roadways
or a mix of 2 and 4-lane roadways (as opposed to l-lane, 2-lane, or 4-lane-only
roadways); to incur a suspect's top speed of from 61-90 MPH; to result in the
involvement of four or more police units; to last 6-10 minutes or 11 or more
minutes; to be instigated by a BOLO, a Felony offense, or Reckless Driving/DUI;
to lead to the suspect's apprehension or death; to require a forcible stop; and
to be alcohol or drug-related.
INCIDENCE OF ACCIDENT, INJURY, OR DEATH IN RURAL POLICE DEPARTMENT PURSUITS
A third focus of the Kentucky State Police study was an examination of the
critical circumstances involved in accidents, injuries, or deaths stemming from
pursuits. Table III shows that the greatest likelihood of a pursuit-engendered
accident is when "SUSPECT VEHICLE OVERTURNS OR HITS BARRIER;" such an accident
occurs in 1/7.1 pursuits. The second-greatest likelihood is a collision
between "POLICE VEHICLE/SUSPECT VEHICLEj" this occurs in 1/11.2 pursuits. The
remaining likelihoods of accidents are much more remote: "POLICE VEHICLE
13

...... ~
POLICE VEHICLE/SUSPECT VEHICLE
POLICE VEHICLE/POLICE VEHICLE
POLICE VEHICLE/CIVILIAN VEHICLE
POLICE VEHICLE OVERTURNS O~ HITS BARRIER
SUSPECT VEHICLE/CIVILIAN VEHICLE
SUSPECT VEHICLE OVERTURNS OR HITS BARRIER
ALL ACCIDENTS
KENTUCKY STATE POLICE PURSUITS 5/1/89 - 4./30/90
TABLE III
INCIDENCE OF ACCIDENT
ACCIDENTS/PURSUITS INCIDENCE
21/235 1/11.2
3/235 1/78.3
3/235 1/78.3
4./235 1/58.8
4/235 1/58.8
33/235 1/7 .1
68/235 1/3 .5

KENTUCKY STATE POLICE PURSUITS 5/1/89 - 4/30/90
TABLE III (cont.)
INCIDENCE OF INJURY
INJURIES/ACCIDENTS INCIDENCE INJURIES/PURSUITS INCIDENCE
POLICE VEHICLE/SUSPECT VEHICLE 0/21 0 0/235 0
POLICE VEHICLE/POLICE VEHICLE 0/3 0 0/235 0
POLICE VEHICLE/CIVILIAN VEHICLE 2/3 1/1.5 2/235 1/117.5
~ POLICE VEHICLE OVERTURNS OR HITS BARRIER 1/4 1/4.0 1/235 1/235.0
SUSPECT VEHICLE/CIVILIAN VEHICLE 0/4 0 0/235 0
SUSPECT VEHICLE OVERTURNS OR HITS BARRIER 14/33 1/2.4 14/235 1/16.8
ALL ACCIDENTS 17/68 1/4.0 17/235 1/13.8
KENTUCKY STATE POLICE PURSUITS 5/1/89 - 4/30/90
TABLE III (cont.)
INCIDENCE OF DEATH
DEATHS/ACCIDENTS INCIDENCE DEATHS/PURSUITS INCIDENCE
POLICE VEHICLE/SUSPECT VEHICLE 0/21 0 0/235 0
POLICE VEHICLE/POLICE VEHICLE On 0 0/235 0
POLICE VEHICLE/CIVILIAN VEHICLE 0/3 () 0/235 0
...... POLICE VEHICLE OVERTURNS OR HITS BARRIER 0/4 0 0/235 0 0-
SUSPECT VEHICLE/CIVILIAN VEHICLE 0/4 0 0/235 0
SUSPECT VEHICLE OVERTURNS OR HITS BARRIER 1/33 1/33.0 1/235 1/235.0
ALL ACCIDENTS 1/68 1/68.0 1/235 1/235.0

OVERTURNS OR HITS BARRIER" in 1/58.8 pursuits, "SUSPECT VEHICLE/CIVILIAN
VEHICLE" collision in 1/58.8 pursuits, ·POLICE VEHICLE/POLICE VEHICLE"
collision in 1/78.3 pursuits ~nd "POLICE VEHICLE/CIVILIAN VEHICLE" collision in
1/78.3 pursuits.
The greatest risk of personal injury in a pursuit-engendered accident is
when a collision occurs between "POLICE VEHICLE/CIVILIAN VEHICLE;" the rate of
injury here is 1/1.5 accidents. The second-greatest risk of injury is when
"SUSPECT VEHICLE OVERTURNS OR HITS BARRIER;" the rate of injury is 1/2.4
accidents. The third-greatest risk is when "POLICE VEHICLE OVERTURNS OR HITS
BARRIER;" the rate of injury is 1/4.0 accidents. No other categories of
accident resulted in injury in this study.
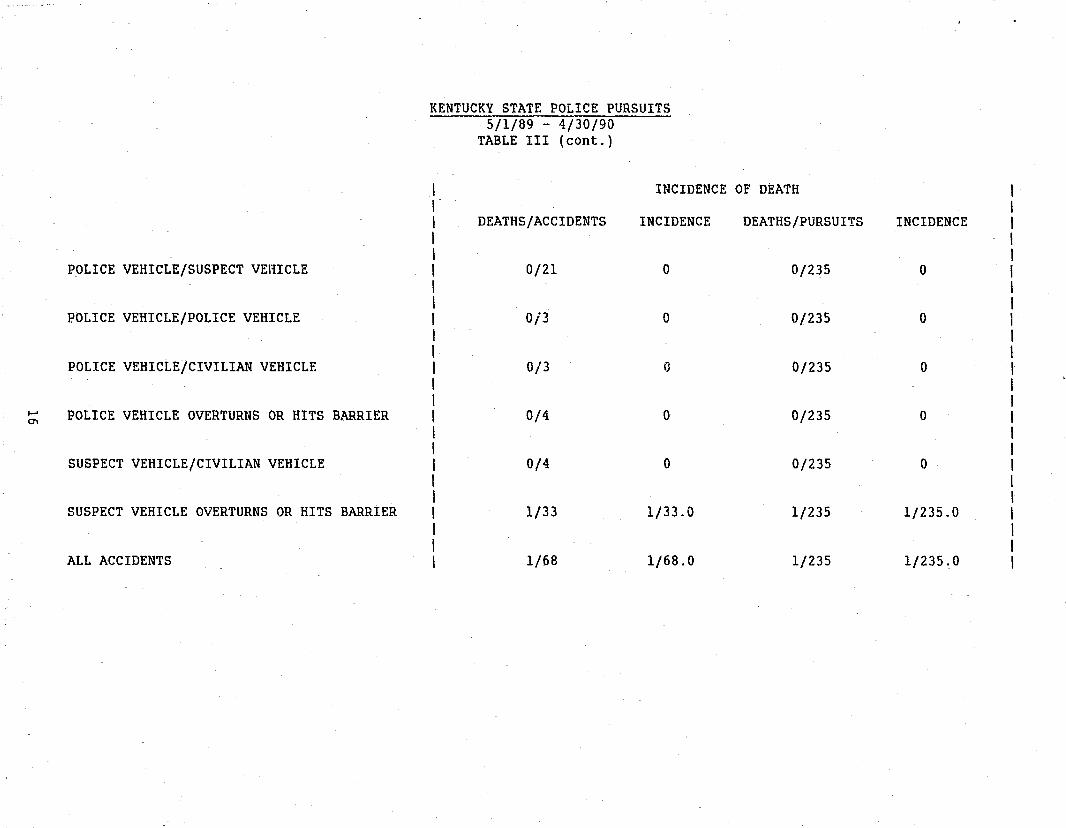
Regarding the risk of death in a pursuit-engendered accident, only one
death was attributable to pursuits in this study. That one death occurred when
"SUSPECT VEHICLE OVERTURNS OR HITS BARRIER," yielding an incidence of death of
1/33.0 such accidents.
CONCLUSION
To bring this analysis of the 5/1/89 - 4/30/90 Kentucky State Police
pursuit driving data to both a close and a summation, a quick comparison to the
findings of previous pursuit studies follows!
CENTER FOR ENVIRONMENT AND MAN STUDY, 1969-70
1. Finding: Majority of pursuitrelated fatalities are incurred by the fleeing driver, passengers. or uninvolved bystanders.
17
KENTUCKY STATE POLICE STUDY, 1989-90
1. Finding: Only pursuit-related fatality was incurred by passenger.

2. Finding: Event that triggers pursuit is traffic violation in more than 90% of cases.
3. Finding: Alcohol plays a role in more than half the cases in which driver attempts to evade apprehension.
4. Finding: A significant number of known offenders (roughly 15%) driving without valid license at time of pursuit.
5. Finding: Only a relatively small number (3 to 8%) of pursuits involve stolen vehicles.
6. The majority of pursuit3 occur at night or on weekends.
CALIFORNIA HIGHWAY PATROL STUDY, 1983
1. Finding: Contrary to a 1968 study by Physicians for Automotive Safety that reported 70% of police pursuits to result in accident, this study found that only 29% result in accident.
2. Finding: Contrary to past studies that claimed up to 20% of pursuits resulted in death, this study found that only 1% result in death.
3. Finding: contrary to past studies that clai~ed up to 50% of pursuits resulted in serious injury, this study found that only 11% result in injury of any kind, including minor injury.
4. Finding: Pursuits result in an apprehension rate of approximately 77%.
18
2. Finding: Event that triggers pursuit is traffic violation in only 41.8% of cases.
3. Finding: Slightly less than half (48.9%) of the pursuits are alcohol or drug-related.
4. Finding: 25.1% of known are offenders are driving without valid license at time of pursuit.
5. Finding: Only 1.7% of pursuits involve stolen vehicles.
6. Finding: 77.4% of pursuits occur between 18:01 ond 06:00 and 53.3% of pursuits occur on either Saturday or Sunday.
KENTUCKY STATE POLICE STUDY, 1989-90
1. Finding: 22.6% of pursuits result in accident.
2. Finding: 0.4% of pursuits result in death.
3. Finding: 5.5% of pursuits result in injury of any kind, including minor injury.
4. Finding: Pursuits result in an overall apprehension rate of 77.9%.

5. Finding: Most pursuits last 10 minutes or less.
THE BECKMAN REPORT, 1985
1. Finding: When an officer does not have a back-up unit, the chance of the suspect's escaping is increased.
2. Finding: Use of roadblocks and ramming by police increases the apprehension rate while reducing the overall injury rate.
19
5. Finding: 82.5% of pursuits last 10 minutes or less.
KENTUCKY STATE POLICE STUDY, 1989-90
1, Finding: Multiple-unit pursuits result in a 13.8% escape rate while single-unit pursuits result in a 25.9% escape rate.
1. Finding: Use of a forcible stop increases the apprehension rate from 75.5% to 96.3%; no In]uries were incurred in the 21 collisions between a police vehicle and a suspect vehicle, while 17 injuries were incurred in the 47 other collisions recorded in this study.

REFERENCES
Gallagher, G.P.
The Crisis in Police Pursuit Driver Training: An Action Plan. "Crime
Control Digest," Vol. 23, Nos. 28-31.
Nugent, H., Connors, E.F., McEwen, J.T., and Mayo, L.
Restrictive Policies for High-Speed Police Pursuits. "National Institute
of Justice/Issues and Practices," NCJ 122025.
20
Top Related