


Languages
Pages
Legal


http://hsb.sagepub.com/Social Behavior
Journal of Health and
http://hsb.sagepub.com/content/52/4/404The online version of this article can be found at:
DOI: 10.1177/0022146511418979
2011 52: 404Journal of Health and Social BehaviorPhyllis Moen, Erin L. Kelly, Eric Tranby and Qinlei Huang
Behaviors and Well-Being?Changing Work, Changing Health : Can Real Work-Time Flexibility Promote Health
Published by:
http://www.sagepublications.com
On behalf of:
American Sociological Association
can be found at:Journal of Health and Social BehaviorAdditional services and information for
http://hsb.sagepub.com/cgi/alertsEmail Alerts:
http://hsb.sagepub.com/subscriptionsSubscriptions:
http://www.sagepub.com/journalsReprints.navReprints:
http://www.sagepub.com/journalsPermissions.navPermissions:
What is This?
- Dec 5, 2011Version of Record >>
at Serials Records, University of Minnesota Libraries on December 5, 2011hsb.sagepub.comDownloaded from

Journal of Health and Social Behavior52(4) 404 –429© American Sociological Association 2011DOI: 10.1177/0022146511418979http://jhsb.sagepub.com
Work and Health
Time, especially work time, is a major shaper of human activities (Adam 1995; Gershuny 2000; Hassard 1990; Nowotny 1992; Thompson 1967; Zerubavel 1985), including health-related behav-iors. Norms, rules, and regulations regarding work time constitute what Sennett (1998) calls “time cages”: taken-for-granted, invisible scaffoldings confining the human experience on and off the job. Adults spend much of their waking hours follow-ing institutionalized rhythms around the start and end of workdays and workweeks. These formal and informal time clocks reflect social time (Sorokin and Merton 1937:622), the “qualities with which the various time units are endowed by members of a group,” such that some days are defined as “work” days and some hours are defined
as “work” hours. This social organization of work time is only beginning to be theorized as a struc-tural context with profound implications for life chances and life quality (Bianchi, Robinson, and Milkie 2006; Epstein and Kalleberg 2004; Fenwick
418979 HSB52410.1177/0022146511418979Moen et al.Journal of Health and Social Behavior
1Department of Sociology and Minnesota Population Center, University of Minnesota, Minneapolis, MN, USA2Department of Sociology and Criminal Justice, University of Delaware, Newark, DE, USA
Corresponding Author:Phyllis Moen, University of Minnesota, Department of Sociology, 909 Social Sciences Building, 267 19th Avenue South, Minneapolis, MN 55455, USA E-mail: [email protected]
Changing Work, Changing Health: Can Real Work-Time Flexibility Promote Health Behaviors and Well-Being?
Phyllis Moen1, Erin L. Kelly1, Eric Tranby2, and Qinlei Huang1
AbstractThis article investigates a change in the structuring of work time, using a natural experiment to test whether participation in a corporate initiative (Results Only Work Environment; ROWE) predicts corresponding changes in health-related outcomes. Drawing on job strain and stress process models, we theorize greater schedule control and reduced work-family conflict as key mechanisms linking this initiative with health outcomes. Longitudinal survey data from 659 employees at a corporate headquarters shows that ROWE predicts changes in health-related behaviors, including almost an extra hour of sleep on work nights. Increasing employees’ schedule control and reducing their work-family conflict are key mechanisms linking the ROWE innovation with changes in employees’ health behaviors; they also predict changes in well-being measures, providing indirect links between ROWE and well-being. This study demonstrates that organizational changes in the structuring of time can promote employee wellness, particularly in terms of prevention behaviors.
Keywordsflexibility, gender, health behavior, natural experiment, organizational change, schedule control, sleep, well-being, work-family conflict
at Serials Records, University of Minnesota Libraries on December 5, 2011hsb.sagepub.comDownloaded from

Moen et al. 405
and Tausig 2007; Gershuny 2000; Hochschild 1997; Jacobs and Gerson 2004; Moen 2003; Perlow 1997; Presser 2003; Rubin 2007). Norms around work time are also norms about space—about being at the workplace during certain hours (Coser and Coser 1963; Wheaton and Clarke 2003).
Sociologists can promote understanding of something as taken for granted as the time and timing of work by showing these socially con-structed temporal structures are, in fact, verbs as well as nouns (e.g., Sewell 1992), structuring the lives—including health-related behaviors—of individuals in profound ways. The temporal structure of work refers to the expectations, norms, and unstated assumptions regarding work schedules and work hours, as well as the rules, regulations (e.g., tardiness prompts disciplinary action), reward systems (e.g., “availability” is recognized in performance reviews), and infor-mal interactions (e.g., comments on arriving late, praise for working extra hours) that reinforce expectations and norms.
While time structures have not been fully theo-rized, there is renewed interest in the ways social structures more generally shape lives, and espe-cially health (e.g., Berkman and Kawachi 2003; House 2002; Kleiner and Pavalko 2010; Link 2008; Lutfey and Freese 2005; Phelan et al. 2004). Existing evidence on structural impacts generally examines differences across individuals in differ-ent social locations, using cross-sectional snap-shots, panel studies, or epidemiological patterns.
But what if the structure itself can be changed? This is a fundamental sociological question: whether and to what extent deliberate changes in social structures produce corresponding changes in individual outcomes. To begin incorporating change into an understanding of how social (and specifically temporal) structures influence health-related outcomes, we report evidence from a natu-ral experiment of a business innovation challenging the conventional temporal structure of white-collar work. Specifically, we assess whether a corporate initiative designed to focus attention on results and not on time, called the Results Only Work Envi-ronment (ROWE), promotes healthy behaviors and/or improves employees’ well-being.
ROWE, the corporate initiative we investigate, involves participatory training of work teams to help employees change everyday work processes and practices so that when or where work is accomplished is no longer an issue (Kelly et al.
2010; Moen, Kelly, and Chermack 2009; Ressler and Thompson 2008). A transformation such as ROWE—loosening work-time cages, clocks, and calendars—should, we argue, promote health-related outcomes precisely because it increases employees’ schedule control and reduces the stress of work-life conflict.
Using longitudinal data from 659 white-collar employees, half of whom participated in ROWE and half of whom continued conventional work arrangements, we ask the following: (1) Does this deliberate change in the temporal structure of work predict changes in health-related outcomes? (2) Does the ROWE initiative affect health out-comes through the mechanisms of increasing employees’ schedule control and/or reducing stress-ful work-family conflicts?
BACKGROUNDExtending the Job Strain Model
Little research focuses on control over working time, but there is a large body of evidence on the impacts of job control more generally. In his job strain model, Karasek (1979:290; see Karasek and Theorell 1990) describes job control as an employ-ee’s “potential control over his tasks and his con-duct during the working day” that is conducive to health. Scholars have empirically linked it to exhaustion and depressive symptoms (Mausner-Dorsch and Eaton 2000), blood pressure and mood (Rau and Triemer 2004), heart disease (Bosma, Stansfeld, and Marmot 1998), mental and physical health (D’Souza et al. 2003; Stansfeld and Candy 2006), and work-family conflict (Thomas and Ganster 1995). Thus, there is ample evidence in the occupational health literature linking employ-ees’ control over how they perform their work with health outcomes (de Lange et al. 2004; van der Doef and Maes 1999), but many employees are stressed because they do not have control over their working time.
Corporate policies and practices offering employees greater schedule control, that is, the ability to decide when and where they do their jobs, may be especially important for the health behavior and well-being of contemporary employees, given the increasing time pressures, time speed-ups, and time conflicts most are experiencing. Schedule control appears to be distinct from but related to traditional measures of job control (Kelly and Moen 2007; Kelly, Moen, and Tranby 2011;
at Serials Records, University of Minnesota Libraries on December 5, 2011hsb.sagepub.comDownloaded from

406 Journal of Health and Social Behavior 52(4)
Moen, Kelly, and Huang 2008). Examining whether a corporate initiative challenging its tem-poral organization affects health behaviors and well-being through the mechanism of increasing employees’ schedule control extends the limited longitudinal research investigating the health impacts of schedule control (Grzywacz, Casey, and Jones 2007).
A Stress Process FramingRole strain theory, focusing on the potential stresses associated with conflicting role obliga-tions, is often implicitly about time. Role strain, “the felt difficulty in fulfilling role obligations” (Goode 1960:483), such as negative spillover from work to home, can be a chronic stressor with del-eterious consequences. A long tradition of research on family stress (Hill 1949; Hochschild 1997), life course processes (Elder, George, and Shanahan 1996; Moen and Roehling 2005), and stress more generally (Aneshensel 1992; Lazarus and Folkman 1984; Pearlin 1989; Pearlin et al. 1981; Pearlin et al. 2005; Turner, Wheaton, and Lloyd 1995) has depicted stress as occurring when a gap between resources and claims (or needs) reduces people’s sense of control. The stress process approach, especially when married with life course insights about cycles of control and shifting social struc-tures,1 underscores the dynamic processes of “fit” between resources and claims/needs. A stress pro-cess framing suggests that the gap between time resources and demands produces stress, particu-larly in the absence of perceived control over the temporal organization of work (Kim, Moen, and Min 2003; Roxburgh 2004).
Work-Family Conflict and HealthNegative spillover from work to family life is a common form of stress in the lives of contempo-rary workers (Bianchi, Casper, and King 2005; Hammer et al. 2005; Kelly et al. 2008; Korabik, Lero, and Whitehead 2008; Kossek and Lambert 2005; Major, Klein, and Ehrhart 2002). It has been conceptualized and measured in a variety of ways—as work to nonwork “conflict” or “interfer-ence” (Greenhaus and Beutell 1985), as “spill-over” (positive, negative) from work to home (Grzywacz and Marks 2000), as work-family or work-life “imbalance” (Tausig and Fenwick 2001), and as “misfit” (Grzywacz and Bass 2003; Moen, Kelly, and Hill 2011). We focus here on the
negative effects of work on home life, recognizing that all workers may experience the stress of such incompatibilities.
Work-family conflict measures have been related to minor physical complaints and lower self-reported health, as well as psychological dis-tress and depressive symptoms (Allen et al. 2000; Grzywacz and Bass 2003; Netemeyer, Boles, and McMurrian 1996; Thomas and Ganster 1995), anxiety disorders (Grzywacz and Bass 2003), lower vitality (Kristensen, Smith-Hansen, and Jansen 2005), and less well-being (Grant-Vallone and Donaldson 2001; Moen and Yu 2000).
In terms of health-related behaviors, Nomaguchi and Bianchi (2004) note that time for exercise is often squeezed out by heavy work and family responsibilities. Maume, Sebastian, and Bardo (2009:989) find women retail workers have sig-nificantly more sleep disruptions than men in similar jobs, due in part to “differences in responsi-bilities for work-family obligations.” Other research shows a relationship between work-family conflict and unhealthy eating habits, obesity, elevated cholesterol levels, and hypertension (Allen and Armstrong 2006; Frone, Russell, and Barnes 1996; Grzywacz and Bass 2003; Grzywacz and Marks 2000; Thomas and Ganster 1995).
Focusing on ChangeTaken together, the job strain and stress process/work-family conflict approaches lead us to theo-rize that an organizational innovation aimed at loosening time structures should produce corre-sponding changes in employees’ health behaviors and well-being:
Hypothesis 1: Participation in ROWE pro-duces a shift in health-promoting behav-iors (amount of sleep, exercise, going to the doctor, and not working when sick) as well as well-being (self-reported health, energy, personal mastery, sleep quality, burnout, psychological distress).
Low schedule control and high work-family con-flict are key risk factors for poor health outcomes. Changes in these risk factors may represent two key mediating mechanisms between ROWE, the organizational innovation, and improved employee health-related outcomes:
at Serials Records, University of Minnesota Libraries on December 5, 2011hsb.sagepub.comDownloaded from

Moen et al. 407
Hypothesis 2: Increase in employees’ sched-ule control is a key mediator between employees’ participation in the ROWE initiative and subsequent changes in their health behaviors and well-being.
The ROWE initiative has also been shown to decrease employees’ degree of work-family con-flict (Kelly et al. 2011), suggesting the following:
Hypothesis 3. The health-related effects of ROWE are mediated by a decrease in work-family conflict. The effect of enhanced schedule control on health- related outcomes is also mediated through decreases in work-family conflict.
We focus first on changes in health-promoting behaviors, since these are more likely to shift over a short period of time and are consequential for both physical and mental health. For example, increasing sleep time among this sleep-deprived population of long-hour workers would be a salu-tary consequence of the initiative. Another key health-promoting behavior is exercise, with ROWE hypothesized to promote greater exercise frequency. Workers who do not go to work when sick avoid the transmission of colds, flu, and other contagious diseases and may lessen the duration or severity of their own illness. Increasing the odds of employees’ seeing a doctor when sick can also limit illness duration or severity.
We then gauge well-being outcomes in the form of reductions in burnout and psychological distress and increases in personal mastery, sleep quality, energy, and self-reported health. We recognize that gains in these assessments may not be evident over so short a period as the six months covered in this study but test for some movement in them, given their potential for decreasing stress-related symptoms and illnesses over a longer period of time.
DATA AND METHODSThe Organizational Initiative
We examine the health effects of the ROWE initia-tive rolled out at the corporate headquarters of Best Buy Co., Inc., a Fortune 500 retail corporation with
about 3,500 headquarters employees in the metropolitan Twin Cities area of Minnesota.2 ROWE was designed to move employees and supervisors away from time-oriented measures of work success (e.g., how many hours put in last week; how much time spent on a given task) to a completely results-based appraisal of productivity and accomplish-ment. After an orientation for managers, teams met with facilitators four times to critique old ways of working and discuss new possibilities (Kelly et al. 2010). Teams transitioning from conventional prac-tices to ROWE aim to foster environments wherein employees do not need permission to modify their work location or schedules but can routinely change when and where they work based on their own and the team’s needs, preferences, and job responsibili-ties. This collective approach to job redesign may reduce the risk that individual employees will be penalized in later evaluations for working to their own rhythms. Importantly, the ROWE sessions do not focus on work-family conflict, a deliberate strat-egy so that ROWE is seen as the new standard rather than another “working mother” or “family-friendly” policy that is on the books but rarely used (Kelly et al. 2010).
Participants and Procedures
ROWE was developed as an organizational initia-tive occurring regardless of whether we studied it, truly an “experiment of nature” (Bronfenbrenner 1979). The natural experiment design exploits the phased implementation of ROWE by using the departments that began ROWE during the study period as a treatment group and using other depart-ments later in the queue as a comparison group, a quasi-experimental nonequivalent control group design with both pretests and posttests (Shadish, Cook, and Campbell 2002). We address potential selection bias and design limitations below and in more detail in Kelly et al. (2011). Importantly, decisions about which departments would partici-pate in ROWE and when were made by executives, not middle managers or individuals.
The 2006 baseline wave of the web survey was completed in the month before ROWE sessions began, with the second survey wave fielded six months after a department launched ROWE (with comparison groups surveyed simultaneously). The
at Serials Records, University of Minnesota Libraries on December 5, 2011hsb.sagepub.comDownloaded from

408 Journal of Health and Social Behavior 52(4)
Wave 1 response rate was 80 percent, with 92 per-cent of those who completed the first survey also completing Wave 2 six months later; response rates were similar for treatment and comparison groups. A total of 659 white-collar workers par-ticipated in both waves of the web survey, 334 in the comparison group and 325 in the ROWE group. Respondents are young (average age is 32), educated (84 percent have a college degree), and predominately white. They work long hours (41 percent working more than 50 hours per week) and have been with the company an average of four years. Almost half (48.4 percent) are women, 70 percent are married or partnered, one fourth have a preschooler at home, and 14 percent care for an infirm adult. Further research is needed to general-ize to the experiences of older workers, workers with less education, those in blue-collar or direct service jobs, or racial/ethnic minorities.
Measures
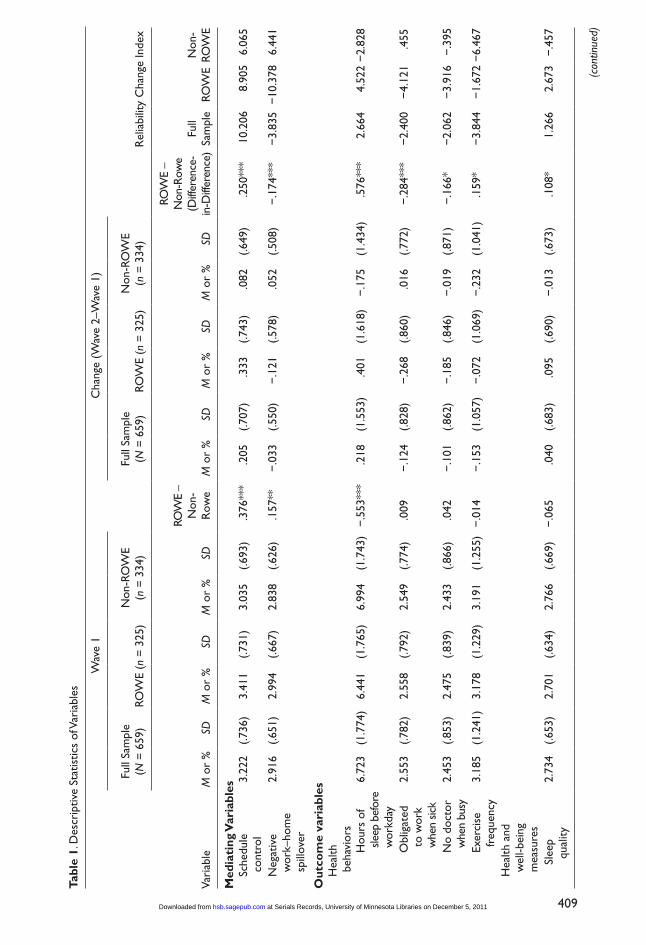
Table 1 provides descriptive statistics for Wave 1 variables, changes between waves, and the reli-ability change index for all measures, with values greater than 1.96 (or less than –1.96) indicating a reliable change.
Recall we hypothesized a mediational model, in which ROWE would influence health-related out-comes by increasing schedule control and reducing negative work-home spillover. The schedule control measure gauges employees’ ability to decide about the time and timing of their work and is modified from Thomas and Ganster (1995), with 1 indicating low schedule control and 5 indicating high schedule control.3 We capture work-family conflict with a measure of negative spillover from work to home life developed and validated by Grzywacz and Marks (2000), emphasizing emotional transmission of stress (i.e., bringing worries home) and energy depletion rather than time strains or conflicts. We deliberately chose a measure of work-family con-flict that does not focus on time strains to distin-guish it from schedule control.4
We include a variety of health behaviors as outcomes. We measure hours of sleep per night, asking respondents to report how many hours of sleep they get before a workday. We ask how many days per week respondents exercised, on average,
over the past four weeks, with scores ranging from not at all to every day. To gauge health care man-agement we use two items. The first asks respond-ents their agreement with the statement “When I am sick, I still feel obligated to come in to work.” The second is agreement with the following state-ment: “Sometimes I’m so busy that I don’t go to the doctor even when I should.” For both of these items, high scores indicate less healthy behaviors.
We assess employees’ well-being with four scales: personal mastery using the classic Pearlin and Schooler (1978) scale; emotional exhaustion con-structed from Maslach Burnout Inventory items (Maslach and Jackson 1986); and psychological dis-tress (K6; Furukawa et al. 2003). Other well-being measures include a single item on quality of sleep (from very bad to very good; Burgard and Ailshire 2009), a self-reported health item (with 5 being in excellent health), and a scale measuring respondents’ energy levels (a subset of SF-36 health survey; Ware and Sherbourne 1992 items).
Employees are coded as part of the ROWE group if they report (in the Wave 2 survey) having attended the ROWE training sessions and being assigned to a team or department that participated in the initiative during the study period.5 We also use a variety of personal and job characteristics as control variables. We include measures of gender and active parental status (and also test them as potential moderators), age, and a summary measure of other changes in respondents’ lives in the six months between surveys. Since ROWE and comparison groups differed on some measures at Wave 1 (see Table 1), we incorpo-rate variables for salaried (or not), tenure, job level, and income. Our analysis also includes measures of job demands and job control (Karasek and Theorell 1990), along with scales of manager support and a supportive organizational culture, established predic-tors of work-family conflict (Kelly et al. 2008) that may also affect employees’ time to manage their health. See the online supplement for detailed descriptions of the construction of variables (Part A), information about scales (see Table S-1), and a cor-relation matrix of all variables (see Table S-2).
Structural Equation Modeling
We use a structural equation model (SEM) to esti-mate the effects of ROWE, testing four possible
at Serials Records, University of Minnesota Libraries on December 5, 2011hsb.sagepub.comDownloaded from
409
Tabl
e 1.
Des
crip
tive
Stat
istic
s of
Var
iabl
es
Wav
e 1
Cha
nge
(Wav
e 2–
Wav
e 1)
Fu
ll Sa
mpl
e
(N =
659
)RO
WE
(n =
325
)N
on-R
OW
E
(n =
334
)Fu
ll Sa
mpl
e
(N =
659
)RO
WE
(n =
325
)N
on-R
OW
E
(n =
334
)R
elia
bilit
y C
hang
e In
dex
Vari
able
M o
r %
SDM
or
%SD
M o
r %
SD
ROW
E -
Non
-R
owe
M o
r %
SDM
or
%SD
M o
r %
SD
ROW
E -
N
on-R
owe
(Diff
eren
ce-
in-D
iffer
ence
)Fu
ll Sa
mpl
eRO
WE
Non
-RO
WE
Med
iati
ng V
aria
bles
Sc
hedu
le
con
trol
3.22
2(.7
36)
3.41
1(.7
31)
3.03
5(.6
93)
.376
***
.205
(.707
).3
33(.7
43)
.082
(.649
).2
50**
*10
.206
8.90
56.
065
N
egat
ive
w
ork–
hom
e s
pillo
ver
2.91
6(.6
51)
2.99
4(.6
67)
2.83
8(.6
26)
.157
**−
.033
(.550
)−
.121
(.578
).0
52(.5
08)
−.1
74**
*−
3.83
5−
10.3
786.
441
Out
com
e va
riab
les
H
ealth
b
ehav
iors
H
ours
of
s
leep
bef
ore
w
orkd
ay
6.72
3(1
.774
)6.
441
(1.7
65)
6.99
4(1
.743
)−
.553
***
.218
(1.5
53)
.401
(1.6
18)
−.1
75(1
.434
).5
76**
*2.
664
4.52
2−
2.82
8
O
blig
ated
to
wor
k
whe
n sic
k
2.55
3(.7
82)
2.55
8(.7
92)
2.54
9(.7
74)
.009
−.1
24(.8
28)
−.2
68(.8
60)
.016
(.772
)−
.284
***
−2.
400
−4.
121
.455
N
o do
ctor
whe
n bu
sy2.
453
(.853
)2.
475
(.839
)2.
433
(.866
).0
42−
.101
(.862
)−
.185
(.846
)−
.019
(.871
)−
.166
*−
2.06
2−
3.91
6−
.395
Exe
rcis
e
freq
uenc
y3.
185
(1.2
41)
3.17
8(1
.229
)3.
191
(1.2
55)
−.0
14−
.153
(1.0
57)
−.0
72(1
.069
)−
.232
(1.0
41)
.159
*−
3.84
4−
1.67
2−
6.46
7
H
ealth
and
w
ell-b
eing
m
easu
res
Slee
p q
ualit
y2.
734
(.653
)2.
701
(.634
)2.
766
(.669
)−
.065
.040
(.683
).0
95(.6
90)
−.0
13(.6
73)
.108
*1.
266
2.67
3−
.457
(con
tinue
d)
at Serials Records, University of Minnesota Libraries on December 5, 2011hsb.sagepub.comDownloaded from

410
Wav
e 1
Cha
nge
(Wav
e 2–
Wav
e 1)
Fu
ll Sa
mpl
e
(N =
659
)RO
WE
(n =
325
)N
on-R
OW
E
(n =
334
)Fu
ll Sa
mpl
e
(N =
659
)RO
WE
(n =
325
)N
on-R
OW
E
(n =
334
)R
elia
bilit
y C
hang
e In
dex
Vari
able
M o
r %
SDM
or
%SD
M o
r %
SD
ROW
E -
Non
-R
owe
M o
r %
SDM
or
%SD
M o
r %
SD
ROW
E -
N
on-R
owe
(Diff
eren
ce-
in-D
iffer
ence
)Fu
ll Sa
mpl
eRO
WE
Non
-RO
WE
Emot
iona
l
exh
aust
ion
3.69
4(.9
80)
3.77
3(.9
64)
3.61
8(.9
91)
.155
*.1
37(.8
70)
.088
(.879
).1
85(.8
59)
−.0
984.
894
2.94
77.
010
Pers
onal
m
aste
ry4.
816
(.799
)4.
778
(.820
)4.
852
(.779
)−
.074
−.0
11(.6
60)
.007
(.666
)−
.028
(.654
).0
35−
.848
.608
−2.
130
Pysc
holo
gi-
cal
dist
ress
4.62
4(3
.619
)4.
903
(3.8
24)
4.36
3(.3
99)
.540
*−
.069
(3.1
94)
−.2
08(3
.348
).0
62(3
.041
)−
.270
−.2
08−
.610
.190
Self-
Re-
po
rted
hea
lth3.
711
(.835
)3.
660
(.857
)3.
760
(.812
)−
.100
−.0
73(.6
99)
−.0
82(.6
81)
−.0
64(.7
17)
−.0
18−
5.18
0−
7.11
3−
3.69
8
Ener
gy3.
557
(.872
)3.
476
(.898
)3.
636
(.840
)−
.160
*−
.057
(.784
).0
38(.7
42)
−.1
50(.8
13)
.188
**−
2.44
02.
508
−4.
494
Co
ntro
l var
iabl
es
Fem
ale
(%)
48.4
—48
.348
.5−
.2—
——
——
——
——
—
Age
(%
)
Age
20–
2945
.6—
36.4
—54
.6—
−18
.2**
*—
——
——
——
——
—
A
ge 3
0–39
39.3
—44
.0—
34.6
—9.
4*—
——
——
——
——
—
A
ge 4
0–60
15.1
—19
.5—
10.8
—8.
8**
——
——
——
——
——
C
hild
(%
)34
.9—
40.3
—29
.6—
10.7
**—
——
——
——
——
—
Sala
ried
(%
)95
.4—
97.7
—93
.1—
4.5*
*—
——
——
——
——
—
Hou
seho
ld
In
com
e4.
202
(1.5
17)
4.34
8(1
.484
)4.
059
(1.5
37)
0.28
9*—
——
——
——
——
—
Te
nure
4.30
6(3
.198
)4.
716
(3.3
03)
3.90
2(3
.042
)0.
814*
*—
——
——
——
——
—
Tabl
e 1.
(co
ntin
ued)
(con
tinue
d)
at Serials Records, University of Minnesota Libraries on December 5, 2011hsb.sagepub.comDownloaded from

411
Wav
e 1
Cha
nge
(Wav
e 2–
Wav
e 1)
Fu
ll Sa
mpl
e
(N =
659
)RO
WE
(n =
325
)N
on-R
OW
E
(n =
334
)Fu
ll Sa
mpl
e
(N =
659
)RO
WE
(n =
325
)N
on-R
OW
E
(n =
334
)R
elia
bilit
y C
hang
e In
dex
Vari
able
M o
r %
SDM
or
%SD
M o
r %
SD
ROW
E -
Non
-R
owe
M o
r %
SDM
or
%SD
M o
r %
SD
ROW
E -
N
on-R
owe
(Diff
eren
ce-
in-D
iffer
ence
)Fu
ll Sa
mpl
eRO
WE
Non
-RO
WE
Jo
b le
vel (
%)
N
on-
supe
rvis
ing
empl
oyee
67.3
—61
.9—
72.5
—−1
0.6*
*—
——
——
——
——
—
Man
ager
19.4
—20
.5—
18.3
—2.
2—
——
——
——
——
—
Se
nior
man
ager
and
up
13.3
—17
.5—
9.2
—8.
4**
——
——
——
——
——
W
orks
mor
e
than
50
hour
s
per
wee
k (%
)
41.2
—40
.5—
41.9
—−
1.3
J o
b de
man
ds2.
949
(.498
)2.
989
(.487
)2.
910
(.506
).0
80—
——
——
——
——
—
Dec
isio
n
auth
ority
2.91
3(.5
18)
2.92
2(.5
25)
2.90
3(.5
12)
.019
——
——
——
——
——
Sk
ill
di
scre
tion
2.92
1(.4
56)
2.97
5(.4
34)
2.86
6(.4
70)
.109
**—
——
——
——
——
—
M
anag
er
su
ppor
t3.
543
(.914
)3.
507
(.941
)3.
579
(.887
)−
.072
——
——
——
——
——
O
rgan
izat
ion-
al s
uppo
r tiv
e
cultu
re
3.40
3(.6
22)
3.34
2(.6
22)
3.46
4(.6
16)
−.1
22*
——
——
——
——
——
Li
fe c
hang
e
with
in s
ix
m
onth
s (%
)
——
——
——
—15
.5—
12.3
—18
.6—
6.3*
——
—
Jo
b ch
ange
with
in s
ix
m
onth
s (%
)
——
——
——
—13
.7—
11
.1—
16.2
—5.
1—
——
Not
e: R
OW
E =
Res
ults
Onl
y W
ork
Envi
ronm
ent.
Das
hes
indi
cate
non
-app
licab
ility
.*p
< .0
5. *
*p <
.01.
***
p <
.001
.
Tabl
e 1.
(co
ntin
ued)
at Serials Records, University of Minnesota Libraries on December 5, 2011hsb.sagepub.comDownloaded from

412 Journal of Health and Social Behavior 52(4)
relationships between the ROWE flexibility inno-vation and health-related outcomes. First is a direct effect from ROWE to changes in health behavior and well-being. Second are mediated effects, in which direct relationships from ROWE to changes in health outcomes are at least partially mediated by (operate through the mechanisms of) changes in schedule control and negative work-home spill-over. Third are indirect (only) effects in which there may be no direct effects of ROWE on health outcomes but there are indirect effects in which ROWE changes schedule control and/or negative spillover and these changes, in turn, improve health outcomes. (See Hayes 2009:413–15 for more discussion on the distinction between medi-ated and indirect effects.) This relationship would indicate that there may be both positive and (pos-sibly unmeasured) suppressor effects operating between ROWE and health measures but that the salutary effects of ROWE in promoting schedule control and reducing negative spillover indirectly enhance well-being. Fourth is the possibility that there are no direct, mediated, or indirect relation-ships between ROWE and changes in health out-comes. SEM allows us to capture direct effects, to test our hypothesized mediational framework, and to capture possible indirect effects of ROWE on changes in health behavior and well-being mea-sures.6 SEM also permits the estimation of unob-served or latent variables. We have four latent constructs—perceived schedule control and work-family conflict (specifically, negative work-to-home spillover), at both Wave 1 and Wave 2.
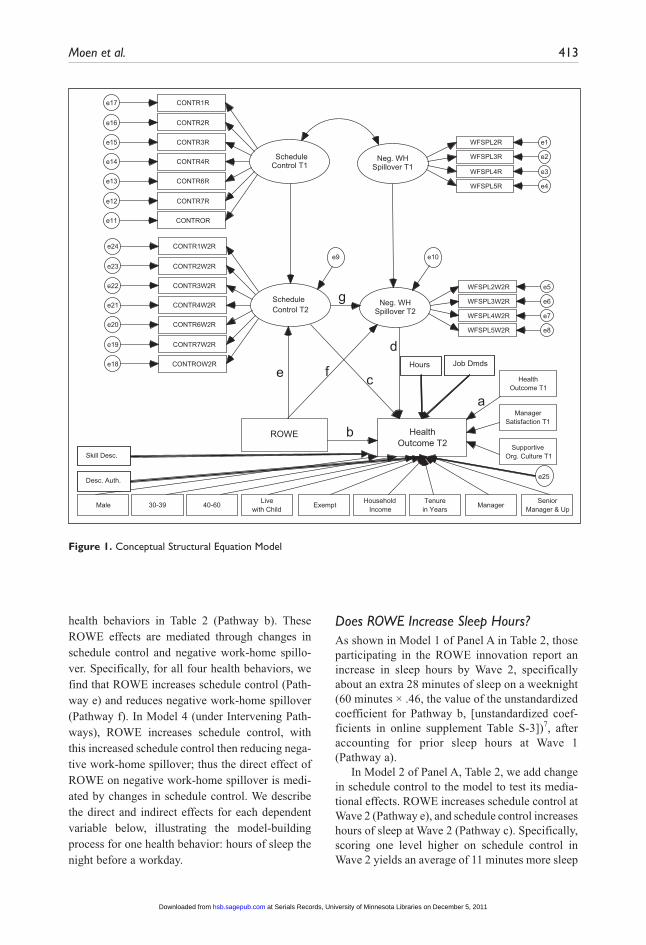
We estimate the hypothesized SEM (see Figure 1) using the maximum likelihood estimation pro-cedure, which is robust, efficient, and widely used when the assumption of multivariate normality is met. To test our hypothesized mediation frame-work, we estimate four nested SEMs. In the first model, we estimate the direct effects of ROWE on each Wave 2 health-related outcome, controlling for the lagged Wave 1 health outcome as well as other variables described above. In the second model, we estimate our first theorized mechanism explaining the effects of ROWE on Wave 2 health-related outcomes by including change in schedule control as an intervening variable (potential media-tor or indirect effect). In the third model, we esti-mate our second theorized mechanism by including
change in negative work-home spillover as an intervening variable. In the fourth and final model, we estimate the effects of ROWE on each Wave 2 outcome by including both theorized mecha-nisms—change in schedule control and change in negative spillover—as intervening variables, with this final step shown in Figure 1. Table 2 summa-rizes standardized estimates from each of these nested SEM models, noting pathways from Figure 1.
We use three indices of goodness of fit availa-ble in AMOS 5.0 to assess overall model fit: (1) the normed χ2 statistic, considering a χ2/degrees of freedom ratio of less than 5 as acceptable (Bollen and Long 1993); (2) the goodness-of-fit index, with a value exceeding 0.85 taken as indicative of reasonable fit (Bentler and Bonett 1980); and (3) the root mean square error of approximation, with a value less than 0.08 representing an appropriate model fit. Generally we find the model fits better in the later mediation steps, with Model 4 yielding the best fit to the data, providing support for the proposed mechanisms.
RESULTSParticipating in the ROWE initiative directly increases employees’ health-related behaviors of sleep and exercise, as well as the likelihood that employees will not go to the workplace when sick and will see a doctor when sick, net of controls included in the model and the lagged Wave 1 out-come (Model 1, Table 2, representing Pathway b in Figure 1). However, Model 1 in Table 3 reveals that ROWE does not directly produce changes in well-being measures (sleep quality, emotional exhaustion, personal mastery, psychological dis-tress, self-reported health, energy) between survey waves (coefficients for Pathway b are not signifi-cant). Nevertheless, there is some support for Hypothesis 1 in that ROWE directly improves health-behavior outcomes over a six-month period.
We next address underlying mechanisms theo-rized to mediate the direct effects of ROWE on health behaviors, finding that the ROWE effects on health behaviors are mediated, in whole or in part, through increases in employees’ schedule control and decreases in their negative work-home spillo-ver. To summarize, ROWE directly affects all the
at Serials Records, University of Minnesota Libraries on December 5, 2011hsb.sagepub.comDownloaded from
Moen et al. 413
health behaviors in Table 2 (Pathway b). These ROWE effects are mediated through changes in schedule control and negative work-home spillo-ver. Specifically, for all four health behaviors, we find that ROWE increases schedule control (Path-way e) and reduces negative work-home spillover (Pathway f). In Model 4 (under Intervening Path-ways), ROWE increases schedule control, with this increased schedule control then reducing nega-tive work-home spillover; thus the direct effect of ROWE on negative work-home spillover is medi-ated by changes in schedule control. We describe the direct and indirect effects for each dependent variable below, illustrating the model-building process for one health behavior: hours of sleep the night before a workday.
Does ROWE Increase Sleep Hours?As shown in Model 1 of Panel A in Table 2, those participating in the ROWE innovation report an increase in sleep hours by Wave 2, specifically about an extra 28 minutes of sleep on a weeknight (60 minutes × .46, the value of the unstandardized coefficient for Pathway b, [unstandardized coef-ficients in online supplement Table S-3])7, after accounting for prior sleep hours at Wave 1 (Pathway a).
In Model 2 of Panel A, Table 2, we add change in schedule control to the model to test its media-tional effects. ROWE increases schedule control at Wave 2 (Pathway e), and schedule control increases hours of sleep at Wave 2 (Pathway c). Specifically, scoring one level higher on schedule control in Wave 2 yields an average of 11 minutes more sleep
ScheduleControl T1
Neg. WHSpillover T1
WFSPL2R e1
WFSPL3R e2
WFSPL4R e3
WFSPL5R e4
Neg. WHSpillover T2
WFSPL2W2R e5
WFSPL3W2R e6
WFSPL4W2R e7
WFSPL5W2R e8
ROWE HealthOutcome T2
HealthOutcome T1
Male 30-39 40-60 Livewith Child Exempt Household
IncomeTenurein Years Manager Senior
Manager & Up
ManagerSatisfaction T1
SupportiveOrg. Culture T1
e9 e10
CONTRORe11
CONTR7Re12
CONTR6Re13
CONTR4Re14
CONTR3Re15
CONTR2Re16
CONTR1Re17
ScheduleControl T2
CONTROW2Re18
CONTR7W2Re19
CONTR6W2Re20
CONTR4W2Re21
CONTR3W2Re22
CONTR2W2Re23
CONTR1W2Re24
e25
Hours Job Dmds
Desc. Auth.
Skill Desc.
a
f
b
c
d
e
g
Figure 1. Conceptual Structural Equation Model
at Serials Records, University of Minnesota Libraries on December 5, 2011hsb.sagepub.comDownloaded from

Tabl
e 2.
Sum
mar
y of
Dir
ect,
Med
iatio
nal,
and
Indi
rect
Effe
cts
of R
esul
ts O
nly
Wor
k En
viro
nmen
t (R
OW
E) o
n H
ealth
Beh
avio
rs
Pane
l A: H
ours
of S
leep
on
a Wee
kday
Pane
l B: O
blig
ated
to
Wor
k W
hen
Sick
M
odel
1M
odel
2M
odel
3M
odel
4M
odel
1M
odel
2M
odel
3M
odel
4
Stru
ctur
al E
quat
ion
Mod
el P
athw
aySt
anda
rd
Estim
ate
Stan
dard
Es
timat
eSt
anda
rd
Estim
ate
Stan
dard
Es
timat
eSt
anda
rd
Estim
ate
Stan
dard
Es
timat
eSt
anda
rd
Estim
ate
Stan
dard
Es
timat
e
Dir
ect
effe
cts
on h
ealth
-rel
ated
out
com
es
Hea
lth T
1 →
Hea
lth
Out
com
e T
2 (a
).6
26**
*.6
19**
*.6
01**
*.6
00**
*.3
95**
*.3
65**
*.3
50**
*.3
29**
*
RO
WE
→ H
ealth
O
utco
me
T2
(b)
.123
***
.094
**.1
00**
.088
*−
.172
***
–.07
3−
.147
**−
.075
Sc
hedu
le C
ontr
ol
T2
→ H
ealth
O
utco
me
T2
(c)
—.0
71*
—.0
28—
–.25
8***
—−
.187
***
N
egat
ive
Wor
k-
Hom
e Sp
illov
er T
2 →
Hea
lth
Out
com
e T
2 (d
)
——
–.16
4***
−.1
56**
*—
—.2
89**
*.2
32**
*
Inte
rven
ing
path
way
s
ROW
E →
Sch
edul
e C
ontr
ol T
2 (e
)—
.247
***
—.2
30**
*—
.212
***
—.2
05**
*
RO
WE
→ N
egat
ive
Wor
k-H
ome
Spi
llove
r T2
(f)
——
−.0
88**
–.01
9—
—−
.054
*−
.007
Sc
hedu
le C
ontr
ol
T2
→ N
egat
ive
Wor
k-H
ome
S
pillo
ver T
2 (g
)
——
—–.
258*
**—
——
−.2
24**
*
Indi
rect
effe
cts
on h
ealth
-rel
ated
out
com
es
ROW
E →
S
ched
ule
Con
trol
T
2 →
Hea
lth T
2
(h
= c
× e
)
—.0
17*
—.0
06—
–.05
5***
—−
.038
***
414
(con
tinue
d)
at Serials Records, University of Minnesota Libraries on December 5, 2011hsb.sagepub.comDownloaded from

Pane
l A: H
ours
of S
leep
on
a Wee
kday
Pane
l B: O
blig
ated
to
Wor
k W
hen
Sick
M
odel
1M
odel
2M
odel
3M
odel
4M
odel
1M
odel
2M
odel
3M
odel
4
Stru
ctur
al E
quat
ion
Mod
el P
athw
aySt
anda
rd
Estim
ate
Stan
dard
Es
timat
eSt
anda
rd
Estim
ate
Stan
dard
Es
timat
eSt
anda
rd
Estim
ate
Stan
dard
Es
timat
eSt
anda
rd
Estim
ate
Stan
dard
Es
timat
e
RO
WE
→ N
egat
ive
Wor
k-H
ome
S
pillo
ver T
2 →
H
ealth
T2
(i =
f × d
)
——
.014
*.0
03—
—−
.016
**−
.002
RO
WE
→ S
ched
- u
le C
ontr
ol T
2 →
N
egat
ive
Wor
k-
Hom
e T
2 →
Hea
lth
T2
(j =
e ×
g ×
d)
——
—.0
09*
——
—−
.011
*
T o
tal I
ndir
ect
Effe
ct
of R
OW
E on
H
ealth
T2
(k =
h
+ i
+ j)
—.0
17*
.014
*.0
19*
—–.
055*
**−
.016
**−
.051
***
To
tal E
ffect
of
RO
WE
on H
ealth
T
2 (b
+ k
)
—.1
12**
.114
**.1
06**
—–.
128*
*−
.163
**−
.126
**
Mod
el fi
t st
atis
tics
N
orm
ed χ
23.
534
3.00
12.
764
2.36
83.
413
3.07
22.
728
2.40
2
Goo
dnes
s-of
-Fit
ind
ex.9
33.8
65.9
08.8
60.9
37.8
62.9
09.8
58
R
oot
mea
n sq
uare
e
rror
of
app
roxi
mat
ion
.068
.061
.057
.050
.067
.062
.056
.051
415
Tabl
e 2.
(co
ntin
ued)
(con
tinue
d)
at Serials Records, University of Minnesota Libraries on December 5, 2011hsb.sagepub.comDownloaded from

416
Pane
l A: H
ours
of S
leep
on
a Wee
kday
Pane
l B: O
blig
ated
to
Wor
k W
hen
Sick
M
odel
1M
odel
2M
odel
3M
odel
4M
odel
1M
odel
2M
odel
3M
odel
4
Stru
ctur
al E
quat
ion
Mod
el P
athw
a ySt
anda
rd
Estim
ate
Stan
dard
Es
timat
eSt
anda
rd
Estim
ate
Stan
dard
Es
timat
eSt
anda
rd
Estim
ate
Stan
dard
Es
timat
eSt
anda
rd
Estim
ate
Stan
dard
Es
timat
e
Pa
nel C
: No
Doc
tor W
hen
Busy
Pane
l D: E
xerc
ise
Freq
uenc
y
Stru
ctur
al E
quat
ion
Mod
el P
athw
ays
Mod
el 1
Stan
dard
Es
timat
e
Mod
el 2
Stan
dard
Es
timat
e
Mod
el 3
Stan
dard
Es
timat
e
Mod
el 4
Stan
dard
Es
timat
e
Mod
el 1
Stan
dard
Es
timat
e
Mod
el 2
Stan
dard
Es
timat
e
Mod
el 3
Stan
dard
Es
timat
e
Mod
el 4
Stan
dard
Es
timat
e
Dir
ect
effe
cts
on h
ealth
-rel
ated
out
com
es
Hea
lth T
1 →
Hea
lth
Out
com
e T
2 (a
).4
19**
*.4
16**
*.3
35**
*.3
41**
*.6
01**
*.6
02**
*.6
08**
*.6
09**
*
RO
WE
→ H
ealth
O
utco
me
T2
(b)
–.09
9**
−.0
11−
.085
*–.
029
.070
*.0
57.0
56.0
49
Sc
hedu
le C
ontr
ol
T2
→ H
ealth
O
utco
me
T2
(c)
—−
.278
***
—–.
193*
**—
.031
—.0
09
N
egat
ive
Wor
k-
Hom
e Sp
illov
er T
2
→ H
ealth
O
utco
me
T2
(d)
——
.301
***
.245
***
——
−.0
89*
−.0
86*
Inte
rven
ing
path
way
s
ROW
E →
Sch
edul
e
Con
trol
T2
(e)
—.2
24**
*—
.215
***
—.2
45**
*—
.231
***
RO
WE
→ N
ega-
t
ive
Wor
k-H
ome
Spi
llove
r T2
(f)
——
−.0
61*
–.01
1—
—−
.087
**−
.010
Sc
hedu
le C
ontr
ol
T2
→ N
egat
ive
Wor
k-H
ome
S
pillo
ver T
2 (g
)
——
—–.
208*
**—
——
−.2
77**
*
(con
tinue
d)
Tabl
e 2.
(co
ntin
ued)
Pane
l A: H
ours
of S
leep
on
a Wee
kday
Pane
l B: O
blig
ated
to
Wor
k W
hen
Sick
M
odel
1M
odel
2M
odel
3M
odel
4M
odel
1M
odel
2M
odel
3M
odel
4
Stru
ctur
al E
quat
ion
Mod
el P
athw
aySt
anda
rd
Estim
ate
Stan
dard
Es
timat
eSt
anda
rd
Estim
ate
Stan
dard
Es
timat
eSt
anda
rd
Estim
ate
Stan
dard
Es
timat
eSt
anda
rd
Estim
ate
Stan
dard
Es
timat
e
Pane
l C: N
o D
octo
r Whe
n Bu
syPa
nel D
: Exe
rcis
e Fr
eque
ncy
Stru
ctur
al E
quat
ion
Mod
el P
athw
ays
Mod
el 1
Stan
dard
Es
timat
e
Mod
el 2
Stan
dard
Es
timat
e
Mod
el 3
Stan
dard
Es
timat
e
Mod
el 4
Stan
dard
Es
timat
e
Mod
el 1
Stan
dard
Es
timat
e
Mod
el 2
Stan
dard
Es
timat
e
Mod
el 3
Stan
dard
Es
timat
e
Mod
el 4
Stan
dard
Es
timat
e
Indi
rect
effe
cts
on h
ealth
-rel
ated
out
com
es
ROW
E →
Sch
edul
e C
ontr
ol T
2 →
H
ealth
T2
(h =
c ×
e)
—−
.062
***
—–.
041*
**—
.007
—.0
02
RO
WE
→ N
egat
ive
Wor
k-H
ome
Spill
- o
ver T
2 →
Hea
lth
T2
(I =
f ×
d)
——
−.0
18**
–.00
3—
—.0
08*
.001
RO
WE
→ S
ched
- u
le C
ontr
ol T
2 →
N
egat
ive
Wor
k-
Hom
e T
2 →
Hea
lth
T2
(j =
e ×
g ×
d)
——
—–.
011*
——
—.0
06
To
tal I
ndir
ect
Effe
ct
of R
OW
E on
Hea
lth
T2
(k =
h +
i +
j)
—−
.062
***
−.0
18**
–.05
5***
—.0
07.0
08*
.008
*
To
tal E
ffect
of
RO
WE
on H
ealth
T
2 (b
+ k
)
—−
.073
*−
.104
**–.
084*
—.0
64*
.064
*.0
58*
Mod
el fi
t st
atis
tics
N
orm
ed χ
23.
958
3.06
22.
712
2.34
39.
376
6.05
85.
260
4.37
9
Goo
dnes
s-of
-Fit
ind
ex.9
24.8
63.9
10.8
62.5
18.6
83.7
80.7
59
R
oot
mea
n sq
uare
e
rror
of
app
roxi
mat
ion
.074
.062
.056
.050
.113
.088
.080
.050
Not
e: R
esul
ts a
re fr
om s
truc
tura
l equ
atio
n m
odel
ing.
Path
way
labe
ls (
lett
ers)
cor
resp
ond
to F
igur
e 1
or in
dica
te p
rodu
cts
of c
oeffi
cien
ts fo
r in
dire
ct e
ffect
s. C
ontr
ols
incl
uded
in t
he m
odel
s, bu
t no
t sh
own
in t
he t
able
, inc
lude
gen
der,
age
grou
p, p
aren
tal s
tatu
s, ex
empt
sta
tus,
inco
me,
ten
ure,
occ
upat
iona
l lev
el, w
ork
hour
s (m
ore
than
50
per
wee
k), p
sych
olog
ical
job
dem
ands
, de
cisi
on a
utho
rity
, ski
ll di
scre
tion,
sat
isfa
ctio
n w
ith m
anag
er, s
uppo
rtiv
e oc
cupa
tiona
l env
iron
men
t, lif
e ch
ange
bet
wee
n w
aves
, and
job
chan
ge b
etw
een
wav
es. T
he fu
ll ta
ble
is a
vaila
ble
on
requ
est.
Das
hes
indi
cate
non
-app
licab
ility
.*p
< .0
5. *
*p <
.01.
***
p <
.001
.
at Serials Records, University of Minnesota Libraries on December 5, 2011hsb.sagepub.comDownloaded from

Pane
l A: H
ours
of S
leep
on
a Wee
kday
Pane
l B: O
blig
ated
to
Wor
k W
hen
Sick
M
odel
1M
odel
2M
odel
3M
odel
4M
odel
1M
odel
2M
odel
3M
odel
4
Stru
ctur
al E
quat
ion
Mod
el P
athw
aySt
anda
rd
Estim
ate
Stan
dard
Es
timat
eSt
anda
rd
Estim
ate
Stan
dard
Es
timat
eSt
anda
rd
Estim
ate
Stan
dard
Es
timat
eSt
anda
rd
Estim
ate
Stan
dard
Es
timat
e
Pane
l C: N
o D
octo
r Whe
n Bu
syPa
nel D
: Exe
rcis
e Fr
eque
ncy
Stru
ctur
al E
quat
ion
Mod
el P
athw
ays
Mod
el 1
Stan
dard
Es
timat
e
Mod
el 2
Stan
dard
Es
timat
e
Mod
el 3
Stan
dard
Es
timat
e
Mod
el 4
Stan
dard
Es
timat
e
Mod
el 1
Stan
dard
Es
timat
e
Mod
el 2
Stan
dard
Es
timat
e
Mod
el 3
Stan
dard
Es
timat
e
Mod
el 4
Stan
dard
Es
timat
e
Indi
rect
effe
cts
on h
ealth
-rel
ated
out
com
es
ROW
E →
Sch
edul
e C
ontr
ol T
2 →
H
ealth
T2
(h =
c ×
e)
—−
.062
***
—–.
041*
**—
.007
—.0
02
RO
WE
→ N
egat
ive
Wor
k-H
ome
Spill
- o
ver T
2 →
Hea
lth
T2
(I =
f ×
d)
——
−.0
18**
–.00
3—
—.0
08*
.001
RO
WE
→ S
ched
- u
le C
ontr
ol T
2 →
N
egat
ive
Wor
k-
Hom
e T
2 →
Hea
lth
T2
(j =
e ×
g ×
d)
——
—–.
011*
——
—.0
06
To
tal I
ndir
ect
Effe
ct
of R
OW
E on
Hea
lth
T2
(k =
h +
i +
j)
—−
.062
***
−.0
18**
–.05
5***
—.0
07.0
08*
.008
*
T o
tal E
ffect
of
RO
WE
on H
ealth
T
2 (b
+ k
)
—−
.073
*−
.104
**–.
084*
—.0
64*
.064
*.0
58*
Mod
el fi
t st
atis
tics
N
orm
ed χ
23.
958
3.06
22.
712
2.34
39.
376
6.05
85.
260
4.37
9
Goo
dnes
s-of
-Fit
ind
ex.9
24.8
63.9
10.8
62.5
18.6
83.7
80.7
59
R
oot
mea
n sq
uare
e
r ror
of
app
roxi
mat
ion
.074
.062
.056
.050
.113
.088
.080
.050
Not
e: R
esul
ts a
re fr
om s
truc
tura
l equ
atio
n m
odel
ing.
Path
way
labe
ls (
lett
ers)
cor
resp
ond
to F
igur
e 1
or in
dica
te p
rodu
cts
of c
oeffi
cien
ts fo
r in
dire
ct e
ffect
s. C
ontr
ols
incl
uded
in t
he m
odel
s, bu
t no
t sh
own
in t
he t
able
, inc
lude
gen
der,
age
grou
p, p
aren
tal s
tatu
s, ex
empt
sta
tus,
inco
me,
ten
ure,
occ
upat
iona
l lev
el, w
ork
hour
s (m
ore
than
50
per
wee
k), p
sych
olog
ical
job
dem
ands
, de
cisi
on a
utho
rity
, ski
ll di
scre
tion,
sat
isfa
ctio
n w
ith m
anag
er, s
uppo
rtiv
e oc
cupa
tiona
l env
iron
men
t, lif
e ch
ange
bet
wee
n w
aves
, and
job
chan
ge b
etw
een
wav
es. T
he fu
ll ta
ble
is a
vaila
ble
on
requ
est.
Das
hes
indi
cate
non
-app
licab
ility
.*p
< .0
5. *
*p <
.01.
***
p <
.001
.
417
Tabl
e 2.
(co
ntin
ued)
at Serials Records, University of Minnesota Libraries on December 5, 2011hsb.sagepub.comDownloaded from
418 Journal of Health and Social Behavior 52(4)
per night. The direct effect of ROWE on hours of sleep continues to be significant, meaning the effect of ROWE on increases in amount of sleep is only partially mediated by increases in schedule control.
Model 3 of Panel A, Table 2, shows that ROWE decreases negative work-home spillover (Pathway f), and having lower negative work-home spillover increases hours of sleep (Pathway d). Specifically, scoring one level lower on negative work-home spillover yields an average of 34 minutes more sleep per night. The effect of ROWE on increases in sleep time is only partially mediated by reduc-tions in negative work-home spillover.
Model 4 of Panel A, Table 2, includes both mechanisms: changes in schedule control and changes in negative work-home spillover. Being in ROWE directly increases sleep before a workday by about an extra 20 minutes (60 minutes × .33) and indirectly increases sleep by about 32 minutes per night (60 minutes × .53) by increasing sched-ule control and, in turn, decreasing negative work-home spillover (as shown by the intervening pathways). Thus, the direct and indirect effects of ROWE (see Model 4) sum to a total of almost an extra hour of sleep (52.3 minutes) per night.
Does ROWE Alter Health Management?
As summarized in Panels B and C of Table 2, ROWE reduces employees’ likelihood of feeling obligated to work when sick and negatively pre-dicts responding that one does “not go to doctor when busy” (Pathway b). In both cases, the ROWE effect is fully mediated by increases in schedule control and partially mediated by reductions in negative work-home spillover (added in Models 2 and 3, Pathways e and f, on Figure 1). When both schedule control and negative work-home spill-over are included in the model (see Model 4), the effect of ROWE on these health management out-comes is fully mediated. The likelihood of feeling obligated to work when sick and of not going to the doctor when busy is reduced by one level when both the direct effects of ROWE and the hypothe-sized mechanisms—schedule control and negative work-home spillover—are included.
Panel D of Table 2 shows that ROWE has a small positive effect on exercise frequency (Path-
way b in Model 1). These effects are fully medi-ated by reductions in negative work-home spillover (Pathway d). Note that increases in schedule con-trol promote exercise frequency indirectly by reducing negative work-to-home spillover (Path-way g). The ROWE effect is fairly small in magni-tude, resulting in about a quarter of a standard deviation increase in exercise frequency, but this indicates some change in an important health behavior.
Does ROWE Improve Employees’ Health and Well-Being?
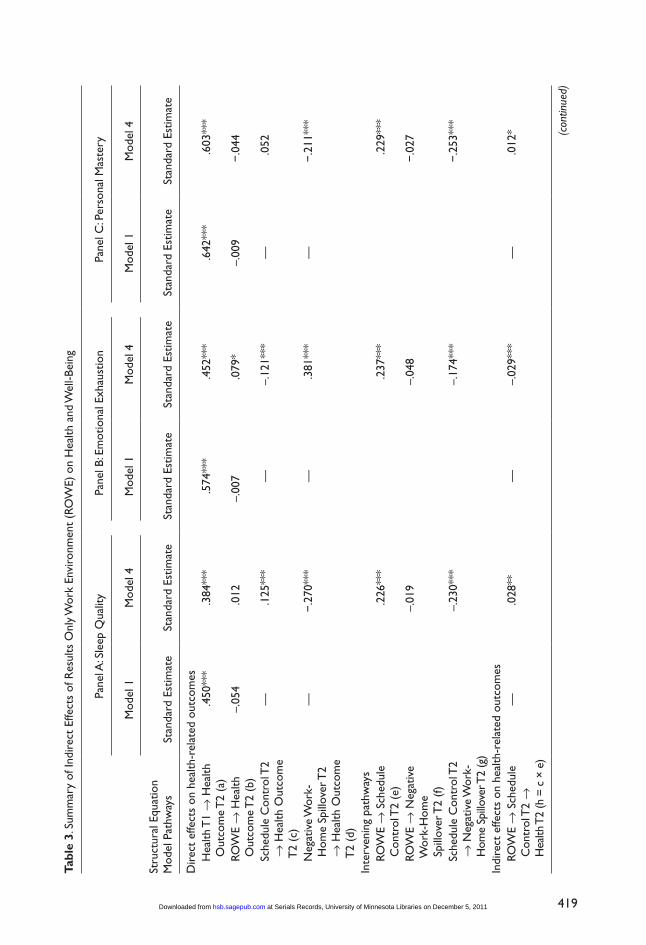
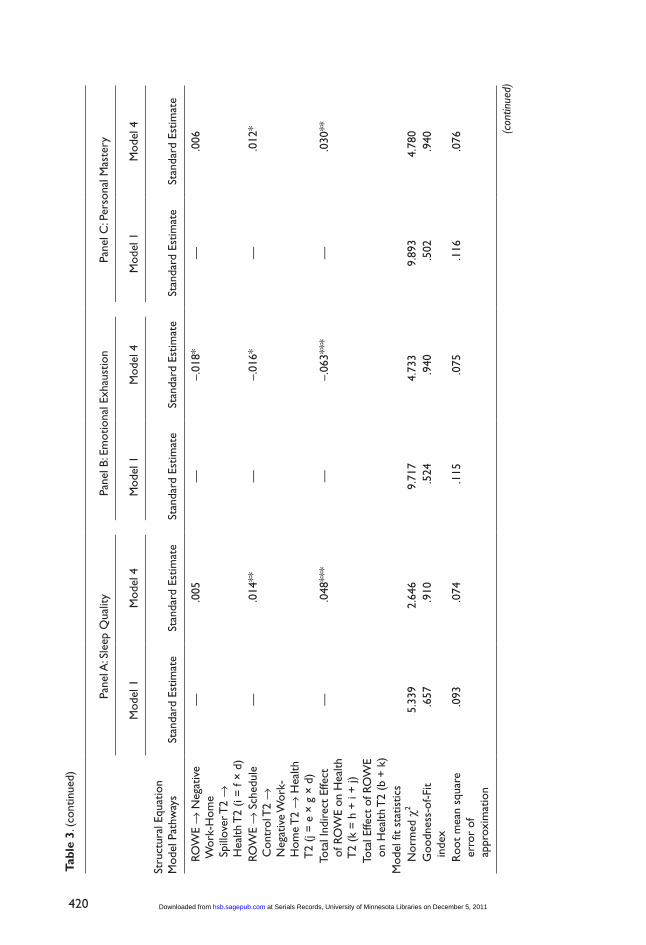
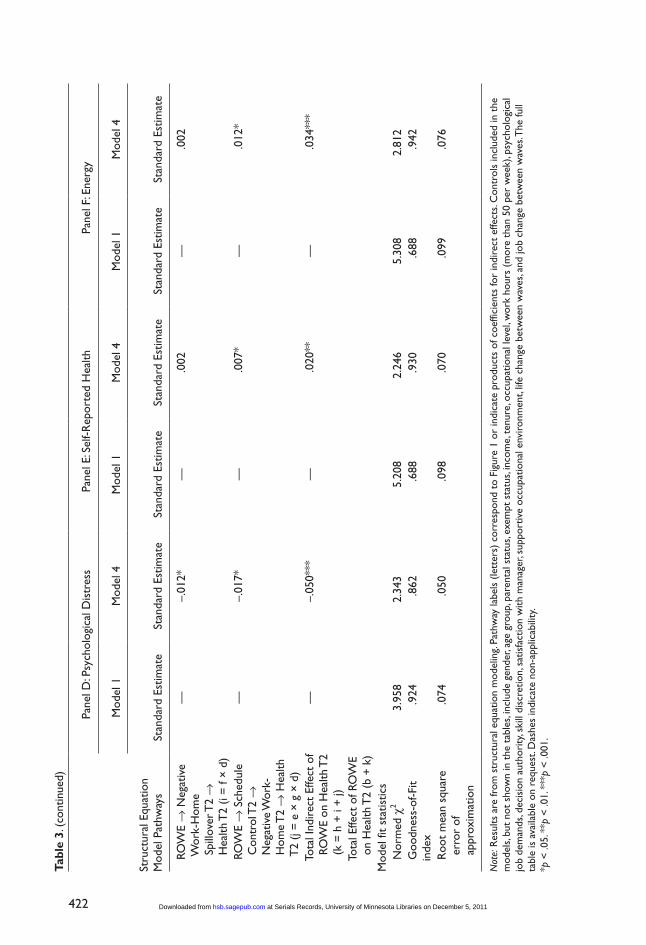
As summarized in Table 3, ROWE does not directly produce changes in well-being measures (sleep quality, emotional exhaustion, personal mastery, psychological distress, self-reported health, energy levels); Pathway b is not signifi-cant.8 However, ROWE indirectly affects these outcomes by increasing schedule control and decreasing negative work-home spillover, both of which do improve well-being outcomes (Pathways e and f). These indirect (only) effects differ from mediation effects in that there is no observable direct effect to mediate. We cannot establish why there are no observed direct effects between ROWE and well-being outcomes but suggest there are many paths of influence from ROWE, some positive and some negative, not all of which are considered in the model. However, Table 3 shows that the specific indirect pathways investigated here have positive effects on well-being.
Specifically, increases in schedule control and decreases in negative work-home spillover (Path-ways c and d) both predict increases in sleep qual-ity and energy, along with decreases in emotional exhaustion and psychological distress. Reductions in negative work-home spillover predict an increase in self-reported health and personal mas-tery. ROWE thus indirectly influences well-being outcomes, with the biggest indirect effects through schedule control and somewhat smaller effects through negative work-home spillover.
To summarize, ROWE facilitates employees’ health-related behaviors (more sleep, more exer-cise, greater likelihood of going to the doctor when sick, and less likelihood of working when sick). These direct effects of ROWE are, as theorized,
at Serials Records, University of Minnesota Libraries on December 5, 2011hsb.sagepub.comDownloaded from
Tabl
e 3.
Sum
mar
y of
Indi
rect
Effe
cts
of R
esul
ts O
nly
Wor
k En
viro
nmen
t (R
OW
E) o
n H
ealth
and
Wel
l-Bei
ng
Pane
l A: S
leep
Qua
lity
Pane
l B: E
mot
iona
l Exh
aust
ion
Pane
l C: P
erso
nal M
aste
ry
M
odel
1M
odel
4M
odel
1M
odel
4M
odel
1M
odel
4
Stru
ctur
al E
quat
ion
Mod
el P
athw
ays
Stan
dard
Est
imat
eSt
anda
rd E
stim
ate
Stan
dard
Est
imat
eSt
anda
rd E
stim
ate
Stan
dard
Est
imat
eSt
anda
rd E
stim
ate
Dir
ect
effe
cts
on h
ealth
-rel
ated
out
com
es
Hea
lth T
1 →
Hea
lth
Out
com
e T
2 (a
).4
50**
*.3
84**
*.5
74**
*.4
52**
*.6
42**
*.6
03**
*
RO
WE
→ H
ealth
O
utco
me
T2
(b)
–.05
4.0
12–.
007
.079
*–.
009
−.0
44
Sc
hedu
le C
ontr
ol T
2 →
Hea
lth O
utco
me
T2
(c)
—.1
25**
*—
–.12
1***
—.0
52
N
egat
ive
Wor
k-
Hom
e Sp
illov
er T
2
→ H
ealth
Out
com
e T
2 (d
)
—−
.270
***
—.3
81**
*—
−.2
11**
*
Inte
rven
ing
path
way
s
ROW
E →
Sch
edul
e C
ontr
ol T
2 (e
).2
26**
*.2
37**
*.2
29**
*
RO
WE
→ N
egat
ive
Wor
k-H
ome
S
pillo
ver T
2 (f)
–.01
9–.
048
−.0
27
Sc
hedu
le C
ontr
ol T
2 →
Neg
ativ
e W
ork-
H
ome
Spill
over
T2
(g)
–.23
0***
–.17
4***
−.2
53**
*
Indi
rect
effe
cts
on h
ealth
-rel
ated
out
com
es
ROW
E →
Sch
edul
e C
ontr
ol T
2 →
H
ealth
T2
(h =
c ×
e)
—.0
28**
—–.
029*
**—
.012
*
419
(con
tinue
d)
at Serials Records, University of Minnesota Libraries on December 5, 2011hsb.sagepub.comDownloaded from
Pane
l A: S
leep
Qua
lity
Pane
l B: E
mot
iona
l Exh
aust
ion
Pane
l C: P
erso
nal M
aste
ry
M
odel
1M
odel
4M
odel
1M
odel
4M
odel
1M
odel
4
Stru
ctur
al E
quat
ion
Mod
el P
athw
ays
Stan
dard
Est
imat
eSt
anda
rd E
stim
ate
Stan
dard
Est
imat
eSt
anda
rd E
stim
ate
Stan
dard
Est
imat
eSt
anda
rd E
stim
ate
RO
WE
→ N
egat
ive
Wor
k-H
ome
S
pillo
ver T
2 →
H
ealth
T2
(i =
f ×
d)
—.0
05—
–.01
8*—
.006
RO
WE
→ S
ched
ule
Con
trol
T2
→
Neg
ativ
e W
ork-
H
ome
T2
→ H
ealth
T
2 (j
= e
× g
× d
)
—.0
14**
—–.
016*
—.0
12*
T o
tal I
ndir
ect
Effe
ct
of R
OW
E on
Hea
lth
T2
(k =
h +
i +
j)
—.0
48**
*—
–.06
3***
—.0
30**
T o
tal E
ffect
of R
OW
E
on
Hea
lth T
2 (b
+ k
)
Mod
el fi
t st
atis
tics
N
orm
ed χ
25.
339
2.64
69.
717
4.73
39.
893
4.78
0
Goo
dnes
s-of
-Fit
ind
ex.6
57.9
10.5
24.9
40.5
02.9
40
R
oot
mea
n sq
uare
e
r ror
of
app
roxi
mat
ion
.093
.074
.115
.075
.116
.076
420
Tabl
e 3.
(co
ntin
ued)
(con
tinue
d)
at Serials Records, University of Minnesota Libraries on December 5, 2011hsb.sagepub.comDownloaded from

421
Pane
l A: S
leep
Qua
lity
Pane
l B: E
mot
iona
l Exh
aust
ion
Pane
l C: P
erso
nal M
aste
ry
M
odel
1M
odel
4M
odel
1M
odel
4M
odel
1M
odel
4
Stru
ctur
al E
quat
ion
Mod
el P
athw
ays
Stan
dard
Est
imat
eSt
anda
rd E
stim
ate
Stan
dard
Est
imat
eSt
anda
rd E
stim
ate
Stan
dard
Est
imat
eSt
anda
rd E
stim
ate
Pa
nel D
: Psy
chol
ogic
al D
istr
ess
Pane
l E: S
elf-R
epor
ted
Hea
lthPa
nel F
: Ene
rgy
Stru
ctur
al E
quat
ion
Mod
el P
athw
ays
Mod
el 1
Stan
dard
Est
imat
e
Mod
el 4
Stan
dard
Est
imat
e
Mod
el 1
Stan
dard
Est
imat
e
Mod
el 4
Stan
dard
Est
imat
e
Mod
el 1
Stan
dard
Est
imat
e
Mod
el 4
Stan
dard
Est
imat
e
Dir
ect
effe
cts
on h
ealth
-rel
ated
out
com
es
Hea
lth T
1 →
Hea
lth
Out
com
e T
2 (a
).6
33**
*.5
44**
*.6
50**
*.6
34**
*.6
08**
*.5
32**
*
RO
WE
→ H
ealth
O
utco
me
T2
(b)
−.0
13.0
45−
.024
–.05
0.0
58.0
19
Sc
hedu
le C
ontr
ol T
2 →
Hea
lth O
utco
me
T2
(c)
—–.
083*
—.0
45—
.087
*
N
egat
ive
Wor
k-
Hom
e Sp
illov
er T
2 →
Hea
lth O
utco
me
T2
(d)
—.3
65**
*—
–.10
7**
—−
.227
***
Inte
rven
ing
path
way
s
ROW
E →
Sch
edul
e C
ontr
ol T
2 (e
)—
.247
***
.236
***
.224
***
RO
WE
→ N
egat
ive
Wor
k-H
ome
S
pillo
ver T
2 (f)
—–.
033
–.02
3–.
010
Sc
hedu
le C
ontr
ol T
2 →
Neg
ativ
e W
ork-
H
ome
Spill
over
T2
(g)
—–.
191*
**–.
269*
**–.
241*
**
Indi
rect
effe
cts
on h
ealth
-rel
ated
out
com
es
ROW
E →
Sch
edul
e C
ontr
ol T
2 →
H
ealth
T2
(h =
c ×
e)
—–.
021*
—.0
11*
—.0
20* (con
tinue
d)
Tabl
e 3.
(co
ntin
ued)
at Serials Records, University of Minnesota Libraries on December 5, 2011hsb.sagepub.comDownloaded from
Pane
l A: S
leep
Qua
lity
Pane
l B: E
mot
iona
l Exh
aust
ion
Pane
l C: P
erso
nal M
aste
ry
M
odel
1M
odel
4M
odel
1M
odel
4M
odel
1M
odel
4
Stru
ctur
al E
quat
ion
Mod
el P
athw
a ys
Stan
dard
Est
imat
eSt
anda
rd E
stim
ate
Stan
dard
Est
imat
eSt
anda
rd E
stim
ate
Stan
dard
Est
imat
eSt
anda
rd E
stim
ate
RO
WE
→ N
egat
ive
Wor
k-H
ome
S
pillo
ver T
2 →
H
ealth
T2
(i =
f ×
d)
—–.
012*
—.0
02—
.002
RO
WE
→ S
ched
ule
Con
trol
T2
→
Neg
ativ
e W
ork-
H
ome
T2
→ H
ealth
T
2 (j
= e
× g
× d
)
—–.
017*
—.0
07*
—.0
12*
T o
tal I
ndir
ect
Effe
ct o
f R
OW
E on
Hea
lth T
2 (
k =
h +
i +
j)
—–.
050*
**—
.020
**—
.034
***
To
tal E
ffect
of R
OW
E o
n H
ealth
T2
(b +
k)
Mod
el fi
t st
atis
tics
N
orm
ed χ
23.
958
2.34
35.
208
2.24
65.
308
2.81
2
Goo
dnes
s-of
-Fit
inde
x.9
24.8
62.6
88.9
30.6
88.9
42
R
oot
mea
n sq
uare
e
rror
of
app
roxi
mat
ion
.074
.050
.098
.070
.099
.076
Not
e: R
esul
ts a
re fr
om s
truc
tura
l equ
atio
n m
odel
ing.
Path
way
labe
ls (
lett
ers)
cor
resp
ond
to F
igur
e 1
or in
dica
te p
rodu
cts
of c
oeffi
cien
ts fo
r in
dire
ct e
ffect
s. C
ontr
ols
incl
uded
in t
he
mod
els,
but
not
show
n in
the
tab
les,
incl
ude
gend
er, a
ge g
roup
, par
enta
l sta
tus,
exem
pt s
tatu
s, in
com
e, t
enur
e, o
ccup
atio
nal l
evel
, wor
k ho
urs
(mor
e th
an 5
0 pe
r w
eek)
, psy
chol
ogic
al
job
dem
ands
, dec
isio
n au
thor
ity, s
kill
disc
retio
n, s
atis
fact
ion
with
man
ager
, sup
port
ive
occu
patio
nal e
nvir
onm
ent,
life
chan
ge b
etw
een
wav
es, a
nd jo
b ch
ange
bet
wee
n w
aves
. The
full
tabl
e is
ava
ilabl
e on
req
uest
. Das
hes
indi
cate
non
-app
licab
ility
.*p
< .0
5. *
*p <
.01.
***
p <
.001
.
422
Tabl
e 3.
(co
ntin
ued)
Pane
l D: P
sych
olog
ical
Dis
tres
sPa
nel E
: Sel
f-Rep
orte
d H
ealth
Pane
l F: E
nerg
y
M
odel
1M
odel
4M
odel
1M
odel
4M
odel
1M
odel
4
at Serials Records, University of Minnesota Libraries on December 5, 2011hsb.sagepub.comDownloaded from

Moen et al. 423
mediated by changes in schedule control and nega-tive work-home spillover. On the other hand, ROWE does not directly influence employees’ subjective measures of well-being, although it indirectly influences these outcomes by increasing employees’ sense of schedule control and their ability to manage work and home life, changes that do improve well-being measures.
Additional Analysis
We considered whether the effects described above hold similarly for women and men, for parents with children at home (vs. other employees), and for mothers and fathers, examining whether our findings are consistent across these and other sub-samples (see Part B, Tables S-4 and S-5 of the online supplement). Note that small sample sizes made it difficult to detect statistically significant differences across subgroups in these exploratory analyses. However, the suggestive evidence is that women (with and without children at home) par-ticipating in ROWE experience greater changes in sleep and exercise than do fathers (see Table S-5; Maume et al. 2009). Additional investigations (see Part C of the online supplement) of two substan-tive issues (alternative mediation pathways and variation in implementation) and two method-ological issues (selection bias and clustering of responses within teams) produced no evidence challenging the results presented here.
DISCUSSIONA major contribution of studying a corporate inno-vation is that it points to the potential power of organizational change as a way of promoting employee wellness, particularly in terms of pre-vention behaviors. Many flexibility policies are offered to help individuals on a selective basis with “their” problems (Kelly and Moen 2007). What our evidence underscores is the importance of organizational-level changes promoting real flexi-bility in terms of employees’ control over the time and timing of their work, not individual adapta-tions and accommodations that leave existing work-time arrangements intact (Heaney 2003). This is a key point. ROWE differs from more com-mon flexible work arrangements in that flexibility
becomes the standard way of working, not an exception granted by a supervisor.
Using a natural experiment design, we were able to demonstrate that this workplace initiative pro-duced corresponding changes in employees’ health-related behaviors (getting enough sleep, exercising more, going to the doctor when sick, not going to the workplace when ill). This has important implica-tions for health, suggesting the value of widespread adoption of organizational changes in the temporal structure of work. Sleep and exercise are linked to stress and risks of chronic diseases (Buxton and Marcelli 2010; Maume et al. 2009; Moore et al. 2002), with huge impacts for individuals and their families as well as for costs borne by employers (both health care costs and lost productivity). Less commonly considered are implications of caring for oneself properly and protecting others when one has a minor or moderate illness, but there is growing concern with “presenteeism” (being on the job but not working effectively) and with workplace trans-mission of illness.
Processes of Change
A second contribution is our specification of mechanisms. The theoretical framing drawn from the occupational health and stress process litera-tures underscores control and stress as key media-tors between the social environment and health-related outcomes. We found two key medi-ating mechanisms, enhanced schedule control and reduced negative work-home spillover, as path-ways from the ROWE innovation to changes in employee health behaviors and as indirect links to well-being measures. The evidence, particularly in the models of health behaviors, confirms Hypotheses 2 and 3 that the ROWE initiative oper-ates by increasing employees’ schedule control, decreasing negative work-home spillover, or a combination of the two. Our model of ROWE’s changing schedule control, with schedule control changes, in turn, reducing negative work-home spillover, is consistent with previous theory and empirical research on the importance of control (whether job control, schedule control, or more global personal mastery) and stress (such as nega-tive work-home spillover) for individual beliefs, behavior, and health.
at Serials Records, University of Minnesota Libraries on December 5, 2011hsb.sagepub.comDownloaded from
424 Journal of Health and Social Behavior 52(4)
The findings from this natural experiment (of an organizational innovation [ROWE] building real flexibility into the temporal structure of work) rein-force and extend prior evidence linking schedule control with health outcomes primarily based on cross-sectional data (Evans and Steptoe 2002; Frone et al. 1996; Grzywacz and Bass 2003; Grzywacz et al. 2007; Moen et al. 2008; Thomas and Ganster 1995). Studying such a deliberate change in working conditions permits us to move beyond issues of selec-tion into and out of these conditions endemic to research comparing employees with or without work-place flexibility, schedule control, or work-family conflict. Moreover, the effects on health behaviors are, we believe, quite remarkable.
In contrast to the findings on health behaviors, we see no evidence of direct effects of ROWE on the well-being outcomes tested. However, there are indi-rect (only) effects, in that increases in schedule con-trol and reductions in work-family conflict (which ROWE precipitates) improve employees’ well-being in the form of increasing personal mastery, sleep quality, self-reported health, and energy levels, as well as reducing emotional exhaustion and psycho-logical distress. These changes are suggestive that ROWE might have greater effects on health and well-being over longer time periods.
Limitations and Suggestions for Future Research
An ideal test of ROWE (or other workplace initia-tives) would be to randomly assign work teams to treatment and control groups. Additional investiga-tions of subgroup differences as well as other populations of employees (including blue-collar, service, and low-wage workers) are also advisable, as are studies of different types of interventions. It is not clear how an adaptive change such as ROWE would operate in retail stores or hospitals, for example, but we theorize that efforts to provide employees with tools to better control the time and timing of their work and reduce work-family stress would promote better health behaviors.
Given that all employees in the study were located in different parts of the same corporate set-ting, it is likely there was some social interaction between the ROWE and comparison groups, rais-ing questions regarding potential contamination.
However, any contamination between the groups would result in greater similarity and fewer differ-ences in measured outcomes, thus creating a con-servative test of differences.
There is also the possibility of treatment misiden-tification (Hawthorne Effect) in which simply par-ticipating in the study influences the responses of individuals. We reduced this possibility by not men-tioning ROWE in the recruitment and introduction to the survey and are reassured by finding some meas-ures (e.g., job satisfaction) did not change between waves and/or differ by group. We were also sensitive to the possibility of organizational changes affecting one group (ROWE or comparison group) more than the other, a threat to validity often called “history” (Shadish et al. 2002). While other changes occurred during ROWE implementation, there is no evidence of differential exposure to them.
Questions remain about the sustainability and the likely diffusion of this type of organizational innovation and its health-related effects, given that our study encompassed only a six-month period. The fact that a human resources staff person is charged with continuing to implement and monitor ROWE at Best Buy and that ROWE is incorpo-rated in training new employees suggests the ini-tiative continues to be important within this site.
In their decade review, Bianchi and Milkie (2010:718) note the “growing use of randomized experiments and quasi-experimental approaches to studying work and family issues.” Our study points to the possible payoffs of investigating change in existing policies and practices creating and sus-taining outdated time cages that constrain the way work is done. The evidence suggests that loosening these time cages increases employees’ schedule control and reduces negative work-family stress, two mechanisms promoting health behaviors. But as Lutfey and Freese (2005:1332) argue, there are very likely “massively multiple mechanisms” link-ing (in this case) time structures with health behav-iors. Other potential mechanisms are fruitful avenues for future research, as are other outcomes, and other organizational innovations.
ACKNOWLEDGMENTSThis research was conducted as part of the Work, Family
and Health Network (www.workfamilyhealthnetwork.org),
at Serials Records, University of Minnesota Libraries on December 5, 2011hsb.sagepub.comDownloaded from

Moen et al. 425
funded by a cooperative agreement through the National
Institute of Child Health and Human Development (Grant
Number U011HD051256), National Institute on Aging
(Grant Number U01AG027669), Office of Behavioral and
Social Sciences Research, and National Institute of Occupa-
tional Safety and Health (Grant Number U010H008788).
The contents of this article are solely the responsibility of the
authors and do not necessarily represent the official views of
these institutes and offices. Special acknowledgment goes to
Extramural Staff Science Collaborator Rosalind Berkowitz
King, PhD (National Institute of Child Health and Human
Development), and Lynne Casper, PhD (now of the Univer-
sity of Southern California), for design of the original
initiative. Additional support was provided by the Alfred P.
Sloan Foundation (Number 2002-6-8) and the Institute for
Advanced Studies at the University of Minnesota. We thank
the Minnesota Population Center (HD041023) and the
McKnight Foundation. We appreciate the suggestions of the
Flexible Work and Well-Being team and the assistance of
Jane Peterson.
NOTES1. See Gotlib and Wheaton (1997) and Muhonen and
Torkleson (2004).
2. Results Only Work Environment (ROWE) was devel-
oped by two Best Buy employees, Cali Ressler and
Jody Thompson, now of CultureRx. (See Moen,
Kelly, and Chermack 2009; Ressler and Thompson
2008; www.gorowe.com.)
3. In this white-collar setting, there is a close relation-
ship between control over the timing of work and the
location of that work, but this may not be the case in
other settings. The analyses were robust to omitting
the question about control over work location.
4. We examined a number of alternative measures of
work-family conflict and time strain, including Nete-
meyer, Boles, and McMurrian’s (1996) measure of
work-family conflict; a scale of time adequacy in
various areas; and a measure of work-schedule fit.
Using other measures did not substantively alter the
results.
5. This measure classifies the few employees who
attended ROWE sessions but subsequently moved to
teams still working in under the conventional rules
and culture as being in the comparison group because
these workers would not be able to implement the key
tenets of ROWE.
6. We use well-known properties of structural equation
modeling to describe the direct, indirect, and total
effect of ROWE on health-related outcomes (Knoke,
Bohrnstedt, and Mee 2002; Schumacker and Lomax
2010). The direct effects are represented by the stan-
dardized estimates of the direct effect of ROWE,
schedule control, and negative work-home spillover.
Effects of the indirect pathway of ROWE on the
health-related outcomes through changing schedule
control and negative work-home spillover are calcu-
lated by multiplying the path coefficients of that
indirect path. The total indirect effect of ROWE on
the health-related outcome is the sum of all of the
indirect pathways from ROWE to the health-related
outcome, and the total effect of ROWE on the health
related outcome is the sum of both the direct and indi-
rect paths.
7. The coefficients reported in Table 2 are standardized
coefficients, as is standard practice when presenting
structural equation model coefficients. To calculate
the effect of ROWE (or any other variable) on hours
of sleep, we use the unstandardized coefficients. The
unstandardized coefficients are presented in the text
in some places and are available in online supplement
Table S-3.
8. To save space, we present only Models 1 and 4 here. For
all outcomes, Models 2 and 3 indicate that schedule con-
trol and negative work-home spillover influence the
health-related outcome and that ROWE influences
schedule control and negative work-home spillover.
REFERENCESAdam, Barbara. 1995. Timewatch: The Social Analysis of
Time. Cambridge, UK: Polity.
Allen, Tammy D., and Jeremy Armstrong. 2006. “Fur-
ther Examination of the Link between Work-Family
Conflict and Physical Health.” American Behavioral
Scientist 49:1204–21.
Allen, Tammy D., David E. L. Herst, Carly S. Bruck, and
Martha Sutton. 2000. “Consequences Associated with
Work-to-Family Conflict: A Review and Agenda for
Future Research.” Journal of Occupational Health
Psychology 5:278–308.
Aneshensel, Carol S. 1992. “Social Stress—Theory and
Research.” Annual Review of Sociology 18:5–38.
Bentler, Peter M., and Douglas G. Bonett. 1980. “Sig-
nificance Tests and Goodness of Fit in the Analysis
of Covariance Structures.” Psychological Bulletin
88:588–606.
Berkman, Lisa, and Ichiro Kawachi. 2003. Social Epide-
miology. New York: Oxford.
at Serials Records, University of Minnesota Libraries on December 5, 2011hsb.sagepub.comDownloaded from

426 Journal of Health and Social Behavior 52(4)
Bianchi, Suzanne, Lynne Casper, and Rosalind King.
2005. Work, Family, Health, and Well-Being. Mah-
wah, NJ: Lawrence Erlbaum.
Bianchi, Suzanne, and Melissa A. Milkie. 2010. “Work
and Family Research in the First Decade of the
21st Century.” Journal of Marriage and Family 72:
705–25.
Bianchi, Suzanne M., John P. Robinson, and Melissa A.
Milkie. 2006. Changing Rhythms of American Family
Life. ASA Rose Series. New York: Russell Sage.
Bollen, Kenneth A., and J. Scott Long. 1993. Testing Struc-
tural Equation Models. Newbury Park, CA: Sage.
Bosma, Hans, Stephen A. Stansfeld, and Michael G.
Marmot. 1998. “Job Control, Personal Characteris-
tics, and Heart Disease.” Journal of Occupational
Health Psychology 3:402–409.
Bronfenbrenner, Urie. 1979. The Ecology of Human
Development: Experiments by Nature and Design.
Cambridge, MA: Harvard.
Burgard, Sarah H., and Jennifer A. Ailshire. 2009. “Put-
ting Work to Bed: Stressful Experiences on the Job
and Sleep Quality.” Journal of Health and Social
Behavior 50:476–92.
Buxton, Orfeu M., and Enrico Marcelli. 2010. “Short and
Long Sleep Are Positively Associated with Obesity,
Diabetes, Hypertension, and Cardiovascular Disease
among Adults in the United States.” Social Science
Medicine 71:1027–36.
Coser, Lewis A., and Rose Laub Coser. 1963. “Time Per-
spective and Social Structure.” Pp. 638–50 in Modern
Sociology, edited by A. W. Gouldner and H. P. Gould-
ner. New York: Harcourt.
de Lange, Annet H., Toon W. Taris, Michiel A. J.
Kompier, Irene L. D. Houtman, and Paulien M.
Bongers. 2004. “The Relationships between Work
Characteristics and Mental Health: Examining Nor-
mal, Reversed and Reciprocal Relationships in a
4-Wave Study.” Work and Stress 18:149–66.
D’Souza, Rennie M., Lyndall Strazdins, Lynette Lim,
Dorothy H. Broom, and Bryan Rodgers. 2003. “Work
and Health in a Contemporary Society: Demands,
Control, and Insecurity.” Journal of Epidemiological
and Community Health 57:849–54.
Elder, Glen H., Jr., Linda K. George, and Michael J.
Shanahan. 1996. “Psychosocial Stress over the Life
Course.” Pp. 247–92 in Psychosocial Stress: Per-
spectives on Structure, Theory, Life-Course, and
Methods, edited by H. B. Kaplan. San Diego, CA:
Academic.
Epstein, Cynthia Fuchs, and Arne Kalleberg. 2004. Fight-
ing for Time: Shifting Boundaries of Work and Social
Life. New York: Russell Sage.
Evans, Olga, and Andrew Steptoe. 2002. “The Contribution
of Gender-Role Orientation, Work Factors and Home
Stressors to Psychological Well-Being and Sickness
Absence in Male- and Female-Dominated Occupational
Groups.” Social Science and Medicine 54:481–92.
Fenwick, Rudy, and Mark Tausig. 2007. “Work and the
Political Economy of Stress: Recontextualizing the
Study of Mental Health/Illness in Sociology.” Pp.
143–67 in Mental Health, Social Mirror, edited by
W. R. Avison, J. D. McLeaod, and P. A. Pesconsolido.
New York: Springer.
Frone, Michael R., Marcia Russell, and Grace M. Barnes.
1996. “Work-Family Conflict, Gender, and Health-
Related Outcomes: A Study of Employed Parents in
Two Community Samples.” Journal of Occupational
Health Psychology 1:57–69.
Furukawa, Toshiaki A., Ronald C. Kessler, T. Slade, and
G. Andrews. 2003. “The Performance of the K6 and
K10 Screening Scales for Psychological Distress in
the Australian National Survey of Mental Health and
Well-Being.” Psychological Medicine 33:357–62.
Gershuny, Jonathan. 2000. Changing Times: Work and
Leisure in Postindustrial Society. New York: Oxford.
Goode, William J. 1960. “A Theory of Role Strain.”
American Sociological Review 25:483–96.
Gotlib, Ian H., and Blair Wheaton. 1997. Stress and
Adversity over the Life Course Trajectories and Turn-
ing Points. New York: Cambridge.
Grant-Vallone, Elisa J., and Stewart I. Donaldson.
2001. “Consequences of Work-Family Conflict on
Employee Well-Being over Time.” Work and Stress
15:214–26.
Greenhaus, Jeffrey H., and Nicholas J. Beutell. 1985.
“Sources of Conflict between Work and Family
Roles.” Academy of Management Review 10:76–88.
Grzywacz, Joseph G., and Brenda L. Bass. 2003. “Work,
Family, and Mental Health: Testing Different Models
of Work-Family Fit.” Journal of Marriage and Fam-
ily 65:248–62.
Grzywacz, Joseph G., Patrick R. Casey, and Fiona A.
Jones. 2007. “The Effects of Workplace Flexibility
on Health Behaviors: A Cross-Sectional and Longi-
tudinal Analysis.” Journal of Occupational and Envi-
ronmental Medicine 49:1302–1309.
Grzywacz, Joseph G., and Nadine F. Marks. 2000. “Recon-
ceptualizing the Work–Family Interface: An Ecological
at Serials Records, University of Minnesota Libraries on December 5, 2011hsb.sagepub.comDownloaded from

Moen et al. 427
Perspective on the Correlates of Positive and Negative
Spillover between Work and Family.” Journal of Occu-
pational Health Psychology 5:111–26.
Hammer, Leslie B., Jennifer C. Cullen, Margaret B. Neal,
Robert R. Sinclair, and Margarita V. Shafiro. 2005.
“The Longitudinal Effects of Work-Family Conflict
and Positive Spillover on Depressive Symptoms
among Dual-Earner Couples.” Journal of Occupa-
tional Health Psychology 10:138–54.
Hassard, John. 1990. The Sociology of Time. New York:
St. Martin’s.
Hayes, Andrew F. 2009. “Beyond Baron and Kenny: Sta-
tistical Mediation Analysis in the New Millennium.”
Communication Monographs 76:408–20.
Heaney, Catherine A. 2003. “Worksite Health Interven-
tions: Targets for Change and Strategies for Attain-
ing Them.” Pp. 305–23 in Handbook of Occupational
Health Psychology, edited by J. C. Quick and L. E.
Tetrick. Washington, DC: APA.
Hill, Reuben. 1949. Families under Stress. New York:
Harper Row.
Hochschild, Arlie. 1997. The Time Bind: When Work
Becomes Home and Home Becomes Work. New York:
Henry Holt.
House, James S. 2002. “Understanding Social Factors
and Inequalities in Health: 20th Century Progress
and 21st Century Prospects.” Journal of Health and
Social Behavior 43:125–42.
Jacobs, Jerry A., and Kathleen Gerson. 2004. The Time
Divide: Work, Family and Gender Inequality. Cam-
bridge, MA: Harvard.
Karasek, Robert. 1979. “Job Demands, Job Decision Lat-
itude, and Mental Strain: Implications for Job Rede-
sign.” Administrative Science Quarterly 24:285–308.
Karasek, Robert, and Töres Theorell. 1990. Healthy
Work: Stress, Productivity, and the Reconstruction of
Working Life. New York: Basic Books.
Kelly, Erin, and Phyllis Moen. 2007. “Rethinking the
Clockwork of Work: Why Schedule Control May Pay
Off at Home and at Work.” Advances in Developing
Human Resources 9:487–506.
Kelly, Erin L., Samantha K. Ammons, Kelly Chermack,
and Phyllis Moen. 2010. “Gendered Challenge, Gen-
dered Response: Confronting the Ideal Worker Norm
in a White-Collar Organization.” Gender & Society
24:281–303.
Kelly, Erin L., Ellen Ernst Kossek, Leslie B. Ham-
mer, Mary Durham, Jeremy Bray, Kelly Chermack,
Lauren A. Murphy, and Dan Kaskubar. 2008. “Getting
There from Here: Research on the Effects of Work-Fam-
ily Initiatives on Work-Family Conflict and Business
Outcomes.” Academy of Management Annals 2:305–49.
Kelly, Erin L., Phyllis Moen, and Eric Tranby. 2011.
“Changing Workplaces to Reduce Work-Family Con-
flict: Schedule Control in a White-Collar Organiza-
tion.” American Sociological Review 76:1–26.
Kim, Jungmeen E., Phyllis Moen, and Hyunjoo Min.
2003. “Well-Being.” Pp. 122–32 in It’s about Time:
Couples and Careers, edited by P. Moen. Ithaca, NY:
Cornell University Press.
Kleiner, Sibyl, and Eliza K. Pavalko. 2010. “Clocking
In: The Organization of Work Time and Health in the
United States.” Social Forces 88:1463–86.
Knoke, David, George W. Bohrnstedt, and Alisa Potter
Mee. 2002. Statistics for Social Data Analysis. 4th ed.
Itasca, IL: F. E. Peacock.
Korabik, Karen, Donna S. Lero, and Denise L.
Whitehead. 2008. Handbook of Work-Family Inte-
gration: Research, Theory, and Best Practices. New
York: Elsevier.
Kossek, Ellen E., and Susan Lambert. 2005. Work and
Life Integration. Mahwah, NJ: Lawrence Erlbaum.
Kristensen, Tage S., Lars Smith-Hansen, and Nicole
Jansen. 2005. “A Systematic Approach to the Assess-
ment of the Psychological Work Environment and the
Associations with Family Work Conflict.” Pp. 433–50
in Work, Family, Health, and Well-Being, edited by S.
M. Bianchi, L. M. Casper, and R. B. King. Mahwah,
NJ: Lawrence Erlbaum.
Lazarus, Richard S., and Susan Folkman. 1984. Stress,
Appraisal and Coping. New York: Springer.
Link, Bruce G. 2008. “Epidemiological Sociology and
the Social Shaping of Population Health.” Journal of
Health and Social Behavior 49:367–84.
Lutfey, Karen, and Jeremy Freese. 2005. “Toward Some
Fundamentals of Fundamental Causality: Socio-
economic Status and Health in the Routine Clinic
Visit for Diabetes.” American Journal of Sociology
110:1326–72.
Major, Virginia Smith, Katherine J. Klein, and Mark G.
Ehrhart. 2002. “Work Time, Work Interference with
Family, and Psychological Distress.” Journal of
Applied Psychology 87:427–36.
Maslach, Christina, and Susan E. Jackson. 1986. Maslach
Burnout Inventory Manual. 2nd ed. Palo Alto, CA:
Consulting Psychologists.
at Serials Records, University of Minnesota Libraries on December 5, 2011hsb.sagepub.comDownloaded from

428 Journal of Health and Social Behavior 52(4)
Maume, David J., Rachel A. Sebastian, and Anthony R.
Bardo. 2009. “Gender Differences in Sleep Disrup-
tion among Retail Food Workers.” American Socio-
logical Review 74:989–1007.
Mausner-Dorsch, Hilde, and William W. Eaton. 2000.
“Psychosocial Work Environment and Depression:
Epidemiologic Assessment of the Demand-Control
Model.” American Journal of Public Health 90:1765–70.
Moen, Phyllis, ed. 2003. It’s About Time: Couples and
Careers. Ithaca, NY: Cornell University Press.
Moen, Phyllis, Erin Kelly, and Kelly Chermack. 2009.
“Learning from a Natural Experiment: Studying a
Corporate Work-Time Policy Initiative.” Pp. 97–131
in Work-Life Policies That Make a Real Difference for
Individuals, Families, and Organizations, edited by
A. C. Crouter and A. Booth. Washington, DC: Urban
Institute.
Moen, Phyllis, Erin L. Kelly, and Rachelle Hill. 2011.
“Does Enhancing Work-Time Control and Flexibility
Reduce Turnover? A Naturally-Occurring Experi-
ment.” Social Problems 58:69–98.
Moen, Phyllis, Erin L. Kelly, and Qinlei Huang. 2008.
“Work, Family, and Life-Course Fit: Does Control
over Work Time Matter?” Journal of Vocational
Behavior 73:414–25.
Moen, Phyllis, and Patricia Roehling. 2005. The Career
Mystique: Cracks in the American Dream. Boulder,
CO: Rowman & Littlefield.
Moen, Phyllis, and Yan Yu. 2000. “Effective Work/Life
Strategies: Working Couples, Work Conditions, Gen-
der, and Life Quality.” Social Problems 47:291–326.
Moore, Philip, J., Nancy E. Adler, David R. Williams,
and James S. Jackson. 2002. “Socioeconomic Sta-
tus and Health: The Role of Sleep.” Psychosomatic
Medicine 64:337–44.
Muhonen, Tuji, and Eva Torkelson. 2004. “Work Locus
of Control and Its Relationship to Health and Job
Satisfaction from a Gender Perspective.” Stress and
Health 20:21–28.
Netemeyer, Richard G., James S. Boles, and Robert
McMurrian. 1996. “Development and Validation of
Work-Family Conflict and Family-Work Conflict
Scales.” Journal of Applied Psychology 81:400–10.
Nomaguchi, Kei M., and Suzanne M. Bianchi. 2004.
“Exercise Time: Gender Differences in the Effects of
Marriage, Parenthood, and Employment.” Journal of
Marriage and Family 66:413–30.
Nowotny, Helga. 1992. “Time and Social Theory: Towards a
Social Theory of Time.” Time Society 1:421–54.
Pearlin, Leonard I. 1989. “The Sociological Study of
Stress.” Journal of Health and Social Behavior
30:241–56.
Pearlin, Leonard I., Morton A. Lieberman, Elizabeth
Menaghan, and Joseph T. Mullan. 1981. “The Stress
Process.” Journal of Health and Social Behavior
22:337–56.
Pearlin, Leonard I., Scott Schieman, Elana M. Fazio,
and Stephen Meersman. 2005. “Stress, Health, and
the Life Course: Some Conceptual Specifications.”
Journal of Health and Social Behavior 46:205–19.
Pearlin, Leonard I., and Carmi Schooler. 1978. “The
Structure of Coping.” Journal of Health and Social
Behavior 19:1–21.
Perlow, Leslie A. 1997. Finding Time: How Corporations,
Individuals, and Families Can Benefit from New Work
Practices. Ithaca, NY: Cornell University Press.
Phelan, Jo C., Bruce G. Link, Ana Diez-Roux, Ichiro
Kawachi, and Bruce Levin. 2004. “Fundamental
Causes of Social Inequalities in Mortality: A Test of
the Theory.” Journal of Health and Social Behavior
45:265–85.
Preacher, Kristopher J., and Andrew F. Hayes. 2008.
“Asymptotic and Resampling Strategies for Assessing
and Comparing Indirect Effects in Multiple Mediator
Models.” Behavioral Research Methods 40:879–91.
Presser, Harriet. 2003. Working in a 24/7 Economy:
Challenges for American Families. New York: Rus-
sell Sage.
Rau, Renate, and Antje Triemer. 2004. “Overtime in
Relation to Blood Pressure and Mood during Work,
Leisure, and Night Time.” Social Indicators Research
67:51–73.
Ressler, Cali, and Jody Thompson. 2008. Why Work
Sucks and How to Fix It: No Schedules, No Meetings,
No Joke—The Simple Change That Can Make Your
Job Terrific. New York: Portfolio.
Roxburgh, Susan. 2004. “‘There Just Aren’t Enough
Hours in the Day’: The Mental Health Consequences
of Time Pressure.” Journal of Health and Social
Behavior 45:115–31.
Rubin, Beth A. 2007. Research in the Sociology of Work,
Vol. 17, Work Place Temporalities. New York: Elsevier.
Schumacker, Randall E., and Richard G. Lomax. 2010. A
Beginner’s Guide to Structural Equation Modeling.
3rd ed. New York: Routledge.
Sennett, Richard. 1998. The Corrosion of Character: The
Personal Consequences of Work in the New Capital-
ism. New York: Norton.
at Serials Records, University of Minnesota Libraries on December 5, 2011hsb.sagepub.comDownloaded from

Moen et al. 429
Sewell, William F. 1992. “A Theory of Structure: Duality,
Agency, and Transformation.” American Journal of
Sociology 98:1–29.
Shadish, William R., Thomas D. Cook, and Donald T.
Campbell. 2002. Experimental and Quasi-Experi-
mental Designs for Generalized Causal Inference.
Boston: Houghton Mifflin.
Sorokin, Pitirim A., and Robert K. Merton. 1937. “Social
Time: A Methodological Anti Functional Analysis.”
American Journal of Sociology 42:615–29.
Stansfeld, Stephen, and Bridget Candy. 2006. “Psycho-
social Work Environment and Mental Health—A
Meta-Analytic Review.” Scandinavian Journal of
Workplace and Environmental Health 32:443–62.
Tausig, Mark, and Rudy Fenwick. 2001. “Unbinding
Time: Alternate Work Schedules and Work-Life
Balance.” Journal of Family and Economic Issues
22:101–19.
Thomas, Linda T., and Daniel C. Ganster. 1995. “Impact
of Family-Supportive Work Variables on Work-
Family Conflict and Strain: A Control Perspective.”
Journal of Applied Psychology 80:6–15.
Thompson, Edward P. 1967. “Time, Work-Discipline, and
Industrial Capitalism.” Past and Present 36:52–97.
Turner, R. Jay, Blair Wheaton, and Donald Lloyd. 1995.
“The Epidemiology of Social Stress.” American Soci-
ological Review 60:104–25.
van der Doef, Margot, and Stan Maes. 1999. “The Job
Demand-Control (-Support) Model and Psychologi-
cal Well-Being: A Review of 20 Years of Empirical
Research.” Work Stress 13:87–114.
Wheaton, Blair, and Philippa Clarke. 2003. “Space Meets
Time: Integrating Temporal and Contextual Influ-
ences on Mental Health in Early Adulthood.” Ameri-
can Sociological Review 68:680–706.
Zerubavel, Eviatar. 1985. The Seven Day Circle: The His-
tory and Meaning of the Week. Chicago: University
of Chicago.
Bios
Phyllis Moen is Professor of Sociology and holds a
McKnight Presidential Chair at the University of Minne-
sota, and is an affiliate of the Minnesota Population
Center. She studies and publishes widely in the areas of
work, family, gender, age and the life course, and health.
Her most recent books are It’s about Time: Couples and
Careers (2003) and The Career Mystique: Cracks in the
American Dream (2005) with Patricia Roehling.
Erin L. Kelly is Associate Professor of Sociology at the
University of Minnesota and an affiliate of the Minne-
sota Population Center. She studies the adoption and
implementation of new workplace policies and the con-
sequences of these innovations for employees, families,
and work organizations. Her research on flexibility
initiatives, family leaves, childcare benefits, sexual
harassment policies, and diversity programs has been
published in the American Sociological Review, Ameri-
can Journal of Sociology, Law & Society Review, and
other venues. She and Phyllis Moen co-direct the Flexi-
ble Work and Well-Being Study, which is part of the
Work, Family & Health Network supported by the
National Institutes of Health and Centers for Disease
Control.
Eric Tranby is Assistant Professor in the Department of
Sociology and Criminal Justice at the University of Dela-
ware. His research interests include gender and racial
inequality, comparative public policy, work-family bal-
ance, and life course research. His work has been
published in the American Sociological Review, Social
Problems, Journal for the Scientific Study of Religion,
and Research in Social Stratification and Mobility.
Qinlei Huang is a graduate student in the Department of
Sociology at the University of Minnesota.
at Serials Records, University of Minnesota Libraries on December 5, 2011hsb.sagepub.comDownloaded from
Top Related