


Languages
Pages
Legal

December 9, 2020
Joint Meeting of the ERS Board of Trustees and Investment Advisory Committee

Public Agenda #24
Call Meeting of the Board of Trustees to Order
December 9, 2020

Public Agenda #25
Call Meeting of the Investment Advisory Committee to Order
December 9, 2020

Public Agenda #26
Review and Approval of the Minutes to the August 19, 2020 Joint Meeting of the Board of Trustees and
Investment Advisory Committee – (Action)
December 9, 2020

Questions?Action Item

Public Agenda Item #27
*Discussion and Training regarding Ethics
December 9, 2020Paula A. Jones, Deputy Executive Director and General
Dr. Robert Prentice, Department Chair and Professor, University of Texas at Austin, McCombs School of Business
ERS policy requires employees to perform their duties in an ethical manner
ERS works diligently to maintain and promote an ethical work environment
All new employees receive ethics-related training during new hire orientation from the Deputy Executive Director & General Counsel (DED&GC) who serves as the ERS Ethics Officer
Ethics Training
Agenda item 27 – Joint Meeting December 9, 2020 7

Employees are encouraged to discuss issues with their supervisors, Human Resources or the DED&GC
ERS Intranet or external website available for reports of any alleged ethics violations. Reports may be anonymous
Any report goes to Directors of Human Resources, Internal Audit and to DED&GC
All reports are investigated
Ethics Training
Agenda item 27 – Joint Meeting December 9, 2020 8

There were no reports of ethics violations this fiscal year
ERS staff is required to complete annual ethics training All ERS staff completed ethics training in FY20
ERS Investment Policy requires that the ERS Board of Trustees, IAC members and Investment-related staff to receive ethics training annually
Agenda item 27 – Joint Meeting December 9, 2020
Ethics Training
9

Ethics training will be presented by Dr. Robert Prentice Chair of the Business, Government & Society Department The Ed & Molly Smith Professor of Business Law, and faculty director of
the Ethics Unwrapped ethics video series University of Texas at Austin, McCombs School of Business
Ethics Training
Agenda item 27 – Joint Meeting December 9, 2020 10

GIVING VOICE TO YOUR VALUES
DEC. 9, 2020
Robert PrenticeCenter for Leadership & EthicsMcCombs School of BusinessUniversity of Texas at Austin 11

“Please talk about tools available to those people in organizations who raise their hands to point out problems, risks, etc. in connection with ethical decision making.” (Request from IAC member following 2019 ethics training)
12

Helen Sharkey Gebhard
13

Helen Sharkey Gebhard
14

Helen: “For the first time in my life, I gave up on myself and stopped fighting for what I knew to be
right.”
How could Helen have spoken up for her values?
15

Mary Gentile, GIVING VOICE TO VALUES: HOW TO SPEAK YOUR MIND WHEN YOU KNOW WHAT’S RIGHT (2011)
16

SEVEN PILLARS1. Values2. Choice3. Normalization4. Purpose5. Self-knowledge & Alignment6. Voice7. Reasons & Rationalizations
17

1. VALUES
18

1. VALUES• Think carefully about what your values are, so
that:
19

1. VALUES• Think carefully about what your values are, so that:
• You can answer the question: “Is this the hill I want to die on?”
20

1. VALUES• Think carefully about what your values are, so that:
• You can answer the question: “Is this the hill I want to die on?”
• You can appeal to others who share your common values, and frame your arguments in terms of advancing those shared values.
21

2. CHOICE
22

2. CHOICE• If you look back over your business life, there are
probably times that you have chosen to stand up for your values, and times that you have chosen not to do so.
23

2. CHOICE• When you did speak up for and act for your values,
ask yourself four questions:1) What did you do and what was the impact?2) What motivated you to speak up and act?3) How satisfied are you? How would you like to have
responded?4) What would have made it easier to speak and act?
24

2. CHOICE• When you failed to speak up and act, ask four
questions:1) What happened?2) Why didn’t you speak up and act? What would have
motivated you to do so?3) How satisfied are you? How would you like to have
responded?4) What would have made it easier to speak and act?
25

2. CHOICE
• Recruit allies, because it makes it easier to:• Resist authority (Milgram)
26

2. CHOICE
• Recruit allies, because it makes it easier to:• Resist authority (Milgram)• Resist conformity (Asch)
27

2. CHOICE
• Recruit allies, because it makes it easier to:• Resist authority (Milgram)• Resist conformity (Asch)• Help others (Batson)
28

2. CHOICE
• “Talk out loud about it to another person.”
• “This single act makes the decision feel more real, less hypothetical, less easily avoided. We have brought it into the light.”
29

2. CHOICE
• Selection and sequencing of audiences• Who is best to approach?
30
2. CHOICE
• Selection and sequencing of audiences• Who is best to approach?• Who would be the best allies to approach this person?
31

2. CHOICE
• Selection and sequencing of audiences• Who is best to approach?• Who would be the best allies to approach this person?• In person or on line?
32

2. CHOICE
• Selection and sequencing of audiences• Who is best to approach?• Who would be the best allies to approach this person?• In person or on line?• In public or in private?
33

2. CHOICE
• Framing:• Reframe an unethical opportunity as a risk we must avoid
34

2. CHOICE
• Framing:• Reframe an unethical opportunity as a risk we must avoid• Reframe a denouncing of others’ ethics as a “learning
dialogue”
35
2. CHOICE
• Framing:• Reframe an unethical opportunity as a risk we must avoid• Reframe a denouncing of others’ ethics as a “learning
dialogue”• With a little imagination, reframe win-lose scenarios as
win-win scenarios
36

3. NORMALIZATION
37

3. NORMALIZATION
• Values conflicts and moral dilemmas are an inevitable aspect of today’s business world. They are normal.
• So get used to them and realize that part of your job is to work on your skills to handle them properly.
38

3. NORMALIZATION
• A manager: “In retrospect, this problem really wasn’t that overwhelming once I figured out what I wanted to do. But before that, I lied – I instinctively lied – hoping that it just wouldn’t happen again. Now I realize that such choices are an inevitable part of our business journey and it doesn’t seem so huge.”
39

3. NORMALIZATION• GVV tips:
• Take the emotion out of the scenario• Realize that the people challenging your values do
not think of themselves as bad people• Consider what all parties have at stake• View the situation within a broader organizational
context to look for ways all sides can benefit without violation laws or norms
40

4. PURPOSE
41

4. PURPOSE
• Think carefully about why you do what you do.• Just drawing a paycheck?
42

4. PURPOSE
• Think carefully about why you do what you do.• Just drawing a paycheck?
• And what is the company’s goal? Perhaps to be a respected corporate citizen?
• Leverage the company’s code of ethics or credo
43

4. PURPOSE
• Think carefully about why you do what you do.• Just drawing a paycheck?
• And what is the company’s goal? Perhaps to be a respected corporate citizen?
• Leverage the company’s code of ethics or credo• Make the debate about big-picture values (individual and
organizational) rather than seamy little battles over dollars and cents.
44

4. PURPOSE
Gentile: To see ourselves as part of an endeavor to accomplish something laudable, “gives us more arguments for presenting our point of view. It also dignifies the values conflicts themselves. These are not seamy little dilemmas that we squirm over quietly and try to forget, rationalizing that they are simply the unfortunate ‘price we must pay’ to survive in a particular firm or industry. Instead, they become opportunities to take a step toward building or preserving an organization that we can be proud of. Instead of normalizing the loss of our values, we can normalize the fact that we will be called upon to preserve them in the face of predictable challenges.”
45

5. SELF-KNOWLEDGE AND ALIGNMENT
“We are all the heroes of our own story.” –Mary McCarthy
46

5. SELF-KNOWLEDGE AND ALIGNMENT
Three steps:
47

5. SELF-KNOWLEDGE AND ALIGNMENT
Three steps:• Create a self-narrative where you are a person who stands up
for your values.
48

5. SELF-KNOWLEDGE AND ALIGNMENT
Three steps:• Create a self-narrative where you are a person who stands up
for your values.• Say something out loud to someone else.
49

5. SELF-KNOWLEDGE AND ALIGNMENT
Three steps:• Create a self-narrative where you are a person who stands up
for your values.• Say something out loud to someone else.• Pre-script
50

• “Prescript”
• Who are the heroes?
• Psychologists interviewed them…
51

• “Prescript”
• Highlands Ranch shooting (May 2019)
Kendrick RayCastillo
Kendrick Castillo
52

• I have all my students prescript.
53

• E-mail from one student:
“Your Business law class taught me a lot about visualizing yourself with difficult situations before they are confronted, so when you face them, you already know how to act. I worked for a legal advocate for survivors of gender-based violence last year, and when I found myself in this situation, fortunately I knew what steps to take. I am grateful that BHP instilled such a strong moral compass and sense of ethics.”
54

• E-mail from another former student:
“The ethical dilemma paper that you assigned has already served me well. On my fifth day in a tax accounting internship, I was asked by a partner at my firm to hide some funds in an account where they did not belong… A pit formed in my stomach and I couldn’t help but feel that making the wrong decision could set the tone for the rest of my career.”
55

“I came up with a script as to what to say to the partner and walked to his office with my heart nearly beating out of my chest. I posed my concern and was able to follow up his answers with innocent questions until he saw my real issue. Like me, he wanted to rationalize the decision for a moment, but soon came around to seeing the right thing to do.
“I don’t think that I would have done the right thing had I not written the paper.”
56

6. VOICE
57

6. VOICE• If we can learn a foreign language or learn a new software
program, we can learn to more effectively speak up for our values
58

6. VOICE
59

6. Voice• If we can learn a foreign language or learn a new software
program, we can learn to more effectively speak up for our values
• We just need to effectively:• Clarify the ethical issue• Bring it to the attention of the relevant people• Persuade them as to the proper path• Motivate them to take it
60

6. Voice• Three tips:
• Don’t be “preachy”• Dialogue rather than sermonize
• Don’t play the Lone Ranger• Enlist allies and/or mentors
• Practice, practice, practice (and “prescript”)• It’s hard to be ethical on the fly, as Helen Sharkey
Gebhard found out
61

7. Reasons and Rationalizations
62

7. Reasons and Rationalizations• Remember that those you are trying to convince will have
their own reasons and rationalizations for their positions. These must be overcome.
63

• Common rationalizations.
“Rationalizations are more important than sex.”
“The Big Chill”
“Rationalizations are more important than sex.”
64

• Anand et al., categorizations:
65

Denial of Responsibility
• “I know it was wrong, but my boss ordered me.”• “I know it was wrong, but it’s what my client wanted.”
66

Denial of Responsibility:Adolf Eichmann (one of Hitler’s major organizers of the
Holocaust): “What I said to myself was this: The head of State has ordered it, and those exercising judicial authority over me are now transmitting it. I escaped into other areas and looked for a cover for myself which gave me some peace of mind at least, and so in this way I was able to shift—no, that is not the right term—to attach this whole thing one hundred percent to those in judicial authority who happened to be my superiors, to the head of State—since they gave the orders. So, deep down, I did not consider myself responsible and I felt free of guilt. I was greatly relieved that I had nothing to do with the actual physical extermination.”
Eichmann 67

Denial of Injury“I know it was wrong, but no one was really hurt.”“I know it was wrong, but it could have been worse.”
68
Denial of InjuryMichael Lewis, LIAR’S POKER: “There was a convenient way of looking at this situation … Anyway, who was hurt besides my German? … The German’s bank had lost sixty thousand dollars. The bank’s shareholders, the Austrian Government, were therefore the losers. But compared with the assets of the nation as a whole, sixty thousand dollars was a ridiculously small sum.”

Denial of Victim
“I know it was wrong, but my client is an idiot; he deserves to be screwed.”
70
Denial of Victim
--Jack Abramoff referred to his Indian clients as “monkeys” and “troglodytes.”
71

Denial of Victim
--A Milgram subject after the experiment said: “He was so stupid and stubborn. He deserved to be shocked.”
72

--When sex abuse survivors sued the Catholic Church, William Donohoe, president of the Catholic League, referred to them as “a pitiful bunch of malcontents.”
73

Social Weighting
Condemn the condemnor• “What I did was wrong, but you have no right to criticize
me.”
74

Social Weighting
Condemn the condemnor• “What I did was wrong, but you have no right to criticize
me.”Selective comparisons
• “I know I shouldn’t do this, but others are even worse.”
75

Selective comparisons
• “’Don’t worry mate—there’s bigger crooks in the market than us guys!’ wrote an official of Rabobank, the large Dutch lender after he agreed to a request from one of the bank’s traders in 2007 to submit a phony rate for Libor rates in yen.”
76

Appeal to Higher Loyalties
“I know this is wrong, but I have to be loyal to my firm.”“I know this is wrong, but I have a family to feed.”
77

Appeal to Higher Loyalties
B.F. Goodrich made fighter plane brakes it sold to the Air Force. They kept flunking safety tests. Gretzinger went to talk to his superiors. “An hour passed and Gretzinger returned. Looking dejected, he told the engineers: ‘I’ve always believed that ethics and integrity were every bit as important as theorems and formulas, and never once has anything happened to change my beliefs. Now this….Hell, I’ve got two sons I’ve got to put through school…’”
78
• Reinhard Siekaczek, an accountant who handled $50m in bribery money at Siemens:
• “We all knew that what we were doing was illegal. I didn’t really look at it from an ethical standpoint. We did it for the company. It was about keeping the business unit alive and not jeopardizing thousands of jobs overnight.”
79
Metaphor of the Ledger
“I work lots of extra hours, so it’s ok if I pad my expense account.”
“I’m underpaid, so it’s ok if I take some office supplies home.”
80

Metaphor of the Ledger
Jack Abramoff: “I give 80% of my income to charity, so my actions are justified”
81

Metaphor of the Ledger
A UT MBA who served in the Iraq War, and whose responsibility was to disburse large sums of cash that were always in her possession, said: “…there were days when I was so frustrated with the lack of senior leadership involvement, feeling overworked and underpaid for the amount of responsibility, and the feeling of loss from missing so much time with my family, that a sense of entitlement towards my stockpile of money would creep in, completing the perfect fraud triangle for me.”
82

Two other rationalizations:
“This is the last time…”
--study of journalists
83
Two other rationalizations:
“Altruistic Cheating”
-- “I’m doing this to help someone else.”
84
Professors Hannah, Avolio, and May speak of moral conation: “the capacity to generate responsibility and motivation to take moral action in the face of adversity and persevere through challenges.”
85

They say that moral conation takes three things:
• Moral Ownership• This is your life. These are your values. You must
take ownership and not just float along as if you are a bystander to your own career.
86

They say that moral conation takes three things:• Moral Ownership• Moral Efficacy
• You’ve got to feel like you can actually make a difference. You can get there by prescripting, recruiting allies, etc. But obviously, it helps a lot if the company makes it easier, not harder, for employees to speak up for the right.
87

They say that moral conation takes three things:• Moral Ownership• Moral Efficacy• Moral Courage
• Again, speaking aloud, prescripting, recruiting allies, and saving “screw you” funds can all help
88

Some good news from Mary Gentile’s experience at Columbia Business School
89

90

Questions?

*Public Agenda Item #28
*Review of Retirement Program Actuarial Valuations and Financial Status
December 9, 2020Ariana Whaley, Pension Policy Analyst
Ryan Falls, Senior Consultant, Gabriel Roeder & SmithJoe Newton, Pension Practice Leader, Gabriel Roeder & SmithDana Woolfrey, Senior Consultant, Gabriel Roeder & Smith
Copyright © 2020 GRS – All rights reserved.
Actuarial Valuations of the ERS Retirement Funds as of August 31, 2020
Ryan Falls, FSA, EA, MAAAJoe Newton, FSA, EA, MAAADana Woolfrey, FSA, EA, MAAA
December 9, 2020

Agenda• ERS Funding Valuation Results• LECOSRF and JRS2 Funding Valuation Results• Accounting Results at August 31, 2020
94

Purpose of Actuarial Valuation• Snapshot as of August 31, 2020 using member data,
financial data, benefit and contribution provisions, actuarial assumptions and methods as of that date
• Purposes:– Measure the actuarial liabilities and funding levels– Determine adequacy of current statutory contributions– Provide other information for reporting
GASB 67/68, Comprehensive Annual Financial Report– Explain changes in actuarial condition of the plans– Track changes over time– Analyze future outlook
95

Where are we headed now?• Outlook is similar as discussed during experience study as all
three trust funds are projected to run out of money and the funds would not be able to pay earned benefits to current members during retirement – ERS trust is projected to run out of money in ≈ 40 years– LECOSRF trust is projected to run out of money in ≈ 20 years– JRS2 trust is projected to run out of money in ≈ 40 years
• Changes are required to limit risks to benefit security• Further delays by Legislature make adjustments more costly
96
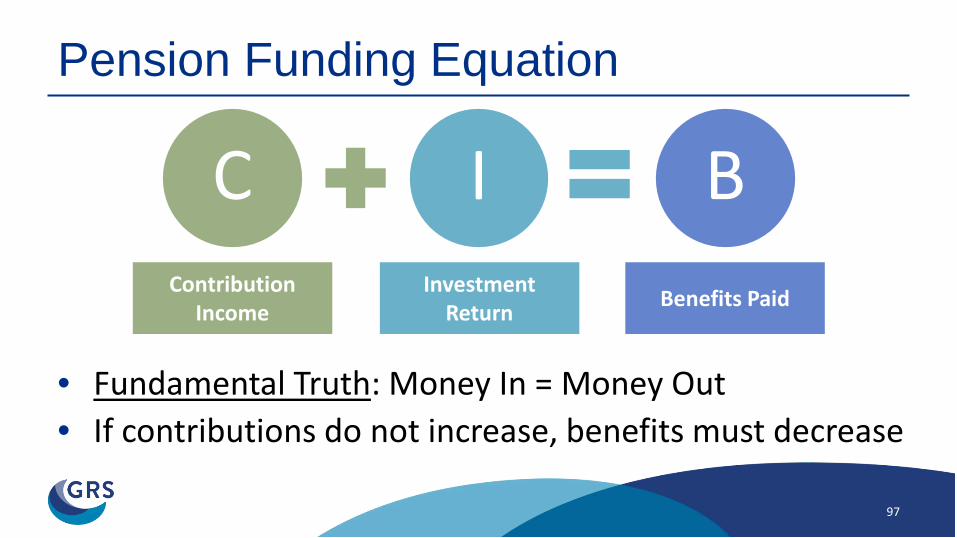
Pension Funding Equation
97
C I BContribution
IncomeInvestment
Return Benefits Paid
• Fundamental Truth: Money In = Money Out• If contributions do not increase, benefits must decrease

98
ERS Funding Valuation Results
at August 31, 2020

Updated Actuarial Assumptions• Board adopted updated actuarial assumptions in May
– Upon completion of Actuarial Experience Study• New assumptions will provide best starting point for
discussions with Legislature in upcoming session– Biggest impact was lowering investment return
assumption to 7.00%– Life expectancy consistent with prior study
99

Asset Experience• Actual rate of return on market for FY20 was ≈ 6.8%• Actuarial metrics primarily based on 5-year smoothed value of
assets (actuarial value, or AVA), not market value• 5 year smoothed return on AVA was 6.1% in FY 2020
– FY19 return on market was ≈ 3.0%
• $597 million in net deferred losses, not yet recognized– Will be recognized over next four years
100

Funded Status (ERS)($ in millions)
101
AVA MVA
Actuarial Accrued Liability $43,258 $43,258AVA / MVA 28,543 27,946Unfunded Accrued Liability $14,715 $15,312Funded Ratio 66.0% 64.6%Funding Period Never Never
AVA MVA
Actuarial Accrued Liability $39,801 $39,801AVA / MVA 28,060 27,351Unfunded Accrued Liability $11,741 $12,450Funded Ratio 70.5% 68.7%Funding Period Never Never
Actuarial Valuation as of August 31, 2019
Actuarial Valuation as of August 31, 2020

102
Funded Ratio Projections (ERS)Historical Scenario
Projections assume no changes to current assumptions and except actual asset returns, as noted, all other assumptions are met and future contributions continue at current levels.
Fund depleted in 2061
Fund depleted in 2051
Fund depleted in 2047

103
Funded Ratio Projections (ERS)Probability of Solvency
Projections assume no changes to current assumptions and except actual asset returns, as noted, all other assumptions are met and future contributions continue at current levels.
This represents the probability of the trust fund having assets at the beginning of each year
Stochastic Projections based on 7.0% median return expectation and 12% standard deviation

Funding Guidelines• Board approved the Pension Funding Priorities and Guidelines in
August 2020• Policy laid out a multi-level funding period goal to gradually achieve
funding on sound actuarial principles1. Fund normal costs,2. Avoid trust fund depletion,3. Meet current statutory standard of a 31-year funding period, and4. Match funding period to the average years of service at retirement
once a 31-year funding period is achieved, and closed.• With projected depletion date in 41 years, none of the Board’s vital
funding period goals are being met
104

Actuarially Sound Contribution (ERS)
105
106
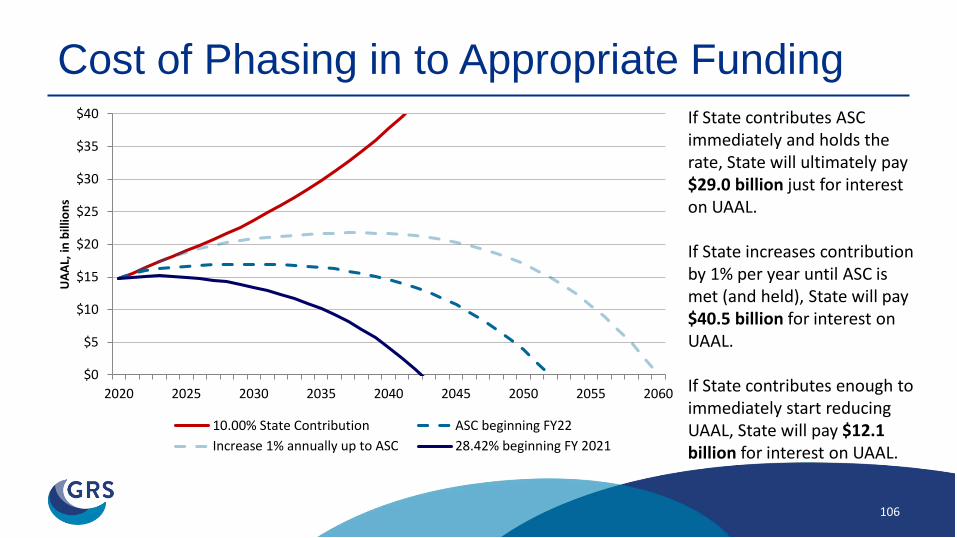
Cost of Phasing in to Appropriate FundingIf State contributes ASC immediately and holds the rate, State will ultimately pay $29.0 billion just for interest on UAAL.
If State increases contribution by 1% per year until ASC is met (and held), State will pay $40.5 billion for interest on UAAL.
If State contributes enough to immediately start reducing UAAL, State will pay $12.1 billion for interest on UAAL.
$0
$5
$10
$15
$20
$25
$30
$35
$40
2020 2025 2030 2035 2040 2045 2050 2055 2060
UAA
L, in
bill
ions
10.00% State Contribution ASC beginning FY22Increase 1% annually up to ASC 28.42% beginning FY 2021

107
LECOSRF and JRS2 Funding Valuation Results
at August 31, 2020

LECOSRF and JRS2 Results• LECOSRF had a reduction in funded status
– Contributions are not sufficient to sustain the plan– Projected depletion date in 21 years
• JRS2 had a reduction in funded status– Contributions are not sufficient to sustain the plan– Projected depletion date in 39 years
108

Funded Status($ in millions)
109
Actuarial Valuation as of 2020 2019
Actuarial Accrued Liability $1,610 $1,483Actuarial Value of Assets 968 968Unfunded Accrued Liability $642 $515Funded Ratio 60.1% 65.3%Funding Period Never Never
Actuarial Valuation as of 2020 2019
Actuarial Accrued Liability $591 $535Actuarial Value of Assets 487 468Unfunded Accrued Liability $104 $67Funded Ratio 82.3% 87.5%Funding Period Never Never
Judicial Retirement System of Texas, Plan 2
LECO Supplemental Retirement Fund
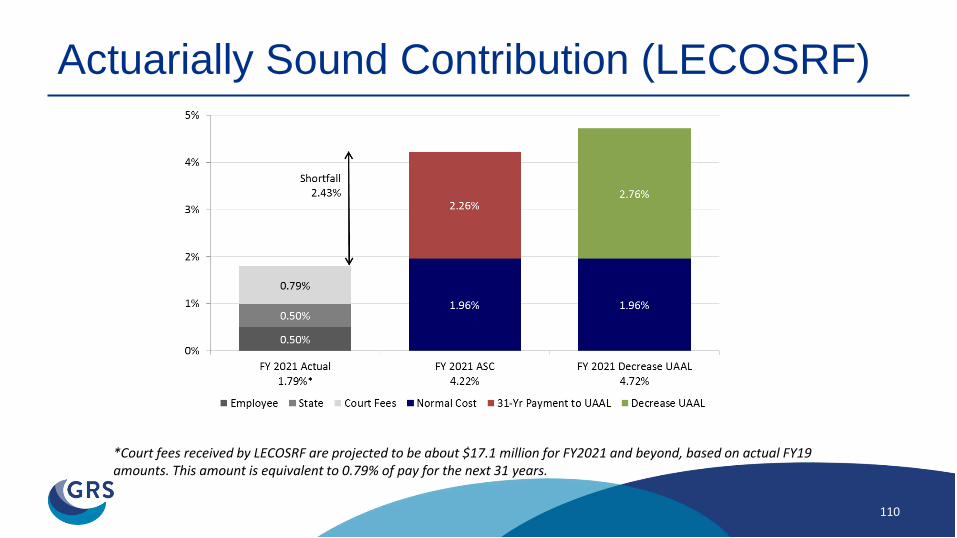
Actuarially Sound Contribution (LECOSRF)
110
*Court fees received by LECOSRF are projected to be about $17.1 million for FY2021 and beyond, based on actual FY19 amounts. This amount is equivalent to 0.79% of pay for the next 31 years.

Actuarially Sound Contribution (JRS2)
111

112
Accounting Results as of August 31, 2020

Determining Discount Rate• Discount rate used in determining the Total Pension
Liability (TPL) is a blend of two rates– Long-term expected rate of return on pension plan
investments (7.00% based on current investment policy) Can be used to discount plan obligations as long as there are
projected assets sufficient to pay projected plan benefits– Yield or index rate for a 20-year, tax-exempt general
obligation municipal bond (2.33% as of August 31, 2020) Used to discount plan obligations after the projected assets have
been extinguished
113

Accounting Valuation Results
($ in billions)
114
August 31, 2020 CurrentIncreased Funding Difference
Single Discount Rate (SDR) 3.62% 7.00%
Total Pension Liability $65.9 $43.2 $22.7
Plan Fiduciary Net Position 27.9 27.9 0.0
Net Pension Liability (NPL) 38.0 15.3 22.7
• With stronger funding policy, unfunded liability on State’s balance sheet could immediately drop by $22.7 billion
115
Summary

Summary• Doing nothing is no longer an option• For ERS, LECOSRF, and JRS-2, current
contribution levels are not sufficient to sustain the system– Without an increase of contributions over the
current schedules the benefit security will continue to deteriorate
116

Disclaimers• This presentation is intended to be used in conjunction
with the actuarial valuation reports issued in December 2020. This presentation should not be relied on for any purpose other than the purpose described in the valuation reports.
• This presentation shall not be construed to provide tax advice, legal advice or investment advice.
117

Questions?

Public Agenda Item #29
*Educational Presentation – Overview of Credit Rating Agency Metrics, Methodologies and Impact on State Ratings
December 9, 2020
Cathy Terrell, Deputy Executive DirectorNicholas Samuels, Sr. Vice President, Moody’s Investors Service
Tom Aaron, Vice President, Senior Credit Officer, Moody’s Investors Service

Texas and credit impact of pension funding
December 9, 2020Nick Samuels, Senior Vice PresidentTom Aaron, Vice President – Senior Credit Officer


Texas and credit impact of pension funding December 9, 2020 122
Key topics
1. State sector credit overview2. State of Texas

1 State sector credit overview

Texas and credit impact of pension funding December 9, 2020 124
State rating distribution OUTLOOK
StableNegative
RUR Down
Positive
RUR Up
This Presentation does not announce a credit rating action. For any credit ratings referenced in this presentation, please see the ratings tab on the issuer/entity page on www.moodys.com for the most updated credit rating action information and rating history.
Aaa Delaware Florida Georgia Indiana* Iowa* Maryland Missouri North Carolina South Carolina South Dakota*Tennessee Texas Utah Virginia Washington
Aa1 Alabama Arizona* Arkansas Colorado* Idaho* Massachusetts Michigan Minnesota Montana Nebraska*Nevada New Hampshire North Dakota* Ohio Oregon Vermont Wisconsin
Aa2 California Hawaii Kansas* Maine Mississippi New Mexico New York Oklahoma* Rhode Island West VirginiaAa3 Alaska Kentucky Louisiana PennsylvaniaA1 ConnecticutA2A3 New Jersey
Baa1Baa2Baa3 IllinoisBa1Ba2Ba3B1B2B3
Caa1Caa2Caa3
CaC
*Issuer rating (state either not permitted to issue GO debt or permitted to, but none is outstanding)As of 2 November 2020 Source: Moody’s Investors Service
Texas and credit impact of pension funding December 9, 2020 125
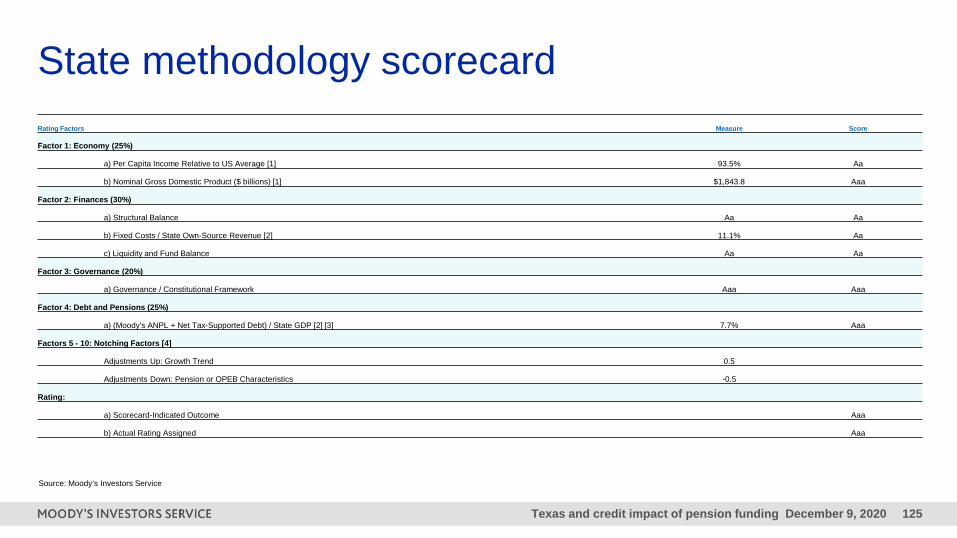
Rating Factors Measure Score
Factor 1: Economy (25%)
a) Per Capita Income Relative to US Average [1] 93.5% Aa
b) Nominal Gross Domestic Product ($ billions) [1] $1,843.8 Aaa
Factor 2: Finances (30%)
a) Structural Balance Aa Aa
b) Fixed Costs / State Own-Source Revenue [2] 11.1% Aa
c) Liquidity and Fund Balance Aa Aa
Factor 3: Governance (20%)
a) Governance / Constitutional Framework Aaa Aaa
Factor 4: Debt and Pensions (25%)
a) (Moody's ANPL + Net Tax-Supported Debt) / State GDP [2] [3] 7.7% Aaa
Factors 5 - 10: Notching Factors [4]
Adjustments Up: Growth Trend 0.5
Adjustments Down: Pension or OPEB Characteristics -0.5
Rating:
a) Scorecard-Indicated Outcome Aaa
b) Actual Rating Assigned Aaa
State methodology scorecard
Source: Moody’s Investors Service

Texas and credit impact of pension funding December 9, 2020 126
Pensions are “must-pay” obligations for most state and local governments» Credit quality remains high for most state and local governments
– But pension affordability ratios more challenging than ever for many
» Service solvency a key credit consideration
– Bondholder risk rises as pensions + other fixed costs “crowd-out” essential services
» Bond default and/or bankruptcy usually precedes pension benefit defaults
– Detroit, MI; Harvey, IL; Puerto Rico; CA cities of San Bernardino, Stockton, Vallejo
» Pension unaffordability = debt unaffordability

Texas and credit impact of pension funding December 9, 2020 127
State and local government pension risks are high as ever
Q2 2020 assets: $4.6 trillion (24% of US GDP)(55% corporate equities)
2007 assets: $3.3 trillion (23% of US GDP)(56% corporate equities)
Q2 2020: 22% of US GDP (Fed basis)
2007: 11% of US GDP
Contributions relative to revenues at or near historical peaks for many…
…but often do not “tread water” under reported discount rates
Larger unfunded liabilities Higher annual costs
Similar scale of asset risk
Negative non-investment cash flow (NICF) will constrain asset accumulation without higher contributions
Weaker cash flow
Less pension “smoothing” capacity

2 State of Texas

Texas and credit impact of pension funding December 9, 2020 129
Credit strengths» Strong long-term demographic and employment trends that drive tax revenue
» Economic diversification that helps buttress the state from energy market volatility
» Conservative revenue forecasting and a rainy day fund that provides an ample budgetary cushion
» Bonded debt ratios on both a per capita and personal income basis that are well below Moody's 50-state medians
Credit challenges» Weak pension funding practices
» Budget balancing pressure amid growing state spending for K-12 education and demand for transportation funding in a political environment that is generally adverse to tax increases
» Social pressures like the nation's highest healthcare uninsured rate and above-average poverty that drive safety net spending
» Above-average economic exposure to climate risks, especially water stress and hurricanes that require policy and capital investment to mitigate
Texas credit profile

Texas and credit impact of pension funding December 9, 2020 130
Pensions & OPEB drive Texas liabilities
0%
2%
4%
6%
8%
10%
12%
14%
2015 2016 2017 2018 2019
NTSD ANPL ANOL Total leverage (50-state median)
Source: Moody’s Investors Service
Debt, pensions & OPEB as a percentage of state GDP (adjusted net OPEB liabilities unavailable before 2017)

Texas and credit impact of pension funding December 9, 2020 131
Pensions a challenge in Texas’ credit profile
ANPL % own-source revenue
ANPL per capita
ANPL % personal income ANPL % GDP
NTSD+ANPL+ANOL % GDP
Tread water shortfall % own-source revenue
Texas 161% $4,550 8.6% 7.0% 11.2% 2.7%
50-state median 80% $2,258 5.2% 4.8% 7.9% -0.1%
Rank 10 19 18 20 21 3
Texas and 50-state median pension metrics
Sources: Moody’s Investors Service, state and pension plan financial statements, US Bureau of Economic Analysis
Texas’ FY 2019 ANPL (based on 2018 pension measurements): $131.4 billion» TRS: 75%
» ERS: 24%
» Misc. others (e.g., Judicial and Emergency Services systems): 1%

Texas and credit impact of pension funding December 9, 2020 132
Moody’s adjusted liabilities reflect market-based discount rate as of measurement dateGASB “depletion” signals cash flow challenge, but no liability impact
August 31, 2019: 3.00%
August 31 2020: …
0%
1%
2%
3%
4%
5%
6%
7%
Source: Society of Actuaries
Measurement date 8/31/2019$ blns Actuarial valuation GASB Moody'sDiscount rate 7.50% 4.42% 3.00%
Total liabilities $39.8 $57.3 $70.1
Assets $27.4 $27.4 $27.4
Unfunded liability $12.5 $30.0 $42.8
Sources: Moody’s Investors Service, Texas ERS financial statements and actuarial valuation
Texas ERS Funding

Texas and credit impact of pension funding December 9, 2020 133
Asset volatility and reduced “smoothing” capacity will remain the key pension risk drivers for governments
Texas ERS’ probability of depletion, with current contribution rates
Source: Moody’s Investors Service, using Texas ERS actuarial valuations
Texas ERS’ probability of depletion, with 12% return volatility
0%
5%
10%
15%
20%
25%
30%
35%
2019
2021
2023
2025
2027
2029
2031
2033
2035
2037
2039
2041
2043
2045
12% volatility 15% volatility
0%
5%
10%
15%
20%
25%
30%
35%
2019
2021
2023
2025
2027
2029
2031
2033
2035
2037
2039
2041
2043
2045
10% of payroll contribution rate(current)
Source: Moody’s Investors Service, using Texas ERS actuarial valuations

moodys.com
Nick Samuels
Senior Vice President
(212) 553-7121
Tom Aaron
Vice President – Senior Credit Officer
(312) 706-9967
Texas and credit impact of pension funding December 9, 2020 135
© 2020 Moody’s Corporation, Moody’s Investors Service, Inc., Moody’s Analytics, Inc. and/or their licensors and affiliates (collectively, “MOODY’S”). All rights reserved.
CREDIT RATINGS ISSUED BY MOODY'S INVESTORS SERVICE, INC. AND/OR ITS CREDIT RATINGS AFFILIATES ARE MOODY’S CURRENT OPINIONS OF THE RELATIVE FUTURE CREDIT RISK OF ENTITIES, CREDIT COMMITMENTS, OR DEBT OR DEBT-LIKE SECURITIES, AND MATERIALS, PRODUCTS, SERVICES AND INFORMATION PUBLISHED BY MOODY’S (COLLECTIVELY, “PUBLICATIONS”) MAY INCLUDE SUCH CURRENT OPINIONS. MOODY’S INVESTORS SERVICE DEFINES CREDIT RISK AS THE RISK THAT AN ENTITY MAY NOT MEET ITS CONTRACTUAL FINANCIAL OBLIGATIONS AS THEY COME DUE AND ANY ESTIMATED FINANCIAL LOSS IN THE EVENT OF DEFAULT OR IMPAIRMENT. SEE MOODY’S RATING SYMBOLS AND DEFINITIONS PUBLICATION FOR INFORMATION ON THE TYPES OF CONTRACTUAL FINANCIAL OBLIGATIONS ADDRESSED BY MOODY’S INVESTORS SERVICE CREDIT RATINGS. CREDIT RATINGS DO NOT ADDRESS ANY OTHER RISK, INCLUDING BUT NOT LIMITED TO: LIQUIDITY RISK, MARKET VALUE RISK, OR PRICE VOLATILITY. CREDIT RATINGS, NON-CREDIT ASSESSMENTS (“ASSESSMENTS”), AND OTHER OPINIONS INCLUDED IN MOODY’S PUBLICATIONS ARE NOT STATEMENTS OF CURRENT OR HISTORICAL FACT. MOODY’S PUBLICATIONS MAY ALSO INCLUDE QUANTITATIVE MODEL-BASED ESTIMATES OF CREDIT RISK AND RELATED OPINIONS OR COMMENTARY PUBLISHED BY MOODY’S ANALYTICS, INC. AND/OR ITS AFFILIATES. MOODY’S CREDIT RATINGS, ASSESSMENTS, OTHER OPINIONS AND PUBLICATIONS DO NOT CONSTITUTE OR PROVIDE INVESTMENT OR FINANCIAL ADVICE, AND MOODY’S CREDIT RATINGS, ASSESSMENTS, OTHER OPINIONS AND PUBLICATIONS ARE NOT AND DO NOT PROVIDE RECOMMENDATIONS TO PURCHASE, SELL, OR HOLD PARTICULAR SECURITIES. MOODY’S CREDIT RATINGS, ASSESSMENTS, OTHER OPINIONS AND PUBLICATIONS DO NOT COMMENT ON THE SUITABILITY OF AN INVESTMENT FOR ANY PARTICULAR INVESTOR. MOODY’S ISSUES ITS CREDIT RATINGS, ASSESSMENTS AND OTHER OPINIONS AND PUBLISHES ITS PUBLICATIONS WITH THE EXPECTATION AND UNDERSTANDING THAT EACH INVESTOR WILL, WITH DUE CARE, MAKE ITS OWN STUDY AND EVALUATION OF EACH SECURITY THAT IS UNDER CONSIDERATION FOR PURCHASE, HOLDING, OR SALE.
MOODY’S CREDIT RATINGS, ASSESSMENTS, OTHER OPINIONS, AND PUBLICATIONS ARE NOT INTENDED FOR USE BY RETAIL INVESTORS AND IT WOULD BE RECKLESS AND INAPPROPRIATE FOR RETAIL INVESTORS TO USE MOODY’S CREDIT RATINGS, ASSESSMENTS, OTHER OPINIONS OR PUBLICATIONS WHEN MAKING AN INVESTMENT DECISION. IF IN DOUBT YOU SHOULD CONTACT YOUR FINANCIAL OR OTHER PROFESSIONAL ADVISER.
ALL INFORMATION CONTAINED HEREIN IS PROTECTED BY LAW, INCLUDING BUT NOT LIMITED TO, COPYRIGHT LAW, AND NONE OF SUCH INFORMATION MAY BE COPIED OR OTHERWISE REPRODUCED, REPACKAGED, FURTHER TRANSMITTED, TRANSFERRED, DISSEMINATED, REDISTRIBUTED OR RESOLD, OR STORED FOR SUBSEQUENT USE FOR ANY SUCH PURPOSE, IN WHOLE OR IN PART, IN ANY FORM OR MANNER OR BY ANY MEANS WHATSOEVER, BY ANY PERSON WITHOUT MOODY’S PRIOR WRITTEN CONSENT.
MOODY’S CREDIT RATINGS, ASSESSMENTS, OTHER OPINIONS AND PUBLICATIONS ARE NOT INTENDED FOR USE BY ANY PERSON AS A BENCHMARK AS THAT TERM IS DEFINED FOR REGULATORY PURPOSES AND MUST NOT BE USED IN ANY WAY THAT COULD RESULT IN THEM BEING CONSIDERED A BENCHMARK.
All information contained herein is obtained by MOODY’S from sources believed by it to be accurate and reliable. Because of the possibility of human or mechanical error as well as other factors, however, all information contained herein is provided “AS IS” without warranty of any kind. MOODY'S adopts all necessary measures so that the information it uses in assigning a credit rating is of sufficient quality and from sources MOODY'S considers to be reliable including, when appropriate, independent third-party sources. However, MOODY’S is not an auditor and cannot in every instance independently verify or validate information received in the rating process or in preparing its Publications.
To the extent permitted by law, MOODY’S and its directors, officers, employees, agents, representatives, licensors and suppliers disclaim liability to any person or entity for any indirect, special, consequential, or incidental losses or damages whatsoever arising from or in connection with the information contained herein or the use of or inability to use any such information, even if MOODY’S or any of its directors, officers, employees, agents, representatives, licensors or suppliers is advised in advance of the possibility of such losses or damages, including but not limited to: (a) any loss of present or prospective profits or (b) any loss or damage arising where the relevant financial instrument is not the subject of a particular credit rating assigned by MOODY’S.
To the extent permitted by law, MOODY’S and its directors, officers, employees, agents, representatives, licensors and suppliers disclaim liability for any direct or compensatory losses or damages caused to any person or entity, including but not limited to by any negligence (but excluding fraud, willful misconduct or any other type of liability that, for the avoidance of doubt, by law cannot be excluded) on the part of, or any contingency within or beyond the control of, MOODY’S or any of its directors, officers, employees, agents, representatives, licensors or suppliers, arising from or in connection with the information contained herein or the use of or inability to use any such information.
NO WARRANTY, EXPRESS OR IMPLIED, AS TO THE ACCURACY, TIMELINESS, COMPLETENESS, MERCHANTABILITY OR FITNESS FOR ANY PARTICULAR PURPOSE OF ANY CREDIT RATING, ASSESSMENT, OTHER OPINION OR INFORMATION IS GIVEN OR MADE BY MOODY’S IN ANY FORM OR MANNER WHATSOEVER.
Moody’s Investors Service, Inc., a wholly-owned credit rating agency subsidiary of Moody’s Corporation (“MCO”), hereby discloses that most issuers of debt securities (including corporate and municipal bonds, debentures, notes and commercial paper) and preferred stock rated by Moody’s Investors Service, Inc. have, prior to assignment of any credit rating, agreed to pay to Moody’s Investors Service, Inc. for credit ratings opinions and services rendered by it fees ranging from $1,000 to approximately $2,700,000. MCO and Moody’s investors Service also maintain policies and procedures to address the independence of Moody’s Investors Service credit ratings and credit rating processes. Information regarding certain affiliations that may exist between directors of MCO and rated entities, and between entities who hold credit ratings from Moody’s Investors Service and have also publicly reported to the SEC an ownership interest in MCO of more than 5%, is posted annually at www.moodys.com under the heading “Investor Relations — Corporate Governance — Director and Shareholder Affiliation Policy.”
Additional terms for Australia only: Any publication into Australia of this document is pursuant to the Australian Financial Services License of MOODY’S affiliate, Moody’s Investors Service Pty Limited ABN 61 003 399 657AFSL 336969 and/or Moody’s Analytics Australia Pty Ltd ABN 94 105 136 972 AFSL 383569 (as applicable). This document is intended to be provided only to “wholesale clients” within the meaning of section 761G of the Corporations Act 2001. By continuing to access this document from within Australia, you represent to MOODY’S that you are, or are accessing the document as a representative of, a “wholesale client” and that neither you nor the entity you represent will directly or indirectly disseminate this document or its contents to “retail clients” within the meaning of section 761G of the Corporations Act 2001. MOODY’S credit rating is an opinion as to the creditworthiness of a debt obligation of the issuer, not on the equity securities of the issuer or any form of security that is available to retail investors.
Additional terms for Japan only: Moody's Japan K.K. (“MJKK”) is a wholly-owned credit rating agency subsidiary of Moody's Group Japan G.K., which is wholly-owned by Moody’s Overseas Holdings Inc., a wholly-owned subsidiary of MCO. Moody’s SF Japan K.K. (“MSFJ”) is a wholly-owned credit rating agency subsidiary of MJKK. MSFJ is not a Nationally Recognized Statistical Rating Organization (“NRSRO”). Therefore, credit ratings assigned by MSFJ are Non-NRSRO Credit Ratings. Non-NRSRO Credit Ratings are assigned by an entity that is not a NRSRO and, consequently, the rated obligation will not qualify for certain types of treatment under U.S. laws. MJKK and MSFJ are credit rating agencies registered with the Japan Financial Services Agency and their registration numbers are FSA Commissioner (Ratings) No. 2 and 3 respectively.
MJKK or MSFJ (as applicable) hereby disclose that most issuers of debt securities (including corporate and municipal bonds, debentures, notes and commercial paper) and preferred stock rated by MJKK or MSFJ (as applicable) have, prior to assignment of any credit rating, agreed to pay to MJKK or MSFJ (as applicable) for credit ratings opinions and services rendered by it fees ranging from JPY125,000 to approximately JPY250,000,000.
MJKK and MSFJ also maintain policies and procedures to address Japanese regulatory requirements.
This publication does not announce a credit rating action. For any credit ratings referenced in this publication, please see the ratings tab on the issuer/entity page on www.moodys.com for the most updated credit rating action information and rating history.

Questions?

Public Agenda Item #30Review, Discussion and Consideration of the Texa$aver Program Updates:
Texa$aver Product Review Committee Recommendations -(Action – BOT)
December 9, 2020
Diana Kongevick, Director of Group BenefitsGeorgina Bouton, CTCM, Assistant Director of Group Benefits
Thomas Nun, CFA®, GWI Portfolio Strategista

• Defined contribution plan established in 1985• Available to employees of state agencies• Procure plan administrator and investment advisory service
providers through competitive bid process• Feature automatic enrollment for new hires since 1/1/2008 • Offer traditional and Roth contributions
• Defined contribution plan established in 1974• Available to employees of eligible higher education and state
agencies• Procure plan administrator and investment advisory service
providers through competitive bid process• Offer traditional and Roth contributions
Texa$averSM 401(k) / 457 ProgramProgram Overview
Agenda item 30 - Joint Meeting December 9, 2020 138

Texa$aver programExecutive Summary 401(k) Plan, 3Q20 457 Plan, 3Q20
Assets under Management (AUM) $2,802 million Assets under Management (AUM) $1,029 million
Traditional balances $2,740 million Traditional balances $978 million
Roth balances $61 million Roth balances $51 million
No. of Participant Accounts 218,749 No. of Participant Accounts 26,263
Contributing 105,470 Contributing 16,037
Non-contributing 113,279 Non-contributing 10,226
Contributions, deposits, loan repayments $53 million Contributions, deposits, loan repayments $20 million
Change in value & Interest/Dividends $172 million Change in value & Interest/Dividends, annual $58 million
Plan withdrawals ($51) million Plan withdrawals ($16) million
Agenda item 30 - Joint Meeting December 9, 2020 139
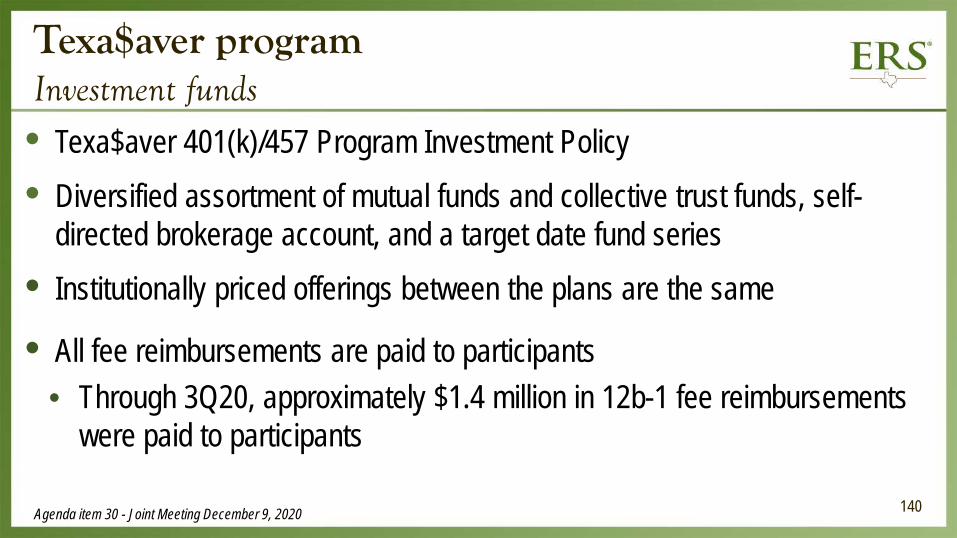
• Texa$aver 401(k)/457 Program Investment Policy• Diversified assortment of mutual funds and collective trust funds, self-
directed brokerage account, and a target date fund series • Institutionally priced offerings between the plans are the same
• All fee reimbursements are paid to participants• Through 3Q20, approximately $1.4 million in 12b-1 fee reimbursements
were paid to participants
Texa$aver program Investment funds
Agenda item 30 - Joint Meeting December 9, 2020 140

Texa$aver Investment OfferingsSeptember 30, 2020
BlackRock Mid Cap Equity Index
Wellington CIF II Mid Cap Opportunities S
Large Cap Blend
141

• Porter Wilson – ERS Executive Director• Catherine Terrell – ERS Deputy Executive Director• Diana Kongevick – ERS Director of Group Benefits• Tom Tull – ERS Chief Investment Officer• Leighton Shantz – ERS Director of Fixed Income• Carlos Chujoy – ERS Investment Risk Officer• Gene L. Needles, Jr. – Chairman and CEO Resolute Investment Managers
and Vice-chair of ERS’ Investment Advisory Committee (IAC)• Laurie L. Dotter, CPA – IAC member• Laura T. Starks, Ph.D. – Charles E. and Sarah M. Seay Regents Chair in Finance and
Co-Executive Director, Social Innovation Initiative, McCombs School of Business, University of Texas at Austin
Agenda item 30 - Joint Meeting December 9, 2020
Product Review Committee (PRC)Members
PRC
142

• PRC may appoint a sub-committee for a specific purpose (e.g., due diligence, fund evaluation, research, etc.), assisting the PRC in fulfilling its duties.
• PRC sub-committee members include:• Carlos Chujoy – PRC Member• Leighton Shantz – PRC Member• Dr. Laura T. Starks – PRC Member• Lauren Honza – ERS Portfolio Manager• Brannon Andrews – ERS Assistant General Counsel• Gene Needles – PRC Member to serve as an alternate, if necessary
Agenda item 30 - Joint Meeting December 9, 2020
PRC Sub-committee
143

Agenda item 30 - Joint Meeting December 9, 2020
PRC
• The PRC meets at least semi-annually to conduct investment reviews and undertake any other action required for the administration of the Program
• July 28, 2020 meeting PRC addressed • Concerns and next steps regarding Davis New York Venture A
(NYVTX) – program’s large cap blend fund • Opportunities to enhance the program’s fund line-up
PRC Semi-annual MeetingJuly 28, 2020
144

Fund Line-up Opportunities

GWI Portfolio Strategist led the PRC through a strategic review of the funds offered within the program
PRC determined the following Adequate coverage of major equity and fixed income categories Opportunity to explore a passive international equity Opportunity to explore a high yield bond
Sub-committee appointed to determine options for a passive international equity and high yield bond fund within the program
Texa$aver Investment OfferingsEnhancement opportunities
Agenda item 30 - Joint Meeting December 9, 2020 146

Passive International Fund Due diligence for a passive international offering is underway The prospective fund would be in addition to the existing international
fund, Fidelity Diversified International There would not be a fund transfer to this new (prospective) core fund
offering Target recommendation is 1st calendar quarter 2021
Texa$aver Investment OfferingsEnhancement opportunities update
Agenda item 30 - Joint Meeting December 9, 2020 147

High yield bond fund and large cap value fund Due diligence on both of these funds would be conducted following the
passive international fund search There would not be fund transfers to the new (prospective) core fund
offerings Target recommendation would be on or before 3rd calendar quarter 2021
Texa$aver Investment OfferingsEnhancement opportunities update
Agenda item 30 - Joint Meeting December 9, 2020 148

Davis New York Venture A

PRC has been closely monitoring Davis New York Venture A fund Performance issues
- Underperformed 90% of peers over 10 years - Underperformed its benchmark (S&P 500 Index) 2 of the last 3 calendar
quarters- Carries a 1-star rating from Morningstar
47 stock holdings comprise the entire portfolio- Non-US holdings - Heavy bias in financial services sector (>35%)
Davis New York Venture Due Diligence
Agenda item 30 - Joint Meeting December 9, 2020 150

Davis New York Venture A (NYVTX)Large Cap Blend
PERFORMANCE, 9/30/2020 1Y 3Y 5Y 7Y 10Y
Fund 2.15 4.56 9.26 8.57 9.86
Benchmark: S&P Index 15.15 12.28 14.15 12.68 13.74
Peer Group Median 11.92 10.44 12.43 11.07 12.52
PORTFOLIO COMPOSITION Assets
Investment type Mutual fund
Investment strategy Active
Fund expense ratio 0.89%
Fund reimbursement 0.55%
Net Texa$aver expense 0.34%
FUND OVERVIEWBenchmark
Overall Morningstar Rating™
Agenda item 30 - Joint Meeting December 9, 2020
Program Assets: $141 million No. of Texa$aver accounts: 32,128
Cash 0.92% US Stocks 75.70% US Bonds 0.00% Non-US Stocks 20.05% Preferred Stocks 0.00% Convertible Bonds 0.00% Other 3.33% Non-US Bonds 0.00% 3 Year Rolling Performance (Oct 15-Sep 20)
-4
3
8
13
18
1/2016 3/2016 1/2017 3/2017 1/2018 3/2018 1/2019 3/2019 1/2020 3/2020
5th to 25th Percentile25th to MedianMedian to 75th Percentile75th to 95th Percentile
Davis NY Venture AS&P 500 Index

April 23, 2020 meeting with GWI Portfolio Strategist July 20, 2020 meeting with members of PRC, Texa$averSM and GWI
Portfolio Strategist Fund’s overall poor performance Lack of appropriate risk controls Large sector deviation to financials Exposure to international private equities
Davis New York VentureDue Diligence
Agenda item 30 - Joint Meeting December 9, 2020 152
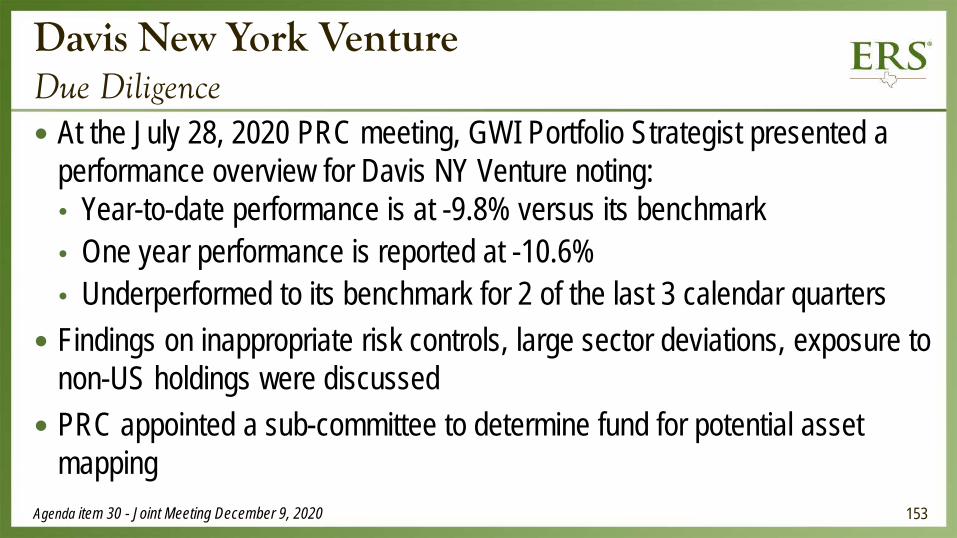
At the July 28, 2020 PRC meeting, GWI Portfolio Strategist presented a performance overview for Davis NY Venture noting: Year-to-date performance is at -9.8% versus its benchmark One year performance is reported at -10.6% Underperformed to its benchmark for 2 of the last 3 calendar quarters
Findings on inappropriate risk controls, large sector deviations, exposure to non-US holdings were discussed
PRC appointed a sub-committee to determine fund for potential asset mapping
Davis New York VentureDue Diligence
Agenda item 30 - Joint Meeting December 9, 2020 153

Recommend mapping assets to the Vanguard Institutional Index (VIIIX), a large cap blend fund (same category as Davis NY Venture) Employs an indexing investment approach designed to track the
performance of the S&P 500 Index Replicates the target index, holding each stock in approximately the same
proportion as its weighting in the index Diversifies risk and accurately represents the composition of the US large
cap market Holds a 5-star Morningstar rating, as well as a Gold rating by Morningstar
Fund MappingVanguard Institutional Index (VIIIX)
Agenda item 30 - Joint Meeting December 9, 2020 154

TPA and ERS staff will coordinate the operational process for fund transitions Timing considerations Funds transfers Communication strategy for participants
Next Steps
Agenda item 30 - Joint Meeting December 9, 2020 155
The Texa$aver Product Review Committee and staff recommend Board of Trustees of the Employees Retirement System remove the Davis New York Venture A (NYVTX) fund from the Texa$aver program with the program assets being moved to the Vanguard Institutional Index (VIIIX) fund.
Texa$aver program Staff recommendation
Agenda item 30 - Joint Meeting December 9, 2020 156

Questions?Action Item –BOT

Public Agenda Item #31
*Educational Presentation – Environment, Social and Governance
December 9, 2020Tom Tull, CFA, Chief Investment Officer
Benjamin Schuman, CFA, Global Equity Portfolio Manager

Introduction to ESG
Tom Tull, CFA, Chief Investment Officer
Benjamin Schuman, CFA, Global Equity Portfolio Manager

What is ESG? Why is ESG potentially important to ERS? Steps taken by ERS and plan moving forward
Agenda item 31 – Joint Meeting December 9, 2020
Agenda
160

What is ESG? Environmental, Social, Governance
Environmental Social Governance
Carbon/Greenhouse Gas Emissions Diversity Transparency
Ecosystem Change Consumer Protection Reporting and Disclosure
Fossil Fuel Dependence Fair Trade Executive Compensation
Climate Change Animal Testing Shareholder Rights
Water Issues Human Rights Board Accountability and Makeup
Clean Tech Health Care Director Independence
Toxic Chemical Usage Working Conditions Accounting Practices and Policies
Renewable Energy Child Labor Voting Practices
Agenda item 31 – Joint Meeting December 9, 2020 161
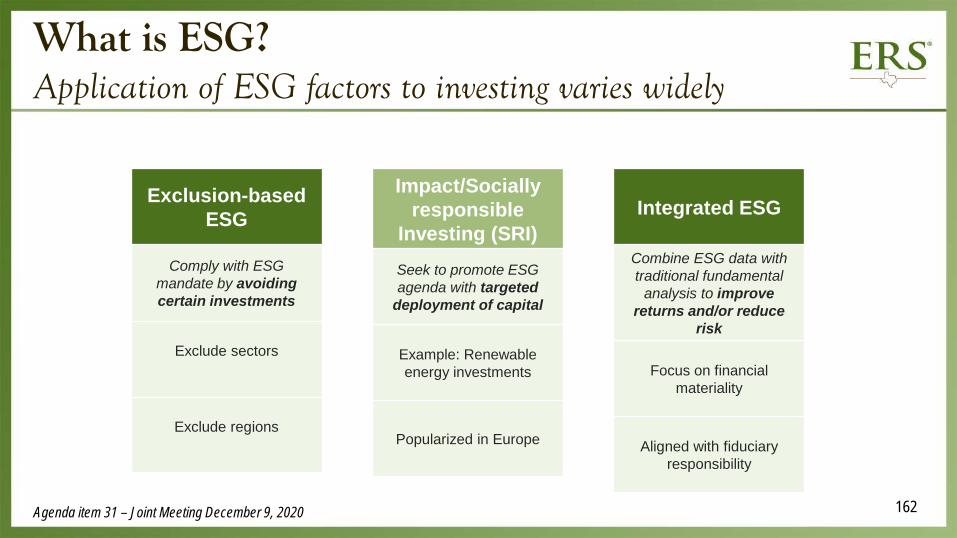
What is ESG? Application of ESG factors to investing varies widely
Exclusion-based ESG
Comply with ESG mandate by avoiding certain investments
Exclude sectors
Exclude regions
Impact/Sociallyresponsible
Investing (SRI)Seek to promote ESG agenda with targeted
deployment of capital
Example: Renewable energy investments
Popularized in Europe
Integrated ESG
Combine ESG data with traditional fundamental
analysis to improve returns and/or reduce
risk
Focus on financial materiality
Aligned with fiduciary responsibility
Agenda item 31 – Joint Meeting December 9, 2020 162

What is ESG? Integration within asset classes
Source: NEPC
Strategy Type Level of ESG Integration Notes
Public Equity High Highest level of adoption; European market generally ahead of US
Fixed Income ModerateESG ratings more applicable for corporate debt; sovereign debt
and structured credit generally less compatible; growing adoption
Private Equity Moderate
Funds are often smaller in size, have shorter track records and are newer entities; ESG issues can present an opportunity to
unlock value
Real Estate ModerateValue-add and opportunistic strategies are often more focused on
ESG given their emphasis on property repositioning
Real Assets ModerateSustainable real assets present a wide range of options from
renewables to agriculture
Hedge Funds LowLimited but growing adoption of ESG amongst hedge funds; will
be strategy dependent
Agenda item 31 – Joint Meeting December 9, 2020 163

Why is ESG Potentially Important to ERS? Fund flows demonstrate mainstream adoption in U.S.
ESG flows up 4x in 2019, on track to double in 2020*
40% of U.S. asset managers have adopted some form of ESG integration
Policy, demographics, corporate behavior, technology, social trends & data availability are driving adoption
Many ERS external managers integrate ESG already
*Based on universe of 303 funds with ESG central to strategies and 564 funds that consider ESG factors
Agenda item 31 – Joint Meeting December 9, 2020 164

Academic research suggests firms with higher ESG scores: Attract more or higher paying customers Have increased productivity due to higher employee morale Attract lower-cost capital Have managers who avoid short-term decision making Decreased firm risk
Investment performance inconclusive ESG funds have outperformed recently Longer-term studies show neutral to slight-positive impact Nascent nature of ESG data makes integrated approach hard to study
Why is ESG Potentially Important to ERS? Impact on investment performance
Agenda item 31 – Joint Meeting December 9, 2020 165

Department of Labor (DOL) recently implemented restrictive guidelines* Requires ERISA plans to select investments solely on financial considerations Could prevent ESG-centric strategies from inclusion in plan assets No jurisdiction over state plan, but could guide oversight decisions Reinforces need for fiduciary alignment with ESG strategy
*Although the DOL has no jurisdiction over governmental plans because they are exempt from ERISA, ERS complies with many of those requirements in the course of
meeting its fiduciary duties to administer the Trust and manage the assets of the Trust.
Why is ESG Potentially Important to ERS? Pension considerations
Agenda item 31 – Joint Meeting December 9, 2020 166
Adoption within broad investment landscape appears at a tipping point based on adoption rates, asset flows, & corporate behavior
Reporting standards and best practices evolving quickly External managers already integrating ESG
Why is ESG Potentially Important to ERS? Timing considerations
Agenda item 31 – Joint Meeting December 9, 2020 167

Current approach Administering scrutinized investment decisions in compliance with Texas state law such as prohibitions on investments in
Sudan, Iran, companies boycotting Israel, and terrorist organizations, all consistent with our fiduciary responsibility ERS does not change its due diligence or prudent processes for the sole purpose of ESG investments Active voting of proxies via Institutional Shareholders Services our proxy advisor with a strong emphasis on corporate
governance Plan moving forward Continue to actively evolve our research and monitoring processes with annual updates to the Board and IAC Define ESG @ ERS on our terms that can be beneficial to competitive risk adjusted rates of return Build key relationships and knowledge, including possible participation in working groups and standards bodies Engage with external managers on ESG integration process for educational purposes Evaluate use of growing pool of ESG information in conjunction with ERS investment processes to help maximize long-term
risk adjusted returns
Steps Taken by ERS and Plan Moving Forward
Agenda item 31 – Joint Meeting December 9, 2020 168

Questions?

Public Agenda Item #32
*Review of Investment Performance for 3rd Quarter of 2020, Risk Update, and Liquidity
December 9, 2020
Tom Tull, CFA, Chief Investment Officer
Carlos Chujoy, CFA, Director of Risk Management and Applied Research
Sam Austin and Michael Malchenko, NEPC

BOSTON | ATLANTA | CHARLOTTE | CHICAGO | DETROIT | LAS VEGAS | PORTLAND | SAN FRANCISCO
EMPLOYEES RETIREMENT SYSTEM OF TEXAS
QUARTERLY PERFORMANCE REPORT
December 9, 2020
Sam Austin, PartnerTim Bruce, Partner

TABLE OF CONTENTS
Tab
Executive Summary 1
Total Fund Performance Summary 2
Appendix and Disclosures 3
172

NEPC, LLC
EXECUTIVE SUMMARY

ERS TRUST DASHBOARDProfile
Market Value at 9/30/2020:$28.62 BillionActuarial Accrued Liability 8/31/19:$39.8 BillionActuarial Assumed Rate of Return:7.0%Retirees and Beneficiaries 8/31/2019:115,155Retirement Payments Year Ended 8/31/2019:$2.62 BillionERS Trust Funding Ratio 8/31/201970.5%
3rd Quarter 2020
CYTD FY 2020Fund Performance 0.8% 6.8%Policy Benchmark 1.4% 8.2%Excess Return -0.6% -1.4%
3 Yr Tracking Error 2.20%
5 Yr Sharpe Ratio 0.945 Yr Sortino Ratio 1.00
Largest Contributors (Quarter)
Private Equity contributed +1.6% versus the policy benchmarkLargest Detractors (Quarter)Cash contributed -0.1% versus the policy benchmark
48%
52%
Management
Internal
External 82%
18%
Allocation
RiskReducing
ReturnSeeking
65%
35%
Liquidity
Illiquid
Liquid
174

TOTAL FUND PERFORMANCE DETAIL (NET OF FEES)
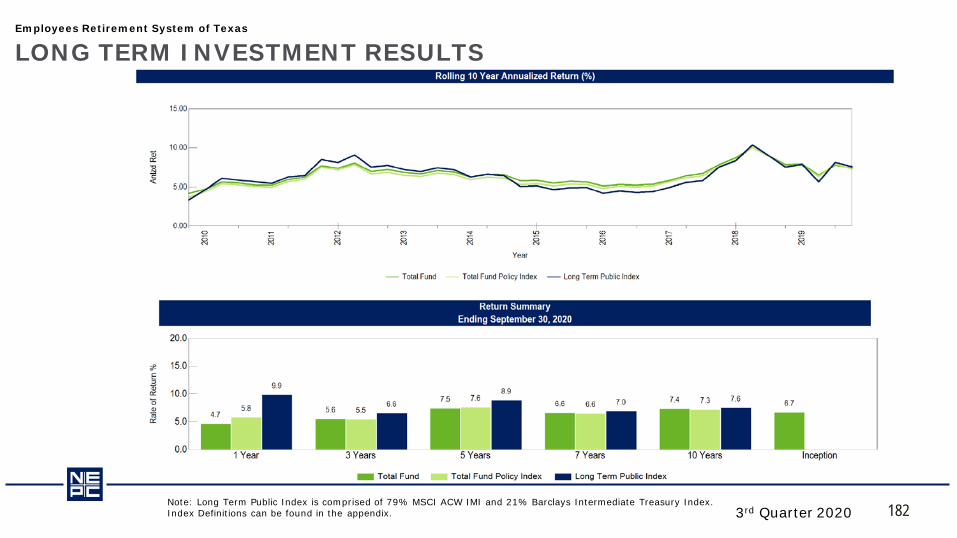
• One-year ended September 30, 2020, the Fund underperformed the policy benchmark by 1.1%.
• The Fund's assets decreased to $28.62 billion from $28.64 billion in the last calendar year which includes an investment gain of $1.283 billion for the year.
Note: Long Term Public Index is comprised of 79% MSCI ACW IMI and 21% Barclays Intermediate Treasury Index. Index Definitions can be found in the appendix.
3rd Quarter 2020
Market Value($) Fiscal YTD 3 Mo(%) YTD(%) 1 Yr(%) 3 Yrs(%) 5 Yrs(%) 10 Yrs(%)
Total Fund 28,618,113,390 -1.2 5.5 0.8 4.7 5.6 7.5 7.4
Total Fund Policy Index -1.3 3.1 1.4 5.8 5.5 7.6 7.3
Long Term Public Index -2.4 6.5 2.8 9.9 6.6 8.9 7.6

TOTAL FUND PERFORMANCE DETAIL (NET OF FEES)
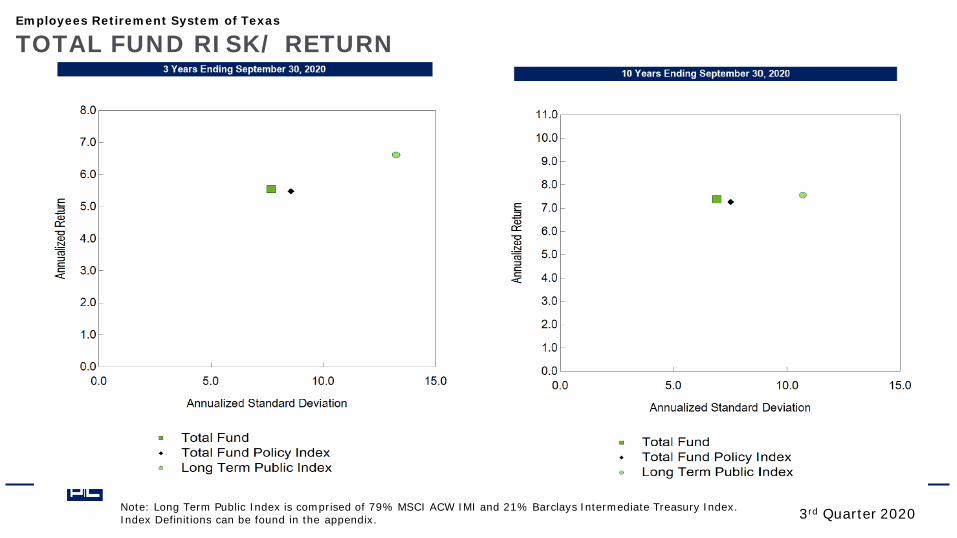
• Three–year period ended September 30, 2020, the return of 5.55% outperformed the benchmark by 0.07%. On a risk-adjusted basis, the Sharpe Ratio and Sortino Ratio outperformed the benchmark.
• Five-year period ended September 30, 2020, the Fund returned 7.47% and underperformed the policy benchmark by 0.16%. On a risk-adjusted basis, the Fund’s Sharpe Ratio and Sortino Ratios outperformed the benchmark and suggests that active management benefitted the Plan.
Note: Long Term Public Index is comprised of 79% MSCI ACW IMI and 21% Barclays Intermediate Treasury Index. Index Definitions can be found in the appendix.
3rd Quarter 2020
3 Years Ending September 30, 2020Anlzd Return Anlzd Standard Deviation Sharpe Ratio Sortino Ratio RF
Total Fund 5.55% 7.69% 0.52 0.56
Total Fund Policy Index 5.48% 8.57% 0.46 0.54
5 Years Ending September 30, 2020Anlzd Return Anlzd Standard Deviation Sharpe Ratio Sortino Ratio RF
Total Fund 7.47% 6.72% 0.94 1.00
Total Fund Policy Index 7.63% 7.69% 0.84 0.99

Employees Retirement System of Texas
TOTAL FUND ASSET GROWTH SUMMARY
3rd Quarter 2020
Summary of Cash FlowsFiscal Year-To-Date Last Three Months Year-To-Date One Year Three Years Five Years
Beginning Market Value $29,076,050,354 $27,435,810,375 $29,406,588,242 $28,644,607,856 $27,797,322,053 $24,533,633,307Contributions $1,036,537,402 $3,432,416,123 $9,263,436,354 $13,934,817,042 $38,019,878,634 $52,834,873,185Withdrawals -$1,148,161,496 -$3,747,279,725 -$10,224,000,047 -$15,244,508,725 -$41,789,373,374 -$58,489,355,177Net Cash Flow -$111,624,093 -$314,863,602 -$960,563,693 -$1,309,691,683 -$3,757,375,192 -$5,642,362,444Net Investment Change -$346,312,871 $1,497,166,617 $172,088,841 $1,283,197,217 $4,578,166,529 $9,726,842,528Ending Market Value $28,618,113,390 $28,618,113,390 $28,618,113,390 $28,618,113,390 $28,618,113,390 $28,618,113,390
177
Employees Retirement System of Texas
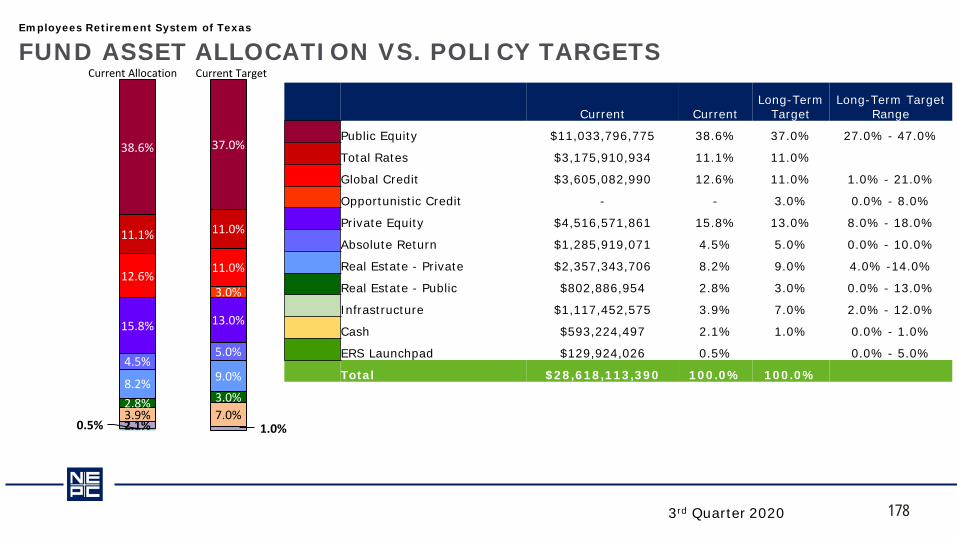
FUND ASSET ALLOCATION VS. POLICY TARGETS
3rd Quarter 2020
Current Allocation Current Target
Current CurrentLong-Term
TargetLong-Term Target
Range
Public Equity $11,033,796,775 38.6% 37.0% 27.0% - 47.0%
Total Rates $3,175,910,934 11.1% 11.0%
Global Credit $3,605,082,990 12.6% 11.0% 1.0% - 21.0%
Opportunistic Credit - - 3.0% 0.0% - 8.0%
Private Equity $4,516,571,861 15.8% 13.0% 8.0% - 18.0%
Absolute Return $1,285,919,071 4.5% 5.0% 0.0% - 10.0%
Real Estate - Private $2,357,343,706 8.2% 9.0% 4.0% -14.0%
Real Estate - Public $802,886,954 2.8% 3.0% 0.0% - 13.0%
Infrastructure $1,117,452,575 3.9% 7.0% 2.0% - 12.0%
Cash $593,224,497 2.1% 1.0% 0.0% - 1.0%
ERS Launchpad $129,924,026 0.5% 0.0% - 5.0%
Total $28,618,113,390 100.0% 100.0%
38.6% 37.0%
11.1% 11.0%
12.6%11.0%
3.0%
15.8% 13.0%
4.5%5.0%
8.2% 9.0%
2.8% 3.0%3.9% 7.0%2.1% 1.0%0.5%
178
Employees Retirement System of Texas
TOTAL FUND RISK/ RETURN
Note: Long Term Public Index is comprised of 79% MSCI ACW IMI and 21% Barclays Intermediate Treasury Index. Index Definitions can be found in the appendix. 3rd Quarter 2020

Employees Retirement System of Texas
TOTAL FUND ATTRIBUTION ANALYSIS
*Total Fund Attribution Analysis uses policy weights.
180

Employees Retirement System of Texas
TOTAL FUND ATTRIBUTION ANALYSIS
* Total Fund Attribution Analysis uses policy weights.
181
Employees Retirement System of Texas
LONG TERM INVESTMENT RESULTS
Note: Long Term Public Index is comprised of 79% MSCI ACW IMI and 21% Barclays Intermediate Treasury Index. Index Definitions can be found in the appendix. 3rd Quarter 2020 182

Employees Retirement System of Texas
ROLLING INFORMATION RATIO AND TRACKING ERROR
3rd Quarter 2020 183

• Over the past 10 years, Total Fund returns outperformed the policy benchmark by 0.1% and outperformed the Plan’s actuarial rate of return.
• In the one-year ended September 30,2020 the Fund underperformed the policy benchmark by 1.1%. – Global Credit detracted -0.6% and Public Equity detracted -0.6% from Fund returns vs. the policy
benchmark – Rates contributed positively to returns (+0.4%) vs. the policy benchmark
• In the past one-year, portfolio positioning at the asset class level detracted -0.2% from Total Fund returns vs. policy benchmark. – An over-weight position to Private Equity contributed negatively (-0.2%) to total fund returns vs. the policy
benchmark. – An overweight position to Global Public Equity (-0.1%) and Cash contributed (-0.1%) negatively to total
fund returns vs. the policy benchmark.– An underweight position to Absolute Return contributed negatively (-0.1%) to total fund returns vs. the
policy benchmark.– An over-weight position to Rates contributed positively (+0.4%) to Fund returns versus the policy
benchmark.
SUMMARY PERFORMANCE COMMENTARY
3rd Quarter 2020 184

Risk Management & Applied ResearchRisk Update
Carlos Chujoy, CFA, Director of Risk Management & Applied Research

Risk Update3Q2020 Update
Agenda item 32 – Joint Meeting December 9, 2020
• Headwinds and Tailwinds• Performance Review of Selected Markets• Market Stress• Concentration and Tail Risk• ERS Market Exposure and Sensitivity Analysis• ERS Liquidity • Risk Concerns• Conclusions
186

Risk Update3Q2020 Update
Agenda item 32 – Joint Meeting December 9, 2020
Headwinds• Resurgence of COVID-19• Market Concentration Risk• Market Valuation• Delayed Fiscal Stimulus• Uncertainty regarding upcoming US
election• Brexit• Economy still in state of flux
Tailwinds• Major progress in vaccine research• Easy monetary policy (low interest
rates)• Economic indicators improving• Strong housing market• Unemployment rate on right path• Weakening of the dollar• ERS portfolio resiliency
187

Market PerformanceYTD and 3Q20 Returns
Agenda Item 32 – Joint Meeting December 9, 2020
Technology and Discretionary markets benefitted the most from current economic policy Risk-on environment in 3Q20 led by equities, gold and oil.
188

Market StressGlobal Stress Financial Indicator and Cross Asset Class Implied Risk
Agenda item 32 – Joint Meeting December 9, 2020
• GSFI levels points to continued concerns • 3Q20 saw fund outflows in risk-on assets such as equities and pricing of increasing levels of risk in Technology
189

Concentration Risk and Tail RiskWhat drove the markets during the 3rd Quarter
Agenda item 32 – Joint Meeting December 9, 2020
Drivers• FED’s September FOMC meeting• Market Valuation and Concentration Risk in Technology stocks. • Resurgence of second wave of COVID-19 in Europe• US Presidential Elections• Brexit negotiations• Delayed Fiscal Policy Response• Escalated tension between US and China• No recovery in sight for industries involving travelling and gathering• Low mortgage rates leading to a strong housing market
190

Concentration Risk and Tail RiskWhat drove the markets during the 3rd Quarter
Agenda item 32 – Joint Meeting December 9, 2020
• Order flow dominated by retail investors• Single stock option notional ballooned almost 7-fold from prior year
191

Concentration Risk and Tail RiskWhat drove the markets during the 3rd Quarter
Agenda item 32 – Joint Meeting December 9, 2020
• Outperformance of Growth relative to the market accelerated in 2020 during the pandemic • Growth has outperformed Value for 10+ years
192

Concentration Risk and Tail RiskWhat drove the markets during the 3rd Quarter
Agenda item 32 – Joint Meeting December 9, 2020
Source: ERS, Bloomberg
• Market outperformance dominated by the largest companies by market cap, irrespective of size, style or geography • Outperformance by mega cap companies: a reflection of “new economy” vs “old economy” given the pandemic
193

Concentration Risk and Tail RiskWhat drove the markets during the 3rd Quarter
Agenda item 32 – Joint Meeting December 9, 2020
Europe second waveCOVID-19
• Acceleration of COVID-19 cases around the world threatens economic recovery • Near-dated contracts pricing of US election risk, lower pricing on longer tenors suggest market expect low risk of a contested
election 194

Agenda item 32 – Joint Meeting December 9, 2020
ERS Market ExposureSector Allocation (through 09/30)
Public Equities ExposureTrust Level Exposure
Source: ERS Only 11% of Trust Healthy 20% of Equities but diversified
195

ERS Plan Exposure and SensitivityContribution to Risk Analysis
Agenda Item 32 – Joint Meeting, December 9, 2020
• ERS portfolio exhibits same level of exposure to Growth and Momentum factors. Concentration risk same as policy benchmark • Volatility explains the largest contribution to total risk. While Growth and Volatility contribute the most to active risk
196

ERS Plan ExposureLiquidity Risk
Agenda Item 32 – Joint Meeting, December 9, 2020
• Projected Total Unfunded Commitments as end of 2020 is at $5.8b
• Net Operating Cash Outflow* of $1.4B • Total liquidity level (Rates portfolio and Cash) as
of October is at $4.25b• Other liquid assets** stand at $ 14.7b• Therefore, total current liquidity level is sufficient
to meet the ongoing net pension payment plus majority of the unfunded commitments of illiquid investments.
Source: ERS. Projection assumes ERS Trust grows at an annual return of 7%.
$- $2,000 $4,000 $6,000 $8,000
$10,000 $12,000 $14,000 $16,000 $18,000 $20,000
Hedg
e Fun
dIn
frast
ruct
ure
Real
Esta
tePr
ivate
Equ
ityPr
ivate
Deb
tTo
tal
Hedg
e Fun
dIn
frast
ruct
ure
Real
Esta
tePr
ivate
Equ
ityPr
ivate
Deb
tTo
tal
Hedg
e Fun
dIn
frast
ruct
ure
Real
Esta
tePr
ivate
Equ
ityPr
ivate
Deb
tTo
tal
Hedg
e Fun
dIn
frast
ruct
ure
Real
Esta
tePr
ivate
Equ
ityPr
ivate
Deb
tTo
tal
Hedg
e Fun
dIn
frast
ruct
ure
Real
Esta
tePr
ivate
Equ
ityPr
ivate
Deb
tTo
tal
2020 2021 2022 2023 2024
$MM
ERS ILLIQUID INVESTMENT PROJECTIONS
Unfunded Commitments NAV Liquidity Level
Note * Net Operating Cash equals net monthly contributions of $112mm minus monthly Pay Outs of $228mm or approx. -$1.4b per year
* *Assets include Global Public Equities, Global Credit and Public Real Estate
197

Agenda item 32 – Joint Meeting December 9, 2020
ERS Risk SurveyCollective views
1. Coronavirus – 2nd Wave
2. US Elections
3. Delayed Fiscal Stimulus
4. Credit Event
5. UK-EU Brexit
1. Bull market
2. Early cycle
3. Economy, Company Profits and Margins to Improve
4. High Quality, High Momentum , Low Vol
Downside Risk Upside Risk
Source: ERS Risk Survey
198

Agenda Item 32 – Joint Meeting, December 9, 2020
Concentration and Left Tail Risk in the markets dominated end of 3Q performance In particular, Large Cap Stocks with a Growth orientation Long derivative position in Technology stocks, in June-Aug ‘20, 5x the average volume traded in 2019
Resurgence of COVID-19, US-China trade conflict, the US presidential elections and delayed Fiscal stimulus at the forefront of investor’s minds. By all counts, implied levels of risk higher than average. Risk-on assets experienced market correction towards the end of the quarter
From a plan level risk standpoint, higher volatility and higher growth momentum contribute the most to active portfolio risk. Rotation risk stands at its highest stemming from concentration risk in style, sector positioning and size exposure
ERS liquidity profile suggests the ERS portfolio is properly positioned to absorb cash needs and market volatility
ERS collective risk concerns revolve around 3 main issues: COVID-19, uncertainty about the US Elections and delayed Fiscal stimulus
ERS ConclusionsKey Takeaways
199

Questions?

Public Agenda Item #33
*Global Public Equity Market Update and Program Overview
December 9, 2020
John Streun, CFA, Director of Global Public EquitiesMichael Clements, CMT, Chief Trader
Michael McCrary, External Management Investment Analyst

Investment Objective and Recent Performance Global Public Equity Team Update Portfolio Structure and Positioning Internal Program Update External Advisor Program Update Trading Update COVID-19 Impact Global Public Equity Initiatives for 2021
Global Public Equity ProgramAgenda
Agenda item 33 – Joint Meeting December 9, 2020 202

Investment Objective – Outperform the Global Public Equity benchmark over rolling five-year periods, while maintaining compliance with the active risk budget.
Investment Strategy – Combine lower risk internal strategies with higher risk external strategies to produce a stable excess return with a target tracking error of 150 basis points and an excess return ratio of 25 basis points or better.
Global Public Equity ProgramInvestment Objective & Strategy
Agenda item 33 – Joint Meeting December 9, 2020 203

Positive return of 8.50% Relative under performance of -141 basis points 4 out of 4 fundamental internal portfolios outperformed their benchmarks 6 out of 11 external portfolios outperformed their benchmarks Stock selection from both internal and external portfolios was a positive contributor Significant drawdown from an external manager that focused on equity options (Allianz Global
Advisors) hurt performance An under weight to U.S. large cap stocks detracted from performance Internal special situations portfolios (Capitol Hill and Spinoff) detracted from performance The small allocation to cash in a rising market environment also detracted from performance
Asset Class Performance HighlightsSeptember 30, 2019 to September 30, 2020
Agenda item 33 – Joint Meeting December 9, 2020 204

(years of industry experience)
Public Equity TeamLeadership: John Streun, Andrew Hodson, Tim Reynolds, Michael Clements, Lauren Honza
Domestic Portfolio Managers:Large Cap
Kelley Hewell, MBA, CFA (28)Small and Mid Cap
Andrew Hodson, MBA, CFA (19)
International Portfolio Managers:International DevelopedKeith Lyons, MBA (17)
Nancy McCarthy, MBA, CFA (13)
Emerging MarketsTim Reynolds, MS, CFA, CAIA (29)
Canada & International ValueCarlos Chujoy, MBA, CFA (28)
John McCaffrey, MBA (6)
QuantitativeCarlos Chujoy, MBA, CFA (28)
John McCaffrey, MBA (6)
TradingMichael Clements, CMT (22)
Rob Newhall, CMT (20)Kyle Fenton, MBA (13)
External Advisor TeamJohn Streun, MS, CFA, CPA (28)Lauren Honza, MBA, CFA (27)
Michael McCrary, MBA (20)Mark Long, MBA, CFA (24)
Kelley Hewell, MBA, CFA (28)Agenda item 33 – Joint Meeting December 9, 2020
Global Public Equity ProgramPublic Equity Team
205

Global Public Equity ProgramPublic Equity Team
Public Equity StructureInternational Domestic
Emerging MarketsTim Reynolds, MS, CFA, CAIA (29)
John Taylor, MBA, CFA (14)June Kim (14)
Ian Smith, MBA, CFA (12)Jim Gassman, MBA (20)
Large CapKelley Hewell, MBA, CFA (28)
Bob Wood, MBA, CFA (31)Micheal Yuan, CFA (23)Paul Knight, CFA (19)
Derek Sadowsky, CFA (22)
International DevelopedKeith Lyons, MBA (17)
Nancy McCarthy, MBA, CFA (13)Teofilo Bacungan, MBA, CFA (20)
T.J. Qatato, MPA, CFA (25)Scott Schrier, CFA (10)
Small and Mid CapAndrew Hodson, MBA, CFA (19)
Ben Schuman, CFA (15)Jake Tisinger, CFA (12)
Mark Long, MBA, CFA (24)Aris Oglesby, MBA (2)
Agenda item 33 – Joint Meeting December 9, 2020 206

Global Public Equity ProgramGlobal Portfolio Structure – Dollar Allocation (9/30/2020)
207

Global Public Equity ProgramTracking Error as of 10/1/2020
208

Global Public Equity ProgramPortfolio Structure and Positioning – Sector Exposures
209
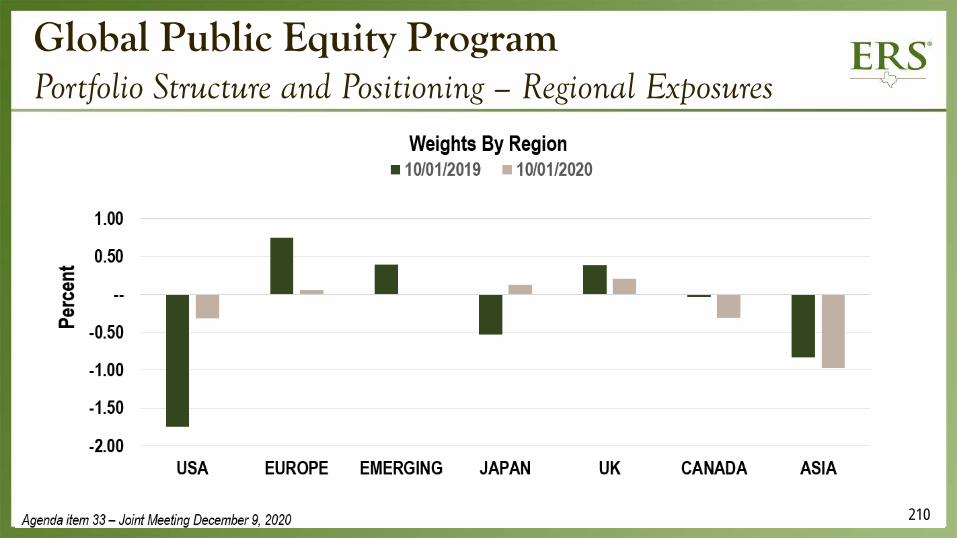
Global Public Equity ProgramPortfolio Structure and Positioning – Regional Exposures
210

Global Public Equity ProgramFactor Exposures (Portfolio Characteristics)
211

Global Public Equity ProgramActive Risk/Tracking Error
212

Global Public Equity ProgramPortfolio Position Values
213

Global Public Equity ProgramPortfolio Structure Changes – Internal Actively Managed Portfolios
Dom
estic
Por
tfolio
s Large Cap Active Core
Mid Cap Active Core
Small Cap Active Core
Inte
rnat
iona
lPo
rtfol
ios
Europe International Equities
Asia International Equities
Emerging Markets Core
Agenda item 33 – Joint Meeting December 9, 2020
Dom
estic
Po
rtfol
ios
Large Cap Active Core
Small/Mid (SMID) Cap
Active Core
Inte
rnat
iona
l Por
tfolio
s
Europe/Asia (EAFE) International Equities
Emerging Markets Core
214

Global Public Equity ProgramInternal Emerging Market Process
Quantitative• Search for
companies with improving fundamentals, strong growth, reasonable valuation
• Assess and manage risk
• Analyze factor, sector and regional exposures
Fundamental • Focus on bottom up
research• Provide context,
perspective, and analysis on company metrics
• Conduct research by region
• Perform on the ground research when possible
Agenda item 33 – Joint Meeting December 9, 2020 215
External Advisor Program
Michael McCrary, MBA, Investment Analyst

External Advisor Program UpdateFunded External Advisors
217

External Advisor ProgramFunded External Advisors
Agenda item 33 – Joint Meeting December 9, 2020
Firm Strategy Selection Date Portfolio Inception
Acadian Asset Management Emerging Markets 12/2/2011 11/1/2017
Axiom International Investors International Small Cap Equity 12/20/2018 3/1/2019Barrow, Hanley, Mewhinney & Strauss Large Cap Value 12/2/2010 4/1/2011
BlackRock International 12/2/2011 3/1/2015
Brandywine GIM Large Cap Value 12/2/2010 4/1/2017
EAM Investors International Small Cap 12/20/2018 3/1/2019
Global Alpha Capital Management International Small Cap 12/20/2018 3/1/2019
Kayne Anderson Rudnick International Small Cap 12/20/2018 3/1/2019
Lazard Asset Management International 8/23/2011 12/1/2011
Quantitative Management Associates Emerging Markets Small Cap 12/20/2018 3/1/2019
Templeton International 11/19/2002 4/1/2003
Legato Capital Management International Small Cap 5/25/2010 2/1/2017
Legato Capital Management Emerging Markets 9/25/2019 11/1/2019
218

External Advisor ProgramSelect Pool
Agenda item 33 – Joint Meeting December 9, 2020
Firm Strategy Selection Date Portfolio Inception
Algert Global International Small Cap 12/20/2018 TBD
Ativo Capital Management International Small Cap 12/20/2018 TBD
Copper Rock Capital Partners Emerging Markets Small Cap 12/20/2018 TBD
Fisher Investments International 1/24/2006 TBD
Strategic Global Advisors International Small Cap Equity 12/20/2018 TBD
TimesSquare Capital Management International Small Cap 12/20/2018 TBD
219

Published January 24, 2020 Benchmarks: MSCI ACWI ex-US and MSCI EAFE Process Phase I: Minimum Requirements and Short Form Review Phase II: Investment DDQ Review and Operational DDQ Review Phase III: Onsite Meetings and Reference Checks Phase IV: Committee Approval Phase V: Contract/Fund
External Advisor Program UpdateRFP Update: International Advisory Services
Agenda item 33 – Joint Meeting December 9, 2020 220

Expected to be Published March 2021 Benchmarks: MSCI Large Cap, Large Cap Value, Large Cap Growth Process Phase I: Minimum Requirements and Short Form Review Phase II: Investment DDQ Review and Operational DDQ Review Phase III: Onsite Meetings and Reference Checks Phase IV: Committee Approval Phase V: Contract/Fund
External Advisor Program UpdateNew RFP: Domestic Large Cap
Agenda item 33 – Joint Meeting December 9, 2020 221

Trading Update
Michael Clements, CMT, Chief Trader

Global Public Equity ProgramTotal Commissions
223
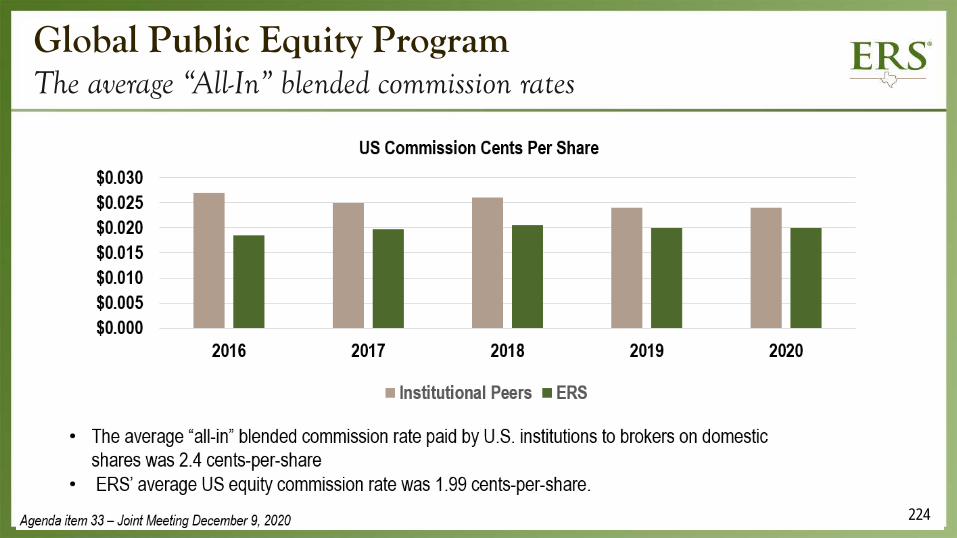
Global Public Equity ProgramThe average “All-In” blended commission rates
224

Global Public Equity ProgramInternational Commission Rates
225

Global Public Equity ProgramCommission by Portfolio
226

ERS Global Public EquityCovid-19 Impact
John Streun, MS, CFA, CPA, Director of Global Public Equity

Agenda item 33 – Joint Meeting December 9, 2020
Sharp increase in Market Volatility
Global Public Equity ProgramCOVID -19 Impact
228

Agenda item 33 – Joint Meeting December 9, 2020
Global Public Equity ProgramCOVID 19 Impact
229

Agenda item 33 – Joint Meeting December 9, 2020
Global Public Equity ProgramCOVID-19 Impact
230

Goals and Objectives for 2021
John Streun, MS, CFA, CPA, Director of Global Public Equity

Global Public Equity ProgramInitiatives for 2021
Select Pool buildout Increase active share of internal portfolios Enhance portfolio construction process
Agenda item 33 – Joint Meeting December 9, 2020 232

Questions?

Public Agenda Item #34
*Emerging Manager Market Update and Program Overview
December 9, 2020Lauren Honza, CFA, Emerging Manager Portfolio Manager

Background Overview Team Approach Current Allocation Performance
Calendar Year 2020 Highlights Calendar Year 2021 Initiatives
Emerging Manager ProgramAgenda
Agenda item 34 – Joint Meeting December 9, 2020 235

Texas Government Code § 815.301 (g), (h) and (i) requires the Employees Retirement System of Texas to make a good faith effort to acquire financial services from emerging managers. Emerging managers are defined in the statute as private professional investment managers with less than $2 billion in assets who provide pension fund management, consulting, investment advising, brokerage services, hedge fund management, private equity management, and real estate investment.
Agenda item 34 – Joint Meeting December 9, 2020
Emerging Manager ProgramDefined
236

Agenda item 34 – Joint Meeting December 9, 2020
Emerging Manager ProgramTeam
237
Emerging Manager Program*
Public Equity Lauren Honza, CFA
Private Equity Adriana Ballard
Private Real EstateAmy Cureton
Hedge FundsPanayiotis
Lambropoulos, CFA, FRM, CAIA
Fixed IncomeRichard Inzunza, CFA
*Emerging Manager Program efforts are coordinated by Lauren Honza in conjunction with the CIO

ERS External Advisor Website Managers of Emerging Managers Consultants Outreach
Emerging Manager Program Approach
Agenda item 34 – Joint Meeting December 9, 2020 238

Emerging Manager ProgramInvestments and Commitments as of August 31, 2020
Agenda item 34 – Joint Meeting December 9, 2020 239

Emerging Manager ProgramPerformance
Agenda item 34 – Joint Meeting December 9, 2020
As of 08/31/20 Public Equity Annualized Since Inception Legato International Small Cap Portfolio (Inception: February 1, 2017) 7.99% MSCI EAFE Small Cap Index 6.95% Legato Emerging Markets Portfolio (Inception: November 1, 2019) 7.27% MSCI Emerging Markets Index 7.80%
Private Equity Net IRR Total Emerging Manager Portfolio (Inception: November 2010) 12.38% Total Private Equity Portfolio 10.28%
Private Real Estate Net IRR Total Emerging Manager Portfolio (Inception: December 2010) 15.17% Total Private Real Estate Portfolio 11.13% Sources: The Burgiss Group, LLC and BNY Mellon
240

TRS/ERS Emerging Manager Conference Real Estate Emerging Manager (REEM) Summit Asset Class Updates Public Equity Private Equity Private Real Estate Hedge Funds
Emerging Manager Program Calendar Year 2020 Highlights
Agenda item 34 – Joint Meeting December 9, 2020 241

Maintain the target of 10% of externally managed assets with emerging managers Focus on relevant direct relationships with emerging managers in ERS Portfolio Promote emerging manager program best practices by working with other investors Continue to work on ERS PAAMCO Launchpad 2020 ERS & TRS Emerging Manager Conference – January 26, 2021
Emerging Manager Program Calendar Year 2021 Initiatives
Agenda item 34 – Joint Meeting December 9, 2020 242

Questions?

Public Agenda Item #35
Chief Investment Officer’s Report
December 9, 2020
Tom Tull, CFA, Chief Investment Officer

Appreciation and commendation of IAC for increased time commitments and involvement to include: New Asset Class Investment Committee meeting participation as voting
members (at least 30 held during this calendar year) Texa$aver Product Review Committee
Appreciation of the Office of General Counsel and the Investment Compliance Officer for effectively meeting the demands of current and new deal flow
Chief Investment Officer’s ReportInvestment Division Appreciation
Agenda item 35 – Joint Meeting December 9, 2020 245

COVID-19 containment Accommodating monetary and fiscal policy Political risk due to agenda of the majority party New normal Geopolitical and trade risks
Chief Investment Officer’s ReportInvestment Challenges for Fiscal Year 2021
Agenda item 35 – Joint Meeting December 9, 2020 246

Chief Investment Officer’s ReportInvestment Opportunities for Fiscal Year 2021
Agenda item 35 – Joint Meeting December 9, 2020
Opportunistic Credit Portfolio Development Focus on Infrastructure Portfolio Development Ramping up the seeding platform for Hedge Funds Enhancement of risk management and risk reporting to Board
247

Chief Investment Officer’s ReportMajor Initiatives for Fiscal Year 2021
Agenda item 35 – Joint Meeting December 9, 2020
Support legislative initiatives for addressing unfunded pension liabilities Expand existing core competencies for innovative investment management by exploring
new investment opportunities Refresh select pool of external advisors/managers and initiate searches to refine mix of
internal and external management
248

Chief Investment Officer’s ReportMajor Initiatives for Fiscal Year 2021
Agenda item 35 – Joint Meeting December 9, 2020
Diligent negotiation of best economic deal terms Continue development of ERS emerging manager program Leverage external relationships for strategic resources and opportunities Enhance Investment Division career path development, communication, succession
planning and team development
249

Questions?

Public Agenda Item #36
Adjournment of the Joint Meeting of the Board of Trustees and Investment Advisory Committee
December 9, 2020
Top Related