


Languages
Pages
Legal


GE Energy Growth in Emerging Markets
John RicePresident & CEO,GE Energy
June 28, 2005“This document contains "forward-looking statements" – that is, statements related to future, not past, events. In this context, forward-looking statements often address our expected future business and financial performance, and often contain words such as "expects," "anticipates," "intends," "plans," "believes," "seeks," or "will." Forward-looking statements by their nature address matters that are, to different degrees, uncertain. For us, particular uncertainties arise from the behavior of financial markets, including fluctuations in interest rates and commodity prices; from future integration of acquired businesses; from future financial performance of major industries which we serve including, without limitation, the air and rail transportation, energy generation, media, real estate and healthcare industries; from unanticipated loss development in our insurance businesses; and from numerous other matters of national, regional and global scale, including those of a political, economic, business, competitive and regulatory nature. These uncertainties may cause our actual future results to be materially different than those expressed in our forward-looking statements. We do not undertake to update our forward-looking statements."
This presentation includes certain non-GAAP financial measures as defined by SEC rules. As required by SEC rules, we have provided a reconciliation of those measures to the most directly comparable GAAP measures, which is available in our Supplemental Information file on our investor relations website at www.ge.com/investor.

2 /
’04 ’05
$17.3
~$20Growth Drivers
• Installed base driving services growth – Outage cycles up– 40% installed base covered
by contractual service agreements
• Global unit growth … better– GT units ~140, +15%
• New platform revenue growth– Wind ~2X ’04– Oil & Gas ~30%
Other
EnergyServices
PowerGen
15%
~15%
~15%
($B)
Revenue
V%
2.8 ~3.2Op Profit $
Energy Revenue Outlook
~25%

3 /
Global Growth … Key Drivers• Eastern Europe … aging infrastructure
• Africa … accelerated oil & gas exploration
• Middle East … higher oil prices = infrastructure improvements
• India … New gas discoveries/govt policies driving investments
• China … energy demand/security driving diversity
• Rest of Asia … population growth
Environment, Security, Volatility

4 /
Gas-to-Liquids
GE Opportunities• Compressor and turbine technology
• System integration capabilities
• Effluent and water treatment
Trend• “Non-flaring” regulations
• Tighter specifications
• Transportation efficiencies
Business Opportunity• Major oil companies leading the effort
• 10-15 GTL plants producing >1 MMBPD by ‘20
• Shell plant in Qatar 140,000 b/d – $5B CAPEX
’05 – ’08GTL Orders
$0.9B*
*Cumulative

5 /
LNG … Longer & Stronger
17
$868
‘05
1.1
Orders
$949
‘08
AAGR ~8%
1.4
($B)$/tonLNG
Train Size (MT/y)2 4 6 8
1989 1991 2003
Fr9Fr7
Fr5
100
200
300
Segment Dynamics
Larger Scale Plants …Enabling Cost Reduction
Gas price from ~$4 to $7/Mbtu … +40%
Number of projects from 4 to 6/yr … +50%
Project size from ~4 to 6MT/yr … +50%
Changes in Last 2 Years … Capacity adds through 2012 =
adds from1965 - 2005

6 /
IGCC … Expanding in High Growth Areas
Source: IEA ’04 Report
• Coal 40% global fuel source• Increasing environmental concern … everywhere
Average annual capacity additions 60 GW … 20 GW coal based
Fuel cost + security + environment = gasification

7 /
Growth Opportunities in Eastern Europe
Key Opportunities• Power generation … EU capacity/emissions
requirements ($1.4B)• Oil & Gas Russia, Kazakhstan
and Turkmenistan ($2B)• Distributed power … Bucharest DH plant ($24MM)
Energy Dynamics• Aging District Heating (DH) and Combined Heat
& Power (CHP) facilities • Investments in grid infrastructure • Power sector restructuring
Local Capability / Partnerships• Kazakhstan training & service center• Hungary parts center & optimization services• Application centers in Russia, Romania, Hungary,
Prague & Poland … engineering center in Moscow
Orders($B)
$0.8
$1.3AAGR ~18%
‘05 ‘08

8 /
Orders($B)
Growth Opportunities in Africa
1.1
1.7AAGR ~16%
Key Opportunities• Power
• LNG projects & pipelines
• Large scale desalination projects
Energy Dynamics• Oil & gas resources driving economic growth
• Large power needs ... 50+GW, $6.7B next 10 yrs
• Emergence of national & regional grids and gas lines
Local Capability / Partnerships• Nigeria … Company to Country strategy
• Service and training centers … Nigeria & Algeria
‘05 ‘08

9 /
Orders($B)
‘05 ‘08
1.7
2.2AAGR ~10%
Growth Opportunities in the Middle East
Key Opportunities• LNG/GTL projects ~$5.0B, 70+ LNG tankers
added by 2015 • Gas turbines & CC … $7.0B+ by 2015 • Water & power projects ... 74GW by 2015
Energy Dynamics• Regional revenues ~$1.8 Trillion … plenty for
infrastructure• O&G focused … LNG, GTL, petrochemicals,
ethylene• Population growth creating water issues …
power becomes by-product?
Local Capability / Partnerships• Saudi, Qatar, UAE• Energy rental facility … Saudi• Service center … Bahrain

10 /
Growth Opportunities in India
Orders($B)
0.30.7
AAGR ~33%
Energy Dynamics• National electricity policy … power to all by 2012 • Strong GDP growth 6-8% … infrastructure• World’s largest gas find in ’02
Key Opportunities by 2015• Power generation … 80-90 GW gas, steam, hydro
($30-40B) • Renewables … 14GW wind ($12B)• O&G … LNG, compressors, small PG ($3B)
Local Capability / Partnerships• Local gas & steam service JV’s • Welch Technology Center … $80MM investment• Bangalore, Chennai, Kanyakumari … local wind • Build alliances with strong local companies … BHEL
‘05 ‘08
11 /
Orders($B)
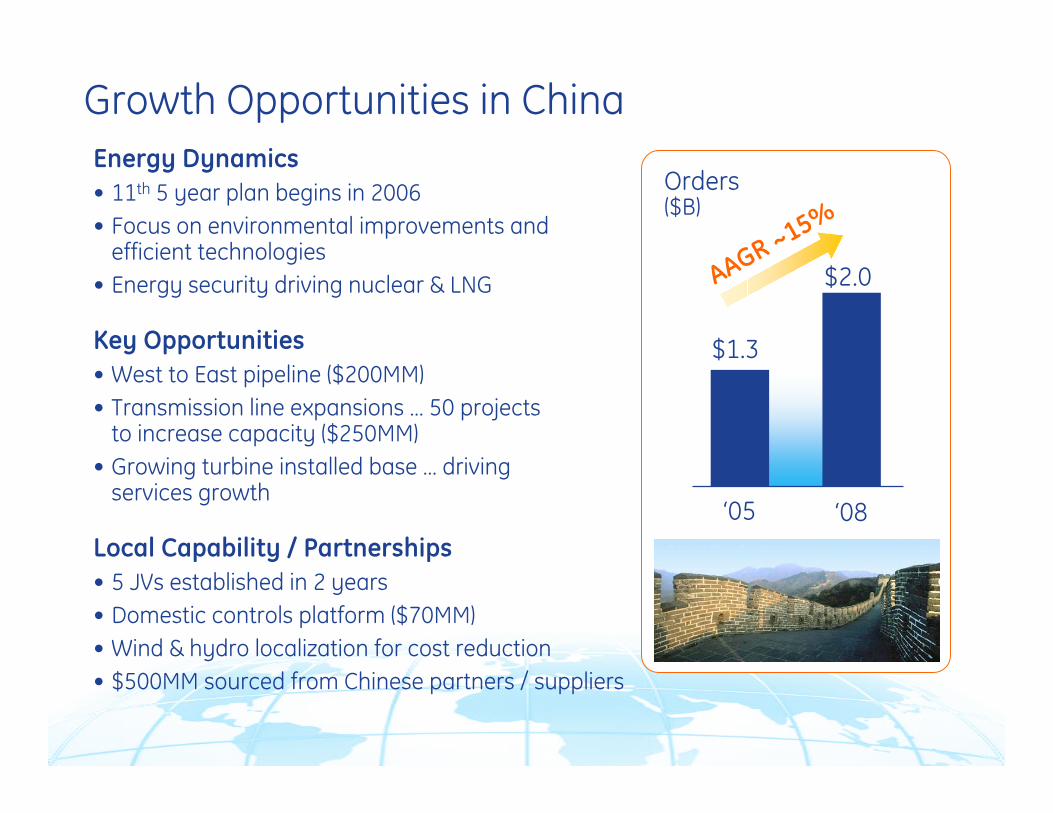
Growth Opportunities in China
Key Opportunities• West to East pipeline ($200MM)• Transmission line expansions … 50 projects
to increase capacity ($250MM)• Growing turbine installed base … driving
services growth
$1.3
$2.0
Energy Dynamics• 11th 5 year plan begins in 2006• Focus on environmental improvements and
efficient technologies• Energy security driving nuclear & LNG
Local Capability / Partnerships• 5 JVs established in 2 years• Domestic controls platform ($70MM)• Wind & hydro localization for cost reduction• $500MM sourced from Chinese partners / suppliers
AAGR ~15%
‘05 ‘08

12 /
Zhangjiagang unit under construction
China Bundle Buy
• Co-production with Harbin Power Equipment … 9 units total since ’03
• GE first to supply electricity using advanced 9FA gas turbine technology
• Online in time for summer peak … world class cycle times, construction standards
– Banshan … May 19
– Zhangjiagang … June 1
– Caojing … June 7
Banshan turbine hall
~20% Faster than Standard

13 /
‘01 ‘03 ‘05
OrdersGrowing Turbine Fleet
Services … Platform for Growth in China
High efficiency GTs
Small gas turbines
($B)
114166
$0.3
Portfolio Expansion
72
• ’01-’05 AAGR ~40% … sustainable growth platform
• Contractual services … E/F class installed fleet creating growth opportunities
• Expanded local capabilities … 50 series compensation projects planned, ‘05 orders $28MM
(# Units)
AAGR ~13%
$0.5
‘05 ‘08

14 /
Growth Opportunities in Rest of Asia
Key Opportunities• Gas turbines >$1B• Cleaner coal 2 GW potential in Australia ($1B)• GTL & LNG projects in SE Asia … $1.5B opportunity
Energy Dynamics• Region GDP = $8 Trillion, population 2X USA• 180 GW installed over next 10 years ... 40% coal• Tougher environmental standards ...
Japan leading
Local Capability / Partnerships• Partnerships in Japan & Korea driving new
technologies• Localization & expansion of technical
and commercial operations• Expanding partnerships in PG & nuclear
Orders($B) 3.1
AAGR ~15%
2.2
‘05 ‘08

15 /
• Expanding Strong Foundation …
– Investing in core technology … growing installed base
– New products and services based on core capabilities
• Accelerating Growth …
– New business platforms … wind, gas recips, coal gasification, gas-to-liquids
• Fueling the Future …
– Next generation technologies
– Investing in high growth regions
Accelerating Growth … Global Expansion

16 /
• Rapid growth in developing countries in all major sectors…expected to surpass developed countries in next 10 years– Eastern Europe, China and India: 9-10% GDP growth– MEA: 5-6% GDP growth
• Developing countries have significant needs to mobilize opportunities – Aging or underdeveloped infrastructure– Limited energy/water resources
… Fits well with GE product set
• GE has unique capabilities to address needs and capture growth– Consumer finance and infrastructure technologies– Company to country relationships
GE in Emerging markets - Summary

17 /
2005E 2010E
($ in billions)
Global and emerging markets revenue growth
Global
Developingcountries
~80
25
~120
~55
~10-15% CAGR
15-20% CAGR
Positioned for strong growth
Growth Drivers
• Big, fast-growing emerging markets
• Macro trends driving demand for better infrastructure
• GE’s scale & diversity mitigates risk
• Global commercial excellence
Top Related