


Languages
Pages
Legal

Japan's Negative Risk Premium in Interest Rates: The Liquidity Trap and Fall in Bank Lending
Rishi Goyal, Department of Economics, Stanford University Ronald I McKinnon, William Eberle Professor of International
Economics, Stanford University
Working Paper Series Vol. 2002-06 May 2002
The views expressed in this publication are those of the author(s) and
do not necessarily reflect those of the Institute.
No part of this book may be used reproduced in any manner whatsoever
without written permission except in the case of brief quotations
embodied in articles and reviews. For information, please write to the
Centre.
The International Centre for the Study of East Asian Development, Kitakyushu

Japan’s Negative Risk Premium in Interest Rates:
The Liquidity Trap and Fall in Bank Lending†
Rishi Goyal* and Ronald McKinnon**
May 10, 2002
Abstract
Japan's interest rates have been compressed toward zero because of pressure coming
through the foreign exchanges. Twenty years of current account surpluses have led to a huge
build up of claims – mainly dollars – on foreigners. Because of ongoing fluctuations in the
yen/dollar exchange rate, Japanese financial institutions will only willingly hold these dollar
claims if the nominal yield on them is substantially higher than on yen assets. In the 1990s to
2002 as U.S. interest rates have come down, portfolio equilibrium has been sustained only when
nominal interest rates on yen assets have been forced toward zero. One consequence is the now
infamous liquidity trap for Japanese monetary policy. A second consequence is the erosion of the
normal profit margins of Japan's commercial bank leading to a slump in new bank credit and an
inability to grow out of the overhang of old bad loans.
† We are grateful to Andrew Coleman, Dale Henderson and the participants of the symposium on “Japan’s Lost Decade: Origins, Consequences and Prospects for Recovery”, held at the University of Michigan in March 2002, for helpful comments. The International Centre for the Study of East Asian Development, Kitakyushu, Japan, provided generous financial support. * Department of Economics, Stanford University, Stanford, CA 94305-6072. E-mail: [email protected] ** William Eberle Professor of International Economics, Department of Economics, Stanford University, Stanford, CA 94305-6072. E-mail: [email protected]

1. Introduction
Since the asset price bubble burst in the early 1990s, Japan’s economy has been virtually
stagnant and its banking sector has been troubled. Since the late 1990s, the macroeconomic
performance has deteriorated and the banking sector troubles have worsened. The government
has resorted to expansionary monetary policy and has tried expansionary fiscal policy. However,
these standard stabilization tools have failed to stimulate the economy. Most existing analyses
have emphasized the need for broad-based structural reforms to cleanup the banking sector and to
liberalize various sectors of the economy. Others have emphasized the need for an even more
expansionary monetary policy to halt deflation.
We believe that this emphasis on structural reform and further monetary (or fiscal)
“expansion” is misplaced.1 In this paper, we argue that long and short-term nominal interest rates
in Japan have been compressed to historically low levels – the so-called liquidity trap – because
of pressure coming through the foreign exchanges. This pressure has several facets. The first
facet is the declining nominal interest rate on dollar assets from inflation stabilization in the US in
the 1990s. The second is a negative risk premium in Japanese interest rates that has kept yields
on yen assets well below those on dollar assets. The third facet is a residual fear, now possibly
quite small, that the yen will resume appreciating secularly.2 This paper focuses on the domestic
financial consequences of the negative risk premium arising from the cumulative effect of more
than twenty years of Japanese current account surpluses.
As long-term interest rates have been pushed to very low values, short-term interest rates
have been reduced to zero and Japan has found itself in a liquidity trap, where the Bank of Japan
1 Structural reforms are needed to raise Japan’s long-term trend growth rate and its real return on capital.
However, our argument is that such reforms are not central to addressing the current problems of deflation
and macroeconomic instability in the economy.
2 This fear of an ever-higher yen was central in the earlier work of McKinnon and Ohno (1997, 2001).
1
has been unable to halt deflation even though it has been increasing the monetary base at a high
rate in the past few years – see Figure 1, and the more extensive depiction of Japan’s very high
growth in base money over the past decade in Shirakawa (2001).3 In addition to the impotence of
monetary policy at the zero lower bound of nominal interest rates, the compression of lending
interest rates toward zero has squeezed bank profit margins. This compression has made new
bank lending hardly profitable, and has made it practically impossible for Japanese banks, by
themselves, to gradually write-off old bad loans out of current earnings. In many countries beset
by bad loan problems, the spread between deposit rates and lending rates has been raised so that
banks have been able to gradually recover loan losses with the passage of time. In Japan,
however, the compressed spreads have hindered banks saddled with sizable non-performing loans
from earning profits that could be used to restore their capital. It also explains the slump in new
bank credit to Japan’s private sector.
The rest of the paper elaborates on and discusses these arguments. Section 2 presents the
theory of the negative risk premium, along with supporting evidence and the theory’s implications
for the liquidity trap. It summarizes a more detailed analysis provided in Goyal (2001). Section
3 discusses the consequences of compressed spreads for the banking system, and is the core
contribution of this paper. Section 4 concludes with policy implications.
2. Theory of the Negative Risk Premium
Consider the plot of nominal interest rates on long-term US government bonds and long-
term Japanese government bonds (JGBs) in Figure 2. Note two properties. First, since the late
3 Critics of the Bank of Japan (BoJ) argue that it is able to re-inflate the economy even at zero short rates.
But their formal models, such as the ones discussed in Krugman (1998) and Svensson (2001), do not show
how the BoJ would be able to re-inflate the economy (or depreciate the exchange rate) when short-term
interest rates are trapped at zero.
2

1970s, Japanese rates have been well below US rates. Second, there has been a trend decline in
the level of the interest rate in the US and in Japan since the early 1980s.
Uncovered interest parity suggests that the interest differential should correspond to
expected yen appreciation; otherwise, there would be arbitrage opportunities. As Figure 3
displays, the yen did appreciate from the early 70s to the early 90s. However, there has been no
trend appreciation since the mid-90s. The absence of such a trend may be rationalized either as
the consequence of a strong US economy and a strong dollar policy where American mercantile
pressure has been muted, as in McKinnon and Ohno (1997, 2001), or as the consequence of a
stagnant real Japanese economy relative to a robust US economy in a standard neoclassical
growth model, as in Yoshikawa (1990). Even though there has been no trend appreciation since
the mid-90s, Figure 2 shows that Japanese long rates have remained much lower than US rates.
To account for the sustained interest differential of about four percentage points between
yen and dollar assets in the absence of trend yen appreciation, we postulate an augmented interest
parity relationship:
i = i* + ∆se + ϕ (1)
where i is the (endogenously determined) Japanese long-term nominal interest rate, i* is the
(exogenously given) US long-term nominal interest rate, s is the yen price of one dollar, ∆se is
expected depreciation of the yen, and ϕ is the risk premium on yen assets. The interest
differential, i – i*, from the 70s to the early 90s was driven primarily by the negative ∆se term.
Since the mid-90s, ∆se ≈ 0 and the interest differential has been driven primarily by the ϕ term,
which is also negative.
ϕ is the excess yield that an investor demands for bearing foreign exchange risk. For a
private Japanese financial institution holding net dollar assets, fluctuations in the yen-dollar
exchange rate result in fluctuations in the yen value of the net dollar assets, and hence of the net
worth of the financial institution. From its perspective, the dollar asset is the risky asset because
3

its liabilities are denominated in yen. So, ϕ captures the excess yield, over and above
expectations of ongoing yen appreciation, that the dollar asset must pay in order to induce the
financial institution to hold it.
It follows that ϕ is negative for a creditor country such as Japan whose credits are
denominated in foreign currency. Conversely, ϕ is positive for a debtor country whose debts are
denominated in foreign currency. The size of ϕ depends on the share of net foreign currency
assets or the net foreign currency debts and on the expected variance in the exchange rate. The
larger the share of net foreign currency assets (debts), the more negative (positive) is ϕ. Hence, ϕ
is inversely related to the net foreign currency asset position.4
These properties are in line with general, cross-sectional evidence provided by Lane and
Milesi-Ferretti (2001) showing an inverse relationship between real interest differentials and net
foreign asset positions.5 To see this, combine equation (1) with the familiar relative purchasing
power parity equation, ∆se = πe – π*e, where πe is expected domestic inflation and π*e is expected
inflation in the rest of the world.6 Fisher parity relates the real interest rate, r, to the nominal
interest rate and expected inflation: r = i – πe. Therefore, the real interest differential equals ϕ:
r – r* = (i – πe) – (i* – π*e) = (i – i*) – ∆se = ϕ
Since ϕ is inversely related to net foreign assets (and, in particular, to net foreign currency assets
in our theory), the real interest rate differential is inversely related to net foreign assets.
Not only does a larger net foreign currency asset share lead to a more negative risk
premium of a creditor country but declines in the value of domestic assets also result in a more
negative risk premium. Shocks to domestic assets that lower the returns on and the market value
4 Note that ϕ must depend upon the existence of ongoing exchange rate volatility or on the possibility of a
change in the exchange rate. If neither is present, there is no foreign exchange risk.
5 See Lane and Milesi-Ferretti (2001), Figure 11.
6 They assume that, on average or in steady state, ∆q = 0, where q is the (log of) real exchange rate.
4

of domestic assets result in a larger share of net foreign currency assets. This, in turn, results in a
more negative risk premium since a larger share of the portfolio is subject to foreign exchange
risk.
Being a creditor nation, Japan has a large negative risk premium that has become more
negative as it has continued to run large current account surpluses throughout the 1990s and has
built up foreign currency claims on the rest of the world. Negative shocks to the Japanese
economy in the late 80s and early 90s lowered the real return on capital in Japan relative to the
rest of the world. So the Japanese invested more abroad (which was reflected in large current
account surpluses) and built up claims on the rest of the world. A substantial fraction of these
claims was in foreign currencies, which resulted in a more negative risk premium in the mid- to
late 90s.
In contrast, foreign currency claims on the rest of the world were small in the 1980s and
domestic growth rates were high. So, the risk premium term was small and the interest
differential between dollar and yen assets was explained primarily by expectations of yen
appreciation. Since the early 1990s, as Japanese growth has slowed and pressure for yen
appreciation has eased, the interest differential is accounted for mainly by the negative risk
premium.
Table 1 displays the rise in net foreign assets from 1980 to 2000 as reported in the
International Financial Statistics (IMF, March 2002). The breakdown between official reserves
and private sector net foreign asset holdings is also displayed. The unit of account is billions of
US dollars.
5

Table 1: Japan’s Net Foreign Asset Position (billions of US dollars)
Year Total Net Foreign Assets
Private Sector Net Position
Official Reserves
1980 12.52 -13.20 25.72 1985 130.38 103.15 27.23 1990 329.36 249.65 79.71 1995 817.60 632.42 184.82 1997 958.73 737.62 220.81 1998 1153.64 937.26 215.83 1999 829.12 540.10 287.66 2000 1157.93 796.82 360.99
Source: International Financial Statistics, IMF (March 2002)
The table shows a large increase in Japan’s net foreign asset position in the late 80s and
the 90s. At the end of 2000, the total net foreign asset position stood at nearly $1.2 trillion, which
is over 20% of GDP or about 8% of total assets.7 A large portion of this position is held by the
private sector, though accumulation of official reserves has played a large role in the late 90s.
This last point will be further examined in section 3.1.
Table 1 displays the officially reported stock of net foreign assets. Unofficial estimates of
the stock position, computed by cumulating current account surpluses, suggest numbers that are
about 1.5 times as large as the official statistics. Table 2 displays different estimates of Japan’s
cumulative current account surplus.
7 From the financial survey (reported in the IFS), domestic credit amounted to nearly $15 trillion in 2000.
6

Table 2: Alternate Estimates of Japan’s Net Foreign Asset Position (billions US $)
Goyal (2001) Year
Official estimate
(IMF 2002)
Lane and Milesi-Ferretti
(2001) Cumulative CA
surplus Capital Accum.
(6% interest rate)
1980 12.52 16.29 12.52 12.52
1985 130.38 101.49 138.43 135.54
1990 329.36 445.96 511.39 506.99
1995 817.60 1030.48 1099.86 1127.81
1997 958.73 1336.66 1277.93 1337.25
2000 1157.93 1653.18 1817.08
Note: Column 4(Cum CA surplus) sums the balance on goods, services and income.
Column 5(Capital Accumulation) computes stocks from flow data (the balance on goods and services only) as follows: Stock (t) = (1+i) Stock (t-1) + Flow (t)
The second column repeats the official net foreign asset position from Table 1. The third
column displays the cumulative current account position from Lane and Milesi-Ferretti (2001).
The fourth column updates Lane and Milesi-Ferretti’s numbers up to 2000. Both columns
indicate numbers substantially higher than the official estimates. The final column cumulates the
balance on goods and services only (the balance on income is excluded) using a 6% yield on
assets. The 6% yield comes from Figure 2, where the return on long-term U.S. bonds has been at
least 6% until the late 90s. These estimates suggest that the stock of net foreign assets, and hence
the external exposure of Japanese financial institutions, is very large.
The share of net foreign assets that are in foreign currencies is difficult to ascertain.
Some data is available through the Bank of Japan’s “Locational International Banking Statistics”,
which reports the balance sheet positions of banks and non-banks vis-à-vis non-residents in any
currency. It is shown for selected years in Table 3.
7

Table 3: Net Asset and Net Foreign Exchange Asset positions of Japanese banks and
non-banks vis-à-vis non-residents (in billions of US dollars)
Total Banks Non-Banks Year NFA NfxA NFA NfxA NFA NfxA 1990 -17 -101 -184 -217 167 116 1994 305 -30 87 -180 218 150 1998 477 264 103 -41 374 305 1999 612 393 142 35 470 358 2000 656 401 127 21 530 380 2001 673 449 128 34 545 415
Source: Locational International Banking Statistics, Bank of Japan Note: NFA in the title header is short for Net Foreign Assets, and NfxA is short for Net Foreign Exchange Assets. The numbers reported for each year corresponds to the end-September number.
Note that, corresponding to the increase of Japan’s net foreign asset position in Tables 1
and 2, there is an increase in net assets vis-à-vis foreigners throughout the 1990s. A substantial
portion of these net assets is in foreign currency. (Note also that the data in Table 3 are less
comprehensive, and thus less in magnitude, to those in Tables 1 and 2.)
The breakdown of foreign assets and foreign currency assets by banks and non-banks
(such as pension funds and insurance companies) is even more stark. Non-banks hold the vast
majority of the net foreign assets and net foreign currency assets. A very large fraction – between
70% and 80% – of their net foreign asset positions is in foreign currency. Banks, on the other
hand, borrowed heavily (in the short-term) from abroad in the 1980s. This is reflected in their net
liability position in 1990. However, after making large foreign exchange losses, they unwound
much of their net short-term exposure whilst accumulating long-term foreign currency assets.8
Their net foreign asset and net foreign exchange asset positions are not very large.
Absent detailed balance sheet data for banks and non-banks, it is difficult to ascertain the
share of net foreign exchange assets in total assets. Balance sheet data for banks is available;
however, as shown in Table 3, they are not the primary holders of net foreign and net foreign
8
exchange assets. For non-banks such as life and non-life insurance companies, basic balance
sheet data suggests that around 12 to 14% of total assets are in foreign securities.9
The estimates of net foreign exchange assets and of exposure to foreign exchange risk are
likely to be understated. First, as noted in Table 2, unofficial net foreign asset positions for
Japanese financial institutions, estimated from simple yet meaningful computations, are nearly
1.5 times as large as official estimates. Second, balance sheet data do not show the proportion of
loans to foreigners or to multinational corporations for the purpose of foreign direct investment
(FDI). Even if external FDI is denominated in yen, the investment is subject to foreign exchange
risk if the proceeds of the investment or the success of the investment is linked to the dollar.
Third, the key variable for the foreign exchange risk premium is the share of net foreign exchange
assets to performing (or healthy) domestic assets. If a large share of total domestic assets is at
risk of becoming non-performing, as is the case in Japan, then net foreign exchange assets
become a larger share of performing assets and imply a more negative foreign exchange risk
premium. As non-performing loans have ballooned in recent years, net foreign exchange assets
of nearly 8% of total assets become a larger share of performing assets.
So, our story is that as Japan has run current account surpluses through the 1990s and has
accumulated net foreign assets and, in particular, net foreign exchange assets, the negative risk
premium has become more negative. This more negative risk premium has maintained the
interest differential between yen assets and dollar assets even in the absence of trend yen
appreciation. As US nominal interest rates declined due to inflation stabilization in the US,
Japanese long rates have been compressed to very low values. Taking into account a term
premium or liquidity premium, this compression of long rates has meant that short rates have
8 See Goyal (2001).
9 See Economic Statistics Annual, Bank of Japan.
9

been compressed to zero – a liquidity trap situation – where the Bank of Japan has been unable to
halt deflation and re-inflate the economy.
This story has several implications for the Japanese banking sector. In the next section,
we discuss each of these implications in turn.
3. Negative Risk Premium, Low Nominal Interest Rates and the Banking Sector
This section is divided into three parts. The first part examines portfolio re-allocation
between yen assets and foreign currency assets by private financial institutions in the liquidity
trap. The second part investigates the profitability of new bank lending. The third part studies
two issues regarding lending spreads and the share of bad loans in a bank’s loan portfolio.
3.1 Portfolio re-allocation in the Liquidity Trap
At the zero lower bound of nominal interest rates, i = 0 = i* + ∆se + ϕ. Recall that the
left hand side variable, i, denotes the domestic currency return on a domestic currency asset, and
the right hand side expression, i* + ∆se + ϕ, denotes the risk-adjusted domestic currency return
on a foreign currency asset.
Given a portfolio allocation between foreign assets and domestic assets, and hence given
a value for ϕ, a decline in i* + ∆se due either to a decline in foreign nominal interest rates, i*, or
to greater anticipated yen appreciation implies negative risk-adjusted domestic currency returns
on foreign currency assets. In other words, i = 0 > i* + ∆se + ϕ.
Private Japanese financial institutions find it unprofitable to hold foreign currency assets.
So, they sell foreign currency assets and buy yen assets. This portfolio re-allocation implies a
less negative risk premium because exposure to foreign currency risk reduces. However, it puts
additional pressure for yen appreciation.
10

Yen appreciation, at a time when the Japanese economy is already quite weak, would
further weaken it. To prevent this from occurring, the Japanese monetary authorities intervene in
the foreign exchange markets to sell yen and buy foreign currencies. As they do so, not only is
pressure for yen appreciation alleviated (which, along with a less negative risk premium, restores
interest parity at zero rates: i = 0 = i* + ∆se + ϕ) but also official reserve accumulation becomes
the channel for dollar finance of Japan’s current account surplus! For 1999 and 2000, where the
nominal interest rates are zero, official reserve accumulation has in deed been the primary
channel for dollar finance of the current account surplus and for reducing what would otherwise
be an even more negative currency risk premium, ϕ. See Table 1.10,11
A graphical illustration of the above argument is in Figure 4. The bold line shows interest
parity above zero: i = i* + ∆se + ϕ. Since i is constrained below by zero, low levels of i* (given
∆se + ϕ) imply i = 0 > i* + ∆se + ϕ, where portfolio re-allocation by private Japanese financial
institutions and equivalent interventions by Japanese monetary authorities result in restoration of
“parity” at a zero domestic interest rate: i = 0 = i* + ∆se + ϕ. However, this is a fragile
equilibrium because (i) any further decline in i*, or (ii) new foreign exchange asset accumulation
from the current account surplus will lead to the same cycle of portfolio re-allocation and foreign
exchange interventions described above. After official intervention to buy dollar assets in
exchange for yen assets, the equilibrium currency risk premium will be less negative under (i);
and, under (ii), it will be prevented from becoming more negative.
10 Data for 2001 is not available as yet.
11 Japan ran a current account surplus in 1999. So, a fall in its net foreign asset position in 1999 may
appear puzzling. The fall is explained by a sharp increase in portfolio liabilities in 1999 associated with an
inflow of foreign funds into the Japanese stock market and an increase in stock prices.
11

In summary, in the liquidity trap with a near zero domestic interest rate, official foreign
exchange interventions must continually adjust ϕ to maintain private portfolio balance without
the yen appreciating.
3.2 Profitability of new bank lending
The compression of interest rates towards zero has an adverse impact on the profitability
of new bank lending. Banks earn profits on the spread between their borrowing and lending rates.
They accept various types of deposits such as demand deposits at zero interest rates and time
deposits, and they borrow short-term from other banks. They typically lend long-term. As the
(absolute) level of lending rates falls towards zero12 and as the spread between the short-term
rates and long-term rates is compressed, banks will have very low profit margins on new loans.
Figure 5 shows the ex ante profit margin on new bank lending. Two measures are
plotted. One is the difference between the rate on long-term loans for prime borrowers (the prime
lending rate) and the ordinary deposit rate. This measure shows a decline through the 1990s. The
other measure is the difference between the prime rate on long-term loans and the three-month
certificate of deposit (CD) rate, which shows an increase in the 1990s relative to the 1980s and is
explainable by deregulation of time deposit rates.13 Though the latter measure has increased, it
remains at low levels.
Another measure of the ex ante profitability of bank lending is in Figure 6, which plots
the short-term and long-term rates for prime borrowers. Both rates have declined in the 1990s.
Significantly, the spread between the two has declined compared to the early and mid 80s.
12 Average interest rates on new loans and discounts have fallen from over 3.5% before 1995 to less than
2% since 1996.
13 See Bank of Japan (2001) for an explanation of how the composition of profit margin (the sum of the
lending spread and the fund-raising spread) has changed after deregulation.
12
Though ex ante measures of profitability show a decline, ex post measures of profitability
of bank lending do not show a similar decline unless the cost of disposing non-performing loans
is taken into account. Figure 7a plots the interest margin on lending, the cost of maintaining
assets or the expense ratio, and the realized credit cost. The interest margin on lending is defined
as the difference between the yield on lending and the average rate on banks’ interest-bearing
liabilities. The expense ratio is defined as the ratio of general and administrative expenses to the
average annual balance on interest-earning assets. Realized credit costs is the ratio of loan-loss
provisioning and loan write-offs (or the disposal of non-performing loans) to the average amount
of loans outstanding.14
The interest margin on lending shows a slight decline in the 1990s. However, this decline
was more than matched by a decline in general and administrative costs (or in the expense ratio).
Hence, the ex post interest margin on lending net of general expenses displayed in Figure 7b does
not show a decline through the 1990s.
Realized credit costs or the costs associated with the disposal of non-performing loans
increased dramatically in the mid- to late 90s. Consequently, ex post profitability suffered. This
is displayed in Figure 7b as an interest margin on lending net of realized credit costs, and as an
interest margin on lending net of realized credit costs and net of general and administrative
expenses. Both measures show negative returns in the mid- to late 90s.
How does the compression of ex ante profit margins on lending square with the absence
of compression in ex post profit margins (not including realized credit costs)? We think it quite
likely that the accounting of interest income is flawed. While Japanese banks have disposed of a
large number of non-performing loans, new and larger amounts of non-performing loans keep
appearing on their books. This suggests that banks have not performed adequate risk assessments
of their loan portfolios and they have not made sufficient allowances for future loan losses. It
14 Data source: Bank of Japan (2001).
13

also suggests that banks may be “evergreening” these loans and capitalizing interest payments
that they have not received. The effect is that their net interest income is possibly over-stated and
the reported ex post net margin does not decline. But profit margins remain at very low levels.
Very low profit margins or compressed profit margins imply that Japanese banks are not
earning adequate profits to cover loan losses. Comparing Japanese profit margins on lending to
the margins for US banks is quite revealing. See Figure 8. US banks have been able to run much
larger profit margins and, thereby, have been able to cover losses on loans. Japanese banks have
not been able to run as high profit margins and, hence, have been unable to cover loan losses by
themselves. In the 1980s, profit margins were low because of interest rate regulation. However,
even after deregulation of the interest rate structure, Japanese banks have been unable to generate
or maintain substantially larger profit margins.
Banks may want to raise lending rates. However, they have not been able to do so to any
significant degree. One possibility is that if they raise lending rates, the most credit-worthy of
their corporate clients will stop borrowing from them and will instead raise credit by issuing low
yield commercial paper. This will leave banks with less credit-worthy clients. In fact, yields on
newly issued commercial paper have been very low since the mid 1990s. They fell from around
2.5% before 1995 to approximately 0.5% since 1996, suggesting that issuers of this paper can
access credit cheaply and need not pay higher interest rates to banks.15
Another possibility is that small and medium enterprises, who are the banks’ primary
clients, are already very heavily indebted and in a precarious financial situation. Raising lending
rates would raise their risk of default. Bank lending shifted away from manufacturing firms in
the 1980s to primarily non-manufacturing firms in real estate, finance and insurance and services.
In the 1990s, lending to individuals increased substantially as a share of total loans. By size of
enterprise, lending has been primarily to small non-manufacturing firms.
15 Data source: Financial and Economic Statistics Monthly, Bank of Japan.
14
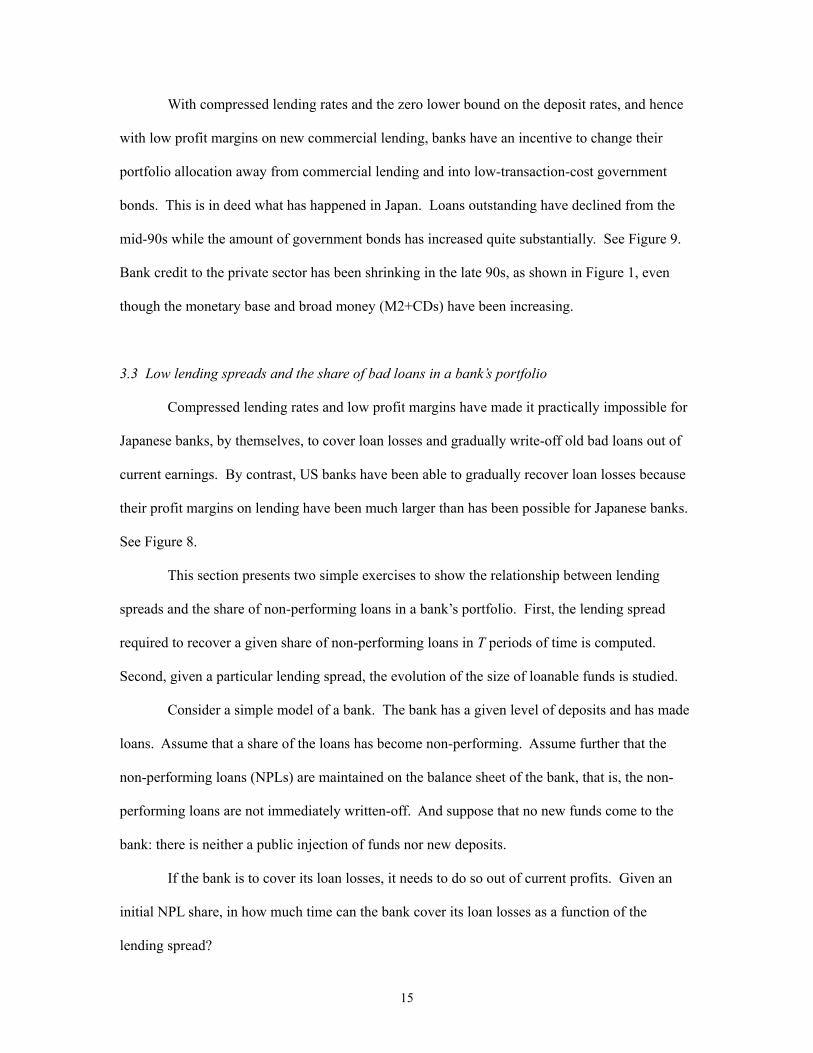
With compressed lending rates and the zero lower bound on the deposit rates, and hence
with low profit margins on new commercial lending, banks have an incentive to change their
portfolio allocation away from commercial lending and into low-transaction-cost government
bonds. This is in deed what has happened in Japan. Loans outstanding have declined from the
mid-90s while the amount of government bonds has increased quite substantially. See Figure 9.
Bank credit to the private sector has been shrinking in the late 90s, as shown in Figure 1, even
though the monetary base and broad money (M2+CDs) have been increasing.
3.3 Low lending spreads and the share of bad loans in a bank’s portfolio
Compressed lending rates and low profit margins have made it practically impossible for
Japanese banks, by themselves, to cover loan losses and gradually write-off old bad loans out of
current earnings. By contrast, US banks have been able to gradually recover loan losses because
their profit margins on lending have been much larger than has been possible for Japanese banks.
See Figure 8.
This section presents two simple exercises to show the relationship between lending
spreads and the share of non-performing loans in a bank’s portfolio. First, the lending spread
required to recover a given share of non-performing loans in T periods of time is computed.
Second, given a particular lending spread, the evolution of the size of loanable funds is studied.
Consider a simple model of a bank. The bank has a given level of deposits and has made
loans. Assume that a share of the loans has become non-performing. Assume further that the
non-performing loans (NPLs) are maintained on the balance sheet of the bank, that is, the non-
performing loans are not immediately written-off. And suppose that no new funds come to the
bank: there is neither a public injection of funds nor new deposits.
If the bank is to cover its loan losses, it needs to do so out of current profits. Given an
initial NPL share, in how much time can the bank cover its loan losses as a function of the
lending spread?
15

The balance sheet of the bank may be described as follows:
Assets Liabilities Loans
NPLs Performing Loans
Reserves
Deposits Capital
Let il be the lending rate, let id be the deposit rate, and let τ be the general and
administrative cost per unit of assets. Let k be the capital adequacy ratio and let r be the required
reserve ratio.
Let total liabilities be normalized to 1, and let the share of NPLs at time t be NPAt.
Assuming no new defaults, the bank’s revenue per yen lent at time t is il (1 – r – NPAt).
Its cost at time t is id (1 – k) + τ. Hence, its profit rate at time t, πt, is given by
πt = il (1 – r – NPAt) – id (1 – k) – τ. (2)
Assume that (positive) profits are used to write-off loan losses. The evolution of the non-
performing loan share is given by
NPAt+1 = NPAt – πt (3)
Given an initial share of non-performing loans, NPA0, and given id, τ, k and r, we can
compute the time to cover loan losses as a function of the lending rate, il. We do so by setting
NPAT = 0 and iterating backwards using equations (2) and (3). See Appendix 1 for the details.
Let id = 0, τ = 1.5%, k = 10% and r = 2%. This parameterization roughly corresponds to
the situation of Japanese banks.
Figure 10 displays the time taken to reduce the share of non-performing loans in the
bank’s balance sheet to zero as a function of the lending rate il (given a zero deposit rate). As one
would expect, the lower the lending spread, the longer it takes to cover loan losses. The larger the
initial share of non-performing assets, the longer it takes to cover loan losses. The time taken to
cover loan losses increases exponentially as the lending spread declines.
16

By official estimates, the share of non-performing loans is 6%.16 From Figure 5, the ex
ante profit margins are approximately 1.7%. Given a spread of 1.7%, it will take over 56 years to
cover the loan losses. This computation assumes no new defaults and no infusion of funds. If
there is a continuing risk of default, as there most likely will be, then this is an under-estimate and
it will take longer to cover the losses. Furthermore, in the past ten years, there has been little
change in the total deposit base of domestically licensed banks. There have been public infusions
of funds, but these have been few and in times of (near) crisis.
Unofficial estimates of the share of non-performing loans are as high as 20%. For such
high loan losses, it would take over 100 years to recover losses at a spread of 2%. For spreads
lower than 1.9%, the banks are running at a loss and are unable to cover their loan losses. In
deed, the spreads required for Japanese banks to make profits and cover losses are much larger
than they have been able to generate. Figure 6 is also suggestive of their troubles since the spread
between the short-term rate and long-term rate has been about 0.5%, which is far smaller than the
spreads that they need to restore financial health.
The exercise strongly suggests that low lending spreads are a key component to the
problems faced by Japanese banks. Lowering τ and lowering r would reduce the lending spreads
needed to cover loan losses and, in fact, Japanese banks have been trying to lower τ by reducing
personnel expenses. Reducing τ and r in the computations reduces the time needed to cover loan
losses; however, the time needed remains high. For a 20% initial share of non-performing loans
and for τ reduced to 1% and r reduced to 1%, forty years are needed to cover loan losses for a
lending spread of 1.7%. For a 6% share, the time is ten years. This computation assumes no
defaults on new loans.
A spread of over 3%, which US banks have been able to generate, implies that a 6%
initial non-performing loan share can be covered in less than five years at the initial
16 See Bank of Japan (2001).
17

parameterization. After the savings and loan crisis of the late 80s and early 90s, the ratio of non-
performing loans rose significantly in the portfolio of US banks. However, they were not very
high and, with spreads over 3%, US banks have easily recovered their losses. With larger non-
performing loans and smaller lending spreads, Japanese banks on the other hand face a much
more difficult time in covering their losses.
With low lending spreads and large non-performing loans, the computations suggest that
Japanese banks are losing money on their operations. What is the impact on bank lending if the
banks are unable to break even?
In our simple model, if πt < 0 and the bank makes losses, then its capital (or net worth)
declines. To maintain a required level of capital, the bank must call in, or not renew, some of its
performing (or good) loans to reduce its liabilities. As performing loans are called in, non-
performing assets rise as a share of performing assets. That is, the “loan dependency ratio” of
non-performing loans to performing loans worsens over time even if there are no new defaults!
We have computed and plotted this “loan dependency ratio” over time for the case of an
initial non-performing asset share of 20%. Let total liabilities be normalized initially, that is, at
time 0, to 1. Hence, non-performing assets at time 0 are 0.20. As in the exercise above, let the
required reserve ratio be 2% and let the capital adequacy ratio be 10% of total liabilities. Let the
lending rate il be 1.7%, let the deposit rate id be 0% and let the general and administrative expense
ratio τ be 1.5%.
Figure 11 plots the exponential increase in the ratio of non-performing assets to
performing assets over time. The ratio increases gradually at first, rising from 26% at time 0
(corresponding to non-performing assets as a 20% share of total liabilities at time 0) to 29% in 5
years and 34% after 10 years. After that, the increases are much quicker. So, the bad loan
problem can fester for some years before it explodes.
18

3.4 Public Financial Intermediation
An alternative interpretation, put forth by Fukao (2002), is that profit margins are low not
because of pressure coming in from the foreign exchange market, as we have argued, but in large
part because government financial institutions have been providing funds at low interest rates,
thus keeping commercial loan rates low. But, the question is one of causality or endogeneity. Is
public intermediation driving the non-profitability of commercial bank lending or is public
intermediation an endogenous response to a curtailment in (unprofitable) commercial bank
lending? Fukao suggests the former, but we suspect that it may be the latter.
Figure 12 plots the prime long-term lending rate, the key lending rates of government
financial institutions and the Fiscal Loan Fund. The key lending rates of the government
financial institutions move very closely with the prime long-term lending rate. The two are
virtually identical for many periods. They also move very closely with the Fiscal Loan Fund rate,
and have declined significantly over the 1990s. While the co-movement and the fall are apparent
throughout the 1990s, the causality from one to the other is not.
Figure 13 plots the prime long-term lending rate with the middle rates on housing loans
by City Banks and the lending rates on private dwellings by the Housing Loan Corporation. The
loan rates of City Banks have moved nearly identically with the prime long-term rates and, since
1995, have been below the rates offered by the Housing Loan Corporation. Housing loan rates of
the latter have declined in the 1990s, but it does not appear that the Housing Loan Corporation is
undercutting the profit margins of commercial bank lending.
On the loan side, commercial bank credit to private non-financial corporations has fallen
in absolute terms since 1996-97. As argued above, commercial banks have instead increased their
holdings of government securities. Loans from government financial institutions to private non-
financial corporations rose in the early 90s but have fallen in absolute terms since 1998. In
relative terms, a slightly larger share of loans outstanding to private non-financial corporations
19

has come from government financial intermediaries. Their share of loans outstanding has risen
from 11% in 1990 to 13% in 1997 and 14% in 2000.17
On the deposit side, household savings has increased throughout the 1990s. In 1989-90,
41% of these savings were held in domestically licensed banks while 31% were in the postal
savings system. The rest were mostly in financial institutions for agriculture, forestry and
fisheries and financial institutions for small businesses. By the late 90s, the share of savings held
in domestically licensed banks had fallen marginally to 40% but had increased to 36% in the
postal savings system. The increase in postal savings deposits came at the expense of the
financial institutions for agriculture, forestry and fisheries and financial institutions for small
businesses.
To summarize, on the deposit side, there has not been much change. On the lending side,
there has been an increase in the share of loans by government financial institutions, as Fukao has
noted. But, this change is not large and there does not appear to be much evidence of
undercutting of private lending rates by government financial institutions. Nevertheless, the
evidence of government financial institutions offering low rates and increasing lending to the
private sector does not contradict our argument of low rates coming from pressures in the foreign
exchange market – and government financial institutions acting endogenously to offset some of
the decline in lending by commercial banks. Thus, the evidence presented by Fukao is consistent
with our explanation.
17 Data source: Bank of Japan.
20

3 Conclusion
One of the supposed truisms about Japan's economic malaise has been the failure of the
government to take resolute action to “clean-up” the balance sheets of the banks after the collapse
of the bubble economy in 1991. After the string of bank failures in the United States in the
1980s, the American government created the Resolution Trust Corporation (1989). The RTC
assumed dubious loans and wound up really bad banks, but also helped with the re-capitalization
of the wounded survivors often by subsidizing a merger with, or acquisition by, a good bank.
Although there have been several desultory attempts to inject more capital into distressed (and not
so distressed!) Japanese banks, nothing seems to work to stem the fall in new bank credit. Thus,
with invidious comparisons to the earlier American example, the Japanese government is heavily
criticized for not being thorough enough in restructuring commercial and other domestic banks.
However, our analysis of the negative risk premium and Japan's low-interest rate trap
suggests that such criticism of government regulatory inaction is seriously misplaced. Instead,
macroeconomic phenomena have compressed bank lending (as well as deposit) rates toward zero
so as to take away the “normal” margin of profitability on new lending. This compressed margin
helps explain both the reluctance of Japanese banks to make new loans and their inability to
gradually re-capitalize themselves. In contrast, after the banking crises of the 1980s, most
American banks could gradually re-capitalize because the spread between deposit and loan rates
for several years was even higher than it is now – and much higher than in Japan currently.
A comprehensive restructuring of balance sheets, no matter how thorough, cannot end
Japan’s banking crisis. Under the currently compressed structure of interest rates on yen assets,
commercial banks will remain reluctant to lend to high-quality borrowers. Decompression and a
return to a more normal structure of nominal interest rates through macroeconomic reforms
should precede serious balance sheet restructuring, which of course will ultimately be necessary.
Thus, ending the low-interest liquidity trap is a necessary condition for recovery in
Japan's banking system. If one accepts our hypothesis of the importance of the negative risk
21

premium in contributing to Japan's low-interest rate trap, then what should be done is obvious.
The negative risk premium arises from (1) decades of accumulation of dollar assets within
Japanese financial institutions, and (2) fluctuations in the yen/dollar exchange rate, which
increase the risks to yen-based financial firms from holding these dollar assets. Because running
trade deficits cannot suddenly reverse the cumulative financial effect of twenty years of trade
surpluses, the only immediate policy instrument for reducing the foreign exchange risk in
Japanese financial intermediaries is to stabilize the yen/dollar exchange rate in a completely
convincing fashion.
How to credibly stabilize the yen/dollar rate into the indefinite future, and the
macroeconomic consequences of doing so, is a story for another time (McKinnon and Ohno, 1997
and 2001; and Goyal 2001). Here it suffices to note that the solution, as well as the problem, is
not one that the Japanese authorities are likely to be able to deal with on their own. Rather, to be
credible, a long-term benchmark parity for the yen/dollar rate will require the full cooperation of
the United States.
4 Appendix
4.1 Case of Positive Operational Profits: πt > 0
Combining equations (2) and (3) yields:
NPAT = (1+ il) NPAT-1 – il (1 – r) + id (1 – k) + τ
Iterating backwards to time 0 gives:
NPAT = (1+ il)T NPA0 – [il (1 – r) + id (1 – k) + τ] [1 + (1+ il) + (1+ il)2 + … + (1+ il)T-1]
This equation can be used to compute the time T needed to cover loan losses of NPA0 given il, id,
τ, k and r. This is done by setting NPAT = 0. The equation then reduces to
il NPA0 = [1 – (1+ il)-T] [il (1 – r) + id (1 – k) + τ]
22

It can be solved for T. Alternatively, the equation can be used to determine the lending rate il
needed to cover initial loan losses NPA0 for a given time period of, say, ten years.
4.2 Case of Negative Operational Profits: πt < 0
Losses erode bank capital. Let kt be bank capital at time t. Since losses erode capital,
kt+1 = kt + πt < kt
Banks must maintain a certain capital adequacy ratio, denoted by k*. So, its liabilities, which are
deposits Dt, must shrink. Deposits must shrink such that kt+1/(kt+1+ Dt+1) = k*. Thus, the size of
the bank (kt+1+ Dt+1) shrinks.
As liabilities shrink, so do required reserves and, more importantly, the performing assets.
Performing loans are called in or are not renewed. Hence, non-performing loans rise as a share of
performing loans.
5 References
Bank of Japan (2002). “Locational International Banking Statistics.” http://www.boj.or.jp/en/
Bank of Japan (2001). “Developments in Profits and Balance Sheets of Japanese Banks in Fiscal
2000 and Banks’ Management Tasks.” Bank of Japan Quarterly Bulletin. November.
Fukao, Mitsuhiro (2002). “Japan’s Lost Decade and Weaknesses in its Corporate Governance
Structure.” Paper presented at the symposium, Japan’s Lost Decade: Origins, Consequences and
Prospects for Recovery, at the University of Michigan. March.
23

Goyal, Rishi (2001). “Foreign Exchange Risk and Japan’s Liquidity Trap.” Stanford University
mimeo.
International Monetary Fund (2002). International Financial Statistics. CD-ROM. March.
Krugman, Paul (1998). “It’s Baaack: Japan’s Slump and the Return of the Liquidity Trap.”
Brookings Papers on Economic Activity 2.
Lane, Philip and Gian Maria Milesi-Ferretti (2001). “Long-Term Capital Movements.” NBER
Macroeconomics Annual 2001.
McKinnon, Ronald I. and Kenichi Ohno (2001). "The Foreign Exchange Origins of Japan's
Economic Slump and Low Interest Liquidity Trap." The World Economy 24(3).
McKinnon, Ronald I. and Kenichi Ohno (1997). Dollar and Yen: Resolving Economic Conflict
between the United States and Japan. Cambridge: MIT Press.
Shirakawa, Masaaki (2001). “Monetary Policy Under the Zero Interest Rate Constraint and
Balance Sheet Adjustment.” International Finance 4(3). Winter.
Svensson, Lars (2001). “The Zero Bound in an Open Economy: A Foolproof Way of Escaping
from a Liquidity Trap.” Monetary and Economic Studies Special Edition. Institute for Monetary
and Economic Studies, Bank of Japan. 19:S-1.
Yoshikawa, Hiroshi (1990). "On the Equilibrium Yen-Dollar Rate." American Economic Review
80(3).
24
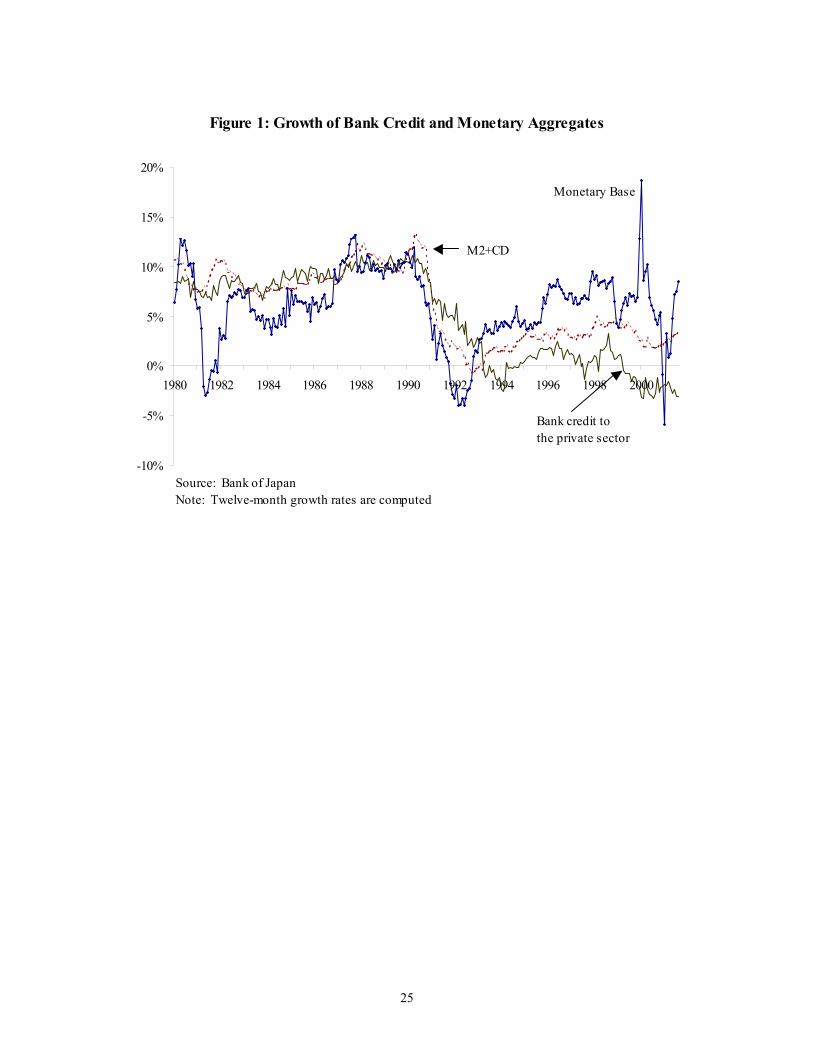
Figure 1: Growth of Bank Credit and Monetary Aggregates
-10%
-5%
0%
5%
10%
15%
20%
1980 1982 1984 1986 1988 1990 1992 1994 1996 1998 2000
Source: Bank of JapanNote: Twelve-month growth rates are computed
Monetary Base
M2+CD
Bank credit tothe private sector
25

Figure 2: Long-Term Interest Rates
0
2
4
6
8
10
12
14
16
70 72 74 76 78 80 82 84 86 88 90 92 94 96 98 0 2
%
US
Japan
Source: International Financial Statistics, IMF
Figure 3: Yen-Dollar Nominal Exchange Rate
4
4.5
5
5.5
6
70 72 74 76 78 80 82 84 86 88 90 92 94 96 98 0 2
Source: International Financial Statistics, IMF
Log Scale
Long-run trend appreciationof McKinnon and Ohno
No apparent trend inthe mid- to late 90s
100
200
300
400
26
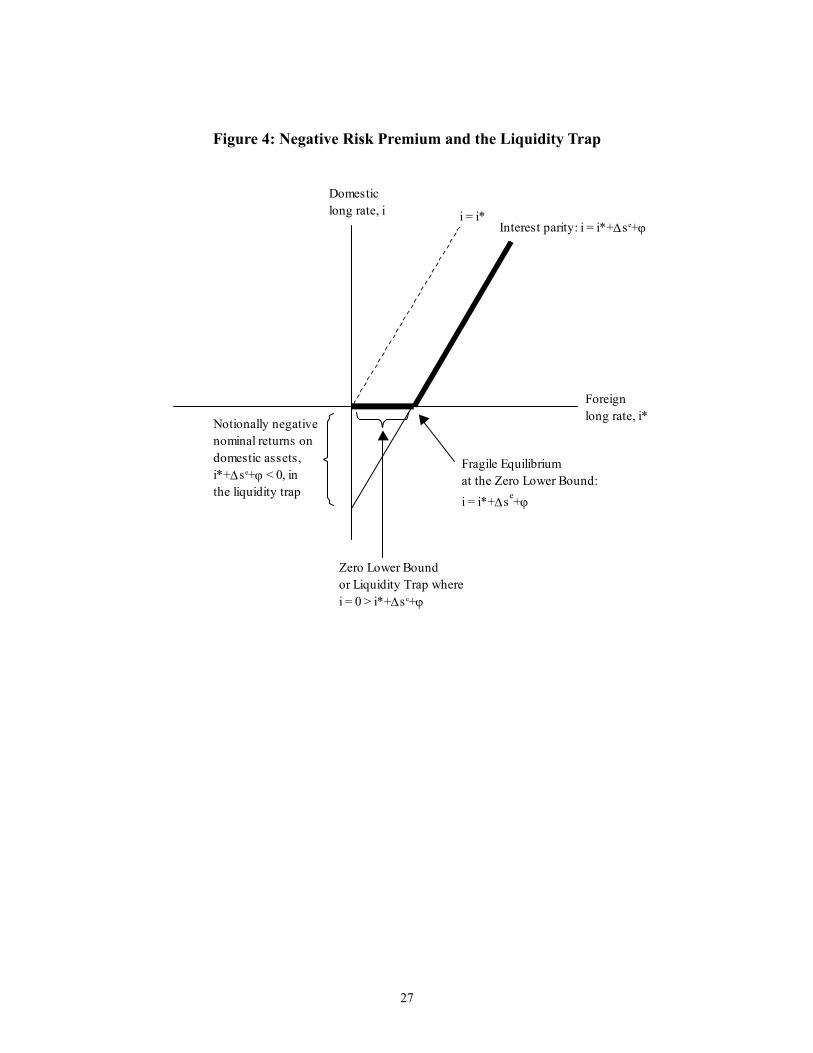
Figure 4: Negative Risk Premium and the Liquidity Trap
Foreignlong rate, i*
Domesticlong rate, i
Fragile Equilibriumat the Zero Lower Bound:i = i*+∆se+ϕ
i = i*Interest parity: i = i*+∆se+ϕ
Zero Lower Boundor Liquidity Trap wherei = 0 > i*+∆se+ϕ
Notionally negativenominal returns on domestic assets,i*+∆se+ϕ < 0, in the liquidity trap
27
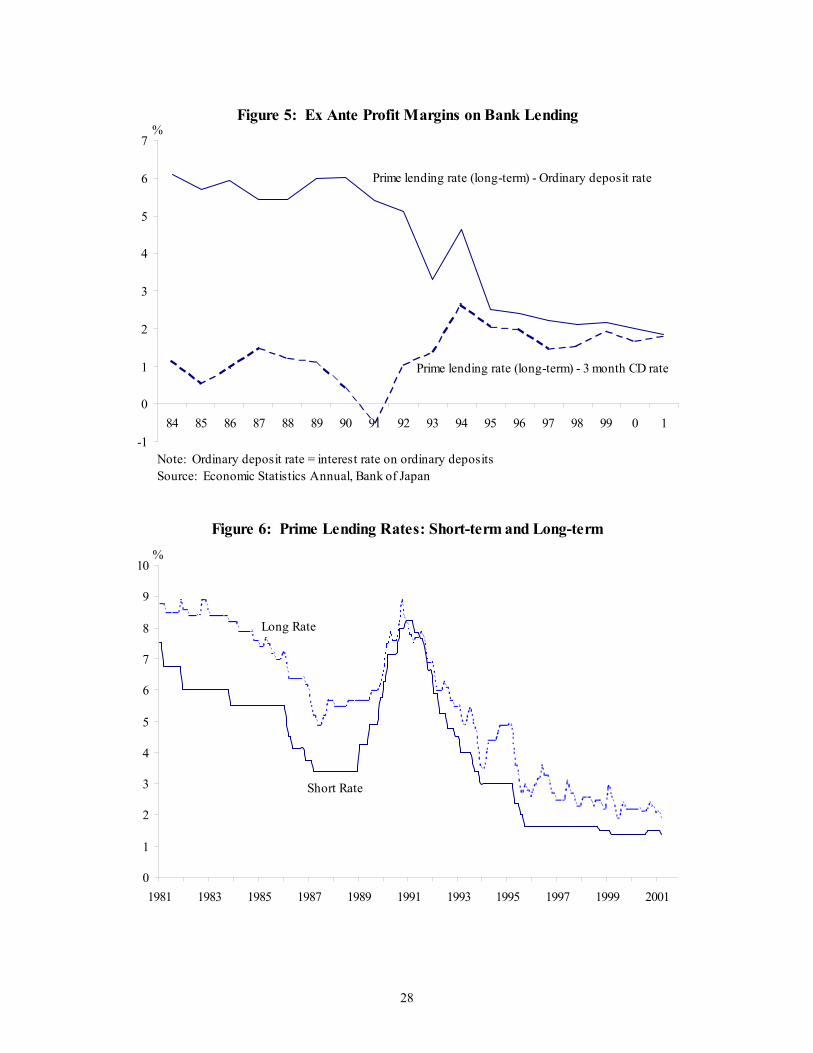
Figure 5: Ex Ante Profit Margins on Bank Lending
-1
0
1
2
3
4
5
6
7
84 85 86 87 88 89 90 91 92 93 94 95 96 97 98 99 0 1
%
Prime lending rate (long-term) - Ordinary deposit rate
Prime lending rate (long-term) - 3 month CD rate
Note: Ordinary deposit rate = interest rate on ordinary depositsSource: Economic Statistics Annual, Bank of Japan
Figure 6: Prime Lending Rates: Short-term and Long-term
0
1
2
3
4
5
6
7
8
9
10
1981 1983 1985 1987 1989 1991 1993 1995 1997 1999 2001
%
Short Rate
Long Rate
28

Figure 7a: Interest margin on lending, expenses and credit costs
-4
-3
-2
-1
0
1
2
3
82 83 84 85 86 87 88 89 90 91 92 93 94 95 96 97 98 99 0
(1)
(2)
(3)
(1) Interest margin on lending = yield on lending - average rate on banks' interest-bearing liabilities(2) Expense ratio = general and administrative expenses/balance on interest-earning assets(3) Realized credit cost = disposal of NPLs/average outstanding amount of loans
%
Figure 7b: Ex post profit margins on bank lending
-3
-2
-1
0
1
2
3
82 83 84 85 86 87 88 89 90 91 92 93 94 95 96 97 98 99 0
(1) Interest margin on lending net of general and administrative expenses(2) Interest margin on lending net of realized credit costs(3) Interest margin on lending net of general expenses and realized credit costs
(1)
(2)
(3)
Source: Bank of Japan (2001)
%
29
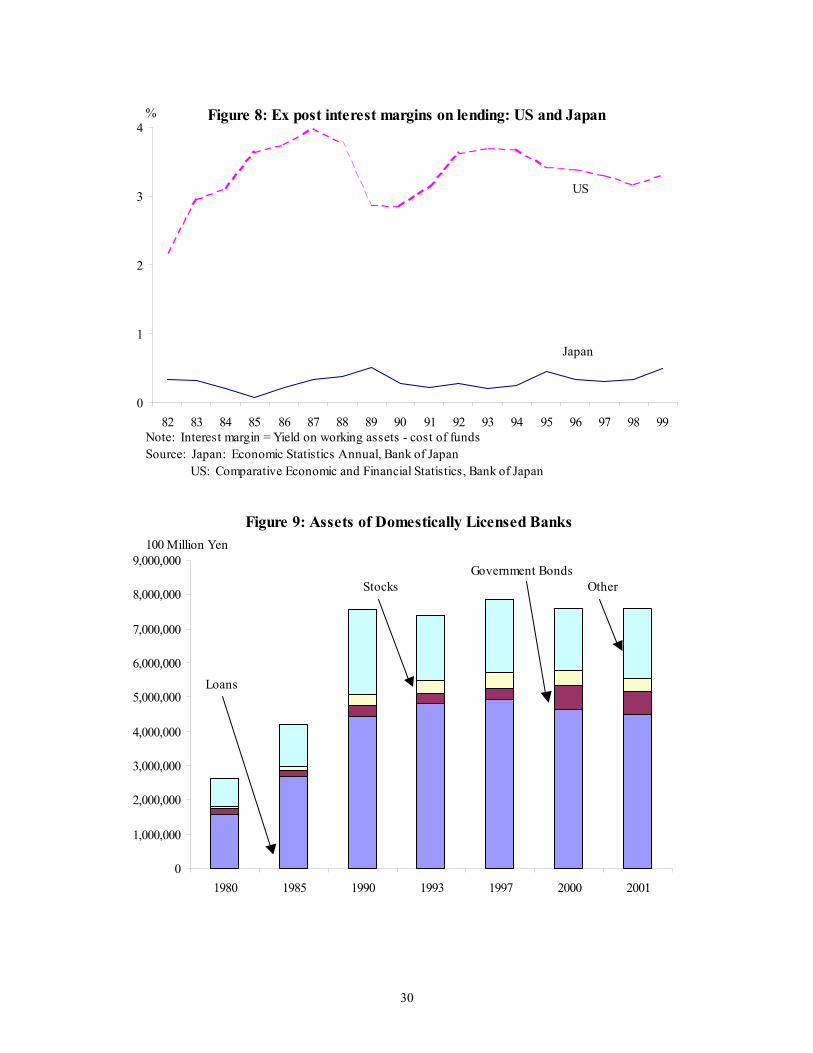
Figure 8: Ex post interest margins on lending: US and Japan
0
1
2
3
4
82 83 84 85 86 87 88 89 90 91 92 93 94 95 96 97 98 99
US
Japan
Note: Interest margin = Yield on working assets - cost of fundsSource: Japan: Economic Statistics Annual, Bank of Japan US: Comparative Economic and Financial Statistics, Bank of Japan
%
Figure 9: Assets of Domestically Licensed Banks
0
1,000,000
2,000,000
3,000,000
4,000,000
5,000,000
6,000,000
7,000,000
8,000,000
9,000,000
1980 1985 1990 1993 1997 2000 2001
100 Million Yen
Loans
Government BondsStocks Other
30
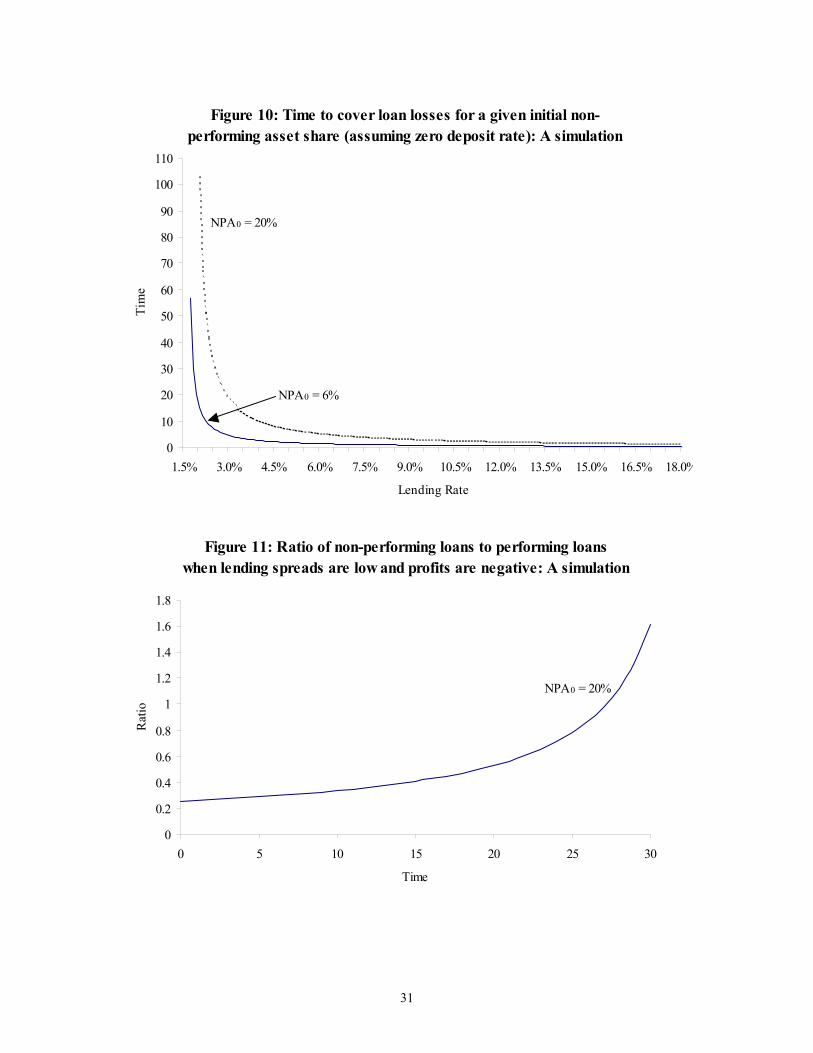
Figure 10: Time to cover loan losses for a given initial non-performing asset share (assuming zero deposit rate): A simulation
0
10
20
30
40
50
60
70
80
90
100
110
1.5% 3.0% 4.5% 6.0% 7.5% 9.0% 10.5% 12.0% 13.5% 15.0% 16.5% 18.0%
Lending Rate
Tim
e
NPA0 = 20%
NPA0 = 6%
Figure 11: Ratio of non-performing loans to performing loanswhen lending spreads are low and profits are negative: A simulation
0
0.2
0.4
0.6
0.8
1
1.2
1.4
1.6
1.8
0 5 10 15 20 25 30
Time
Rat
io
NPA0 = 20%
31

Figure 12: Lending Rates: Prime Rates, Government Financial Institutions Rates and Fiscal Loan Funds Rate
0
1
2
3
4
5
6
7
8
9
10
89 90 91 92 93 94 95 96 97 98 99 0 1 2
%
Source: Financial and Economic Statistics Monthly, Bank of Japan
Prime Long Rate
Govt Financial Institution rates
Fiscal Loan Funds rate
Figure 13: Housing Loan Rates: City Banks (middle rate) and Housing Loan Corporation
0
1
2
3
4
5
6
7
8
9
10
89 90 91 92 93 94 95 96 97 98 99 0 1 2
%
City Banks
Prime Long Rate
Housing Loan Corporation
Source: Financial and Economic Statistics Monthly, Bank of Japan
32
Top Related