


Languages
Pages
Legal

Table of Contents
UNITED STATESSECURITIES AND EXCHANGE COMMISSION
Washington, D.C. 20549FORM 10-K
(Mark One) x ANNUAL REPORT PURSUANT TO SECTION 13 OR 15(d) OF THE SECURITIES EXCHANGE ACT OF 1934
For the fiscal year ended February 2, 2019or
o TRANSITION REPORT PURSUANT TO SECTION 13 OR 15(d) OF THE SECURITIES EXCHANGE ACT OF 1934For the transition period from ______________ to ________________
Commission File Number: 001-15274
J. C. PENNEY COMPANY, INC. (Exact name of registrant as specified in its charter)
Delaware 26-0037077(State or other jurisdiction of incorporation or organization) (I.R.S. Employer Identification No.)
6501 Legacy Drive, Plano, Texas 75024-3698 (Address of principal executive offices) (Zip Code) (972) 431-1000 (Registrant's telephone number, including area code) Securities registered pursuant to Section 12(b) of the Act:
Title of each class Name of each exchange on which registered
Common Stock of 50 cents par value New York Stock Exchange
Preferred Stock Purchase Rights New York Stock Exchange
Securities registered pursuant to Section 12(g) of the Act: None (Title of class)
Indicate by check mark if the registrant is a well-known seasoned issuer, as defined in Rule 405 of the Securities Act. Yes o No xIndicate by check mark if the registrant is not required to file reports pursuant to Section 13 or 15(d) of the Act. Yes o No x Indicate by check mark whether the registrant (1) has filed all reports required to be filed by Section 13 or 15(d) of the Securities Exchange Act of 1934 during the preceding 12 months (or for such shorter period that theregistrant was required to file such reports), and (2) has been subject to such filing requirements for the past 90 days. Yes x No o Indicate by check mark whether the registrant has submitted electronically every Interactive Data File required to be submitted pursuant to Rule 405 of Regulation S-T (§ 232.405 of this chapter) during the preceding 12 months(or for such shorter period that the registrant was required to submit such files). Yes x No oIndicate by check mark if disclosure of delinquent filers pursuant to Item 405 of Regulation S-K (§ 229.405 of this chapter) is not contained herein, and will not be contained, to the best of registrant’s knowledge, in definitiveproxy or information statements incorporated by reference in Part III of this Form 10-K or any amendment to this Form 10-K. xIndicate by check mark whether the registrant is a large accelerated filer, an accelerated filer, a non-accelerated filer, a smaller reporting company, or emerging growth company. See the definitions of “large accelerated filer,”“accelerated filer,” “smaller reporting company,” and “emerging growth company” in Rule 12b-2 of the Exchange Act.
Large accelerated filer x Accelerated filer oNon-accelerated filer o Smaller reporting company o
Emerging growth company o
If an emerging growth company, indicate by check mark if the registrant has elected not to use the extended transition period for complying with any new or revised financial accounting standards provided pursuant to Section13(a) of the Exchange Act. oIndicate by check mark whether the registrant is a shell company (as defined in Rule 12b-2 of the Exchange Act). Yes o No x State the aggregate market value of the voting and non-voting common equity held by non-affiliates computed by reference to the price at which the common equity was last sold, or the average bid and asked price of suchcommon equity, as of the last business day of the registrant’s most recently completed second fiscal quarter (August 4, 2018). $747,082,556 Indicate the number of shares outstanding of each of the registrant's classes of common stock, as of the latest practicable date.316,351,556 shares of Common Stock of 50 cents par value, as of March 15, 2019.
DOCUMENTS INCORPORATED BY REFERENCEDocuments from which portions are incorporated by reference Parts of the Form 10-K into which incorporated
J. C. Penney Company, Inc. 2019 Proxy Statement Part III
Table of Contents
INDEX
PagePart I Item 1. Business 3 Item 1A. Risk Factors 6 Item 1B. Unresolved Staff Comments 17 Item 2. Properties 18 Item 3. Legal Proceedings 19 Item 4. Mine Safety Disclosures 19Part II Item 5. Market for Registrant’s Common Equity, Related Stockholder Matters and Issuer Purchases of Equity Securities 20 Item 6. Selected Financial Data 22 Item 7. Management’s Discussion and Analysis of Financial Condition and Results of Operations 24 Item 7A. Quantitative and Qualitative Disclosures about Market Risk 44 Item 8. Financial Statements and Supplementary Data 44 Item 9. Changes in and Disagreements with Accountants on Accounting and Financial Disclosure 44 Item 9A. Controls and Procedures 44 Item 9B. Other Information 47Part III Item 10. Directors, Executive Officers and Corporate Governance 47 Item 11. Executive Compensation 47 Item 12. Security Ownership of Certain Beneficial Owners and Management and Related Stockholder Matters 47 Item 13. Certain Relationships and Related Transactions, and Director Independence 47 Item 14. Principal Accounting Fees and Services 48Part IV Item 15. Exhibits, Financial Statement Schedules 48 Item 16. Form 10-K Summary 54 Signatures 55 Index to Consolidated Financial Statements 57
2
Table of Contents
PART I
Item 1. Business
Business Overview
J. C. Penney Company, Inc. is a holding company whose principal operating subsidiary is J. C. Penney Corporation, Inc. (JCP). JCP was incorporated in Delaware in 1924, andJ. C. Penney Company, Inc. was incorporated in Delaware in 2002, when the holding company structure was implemented. The new holding company assumed the name J. C.Penney Company, Inc. (Company). The holding company has no independent assets or operations, and no direct subsidiaries other than JCP. Common stock of the Company ispublicly traded under the symbol “JCP” on the New York Stock Exchange. The Company is a co-obligor (or guarantor, as appropriate) regarding the payment of principal andinterest on JCP’s outstanding debt securities. The guarantee by the Company of certain of JCP’s outstanding debt securities is full and unconditional. The holding company andits consolidated subsidiaries, including JCP, are collectively referred to in this Annual Report on Form 10-K as “we,” “us,” “our,” “ourselves,” “Company” or “JCPenney.”
Since our founding by James Cash Penney in 1902, we have grown to be a major retailer, operating 864 department stores in 49 states and Puerto Rico as of February 2, 2019.Our fiscal year ends on the Saturday closest to January 31. Unless otherwise stated, references to years in this report relate to fiscal years, rather than to calendar years. Fiscalyear 2018 ended on February 2, 2019; fiscal year 2017 ended on February 3, 2018; and fiscal year 2016 ended on January 28, 2017. Fiscal years 2018 and 2016 consisted of 52weeks and fiscal year 2017 consisted of 53 weeks.
Our business consists of selling merchandise and services to consumers through our department stores and our website at jcpenney.com, which utilizes fully optimizedapplications for desktop, mobile and tablet devices. Our department stores and website generally serve the same type of customers, our website offers virtually the same mix ofmerchandise as our store assortment plus other extended categories that are not offered in store, and our department stores generally accept returns from sales made in storesand via our website. We fulfill online customer purchases by direct shipment to the customer from our distribution facilities and stores or from our suppliers' warehouses and byin store customer pick up. We primarily sell family apparel and footwear, accessories, fine and fashion jewelry, beauty products through Sephora inside JCPenney, and homefurnishings. In addition, our department stores provide our customers with services such as styling salon, optical, portrait photography, and custom decorating.
Based on how we categorized our divisions in 2018, our merchandise mix of total net sales over the last three years was as follows:
2018 2017 2016Women’s apparel 22 % 22 % 23 %Men’s apparel and accessories 21 % 21 % 21 %Home 14 % 15 % 13 %Women’s accessories, including Sephora 13 % 13 % 13 %Children’s, including toys 9 % 9 % 10 %Footwear and handbags 8 % 8 % 8 %Jewelry 7 % 6 % 6 %Services and other 6 % 6 % 6 % 100 % 100 % 100 %
Competition and Seasonality
The business of selling merchandise and services is highly competitive. We are one of the largest department store and e-commerce retailers in the United States, and we havenumerous competitors, as further described in Item 1A, Risk Factors. Many factors enter into the competition for the consumer’s patronage, including merchandise assortment,advertising, price, quality, service, location, shipping times and cost, online and mobile user experience, reputation, credit availability, customer loyalty, availability of in-storeservices such as styling salon, optical, portrait photography and custom decorating, and the ability to offer personalized customer experiences. Our annual earnings depend to agreat extent on the results of operations for the last quarter of the fiscal year, which includes the holiday season, when a significant portion of our sales and profits are recorded.
3
Table of Contents
Trademarks
The JCPenney®, JCP®, Liz Claiborne®, Claiborne®, Okie Dokie®, Worthington®, a.n.a®, St. John’s Bay®, The Original Arizona Jean Company®, Ambrielle®, Decree®,Stafford®, J. Ferrar®, Xersion®, Belle + Sky®, Total Girl®, monet®, JCPenney Home®, Studio JCP Home™, Home Collection by JCPenney™, Made for Life™, Sleep Chic®,Home Expressions® and Cooks JCPenney Home® trademarks, as well as certain other trademarks, have been registered, or are the subject of pending trademark applicationswith the United States Patent and Trademark Office and with the registries of many foreign countries and/or are protected by common law. We consider our marks and theaccompanying name recognition to be valuable to our business.
Website Availability
We maintain an Internet website at www.jcpenney.com and make available free of charge through this website our annual reports on Form 10-K, quarterly reports on Form 10-Q, current reports on Form 8-K and all related amendments to those reports, as soon as reasonably practicable after the materials are electronically filed with or furnished to theSecurities and Exchange Commission. In addition, our website provides press releases, access to webcasts of management presentations and other materials useful in evaluatingour Company.
Suppliers
We have a diversified supplier base, both domestic and foreign, and are not dependent to any significant degree on any single supplier. We purchase our merchandise fromapproximately 2,900 domestic and foreign suppliers, many of whom have done business with us for many years. In addition to our Plano, Texas home office, we, through ourpurchasing subsidiary, maintained buying and quality assurance offices in 9 foreign countries as of February 2, 2019.
Employment
The Company and its consolidated subsidiaries employed approximately 95,000 full-time and part-time employees as of February 2, 2019.
Environmental Matters
Environmental protection requirements did not have a material effect upon our operations during 2018. It is possible that compliance with such requirements (including any newrequirements) would lengthen lead time in expansion or renovation plans and increase construction costs, and therefore operating costs, due in part to the expense and timerequired to conduct environmental and ecological studies and any required remediation.
As of February 2, 2019, we estimated our total potential environmental liabilities to be $19 million and recorded our estimate in Other liabilities in the Consolidated BalanceSheet as of that date. This estimate covered potential liabilities primarily related to underground storage tanks and remediation of environmental conditions involving ourformer drugstore locations. We continue to assess required remediation and the adequacy of environmental reserves as new information becomes available and knownconditions are further delineated. If we were to incur losses at the estimated amount, we do not believe that such losses would have a material effect on our financial condition,results of operations or liquidity.
Executive Officers of the Registrant
The following is a list, as of March 15, 2019, of the names and ages of the executive officers of J. C. Penney Company, Inc. and of the offices and other positions held by eachsuch person with the Company. These officers hold identical positions with JCP. There is no family relationship between any of the named persons.
4
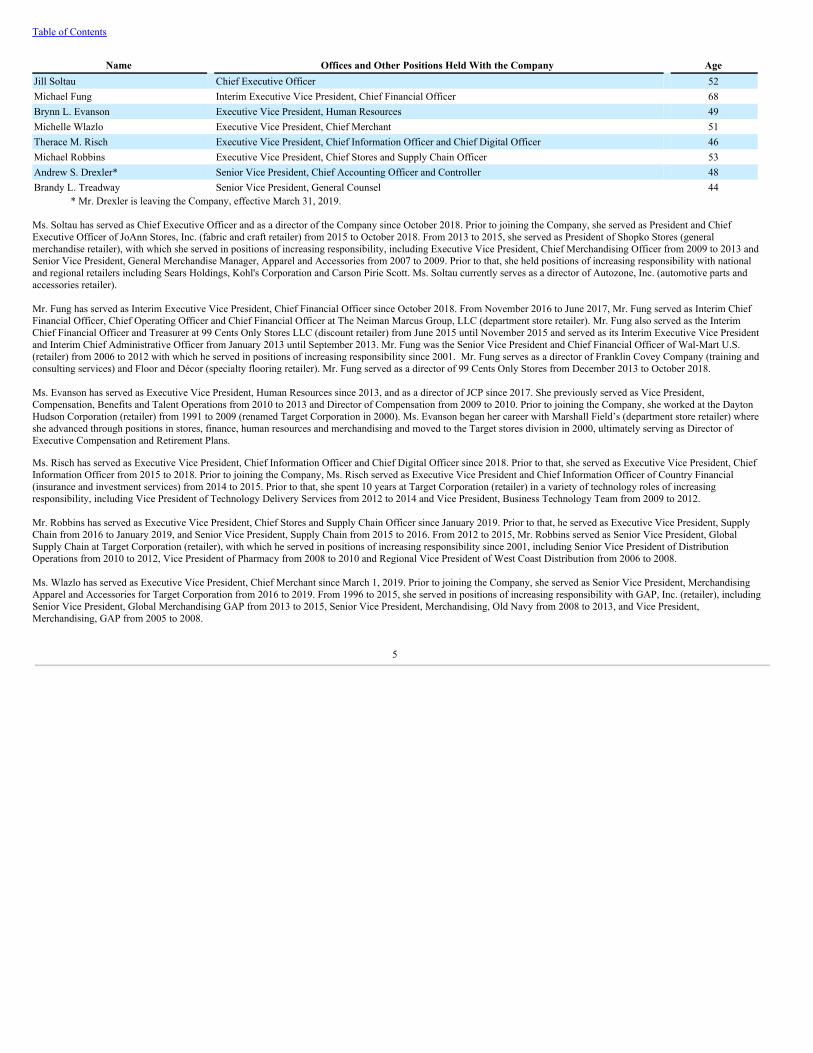
Table of Contents
Name Offices and Other Positions Held With the Company AgeJill Soltau Chief Executive Officer 52Michael Fung Interim Executive Vice President, Chief Financial Officer 68Brynn L. Evanson Executive Vice President, Human Resources 49Michelle Wlazlo Executive Vice President, Chief Merchant 51Therace M. Risch Executive Vice President, Chief Information Officer and Chief Digital Officer 46Michael Robbins Executive Vice President, Chief Stores and Supply Chain Officer 53Andrew S. Drexler* Senior Vice President, Chief Accounting Officer and Controller 48Brandy L. Treadway Senior Vice President, General Counsel 44
* Mr. Drexler is leaving the Company, effective March 31, 2019.
Ms. Soltau has served as Chief Executive Officer and as a director of the Company since October 2018. Prior to joining the Company, she served as President and ChiefExecutive Officer of JoAnn Stores, Inc. (fabric and craft retailer) from 2015 to October 2018. From 2013 to 2015, she served as President of Shopko Stores (generalmerchandise retailer), with which she served in positions of increasing responsibility, including Executive Vice President, Chief Merchandising Officer from 2009 to 2013 andSenior Vice President, General Merchandise Manager, Apparel and Accessories from 2007 to 2009. Prior to that, she held positions of increasing responsibility with nationaland regional retailers including Sears Holdings, Kohl's Corporation and Carson Pirie Scott. Ms. Soltau currently serves as a director of Autozone, Inc. (automotive parts andaccessories retailer).
Mr. Fung has served as Interim Executive Vice President, Chief Financial Officer since October 2018. From November 2016 to June 2017, Mr. Fung served as Interim ChiefFinancial Officer, Chief Operating Officer and Chief Financial Officer at The Neiman Marcus Group, LLC (department store retailer). Mr. Fung also served as the InterimChief Financial Officer and Treasurer at 99 Cents Only Stores LLC (discount retailer) from June 2015 until November 2015 and served as its Interim Executive Vice Presidentand Interim Chief Administrative Officer from January 2013 until September 2013. Mr. Fung was the Senior Vice President and Chief Financial Officer of Wal-Mart U.S.(retailer) from 2006 to 2012 with which he served in positions of increasing responsibility since 2001. Mr. Fung serves as a director of Franklin Covey Company (training andconsulting services) and Floor and Décor (specialty flooring retailer). Mr. Fung served as a director of 99 Cents Only Stores from December 2013 to October 2018.
Ms. Evanson has served as Executive Vice President, Human Resources since 2013, and as a director of JCP since 2017. She previously served as Vice President,Compensation, Benefits and Talent Operations from 2010 to 2013 and Director of Compensation from 2009 to 2010. Prior to joining the Company, she worked at the DaytonHudson Corporation (retailer) from 1991 to 2009 (renamed Target Corporation in 2000). Ms. Evanson began her career with Marshall Field’s (department store retailer) whereshe advanced through positions in stores, finance, human resources and merchandising and moved to the Target stores division in 2000, ultimately serving as Director ofExecutive Compensation and Retirement Plans.
Ms. Risch has served as Executive Vice President, Chief Information Officer and Chief Digital Officer since 2018. Prior to that, she served as Executive Vice President, ChiefInformation Officer from 2015 to 2018. Prior to joining the Company, Ms. Risch served as Executive Vice President and Chief Information Officer of Country Financial(insurance and investment services) from 2014 to 2015. Prior to that, she spent 10 years at Target Corporation (retailer) in a variety of technology roles of increasingresponsibility, including Vice President of Technology Delivery Services from 2012 to 2014 and Vice President, Business Technology Team from 2009 to 2012.
Mr. Robbins has served as Executive Vice President, Chief Stores and Supply Chain Officer since January 2019. Prior to that, he served as Executive Vice President, SupplyChain from 2016 to January 2019, and Senior Vice President, Supply Chain from 2015 to 2016. From 2012 to 2015, Mr. Robbins served as Senior Vice President, GlobalSupply Chain at Target Corporation (retailer), with which he served in positions of increasing responsibility since 2001, including Senior Vice President of DistributionOperations from 2010 to 2012, Vice President of Pharmacy from 2008 to 2010 and Regional Vice President of West Coast Distribution from 2006 to 2008.
Ms. Wlazlo has served as Executive Vice President, Chief Merchant since March 1, 2019. Prior to joining the Company, she served as Senior Vice President, MerchandisingApparel and Accessories for Target Corporation from 2016 to 2019. From 1996 to 2015, she served in positions of increasing responsibility with GAP, Inc. (retailer), includingSenior Vice President, Global Merchandising GAP from 2013 to 2015, Senior Vice President, Merchandising, Old Navy from 2008 to 2013, and Vice President,Merchandising, GAP from 2005 to 2008.
5
Table of Contents
Mr. Drexler has served as Senior Vice President, Chief Accounting Officer and Controller since 2015. Prior to joining the Company, he served as Senior Vice President andChief Financial Officer of Giant Eagle, Inc. (grocery retailer) from 2014 to 2015. He also served as Senior Vice President, Finance, and Corporate Controller for GNCHoldings, Inc. (health and nutrition retailer) from 2011 to 2014. Prior to that, Mr. Drexler spent 11 years at Walmart Inc. in roles of increasing responsibility, including VicePresident of Finance for the information systems division from 2010 to 2011. Earlier in his career, he held a variety of roles with PricewaterhouseCoopers, LLP (accountingfirm). Mr. Drexler is a certified public accountant.
Ms. Treadway has served as Senior Vice President, General Counsel since August 2017. She previously served as Vice President, interim General Counsel from June 2017 toAugust 2017, Vice President, Associate General Counsel from 2016 to June 2017, Assistant General Counsel from 2014 to 2016, Senior Managing Counsel from 2012 to 2014,and Senior Counsel from 2011 to 2012. Prior to joining the Company, Ms. Treadway was an associate at Weil, Gotshal & Manges, LLP (law firm) from 2002 to 2011.
Item 1A. Risk Factors
The following risk factors should be read carefully in connection with evaluating our business and the forward-looking information contained in this Annual Report on Form10-K. Any of the following risks could materially adversely affect our business, operating results, financial condition and the actual outcome of matters as to which forward-looking statements are made in this Annual Report on Form 10-K.
Our ability to achieve profitable growth is subject to both the risks affecting our business generally and the inherent difficulties associated with implementing our strategicplan.
As we position the Company for long-term growth, it may take longer than expected to achieve our objectives, and actual results may be materially less than planned. Ourability to improve our operating results depends upon a significant number of factors, some of which are beyond our control, including:
• customer response to our marketing and merchandisestrategies;
• our ability to achieve profitable sales and to make adjustments in response to changingconditions;
• our ability to respond to competitive pressures in ourindustry;
• our ability to effectively manageinventory;
• the success of our omnichannelstrategy;
• our ability to gather accurate and relevant data and effectively utilize that data in our strategic planning and decisionmaking;
• our ability to benefit from investments in ourstores;
• our ability to respond to any unanticipated changes in expected cash flows, liquidity and cash needs, including our ability to obtain any additional financing or otherliquidity enhancing transactions, if and when needed;
• our ability to achieve positive cashflow;
• our ability to access an adequate and uninterrupted supply of merchandise from suppliers at expected levels and on acceptableterms;
• changes to the regulatory environment in which our business operates;and
• general economicconditions.
There is no assurance that our marketing, merchandising and omnichannel strategies, or any future adjustments to our strategies, will improve our operating results.
6
Table of Contents
We operate in a highly competitive industry, which could adversely impact our sales and profitability.
The retail industry is highly competitive, with few barriers to entry. We compete with many other local, regional and national retailers for customers, employees, locations,merchandise, services and other important aspects of our business. Those competitors include other department stores, discounters, home furnishing stores, specialty retailers,wholesale clubs, direct-to-consumer businesses, including those on the Internet, and other forms of retail commerce. Some competitors are larger than JCPenney, and/or havegreater financial resources available to them, and, as a result, may be able to devote greater resources to sourcing, promoting, selling their products, updating their storeenvironment and updating their technology. Competition is characterized by many factors, including merchandise assortment, advertising, price, quality, service, location,reputation, shipping times and cost, online and mobile user experience, credit availability, customer loyalty, availability of in-store services, such as styling salon, optical,portrait photography and custom decorating, and the ability to offer personalized customer experiences. We have experienced, and anticipate that we will continue to experiencefor at least the foreseeable future, significant competition from our competitors. The performance of competitors as well as changes in their pricing and promotional policies,marketing activities, customer loyalty programs, new strategic partnerships, availability of in-store services, new store openings, store renovations, launches of Internet websitesor mobile platforms, brand launches and other merchandise and operational strategies could cause us to have lower sales, lower merchandise margin and/or higher operatingexpenses such as marketing costs and other selling, general and administrative expenses, which in turn could have an adverse impact on our profitability.
Our sales and operating results depend on our ability to develop merchandise offerings that resonate with our existing customers and help to attract new customers.
Our sales and operating results depend in part on our ability to predict and respond to changes in fashion trends and customer preferences in a timely manner by consistentlyoffering stylish, quality merchandise assortments at competitive prices. We continuously assess emerging styles and trends and focus on developing a merchandise assortmentto meet customer preferences. There is no assurance that these efforts will be successful or that we will be able to satisfy constantly changing customer demands. To the extentour decisions regarding our merchandise differ from our customers’ preferences, we may be faced with reduced sales and excess inventories for some products and/or missedopportunities for others. Any sustained failure to identify and respond to emerging trends in lifestyle and customer preferences and buying trends could have an adverse impacton our business. In addition, merchandise misjudgments may adversely impact the perception or reputation of our Company, which could result in declines in customer loyaltyand vendor relationship issues, and ultimately have a material adverse effect on our business, financial condition and results of operations.
We may also seek to expand into new lines of business from time to time. There is no assurance that these efforts will be successful. As we devote time and resources to newlines of business, management’s attention and resources may be diverted from existing business activities. Further, if new lines of business are not as successful as we planned,then we risk damaging our overall business results. In addition, we may seek to expand our merchandise offerings into new product categories. Moving into new lines ofbusiness and expanding our merchandise offerings may carry new or additional risks beyond those typically associated with our traditional apparel and home furnishingsbusinesses, including potential reputational harm resulting from actions by unaffiliated third-parties that we may use to assist us in providing goods or services. We may not beable to develop new lines of business in a manner that improves our operating results or address or mitigate the risks associated with new product categories and new lines ofbusiness, and may therefore be forced to close the new lines of business or reduce our expanded merchandise offerings, which may damage our reputation and negativelyimpact our operating results.
7
Table of Contents
Our results may be negatively impacted if customers do not maintain their favorable perception of our Company and our private brand merchandise.
Maintaining and continually enhancing the value of our Company and our private brand merchandise is important to the success of our business. The value of our privatebrands is based in large part on the degree to which customers perceive and react to them. The value of our private brands could diminish significantly due to a number offactors, including customer perception that we have acted in an irresponsible manner in sourcing our private brand merchandise, adverse publicity about our private brandmerchandise, our failure to maintain the quality of our private brand products, the failure of our private brand merchandise to deliver consistently good value to the customer, orthe failure to protect the image associated with our private brands. The growing use of social and digital media by customers, us, and third parties increases the speed and extentthat information or misinformation and opinions can be shared. Negative posts or comments about us, our private brands, or any of our merchandise on social or digital mediacould seriously damage our reputation. If we do not maintain the favorable perception of our Company and our private brand merchandise or we experience a reduction in thelevel of private brand sales, our business results could be negatively impacted.
Our ability to increase sales and store productivity is largely dependent upon our ability to increase customer traffic and conversion.
Customer traffic depends upon our ability to successfully market compelling merchandise assortments, present an appealing shopping environment and experience tocustomers, and attract customers to our stores through omnichannel initiatives such as buy-online-pickup-in-store programs. Our strategies focus on increasing customer trafficand improving conversion in our stores and online; however, there can be no assurance that our efforts will be successful or will result in increased sales or margins. Further,costs to drive online traffic may be higher than anticipated, which could result in lower margins, and actions to drive online traffic may not deliver anticipated results. Inaddition, external events outside of our control, including store closings by our competitors, pandemics, terrorist threats, domestic conflicts and civil unrest, may influencecustomers' decisions to visit malls or might otherwise cause customers to avoid public places. There is no assurance that we will be able to reverse any decline in traffic or thatincreases in Internet sales will offset any decline in store traffic. We may need to respond to any declines in customer traffic or conversion rates by increasing markdowns orpromotions to attract customers, which could adversely impact our operating results and cash flows from operating activities. In addition, the challenge of declining store trafficalong with the growth of digital shopping channels and its diversion of sales from brick-and-mortar stores could lead to store closures and/or asset impairment charges, whichcould adversely impact our operating results, financial position and cash flows.
If we are unable to manage our inventory effectively, our merchandise margins could be adversely affected.
Our profitability depends upon our ability to manage appropriate inventory levels and respond quickly to shifts in consumer demand patterns. We must properly execute ourinventory management strategies by appropriately allocating merchandise among our stores and online, timely and efficiently distributing inventory to stores, maintaining anappropriate mix and level of inventory in stores and online, adjusting our merchandise mix between our private and exclusive brands and national brands, appropriatelychanging the allocation of floor space of stores among product categories to respond to customer demand and effectively managing pricing and markdowns. If we overestimatecustomer demand for our merchandise, we will likely need to record inventory markdowns and sell the excess inventory at clearance prices which would negatively impact ourmerchandise margins and operating results. If we underestimate customer demand for our merchandise, we may experience inventory shortages which may result in missed salesopportunities and have a negative impact on customer loyalty. In addition, although we have various processes and systems to help protect against loss or theft of our inventory,higher than expected levels of lost or stolen inventory (called “shrinkage”) could result in write-offs and lost sales, which could adversely impact our profitability.
We must protect against security breaches or other unauthorized disclosures of confidential data about our customers as well as about our employees and other thirdparties.
As part of our normal operations, we and third-party service providers with whom we contract receive and maintain information about our customers (including credit/debitcard information), our employees and other third parties. Confidential data must at all times be protected against security breaches or other unauthorized disclosure. We have,and require our third-party service providers to have, administrative, physical and technical safeguards and procedures in place to protect the security, confidentiality, integrityand availability of such information and to protect such information against unauthorized access, disclosure or acquisition. Despite our safeguards and security processes andprocedures, there is no assurance that all of our systems and processes, or those of our third-party service providers, are free from vulnerability to security breaches, inadvertentdata disclosure or acquisition by third parties. Further, because the methods used to obtain unauthorized access change
8
Table of Contents
frequently and may not be immediately detected, we may be unable to anticipate these methods or promptly implement safeguards.
Additionally, as the regulatory environment related to information security, data collection, and use and privacy becomes increasingly rigorous, with new and constantlychanging requirements applicable to our business, compliance with those requirements could also result in additional costs. For example, California recently passed theCalifornia Consumer Privacy Act of 2018 (the “CCPA”), which goes into effect in January 2020 and provides broad rights to California consumers with respect to the collectionand use of their information by businesses. The CCPA expands the privacy rights of California citizens and as a result, we may need to process enhancements and commitresources in support of compliance with California’s regulatory requirements. Any failure to adhere to the requirements of the CCPA and other evolving laws and regulations inthis area, or to protect confidential data about our business or our customers, employees or other third parties, could result in financial penalties and legal liability and couldmaterially damage our brand and reputation, as well as result in significant expenses and disruptions to our operations, and loss of customer confidence, any of which couldhave a material adverse impact on our business and results of operations. We could also be subject to government enforcement actions and private litigation as a result of anysuch failure.
The failure to retain, attract and motivate our employees, including employees in key positions, could have an adverse impact on our results of operations.
Our results depend on the contributions of our employees, including our senior management team and other key employees. This depends to a great extent on our ability toretain, attract and motivate talented employees throughout the organization, many of whom, particularly in the stores, are in entry level or part-time positions, which havehistorically had high rates of turnover. We currently operate with significantly fewer individuals than we have in the past who have assumed additional duties andresponsibilities, which could have an adverse impact on our operating performance and efficiency. Negative media reports regarding the Company or the retail industry ingeneral, as well as uncertainty due to store closings, could also have an adverse impact on our ability to attract, retain and motivate our employees. If we are unable to retain,attract and motivate talented employees with the appropriate skill sets, we may not achieve our objectives and our results of operations could be adversely impacted. Our abilityto meet our changing labor needs while controlling our costs is also subject to external factors such as unemployment levels, competing wages, potential union organizingefforts and government regulation. An inability to provide wages and/or benefits that are competitive within the markets in which we operate could adversely affect our ability toretain and attract employees. In addition, the loss of one or more of our key personnel or the inability to effectively identify a suitable successor to a key role in our seniormanagement could have a material adverse effect on our business.
If we are unable to successfully develop and maintain a relevant and reliable omnichannel experience for our customers, our sales, results of operations and reputationcould be adversely affected.
We believe it is critical that we deliver a superior omnichannel shopping experience for our customers through the integration of our store and digital shopping channels.Omnichannel retailing is rapidly evolving and we must anticipate and meet changing customer expectations. Our omnichannel strategies include our ship-from-store and buy-online-pickup-in-store programs. In addition, we continue to explore ways to enhance our customers’ omnichannel shopping experience, including through investments in ITsystems, operational changes and developing a more customer-friendly user experience. Our competitors are also investing in omnichannel initiatives, some of which may bemore successful than our initiatives. For example, online and other competitors have placed an emphasis on delivery services, with customers increasingly seeking faster,guaranteed delivery times and low-price or free shipping. There is no assurance that we will be able to maintain an ability to be competitive on delivery times and delivery costs,which is dependent on many factors. If the implementation of our omnichannel strategies is not successful or does not meet customer expectations, or we do not realize a returnon our omnichannel investments, our reputation and operating results may be adversely affected.
Disruptions in our Internet website or mobile applications, or our inability to successfully execute our online strategies, could have an adverse impact on our sales andresults of operations.
We sell merchandise over the Internet through our website, www.jcpenney.com, and through mobile applications for smart phones and tablets. Our Internet operations aresubject to numerous risks, including rapid technological change and the implementation of new systems and platforms; liability for online and mobile content; violations of stateor federal laws, including those relating to online and mobile privacy and intellectual property rights; credit card fraud; problems associated with the operation, security andavailability of our website, mobile applications and related support systems; computer malware; telecommunications failures; electronic break-ins and similar disruptions; andthe allocation of inventory between our online operations and department stores. The failure of our website or mobile applications to perform as expected could result
9
Table of Contents
in disruptions and costs to our operations and make it more difficult for customers to purchase merchandise online. In addition, our inability to successfully develop andmaintain the necessary technological interfaces for our customers to purchase merchandise through our website and mobile applications, including user friendly softwareapplications for smart phones and tablets, could result in the loss of Internet sales and have an adverse impact on our results of operations.
Our operations are dependent on information technology systems; disruptions in those systems or increased costs relating to their implementation could have an adverseimpact on our results of operations.
Our operations are dependent upon the integrity, security and consistent operation of various systems and data centers, including the point-of-sale systems in the stores, ourInternet website and mobile applications, data centers that process transactions, communication systems and various software applications used throughout our Company totrack inventory flow, process transactions, generate performance and financial reports and administer payroll and benefit plans.
We have implemented several applications and systems from third party vendors, providers and licensors to simplify our processes and reduce our use of customized existinglegacy systems and expect to place additional applications and systems into operation in the future. Any continued reliance on existing legacy systems may result in extendedsystem outages due to the difficulty in recovering those systems as well as inefficiencies in our business workflow due to the complexity and high levels of customizationinherent in such systems. Implementing new applications and systems carries substantial risk, including implementation delays, cost overruns, disruption of operations,potential loss of data or information, lower customer satisfaction resulting in lost customers or sales, inability to deliver merchandise to our stores or our customers, the potentialinability to meet reporting requirements and unintentional security vulnerabilities. There can be no assurances that we will successfully launch the new applications and systemsas planned, that the new applications and systems will perform as expected or that the new applications and systems will be implemented without disruptions to our operations,any of which may cause critical information upon which we rely to be delayed, unreliable, corrupted, insufficient or inaccessible.
We also outsource various information technology functions to third party service providers and may outsource other functions in the future. We rely on those third partyservice providers to provide services on a timely and effective basis and their failure to perform as expected or as required by contract could result in disruptions and costs to ouroperations.
Our vendors are also highly dependent on the use of information technology systems. Major disruptions in their information technology systems could result in their inability tocommunicate with us or otherwise to process our transactions or information, their inability to perform required functions, or in the loss or corruption of our information, anyand all of which could result in disruptions to our operations. Our vendors are responsible for having safeguards and procedures in place to protect the confidentiality, integrityand security of our information, and to protect our information and systems against unauthorized access, disclosure or acquisition. Any failure in their systems to operate or intheir ability to protect our information or systems could have a material adverse impact on our business and results of operations.
We have insourced, and may continue to insource, certain business functions from third party vendors and may seek to relocate certain business functions to internationallocations in an attempt to achieve additional efficiencies, both of which subject us to risks, including disruptions in our business.
We have insourced certain business functions and may also need to continue to insource other aspects of our business in the future in order to effectively manage our costs andstay competitive. We may also seek from time to time to relocate certain business functions to countries other than the United States to access highly skilled labor markets andfurther control costs. There is no assurance that these efforts will be successful. In addition, future regulatory developments could hinder our ability to fully realize theanticipated benefits of these actions. These actions may also cause disruptions that negatively impact our business. If we are ultimately unable to perform insourced functionsbetter than, or at least as well as, third party providers, or otherwise fully realize the anticipated benefits of these actions, our operating results could be adversely impacted.
Changes in our credit ratings may limit our access to capital markets and adversely affect our liquidity.
The credit rating agencies periodically review our capital structure and the quality and stability of our earnings. Any downgrades to our long-term credit ratings could result inreduced access to the credit and capital markets and higher interest costs on future financings. The future availability of financing will depend on a variety of factors such aseconomic and market conditions, the availability of credit and our credit ratings, as well as the possibility that lenders could develop a negative perception of us. There is noassurance that we will be able to obtain additional financing on favorable terms or at all.
10
Table of Contents
Our profitability depends on our ability to source merchandise and deliver it to our customers in a timely and cost-effective manner.
Our merchandise is sourced from a wide variety of suppliers, and our business depends on being able to find qualified suppliers and access products in a timely and efficientmanner. Inflationary pressures on commodity prices and other input costs could increase our cost of goods, and an inability to pass such cost increases on to our customers or achange in our merchandise mix as a result of such cost increases could have an adverse impact on our profitability. Additionally, the impact of economic conditions on oursuppliers cannot be predicted and our suppliers may be unable to access financing or become insolvent and thus become unable to supply us with products. Developments in taxpolicy, such as the disallowance of tax deductions for imported merchandise, the imposition of tariffs on imported merchandise, or changes to U.S. trade legislation could furtherhave a material adverse effect on our results of operations and liquidity.
Our arrangements with our suppliers and vendors may be impacted by our financial results or financial position.
Substantially all of our merchandise suppliers and vendors sell to us on open account purchase terms. There is a risk that our key suppliers and vendors could respond to anyactual or apparent decrease in or any concern with our financial results or liquidity by requiring or conditioning their sale of merchandise to us on more stringent or more costlypayment terms, such as by requiring standby letters of credit, earlier or advance payment of invoices, payment upon delivery or other assurances or credit support or bychoosing not to sell merchandise to us on a timely basis or at all. Our arrangements with our suppliers and vendors may also be impacted by media reports regarding ourfinancial position. Our need for additional liquidity could significantly increase and our supply of merchandise could be materially disrupted if a significant portion of our keysuppliers and vendors took one or more of the actions described above, which could have a material adverse effect on our sales, customer satisfaction, cash flows, liquidity andfinancial position.
Our senior secured real estate term loan credit facility and senior secured notes are secured by certain of our real property and, together with our senior secured secondpriority notes, substantially all of our personal property, and such property may be subject to foreclosure or other remedies in the event of our default. In addition, the realestate term loan credit facility and the indentures governing the senior secured notes and senior secured second priority notes contain provisions that could restrict ouroperations and our ability to obtain additional financing.
We are (i) party to a $1.688 billion senior secured term loan credit facility and (ii) the issuer of $500 million aggregate principal amount of senior secured notes. We have alsoissued $400 million aggregate principal amount of senior secured second priority notes. The senior secured term loan credit facility and the senior secured notes are secured bymortgages on certain real property of the Company and, together with the senior secured second priority notes, liens on substantially all personal property of the Company,subject to certain exclusions set forth in the security documents relating to the term loan credit facility, the senior secured notes and the senior secured second priority notes. Thereal property subject to mortgages under the term loan credit facility and the indenture governing the senior secured notes includes our distribution centers and certain of ourstores.
The credit and guaranty agreement governing the term loan credit facility and the indentures governing the senior secured notes and the senior secured second-priority notescontain operating restrictions which may impact our future alternatives by limiting, without lender consent, our ability to borrow additional funds, execute certain equityfinancings or enter into dispositions or other liquidity enhancing or strategic transactions regarding certain of our assets, including our real property. Our ability to obtainadditional or other financing or to dispose of certain assets could also be negatively impacted because a substantial portion of our assets have been restricted or pledged ascollateral for repayment of our indebtedness under the term loan credit facility, the senior secured notes and the senior secured second-priority notes.
If an event of default occurs and is continuing, our outstanding obligations under the term loan credit facility, the senior secured notes and the senior secured second-prioritynotes could be declared immediately due and payable or the lenders could foreclose on or exercise other remedies with respect to the assets securing the term loan credit facility,the senior secured notes and the senior secured second-priority notes, including, with respect to the term loan credit facility and senior secured notes, our distribution centersand certain of our stores. If an event of default occurs, there is no assurance that we would have the cash resources available to repay such accelerated obligations or refinancesuch indebtedness on commercially reasonable terms, or at all. The occurrence of any one of these events could have a material adverse effect on our business, financialcondition, results of operations and liquidity.
11
Table of Contents
Our senior secured asset-based revolving credit facility limits our borrowing capacity to the value of certain of our assets. In addition, our senior secured asset-basedrevolving credit facility is secured by certain of our personal property, and lenders may exercise remedies against the collateral in the event of our default.
We are party to a $2.35 billion senior secured asset-based revolving credit facility. Our borrowing capacity under our revolving credit facility varies according to the Company’sinventory levels, accounts receivable and credit card receivables, net of certain reserves. In the event of any material decrease in the amount of or appraised value of theseassets, our borrowing capacity would similarly decrease, which could adversely impact our business and liquidity.
Our revolving credit facility contains customary affirmative and negative covenants and certain restrictions on operations become applicable if our availability falls belowcertain thresholds. These covenants could impose significant operating and financial limitations and restrictions on us, including restrictions on our ability to enter into particulartransactions and to engage in other actions that we may believe are advisable or necessary for our business.
Our obligations under the revolving credit facility are secured by liens with respect to inventory, accounts receivable, deposit accounts and certain related collateral. In the eventof a default that is not cured or waived within any applicable cure periods, the lenders’ commitment to extend further credit under our revolving credit facility could beterminated, our outstanding obligations could become immediately due and payable, outstanding letters of credit may be required to be cash collateralized and remedies may beexercised against the collateral, which generally consists of the Company’s inventory, accounts receivable and deposit accounts and cash credited thereto. If we are unable toborrow under our revolving credit facility, we may not have the necessary cash resources for our operations and, if any event of default occurs, there is no assurance that wewould have the cash resources available to repay such accelerated obligations, refinance such indebtedness on commercially reasonable terms, or at all, or cash collateralize ourletters of credit, which would have a material adverse effect on our business, financial condition, results of operations and liquidity.
Our level of indebtedness may adversely affect our business and results of operations and may require the use of our available cash resources to meet repaymentobligations, which could reduce the cash available for other purposes.
As of February 2, 2019, we have $4.020 billion in total indebtedness and we are highly leveraged. Our level of indebtedness may limit our ability to obtain additional financing,if needed, to fund additional projects, working capital requirements, capital expenditures, debt service, and other general corporate or other obligations, as well as increase therisks to our business associated with general adverse economic and industry conditions. Our level of indebtedness may also place us at a competitive disadvantage to ourcompetitors that are not as highly leveraged. In addition, any future limitations on tax deductions for interest paid on outstanding indebtedness as a result of the Tax Cuts andJobs Act enacted in December 2017 (the “Tax Act”) could have a material adverse effect on our results of operations and liquidity.
We are required to make quarterly repayments in a principal amount equal to $10.55 million during the seven-year term of the real estate term loan credit facility, subject tocertain reductions for mandatory and optional prepayments. In addition, we are required to make prepayments of the real estate term loan credit facility with the proceeds ofcertain asset sales, insurance proceeds and excess cash flow, which could reduce the cash available for other purposes, including capital expenditures for store improvements,and could impact our ability to reinvest in other areas of our business.
There is no assurance that our internal and external sources of liquidity will at all times be sufficient for our cash requirements.
We must have sufficient sources of liquidity to fund our working capital requirements, capital improvement plans, service our outstanding indebtedness and finance investmentopportunities. The principal sources of our liquidity are funds generated from operating activities, available cash and cash equivalents, borrowings under our credit facilities,other debt financings, equity financings and sales of non-operating assets. We expect our ability to generate cash through the sale of non-operating assets to diminish as ourportfolio of non-operating assets decreases. In addition, our recent operating losses have limited our capital resources. Our ability to achieve our business and cash flow plans isbased on a number of assumptions which involve significant judgments and estimates of future performance, borrowing capacity and credit availability, which cannot at alltimes be assured. Accordingly, there is no assurance that cash flows from operations and other internal and external sources of liquidity will at all times be sufficient for our cashrequirements. If necessary, we may need to consider actions and steps to improve our cash position and mitigate any potential liquidity shortfall, such as modifying our businessplan, pursuing additional financing to the extent available, reducing capital expenditures, pursuing and evaluating other alternatives and opportunities to obtain additionalsources of liquidity and other potential actions to reduce costs. There can be no assurance that any of these actions would be successful, sufficient or available on favorableterms. Any inability to generate or obtain
12
Table of Contents
sufficient levels of liquidity to meet our cash requirements at the level and times needed could have a material adverse impact on our business and financial position.
Our ability to obtain any additional financing or any refinancing of our debt, if needed at any time, depends upon many factors, including our existing level of indebtedness andrestrictions in our debt facilities, historical business performance, financial projections, the value and sufficiency of collateral, prospects and creditworthiness, externaleconomic conditions and general liquidity in the credit and capital markets. Any additional debt, equity or equity-linked financing may require modification of our existing debtagreements, which there is no assurance would be obtainable. Any additional financing or refinancing could also be extended only at higher costs and require us to satisfy morerestrictive covenants, which could further limit or restrict our business and results of operations, or be dilutive to our stockholders.
Our use of interest rate hedging transactions could expose us to risks and financial losses that may adversely affect our financial condition, liquidity and results ofoperations.
To reduce our exposure to interest rate fluctuations, we have entered into, and in the future may enter into, interest rate swaps with various financial counterparties. The interestrate swap agreements effectively convert a portion of our variable rate interest payments to a fixed price. There can be no assurances, however, that our hedging activity will beeffective in insulating us from the risks associated with changes in interest rates. In addition, our hedging transactions may expose us to certain risks and financial losses,including, among other things:
• counterparty creditrisk;
• the risk that the duration or amount of the hedge may not match the duration or amount of the relatedliability;
• the hedging transactions may be adjusted from time to time in accordance with accounting rules to reflect changes in fair values, downward adjustments or “mark-to-market losses,” which would affect our stockholders’ equity; and
• the risk that we may not be able to meet the terms and conditions of the hedging instruments, in which case we may be required to settle the instruments prior tomaturity with cash payments that could significantly affect our liquidity.
Further, we have designated the swaps as cash flow hedges in accordance with Accounting Standards Codification Topic 815, Derivatives and Hedging. However, in the future,we may fail to qualify for hedge accounting treatment under these standards for a number of reasons, including if we fail to satisfy hedge documentation and hedge effectivenessassessment requirements or if the swaps are not highly effective. If we fail to qualify for hedge accounting treatment, losses on the swaps caused by the change in their fair valuewill be recognized as part of net income, rather than being recognized as part of other comprehensive income.
Operating results and cash flows may cause us to incur asset impairment charges.
Long-lived assets, primarily property and equipment, are reviewed at the store level at least annually for impairment, or whenever changes in circumstances indicate that a fullrecovery of net asset values through future cash flows is in question. We also assess the recoverability of indefinite-lived intangible assets at least annually or whenever eventsor changes in circumstances indicate that the carrying amount may not be fully recoverable. Our impairment review requires us to make estimates and projections regarding, butnot limited to, sales, operating profit and future cash flows. If our operating performance reflects a sustained decline, we may be exposed to significant asset impairmentcharges in future periods, which could be material to our results of operations.
Reductions in income and cash flow from our marketing and servicing arrangement related to our private label and co-branded credit cards could adversely affect ouroperating results and cash flows.
Synchrony Financial (“Synchrony”) owns and services our private label credit card and co-branded MasterCard® programs. Our agreement with Synchrony provides for certainpayments to be made by Synchrony to the Company, including a share of income from the performance of the credit card portfolios. The income and cash flow that theCompany receives from Synchrony is dependent upon a number of factors including the level of sales on private label and co-branded accounts, the percentage of sales onprivate label and co-branded accounts relative to the Company’s total sales, the level of balances carried on the accounts, payment rates on the accounts, finance charge ratesand other fees on the accounts, the level of credit losses for the accounts, Synchrony’s ability to extend credit to our customers as well as the cost of customer rewards programs.All of these factors can vary based on changes in federal and state credit card, banking and consumer protection laws, which could
13
Table of Contents
also materially limit the availability of credit to consumers or increase the cost of credit to our cardholders. The factors affecting the income and cash flow that the Companyreceives from Synchrony can also vary based on a variety of economic, legal, social and other factors that we cannot control. If the income or cash flow that the Companyreceives from our consumer credit card program agreement with Synchrony decreases, our operating results and cash flows could be adversely affected.
We are subject to risks associated with importing merchandise from foreign countries.
A substantial portion of our merchandise is sourced by our vendors and by us outside of the United States. All of our direct private brand vendors must comply with oursupplier legal compliance program and applicable laws, including consumer and product safety laws. Although we diversify our sourcing and production by country andsupplier, the failure of a supplier to produce and deliver our goods on time, to meet our quality standards and adhere to our product safety requirements or to meet therequirements of our supplier compliance program or applicable laws could result in damage to our reputation.
Although we have implemented policies and procedures designed to facilitate compliance with laws and regulations relating to doing business in foreign markets and importingmerchandise from abroad, there can be no assurance that suppliers and other third parties with whom we do business will not violate such laws and regulations or our policies,which could subject us to liability and could adversely affect our results of operations.
We are subject to the various risks of importing merchandise from abroad and purchasing product made in foreign countries, such as:
• potential disruptions in manufacturing, logistics andsupply;
• changes in duties, tariffs, quotas and voluntary export restrictions on importedmerchandise;
• strikes and other events affectingdelivery;
• consumer perceptions of the safety of importedmerchandise;
• product compliance with laws and regulations of the destinationcountry;
• product liability claims from customers or penalties from government agencies relating to products that are recalled, defective or otherwise noncompliant or alleged tobe harmful;
• concerns about human rights, working conditions and other labor rights and conditions and environmental impact in foreign countries where merchandise is producedand raw materials or components are sourced, and changing labor, environmental and other laws in these countries;
• local business practice and political issues that may result in adverse publicity or threatened or actual adverse consumer actions, includingboycotts;
• compliance with laws and regulations concerning ethical business practices, such as the U.S. Foreign Corrupt Practices Act;and
• economic, political or other problems in countries from or through which merchandise isimported.
Political or financial instability, trade restrictions, tariffs, currency exchange rates, labor conditions, congestion and labor issues at major ports, transport capacity and costs,systems issues, problems in third party distribution and warehousing and other interruptions of the supply chain, compliance with U.S. and foreign laws and regulations andother factors relating to international trade and imported merchandise beyond our control could affect the availability and the price of our inventory. These risks and otherfactors relating to foreign trade could subject us to liability or hinder our ability to access suitable merchandise on acceptable terms, which could adversely impact our results ofoperations. In addition, developments in tax policy, such as the disallowance of tax deductions for imported merchandise, the imposition of tariffs on imported merchandise, orchanges to U.S. trade legislation could have a material adverse effect on our results of operations and liquidity.
14
Table of Contents
Disruptions and congestion at ports through which we import merchandise may increase our costs and/or delay the receipt of goods in our stores, which could adverselyimpact our profitability, financial position and cash flows.
We ship the majority of our private brand merchandise by ocean to ports in the United States. Our national brand suppliers also ship merchandise by ocean. Disruptions in theoperations of ports through which we import our merchandise, including but not limited to labor disputes involving work slowdowns, lockouts or strikes, could require us and/orour vendors to ship merchandise by air freight or to alternative ports in the United States. Shipping by air is significantly more expensive than shipping by ocean which couldadversely affect our profitability. Similarly, shipping to alternative ports in the United States could result in increased lead times and transportation costs. Disruptions at portsthrough which we import our goods could also result in unanticipated inventory shortages, which could adversely impact our reputation and our results of operations.
Our Company’s growth and profitability depend on the levels of consumer confidence and spending.
Our results of operations are sensitive to changes in overall economic and political conditions that impact consumer spending, including discretionary spending. Many economicfactors outside of our control, including the housing market, interest rates, recession, inflation and deflation, energy costs and availability, consumer credit availability andterms, consumer debt levels, tax rates and policy, and unemployment trends influence consumer confidence and spending. The domestic and international political situation andactions also affect consumer confidence and spending. Additional events that could impact our performance include pandemics, terrorist threats and activities, worldwidemilitary and domestic disturbances and conflicts, political instability and civil unrest. Declines in the level of consumer spending could adversely affect our growth andprofitability.
Our business is seasonal, which impacts our results of operations.
Our annual earnings and cash flows depend to a great extent on the results of operations for the last quarter of our fiscal year, which includes the holiday season. Our fiscalfourth-quarter results may fluctuate significantly, based on many factors, including holiday spending patterns and weather conditions. This seasonality causes our operatingresults to vary considerably from quarter to quarter.
Our profitability may be impacted by weather conditions.
Our merchandise assortments reflect assumptions regarding expected weather patterns and our profitability depends on our ability to timely deliver seasonally appropriateinventory. Unseasonable or unexpected weather conditions such as warm temperatures during the winter season or prolonged or extreme periods of warm or cold temperaturescould render a portion of our inventory incompatible with consumer needs. Extreme weather or natural disasters could also severely hinder our ability to timely deliverseasonally appropriate merchandise, preclude customers from traveling to our stores, delay capital improvements or cause us to close stores. A reduction in the demand for orsupply of our seasonal merchandise could have an adverse effect on our inventory levels and results of operations.
Changes in federal, state or local laws and regulations could increase our expenses and adversely affect our results of operations.
Our business is subject to a wide array of laws and regulations. Government intervention and activism and/or regulatory reform may result in substantial new regulations anddisclosure obligations and/or changes in the interpretation of existing laws and regulations, which may lead to additional compliance costs as well as the diversion of ourmanagement’s time and attention from strategic initiatives. If we fail to comply with applicable laws and regulations, we could be subject to legal risk, including governmentenforcement action and class action civil litigation that could disrupt our operations and increase our costs of doing business. Changes in the regulatory environment regardingtopics such as privacy and information security, tax policy, product safety, environmental protection, including regulations in response to concerns regarding climate change,collective bargaining activities, minimum wage, wage and hour, and health care mandates, among others, as well as changes to applicable accounting rules and regulations,such as changes to lease accounting standards, could also cause our compliance costs to increase and adversely affect our business, financial condition and results of operations.
Legal and regulatory proceedings could have an adverse impact on our results of operations.
Our Company is subject to various legal and regulatory proceedings relating to our business, certain of which may involve jurisdictions with reputations for aggressiveapplication of laws and procedures against corporate defendants. We are impacted by trends in litigation, including class action litigation brought under various consumerprotection, employment, and privacy
15
Table of Contents
and information security laws. In addition, litigation risks related to claims that technologies we use infringe intellectual property rights of third parties have been amplified bythe increase in third parties whose primary business is to assert such claims. Reserves are established based on our best estimates of our potential liability. However, we cannotaccurately predict the ultimate outcome of any such proceedings due to the inherent uncertainties of litigation. Regardless of the outcome or whether the claims are meritorious,legal and regulatory proceedings may require that we devote substantial time and expense to defend our Company. Unfavorable rulings could result in a material adverse impacton our business, financial condition or results of operations.
Significant changes in discount rates, actual investment return on pension assets, and other factors could affect our earnings, equity, and pension contributions in futureperiods.
Our earnings may be positively or negatively impacted by the amount of income or expense recorded for our qualified pension plan. Generally accepted accounting principles inthe United States of America (GAAP) require that income or expense for the plan be calculated at the annual measurement date using actuarial assumptions and calculations.The most significant assumptions relate to the capital markets, interest rates and other economic conditions. Changes in key economic indicators can change the assumptions.Two critical assumptions used to estimate pension income or expense for the year are the expected long-term rate of return on plan assets and the discount rate. In addition, atthe measurement date, we must also reflect the funded status of the plan (assets and liabilities) on the balance sheet, which may result in a significant change to equity through areduction or increase to other comprehensive income. We may also experience volatility in the amount of the annual actuarial gains or losses recognized as income or expensebecause we have elected to recognize pension expense using mark-to-market accounting. Although GAAP expense and pension contributions are not directly related, the keyeconomic factors that affect GAAP expense would also likely affect the amount of cash we could be required to contribute to the pension plan. Potential pension contributionsinclude both mandatory amounts required under federal law and discretionary contributions to improve a plan’s funded status.
Our stock price has been and may continue to be volatile.
The market price of our common stock has fluctuated substantially and may continue to fluctuate significantly. Future announcements or disclosures concerning us or any ofour competitors, our strategic initiatives, our sales and profitability, our financial condition, any quarterly variations in actual or anticipated operating results or comparablesales, any failure to meet analysts’ expectations and sales of large blocks of our common stock, among other factors, could cause the market price of our common stock tofluctuate substantially. In addition, the stock market has experienced price and volume fluctuations that have affected the market price of many retail and other stocks that haveoften been unrelated or disproportionate to the operating performance of these companies. This volatility could affect the price at which you could sell shares of our commonstock.
Securities class action litigation has often been instituted against companies following periods of volatility in the overall market and in the market price of a company’ssecurities. Such litigation could result in substantial costs, divert our management’s attention and resources and have an adverse effect on our business, results of operations andfinancial condition.
The Company’s ability to use net operating loss carryforwards to offset future taxable income for U.S. federal income tax purposes may be limited.
The Company has a federal net operating loss (NOL) of $2.1 billion as of February 2, 2019. Nearly all of these NOL carryforwards (expiring in 2032 through 2034) arose priorto December 31, 2017 and are available to offset future taxable income in full. NOLs recognized after December 31, 2017 are only available to offset up to 80% of theCompany’s future taxable income.
Section 382 of the Internal Revenue Code of 1986, as amended (the Code), imposes an annual limitation on the amount of taxable income that may be offset by a corporation'sNOLs if the corporation experiences an “ownership change” as defined in Section 382 of the Code. An ownership change occurs when the Company’s “five-percentshareholders” (as defined in Section 382 of the Code) collectively increase their ownership in the Company by more than 50 percentage points (by value) over a rolling three-year period. Additionally, various states have similar limitations on the use of state NOLs following an ownership change.
If an ownership change occurs, the amount of the taxable income for any post-change year that may be offset by a pre-change loss is subject to an annual limitation that iscumulative to the extent it is not all utilized in a year. This limitation is derived by multiplying the fair market value of the Company stock as of the ownership change by theapplicable federal long-term tax-exempt rate, which was 2.51% at February 2, 2019. To the extent that a company has a net unrealized built-in gain at the time of
16

Table of Contents
an ownership change, which is realized or deemed recognized during the five-year period following the ownership change, there is an increase in the annual limitation for eachof the first five-years that is cumulative to the extent it is not all utilized in a year.
The Company has an ongoing study of the rolling three-year testing periods. Based upon the elections the Company has made and the information that has been filed with theSecurities and Exchange Commission through February 2, 2019, the Company has not had a Section 382 ownership change through February 2, 2019.
If an ownership change should occur in the future, the Company’s ability to use the NOL to offset future taxable income will be subject to an annual limitation and will dependon the amount of taxable income generated by the Company in future periods. There is no assurance that the Company will be able to fully utilize the NOL and the Companycould be required to record an additional valuation allowance related to the amount of the NOL that may not be realized, which could impact the Company’s result ofoperations.
We believe that these NOL carryforwards are a valuable asset for us. Consequently, we have a stockholder rights plan in place, which was approved by the Company’sstockholders, to protect our NOLs during the effective period of the rights plan. Although the rights plan is intended to reduce the likelihood of an “ownership change” thatcould adversely affect us, there is no assurance that the restrictions on transferability in the rights plan will prevent all transfers that could result in such an “ownership change”.
The rights plan could make it more difficult for a third party to acquire, or could discourage a third party from acquiring, our Company or a large block of our common stock. A third party that acquires 4.9% or more of our common stock could suffer substantial dilution of its ownership interest under the terms of the rights plan through the issuanceof common stock or common stock equivalents to all stockholders other than the acquiring person.
The foregoing provisions may adversely affect the marketability of our common stock by discouraging potential investors from acquiring our stock. In addition, theseprovisions could delay or frustrate the removal of incumbent directors and could make more difficult a merger, tender offer or proxy contest involving us, or impede an attemptto acquire a significant or controlling interest in us, even if such events might be beneficial to us and our stockholders.
Item 1B. Unresolved Staff Comments
None.
17
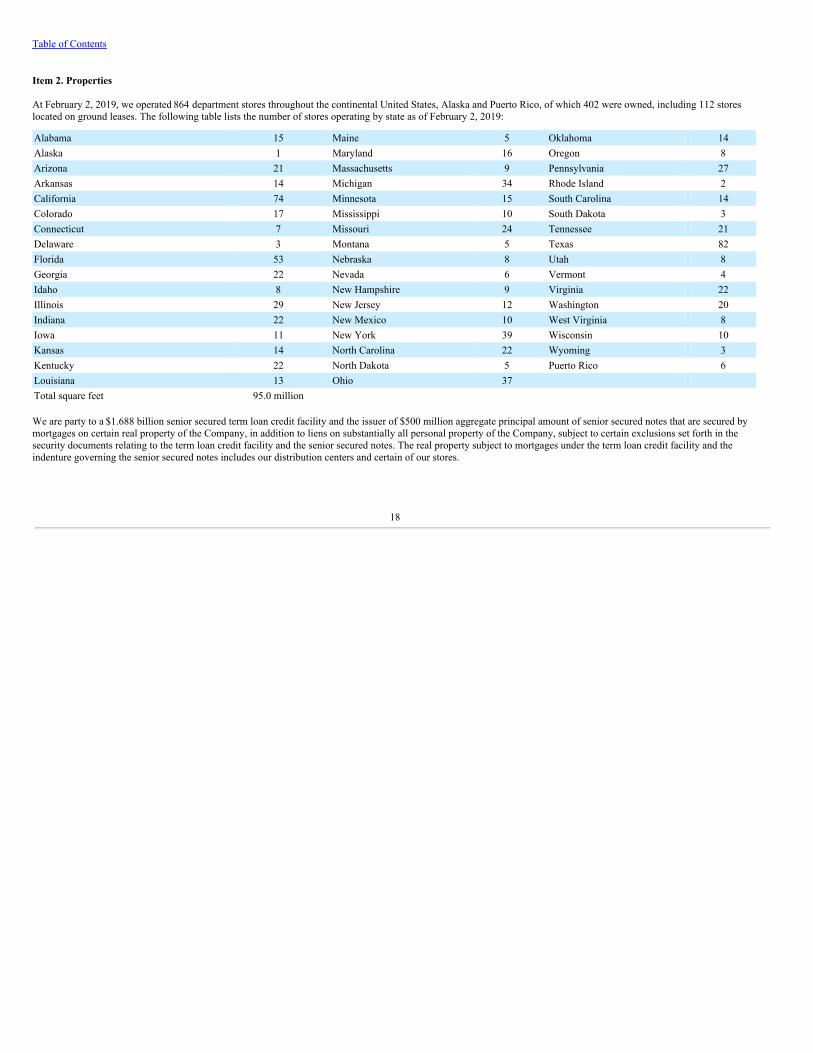
Table of Contents
Item 2. Properties
At February 2, 2019, we operated 864 department stores throughout the continental United States, Alaska and Puerto Rico, of which 402 were owned, including 112 storeslocated on ground leases. The following table lists the number of stores operating by state as of February 2, 2019:
Alabama 15 Maine 5 Oklahoma 14Alaska 1 Maryland 16 Oregon 8Arizona 21 Massachusetts 9 Pennsylvania 27Arkansas 14 Michigan 34 Rhode Island 2California 74 Minnesota 15 South Carolina 14Colorado 17 Mississippi 10 South Dakota 3Connecticut 7 Missouri 24 Tennessee 21Delaware 3 Montana 5 Texas 82Florida 53 Nebraska 8 Utah 8Georgia 22 Nevada 6 Vermont 4Idaho 8 New Hampshire 9 Virginia 22Illinois 29 New Jersey 12 Washington 20Indiana 22 New Mexico 10 West Virginia 8Iowa 11 New York 39 Wisconsin 10Kansas 14 North Carolina 22 Wyoming 3Kentucky 22 North Dakota 5 Puerto Rico 6Louisiana 13 Ohio 37 Total square feet 95.0 million
We are party to a $1.688 billion senior secured term loan credit facility and the issuer of $500 million aggregate principal amount of senior secured notes that are secured bymortgages on certain real property of the Company, in addition to liens on substantially all personal property of the Company, subject to certain exclusions set forth in thesecurity documents relating to the term loan credit facility and the senior secured notes. The real property subject to mortgages under the term loan credit facility and theindenture governing the senior secured notes includes our distribution centers and certain of our stores.
18
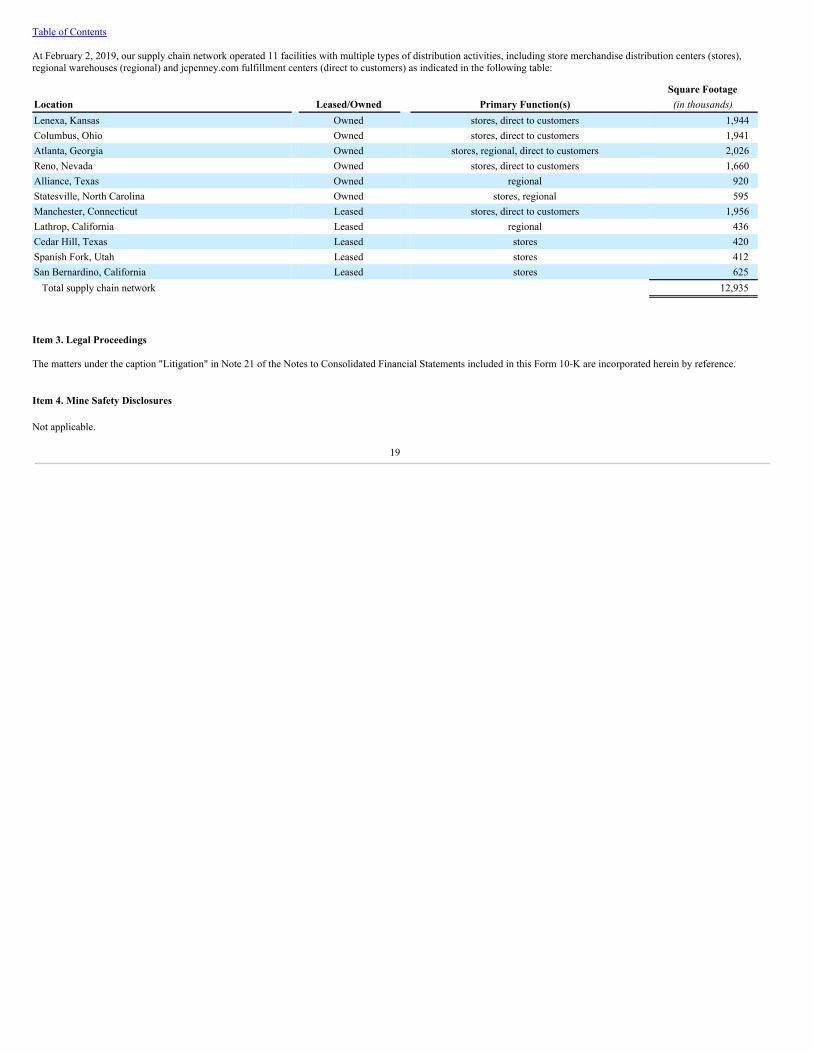
Table of Contents
At February 2, 2019, our supply chain network operated 11 facilities with multiple types of distribution activities, including store merchandise distribution centers (stores),regional warehouses (regional) and jcpenney.com fulfillment centers (direct to customers) as indicated in the following table:
Square FootageLocation Leased/Owned Primary Function(s) (in thousands)Lenexa, Kansas Owned stores, direct to customers 1,944Columbus, Ohio Owned stores, direct to customers 1,941Atlanta, Georgia Owned stores, regional, direct to customers 2,026Reno, Nevada Owned stores, direct to customers 1,660Alliance, Texas Owned regional 920Statesville, North Carolina Owned stores, regional 595Manchester, Connecticut Leased stores, direct to customers 1,956Lathrop, California Leased regional 436Cedar Hill, Texas Leased stores 420Spanish Fork, Utah Leased stores 412San Bernardino, California Leased stores 625
Total supply chain network 12,935
Item 3. Legal Proceedings
The matters under the caption "Litigation" in Note 21 of the Notes to Consolidated Financial Statements included in this Form 10-K are incorporated herein by reference.
Item 4. Mine Safety Disclosures
Not applicable.
19

Table of Contents
PART II
Item 5. Market for Registrant’s Common Equity, Related Stockholder Matters and Issuer Purchases of Equity Securities
Market for Registrant’s Common Equity
Our common stock is traded principally on the New York Stock Exchange (NYSE) under the symbol “JCP.” The number of stockholders of record at March 15, 2019, was21,122. In addition to common stock, we have authorized 25 million shares of preferred stock, of which no shares were issued and outstanding at February 2, 2019.
Since May 2012, the Company has not paid a dividend. Under our senior secured term loan credit facility and senior secured asset-based credit facility, we are subject torestrictive covenants regarding our ability to pay cash dividends.
Additional information relating to the common stock and preferred stock is included in this Annual Report on Form 10-K in the Consolidated Statements of Stockholders’Equity and in Note 13 to the Consolidated Financial Statements.
Issuer Purchases of Securities
No repurchases of common stock were made during the fourth quarter of 2018 and no amounts are authorized for share repurchases as of February 2, 2019.
20
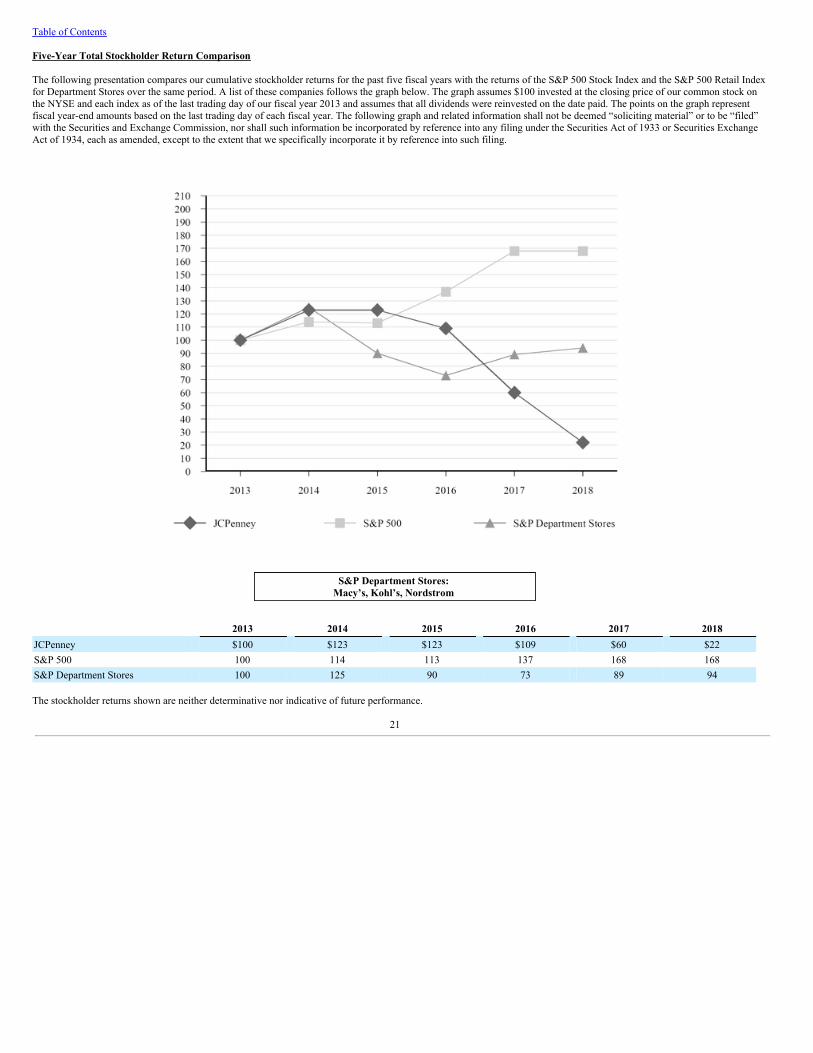
Table of Contents
Five-Year Total Stockholder Return Comparison
The following presentation compares our cumulative stockholder returns for the past five fiscal years with the returns of the S&P 500 Stock Index and the S&P 500 Retail Indexfor Department Stores over the same period. A list of these companies follows the graph below. The graph assumes $100 invested at the closing price of our common stock onthe NYSE and each index as of the last trading day of our fiscal year 2013 and assumes that all dividends were reinvested on the date paid. The points on the graph representfiscal year-end amounts based on the last trading day of each fiscal year. The following graph and related information shall not be deemed “soliciting material” or to be “filed”with the Securities and Exchange Commission, nor shall such information be incorporated by reference into any filing under the Securities Act of 1933 or Securities ExchangeAct of 1934, each as amended, except to the extent that we specifically incorporate it by reference into such filing.
S&P Department Stores:Macy’s, Kohl’s, Nordstrom
2013 2014 2015 2016 2017 2018JCPenney $100 $123 $123 $109 $60 $22S&P 500 100 114 113 137 168 168S&P Department Stores 100 125 90 73 89 94
The stockholder returns shown are neither determinative nor indicative of future performance.
21
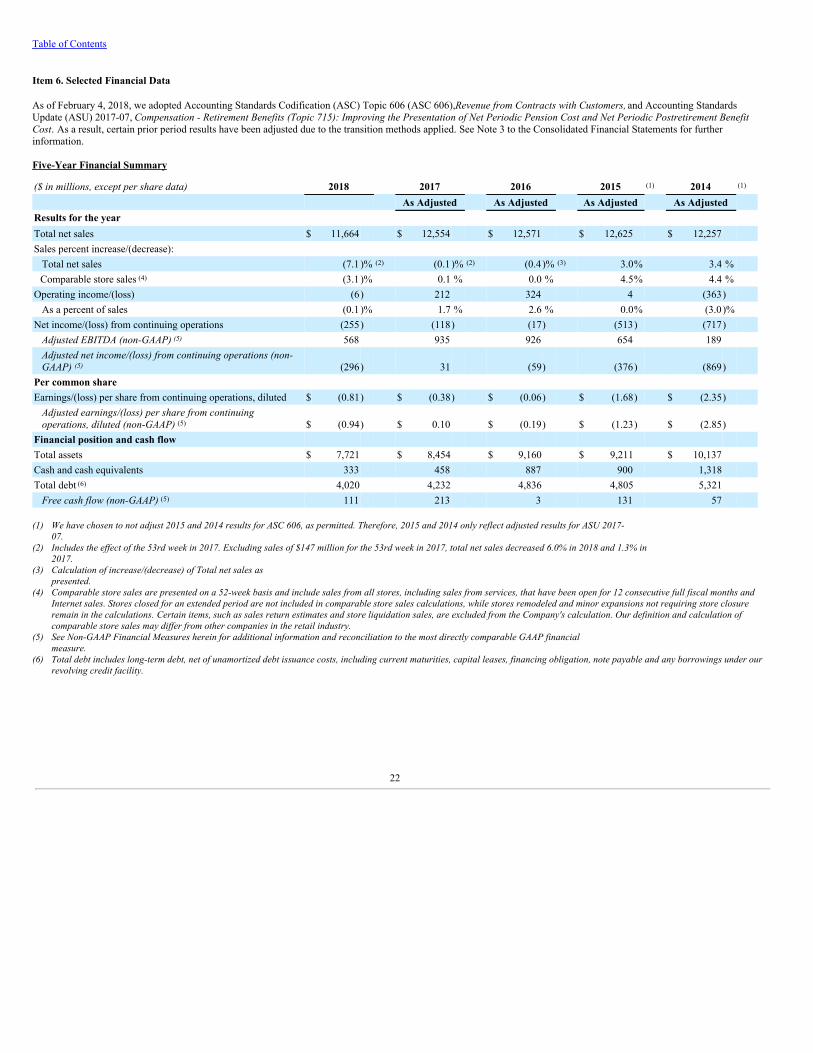
Table of Contents
Item 6. Selected Financial Data
As of February 4, 2018, we adopted Accounting Standards Codification (ASC) Topic 606 (ASC 606), Revenue from Contracts with Customers, and Accounting StandardsUpdate (ASU) 2017-07, Compensation - Retirement Benefits (Topic 715): Improving the Presentation of Net Periodic Pension Cost and Net Periodic Postretirement BenefitCost. As a result, certain prior period results have been adjusted due to the transition methods applied. See Note 3 to the Consolidated Financial Statements for furtherinformation.
Five-Year Financial Summary
($ in millions, except per share data) 2018 2017 2016 2015 (1) 2014 (1) As Adjusted As Adjusted As Adjusted As Adjusted Results for the year Total net sales $ 11,664 $ 12,554 $ 12,571 $ 12,625 $ 12,257 Sales percent increase/(decrease):
Total net sales (7.1 )% (2) (0.1 )% (2) (0.4 )% (3) 3.0% 3.4 % Comparable store sales (4) (3.1 )% 0.1 % 0.0 % 4.5% 4.4 %
Operating income/(loss) (6) 212 324 4 (363) As a percent of sales (0.1 )% 1.7 % 2.6 % 0.0% (3.0 )%
Net income/(loss) from continuing operations (255) (118) (17) (513) (717) Adjusted EBITDA (non-GAAP) (5) 568 935 926 654 189 Adjusted net income/(loss) from continuing operations (non-GAAP) (5) (296) 31 (59) (376) (869)
Per common share Earnings/(loss) per share from continuing operations, diluted $ (0.81) $ (0.38) $ (0.06) $ (1.68) $ (2.35)
Adjusted earnings/(loss) per share from continuingoperations, diluted (non-GAAP) (5) $ (0.94) $ 0.10 $ (0.19) $ (1.23) $ (2.85)
Financial position and cash flow Total assets $ 7,721 $ 8,454 $ 9,160 $ 9,211 $ 10,137Cash and cash equivalents 333 458 887 900 1,318 Total debt (6) 4,020 4,232 4,836 4,805 5,321
Free cash flow (non-GAAP) (5) 111 213 3 131 57
(1) We have chosen to not adjust 2015 and 2014 results for ASC 606, as permitted. Therefore, 2015 and 2014 only reflect adjusted results for ASU 2017-07.
(2) Includes the effect of the 53rd week in 2017. Excluding sales of $147 million for the 53rd week in 2017, total net sales decreased 6.0% in 2018 and 1.3% in2017.
(3) Calculation of increase/(decrease) of Total net sales aspresented.
(4) Comparable store sales are presented on a 52-week basis and include sales from all stores, including sales from services, that have been open for 12 consecutive full fiscal months andInternet sales. Stores closed for an extended period are not included in comparable store sales calculations, while stores remodeled and minor expansions not requiring store closureremain in the calculations. Certain items, such as sales return estimates and store liquidation sales, are excluded from the Company's calculation. Our definition and calculation ofcomparable store sales may differ from other companies in the retail industry.
(5) See Non-GAAP Financial Measures herein for additional information and reconciliation to the most directly comparable GAAP financialmeasure.
(6) Total debt includes long-term debt, net of unamortized debt issuance costs, including current maturities, capital leases, financing obligation, note payable and any borrowings under ourrevolving credit facility.
22
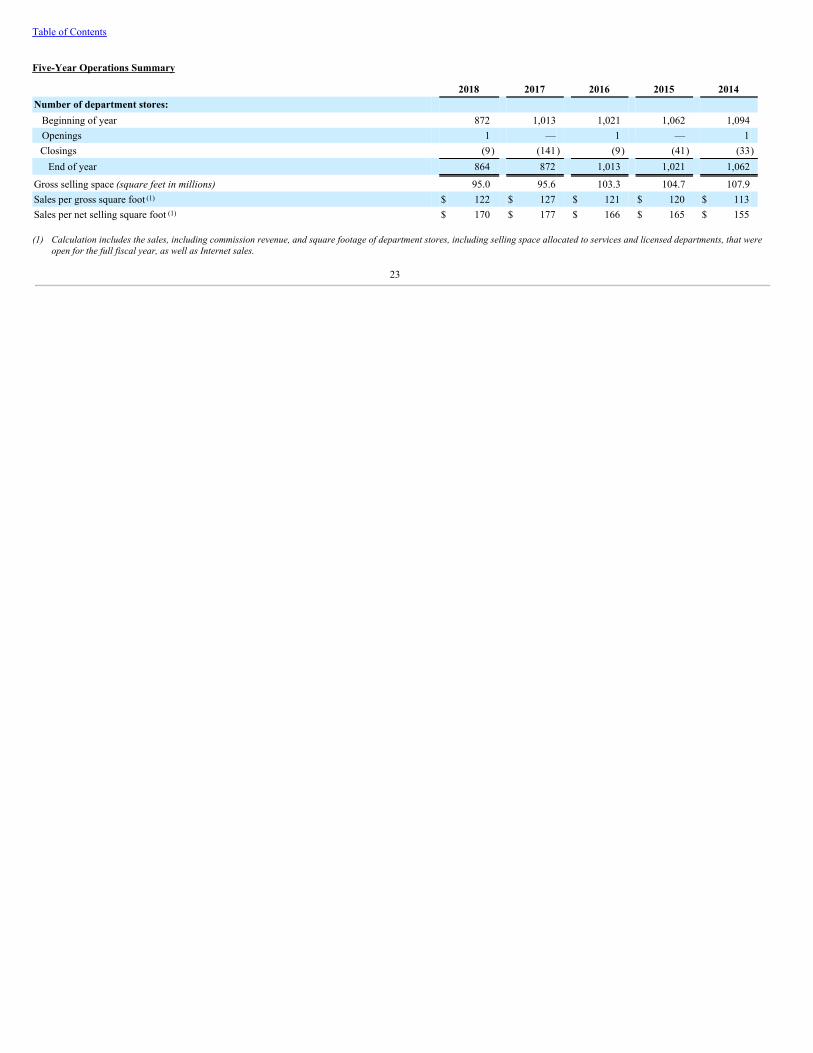
Table of Contents
Five-Year Operations Summary
2018 2017 2016 2015 2014Number of department stores:
Beginning of year 872 1,013 1,021 1,062 1,094Openings 1 — 1 — 1Closings (9) (141) (9) (41) (33)
End of year 864 872 1,013 1,021 1,062
Gross selling space (square feet in millions) 95.0 95.6 103.3 104.7 107.9Sales per gross square foot (1) $ 122 $ 127 $ 121 $ 120 $ 113Sales per net selling square foot (1) $ 170 $ 177 $ 166 $ 165 $ 155
(1) Calculation includes the sales, including commission revenue, and square footage of department stores, including selling space allocated to services and licensed departments, that were
open for the full fiscal year, as well as Internet sales.
23
Table of Contents
Item 7. Management’s Discussion and Analysis of Financial Condition and Results of Operations
The following discussion, which presents our results, should be read in conjunction with the accompanying Consolidated Financial Statements and notes thereto, along with theFive-Year Financial and Operations Summaries, the risk factors and the cautionary statement regarding forward-looking information. Unless otherwise indicated, all referencesin this Management’s Discussion and Analysis (MD&A) related to earnings/(loss) per share (EPS) are on a diluted basis and all references to years relate to fiscal years ratherthan to calendar years.
Current Initiatives
With the development of a new senior leadership team, management is in the process of reassessing strategies and evaluating the transformational needs of the business. Goingthrough this process, management's immediate priority is to reestablish the fundamentals of retail based on the following initiatives:
• Reducing and enhancing our inventoryposition;
• Strengthening our integrated omnichannelstrategy;
• Redesigning and improving core storeprocesses;
• Improving our shrink results;and
• Revamping our merchandise assortments andstrategies.
First, we will continue our efforts to reduce and enhance our inventory position. For 2018, inventory was reduced by over 13%. For 2019, we will continue to clear unproductiveinventory swiftly and thoughtfully and implement new processes and training across our organization to ensure proper inventory management and merchandising and preventfuture build-up of excess inventory.
Second, we will continue to strengthen our integrated omnichannel strategy to ensure we return to growth in our digital channels, but in a sustainable and profitable way. In2019, we continue to focus on improving the overall customer experience from a digital standpoint and on strengthening our omnichannel retail capabilities to ensure we have aconsistent experience regardless of whether our customer is shopping on-line, mobile or in-store.
Third, we will redesign and improve core store processes while implementing enhanced technology tools to better equip our store associates to deliver on our customers'expectations. In 2019, we will have a critical focus on improving the productivity of our labor hours by delivering service to the customer where and when it matters most.
Fourth, we are taking immediate action to improve our shrink results. We have made and will continue to make technology investments and staffing adjustments to improve ourinventory shrink results.
Lastly, we will continue to revamp and rethink our merchandise assortments and strategies. In 2019, we made the decision to discontinue selling major appliances in an effort toimprove financial performance and refocus on our legacy strengths in apparel and soft home as well as profitable growth opportunities. We will also continue to leverage ourbest-in-class global sourcing and design organization across our product spectrum to enhance the style and quality we deliver, but also to improve profitability within ourassortment.
24
Table of Contents
2018 Overview
▪ Total net sales were $11,664 million, a decrease of 7.1% as compared to 2017, and comparable store sales decreased 3.1% for theyear.
▪ Credit income and other was $355 million compared to $319 million in 2017. The increase was due to improved performance of the creditportfolio.
▪ Cost of goods sold, which excludes depreciation and amortization, as a percentage of Total net sales was 67.5% compared to 65.4% last year. The increase as a rate ofsales was primarily driven by planned markdown and pricing actions taken during the year to reduce excess inventory.
▪ Selling, general and administrative (SG&A) expenses decreased $249 million, or 6.5%, as compared to 2017. These savings were primarily driven by lower storecontrollable costs, incentive compensation and corporate overhead.
▪ Net loss was $255 million, or $0.81 per share, compared to a net loss of $118 million, or $0.38 per share, in 2017. Results for 2018 included the following amounts thatare not directly related to our ongoing core business operations:
▪ $22 million, or $(0.07) per share, of restructuring and management transitioncharges;
▪ $71 million, or $0.22 per share, for other components of net periodic pension and postretirement benefitincome;
▪ $23 million, or $(0.07) per share, for the loss on extinguishment ofdebt;
▪ $4 million, or $0.01 per share, for our proportional share of net income from our joint venture formed to develop the excess property adjacent to our homeoffice facility in Plano, Texas (Home Office Land Joint Venture); and
▪ $11 million, or $0.03 per share, for the tax benefit resulting from other comprehensive income allocation related to pension and interest rate swapactivity.
▪ Adjusted net loss was $296 million, or $(0.94) per share, compared to adjusted net income of $31 million, or $0.10 per share, in 2017. See the reconciliation of netincome/(loss) and diluted EPS, the most directly comparable GAAP financial measures, to adjusted net income/(loss) and adjusted diluted EPS on page 35.
▪ Adjusted EBITDA was $568 million for 2018 compared to adjusted EBITDA of $935 million in 2017. See the reconciliation of net income/(loss), the most directlycomparable GAAP financial measure, to adjusted EBITDA on page 35.
▪ On March 12, 2018, JCP issued $400 million aggregate principal amount of senior secured second priority notes due 2025 with a 8.625% rate (2025 Notes). The netproceeds from the 2025 Notes were used for the tender consideration for JCP's contemporaneous cash tender offers for $125 million aggregate principal amount of its8.125% Senior Notes Due 2019 (2019 Notes) and $250 million aggregate principal amount of its 5.65% Senior Notes Due 2020 (2020 Notes).
▪ We completed the sale-leasebacks of our Milwaukee, Wisconsin and Manchester, Connecticut distribution facilities for net sales prices of $30 million and $68 million,respectively, and recorded net gains of $12 million and $38 million, respectively.
▪ We recorded an impairment charge of $52 million related to management's decision to sell three airplanes. Two of the airplanes were sold during the second quarter of2018 at their fair value of $12 million and the third airplane was sold during the third quarter of 2018 at its fair value of $8 million.
▪ We completed a multi-year extension of our private-label and co-branded credit card agreement with Synchrony Financial (Synchrony). The amended and restatedagreement provides for improved alignment with respect to the marketing and servicing alliance of the program.
▪ Effective October 15, 2018, the Board of Directors elected Jill Soltau as Chief Executive Officer of theCompany.
25
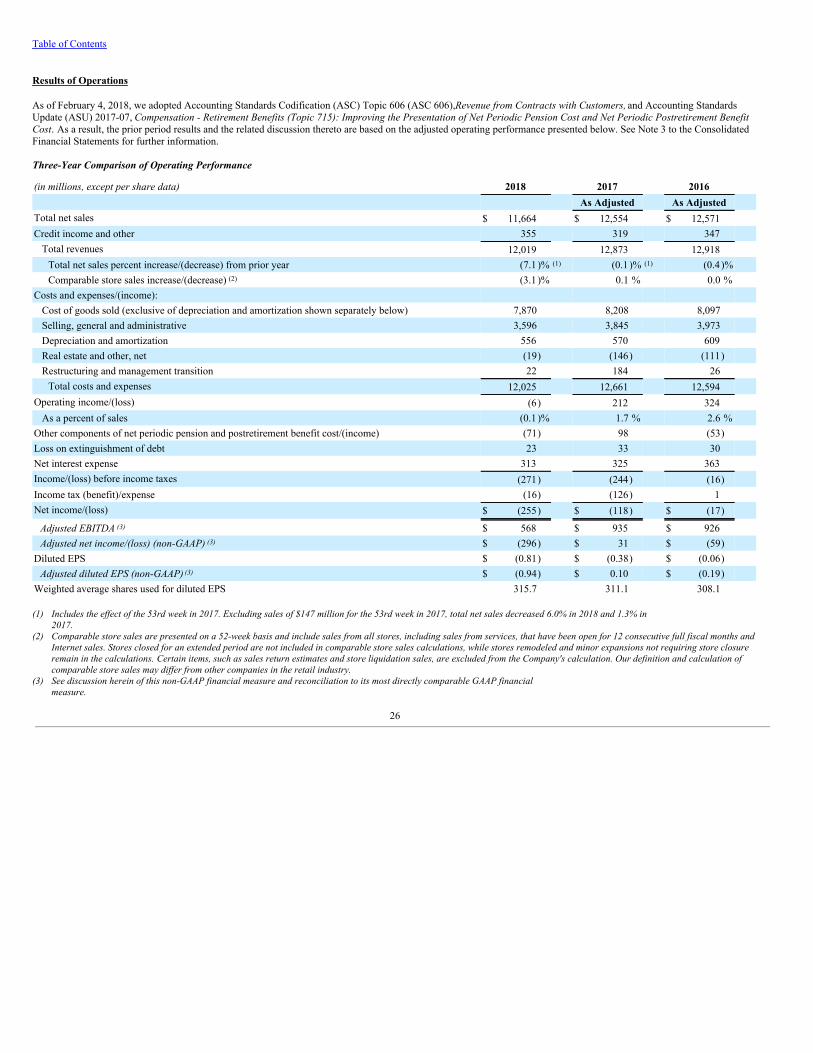
Table of Contents
Results of Operations
As of February 4, 2018, we adopted Accounting Standards Codification (ASC) Topic 606 (ASC 606), Revenue from Contracts with Customers, and Accounting StandardsUpdate (ASU) 2017-07, Compensation - Retirement Benefits (Topic 715): Improving the Presentation of Net Periodic Pension Cost and Net Periodic Postretirement BenefitCost. As a result, the prior period results and the related discussion thereto are based on the adjusted operating performance presented below. See Note 3 to the ConsolidatedFinancial Statements for further information.
Three-Year Comparison of Operating Performance
(in millions, except per share data) 2018 2017 2016 As Adjusted As Adjusted Total net sales $ 11,664 $ 12,554 $ 12,571 Credit income and other 355 319 347
Total revenues 12,019 12,873 12,918 Total net sales percent increase/(decrease) from prior year (7.1 )% (1) (0.1 )% (1) (0.4 )% Comparable store sales increase/(decrease) (2) (3.1 )% 0.1 % 0.0 %
Costs and expenses/(income): Cost of goods sold (exclusive of depreciation and amortization shown separately below) 7,870 8,208 8,097 Selling, general and administrative 3,596 3,845 3,973 Depreciation and amortization 556 570 609 Real estate and other, net (19) (146) (111) Restructuring and management transition 22 184 26
Total costs and expenses 12,025 12,661 12,594 Operating income/(loss) (6) 212 324
As a percent of sales (0.1 )% 1.7 % 2.6 % Other components of net periodic pension and postretirement benefit cost/(income) (71) 98 (53) Loss on extinguishment of debt 23 33 30 Net interest expense 313 325 363 Income/(loss) before income taxes (271) (244) (16) Income tax (benefit)/expense (16) (126) 1 Net income/(loss) $ (255) $ (118) $ (17)
Adjusted EBITDA (3) $ 568 $ 935 $ 926 Adjusted net income/(loss) (non-GAAP) (3) $ (296) $ 31 $ (59)
Diluted EPS $ (0.81) $ (0.38) $ (0.06) Adjusted diluted EPS (non-GAAP) (3) $ (0.94) $ 0.10 $ (0.19)
Weighted average shares used for diluted EPS 315.7 311.1 308.1
(1) Includes the effect of the 53rd week in 2017. Excluding sales of $147 million for the 53rd week in 2017, total net sales decreased 6.0% in 2018 and 1.3% in2017.
(2) Comparable store sales are presented on a 52-week basis and include sales from all stores, including sales from services, that have been open for 12 consecutive full fiscal months andInternet sales. Stores closed for an extended period are not included in comparable store sales calculations, while stores remodeled and minor expansions not requiring store closureremain in the calculations. Certain items, such as sales return estimates and store liquidation sales, are excluded from the Company's calculation. Our definition and calculation ofcomparable store sales may differ from other companies in the retail industry.
(3) See discussion herein of this non-GAAP financial measure and reconciliation to its most directly comparable GAAP financialmeasure.
26
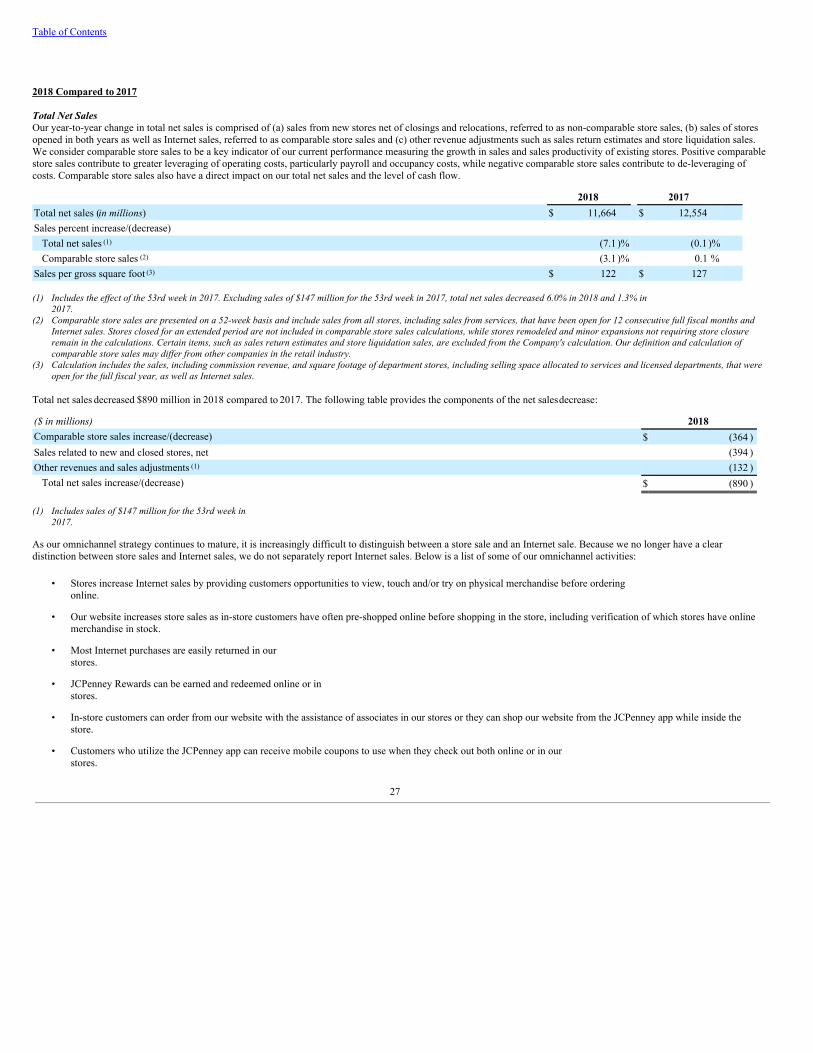
Table of Contents
2018 Compared to 2017
Total Net SalesOur year-to-year change in total net sales is comprised of (a) sales from new stores net of closings and relocations, referred to as non-comparable store sales, (b) sales of storesopened in both years as well as Internet sales, referred to as comparable store sales and (c) other revenue adjustments such as sales return estimates and store liquidation sales.We consider comparable store sales to be a key indicator of our current performance measuring the growth in sales and sales productivity of existing stores. Positive comparablestore sales contribute to greater leveraging of operating costs, particularly payroll and occupancy costs, while negative comparable store sales contribute to de-leveraging ofcosts. Comparable store sales also have a direct impact on our total net sales and the level of cash flow.
2018 2017 Total net sales (in millions) $ 11,664 $ 12,554 Sales percent increase/(decrease)
Total net sales (1) (7.1 )% (0.1 )% Comparable store sales (2) (3.1 )% 0.1 %
Sales per gross square foot (3) $ 122 $ 127
(1) Includes the effect of the 53rd week in 2017. Excluding sales of $147 million for the 53rd week in 2017, total net sales decreased 6.0% in 2018 and 1.3% in2017.
(2) Comparable store sales are presented on a 52-week basis and include sales from all stores, including sales from services, that have been open for 12 consecutive full fiscal months andInternet sales. Stores closed for an extended period are not included in comparable store sales calculations, while stores remodeled and minor expansions not requiring store closureremain in the calculations. Certain items, such as sales return estimates and store liquidation sales, are excluded from the Company's calculation. Our definition and calculation ofcomparable store sales may differ from other companies in the retail industry.
(3) Calculation includes the sales, including commission revenue, and square footage of department stores, including selling space allocated to services and licensed departments, that wereopen for the full fiscal year, as well as Internet sales.
Total net sales decreased $890 million in 2018 compared to 2017. The following table provides the components of the net sales decrease:
($ in millions) 2018Comparable store sales increase/(decrease) $ (364 )Sales related to new and closed stores, net (394 )Other revenues and sales adjustments (1) (132 )
Total net sales increase/(decrease) $ (890 )
(1) Includes sales of $147 million for the 53rd week in2017.
As our omnichannel strategy continues to mature, it is increasingly difficult to distinguish between a store sale and an Internet sale. Because we no longer have a cleardistinction between store sales and Internet sales, we do not separately report Internet sales. Below is a list of some of our omnichannel activities:
• Stores increase Internet sales by providing customers opportunities to view, touch and/or try on physical merchandise before orderingonline.
• Our website increases store sales as in-store customers have often pre-shopped online before shopping in the store, including verification of which stores have onlinemerchandise in stock.
• Most Internet purchases are easily returned in ourstores.
• JCPenney Rewards can be earned and redeemed online or instores.
• In-store customers can order from our website with the assistance of associates in our stores or they can shop our website from the JCPenney app while inside thestore.
• Customers who utilize the JCPenney app can receive mobile coupons to use when they check out both online or in ourstores.
27
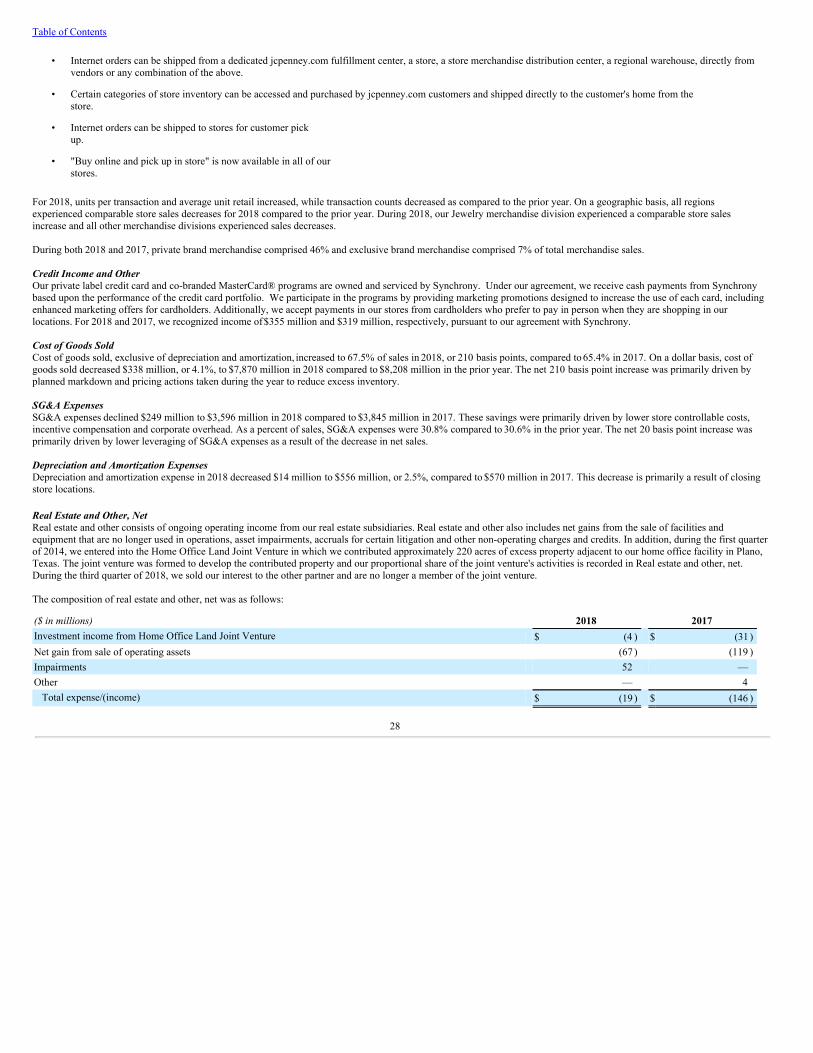
Table of Contents
• Internet orders can be shipped from a dedicated jcpenney.com fulfillment center, a store, a store merchandise distribution center, a regional warehouse, directly fromvendors or any combination of the above.
• Certain categories of store inventory can be accessed and purchased by jcpenney.com customers and shipped directly to the customer's home from thestore.
• Internet orders can be shipped to stores for customer pickup.
• "Buy online and pick up in store" is now available in all of ourstores.
For 2018, units per transaction and average unit retail increased, while transaction counts decreased as compared to the prior year. On a geographic basis, all regionsexperienced comparable store sales decreases for 2018 compared to the prior year. During 2018, our Jewelry merchandise division experienced a comparable store salesincrease and all other merchandise divisions experienced sales decreases. During both 2018 and 2017, private brand merchandise comprised 46% and exclusive brand merchandise comprised 7% of total merchandise sales.
Credit Income and OtherOur private label credit card and co-branded MasterCard® programs are owned and serviced by Synchrony. Under our agreement, we receive cash payments from Synchronybased upon the performance of the credit card portfolio. We participate in the programs by providing marketing promotions designed to increase the use of each card, includingenhanced marketing offers for cardholders. Additionally, we accept payments in our stores from cardholders who prefer to pay in person when they are shopping in ourlocations. For 2018 and 2017, we recognized income of $355 million and $319 million, respectively, pursuant to our agreement with Synchrony.
Cost of Goods SoldCost of goods sold, exclusive of depreciation and amortization, increased to 67.5% of sales in 2018, or 210 basis points, compared to 65.4% in 2017. On a dollar basis, cost ofgoods sold decreased $338 million, or 4.1%, to $7,870 million in 2018 compared to $8,208 million in the prior year. The net 210 basis point increase was primarily driven byplanned markdown and pricing actions taken during the year to reduce excess inventory.
SG&A ExpensesSG&A expenses declined $249 million to $3,596 million in 2018 compared to $3,845 million in 2017. These savings were primarily driven by lower store controllable costs,incentive compensation and corporate overhead. As a percent of sales, SG&A expenses were 30.8% compared to 30.6% in the prior year. The net 20 basis point increase wasprimarily driven by lower leveraging of SG&A expenses as a result of the decrease in net sales.
Depreciation and Amortization ExpensesDepreciation and amortization expense in 2018 decreased $14 million to $556 million, or 2.5%, compared to $570 million in 2017. This decrease is primarily a result of closingstore locations.
Real Estate and Other, NetReal estate and other consists of ongoing operating income from our real estate subsidiaries. Real estate and other also includes net gains from the sale of facilities andequipment that are no longer used in operations, asset impairments, accruals for certain litigation and other non-operating charges and credits. In addition, during the first quarterof 2014, we entered into the Home Office Land Joint Venture in which we contributed approximately 220 acres of excess property adjacent to our home office facility in Plano,Texas. The joint venture was formed to develop the contributed property and our proportional share of the joint venture's activities is recorded in Real estate and other, net.During the third quarter of 2018, we sold our interest to the other partner and are no longer a member of the joint venture.
The composition of real estate and other, net was as follows:
($ in millions) 2018 2017Investment income from Home Office Land Joint Venture $ (4 ) $ (31 )Net gain from sale of operating assets (67 ) (119 )Impairments 52 —Other — 4
Total expense/(income) $ (19 ) $ (146 )
28
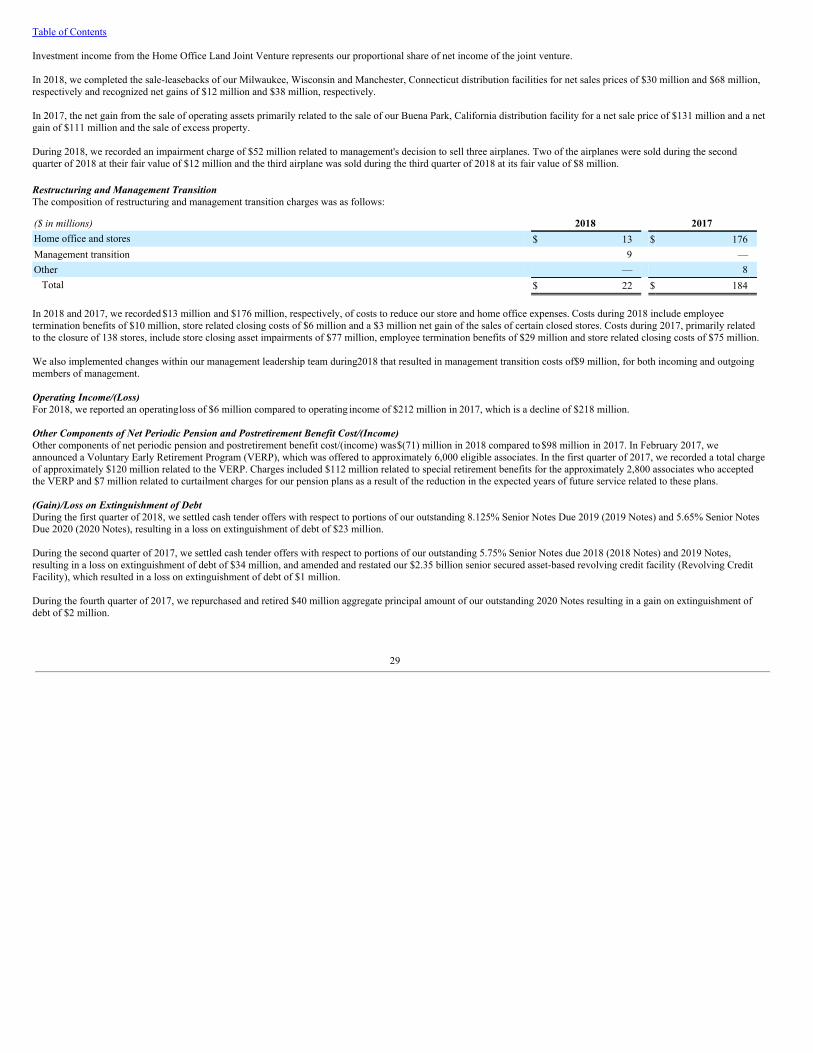
Table of Contents
Investment income from the Home Office Land Joint Venture represents our proportional share of net income of the joint venture.
In 2018, we completed the sale-leasebacks of our Milwaukee, Wisconsin and Manchester, Connecticut distribution facilities for net sales prices of $30 million and $68 million,respectively and recognized net gains of $12 million and $38 million, respectively.
In 2017, the net gain from the sale of operating assets primarily related to the sale of our Buena Park, California distribution facility for a net sale price of $131 million and a netgain of $111 million and the sale of excess property.
During 2018, we recorded an impairment charge of $52 million related to management's decision to sell three airplanes. Two of the airplanes were sold during the secondquarter of 2018 at their fair value of $12 million and the third airplane was sold during the third quarter of 2018 at its fair value of $8 million.
Restructuring and Management TransitionThe composition of restructuring and management transition charges was as follows:
($ in millions) 2018 2017Home office and stores $ 13 $ 176Management transition 9 —Other — 8
Total $ 22 $ 184
In 2018 and 2017, we recorded $13 million and $176 million, respectively, of costs to reduce our store and home office expenses. Costs during 2018 include employeetermination benefits of $10 million, store related closing costs of $6 million and a $3 million net gain of the sales of certain closed stores. Costs during 2017, primarily relatedto the closure of 138 stores, include store closing asset impairments of $77 million, employee termination benefits of $29 million and store related closing costs of $75 million.
We also implemented changes within our management leadership team during 2018 that resulted in management transition costs of $9 million, for both incoming and outgoingmembers of management.
Operating Income/(Loss)For 2018, we reported an operating loss of $6 million compared to operating income of $212 million in 2017, which is a decline of $218 million.
Other Components of Net Periodic Pension and Postretirement Benefit Cost/(Income)Other components of net periodic pension and postretirement benefit cost/(income) was $(71) million in 2018 compared to $98 million in 2017. In February 2017, weannounced a Voluntary Early Retirement Program (VERP), which was offered to approximately 6,000 eligible associates. In the first quarter of 2017, we recorded a total chargeof approximately $120 million related to the VERP. Charges included $112 million related to special retirement benefits for the approximately 2,800 associates who acceptedthe VERP and $7 million related to curtailment charges for our pension plans as a result of the reduction in the expected years of future service related to these plans.
(Gain)/Loss on Extinguishment of DebtDuring the first quarter of 2018, we settled cash tender offers with respect to portions of our outstanding 8.125% Senior Notes Due 2019 (2019 Notes) and 5.65% Senior NotesDue 2020 (2020 Notes), resulting in a loss on extinguishment of debt of $23 million.
During the second quarter of 2017, we settled cash tender offers with respect to portions of our outstanding 5.75% Senior Notes due 2018 (2018 Notes) and 2019 Notes,resulting in a loss on extinguishment of debt of $34 million, and amended and restated our $2.35 billion senior secured asset-based revolving credit facility (Revolving CreditFacility), which resulted in a loss on extinguishment of debt of $1 million.
During the fourth quarter of 2017, we repurchased and retired $40 million aggregate principal amount of our outstanding 2020 Notes resulting in a gain on extinguishment ofdebt of $2 million.
29

Table of Contents
Net Interest ExpenseNet interest expense consists principally of interest expense on long-term debt, net of interest income earned on cash and cash equivalents. In 2018, Net interest expense was$313 million, a decrease of $12 million, or 3.7%, from $325 million in 2017. The reduction in net interest expense is due to lower debt levels in 2018 compared to 2017.
Income TaxesOur deferred tax assets, which include the future tax benefits of our net operating loss carryforwards, are subject to a valuation allowance. At February 2, 2019, the federal andstate valuation allowances were $553 million and $249 million, respectively. Our deferred tax assets include the impact of re-measurement on U. S. deferred taxes at the lowerenacted corporate tax rate resulting from U. S. tax reform enacted in December 2017. Future book pre-tax losses will require additional valuation allowances to offset thedeferred tax assets created. Until such time that we achieve sufficient profitability to allow removal of most of our valuation allowance, utilization of our loss carryforwards willresult in a corresponding decrease in the valuation allowance and offset our tax provision dollar for dollar.
Each period we are required to allocate our income tax expense or benefit to continuing operations and other items such as other comprehensive income and stockholder’sequity. In accordance with these rules, when we have a loss in continuing operations and a gain in other comprehensive income, as arose in 2013, we are required to recognize atax benefit in continuing operations up to the amount of tax expense that we are required to report in other comprehensive income. In 2018, we experienced a loss in continuingoperations and income in other comprehensive income. Under the allocation rules, we are only required to recognize the valuation allowance allocable to the tax benefitattributable to losses in each component of comprehensive income. Accordingly, there is no valuation allowance offsetting a deferred tax benefit attributable to othercomprehensive income included in the total valuation allowance of $802 million noted above.
For 2018, we recorded a net tax benefit of $16 million. Tax benefit includes $16 million to adjust the valuation allowance, $1 million for state audit settlements and $11 millionrelated to other comprehensive income offset by tax expense of $4 million related to the amortization of certain indefinite-lived intangible assets, $7 million for federal, stateand foreign jurisdictions where loss carryforwards are limited or unavailable and $1 million for state law changes.
For 2017, we recorded a net tax benefit of $126 million. Tax benefit includes $75 million related to the re-measurement of the U. S. net deferred tax liabilities from 35% to 21%tax rate, $3 million to adjust the valuation allowance, $1 million for state audit settlements and $60 million related to other comprehensive income offset by tax expense of $7million related to the amortization of certain indefinite-lived intangible assets and $6 million for state and foreign jurisdictions where loss carryforwards are limited. Net Income/(Loss) and Adjusted Net Income/(Loss) (non-GAAP)In 2018, we reported a loss of $255 million, or $0.81 per share, compared with loss of $118 million, or $0.38 per share, in 2017. Excluding the impact of restructuring andmanagement transition charges, other components of periodic pension and postretirement benefit cost/(income), the loss on extinguishment of debt, the proportional share of netincome from joint venture, the tax impact resulting from other comprehensive income allocation, and the impact of tax reform, adjusted net income/(loss) (non-GAAP) was aloss of $296 million, or $0.94 per share, in 2018 compared to income of $31 million, or $0.10 per share, in 2017.
The reduction in net income/(loss) in 2018 was driven primarily by lower operating performance relative to the prior year.
Adjusted EBITDA (non-GAAP)In 2018, adjusted EBITDA was $568 million, a decline of $367 million for 2018 compared to adjusted EBITDA of $935 million for the prior year.
30
Table of Contents
2017 Compared to 2016
Total Net Sales
2017 2016Total net sales (in millions) $ 12,554 $ 12,571Sales percent increase/(decrease)
Total net sales (0.1 )% (1) (4.0 )%Comparable store sales(2) 0.1 % 0.0 %
Sales per gross square foot(3) $ 127 $ 121
(1) Includes the effect of the 53rd week in 2017. Excluding sales of $147 million for the 53rd week in 2017, total net sales decreased 1.3% in2017.
(2) Comparable store sales are presented on a 52-week basis and include sales from all stores, including sales from services, that have been open for 12 consecutive full fiscal months andInternet sales. Stores closed for an extended period are not included in comparable store sales calculations, while stores remodeled and minor expansions not requiring store closureremain in the calculations. Certain items, such as sales return estimates and store liquidation sales, are excluded from the Company's calculation. Our definition and calculation ofcomparable store sales may differ from other companies in the retail industry.
(3) Calculation includes the sales, including commission revenue, and square footage of department stores, including selling space allocated to services and licensed departments, that wereopen for the full fiscal year, as well as Internet sales.
Total net sales decreased $17 million in 2017 compared to 2016. The following table provides the components of the net sales decrease:
($ in millions) 2017Comparable store sales increase/(decrease) $ 12Sales related to new and closed stores, net (205 )Other revenues and sales adjustments (1) 176
Total net sales increase/(decrease) $ (17 )
(1) Includes sales of $147 million for the 53rd week in2017.
For 2017, units per transaction increased and average unit retail increased, while transaction counts decreased as compared to the prior year. On a geographic basis, all regionsexperienced comparable store sales decreases for 2017 compared to the prior year. During 2017, our Home, Jewelry, Sephora and Footwear and Handbags merchandisedivisions experienced sales increases. Home, which reflected the addition of 100 new appliance showrooms, experienced the highest sales increase.
During 2017, private brand merchandise comprised 46% of total merchandise sales, as compared to 44% in 2016. During 2017 and 2016, exclusive brand merchandisecomprised 7% and 8%, respectively, of total merchandise sales.
Credit Income and OtherOur private label credit card and co-branded MasterCard® programs are owned and serviced by Synchrony. Under our agreement, we receive cash payments from Synchronybased upon the performance of the credit card portfolio. We participate in the programs by providing marketing promotions designed to increase the use of each card, includingenhanced marketing offers for cardholders. Additionally, we accept payments in our stores from cardholders who prefer to pay in person when they are shopping in ourlocations. For 2017 and 2016, we recognized income of $319 million and $347 million, respectively, pursuant to our agreement with Synchrony.
Cost of Goods SoldCost of goods sold, exclusive of depreciation and amortization, increased to 65.4% of sales in 2017, or 100 basis points, compared to 2016. On a dollar basis, cost of goods soldincreased $111 million, or 1.4%, to $8,208 million in 2017 compared to $8,097 million in the prior year. The net 100 basis point increase was primarily driven by the liquidationof both closed store and slow-moving inventory, higher shrinkage rates and the continued growth in certain lower margin merchandise categories such as major appliances. SG&A ExpensesSG&A expenses declined $128 million to $3,845 million in 2017 compared to $3,973 million in 2016, primarily due to the closing of 138 stores. As a percent of sales, SG&Aexpenses were 30.6% compared to 31.6% in the prior year. The net 100
31
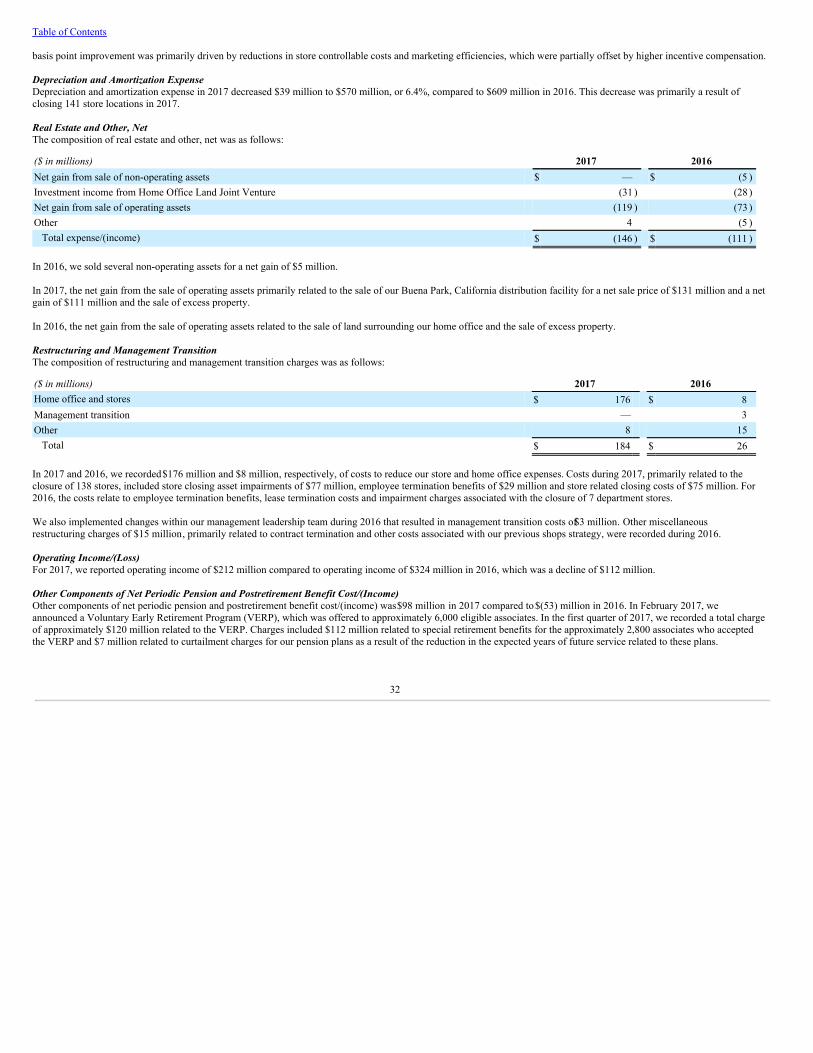
Table of Contents
basis point improvement was primarily driven by reductions in store controllable costs and marketing efficiencies, which were partially offset by higher incentive compensation.
Depreciation and Amortization ExpenseDepreciation and amortization expense in 2017 decreased $39 million to $570 million, or 6.4%, compared to $609 million in 2016. This decrease was primarily a result ofclosing 141 store locations in 2017.
Real Estate and Other, NetThe composition of real estate and other, net was as follows:
($ in millions) 2017 2016Net gain from sale of non-operating assets $ — $ (5 )Investment income from Home Office Land Joint Venture (31 ) (28 )Net gain from sale of operating assets (119 ) (73 )Other 4 (5 )
Total expense/(income) $ (146 ) $ (111 )
In 2016, we sold several non-operating assets for a net gain of $5 million.
In 2017, the net gain from the sale of operating assets primarily related to the sale of our Buena Park, California distribution facility for a net sale price of $131 million and a netgain of $111 million and the sale of excess property.
In 2016, the net gain from the sale of operating assets related to the sale of land surrounding our home office and the sale of excess property.
Restructuring and Management TransitionThe composition of restructuring and management transition charges was as follows:
($ in millions) 2017 2016Home office and stores $ 176 $ 8Management transition — 3Other 8 15
Total $ 184 $ 26
In 2017 and 2016, we recorded $176 million and $8 million, respectively, of costs to reduce our store and home office expenses. Costs during 2017, primarily related to theclosure of 138 stores, included store closing asset impairments of $77 million, employee termination benefits of $29 million and store related closing costs of $75 million. For2016, the costs relate to employee termination benefits, lease termination costs and impairment charges associated with the closure of 7 department stores.
We also implemented changes within our management leadership team during 2016 that resulted in management transition costs of $3 million. Other miscellaneousrestructuring charges of $15 million, primarily related to contract termination and other costs associated with our previous shops strategy, were recorded during 2016.
Operating Income/(Loss)For 2017, we reported operating income of $212 million compared to operating income of $324 million in 2016, which was a decline of $112 million.
Other Components of Net Periodic Pension and Postretirement Benefit Cost/(Income)Other components of net periodic pension and postretirement benefit cost/(income) was $98 million in 2017 compared to $(53) million in 2016. In February 2017, weannounced a Voluntary Early Retirement Program (VERP), which was offered to approximately 6,000 eligible associates. In the first quarter of 2017, we recorded a total chargeof approximately $120 million related to the VERP. Charges included $112 million related to special retirement benefits for the approximately 2,800 associates who acceptedthe VERP and $7 million related to curtailment charges for our pension plans as a result of the reduction in the expected years of future service related to these plans.
32
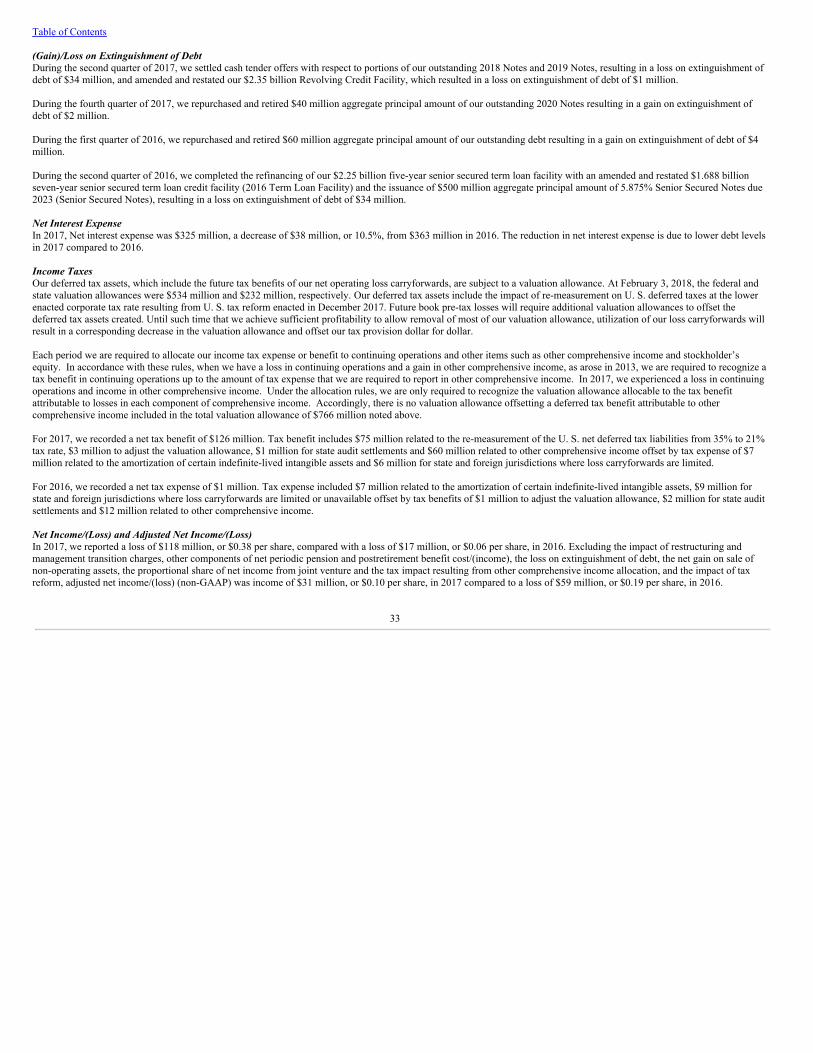
Table of Contents
(Gain)/Loss on Extinguishment of DebtDuring the second quarter of 2017, we settled cash tender offers with respect to portions of our outstanding 2018 Notes and 2019 Notes, resulting in a loss on extinguishment ofdebt of $34 million, and amended and restated our $2.35 billion Revolving Credit Facility, which resulted in a loss on extinguishment of debt of $1 million.
During the fourth quarter of 2017, we repurchased and retired $40 million aggregate principal amount of our outstanding 2020 Notes resulting in a gain on extinguishment ofdebt of $2 million.
During the first quarter of 2016, we repurchased and retired $60 million aggregate principal amount of our outstanding debt resulting in a gain on extinguishment of debt of $4million.
During the second quarter of 2016, we completed the refinancing of our $2.25 billion five-year senior secured term loan facility with an amended and restated $1.688 billionseven-year senior secured term loan credit facility (2016 Term Loan Facility) and the issuance of $500 million aggregate principal amount of 5.875% Senior Secured Notes due2023 (Senior Secured Notes), resulting in a loss on extinguishment of debt of $34 million.
Net Interest ExpenseIn 2017, Net interest expense was $325 million, a decrease of $38 million, or 10.5%, from $363 million in 2016. The reduction in net interest expense is due to lower debt levelsin 2017 compared to 2016.
Income TaxesOur deferred tax assets, which include the future tax benefits of our net operating loss carryforwards, are subject to a valuation allowance. At February 3, 2018, the federal andstate valuation allowances were $534 million and $232 million, respectively. Our deferred tax assets include the impact of re-measurement on U. S. deferred taxes at the lowerenacted corporate tax rate resulting from U. S. tax reform enacted in December 2017. Future book pre-tax losses will require additional valuation allowances to offset thedeferred tax assets created. Until such time that we achieve sufficient profitability to allow removal of most of our valuation allowance, utilization of our loss carryforwards willresult in a corresponding decrease in the valuation allowance and offset our tax provision dollar for dollar.
Each period we are required to allocate our income tax expense or benefit to continuing operations and other items such as other comprehensive income and stockholder’sequity. In accordance with these rules, when we have a loss in continuing operations and a gain in other comprehensive income, as arose in 2013, we are required to recognize atax benefit in continuing operations up to the amount of tax expense that we are required to report in other comprehensive income. In 2017, we experienced a loss in continuingoperations and income in other comprehensive income. Under the allocation rules, we are only required to recognize the valuation allowance allocable to the tax benefitattributable to losses in each component of comprehensive income. Accordingly, there is no valuation allowance offsetting a deferred tax benefit attributable to othercomprehensive income included in the total valuation allowance of $766 million noted above.
For 2017, we recorded a net tax benefit of $126 million. Tax benefit includes $75 million related to the re-measurement of the U. S. net deferred tax liabilities from 35% to 21%tax rate, $3 million to adjust the valuation allowance, $1 million for state audit settlements and $60 million related to other comprehensive income offset by tax expense of $7million related to the amortization of certain indefinite-lived intangible assets and $6 million for state and foreign jurisdictions where loss carryforwards are limited.
For 2016, we recorded a net tax expense of $1 million. Tax expense included $7 million related to the amortization of certain indefinite-lived intangible assets, $9 million forstate and foreign jurisdictions where loss carryforwards are limited or unavailable offset by tax benefits of $1 million to adjust the valuation allowance, $2 million for state auditsettlements and $12 million related to other comprehensive income.
Net Income/(Loss) and Adjusted Net Income/(Loss)In 2017, we reported a loss of $118 million, or $0.38 per share, compared with a loss of $17 million, or $0.06 per share, in 2016. Excluding the impact of restructuring andmanagement transition charges, other components of net periodic pension and postretirement benefit cost/(income), the loss on extinguishment of debt, the net gain on sale ofnon-operating assets, the proportional share of net income from joint venture and the tax impact resulting from other comprehensive income allocation, and the impact of taxreform, adjusted net income/(loss) (non-GAAP) was income of $31 million, or $0.10 per share, in 2017 compared to a loss of $59 million, or $0.19 per share, in 2016.
33
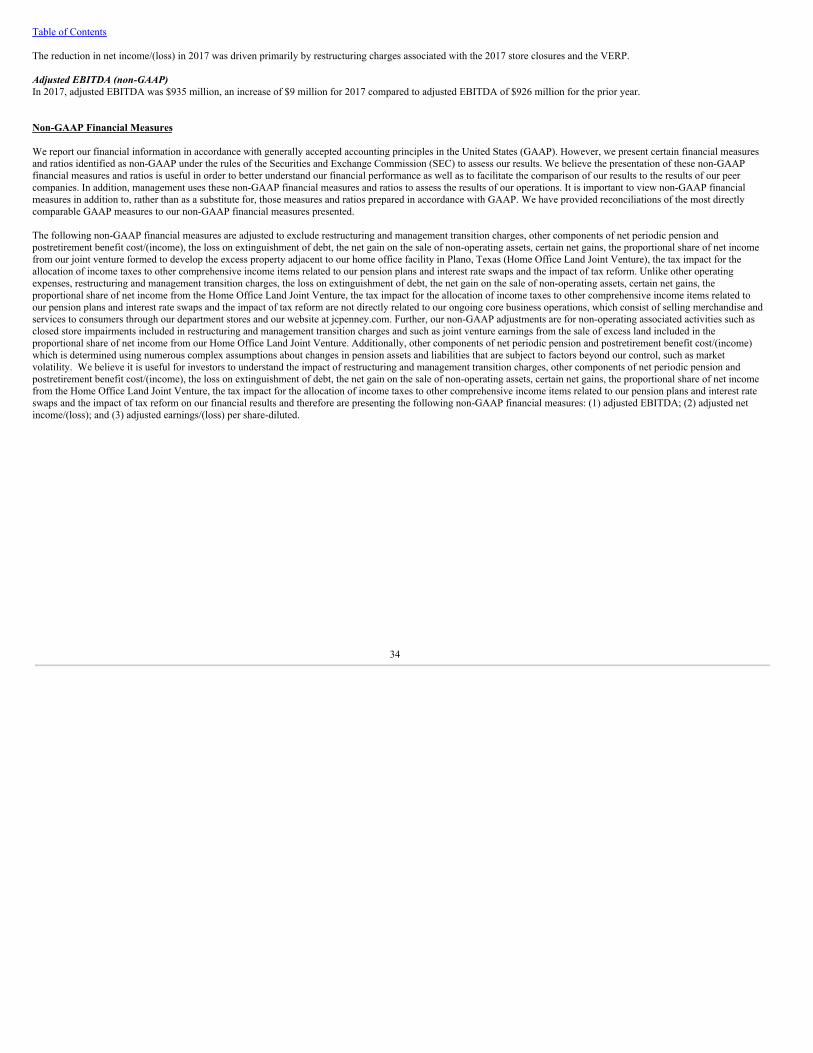
Table of Contents
The reduction in net income/(loss) in 2017 was driven primarily by restructuring charges associated with the 2017 store closures and the VERP.
Adjusted EBITDA (non-GAAP)In 2017, adjusted EBITDA was $935 million, an increase of $9 million for 2017 compared to adjusted EBITDA of $926 million for the prior year.
Non-GAAP Financial Measures
We report our financial information in accordance with generally accepted accounting principles in the United States (GAAP). However, we present certain financial measuresand ratios identified as non-GAAP under the rules of the Securities and Exchange Commission (SEC) to assess our results. We believe the presentation of these non-GAAPfinancial measures and ratios is useful in order to better understand our financial performance as well as to facilitate the comparison of our results to the results of our peercompanies. In addition, management uses these non-GAAP financial measures and ratios to assess the results of our operations. It is important to view non-GAAP financialmeasures in addition to, rather than as a substitute for, those measures and ratios prepared in accordance with GAAP. We have provided reconciliations of the most directlycomparable GAAP measures to our non-GAAP financial measures presented.
The following non-GAAP financial measures are adjusted to exclude restructuring and management transition charges, other components of net periodic pension andpostretirement benefit cost/(income), the loss on extinguishment of debt, the net gain on the sale of non-operating assets, certain net gains, the proportional share of net incomefrom our joint venture formed to develop the excess property adjacent to our home office facility in Plano, Texas (Home Office Land Joint Venture), the tax impact for theallocation of income taxes to other comprehensive income items related to our pension plans and interest rate swaps and the impact of tax reform. Unlike other operatingexpenses, restructuring and management transition charges, the loss on extinguishment of debt, the net gain on the sale of non-operating assets, certain net gains, theproportional share of net income from the Home Office Land Joint Venture, the tax impact for the allocation of income taxes to other comprehensive income items related toour pension plans and interest rate swaps and the impact of tax reform are not directly related to our ongoing core business operations, which consist of selling merchandise andservices to consumers through our department stores and our website at jcpenney.com. Further, our non-GAAP adjustments are for non-operating associated activities such asclosed store impairments included in restructuring and management transition charges and such as joint venture earnings from the sale of excess land included in theproportional share of net income from our Home Office Land Joint Venture. Additionally, other components of net periodic pension and postretirement benefit cost/(income)which is determined using numerous complex assumptions about changes in pension assets and liabilities that are subject to factors beyond our control, such as marketvolatility. We believe it is useful for investors to understand the impact of restructuring and management transition charges, other components of net periodic pension andpostretirement benefit cost/(income), the loss on extinguishment of debt, the net gain on the sale of non-operating assets, certain net gains, the proportional share of net incomefrom the Home Office Land Joint Venture, the tax impact for the allocation of income taxes to other comprehensive income items related to our pension plans and interest rateswaps and the impact of tax reform on our financial results and therefore are presenting the following non-GAAP financial measures: (1) adjusted EBITDA; (2) adjusted netincome/(loss); and (3) adjusted earnings/(loss) per share-diluted.
34
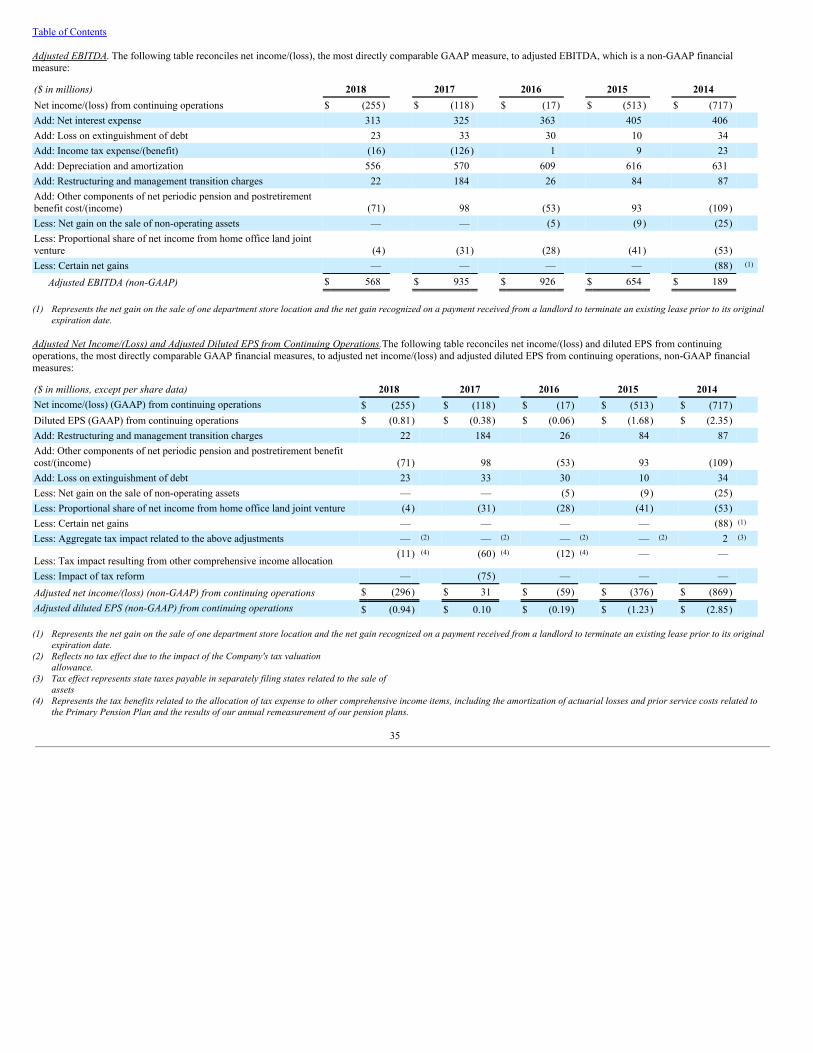
Table of Contents
Adjusted EBITDA. The following table reconciles net income/(loss), the most directly comparable GAAP measure, to adjusted EBITDA, which is a non-GAAP financialmeasure:
($ in millions) 2018 2017 2016 2015 2014 Net income/(loss) from continuing operations $ (255) $ (118) $ (17) $ (513) $ (717) Add: Net interest expense 313 325 363 405 406 Add: Loss on extinguishment of debt 23 33 30 10 34 Add: Income tax expense/(benefit) (16) (126) 1 9 23 Add: Depreciation and amortization 556 570 609 616 631 Add: Restructuring and management transition charges 22 184 26 84 87 Add: Other components of net periodic pension and postretirementbenefit cost/(income) (71) 98 (53) 93 (109) Less: Net gain on the sale of non-operating assets — — (5) (9) (25) Less: Proportional share of net income from home office land jointventure (4) (31) (28) (41) (53) Less: Certain net gains — — — — (88) (1)
Adjusted EBITDA (non-GAAP) $ 568 $ 935 $ 926 $ 654 $ 189
(1) Represents the net gain on the sale of one department store location and the net gain recognized on a payment received from a landlord to terminate an existing lease prior to its originalexpiration date.
Adjusted Net Income/(Loss) and Adjusted Diluted EPS from Continuing Operations. The following table reconciles net income/(loss) and diluted EPS from continuingoperations, the most directly comparable GAAP financial measures, to adjusted net income/(loss) and adjusted diluted EPS from continuing operations, non-GAAP financialmeasures:
($ in millions, except per share data) 2018 2017 2016 2015 2014 Net income/(loss) (GAAP) from continuing operations $ (255) $ (118) $ (17) $ (513) $ (717) Diluted EPS (GAAP) from continuing operations $ (0.81) $ (0.38) $ (0.06) $ (1.68) $ (2.35) Add: Restructuring and management transition charges 22 184 26 84 87 Add: Other components of net periodic pension and postretirement benefitcost/(income) (71) 98 (53) 93 (109) Add: Loss on extinguishment of debt 23 33 30 10 34 Less: Net gain on the sale of non-operating assets — — (5) (9) (25) Less: Proportional share of net income from home office land joint venture (4) (31) (28) (41) (53) Less: Certain net gains — — — — (88) (1) Less: Aggregate tax impact related to the above adjustments — (2) — (2) — (2) — (2) 2 (3)
Less: Tax impact resulting from other comprehensive income allocation(11) (4) (60) (4) (12) (4) — —
Less: Impact of tax reform — (75) — — — Adjusted net income/(loss) (non-GAAP) from continuing operations $ (296) $ 31 $ (59) $ (376) $ (869) Adjusted diluted EPS (non-GAAP) from continuing operations $ (0.94) $ 0.10 $ (0.19) $ (1.23) $ (2.85)
(1) Represents the net gain on the sale of one department store location and the net gain recognized on a payment received from a landlord to terminate an existing lease prior to its originalexpiration date.
(2) Reflects no tax effect due to the impact of the Company's tax valuationallowance.
(3) Tax effect represents state taxes payable in separately filing states related to the sale ofassets
(4) Represents the tax benefits related to the allocation of tax expense to other comprehensive income items, including the amortization of actuarial losses and prior service costs related tothe Primary Pension Plan and the results of our annual remeasurement of our pension plans.
35
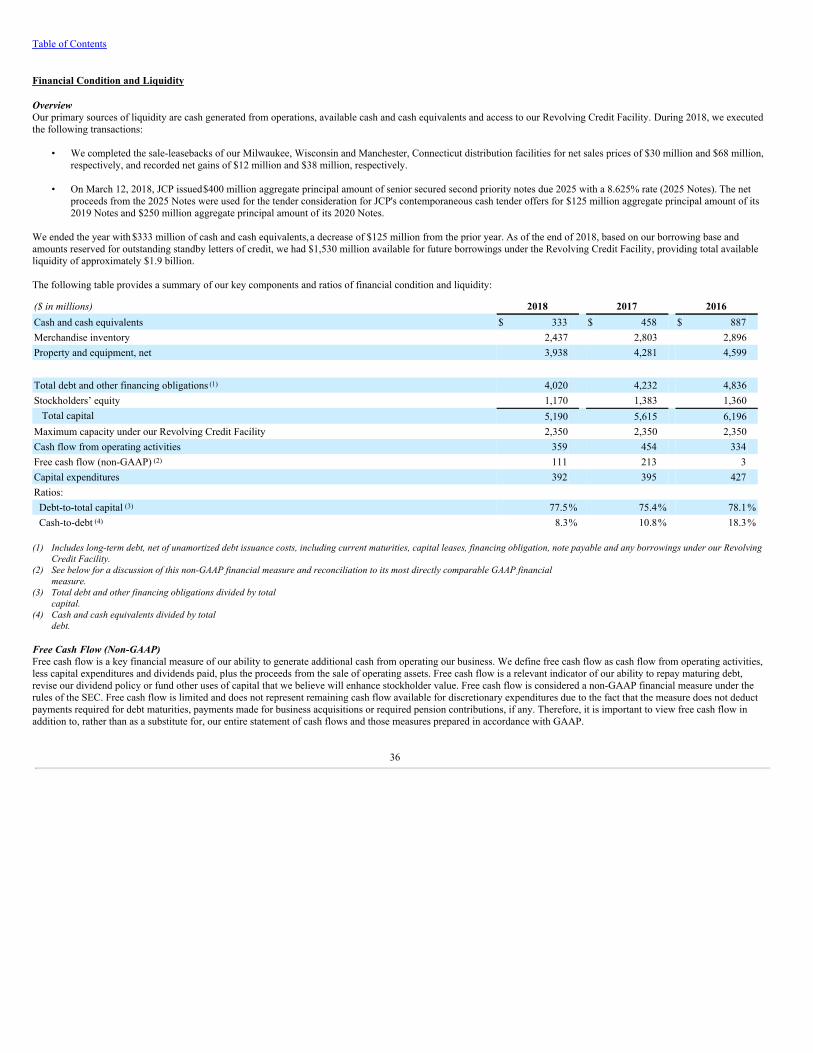
Table of Contents
Financial Condition and Liquidity
OverviewOur primary sources of liquidity are cash generated from operations, available cash and cash equivalents and access to our Revolving Credit Facility. During 2018, we executedthe following transactions:
• We completed the sale-leasebacks of our Milwaukee, Wisconsin and Manchester, Connecticut distribution facilities for net sales prices of $30 million and $68 million,respectively, and recorded net gains of $12 million and $38 million, respectively.
• On March 12, 2018, JCP issued $400 million aggregate principal amount of senior secured second priority notes due 2025 with a 8.625% rate (2025 Notes). The netproceeds from the 2025 Notes were used for the tender consideration for JCP's contemporaneous cash tender offers for $125 million aggregate principal amount of its2019 Notes and $250 million aggregate principal amount of its 2020 Notes.
We ended the year with $333 million of cash and cash equivalents, a decrease of $125 million from the prior year. As of the end of 2018, based on our borrowing base andamounts reserved for outstanding standby letters of credit, we had $1,530 million available for future borrowings under the Revolving Credit Facility, providing total availableliquidity of approximately $1.9 billion. The following table provides a summary of our key components and ratios of financial condition and liquidity:
($ in millions) 2018 2017 2016Cash and cash equivalents $ 333 $ 458 $ 887Merchandise inventory 2,437 2,803 2,896Property and equipment, net 3,938 4,281 4,599
Total debt and other financing obligations (1) 4,020 4,232 4,836Stockholders’ equity 1,170 1,383 1,360
Total capital 5,190 5,615 6,196Maximum capacity under our Revolving Credit Facility 2,350 2,350 2,350Cash flow from operating activities 359 454 334Free cash flow (non-GAAP) (2) 111 213 3Capital expenditures 392 395 427Ratios: Debt-to-total capital (3) 77.5% 75.4% 78.1% Cash-to-debt (4) 8.3% 10.8% 18.3%
(1) Includes long-term debt, net of unamortized debt issuance costs, including current maturities, capital leases, financing obligation, note payable and any borrowings under our Revolving
Credit Facility.(2) See below for a discussion of this non-GAAP financial measure and reconciliation to its most directly comparable GAAP financial
measure.(3) Total debt and other financing obligations divided by total
capital.(4) Cash and cash equivalents divided by total
debt.
Free Cash Flow (Non-GAAP)Free cash flow is a key financial measure of our ability to generate additional cash from operating our business. We define free cash flow as cash flow from operating activities,less capital expenditures and dividends paid, plus the proceeds from the sale of operating assets. Free cash flow is a relevant indicator of our ability to repay maturing debt,revise our dividend policy or fund other uses of capital that we believe will enhance stockholder value. Free cash flow is considered a non-GAAP financial measure under therules of the SEC. Free cash flow is limited and does not represent remaining cash flow available for discretionary expenditures due to the fact that the measure does not deductpayments required for debt maturities, payments made for business acquisitions or required pension contributions, if any. Therefore, it is important to view free cash flow inaddition to, rather than as a substitute for, our entire statement of cash flows and those measures prepared in accordance with GAAP.
36
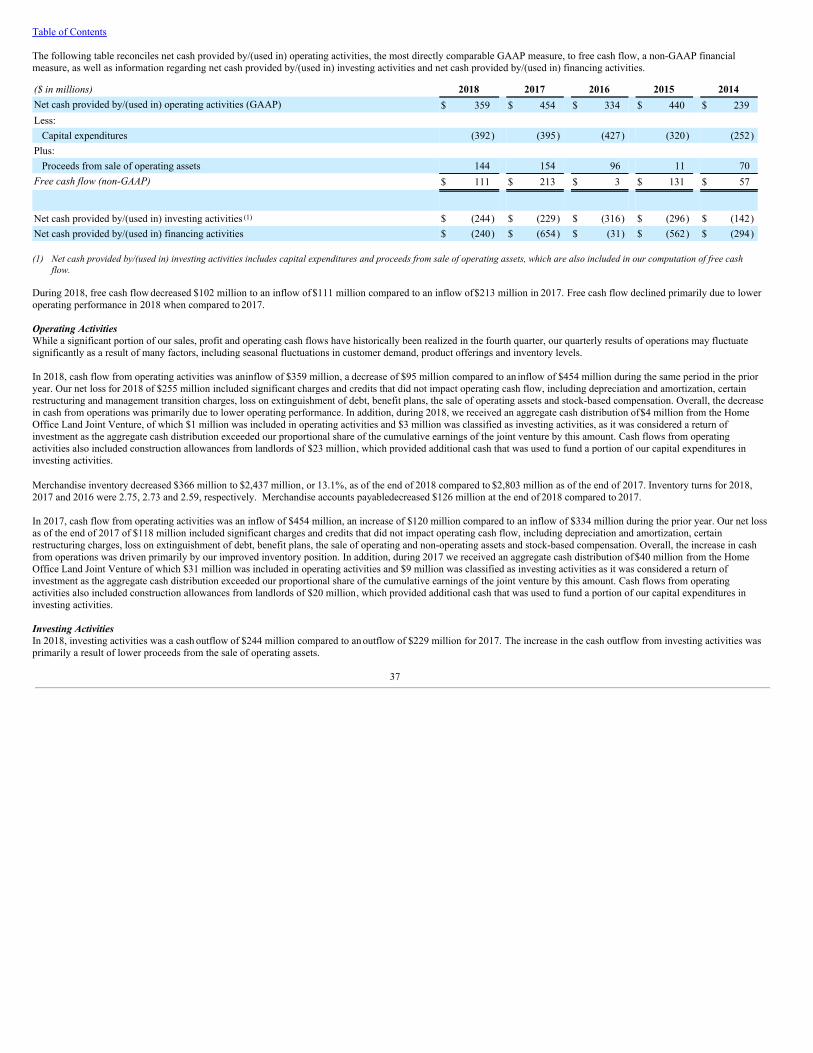
Table of Contents
The following table reconciles net cash provided by/(used in) operating activities, the most directly comparable GAAP measure, to free cash flow, a non-GAAP financialmeasure, as well as information regarding net cash provided by/(used in) investing activities and net cash provided by/(used in) financing activities.
($ in millions) 2018 2017 2016 2015 2014Net cash provided by/(used in) operating activities (GAAP) $ 359 $ 454 $ 334 $ 440 $ 239Less:
Capital expenditures (392) (395) (427) (320) (252)Plus:
Proceeds from sale of operating assets 144 154 96 11 70Free cash flow (non-GAAP) $ 111 $ 213 $ 3 $ 131 $ 57
Net cash provided by/(used in) investing activities (1) $ (244) $ (229) $ (316) $ (296) $ (142)Net cash provided by/(used in) financing activities $ (240) $ (654) $ (31) $ (562) $ (294)
(1) Net cash provided by/(used in) investing activities includes capital expenditures and proceeds from sale of operating assets, which are also included in our computation of free cash
flow.
During 2018, free cash flow decreased $102 million to an inflow of $111 million compared to an inflow of $213 million in 2017. Free cash flow declined primarily due to loweroperating performance in 2018 when compared to 2017.
Operating ActivitiesWhile a significant portion of our sales, profit and operating cash flows have historically been realized in the fourth quarter, our quarterly results of operations may fluctuatesignificantly as a result of many factors, including seasonal fluctuations in customer demand, product offerings and inventory levels.
In 2018, cash flow from operating activities was an inflow of $359 million, a decrease of $95 million compared to an inflow of $454 million during the same period in the prioryear. Our net loss for 2018 of $255 million included significant charges and credits that did not impact operating cash flow, including depreciation and amortization, certainrestructuring and management transition charges, loss on extinguishment of debt, benefit plans, the sale of operating assets and stock-based compensation. Overall, the decreasein cash from operations was primarily due to lower operating performance. In addition, during 2018, we received an aggregate cash distribution of $4 million from the HomeOffice Land Joint Venture, of which $1 million was included in operating activities and $3 million was classified as investing activities, as it was considered a return ofinvestment as the aggregate cash distribution exceeded our proportional share of the cumulative earnings of the joint venture by this amount. Cash flows from operatingactivities also included construction allowances from landlords of $23 million, which provided additional cash that was used to fund a portion of our capital expenditures ininvesting activities.
Merchandise inventory decreased $366 million to $2,437 million, or 13.1%, as of the end of 2018 compared to $2,803 million as of the end of 2017. Inventory turns for 2018,2017 and 2016 were 2.75, 2.73 and 2.59, respectively. Merchandise accounts payable decreased $126 million at the end of 2018 compared to 2017.
In 2017, cash flow from operating activities was an inflow of $454 million, an increase of $120 million compared to an inflow of $334 million during the prior year. Our net lossas of the end of 2017 of $118 million included significant charges and credits that did not impact operating cash flow, including depreciation and amortization, certainrestructuring charges, loss on extinguishment of debt, benefit plans, the sale of operating and non-operating assets and stock-based compensation. Overall, the increase in cashfrom operations was driven primarily by our improved inventory position. In addition, during 2017 we received an aggregate cash distribution of $40 million from the HomeOffice Land Joint Venture of which $31 million was included in operating activities and $9 million was classified as investing activities as it was considered a return ofinvestment as the aggregate cash distribution exceeded our proportional share of the cumulative earnings of the joint venture by this amount. Cash flows from operatingactivities also included construction allowances from landlords of $20 million, which provided additional cash that was used to fund a portion of our capital expenditures ininvesting activities.
Investing ActivitiesIn 2018, investing activities was a cash outflow of $244 million compared to an outflow of $229 million for 2017. The increase in the cash outflow from investing activities wasprimarily a result of lower proceeds from the sale of operating assets.
37
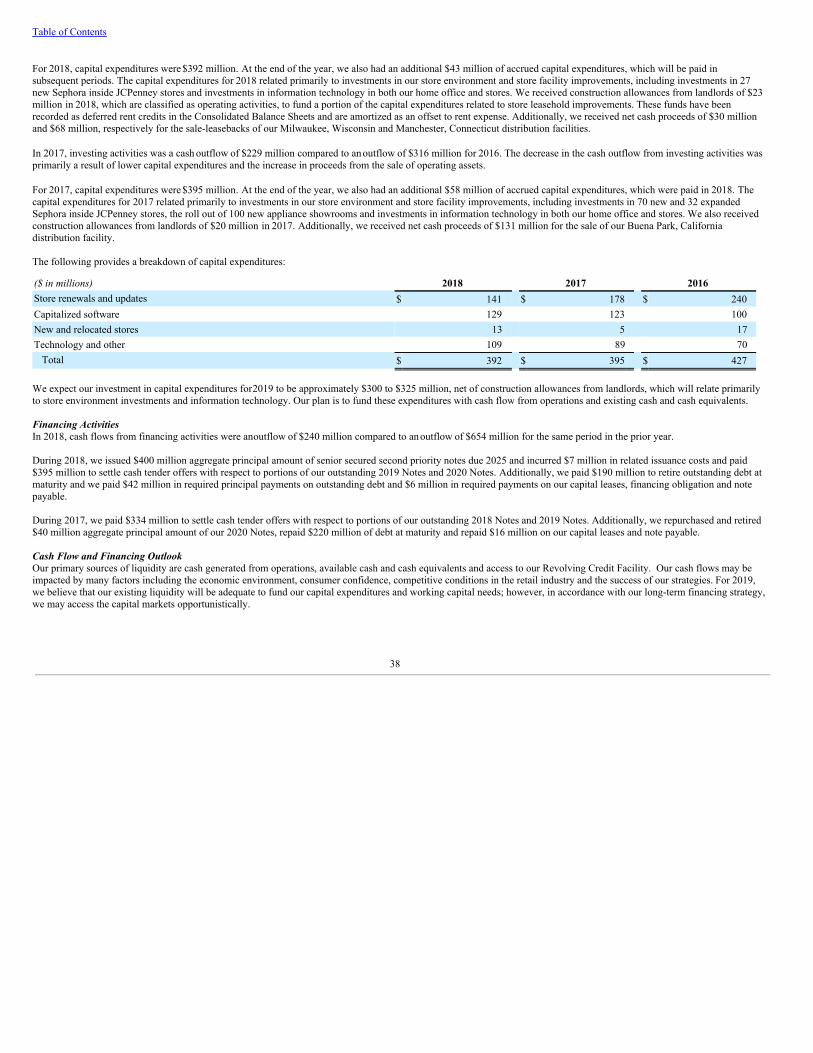
Table of Contents
For 2018, capital expenditures were $392 million. At the end of the year, we also had an additional $43 million of accrued capital expenditures, which will be paid insubsequent periods. The capital expenditures for 2018 related primarily to investments in our store environment and store facility improvements, including investments in 27new Sephora inside JCPenney stores and investments in information technology in both our home office and stores. We received construction allowances from landlords of $23million in 2018, which are classified as operating activities, to fund a portion of the capital expenditures related to store leasehold improvements. These funds have beenrecorded as deferred rent credits in the Consolidated Balance Sheets and are amortized as an offset to rent expense. Additionally, we received net cash proceeds of $30 millionand $68 million, respectively for the sale-leasebacks of our Milwaukee, Wisconsin and Manchester, Connecticut distribution facilities.
In 2017, investing activities was a cash outflow of $229 million compared to an outflow of $316 million for 2016. The decrease in the cash outflow from investing activities wasprimarily a result of lower capital expenditures and the increase in proceeds from the sale of operating assets.
For 2017, capital expenditures were $395 million. At the end of the year, we also had an additional $58 million of accrued capital expenditures, which were paid in 2018. Thecapital expenditures for 2017 related primarily to investments in our store environment and store facility improvements, including investments in 70 new and 32 expandedSephora inside JCPenney stores, the roll out of 100 new appliance showrooms and investments in information technology in both our home office and stores. We also receivedconstruction allowances from landlords of $20 million in 2017. Additionally, we received net cash proceeds of $131 million for the sale of our Buena Park, Californiadistribution facility.
The following provides a breakdown of capital expenditures:
($ in millions) 2018 2017 2016Store renewals and updates $ 141 $ 178 $ 240Capitalized software 129 123 100New and relocated stores 13 5 17Technology and other 109 89 70
Total $ 392 $ 395 $ 427
We expect our investment in capital expenditures for 2019 to be approximately $300 to $325 million, net of construction allowances from landlords, which will relate primarilyto store environment investments and information technology. Our plan is to fund these expenditures with cash flow from operations and existing cash and cash equivalents.
Financing ActivitiesIn 2018, cash flows from financing activities were an outflow of $240 million compared to an outflow of $654 million for the same period in the prior year.
During 2018, we issued $400 million aggregate principal amount of senior secured second priority notes due 2025 and incurred $7 million in related issuance costs and paid$395 million to settle cash tender offers with respect to portions of our outstanding 2019 Notes and 2020 Notes. Additionally, we paid $190 million to retire outstanding debt atmaturity and we paid $42 million in required principal payments on outstanding debt and $6 million in required payments on our capital leases, financing obligation and notepayable.
During 2017, we paid $334 million to settle cash tender offers with respect to portions of our outstanding 2018 Notes and 2019 Notes. Additionally, we repurchased and retired$40 million aggregate principal amount of our 2020 Notes, repaid $220 million of debt at maturity and repaid $16 million on our capital leases and note payable.
Cash Flow and Financing OutlookOur primary sources of liquidity are cash generated from operations, available cash and cash equivalents and access to our Revolving Credit Facility. Our cash flows may beimpacted by many factors including the economic environment, consumer confidence, competitive conditions in the retail industry and the success of our strategies. For 2019,we believe that our existing liquidity will be adequate to fund our capital expenditures and working capital needs; however, in accordance with our long-term financing strategy,we may access the capital markets opportunistically.
38
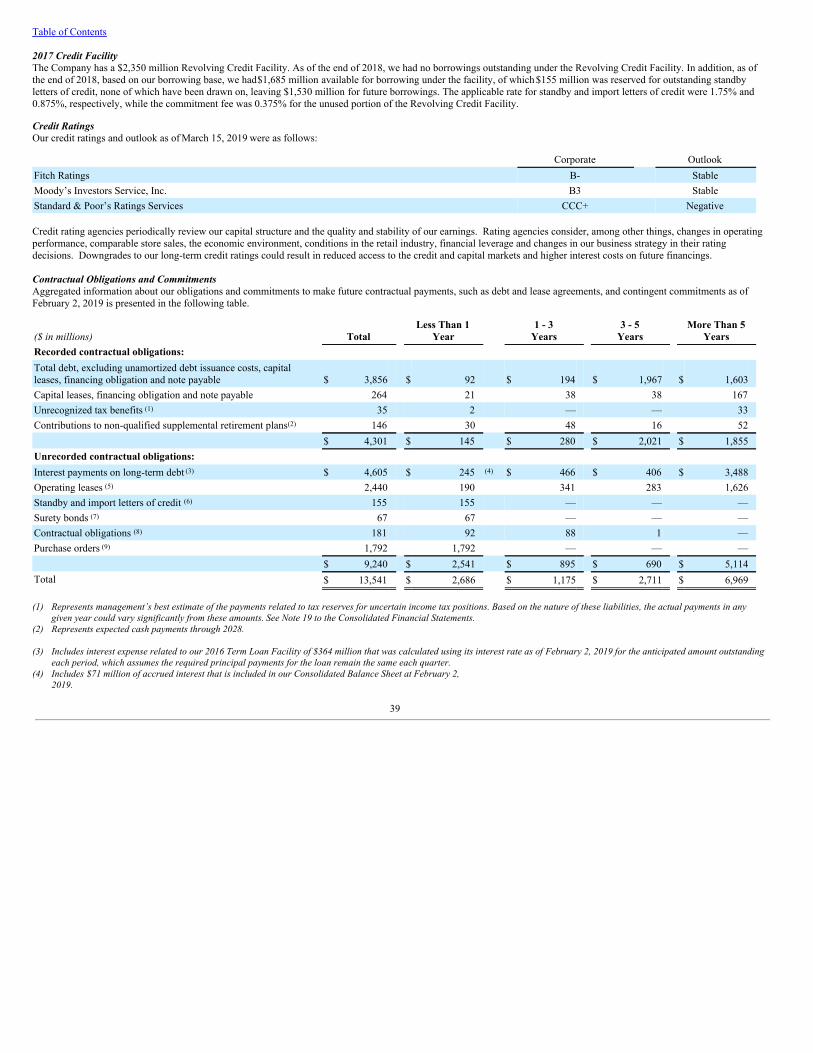
Table of Contents
2017 Credit FacilityThe Company has a $2,350 million Revolving Credit Facility. As of the end of 2018, we had no borrowings outstanding under the Revolving Credit Facility. In addition, as ofthe end of 2018, based on our borrowing base, we had $1,685 million available for borrowing under the facility, of which $155 million was reserved for outstanding standbyletters of credit, none of which have been drawn on, leaving $1,530 million for future borrowings. The applicable rate for standby and import letters of credit were 1.75% and0.875%, respectively, while the commitment fee was 0.375% for the unused portion of the Revolving Credit Facility.
Credit RatingsOur credit ratings and outlook as of March 15, 2019 were as follows:
Corporate OutlookFitch Ratings B- StableMoody’s Investors Service, Inc. B3 StableStandard & Poor’s Ratings Services CCC+ Negative
Credit rating agencies periodically review our capital structure and the quality and stability of our earnings. Rating agencies consider, among other things, changes in operatingperformance, comparable store sales, the economic environment, conditions in the retail industry, financial leverage and changes in our business strategy in their ratingdecisions. Downgrades to our long-term credit ratings could result in reduced access to the credit and capital markets and higher interest costs on future financings.
Contractual Obligations and CommitmentsAggregated information about our obligations and commitments to make future contractual payments, such as debt and lease agreements, and contingent commitments as ofFebruary 2, 2019 is presented in the following table.
($ in millions) Total Less Than 1
Year 1 - 3
Years 3 - 5
Years More Than 5
YearsRecorded contractual obligations: Total debt, excluding unamortized debt issuance costs, capitalleases, financing obligation and note payable $ 3,856 $ 92 $ 194 $ 1,967 $ 1,603Capital leases, financing obligation and note payable 264 21 38 38 167Unrecognized tax benefits (1) 35 2 — — 33Contributions to non-qualified supplemental retirement plans (2) 146 30 48 16 52 $ 4,301 $ 145 $ 280 $ 2,021 $ 1,855Unrecorded contractual obligations: Interest payments on long-term debt (3) $ 4,605 $ 245 (4) $ 466 $ 406 $ 3,488Operating leases (5) 2,440 190 341 283 1,626Standby and import letters of credit (6) 155 155 — — —Surety bonds (7) 67 67 — — —Contractual obligations (8) 181 92 88 1 —Purchase orders (9) 1,792 1,792 — — — $ 9,240 $ 2,541 $ 895 $ 690 $ 5,114Total $ 13,541 $ 2,686 $ 1,175 $ 2,711 $ 6,969
(1) Represents management’s best estimate of the payments related to tax reserves for uncertain income tax positions. Based on the nature of these liabilities, the actual payments in any
given year could vary significantly from these amounts. See Note 19 to the Consolidated Financial Statements.(2) Represents expected cash payments through 2028.
(3) Includes interest expense related to our 2016 Term Loan Facility of $364 million that was calculated using its interest rate as of February 2, 2019 for the anticipated amount outstanding
each period, which assumes the required principal payments for the loan remain the same each quarter.(4) Includes $71 million of accrued interest that is included in our Consolidated Balance Sheet at February 2,
2019.
39
Table of Contents
(5) Represents future minimum lease payments for non-cancelable operating leases, including renewals determined to be reasonably assured. Future minimum lease payments have not beenreduced for sublease income.
(6) Standby letters of credit, which totaled $155 million, are issued as collateral to a third-party administrator for self-insured workers’ compensation and general liability claims and tosupport our merchandise initiatives. There were no outstanding import letters of credit at February 2, 2019.
(7) Surety bonds are primarily for previously incurred and expensed obligations related to workers’ compensation and general liabilityclaims.
(8) Consists primarily of (a) minimum purchase requirements for exclusive merchandise and fixtures; (b) royalty obligations; and (c) minimum obligations for professional services, energyservices, software maintenance and network services.
(9) Amounts committed under open purchase orders for merchandise inventory of which a significant portion are cancelable without penalty prior to a date that precedes the vendor’sscheduled shipment date.
Off-Balance Sheet Arrangements Management considers all on- and off-balance sheet debt in evaluating our overall liquidity position and capital structure. Other than operating leases, which are included in theContractual Obligations and Commitments table, we do not have any material off-balance sheet financing. See detailed disclosure regarding operating leases in Note 15 to theConsolidated Financial Statements.
We do not have any additional arrangements or relationships with entities that are not consolidated into the financial statements.
Impact of Inflation, Deflation and Changing PricesWe have experienced inflation and deflation related to our purchase of certain commodity products. We do not believe that changing prices for commodities have had a materialeffect on our Net Sales or results of operations. Although we cannot precisely determine the overall effect of inflation and deflation on operations, we do not believe inflationand deflation have hada material effect on our financial condition or results of operations.
Critical Accounting Policies
The preparation of our financial statements in conformity with accounting principles generally accepted in the United States requires that we make estimates and useassumptions that in some instances may materially affect amounts reported in the accompanying Consolidated Financial Statements. In preparing these financial statements, wehave made our best estimates and judgments based on history and current trends, as well as other factors that we believe are relevant at the time of the preparation of ourConsolidated Financial Statements. Historically, actual results have not differed materially from estimates; however, future events and their effects cannot be determined withcertainty and as a result, actual results could differ from our assumptions and estimates.
See Note 2 to the Consolidated Financial Statements for a description of our significant accounting policies.
Inventory Valuation under the Retail MethodInventories are valued at the lower of cost (using the first-in, first-out or “FIFO” method) or market, determined under the Retail Inventory Method (RIM). Under RIM, retailvalues of merchandise groups are converted to a cost basis by applying the specific average cost-to-retail ratio related to each merchandise grouping. RIM inherently requiresmanagement judgment and certain estimates that may significantly impact the ending inventory valuation at cost, as well as our Cost of goods sold. The most significantestimates are permanent reductions to retail prices (markdowns) and permanent devaluation of inventory (markdown accruals) used primarily to clear seasonal merchandise orotherwise slow-moving inventory and inventory shortage (shrinkage).
Permanent markdowns and markdown accruals are designated for clearance activity and are recorded at the point of decision, when the utility of inventory has diminished,versus the point of sale. Factors considered in the determination of permanent markdowns and markdown accruals include current and anticipated demand, customerpreferences, age of the merchandise and style trends. Under RIM, permanent markdowns and markdown accruals result in the devaluation of inventory and the correspondingincrease to cost of goods sold is recognized in the period the decision to execute the markdown is made. Shrinkage accruals are estimated as a percent of sales for a given periodbased on physical inventories or cycle count activities. Physical inventory counts for stores are taken at least annually and cycle count activities for distribution centers andregional warehouses are executed on a daily basis. Inventory records and shrinkage accruals are adjusted appropriately based on the actual results from physical inventories andcycle counts. The shrinkage rate from the most recent physical inventory and cycle count activity, in combination with current events and historical experience, is used as thestandard for the shrinkage accrual rate for the next inventory cycle or cycle count activity. Historically, our actual physical inventory and cycle counts results have
40
Table of Contents
shown our estimates to be reliable. Based on prior experience, we do not believe that the actual results will differ significantly from the assumptions used in these estimates.
Valuation of Long-Lived and Indefinite-Lived AssetsLong-Lived AssetsWe evaluate recoverability of long-lived assets, such as property and equipment, whenever events or changes in circumstances indicate that the carrying value may not berecoverable, such as historical operating losses or plans to close stores and dispose of or sell long-lived assets before the end of their previously estimated useful lives.Additionally, annual operating performance of individual stores are periodically analyzed to identify potential underperforming stores which may require further evaluation ofthe recoverability of the carrying amounts. If our further evaluations of underperforming stores, performed on an undiscounted cash flow basis, indicate that the carryingamount of the asset may not be recoverable, the potential impairment is measured as the excess of carrying value over the fair value of the impaired asset. The impairmentcalculation requires us to apply estimates for future cash flows and use judgments for qualitative factors such as local market conditions, operating environment, mallperformance and other trends. We estimate fair value based on either a projected discounted cash flow method using a discount rate that is considered commensurate with therisk inherent in our current business model or a appraised value method, as appropriate.
We recognize impairment losses in the earliest period that it is determined a loss has occurred. The carrying value is adjusted to the new carrying value and any subsequentincreases in fair value are not recorded. If it is determined that the estimated remaining useful life of the asset should be decreased, the periodic depreciation expense is adjustedbased on the new carrying value of the asset. Impairment losses totaling $52 million in 2018 related to the Company's three airplanes that were sold during the year wererecorded in the Consolidated Statement of Operations in the line item Real estate and other, net. Impairment losses totaling $77 million in 2017 that related to the Company'sclosure of 138 stores were recorded in the Consolidated Statement of Operations in the line item Restructuring and management transition.
While we do not believe there is a reasonable likelihood that there will be a material change in our estimates or assumptions used to calculate long-lived asset impairments, ifactual results are not consistent with our current estimates and assumptions, we may be exposed to additional impairment charges, which could be material to our results ofoperations.
Indefinite-Lived AssetsWe assess the recoverability of indefinite-lived intangible assets at least annually during the fourth quarter of our fiscal year or whenever events or changes in circumstancesindicate that the carrying amount of the indefinite-lived intangible asset may not be fully recoverable. Examples of a change in events or circumstances include, but are notlimited to, a decrease in the market price of the asset, a history of cash flow losses related to the use of the asset or a significant adverse change in the extent or manner in whichan asset is being used. For our 2018 annual impairment test, we tested our indefinite-lived intangible assets utilizing the relief from royalty method to determine the estimatedfair value for each indefinite-lived intangible asset. The relief from royalty method estimates our theoretical royalty savings from ownership of the intangible asset. Keyassumptions used in this model include discount rates, royalty rates, growth rates, sales projections and terminal value rates. Discount rates, royalty rates, growth rates and salesprojections are the assumptions most sensitive and susceptible to change as they require significant management judgment. Discount rates used are similar to the ratesestimated by the weighted average cost of capital considering any differences in company-specific risk factors. Royalty rates are established by management based oncomparable trademark licensing agreements in the market. Operational management, considering industry and company-specific historical and projected data, develops growthrates and sales projections associated with each indefinite-lived intangible asset. Terminal value rate determination follows common methodology of capturing the present valueof perpetual sales estimates beyond the last projected period assuming a constant weighted average cost of capital and long-term growth rates.
While we do not believe there is a reasonable likelihood that there will be a material change in our estimates or assumptions used to calculate indefinite-lived asset impairments,if actual results are not consistent with our current estimates and assumptions, we may be exposed to additional impairment charges, which could be material to our results ofoperations.
Valuation of Deferred Tax AssetsWe account for income taxes using the asset and liability method. Deferred tax assets and liabilities are recognized for the future tax consequences attributable to differencesbetween the financial statement carrying amounts of existing assets and liabilities and their respective tax bases and operating loss and tax credit carryforwards. Deferred taxassets and liabilities are measured using enacted tax rates expected to apply to taxable income in the years in which those temporary differences are expected to be recovered orsettled. The effect on deferred tax assets and liabilities of a change in tax rates is recognized in
41
Table of Contents
income in the period that includes the enactment date. A valuation allowance is recorded to reduce the carrying amounts of deferred tax assets unless it is more likely than notsuch assets will be realized.
In assessing the need for a valuation allowance, we consider both positive and negative evidence related to the likelihood of the realization of the deferred tax assets based onfuture events. Our accounting for deferred tax consequences represents our best estimate of those future events. If based on the weight of available evidence, it is more likelythan not (defined as a likelihood of more than 50%) the deferred tax assets will not be realized, we record a valuation allowance. The weight given to both positive and negativeevidence is commensurate with the extent to which the evidence may be objectively verified. As such, it is generally difficult for positive evidence regarding projected futuretaxable income, exclusive of reversing taxable temporary differences, to outweigh objective negative evidence of recent losses. Cumulative losses in recent years are asignificant piece of negative evidence that is difficult to overcome in determining that a valuation allowance is not needed against deferred tax assets.
This assessment is completed on a taxing jurisdiction basis and takes into account several types of evidence, including the following:
• Nature, frequency, and severity of current and cumulative financial reporting losses. A pattern of recent losses is heavily weighted as a source of negative evidence. Incertain circumstances, historical information may not be as relevant due to a change in circumstances.
• Sources of future taxable income. Future reversals of existing temporary differences are heavily weighted sources of objectively verifiable positive evidence.Projections of future taxable income, exclusive of reversing temporary differences, are a source of positive evidence only when the projections are combined with ahistory of recent profits and can be reasonably estimated. Otherwise, these projections are considered inherently subjective and generally will not be sufficient toovercome negative evidence that includes cumulative losses in recent years, particularly if the projected future taxable income is dependent on an anticipatedturnaround to profitability that has not yet been achieved. In such cases, we generally give these projections of future taxable income no weight for the purposes of ourvaluation allowance assessment.
• Tax planning strategies. If necessary and available, tax-planning strategies would be implemented to accelerate taxable amounts to utilize expiring net operating losscarryforwards. These strategies would be a source of additional positive evidence and, depending on their nature, could be heavily weighted.
In the second quarter of 2013, our net deferred tax position, exclusive of any valuation allowance, changed from a net deferred tax liability to a net deferred tax asset. In ourassessment of the need for a valuation allowance, we heavily weighted the negative evidence of cumulative losses in recent periods and the positive evidence of future reversalsof existing temporary differences. Although a sizable portion of our losses in recent years were the result of charges incurred for restructuring and other special items, evenwithout these charges we still would have incurred significant losses. Accordingly, we considered our pattern of recent losses to be relevant to our analysis. Considering thispattern of recent losses and the uncertainties associated with projected future taxable income exclusive of reversing temporary differences, we gave no weight to projectionsshowing future U.S. taxable income for purposes of assessing the need for a valuation allowance. As a result of our assessment, we concluded that, beginning in the secondquarter of 2013, our estimate of the realization of deferred tax assets would be based solely on future reversals of existing taxable temporary differences and tax planningstrategies that we would make use of to accelerate taxable income to utilize expiring carryforwards.
Future book pre-tax losses will require additional valuation allowances to offset the deferred tax assets created. A sustained period of profitability is required before we wouldchange our need for a valuation allowance against our net deferred tax assets. Additionally, under the U.S. Tax Cuts and Jobs Act, additional NOLs that the Company mayrecognize in the future would not expire but would only be available to offset up to 80% of the Company’s future taxable income.
See Note 19 to the Consolidated Financial Statements for more information regarding income taxes and also Risk Factors, Item 1A.
PensionPension AccountingWe maintain a qualified funded defined benefit pension plan (Primary Pension Plan) and smaller non-qualified unfunded supplemental defined benefit plans. The determinationof pension expense is the result of actuarial calculations that are based on important assumptions about pension assets and liabilities. The most important of these are theexpected rate of return on assets and the discount rate assumptions. These assumptions require significant judgment and a change in any one of them
42
Table of Contents
could have a material impact on pension expense reported in our Consolidated Statements of Operations and Consolidated Statements of Comprehensive Income/(Loss), as wellas in the assets, liability and equity sections of the Consolidated Balance Sheets.
The following table reflects our expected rate of return and discount rate assumptions:
2018 2017 2016 Expected return on plan assets 6.50 % 6.50 % 6.75 % Discount rate for pension expense 3.98 % 4.40 % 4.73 % Discount rate for pension obligation 4.33 % 3.98 % 4.40 %
Return on Plan Assets and Impact on EarningsFor the Primary Pension Plan, we apply our expected return on plan assets using fair market value as of the annual measurement date. The fair market value method results ingreater volatility to our pension expense than the more commonly used calculated value method (referred to as smoothing of assets). Our Primary Pension Plan asset baseconsists of a mix of equities (U.S., non-U.S. and private), fixed income (investment-grade and high-yield), real estate (private and public) and alternative asset classes.
The expected return on plan assets is based on the plan’s long-term asset allocation policy, historical returns for plan assets and overall capital market returns, taking intoaccount current and expected market conditions.
Discount RateThe discount rate used to measure pension expense each year is the rate as of the beginning of the year (i.e., the prior measurement date). The discount rate, as determined bythe plan actuary, is based on a hypothetical AA yield curve represented by a series of bonds maturing over the next 30 years, designed to match the corresponding pensionbenefit cash payments to retirees.
For 2018, the discount rate to measure pension expense was 3.98% compared to 4.40% in 2017. The discount rate to measure the pension obligations increased to 4.33% as ofFebruary 2, 2019 from 3.98% as of February 3, 2018.
SensitivityThe sensitivity of pension expense to a plus or minus one-half of one percent of expected return on assets is a decrease or increase in pension expense of approximately $15million. An increase in the discount rate of one-half of one percent would increase the 2019 pension expense by approximately $6 million and a decrease in the discount rate ofone-half of one percent would decrease pension expense by approximately $7 million.
Pension FundingFunding requirements for our Primary Pension Plan are determined under Employee Retirement Income Security Act of 1974 (ERISA) rules, as amended by the PensionProtection Act of 2006. As a result of the funded status of the Primary Pension Plan, we are not required to make cash contributions in 2019.
Recent Accounting Pronouncements
Refer to Note 4 to the Consolidated Financial Statements for discussion of recent accounting pronouncements.
Cautionary Statement Regarding Forward-Looking Information
This Annual Report on Form 10-K contains forward-looking statements within the meaning of the Private Securities Litigation Reform Act of 1995, which reflect our currentview of future events and financial performance. Words such as "expect" and similar expressions identify forward-looking statements, which include, but are not limited to,statements regarding sales, cost of goods sold, selling, general and administrative expenses, earnings, cash flows and liquidity. Forward-looking statements are based only onthe Company's current assumptions and views of future events and financial performance. They are subject to known and unknown risks and uncertainties, many of which areoutside of the Company's control, that may cause the Company's actual results to be materially different from planned or expected results. Those risks and uncertainties include,but are not limited to, general economic conditions, including inflation, recession, unemployment levels, consumer confidence and spending patterns, credit availability anddebt levels, changes in store traffic trends, the cost of goods, more stringent or costly payment terms and/or the decision by a significant number of vendors not to sell usmerchandise on a timely basis or at all,
43
Table of Contents
trade restrictions, the ability to monetize non-core assets on acceptable terms, the ability to implement our strategic plan including our omnichannel initiatives, customeracceptance of our strategies, our ability to attract, motivate and retain key executives and other associates, the impact of cost reduction initiatives, our ability to generate ormaintain liquidity, implementation of new systems and platforms, changes in tariff, freight and shipping rates, changes in the cost of fuel and other energy and transportationcosts, disruptions and congestion at ports through which we import goods, increases in wage and benefit costs, competition and retail industry consolidations, interest ratefluctuations, dollar and other currency valuations, the impact of weather conditions, risks associated with war, an act of terrorism or pandemic, the ability of the federalgovernment to fund and conduct its operations, a systems failure and/or security breach that results in the theft, transfer or unauthorized disclosure of customer, employee orCompany information, legal and regulatory proceedings and the Company's ability to access the debt or equity markets on favorable terms or at all. There can be no assurancesthat the Company will achieve expected results, and actual results may be materially less than expectations. While we believe that our assumptions are reasonable, we cautionthat it is impossible to predict the degree to which any such factors could cause actual results to differ materially from predicted results. For additional discussion on risks anduncertainties, see Part I, Item 1A, Risk Factors, above. We intend the forward-looking statements in this Annual Report on Form 10-K to speak only as of the date of this reportand do not undertake to update or revise such statements as more information becomes available.
Item 7A. Quantitative and Qualitative Disclosures about Market Risk
All of our outstanding notes and debentures as of February 2, 2019 are at fixed interest rates and would not be affected by interest rate changes. The Revolving Credit Facilityborrowings under the 2017 Credit Facility are affected by interest rate changes. As of February 2, 2019, we had no borrowings outstanding under the Revolving Credit Facility.
The Company's 2016 Term Loan Facility bears interest at a variable rate of LIBOR plus 4.25%. To manage the fluctuation of interest, the Company entered into interest rateswap agreements with notional amounts totaling $1,250 million to fix a portion of our variable LIBOR-based interest payments. The interest rate swap agreements, which wereeffective May 7, 2015, have a weighted-average fixed rate of 2.04%, mature on May 7, 2020 and have been designated as cash flow hedges. The Company entered intoadditional interest rate swap agreements with notional amounts totaling $750 million to fix a portion of our variable LIBOR-based interest payments. The interest rate swapagreements have a weighted-average fixed rate of 3.135%, are effective from May 7, 2020 to May 7, 2025 and have been designated as cash flow hedges. Accordingly, a 100basis point increase in LIBOR interest rates would result in additional annual interest expense of $16 million under the 2016 Term Loan Facility and $13 million in less annualinterest expense under the interest rate swap agreements.
The effects of changes in the U.S. equity and bond markets serve to increase or decrease the value of assets in our Primary Pension Plan. We seek to manage exposure to adverseequity and bond returns by maintaining diversified investment portfolios and utilizing professional investment managers.
Item 8. Financial Statements and Supplementary Data
See the Index to Consolidated Financial Statements on page 57.
Item 9. Changes in and Disagreements with Accountants on Accounting and Financial Disclosure
None.
Item 9A. Controls and Procedures
Conclusion Regarding the Effectiveness of Disclosure Controls and Procedures
The management of our Company, under the supervision and with the participation of our principal executive officer and principal financial officer, conducted an evaluation ofthe effectiveness of the design and operation of our disclosure controls and procedures (as defined in Rules 13a-15(e) and 15d-15(e) under the Securities Exchange Act of 1934(the Exchange Act)) as of the end of the period covered by this Annual Report on Form 10-K. Based on this evaluation, our principal executive officer and principal financialofficer concluded that our disclosure controls and procedures are effective to ensure that information required to be disclosed by us in the reports that we file or submit underthe Exchange Act (i) is recorded, processed, summarized and reported within the time periods specified in the Securities and Exchange Commission’s rules and forms and (ii) isaccumulated and communicated to management, including our principal executive officer and principal financial officer, as appropriate to allow timely decisions regardingrequired disclosure.
44

Table of Contents
Management’s Report on Internal Control over Financial Reporting
The management of our Company is responsible for establishing and maintaining adequate internal control over financial reporting (as defined in Rules 13a-15(f) and 15d-15(f)under the Exchange Act). The management of our Company has assessed the effectiveness of our Company’s internal control over financial reporting as of February 2, 2019. Inmaking this assessment, management used criteria set forth by the Committee of Sponsoring Organizations of the Treadway Commission (COSO) in Internal Control–Integrated Framework (2013). Based on its assessment, the management of our Company believes that, as of February 2, 2019, our Company’s internal control over financialreporting is effective based on those criteria.
The Company’s independent registered public accounting firm, KPMG LLP, has audited the financial statements included in this Annual Report on Form 10-K and has issuedan attestation report on the effectiveness of our Company’s internal control over financial reporting. Their report follows.
Changes in Internal Control over Financial Reporting
There were no changes in our Company’s internal control over financial reporting during the fourth quarter ended February 2, 2019 that have materially affected, or arereasonably likely to materially affect, our Company’s internal control over financial reporting.
45
Table of Contents
Report of Independent Registered Public Accounting Firm
To the Stockholders and Board of Directors
J. C. Penney Company, Inc.:
Opinion on Internal Control Over Financial ReportingWe have audited J. C. Penney Company, Inc.’s and subsidiaries’ (the Company) internal control over financial reporting as of February 2, 2019, based on criteria established inInternal Control - Integrated Framework (2013) issued by the Committee of Sponsoring Organizations of the Treadway Commission. In our opinion, the Company maintained,in all material respects, effective internal control over financial reporting as of February 2, 2019, based on criteria established in Internal Control - Integrated Framework(2013) issued by the Committee of Sponsoring Organizations of the Treadway Commission.
We also have audited, in accordance with the standards of the Public Company Accounting Oversight Board (United States) (PCAOB), the consolidated balance sheets of theCompany as of February 2, 2019 and February 3, 2018, the related consolidated statements of operations, comprehensive income/(loss), stockholders’ equity, and cash flows foreach of the years in the three-year period ended February 2, 2019, and the related notes (collectively, the consolidated financial statements), and our report dated March 19,2019 expressed an unqualified opinion on those consolidated financial statements.
Basis for OpinionThe Company’s management is responsible for maintaining effective internal control over financial reporting and for its assessment of the effectiveness of internal control overfinancial reporting, included in the accompanying “Management’s Report on Internal Control Over Financial Reporting”. Our responsibility is to express an opinion on theCompany’s internal control over financial reporting based on our audit. We are a public accounting firm registered with the PCAOB and are required to be independent withrespect to the Company in accordance with the U.S. federal securities laws and the applicable rules and regulations of the Securities and Exchange Commission and thePCAOB.
We conducted our audit in accordance with the standards of the PCAOB. Those standards require that we plan and perform the audit to obtain reasonable assurance aboutwhether effective internal control over financial reporting was maintained in all material respects. Our audit of internal control over financial reporting included obtaining anunderstanding of internal control over financial reporting, assessing the risk that a material weakness exists, and testing and evaluating the design and operating effectiveness ofinternal control based on the assessed risk. Our audit also included performing such other procedures as we considered necessary in the circumstances. We believe that our auditprovides a reasonable basis for our opinion.
Definition and Limitations of Internal Control Over Financial ReportingA company’s internal control over financial reporting is a process designed to provide reasonable assurance regarding the reliability of financial reporting and the preparation offinancial statements for external purposes in accordance with generally accepted accounting principles. A company’s internal control over financial reporting includes thosepolicies and procedures that (1) pertain to the maintenance of records that, in reasonable detail, accurately and fairly reflect the transactions and dispositions of the assets of thecompany; (2) provide reasonable assurance that transactions are recorded as necessary to permit preparation of financial statements in accordance with generally acceptedaccounting principles, and that receipts and expenditures of the company are being made only in accordance with authorizations of management and directors of the company;and (3) provide reasonable assurance regarding prevention or timely detection of unauthorized acquisition, use, or disposition of the company’s assets that could have a materialeffect on the financial statements.
Because of its inherent limitations, internal control over financial reporting may not prevent or detect misstatements. Also, projections of any evaluation of effectiveness tofuture periods are subject to the risk that controls may become inadequate because of changes in conditions, or that the degree of compliance with the policies or proceduresmay deteriorate.
/s/ KPMG LLP Dallas, TexasMarch 19, 2019
46
Table of Contents
Item 9B. Other Information
None.
PART III
Item 10. Directors, Executive Officers and Corporate Governance
The information required by Item 10 with respect to executive officers is included within Item 1 in Part I of this Annual Report on Form 10-K under the caption “ExecutiveOfficers of the Registrant.”
The information required by Item 10 with respect to directors, audit committee, audit committee financial experts and Section 16(a) beneficial ownership reporting complianceis included under the captions “Board Committees–Audit Committee,” “Section 16(a) Beneficial Ownership Reporting Compliance” and “Proposal 1 - Election of Directors” inour definitive proxy statement for 2019, which will be filed with the Securities and Exchange Commission pursuant to Regulation 14A and is incorporated herein by reference.
Code of Ethics and Corporate Governance Guidelines
We have adopted a code of ethics for officers and employees, which applies to, among others, our principal executive officer, principal financial officer and principalaccounting officer, and which is known as the “Statement of Business Ethics.” We have also adopted certain ethical principles and policies for our directors, which are set forthin Article V of our Corporate Governance Guidelines. The Statement of Business Ethics and Corporate Governance Guidelines are available on our website atwww.jcpenney.com. Additionally, we will provide copies of these documents without charge upon request made to:
J. C. Penney Company, Inc.Office of Investor Relations
6501 Legacy DrivePlano, Texas 75024
(Telephone 972-431-5500) Our Company intends to satisfy the disclosure requirement under Item 5.05 of Form 8-K regarding an amendment to or waiver of any provision of the Statement of BusinessEthics that applies to any officer of the Company by posting such information on our website at www.jcpenney.com.
Item 11. Executive Compensation
The information required by Item 11 is included under the captions “Compensation Committee Interlocks and Insider Participation,” “Compensation Discussion and Analysis,”“Report of the Human Resources and Compensation Committee,” “Summary Compensation Table,” “Grants of Plan-Based Awards for Fiscal 2018,” “Outstanding EquityAwards at Fiscal Year-End 2018,” “Option Exercises and Stock Vested for Fiscal 2018,” “Nonqualified Deferred Compensation for Fiscal 2018,” “Potential Payments andBenefits on Termination of Employment,” “Director Compensation for Fiscal 2018,” and “CEO Pay Ratio” in our Company’s definitive proxy statement for 2019, which will befiled with the Securities and Exchange Commission pursuant to Regulation 14A and is incorporated herein by reference.
Item 12. Security Ownership of Certain Beneficial Owners and Management and Related Stockholder Matters
The information required by Item 12 with respect to beneficial ownership of our Company’s common stock is included under the caption “Beneficial Ownership of CommonStock” and with respect to equity compensation plans is included under the caption "Equity Compensation Plan(s) Information" in our Company’s definitive proxy statement for2019, which will be filed with the Securities and Exchange Commission pursuant to Regulation 14A and is incorporated herein by reference.
Item 13. Certain Relationships and Related Transactions, and Director Independence
The information required by Item 13 is included under the captions “Policies and Procedures with Respect to Related Person Transactions” and “Board Independence” in ourCompany’s definitive proxy statement for 2019, which will be filed with the Securities and Exchange Commission pursuant to Regulation 14A and is incorporated herein byreference.
47
Table of Contents
Item 14. Principal Accounting Fees and Services
The information required by Item 14 is included under the captions “Audit and Other Fees” and “Audit Committee’s Pre-Approval Policies and Procedures” in our Company’sdefinitive proxy statement for 2019, which will be filed with the Securities and Exchange Commission pursuant to Regulation 14A and is incorporated herein by reference.
PART IV
Item 15. Exhibits, Financial Statement Schedules
(a) Documents filed as part of this report:
1. Consolidated Financial Statements:
The Consolidated Financial Statements of J. C. Penney Company, Inc. and subsidiaries are listed in the accompanying "Index to Consolidated FinancialStatements" on page 57.
2. Financial Statement Schedules:
Schedules have been omitted as they are inapplicable or not required under the rules, or the information has been submitted in the Consolidated FinancialStatements and related financial information contained otherwise in this Annual Report on Form 10-K.
3. Exhibits:
Each management contract or compensatory plan or arrangement required to be filed as an exhibit to this Annual Report on Form 10-K is specifically identifiedin the Exhibit Index below and filed with or incorporated by reference in this report.
48
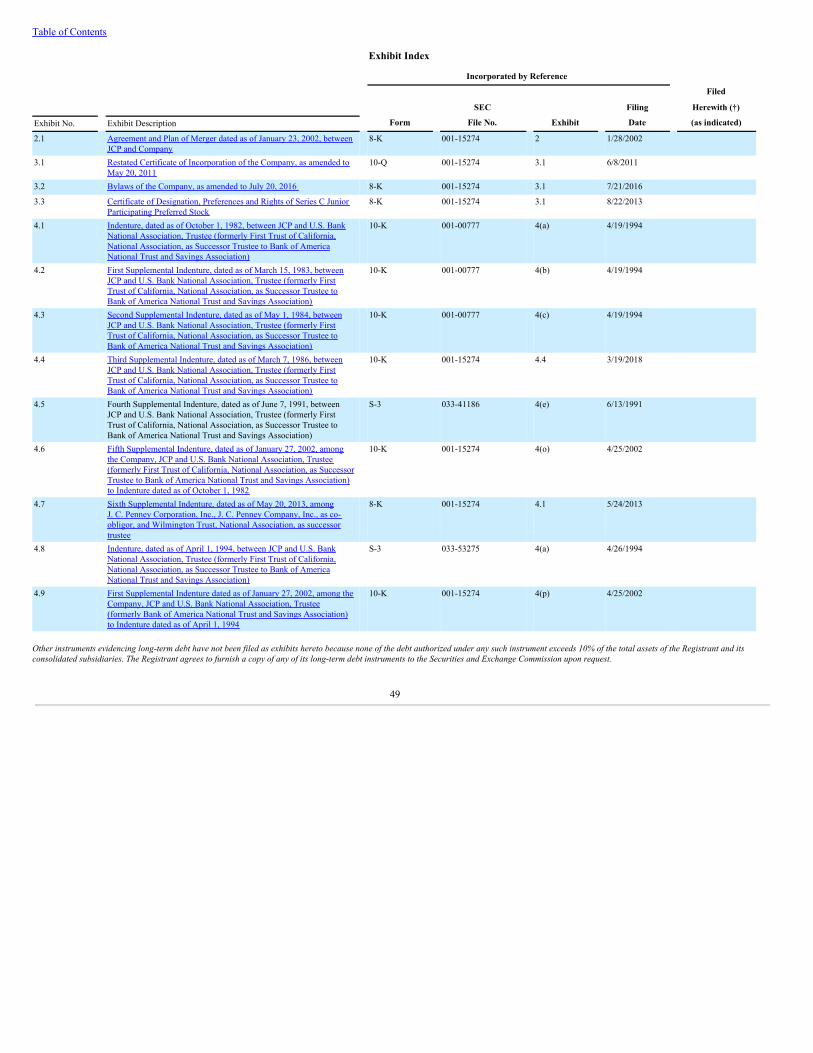
Table of Contents
Exhibit Index
Incorporated by Reference Filed
SEC Filing Herewith (†)
Exhibit No. Exhibit Description Form File No. Exhibit Date (as indicated)
2.1
Agreement and Plan of Merger dated as of January 23, 2002, betweenJCP and Company
8-K
001-15274
2
1/28/2002
3.1
Restated Certificate of Incorporation of the Company, as amended toMay 20, 2011
10-Q
001-15274
3.1
6/8/2011
3.2 Bylaws of the Company, as amended to July 20, 2016 8-K 001-15274 3.1 7/21/2016 3.3
Certificate of Designation, Preferences and Rights of Series C JuniorParticipating Preferred Stock
8-K
001-15274
3.1
8/22/2013
4.1
Indenture, dated as of October 1, 1982, between JCP and U.S. BankNational Association, Trustee (formerly First Trust of California,National Association, as Successor Trustee to Bank of AmericaNational Trust and Savings Association)
10-K
001-00777
4(a)
4/19/1994
4.2
First Supplemental Indenture, dated as of March 15, 1983, betweenJCP and U.S. Bank National Association, Trustee (formerly FirstTrust of California, National Association, as Successor Trustee toBank of America National Trust and Savings Association)
10-K
001-00777
4(b)
4/19/1994
4.3
Second Supplemental Indenture, dated as of May 1, 1984, betweenJCP and U.S. Bank National Association, Trustee (formerly FirstTrust of California, National Association, as Successor Trustee toBank of America National Trust and Savings Association)
10-K
001-00777
4(c)
4/19/1994
4.4
Third Supplemental Indenture, dated as of March 7, 1986, betweenJCP and U.S. Bank National Association, Trustee (formerly FirstTrust of California, National Association, as Successor Trustee toBank of America National Trust and Savings Association)
10-K
001-15274
4.4
3/19/2018
4.5
Fourth Supplemental Indenture, dated as of June 7, 1991, betweenJCP and U.S. Bank National Association, Trustee (formerly FirstTrust of California, National Association, as Successor Trustee toBank of America National Trust and Savings Association)
S-3
033-41186
4(e)
6/13/1991
4.6
Fifth Supplemental Indenture, dated as of January 27, 2002, amongthe Company, JCP and U.S. Bank National Association, Trustee(formerly First Trust of California, National Association, as SuccessorTrustee to Bank of America National Trust and Savings Association)to Indenture dated as of October 1, 1982
10-K
001-15274
4(o)
4/25/2002
4.7
Sixth Supplemental Indenture, dated as of May 20, 2013, amongJ. C. Penney Corporation, Inc., J. C. Penney Company, Inc., as co-obligor, and Wilmington Trust, National Association, as successortrustee
8-K
001-15274
4.1
5/24/2013
4.8
Indenture, dated as of April 1, 1994, between JCP and U.S. BankNational Association, Trustee (formerly First Trust of California,National Association, as Successor Trustee to Bank of AmericaNational Trust and Savings Association)
S-3
033-53275
4(a)
4/26/1994
4.9
First Supplemental Indenture dated as of January 27, 2002, among theCompany, JCP and U.S. Bank National Association, Trustee(formerly Bank of America National Trust and Savings Association)to Indenture dated as of April 1, 1994
10-K
001-15274
4(p)
4/25/2002
Other instruments evidencing long-term debt have not been filed as exhibits hereto because none of the debt authorized under any such instrument exceeds 10% of the total assets of the Registrant and itsconsolidated subsidiaries. The Registrant agrees to furnish a copy of any of its long-term debt instruments to the Securities and Exchange Commission upon request.
49
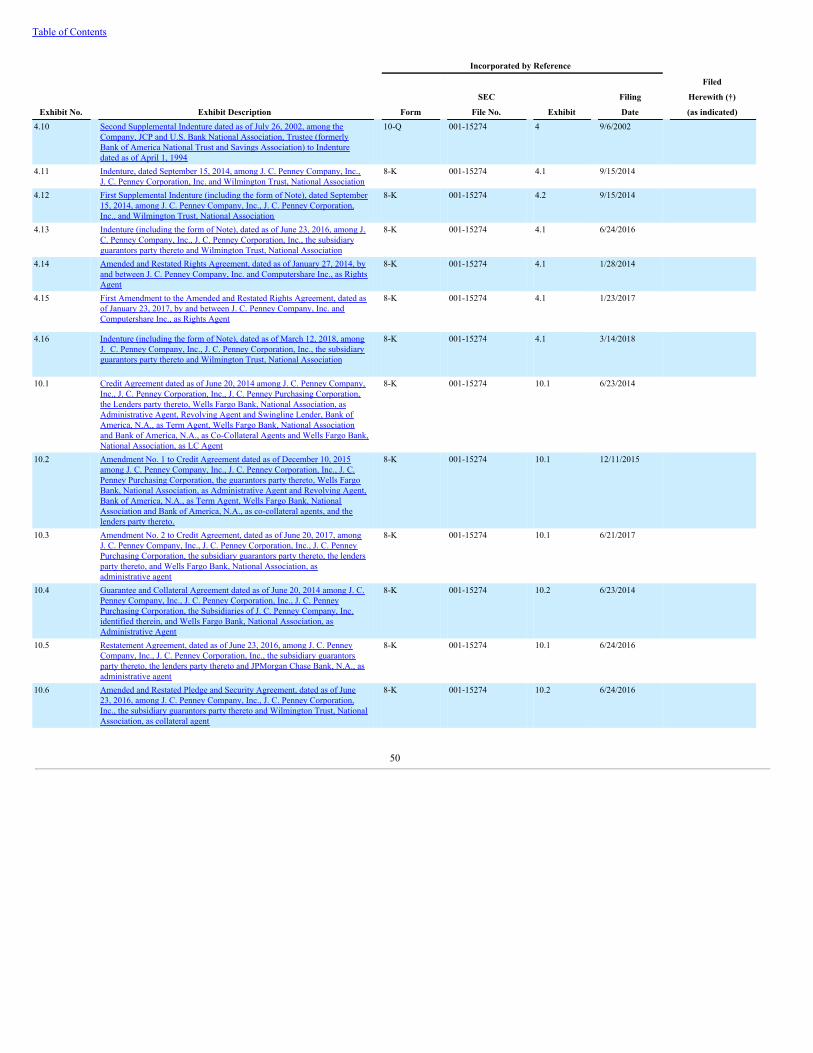
Table of Contents
Incorporated by Reference Filed
SEC Filing Herewith (†)
Exhibit No. Exhibit Description Form File No. Exhibit Date (as indicated)4.10
Second Supplemental Indenture dated as of July 26, 2002, among theCompany, JCP and U.S. Bank National Association, Trustee (formerlyBank of America National Trust and Savings Association) to Indenturedated as of April 1, 1994
10-Q
001-15274
4
9/6/2002
4.11
Indenture, dated September 15, 2014, among J. C. Penney Company, Inc.,J. C. Penney Corporation, Inc. and Wilmington Trust, National Association
8-K
001-15274
4.1
9/15/2014
4.12
First Supplemental Indenture (including the form of Note), dated September15, 2014, among J. C. Penney Company, Inc., J. C. Penney Corporation,Inc., and Wilmington Trust, National Association
8-K
001-15274
4.2
9/15/2014
4.13
Indenture (including the form of Note), dated as of June 23, 2016, among J.C. Penney Company, Inc., J. C. Penney Corporation, Inc., the subsidiaryguarantors party thereto and Wilmington Trust, National Association
8-K
001-15274
4.1
6/24/2016
4.14
Amended and Restated Rights Agreement, dated as of January 27, 2014, byand between J. C. Penney Company, Inc. and Computershare Inc., as RightsAgent
8-K
001-15274
4.1
1/28/2014
4.15
First Amendment to the Amended and Restated Rights Agreement, dated asof January 23, 2017, by and between J. C. Penney Company, Inc. andComputershare Inc., as Rights Agent
8-K
001-15274
4.1
1/23/2017
4.16
Indenture (including the form of Note), dated as of March 12, 2018, amongJ. C. Penney Company, Inc., J. C. Penney Corporation, Inc., the subsidiaryguarantors party thereto and Wilmington Trust, National Association
8-K
001-15274
4.1
3/14/2018
10.1
Credit Agreement dated as of June 20, 2014 among J. C. Penney Company,Inc., J. C. Penney Corporation, Inc., J. C. Penney Purchasing Corporation,the Lenders party thereto, Wells Fargo Bank, National Association, asAdministrative Agent, Revolving Agent and Swingline Lender, Bank ofAmerica, N.A., as Term Agent, Wells Fargo Bank, National Associationand Bank of America, N.A., as Co-Collateral Agents and Wells Fargo Bank,National Association, as LC Agent
8-K
001-15274
10.1
6/23/2014
10.2
Amendment No. 1 to Credit Agreement dated as of December 10, 2015among J. C. Penney Company, Inc., J. C. Penney Corporation, Inc., J. C.Penney Purchasing Corporation, the guarantors party thereto, Wells FargoBank, National Association, as Administrative Agent and Revolving Agent,Bank of America, N.A., as Term Agent, Wells Fargo Bank, NationalAssociation and Bank of America, N.A., as co-collateral agents, and thelenders party thereto.
8-K
001-15274
10.1
12/11/2015
10.3
Amendment No. 2 to Credit Agreement, dated as of June 20, 2017, amongJ. C. Penney Company, Inc., J. C. Penney Corporation, Inc., J. C. PenneyPurchasing Corporation, the subsidiary guarantors party thereto, the lendersparty thereto, and Wells Fargo Bank, National Association, asadministrative agent
8-K
001-15274
10.1
6/21/2017
10.4
Guarantee and Collateral Agreement dated as of June 20, 2014 among J. C.Penney Company, Inc., J. C. Penney Corporation, Inc., J. C. PenneyPurchasing Corporation, the Subsidiaries of J. C. Penney Company, Inc.identified therein, and Wells Fargo Bank, National Association, asAdministrative Agent
8-K
001-15274
10.2
6/23/2014
10.5
Restatement Agreement, dated as of June 23, 2016, among J. C. PenneyCompany, Inc., J. C. Penney Corporation, Inc., the subsidiary guarantorsparty thereto, the lenders party thereto and JPMorgan Chase Bank, N.A., asadministrative agent
8-K
001-15274
10.1
6/24/2016
10.6
Amended and Restated Pledge and Security Agreement, dated as of June23, 2016, among J. C. Penney Company, Inc., J. C. Penney Corporation,Inc., the subsidiary guarantors party thereto and Wilmington Trust, NationalAssociation, as collateral agent
8-K
001-15274
10.2
6/24/2016
50
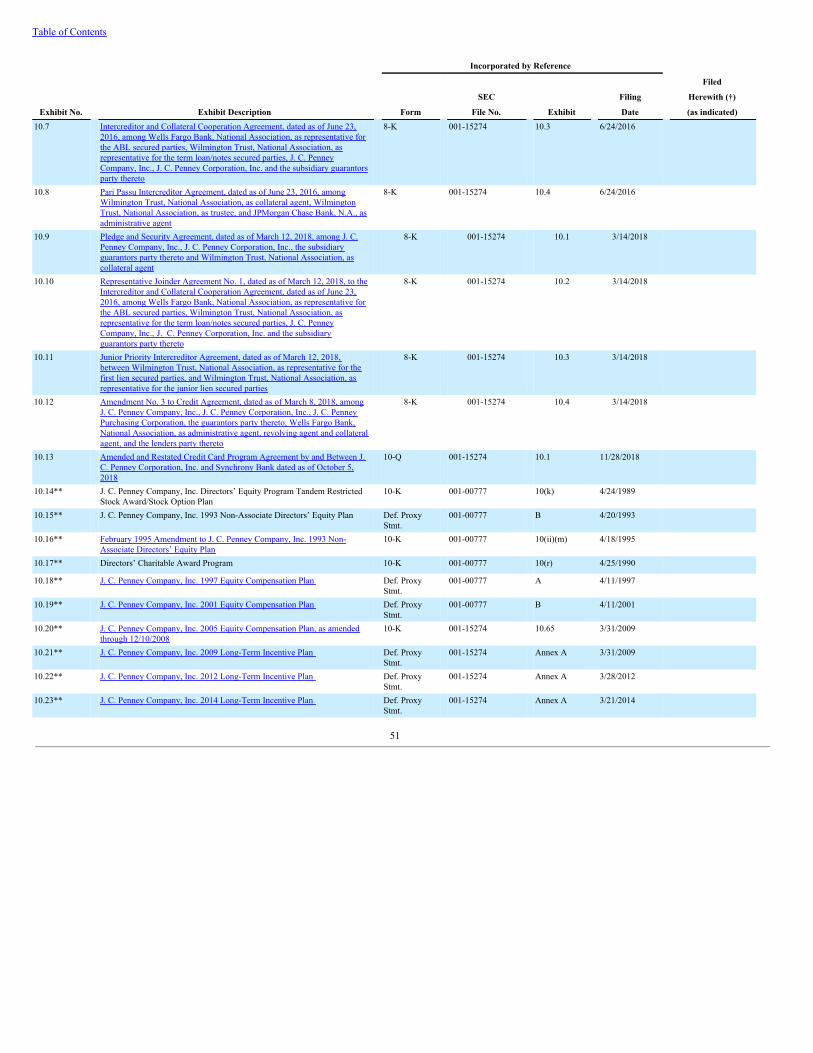
Table of Contents
Incorporated by Reference Filed
SEC Filing Herewith (†)
Exhibit No. Exhibit Description Form File No. Exhibit Date (as indicated)10.7
Intercreditor and Collateral Cooperation Agreement, dated as of June 23,2016, among Wells Fargo Bank, National Association, as representative forthe ABL secured parties, Wilmington Trust, National Association, asrepresentative for the term loan/notes secured parties, J. C. PenneyCompany, Inc., J. C. Penney Corporation, Inc. and the subsidiary guarantorsparty thereto
8-K
001-15274
10.3
6/24/2016
10.8
Pari Passu Intercreditor Agreement, dated as of June 23, 2016, amongWilmington Trust, National Association, as collateral agent, WilmingtonTrust, National Association, as trustee, and JPMorgan Chase Bank, N.A., asadministrative agent
8-K
001-15274
10.4
6/24/2016
10.9
Pledge and Security Agreement, dated as of March 12, 2018, among J. C.Penney Company, Inc., J. C. Penney Corporation, Inc., the subsidiaryguarantors party thereto and Wilmington Trust, National Association, ascollateral agent
8-K
001-15274
10.1
3/14/2018
10.10
Representative Joinder Agreement No. 1, dated as of March 12, 2018, to theIntercreditor and Collateral Cooperation Agreement, dated as of June 23,2016, among Wells Fargo Bank, National Association, as representative forthe ABL secured parties, Wilmington Trust, National Association, asrepresentative for the term loan/notes secured parties, J. C. PenneyCompany, Inc., J. C. Penney Corporation, Inc. and the subsidiaryguarantors party thereto
8-K
001-15274
10.2
3/14/2018
10.11
Junior Priority Intercreditor Agreement, dated as of March 12, 2018,between Wilmington Trust, National Association, as representative for thefirst lien secured parties, and Wilmington Trust, National Association, asrepresentative for the junior lien secured parties
8-K
001-15274
10.3
3/14/2018
10.12
Amendment No. 3 to Credit Agreement, dated as of March 8, 2018, amongJ. C. Penney Company, Inc., J. C. Penney Corporation, Inc., J. C. PenneyPurchasing Corporation, the guarantors party thereto, Wells Fargo Bank,National Association, as administrative agent, revolving agent and collateralagent, and the lenders party thereto
8-K
001-15274
10.4
3/14/2018
10.13
Amended and Restated Credit Card Program Agreement by and Between J.C. Penney Corporation, Inc. and Synchrony Bank dated as of October 5,2018
10-Q
001-15274
10.1
11/28/2018
10.14**
J. C. Penney Company, Inc. Directors’ Equity Program Tandem RestrictedStock Award/Stock Option Plan
10-K
001-00777
10(k)
4/24/1989
10.15**
J. C. Penney Company, Inc. 1993 Non-Associate Directors’ Equity Plan
Def. ProxyStmt.
001-00777
B
4/20/1993
10.16**
February 1995 Amendment to J. C. Penney Company, Inc. 1993 Non-Associate Directors’ Equity Plan
10-K
001-00777
10(ii)(m)
4/18/1995
10.17** Directors’ Charitable Award Program 10-K 001-00777 10(r) 4/25/1990 10.18**
J. C. Penney Company, Inc. 1997 Equity Compensation Plan
Def. ProxyStmt.
001-00777
A
4/11/1997
10.19**
J. C. Penney Company, Inc. 2001 Equity Compensation Plan
Def. ProxyStmt.
001-00777
B
4/11/2001
10.20**
J. C. Penney Company, Inc. 2005 Equity Compensation Plan, as amendedthrough 12/10/2008
10-K
001-15274
10.65
3/31/2009
10.21**
J. C. Penney Company, Inc. 2009 Long-Term Incentive Plan
Def. ProxyStmt.
001-15274
Annex A
3/31/2009
10.22**
J. C. Penney Company, Inc. 2012 Long-Term Incentive Plan
Def. ProxyStmt.
001-15274
Annex A
3/28/2012
10.23**
J. C. Penney Company, Inc. 2014 Long-Term Incentive Plan
Def. ProxyStmt.
001-15274
Annex A
3/21/2014
51
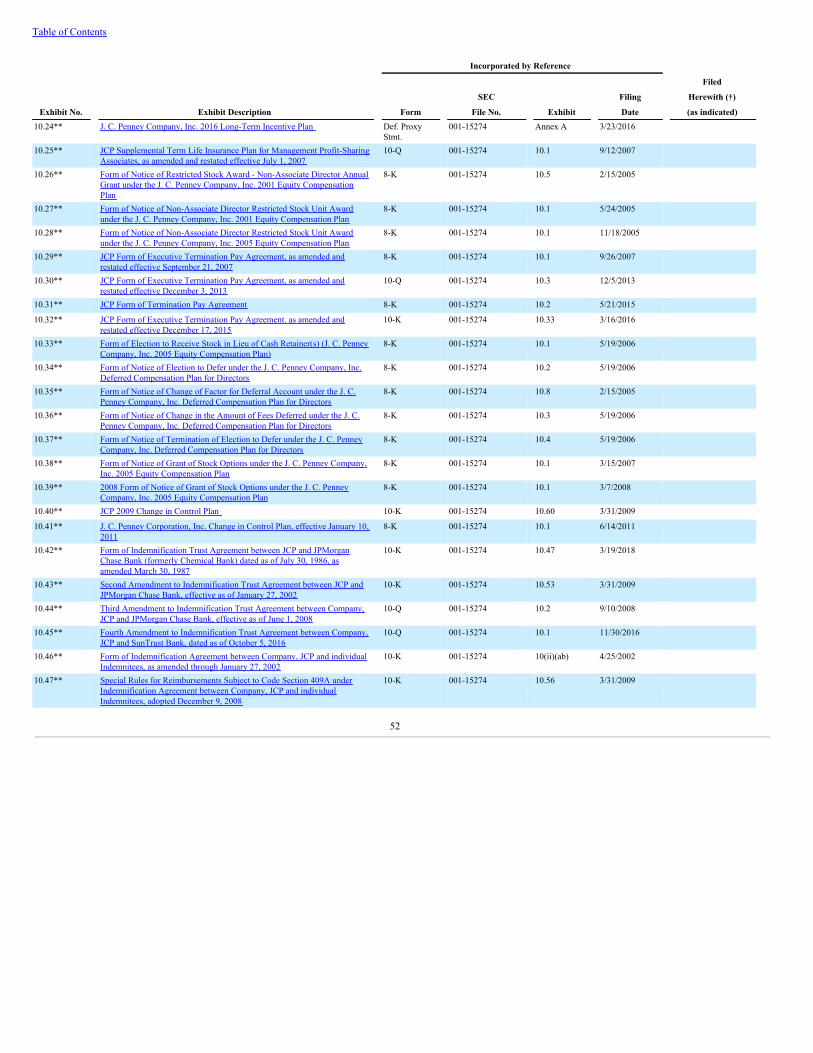
Table of Contents
Incorporated by Reference Filed
SEC Filing Herewith (†)
Exhibit No. Exhibit Description Form File No. Exhibit Date (as indicated)10.24**
J. C. Penney Company, Inc. 2016 Long-Term Incentive Plan
Def. ProxyStmt.
001-15274
Annex A
3/23/2016
10.25**
JCP Supplemental Term Life Insurance Plan for Management Profit-SharingAssociates, as amended and restated effective July 1, 2007
10-Q
001-15274
10.1
9/12/2007
10.26**
Form of Notice of Restricted Stock Award - Non-Associate Director AnnualGrant under the J. C. Penney Company, Inc. 2001 Equity CompensationPlan
8-K
001-15274
10.5
2/15/2005
10.27**
Form of Notice of Non-Associate Director Restricted Stock Unit Awardunder the J. C. Penney Company, Inc. 2001 Equity Compensation Plan
8-K
001-15274
10.1
5/24/2005
10.28**
Form of Notice of Non-Associate Director Restricted Stock Unit Awardunder the J. C. Penney Company, Inc. 2005 Equity Compensation Plan
8-K
001-15274
10.1
11/18/2005
10.29**
JCP Form of Executive Termination Pay Agreement, as amended andrestated effective September 21, 2007
8-K
001-15274
10.1
9/26/2007
10.30**
JCP Form of Executive Termination Pay Agreement, as amended andrestated effective December 3, 2013
10-Q
001-15274
10.3
12/5/2013
10.31** JCP Form of Termination Pay Agreement 8-K 001-15274 10.2 5/21/2015 10.32**
JCP Form of Executive Termination Pay Agreement. as amended andrestated effective December 17, 2015
10-K
001-15274
10.33
3/16/2016
10.33**
Form of Election to Receive Stock in Lieu of Cash Retainer(s) (J. C. PenneyCompany, Inc. 2005 Equity Compensation Plan)
8-K
001-15274
10.1
5/19/2006
10.34**
Form of Notice of Election to Defer under the J. C. Penney Company, Inc.Deferred Compensation Plan for Directors
8-K
001-15274
10.2
5/19/2006
10.35**
Form of Notice of Change of Factor for Deferral Account under the J. C.Penney Company, Inc. Deferred Compensation Plan for Directors
8-K
001-15274
10.8
2/15/2005
10.36**
Form of Notice of Change in the Amount of Fees Deferred under the J. C.Penney Company, Inc. Deferred Compensation Plan for Directors
8-K
001-15274
10.3
5/19/2006
10.37**
Form of Notice of Termination of Election to Defer under the J. C. PenneyCompany, Inc. Deferred Compensation Plan for Directors
8-K
001-15274
10.4
5/19/2006
10.38**
Form of Notice of Grant of Stock Options under the J. C. Penney Company,Inc. 2005 Equity Compensation Plan
8-K
001-15274
10.1
3/15/2007
10.39**
2008 Form of Notice of Grant of Stock Options under the J. C. PenneyCompany, Inc. 2005 Equity Compensation Plan
8-K
001-15274
10.1
3/7/2008
10.40** JCP 2009 Change in Control Plan 10-K 001-15274 10.60 3/31/2009 10.41**
J. C. Penney Corporation, Inc. Change in Control Plan, effective January 10,2011
8-K
001-15274
10.1
6/14/2011
10.42**
Form of Indemnification Trust Agreement between JCP and JPMorganChase Bank (formerly Chemical Bank) dated as of July 30, 1986, asamended March 30, 1987
10-K
001-15274
10.47
3/19/2018
10.43**
Second Amendment to Indemnification Trust Agreement between JCP andJPMorgan Chase Bank, effective as of January 27, 2002
10-K
001-15274
10.53
3/31/2009
10.44**
Third Amendment to Indemnification Trust Agreement between Company,JCP and JPMorgan Chase Bank, effective as of June 1, 2008
10-Q
001-15274
10.2
9/10/2008
10.45**
Fourth Amendment to Indemnification Trust Agreement between Company,JCP and SunTrust Bank, dated as of October 5, 2016
10-Q
001-15274
10.1
11/30/2016
10.46**
Form of Indemnification Agreement between Company, JCP and individualIndemnitees, as amended through January 27, 2002
10-K
001-15274
10(ii)(ab)
4/25/2002
10.47**
Special Rules for Reimbursements Subject to Code Section 409A underIndemnification Agreement between Company, JCP and individualIndemnitees, adopted December 9, 2008
10-K
001-15274
10.56
3/31/2009
52
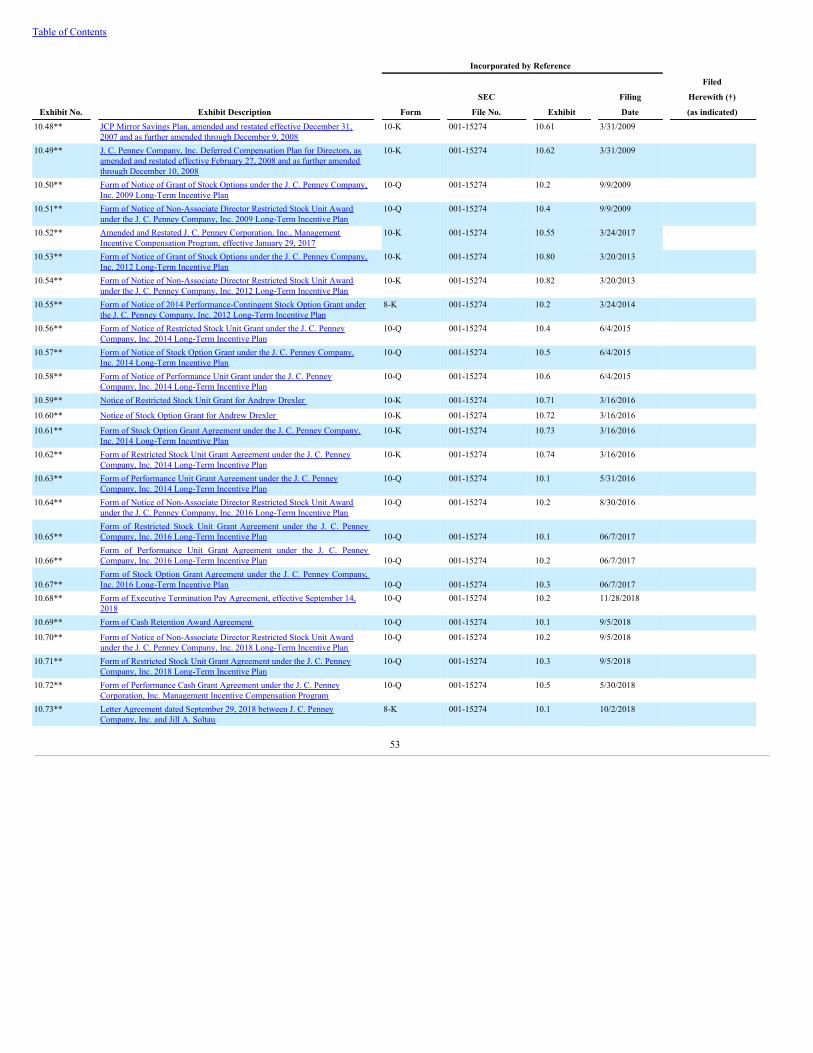
Table of Contents
Incorporated by Reference Filed
SEC Filing Herewith (†)
Exhibit No. Exhibit Description Form File No. Exhibit Date (as indicated)10.48**
JCP Mirror Savings Plan, amended and restated effective December 31,2007 and as further amended through December 9, 2008
10-K
001-15274
10.61
3/31/2009
10.49**
J. C. Penney Company, Inc. Deferred Compensation Plan for Directors, asamended and restated effective February 27, 2008 and as further amendedthrough December 10, 2008
10-K
001-15274
10.62
3/31/2009
10.50**
Form of Notice of Grant of Stock Options under the J. C. Penney Company,Inc. 2009 Long-Term Incentive Plan
10-Q
001-15274
10.2
9/9/2009
10.51**
Form of Notice of Non-Associate Director Restricted Stock Unit Awardunder the J. C. Penney Company, Inc. 2009 Long-Term Incentive Plan
10-Q
001-15274
10.4
9/9/2009
10.52**
Amended and Restated J. C. Penney Corporation, Inc., ManagementIncentive Compensation Program, effective January 29, 2017
10-K
001-15274
10.55
3/24/2017
10.53**
Form of Notice of Grant of Stock Options under the J. C. Penney Company,Inc. 2012 Long-Term Incentive Plan
10-K
001-15274
10.80
3/20/2013
10.54**
Form of Notice of Non-Associate Director Restricted Stock Unit Awardunder the J. C. Penney Company, Inc. 2012 Long-Term Incentive Plan
10-K
001-15274
10.82
3/20/2013
10.55**
Form of Notice of 2014 Performance-Contingent Stock Option Grant underthe J. C. Penney Company, Inc. 2012 Long-Term Incentive Plan
8-K
001-15274
10.2
3/24/2014
10.56**
Form of Notice of Restricted Stock Unit Grant under the J. C. PenneyCompany, Inc. 2014 Long-Term Incentive Plan
10-Q
001-15274
10.4
6/4/2015
10.57**
Form of Notice of Stock Option Grant under the J. C. Penney Company,Inc. 2014 Long-Term Incentive Plan
10-Q
001-15274
10.5
6/4/2015
10.58**
Form of Notice of Performance Unit Grant under the J. C. PenneyCompany, Inc. 2014 Long-Term Incentive Plan
10-Q
001-15274
10.6
6/4/2015
10.59** Notice of Restricted Stock Unit Grant for Andrew Drexler 10-K 001-15274 10.71 3/16/2016 10.60** Notice of Stock Option Grant for Andrew Drexler 10-K 001-15274 10.72 3/16/2016 10.61**
Form of Stock Option Grant Agreement under the J. C. Penney Company,Inc. 2014 Long-Term Incentive Plan
10-K
001-15274
10.73
3/16/2016
10.62**
Form of Restricted Stock Unit Grant Agreement under the J. C. PenneyCompany, Inc. 2014 Long-Term Incentive Plan
10-K
001-15274
10.74
3/16/2016
10.63**
Form of Performance Unit Grant Agreement under the J. C. PenneyCompany, Inc. 2014 Long-Term Incentive Plan
10-Q
001-15274
10.1
5/31/2016
10.64**
Form of Notice of Non-Associate Director Restricted Stock Unit Awardunder the J. C. Penney Company, Inc. 2016 Long-Term Incentive Plan
10-Q
001-15274
10.2
8/30/2016
10.65** Form of Restricted Stock Unit Grant Agreement under the J. C. PenneyCompany, Inc. 2016 Long-Term Incentive Plan 10-Q 001-15274 10.1 06/7/2017
10.66** Form of Performance Unit Grant Agreement under the J. C. PenneyCompany, Inc. 2016 Long-Term Incentive Plan 10-Q 001-15274 10.2 06/7/2017
10.67** Form of Stock Option Grant Agreement under the J. C. Penney Company,Inc. 2016 Long-Term Incentive Plan 10-Q 001-15274 10.3 06/7/2017
10.68**
Form of Executive Termination Pay Agreement, effective September 14,2018
10-Q
001-15274
10.2
11/28/2018
10.69** Form of Cash Retention Award Agreement 10-Q 001-15274 10.1 9/5/2018 10.70**
Form of Notice of Non-Associate Director Restricted Stock Unit Awardunder the J. C. Penney Company, Inc. 2018 Long-Term Incentive Plan
10-Q
001-15274
10.2
9/5/2018
10.71**
Form of Restricted Stock Unit Grant Agreement under the J. C. PenneyCompany, Inc. 2018 Long-Term Incentive Plan
10-Q
001-15274
10.3
9/5/2018
10.72**
Form of Performance Cash Grant Agreement under the J. C. PenneyCorporation, Inc. Management Incentive Compensation Program
10-Q
001-15274
10.5
5/30/2018
10.73**
Letter Agreement dated September 29, 2018 between J. C. PenneyCompany, Inc. and Jill A. Soltau
8-K
001-15274
10.1
10/2/2018
53
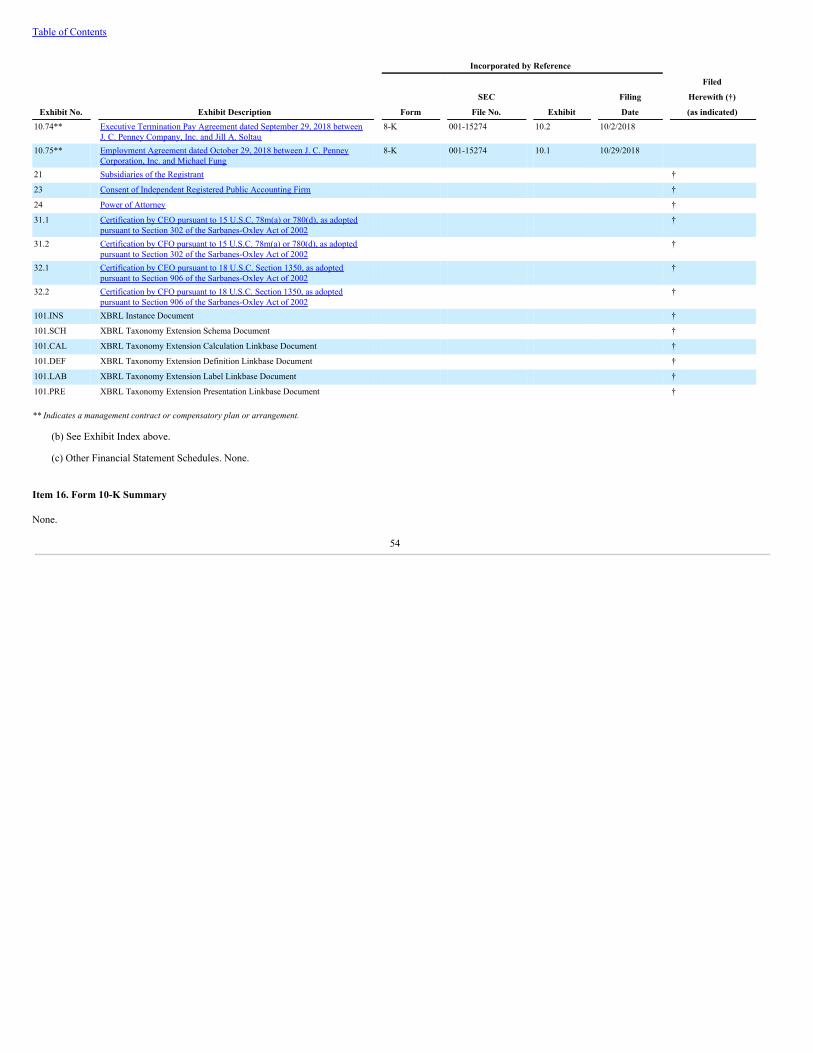
Table of Contents
Incorporated by Reference Filed
SEC Filing Herewith (†)
Exhibit No. Exhibit Description Form File No. Exhibit Date (as indicated)10.74**
Executive Termination Pay Agreement dated September 29, 2018 betweenJ. C. Penney Company, Inc. and Jill A. Soltau
8-K
001-15274
10.2
10/2/2018
10.75**
Employment Agreement dated October 29, 2018 between J. C. PenneyCorporation, Inc. and Michael Fung
8-K
001-15274
10.1
10/29/2018
21 Subsidiaries of the Registrant †
23 Consent of Independent Registered Public Accounting Firm †
24 Power of Attorney †
31.1
Certification by CEO pursuant to 15 U.S.C. 78m(a) or 780(d), as adoptedpursuant to Section 302 of the Sarbanes-Oxley Act of 2002
†
31.2
Certification by CFO pursuant to 15 U.S.C. 78m(a) or 780(d), as adoptedpursuant to Section 302 of the Sarbanes-Oxley Act of 2002
†
32.1
Certification by CEO pursuant to 18 U.S.C. Section 1350, as adoptedpursuant to Section 906 of the Sarbanes-Oxley Act of 2002
†
32.2 Certification by CFO pursuant to 18 U.S.C. Section 1350, as adoptedpursuant to Section 906 of the Sarbanes-Oxley Act of 2002
†
101.INS XBRL Instance Document †
101.SCH XBRL Taxonomy Extension Schema Document †
101.CAL XBRL Taxonomy Extension Calculation Linkbase Document †
101.DEF XBRL Taxonomy Extension Definition Linkbase Document †
101.LAB XBRL Taxonomy Extension Label Linkbase Document †
101.PRE XBRL Taxonomy Extension Presentation Linkbase Document †
** Indicates a management contract or compensatory plan or arrangement.
(b) See Exhibit Index above.
(c) Other Financial Statement Schedules. None.
Item 16. Form 10-K Summary
None.
54
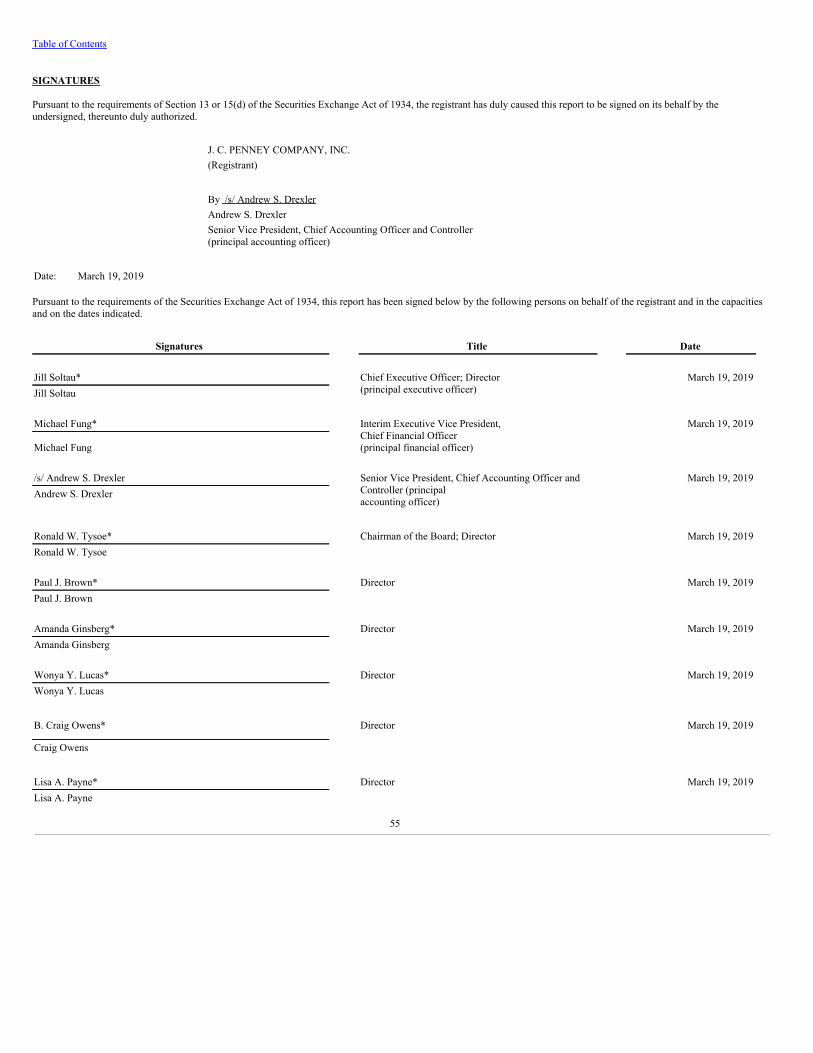
Table of Contents
SIGNATURES
Pursuant to the requirements of Section 13 or 15(d) of the Securities Exchange Act of 1934, the registrant has duly caused this report to be signed on its behalf by theundersigned, thereunto duly authorized.
J. C. PENNEY COMPANY, INC. (Registrant)
By /s/ Andrew S. Drexler Andrew S. Drexler
Senior Vice President, Chief Accounting Officer and Controller(principal accounting officer)
Date: March 19, 2019
Pursuant to the requirements of the Securities Exchange Act of 1934, this report has been signed below by the following persons on behalf of the registrant and in the capacitiesand on the dates indicated.
Signatures Title Date Jill Soltau* Chief Executive Officer; Director
(principal executive officer) March 19, 2019
Jill Soltau Michael Fung* Interim Executive Vice President,
Chief Financial Officer(principal financial officer)
March 19, 2019
Michael Fung /s/ Andrew S. Drexler Senior Vice President, Chief Accounting Officer and
Controller (principalaccounting officer)
March 19, 2019Andrew S. Drexler
Ronald W. Tysoe* Chairman of the Board; Director March 19, 2019Ronald W. Tysoe Paul J. Brown* Director March 19, 2019Paul J. Brown Amanda Ginsberg* Director March 19, 2019Amanda Ginsberg Wonya Y. Lucas* Director March 19, 2019Wonya Y. Lucas
B. Craig Owens* Director March 19, 2019
Craig Owens
Lisa A. Payne* Director March 19, 2019Lisa A. Payne
55
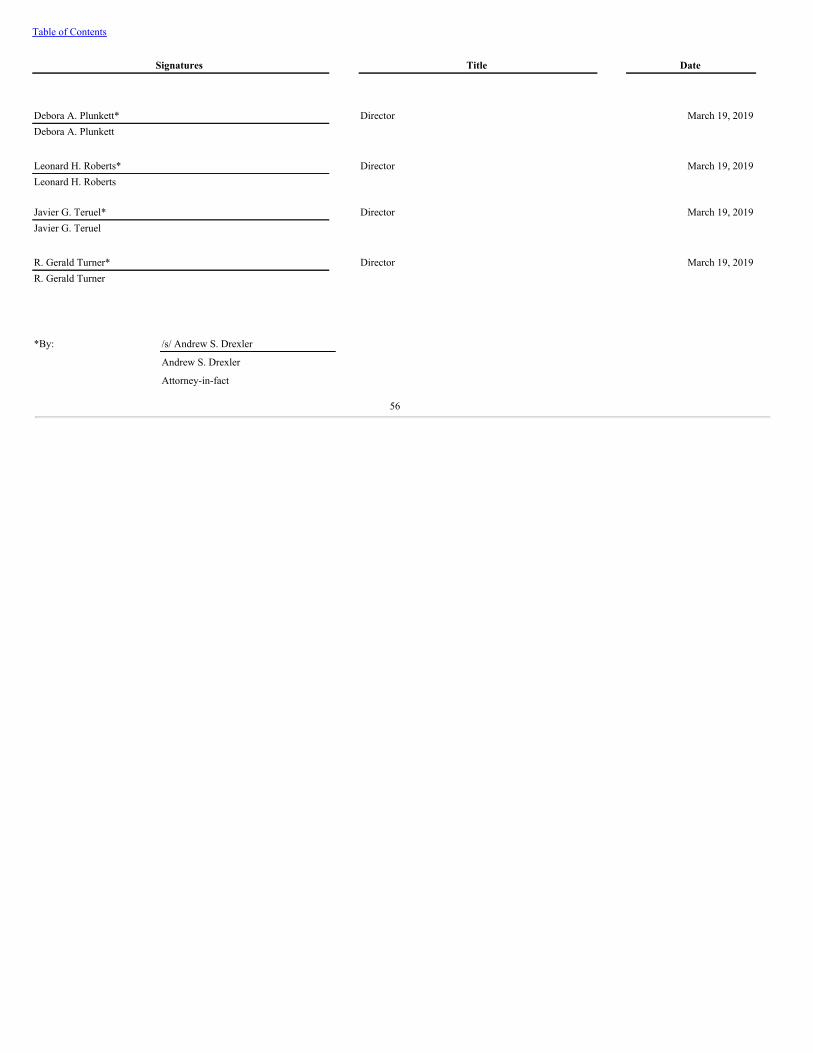
Table of Contents
Signatures Title Date
Debora A. Plunkett* Director March 19, 2019Debora A. Plunkett
Leonard H. Roberts* Director March 19, 2019Leonard H. Roberts Javier G. Teruel* Director March 19, 2019Javier G. Teruel
R. Gerald Turner* Director March 19, 2019R. Gerald Turner
*By: /s/ Andrew S. Drexler
Andrew S. Drexler
Attorney-in-fact
56
Table of Contents
J. C. PENNEY COMPANY, INC.INDEX TO CONSOLIDATED FINANCIAL STATEMENTS
PageReport of Independent Registered Public Accounting Firm 58Consolidated Statements of Operations for the Fiscal Years Ended February 2, 2019, February 3, 2018 and January 28, 2017 59Consolidated Statements of Comprehensive Income/(Loss) for the Fiscal Years Ended February 2, 2019, February 3, 2018 and January 28, 2017 60Consolidated Balance Sheets as of February 2, 2019 and February 3, 2018 61Consolidated Statements of Stockholders’ Equity for the Fiscal Years Ended February 2, 2019, February 3, 2018 and January 28, 2017 62Consolidated Statements of Cash Flows for the Fiscal Years Ended February 2, 2019, February 3, 2018 and January 28, 2017 63
Notes to Consolidated Financial Statements 1. Basis of Presentation and Consolidation 642. Significant Accounting Policies 643. Changes in Accounting for Revenue Recognition and Retirement-Related Benefits 704. Effect of New Accounting Standards 725. Earnings/(Loss) per Share 736. Other Assets 747. Other Accounts Payable and Accrued Expenses 748. Other Liabilities 749. Derivative Financial Instruments 7510. Fair Value Disclosures 7611. Credit Facility 7712. Long-Term Debt 7813. Stockholders’ Equity 7914. Stock-Based Compensation 8015. Leases, Financing Obligation and Note Payable 8216. Retirement Benefit Plans 84
17. Restructuring and Management Transition 9218. Real Estate and Other, Net 9319. Income Taxes 9320. Supplemental Cash Flow Information 9721. Litigation and Other Contingencies 9722. Quarterly Results of Operations (Unaudited) 98
57
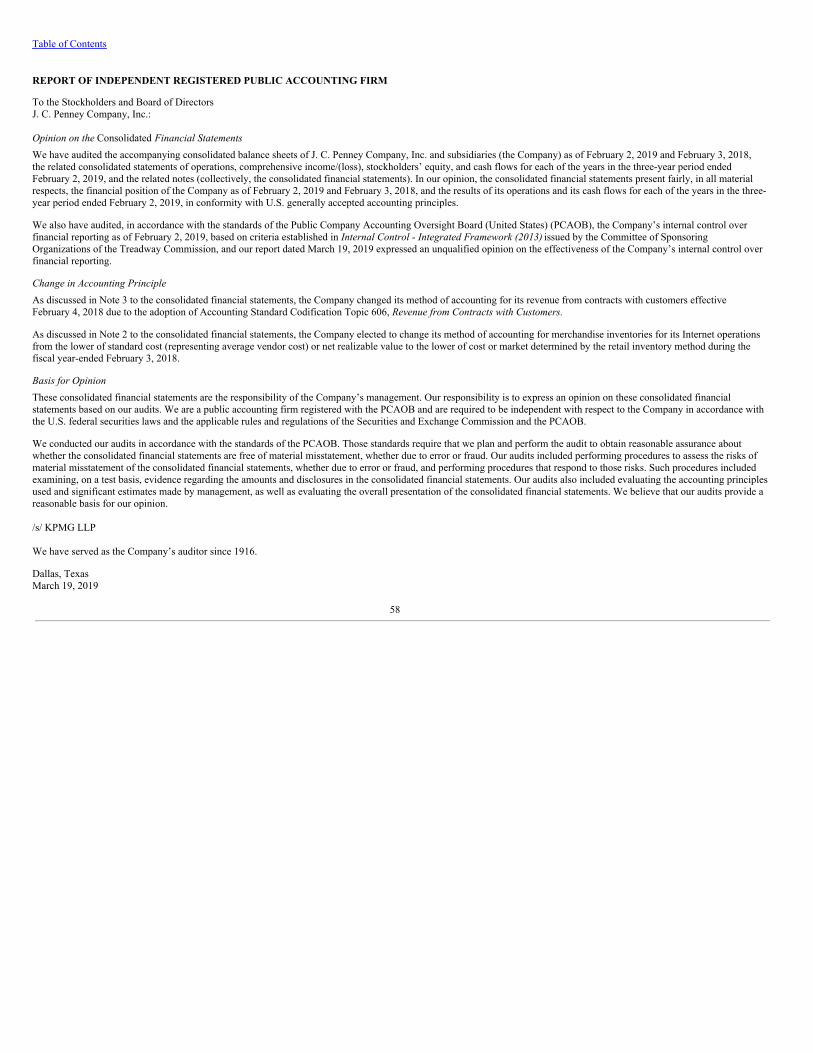
Table of Contents
REPORT OF INDEPENDENT REGISTERED PUBLIC ACCOUNTING FIRM
To the Stockholders and Board of DirectorsJ. C. Penney Company, Inc.:
Opinion on the Consolidated Financial StatementsWe have audited the accompanying consolidated balance sheets of J. C. Penney Company, Inc. and subsidiaries (the Company) as of February 2, 2019 and February 3, 2018,the related consolidated statements of operations, comprehensive income/(loss), stockholders’ equity, and cash flows for each of the years in the three-year period endedFebruary 2, 2019, and the related notes (collectively, the consolidated financial statements). In our opinion, the consolidated financial statements present fairly, in all materialrespects, the financial position of the Company as of February 2, 2019 and February 3, 2018, and the results of its operations and its cash flows for each of the years in the three-year period ended February 2, 2019, in conformity with U.S. generally accepted accounting principles.
We also have audited, in accordance with the standards of the Public Company Accounting Oversight Board (United States) (PCAOB), the Company’s internal control overfinancial reporting as of February 2, 2019, based on criteria established in Internal Control - Integrated Framework (2013) issued by the Committee of SponsoringOrganizations of the Treadway Commission, and our report dated March 19, 2019 expressed an unqualified opinion on the effectiveness of the Company’s internal control overfinancial reporting.
Change in Accounting PrincipleAs discussed in Note 3 to the consolidated financial statements, the Company changed its method of accounting for its revenue from contracts with customers effectiveFebruary 4, 2018 due to the adoption of Accounting Standard Codification Topic 606, Revenue from Contracts with Customers.
As discussed in Note 2 to the consolidated financial statements, the Company elected to change its method of accounting for merchandise inventories for its Internet operationsfrom the lower of standard cost (representing average vendor cost) or net realizable value to the lower of cost or market determined by the retail inventory method during thefiscal year-ended February 3, 2018.
Basis for OpinionThese consolidated financial statements are the responsibility of the Company’s management. Our responsibility is to express an opinion on these consolidated financialstatements based on our audits. We are a public accounting firm registered with the PCAOB and are required to be independent with respect to the Company in accordance withthe U.S. federal securities laws and the applicable rules and regulations of the Securities and Exchange Commission and the PCAOB.
We conducted our audits in accordance with the standards of the PCAOB. Those standards require that we plan and perform the audit to obtain reasonable assurance aboutwhether the consolidated financial statements are free of material misstatement, whether due to error or fraud. Our audits included performing procedures to assess the risks ofmaterial misstatement of the consolidated financial statements, whether due to error or fraud, and performing procedures that respond to those risks. Such procedures includedexamining, on a test basis, evidence regarding the amounts and disclosures in the consolidated financial statements. Our audits also included evaluating the accounting principlesused and significant estimates made by management, as well as evaluating the overall presentation of the consolidated financial statements. We believe that our audits provide areasonable basis for our opinion.
/s/ KPMG LLP
We have served as the Company’s auditor since 1916.
Dallas, Texas March 19, 2019
58
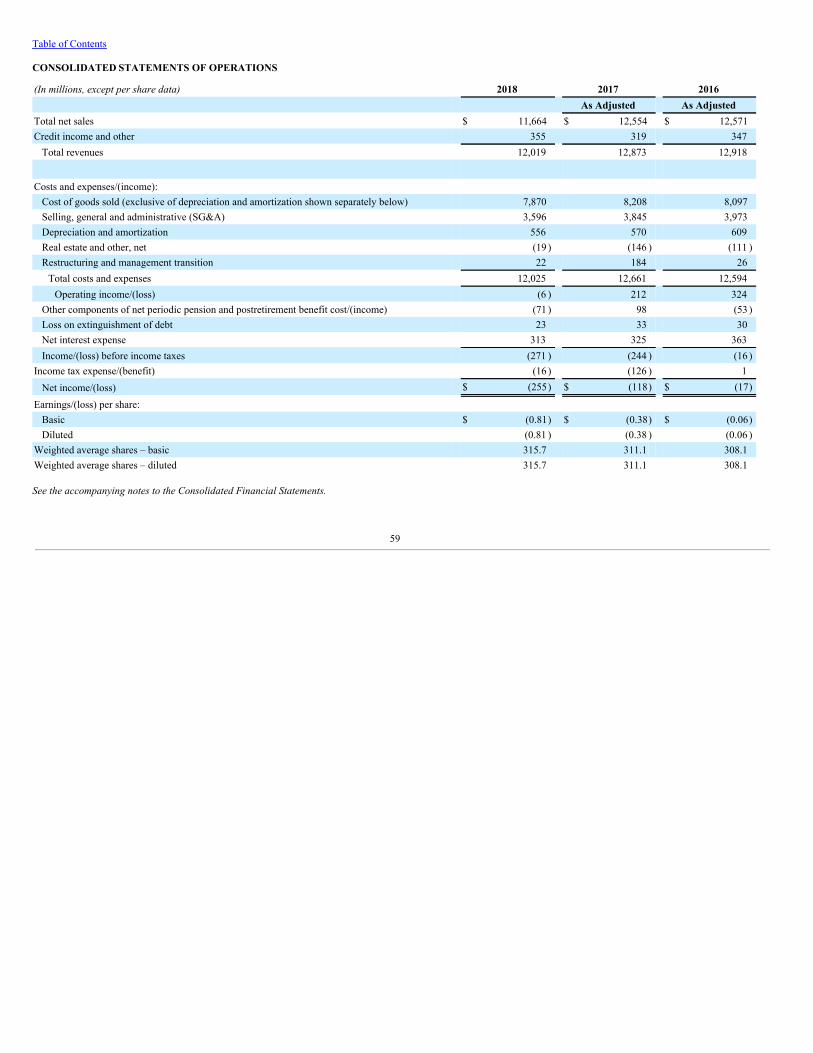
Table of Contents
CONSOLIDATED STATEMENTS OF OPERATIONS
(In millions, except per share data) 2018 2017 2016 As Adjusted As AdjustedTotal net sales $ 11,664 $ 12,554 $ 12,571Credit income and other 355 319 347
Total revenues 12,019 12,873 12,918
Costs and expenses/(income): Cost of goods sold (exclusive of depreciation and amortization shown separately below) 7,870 8,208 8,097Selling, general and administrative (SG&A) 3,596 3,845 3,973Depreciation and amortization 556 570 609Real estate and other, net (19 ) (146 ) (111 )Restructuring and management transition 22 184 26
Total costs and expenses 12,025 12,661 12,594Operating income/(loss) (6 ) 212 324
Other components of net periodic pension and postretirement benefit cost/(income) (71 ) 98 (53 )Loss on extinguishment of debt 23 33 30Net interest expense 313 325 363Income/(loss) before income taxes (271 ) (244 ) (16 )
Income tax expense/(benefit) (16 ) (126 ) 1Net income/(loss) $ (255) $ (118) $ (17)
Earnings/(loss) per share: Basic $ (0.81) $ (0.38) $ (0.06)Diluted (0.81 ) (0.38 ) (0.06 )
Weighted average shares – basic 315.7 311.1 308.1Weighted average shares – diluted 315.7 311.1 308.1
See the accompanying notes to the Consolidated Financial Statements.
59
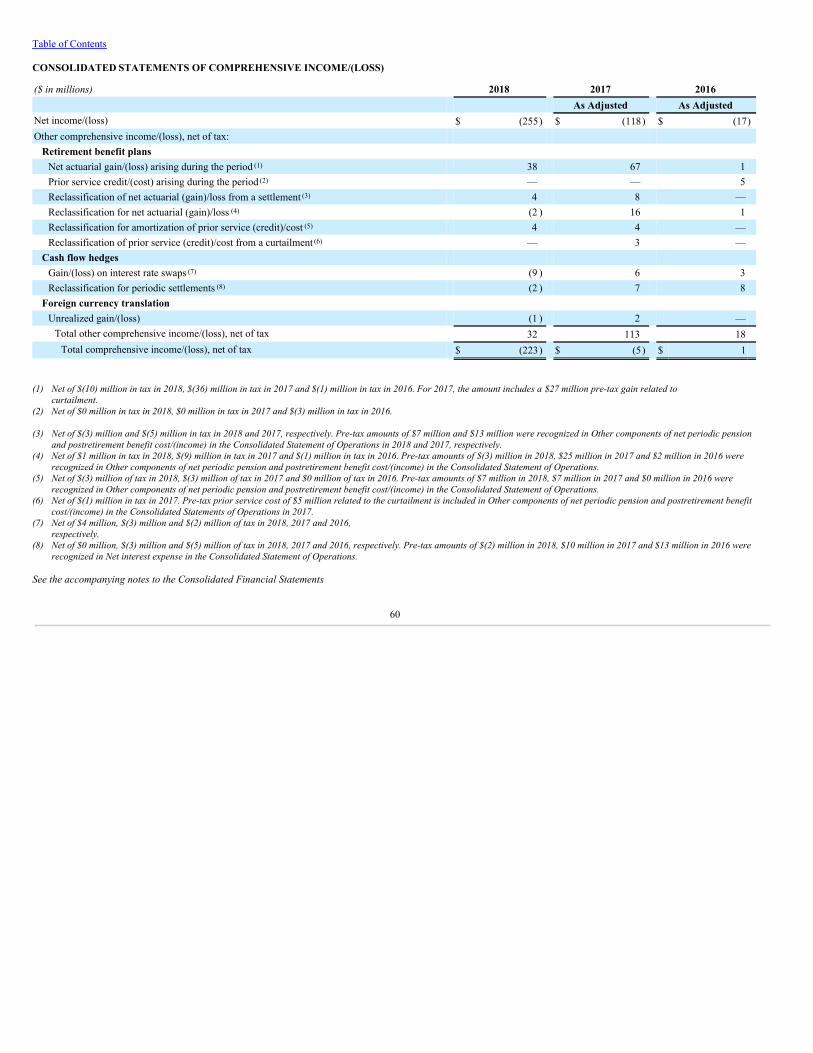
Table of Contents
CONSOLIDATED STATEMENTS OF COMPREHENSIVE INCOME/(LOSS)
($ in millions) 2018 2017 2016 As Adjusted As AdjustedNet income/(loss) $ (255) $ (118) $ (17)Other comprehensive income/(loss), net of tax:
Retirement benefit plans Net actuarial gain/(loss) arising during the period (1) 38 67 1Prior service credit/(cost) arising during the period (2) — — 5Reclassification of net actuarial (gain)/loss from a settlement (3) 4 8 —Reclassification for net actuarial (gain)/loss (4) (2 ) 16 1Reclassification for amortization of prior service (credit)/cost (5) 4 4 —Reclassification of prior service (credit)/cost from a curtailment (6) — 3 —
Cash flow hedges Gain/(loss) on interest rate swaps (7) (9 ) 6 3Reclassification for periodic settlements (8) (2 ) 7 8
Foreign currency translation Unrealized gain/(loss) (1 ) 2 —
Total other comprehensive income/(loss), net of tax 32 113 18Total comprehensive income/(loss), net of tax $ (223) $ (5) $ 1
(1) Net of $(10) million in tax in 2018, $(36) million in tax in 2017 and $(1) million in tax in 2016. For 2017, the amount includes a $27 million pre-tax gain related tocurtailment.
(2) Net of $0 million in tax in 2018, $0 million in tax in 2017 and $(3) million in tax in 2016.
(3) Net of $(3) million and $(5) million in tax in 2018 and 2017, respectively. Pre-tax amounts of $7 million and $13 million were recognized in Other components of net periodic pensionand postretirement benefit cost/(income) in the Consolidated Statement of Operations in 2018 and 2017, respectively.
(4) Net of $1 million in tax in 2018, $(9) million in tax in 2017 and $(1) million in tax in 2016. Pre-tax amounts of $(3) million in 2018, $25 million in 2017 and $2 million in 2016 wererecognized in Other components of net periodic pension and postretirement benefit cost/(income) in the Consolidated Statement of Operations.
(5) Net of $(3) million of tax in 2018, $(3) million of tax in 2017 and $0 million of tax in 2016. Pre-tax amounts of $7 million in 2018, $7 million in 2017 and $0 million in 2016 wererecognized in Other components of net periodic pension and postretirement benefit cost/(income) in the Consolidated Statement of Operations.
(6) Net of $(1) million in tax in 2017. Pre-tax prior service cost of $5 million related to the curtailment is included in Other components of net periodic pension and postretirement benefitcost/(income) in the Consolidated Statements of Operations in 2017.
(7) Net of $4 million, $(3) million and $(2) million of tax in 2018, 2017 and 2016,respectively.
(8) Net of $0 million, $(3) million and $(5) million of tax in 2018, 2017 and 2016, respectively. Pre-tax amounts of $(2) million in 2018, $10 million in 2017 and $13 million in 2016 wererecognized in Net interest expense in the Consolidated Statement of Operations.
See the accompanying notes to the Consolidated Financial Statements.
60
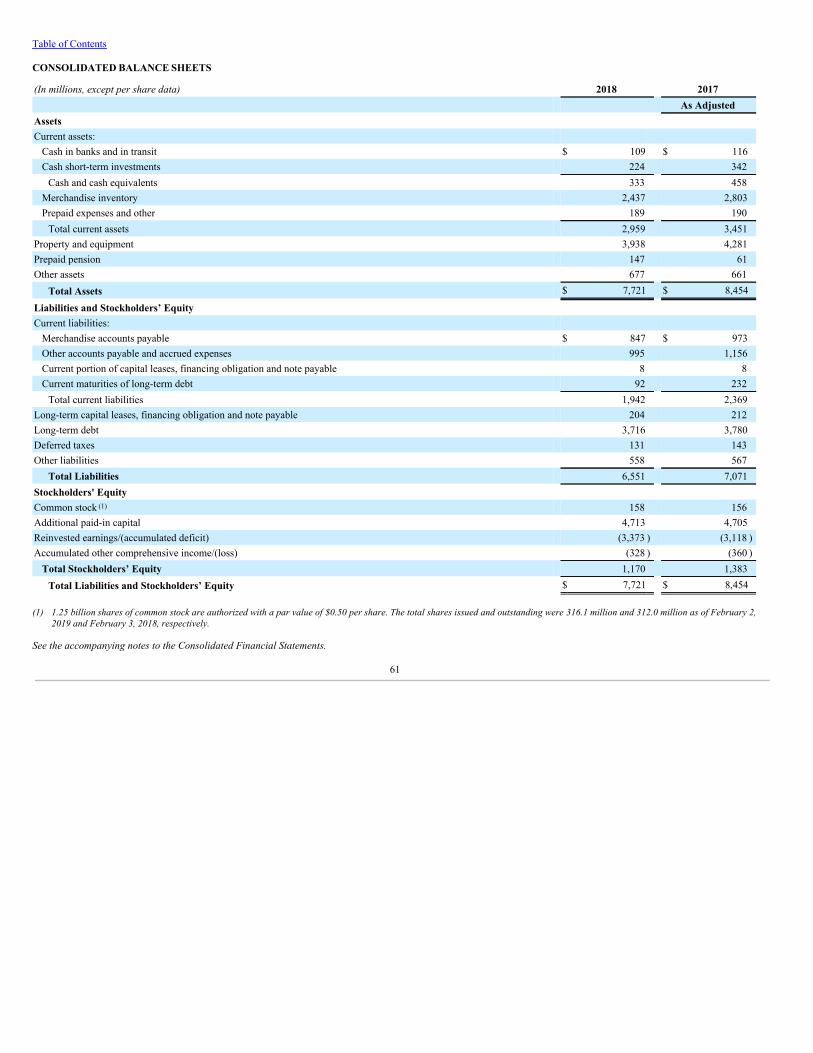
Table of Contents
CONSOLIDATED BALANCE SHEETS
(In millions, except per share data) 2018 2017 As AdjustedAssets Current assets:
Cash in banks and in transit $ 109 $ 116Cash short-term investments 224 342
Cash and cash equivalents 333 458Merchandise inventory 2,437 2,803Prepaid expenses and other 189 190
Total current assets 2,959 3,451Property and equipment 3,938 4,281Prepaid pension 147 61Other assets 677 661
Total Assets $ 7,721 $ 8,454
Liabilities and Stockholders’ Equity Current liabilities:
Merchandise accounts payable $ 847 $ 973Other accounts payable and accrued expenses 995 1,156Current portion of capital leases, financing obligation and note payable 8 8Current maturities of long-term debt 92 232
Total current liabilities 1,942 2,369Long-term capital leases, financing obligation and note payable 204 212Long-term debt 3,716 3,780Deferred taxes 131 143Other liabilities 558 567
Total Liabilities 6,551 7,071Stockholders' Equity Common stock (1) 158 156Additional paid-in capital 4,713 4,705Reinvested earnings/(accumulated deficit) (3,373 ) (3,118 )Accumulated other comprehensive income/(loss) (328 ) (360 )
Total Stockholders’ Equity 1,170 1,383Total Liabilities and Stockholders’ Equity $ 7,721 $ 8,454
(1) 1.25 billion shares of common stock are authorized with a par value of $0.50 per share. The total shares issued and outstanding were 316.1 million and 312.0 million as of February 2,2019 and February 3, 2018, respectively.
See the accompanying notes to the Consolidated Financial Statements.
61
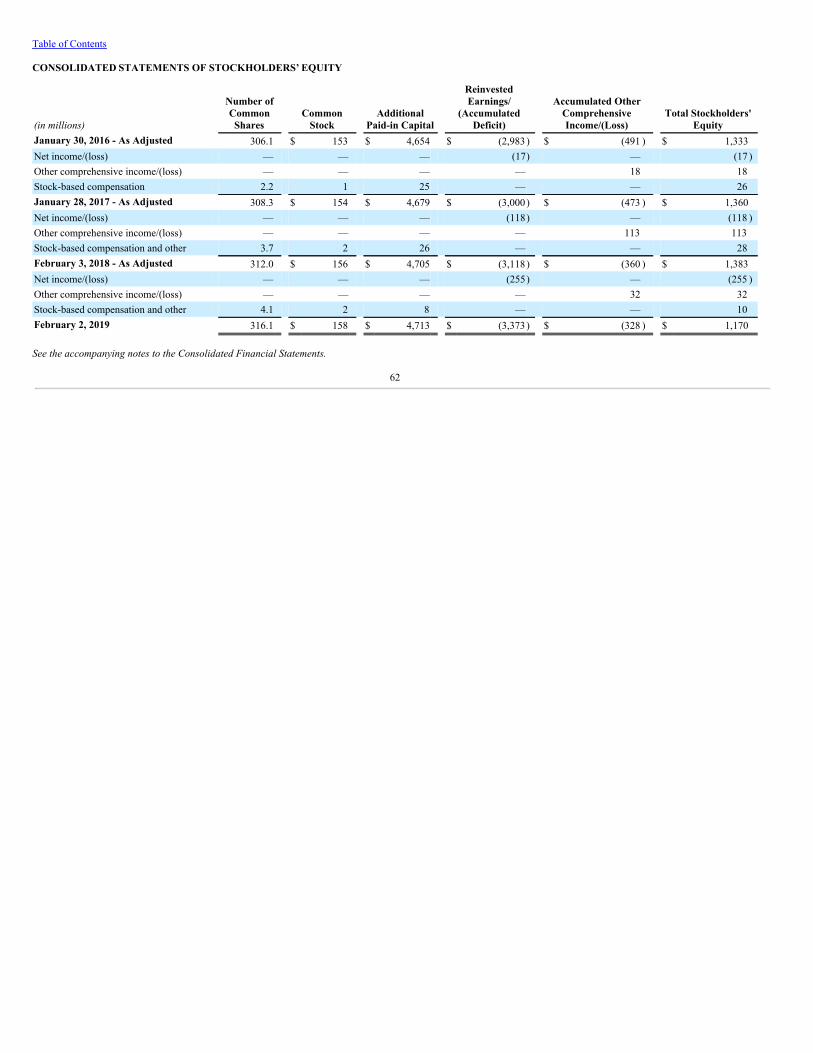
Table of Contents
CONSOLIDATED STATEMENTS OF STOCKHOLDERS’ EQUITY
(in millions)
Number ofCommon
Shares Common
Stock Additional
Paid-in Capital
ReinvestedEarnings/
(AccumulatedDeficit)
Accumulated OtherComprehensiveIncome/(Loss)
Total Stockholders'Equity
January 30, 2016 - As Adjusted 306.1 $ 153 $ 4,654 $ (2,983) $ (491 ) $ 1,333Net income/(loss) — — — (17) — (17 )Other comprehensive income/(loss) — — — — 18 18Stock-based compensation 2.2 1 25 — — 26January 28, 2017 - As Adjusted 308.3 $ 154 $ 4,679 $ (3,000) $ (473 ) $ 1,360Net income/(loss) — — — (118) — (118 )Other comprehensive income/(loss) — — — — 113 113Stock-based compensation and other 3.7 2 26 — — 28February 3, 2018 - As Adjusted 312.0 $ 156 $ 4,705 $ (3,118) $ (360 ) $ 1,383Net income/(loss) — — — (255) — (255 )Other comprehensive income/(loss) — — — — 32 32Stock-based compensation and other 4.1 2 8 — — 10February 2, 2019 316.1 $ 158 $ 4,713 $ (3,373) $ (328 ) $ 1,170
See the accompanying notes to the Consolidated Financial Statements.
62
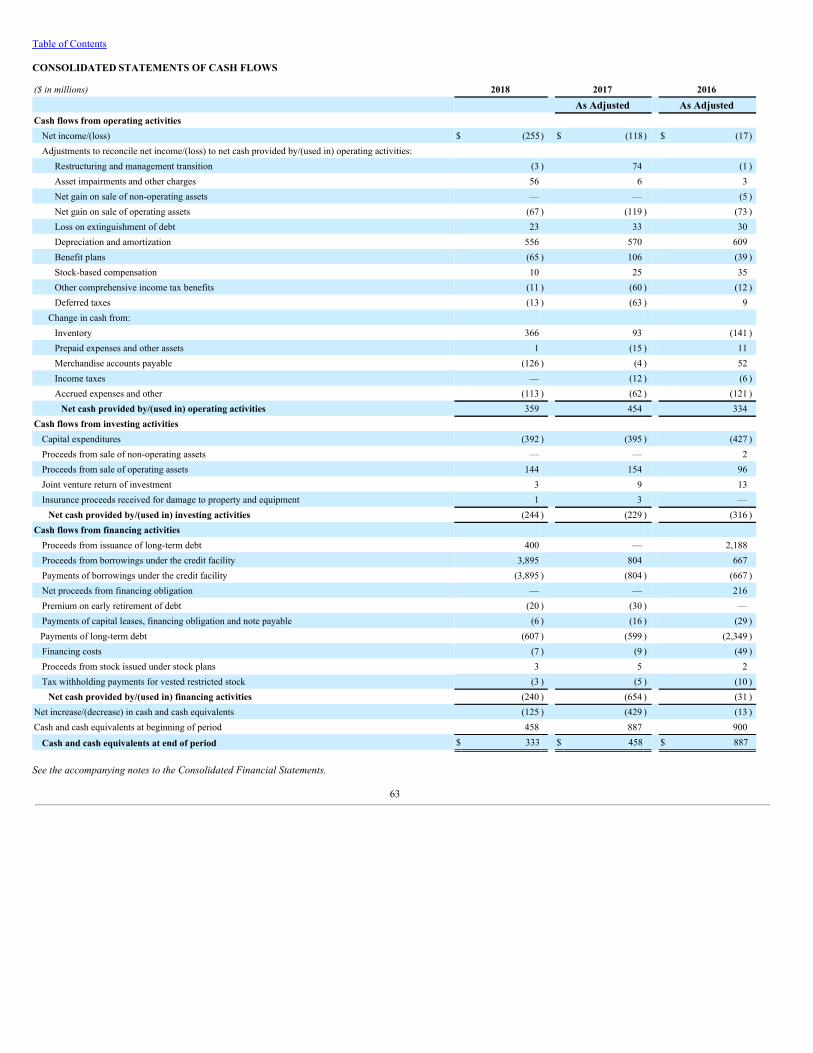
Table of Contents
CONSOLIDATED STATEMENTS OF CASH FLOWS
($ in millions) 2018 2017 2016
As Adjusted As AdjustedCash flows from operating activities
Net income/(loss) $ (255) $ (118) $ (17)Adjustments to reconcile net income/(loss) to net cash provided by/(used in) operating activities:
Restructuring and management transition (3 ) 74 (1 )Asset impairments and other charges 56 6 3Net gain on sale of non-operating assets — — (5 )Net gain on sale of operating assets (67 ) (119 ) (73 )Loss on extinguishment of debt 23 33 30Depreciation and amortization 556 570 609Benefit plans (65 ) 106 (39 )Stock-based compensation 10 25 35Other comprehensive income tax benefits (11 ) (60 ) (12 )Deferred taxes (13 ) (63 ) 9
Change in cash from: Inventory 366 93 (141 )Prepaid expenses and other assets 1 (15 ) 11Merchandise accounts payable (126 ) (4 ) 52Income taxes — (12 ) (6 )Accrued expenses and other (113 ) (62 ) (121 )
Net cash provided by/(used in) operating activities 359 454 334Cash flows from investing activities
Capital expenditures (392 ) (395 ) (427 )Proceeds from sale of non-operating assets — — 2Proceeds from sale of operating assets 144 154 96Joint venture return of investment 3 9 13Insurance proceeds received for damage to property and equipment 1 3 —
Net cash provided by/(used in) investing activities (244 ) (229 ) (316 )Cash flows from financing activities
Proceeds from issuance of long-term debt 400 — 2,188Proceeds from borrowings under the credit facility 3,895 804 667Payments of borrowings under the credit facility (3,895 ) (804 ) (667 )Net proceeds from financing obligation — — 216Premium on early retirement of debt (20 ) (30 ) —Payments of capital leases, financing obligation and note payable (6 ) (16 ) (29 )Payments of long-term debt (607 ) (599 ) (2,349 )Financing costs (7 ) (9 ) (49 )Proceeds from stock issued under stock plans 3 5 2Tax withholding payments for vested restricted stock (3 ) (5 ) (10 )
Net cash provided by/(used in) financing activities (240 ) (654 ) (31 )Net increase/(decrease) in cash and cash equivalents (125 ) (429 ) (13 )Cash and cash equivalents at beginning of period 458 887 900
Cash and cash equivalents at end of period $ 333 $ 458 $ 887
See the accompanying notes to the Consolidated Financial Statements.
63
Table of Contents
NOTES TO CONSOLIDATED FINANCIAL STATEMENTS
1. Basis of Presentation and Consolidation
Nature of Operations Our Company was founded by James Cash Penney in 1902 and has grown to be a major national retailer, operating 864 department stores in 49 states and Puerto Rico, as wellas through our Internet website at jcpenney.com. We sell family apparel and footwear, accessories, fine and fashion jewelry, beauty products through Sephora inside JCPenney,and home furnishings. In addition, our department stores provide services, such as styling salon, optical, portrait photography and custom decorating, to customers.
Basis of Presentation and ConsolidationThe Consolidated Financial Statements present the results of J. C. Penney Company, Inc. and our subsidiaries (the Company or JCPenney). All significant inter-companytransactions and balances have been eliminated in consolidation.
We are a holding company whose principal operating subsidiary is J. C. Penney Corporation, Inc. (JCP). JCP was incorporated in Delaware in 1924, and J. C. Penney Company,Inc. was incorporated in Delaware in 2002, when the holding company structure was implemented. The holding company has no direct subsidiaries other than JCP, and has noindependent assets or operations.
The Company is a co-obligor (or guarantor, as appropriate) regarding the payment of principal and interest on JCP’s outstanding debt securities. We guarantee certain of JCP’soutstanding debt securities fully and unconditionally. Fiscal YearOur fiscal year ends on the Saturday closest to January 31. Unless otherwise stated, references to years in this report relate to fiscal years rather than to calendar years.
Fiscal Year Ended Weeks
2018 February 2, 2019 522017 February 3, 2018 532016 January 28, 2017 52
Use of Estimates and AssumptionsThe preparation of financial statements, in conformity with generally accepted accounting principles in the United States of America (GAAP), requires us to make assumptionsand use estimates that affect the reported amounts of assets and liabilities and disclosure of contingent liabilities at the date of the financial statements and the reported amountsof revenues and expenses during the reporting period. Such estimates and assumptions are subject to inherent uncertainties, which may result in actual amounts differing fromreported amounts.
2. Significant Accounting Policies
RevenueOur contracts with customers primarily consist of sales of merchandise and services at the point of sale, sales of gift cards to a customer for a future purchase, customer loyaltyrewards that provide discount rewards to customers based on purchase activity, and certain licensing and profit sharing arrangements involving the use of our intellectualproperty by others. Revenue includes Total net sales and Credit income and other. Net sales are categorized by merchandise and service sale groupings as we believe it bestdepicts the nature, amount, timing and uncertainty of revenue and cash flow.
64
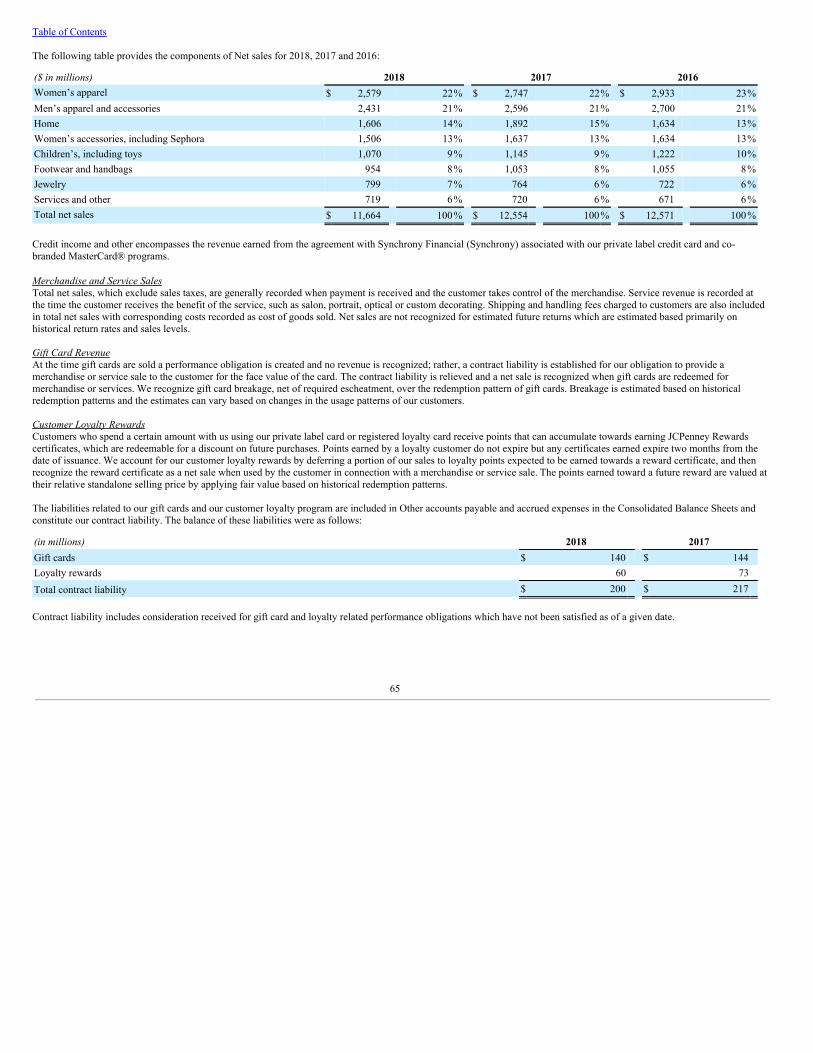
Table of Contents
The following table provides the components of Net sales for 2018, 2017 and 2016:
($ in millions) 2018 2017 2016Women’s apparel $ 2,579 22% $ 2,747 22% $ 2,933 23%Men’s apparel and accessories 2,431 21% 2,596 21% 2,700 21%Home 1,606 14% 1,892 15% 1,634 13%Women’s accessories, including Sephora 1,506 13% 1,637 13% 1,634 13%Children’s, including toys 1,070 9% 1,145 9% 1,222 10%Footwear and handbags 954 8% 1,053 8% 1,055 8%Jewelry 799 7% 764 6% 722 6%Services and other 719 6% 720 6% 671 6%Total net sales $ 11,664 100% $ 12,554 100% $ 12,571 100%
Credit income and other encompasses the revenue earned from the agreement with Synchrony Financial (Synchrony) associated with our private label credit card and co-branded MasterCard® programs.
Merchandise and Service SalesTotal net sales, which exclude sales taxes, are generally recorded when payment is received and the customer takes control of the merchandise. Service revenue is recorded atthe time the customer receives the benefit of the service, such as salon, portrait, optical or custom decorating. Shipping and handling fees charged to customers are also includedin total net sales with corresponding costs recorded as cost of goods sold. Net sales are not recognized for estimated future returns which are estimated based primarily onhistorical return rates and sales levels.
Gift Card RevenueAt the time gift cards are sold a performance obligation is created and no revenue is recognized; rather, a contract liability is established for our obligation to provide amerchandise or service sale to the customer for the face value of the card. The contract liability is relieved and a net sale is recognized when gift cards are redeemed formerchandise or services. We recognize gift card breakage, net of required escheatment, over the redemption pattern of gift cards. Breakage is estimated based on historicalredemption patterns and the estimates can vary based on changes in the usage patterns of our customers.
Customer Loyalty RewardsCustomers who spend a certain amount with us using our private label card or registered loyalty card receive points that can accumulate towards earning JCPenney Rewardscertificates, which are redeemable for a discount on future purchases. Points earned by a loyalty customer do not expire but any certificates earned expire two months from thedate of issuance. We account for our customer loyalty rewards by deferring a portion of our sales to loyalty points expected to be earned towards a reward certificate, and thenrecognize the reward certificate as a net sale when used by the customer in connection with a merchandise or service sale. The points earned toward a future reward are valued attheir relative standalone selling price by applying fair value based on historical redemption patterns.
The liabilities related to our gift cards and our customer loyalty program are included in Other accounts payable and accrued expenses in the Consolidated Balance Sheets andconstitute our contract liability. The balance of these liabilities were as follows:
(in millions) 2018 2017Gift cards $ 140 $ 144Loyalty rewards 60 73Total contract liability $ 200 $ 217
Contract liability includes consideration received for gift card and loyalty related performance obligations which have not been satisfied as of a given date.
65
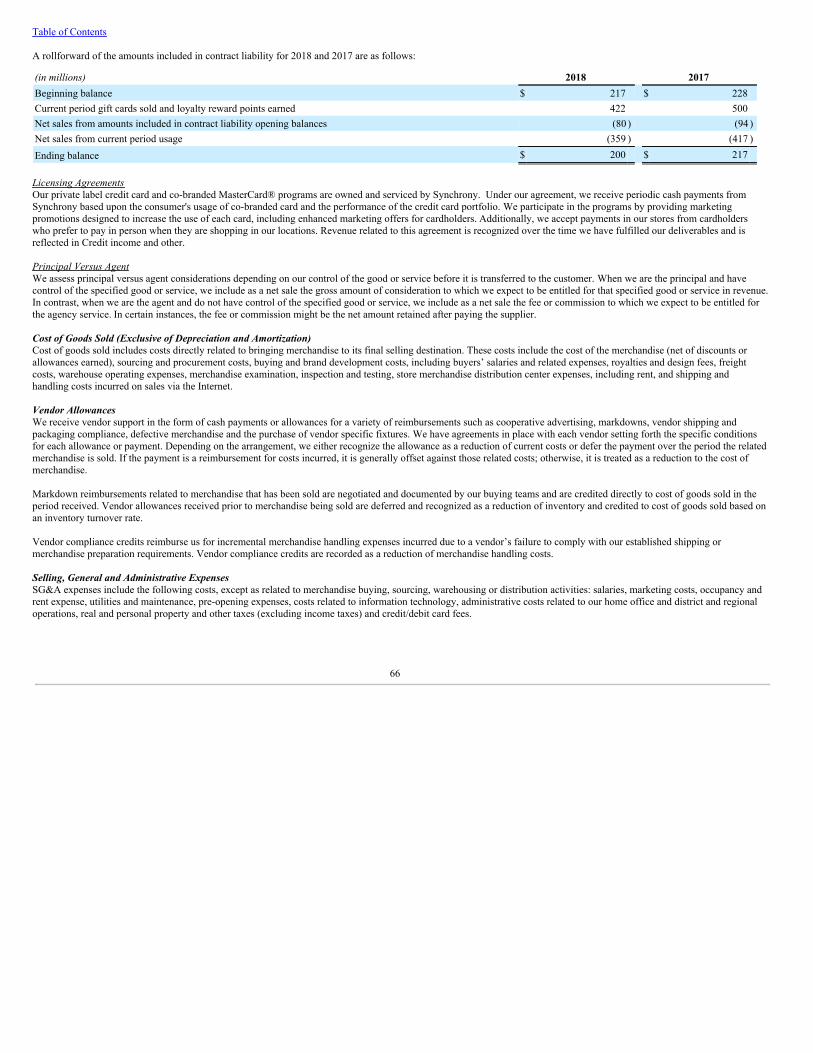
Table of Contents
A rollforward of the amounts included in contract liability for 2018 and 2017 are as follows:
(in millions) 2018 2017Beginning balance $ 217 $ 228Current period gift cards sold and loyalty reward points earned 422 500Net sales from amounts included in contract liability opening balances (80 ) (94 )Net sales from current period usage (359 ) (417 )Ending balance $ 200 $ 217
Licensing AgreementsOur private label credit card and co-branded MasterCard® programs are owned and serviced by Synchrony. Under our agreement, we receive periodic cash payments fromSynchrony based upon the consumer's usage of co-branded card and the performance of the credit card portfolio. We participate in the programs by providing marketingpromotions designed to increase the use of each card, including enhanced marketing offers for cardholders. Additionally, we accept payments in our stores from cardholderswho prefer to pay in person when they are shopping in our locations. Revenue related to this agreement is recognized over the time we have fulfilled our deliverables and isreflected in Credit income and other.
Principal Versus AgentWe assess principal versus agent considerations depending on our control of the good or service before it is transferred to the customer. When we are the principal and havecontrol of the specified good or service, we include as a net sale the gross amount of consideration to which we expect to be entitled for that specified good or service in revenue.In contrast, when we are the agent and do not have control of the specified good or service, we include as a net sale the fee or commission to which we expect to be entitled forthe agency service. In certain instances, the fee or commission might be the net amount retained after paying the supplier.
Cost of Goods Sold (Exclusive of Depreciation and Amortization)Cost of goods sold includes costs directly related to bringing merchandise to its final selling destination. These costs include the cost of the merchandise (net of discounts orallowances earned), sourcing and procurement costs, buying and brand development costs, including buyers’ salaries and related expenses, royalties and design fees, freightcosts, warehouse operating expenses, merchandise examination, inspection and testing, store merchandise distribution center expenses, including rent, and shipping andhandling costs incurred on sales via the Internet.
Vendor AllowancesWe receive vendor support in the form of cash payments or allowances for a variety of reimbursements such as cooperative advertising, markdowns, vendor shipping andpackaging compliance, defective merchandise and the purchase of vendor specific fixtures. We have agreements in place with each vendor setting forth the specific conditionsfor each allowance or payment. Depending on the arrangement, we either recognize the allowance as a reduction of current costs or defer the payment over the period the relatedmerchandise is sold. If the payment is a reimbursement for costs incurred, it is generally offset against those related costs; otherwise, it is treated as a reduction to the cost ofmerchandise.
Markdown reimbursements related to merchandise that has been sold are negotiated and documented by our buying teams and are credited directly to cost of goods sold in theperiod received. Vendor allowances received prior to merchandise being sold are deferred and recognized as a reduction of inventory and credited to cost of goods sold based onan inventory turnover rate.
Vendor compliance credits reimburse us for incremental merchandise handling expenses incurred due to a vendor’s failure to comply with our established shipping ormerchandise preparation requirements. Vendor compliance credits are recorded as a reduction of merchandise handling costs.
Selling, General and Administrative ExpensesSG&A expenses include the following costs, except as related to merchandise buying, sourcing, warehousing or distribution activities: salaries, marketing costs, occupancy andrent expense, utilities and maintenance, pre-opening expenses, costs related to information technology, administrative costs related to our home office and district and regionaloperations, real and personal property and other taxes (excluding income taxes) and credit/debit card fees.
66
Table of Contents
AdvertisingAdvertising costs, which include newspaper, television, Internet search marketing, radio and other media advertising, are expensed either as incurred or the first time theadvertisement occurs. For cooperative advertising programs offered by national brands that require proof of advertising to be provided to the vendor to support thereimbursement of the incurred cost, we offset the allowances against the related advertising expense. Programs that do not require proof of advertising are monitored to ensurethat the allowance provided by each vendor is a reimbursement of costs incurred to advertise for that particular vendor’s label. Total advertising costs, net of cooperativeadvertising vendor reimbursements of $26 million, $27 million and $26 million for 2018, 2017 and 2016, respectively, were $698 million, $714 million and $769 million,respectively.
Income TaxesWe account for income taxes using the asset and liability method. Deferred tax assets and liabilities are recognized for the future tax consequences attributable to differencesbetween the financial statement carrying amounts of existing assets and liabilities and their respective tax bases and operating loss and tax credit carryforwards. Deferred taxassets and liabilities are measured using enacted tax rates expected to apply to taxable income in the years in which those temporary differences are expected to be recovered orsettled. The effect on deferred tax assets and liabilities of a change in tax rates is recognized in income in the period that includes the enactment date. A valuation allowance isrecorded to reduce the carrying amounts of deferred tax assets unless it is more likely than not such assets will be realized. We recognize accrued interest and penalties relatedto unrecognized tax benefits in income tax expense in our Consolidated Statements of Operations.
Earnings/(Loss) per ShareBasic earnings/(loss) per share (EPS) is computed by dividing net income/(loss) by the weighted-average number of common shares outstanding during the period. Diluted EPSis computed by dividing net income/(loss) by the weighted-average number of common shares outstanding during the period plus the number of additional common shares thatwould have been outstanding if the potentially dilutive shares had been issued. Potentially dilutive shares include stock options, unvested restricted stock units and awards anda warrant outstanding during the period, using the treasury stock method. Potentially dilutive shares are excluded from the computations of diluted EPS if their effect would beanti-dilutive.
Cash and Cash EquivalentsCash and cash equivalents include cash short-term investments that are highly liquid investments with original maturities of three months or less. Cash short-term investmentsconsist primarily of short-term U.S. Treasury money market funds and a portfolio of highly rated bank deposits and are stated at cost, which approximates fair market value dueto the short-term maturity. Cash in banks and in transit also include credit card sales transactions that are settled early in the following period.
Merchandise InventoryInventories are valued at the lower of cost (using the first-in, first-out or “FIFO” method) or market using the retail method (RIM). Under RIM, retail values of merchandisegroups are converted to a cost basis by applying the specific average cost-to-retail ratio related to each merchandise grouping.
In 2017, we changed our method of accounting for merchandise inventories for our Internet operations from the lower of standard cost (representing average vendor costs) ornet realizable value to the lower of cost or market using RIM. Along with this change, we retired certain legacy systems and implemented a new module of our enterpriseresource planning system to account for merchandise inventories.
Shrinkage accruals are estimated as a percent of sales for a given period based on physical inventories or cycle count activities. Physical inventory counts for stores are taken atleast annually and cycle count activities for distribution centers and regional warehouses are executed on a daily basis. Inventory records and shrinkage accruals are adjustedappropriately based on the actual results from physical inventories and cycle counts. The shrinkage rate from the most recent physical inventory and cycle count activity, incombination with current events and historical experience, is used as the standard for the shrinkage accrual rate for the next inventory cycle or cycle count activity. Historically,our actual physical inventory and cycle counts results have shown our estimates to be reliable.
67
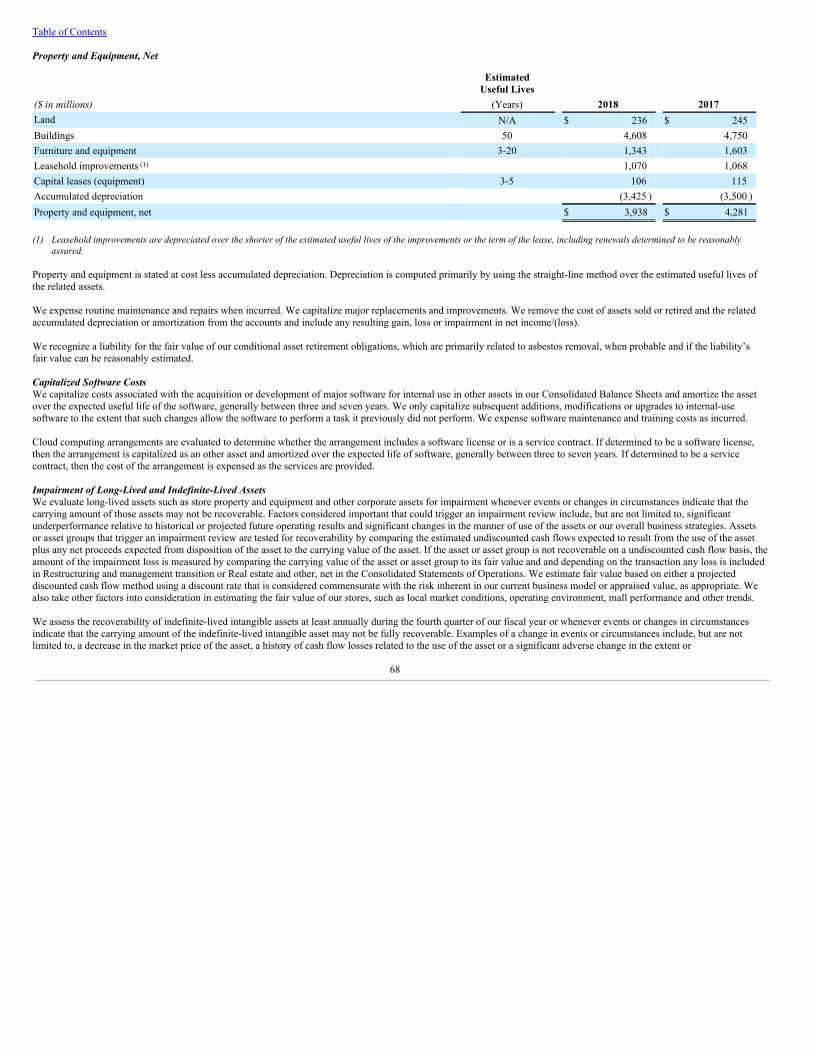
Table of Contents
Property and Equipment, Net
Estimated
Useful Lives ($ in millions) (Years) 2018 2017Land N/A $ 236 $ 245Buildings 50 4,608 4,750Furniture and equipment 3-20 1,343 1,603Leasehold improvements (1) 1,070 1,068Capital leases (equipment) 3-5 106 115Accumulated depreciation (3,425 ) (3,500 )Property and equipment, net $ 3,938 $ 4,281
(1) Leasehold improvements are depreciated over the shorter of the estimated useful lives of the improvements or the term of the lease, including renewals determined to be reasonablyassured.
Property and equipment is stated at cost less accumulated depreciation. Depreciation is computed primarily by using the straight-line method over the estimated useful lives ofthe related assets.
We expense routine maintenance and repairs when incurred. We capitalize major replacements and improvements. We remove the cost of assets sold or retired and the relatedaccumulated depreciation or amortization from the accounts and include any resulting gain, loss or impairment in net income/(loss).
We recognize a liability for the fair value of our conditional asset retirement obligations, which are primarily related to asbestos removal, when probable and if the liability’sfair value can be reasonably estimated.
Capitalized Software CostsWe capitalize costs associated with the acquisition or development of major software for internal use in other assets in our Consolidated Balance Sheets and amortize the assetover the expected useful life of the software, generally between three and seven years. We only capitalize subsequent additions, modifications or upgrades to internal-usesoftware to the extent that such changes allow the software to perform a task it previously did not perform. We expense software maintenance and training costs as incurred.
Cloud computing arrangements are evaluated to determine whether the arrangement includes a software license or is a service contract. If determined to be a software license,then the arrangement is capitalized as an other asset and amortized over the expected life of software, generally between three to seven years. If determined to be a servicecontract, then the cost of the arrangement is expensed as the services are provided.
Impairment of Long-Lived and Indefinite-Lived AssetsWe evaluate long-lived assets such as store property and equipment and other corporate assets for impairment whenever events or changes in circumstances indicate that thecarrying amount of those assets may not be recoverable. Factors considered important that could trigger an impairment review include, but are not limited to, significantunderperformance relative to historical or projected future operating results and significant changes in the manner of use of the assets or our overall business strategies. Assetsor asset groups that trigger an impairment review are tested for recoverability by comparing the estimated undiscounted cash flows expected to result from the use of the assetplus any net proceeds expected from disposition of the asset to the carrying value of the asset. If the asset or asset group is not recoverable on a undiscounted cash flow basis, theamount of the impairment loss is measured by comparing the carrying value of the asset or asset group to its fair value and and depending on the transaction any loss is includedin Restructuring and management transition or Real estate and other, net in the Consolidated Statements of Operations. We estimate fair value based on either a projecteddiscounted cash flow method using a discount rate that is considered commensurate with the risk inherent in our current business model or appraised value, as appropriate. Wealso take other factors into consideration in estimating the fair value of our stores, such as local market conditions, operating environment, mall performance and other trends.
We assess the recoverability of indefinite-lived intangible assets at least annually during the fourth quarter of our fiscal year or whenever events or changes in circumstancesindicate that the carrying amount of the indefinite-lived intangible asset may not be fully recoverable. Examples of a change in events or circumstances include, but are notlimited to, a decrease in the market price of the asset, a history of cash flow losses related to the use of the asset or a significant adverse change in the extent or
68
Table of Contents
manner in which an asset is being used. We test our indefinite-lived intangible assets utilizing the relief from royalty method to determine the estimated fair value for eachindefinite-lived intangible asset. The relief from royalty method estimates our theoretical royalty savings from ownership of the intangible asset. Key assumptions used in thismodel include discount rates, royalty rates, growth rates, sales projections and terminal value rates.
LeasesWe use a consistent lease term when calculating amortization of leasehold improvements, determining straight-line rent expense under an operating lease and determiningclassification of leases as either operating or capital. For purposes of recognizing incentives, premiums, rent holidays and minimum rental expenses on a straight-line basis overthe terms of operating leases, we use the date of initial possession to begin amortization, which is generally when we take control of the property. Renewal options determinedto be reasonably assured are also included in the lease term. Some leases require additional payments based on sales and the related contingent rent is recorded as rent expensewhen the payment is probable.
Some of our lease agreements contain developer/tenant allowances. Upon receipt of such allowances, we record a deferred rent liability in other liabilities on the ConsolidatedBalance Sheets. The allowances are then amortized on a straight-line basis over the remaining terms of the corresponding leases as a reduction of rent expense.
Capital leases are recorded as an asset and an obligation at an amount equal to the present value of the minimum lease payments during the lease term. Assets subject to anoperating lease and the related lease payments are not recorded on our balance sheet. Rent expense related to an operating lease is recognized on a straight-line basis over thelease term resulting in periodic deferred rent balances to adjust the cash rent paid.
Sale-leasebacks are transactions through which we sell assets and subsequently lease them back. The resulting leases that qualify for sale-leaseback accounting are evaluatedand accounted for as operating leases or capital leases. A transaction that does not qualify for sale-leaseback accounting as a result of a prohibited form of continuinginvolvement is accounted for as a financing transaction. For a financing transaction, we retain the "sold" assets within property and equipment and record a financing obligationequal to the amount of cash proceeds received. Rental payments under such transactions are recognized as a reduction of the financing obligation and as interest expense usingan effective interest method.
Exit or Disposal Activity CostsCosts associated with exit or disposal activities are recorded at their fair values when a liability has been incurred. Reserves for operating leases are established at the time ofclosure for the present value of any remaining operating lease obligations (PVOL), net of estimated sublease income. Severance is recorded over the service period required tobe rendered in order to receive the termination benefits or, if employees will not be retained to render future service, a reserve is established when communication has occurredto the affected employees. Other exit costs are accrued when incurred.
Retirement-Related BenefitsWe recognize the funded status – the difference between the fair value of plan assets and the plan’s benefit obligation – of our defined benefit pension and postretirement plansdirectly on the Consolidated Balance Sheet. Each overfunded plan is recognized as an asset and each underfunded plan is recognized as a liability. We adjust othercomprehensive income/(loss) to reflect prior service cost or credits and actuarial gain or loss amounts arising during the period and reclassification adjustments for amountsbeing recognized as components of net periodic pension/postretirement cost, net of tax. Prior service cost or credits are amortized to net income/(loss) over the averageremaining service period, a period of about eight years for the primary plan. Pension related actuarial gains or losses in excess of 10% of the greater of the fair value of planassets or the plan's projected benefit obligation (the corridor) are recognized annually in the fourth quarter each year (Mark-to-market (MTM) adjustment), and, if applicable, inany interim period in which an interim remeasurement is triggered. We measure the plan assets and obligations annually at the adopted measurement date of January 31 to determine pension expense for the subsequent year. The factors andassumptions affecting the measurement are the characteristics of the population and salary increases, with the most important being the expected return on plan assets and thediscount rate for the pension obligation. We use actuarial calculations for the assumptions, which require significant judgment.
Stock-Based CompensationStock options are valued primarily using the binomial lattice option pricing model and are granted with an exercise price equal to the closing price of our common stock on thegrant date. Time-based and performance-based restricted stock awards are valued using the closing price of our common stock on the grant date. For awards that have marketconditions, such as attaining a specified stock price or based on total shareholder return, we use a Monte Carlo simulation model to determine the value of the award. Our
69
Table of Contents
current plan does not permit awarding stock options below grant-date market value nor does it allow any repricing subsequent to the date of grant.
Stock options are valued using the following assumptions:
• Valuation Method. We estimate the fair value of stock option awards on the date of grant using primarily the binomial latticemodel.
• Expected Term. Our expected option term represents the average period that we expect stock options to be outstanding and is determined based on our historicalexperience, giving consideration to contractual terms, vesting schedules, anticipated stock prices and expected future behavior of option holders.
• Expected Volatility. Our expected volatility is based on a blend of the historical volatility of JCPenney stock combined with an estimate of the implied volatilityderived from exchange traded options.
• Risk-Free Interest Rate. Our risk-free interest rate is based on zero-coupon U.S. Treasury yields in effect at the date of grant with the same period as the expectedoption life.
• Expected Dividend Yield. The dividend assumption is based on our current expectations about our dividendpolicy.
Employee stock options and time-based and performance-based restricted stock awards typically vest over periods ranging from one to three years and employee stock optionshave a maximum term of 10 years. Estimates of forfeitures are incorporated at the grant date and are adjusted if actual results are different from initial estimates. For awardsthat have performance conditions, the probability of achieving the performance condition is evaluated each reporting period, and if the performance condition is expected to beachieved, the related compensation expense is recorded over the remaining service period. In addition, certain performance-based restricted stock awards may be granted wherethe number of shares may be increased to the maximum or reduced to the minimum threshold based on the results of the performance metrics in accordance with the termsestablished at the time of the award. In the event that performance conditions are not achieved and the awards do not vest, compensation expense is reversed. For market basedawards, we record expense over the service period, regardless of whether or not the market condition is achieved.
Awards with graded vesting that only have a time vesting requirement and awards that vest entirely at the end of the vesting requirement are expensed on a straight-line basisfor the entire award. Expense for awards with graded vesting that incorporate a market or performance requirement is attributed separately based on the vesting for each tranche.
3. Changes in Accounting for Revenue Recognition and Retirement-Related Benefits
In May 2014, the Financial Accounting Standards Board (FASB) issued Accounting Standards Codification (ASC) Topic 606 (ASC 606), Revenue from Contracts withCustomers. The new revenue recognition standard provides a five-step analysis of transactions to determine when and how revenue is recognized. The core principle of theguidance is that a Company should recognize revenue to depict the transfer of promised goods or services to customers in an amount that reflects the consideration to which theentity expects to be entitled in exchange for those goods or services. We have adopted the new standard using the full retrospective approach on February 4, 2018, and with suchadoption our revenue recognition policies related to gift card breakage, customer loyalty programs, credit card income and principal versus agent considerations were changed.Whereas we previously recognized gift card breakage, net of required escheatment, 60 months after the gift card was issued, we now recognize gift card breakage, net ofrequired escheatment, over the redemption pattern of gift cards. Additionally, whereas we utilized the incremental cost method to account for our customer loyalty programs, wenow account for our customer loyalty programs as revenue and are required to defer a portion of our sales to loyalty rewards to be earned by reward members for a futurediscount on a future sale.
We also changed the classification of profit sharing income earned in connection with our private label credit card and co-branded MasterCard® programs owned and servicedby Synchrony. Under our agreement, we receive cash payments from Synchrony based upon the performance of the credit card portfolios. Previously, the income we earnedunder our agreement with Synchrony was included as an offset to SG&A expenses. In connection with the adoption of the new standard, we changed our presentation to includesuch income in a separate line item described as Credit income and other. Further, we adjusted our principal versus agent considerations for certain contracts and where wepreviously considered ourselves to be the agent (report net sales) under these contracts based on the risk and rewards of the arrangement, we now consider ourselves to be theprincipal (report gross sales) based on our control of the good or service before it is transferred to the customer. Lastly, we
70
Table of Contents
changed our balance sheet presentation of our sales return liability and where we previously reflected the balance as a net liability, we now recognize a gross refund liability forthe sales amounts expected to be refunded to customers and an asset for the recoverable cost of the merchandise expected to be returned by customers.
In March 2017, the FASB issued Accounting Standards Update (ASU) 2017-07, Compensation - Retirement Benefits (Topic 715): Improving the Presentation of Net PeriodicPension Cost and Net Periodic Postretirement Benefit Cost. ASU 2017-07 requires companies to present the service cost component of net periodic pension and postretirementbenefit cost in the same line items in which they report compensation cost. Companies will present all other components of net periodic pension and postretirement benefit costoutside of operating income, if this subtotal is presented. As required by the standard, we retrospectively adopted ASU 2017-07 on February 4, 2018, and we changed thepresentation of our Consolidated Statement of Operations to exclude the Pension line item and to reflect the service cost component of our pension and postretirement benefitexpense/(income) in SG&A and to reflect all other components in a new separate line item below operating income/(loss) described as Other components of net periodic pensionand postretirement benefit cost/(income).
These changes have been reported through retrospective application of the new policies to all periods presented. The impacts of all adjustments made to the financial statementsare summarized below:
Consolidated Statements of Operations
2017 2016
($ in millions, except per share data)PreviouslyReported As Adjusted Effect of Change
PreviouslyReported As Adjusted Effect of Change
Total net sales $ 12,506 $ 12,554 $ 48 $ 12,547 $ 12,571 $ 24Credit income and other — 319 319 — 347 347Total revenues 12,506 12,873 367 12,547 12,918 371Cost of goods sold (exclusive of depreciation andamortization shown separately below) 8,174 8,208 34 8,071 8,097 26Selling, general and administrative (SG&A) 3,468 3,845 377 3,538 3,973 435Pension 21 — (21) 19 — (19)Restructuring and management transition 303 184 (119) 26 26 —Operating income/(loss) 116 212 96 395 324 (71)Other components of net periodic pension andpostretirement benefit cost/(income) — 98 98 — (53) (53)Income/(loss) before income taxes (242) (244) (2) 2 (16) (18)Net income/(loss) $ (116) $ (118) $ (2) $ 1 $ (17) $ (18)Basic earnings/(loss) per common share $ (0.37) $ (0.38) $ (0.01) $ 0.00 $ (0.06) $ (0.06)Diluted earnings/loss per common share $ (0.37) $ (0.38) $ (0.01) $ 0.00 $ (0.06) $ (0.06)
Consolidated Statements of Comprehensive Income/(Loss)
2017 2016
($ in millions)PreviouslyReported As Adjusted Effect of Change
PreviouslyReported As Adjusted Effect of Change
Net income/(loss) $ (116) $ (118) $ (2) $ 1 $ (17) $ (18)
71
Table of Contents
Consolidated Balance Sheet
2017
($ in millions)PreviouslyReported As Adjusted Effect of Change
Merchandise inventory $ 2,762 $ 2,803 $ 41Other accounts payable and accrued expenses 1,119 1,156 37Reinvested earnings/(accumulated deficit) (3,122) (3,118) 4
Consolidated Statements of Stockholders' Equity
2017 2016
($ in millions)PreviouslyReported As Adjusted Effect of Change
PreviouslyReported As Adjusted Effect of Change
Reinvested earnings/(accumulated deficit) Beginning balance $ (3,006) $ (3,000) $ 6 $ (3,007) $ (2,983) $ 24Net income/(loss) (116) (118) (2) 1 (17) (18)Ending balance $ (3,122) $ (3,118) $ 4 $ (3,006) $ (3,000) $ 6
Consolidated Statements of Cash Flows
2017 2016
($ in millions)PreviouslyReported As Adjusted Effect of Change
PreviouslyReported As Adjusted Effect of Change
Cash flows from operating activities: Net income/(loss) $ (116) $ (118) $ (2) $ 1 $ (17) $ (18)Inventory 92 93 1 (133 ) (141) (8)Accrued expenses and other (63) (62) 1 (147 ) (121) 26
4. Effect of New Accounting Standards
In February 2018, the FASB issued ASU 2018-02, Income Statement-Reporting Comprehensive Income (Topic 220): Reclassification of Certain Tax Effects from AccumulatedOther Comprehensive Income. This standard focuses on a targeted improvement to reclassify stranded tax effects resulting from the Tax Cuts and Jobs Act (the “Tax Act”)enacted on December 22, 2017 from Accumulated other comprehensive income/(loss) to Retained earnings/accumulated deficit. The amount of the reclassification would be thedifference between the amount initially charged or credited directly to other comprehensive income at the previously enacted U.S. federal corporate income tax rate that remainsin Accumulated other comprehensive income/(loss) and the amount that would have been charged or credited directly to Other comprehensive income/(loss) using the newlyenacted U.S. federal corporate income tax rate, excluding the effect of any valuation allowance previously charged to Net income/(loss). ASU 2018-02 is effective for interimand annual periods beginning after December 15, 2018, and early adoption is permitted. We are currently evaluating the effect that the new accounting guidance will have onour Consolidated Balance Sheet.
In February 2016, the FASB issued ASC Topic 842, Leases (Topic 842), a replacement of Leases (Topic 840) and updated by various targeted improvements, which requireslessees to recognize most leases on their balance sheets as lease liabilities with corresponding right-of-use assets. While many aspects of lessor accounting remain the same, thenew standard makes some changes, such as eliminating today’s real estate-specific guidance. As a globally converged standard, lessees and lessors are required to classify mostleases using a principle generally consistent with that of International Accounting Standards. The standard also changes what are considered the initial direct costs of a lease.The standard is effective for annual periods beginning after December 15, 2018 and interim periods within that year and must be adopted by a modified retrospective method, orby an optional transition method, which allows for the application of current legacy guidance, including its disclosure requirements, in the comparative periods presented in theyear of adoption. The Company has chosen to use the
72
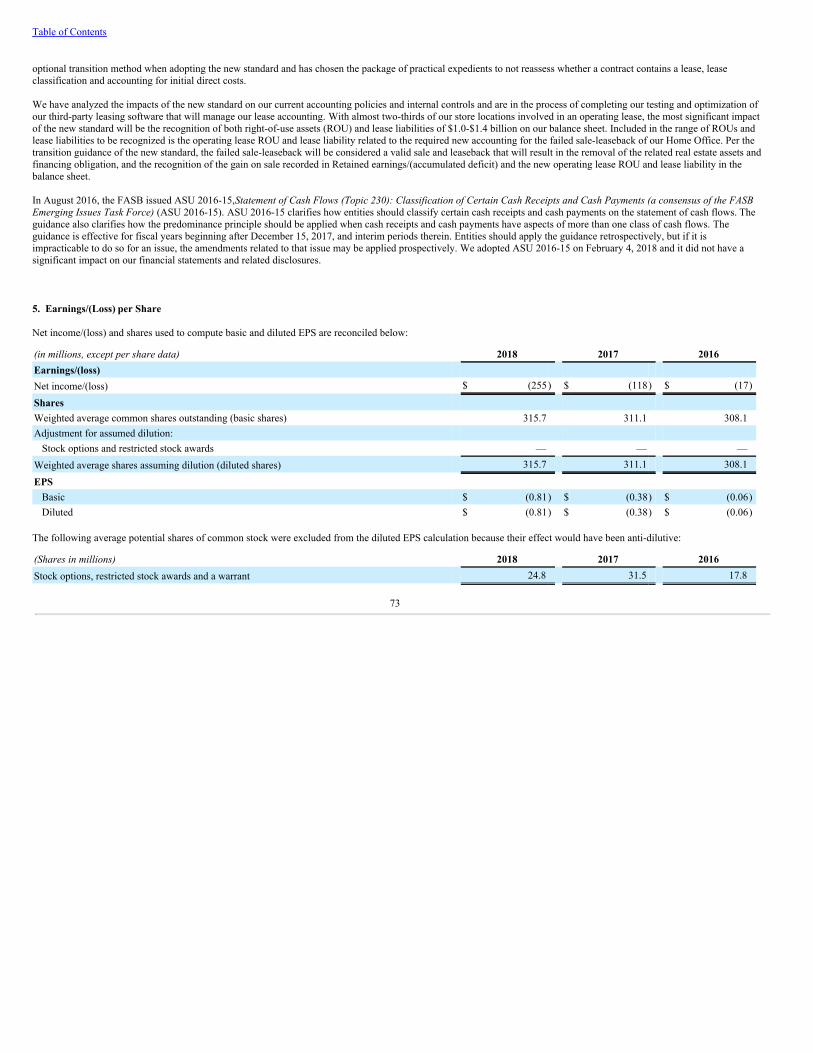
Table of Contents
optional transition method when adopting the new standard and has chosen the package of practical expedients to not reassess whether a contract contains a lease, leaseclassification and accounting for initial direct costs.
We have analyzed the impacts of the new standard on our current accounting policies and internal controls and are in the process of completing our testing and optimization ofour third-party leasing software that will manage our lease accounting. With almost two-thirds of our store locations involved in an operating lease, the most significant impactof the new standard will be the recognition of both right-of-use assets (ROU) and lease liabilities of $1.0-$1.4 billion on our balance sheet. Included in the range of ROUs andlease liabilities to be recognized is the operating lease ROU and lease liability related to the required new accounting for the failed sale-leaseback of our Home Office. Per thetransition guidance of the new standard, the failed sale-leaseback will be considered a valid sale and leaseback that will result in the removal of the related real estate assets andfinancing obligation, and the recognition of the gain on sale recorded in Retained earnings/(accumulated deficit) and the new operating lease ROU and lease liability in thebalance sheet.
In August 2016, the FASB issued ASU 2016-15, Statement of Cash Flows (Topic 230): Classification of Certain Cash Receipts and Cash Payments (a consensus of the FASBEmerging Issues Task Force) (ASU 2016-15). ASU 2016-15 clarifies how entities should classify certain cash receipts and cash payments on the statement of cash flows. Theguidance also clarifies how the predominance principle should be applied when cash receipts and cash payments have aspects of more than one class of cash flows. Theguidance is effective for fiscal years beginning after December 15, 2017, and interim periods therein. Entities should apply the guidance retrospectively, but if it isimpracticable to do so for an issue, the amendments related to that issue may be applied prospectively. We adopted ASU 2016-15 on February 4, 2018 and it did not have asignificant impact on our financial statements and related disclosures.
5. Earnings/(Loss) per Share
Net income/(loss) and shares used to compute basic and diluted EPS are reconciled below:
(in millions, except per share data) 2018 2017 2016Earnings/(loss) Net income/(loss) $ (255) $ (118) $ (17)
Shares Weighted average common shares outstanding (basic shares) 315.7 311.1 308.1Adjustment for assumed dilution:
Stock options and restricted stock awards — — —Weighted average shares assuming dilution (diluted shares) 315.7 311.1 308.1
EPS Basic $ (0.81) $ (0.38) $ (0.06)Diluted $ (0.81) $ (0.38) $ (0.06)
The following average potential shares of common stock were excluded from the diluted EPS calculation because their effect would have been anti-dilutive:
(Shares in millions) 2018 2017 2016Stock options, restricted stock awards and a warrant 24.8 31.5 17.8
73
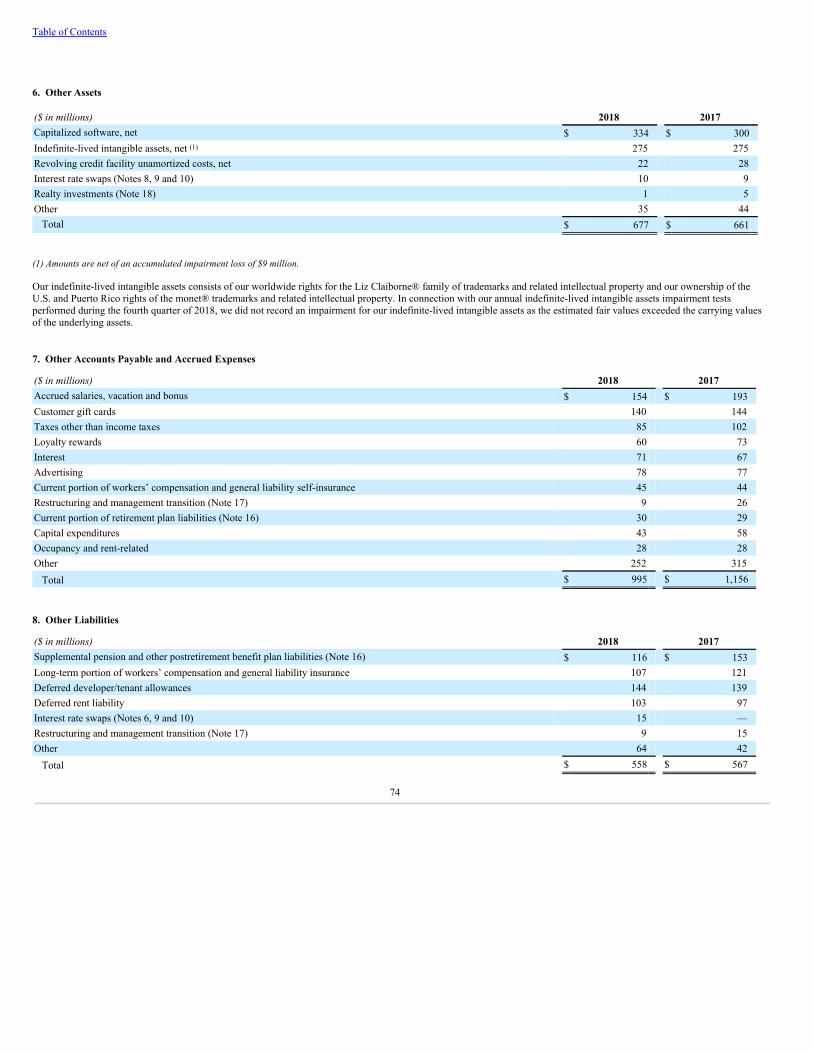
Table of Contents
6. Other Assets
($ in millions) 2018 2017Capitalized software, net $ 334 $ 300Indefinite-lived intangible assets, net (1) 275 275Revolving credit facility unamortized costs, net 22 28Interest rate swaps (Notes 8, 9 and 10) 10 9Realty investments (Note 18) 1 5Other 35 44
Total $ 677 $ 661
(1) Amounts are net of an accumulated impairment loss of $9 million.
Our indefinite-lived intangible assets consists of our worldwide rights for the Liz Claiborne® family of trademarks and related intellectual property and our ownership of theU.S. and Puerto Rico rights of the monet® trademarks and related intellectual property. In connection with our annual indefinite-lived intangible assets impairment testsperformed during the fourth quarter of 2018, we did not record an impairment for our indefinite-lived intangible assets as the estimated fair values exceeded the carrying valuesof the underlying assets.
7. Other Accounts Payable and Accrued Expenses
($ in millions) 2018 2017Accrued salaries, vacation and bonus $ 154 $ 193Customer gift cards 140 144Taxes other than income taxes 85 102Loyalty rewards 60 73Interest 71 67Advertising 78 77Current portion of workers’ compensation and general liability self-insurance 45 44Restructuring and management transition (Note 17) 9 26Current portion of retirement plan liabilities (Note 16) 30 29Capital expenditures 43 58Occupancy and rent-related 28 28Other 252 315
Total $ 995 $ 1,156
8. Other Liabilities
($ in millions) 2018 2017Supplemental pension and other postretirement benefit plan liabilities (Note 16) $ 116 $ 153Long-term portion of workers’ compensation and general liability insurance 107 121Deferred developer/tenant allowances 144 139Deferred rent liability 103 97Interest rate swaps (Notes 6, 9 and 10) 15 —Restructuring and management transition (Note 17) 9 15Other 64 42
Total $ 558 $ 567
74
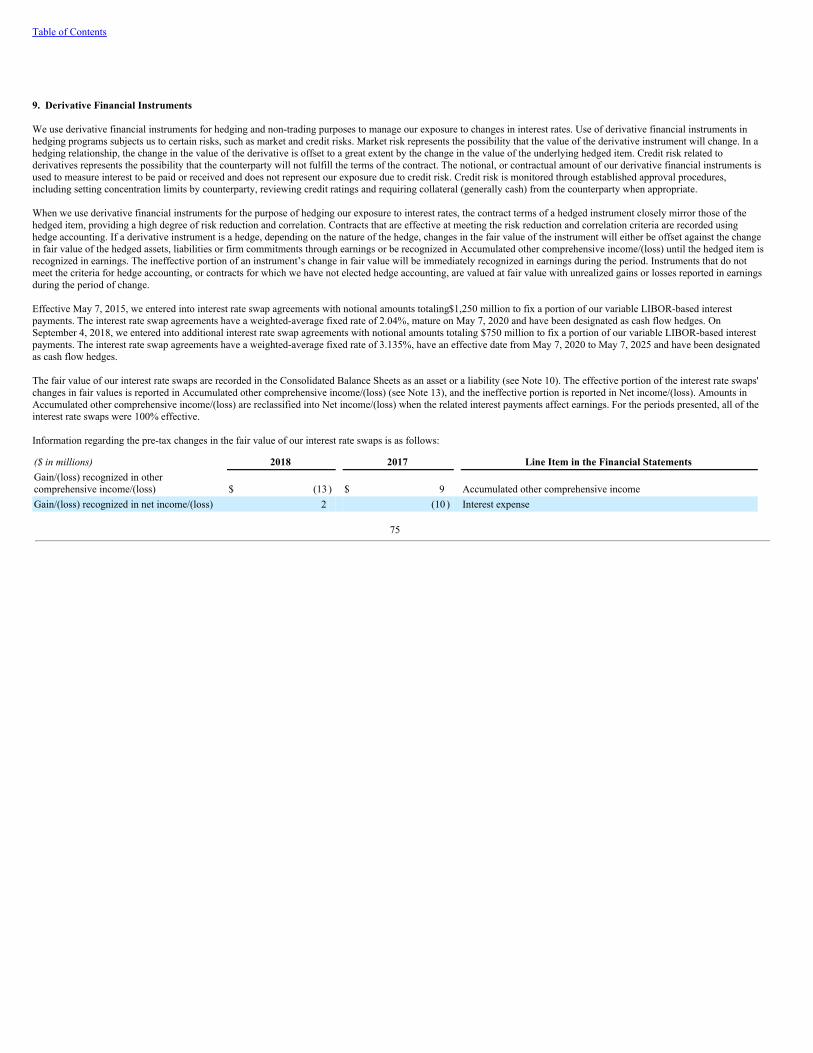
Table of Contents
9. Derivative Financial Instruments
We use derivative financial instruments for hedging and non-trading purposes to manage our exposure to changes in interest rates. Use of derivative financial instruments inhedging programs subjects us to certain risks, such as market and credit risks. Market risk represents the possibility that the value of the derivative instrument will change. In ahedging relationship, the change in the value of the derivative is offset to a great extent by the change in the value of the underlying hedged item. Credit risk related toderivatives represents the possibility that the counterparty will not fulfill the terms of the contract. The notional, or contractual amount of our derivative financial instruments isused to measure interest to be paid or received and does not represent our exposure due to credit risk. Credit risk is monitored through established approval procedures,including setting concentration limits by counterparty, reviewing credit ratings and requiring collateral (generally cash) from the counterparty when appropriate.
When we use derivative financial instruments for the purpose of hedging our exposure to interest rates, the contract terms of a hedged instrument closely mirror those of thehedged item, providing a high degree of risk reduction and correlation. Contracts that are effective at meeting the risk reduction and correlation criteria are recorded usinghedge accounting. If a derivative instrument is a hedge, depending on the nature of the hedge, changes in the fair value of the instrument will either be offset against the changein fair value of the hedged assets, liabilities or firm commitments through earnings or be recognized in Accumulated other comprehensive income/(loss) until the hedged item isrecognized in earnings. The ineffective portion of an instrument’s change in fair value will be immediately recognized in earnings during the period. Instruments that do notmeet the criteria for hedge accounting, or contracts for which we have not elected hedge accounting, are valued at fair value with unrealized gains or losses reported in earningsduring the period of change.
Effective May 7, 2015, we entered into interest rate swap agreements with notional amounts totaling $1,250 million to fix a portion of our variable LIBOR-based interestpayments. The interest rate swap agreements have a weighted-average fixed rate of 2.04%, mature on May 7, 2020 and have been designated as cash flow hedges. OnSeptember 4, 2018, we entered into additional interest rate swap agreements with notional amounts totaling $750 million to fix a portion of our variable LIBOR-based interestpayments. The interest rate swap agreements have a weighted-average fixed rate of 3.135%, have an effective date from May 7, 2020 to May 7, 2025 and have been designatedas cash flow hedges.
The fair value of our interest rate swaps are recorded in the Consolidated Balance Sheets as an asset or a liability (see Note 10). The effective portion of the interest rate swaps'changes in fair values is reported in Accumulated other comprehensive income/(loss) (see Note 13), and the ineffective portion is reported in Net income/(loss). Amounts inAccumulated other comprehensive income/(loss) are reclassified into Net income/(loss) when the related interest payments affect earnings. For the periods presented, all of theinterest rate swaps were 100% effective.
Information regarding the pre-tax changes in the fair value of our interest rate swaps is as follows:
($ in millions) 2018 2017 Line Item in the Financial StatementsGain/(loss) recognized in othercomprehensive income/(loss) $ (13 ) $ 9 Accumulated other comprehensive incomeGain/(loss) recognized in net income/(loss) 2 (10 ) Interest expense
75
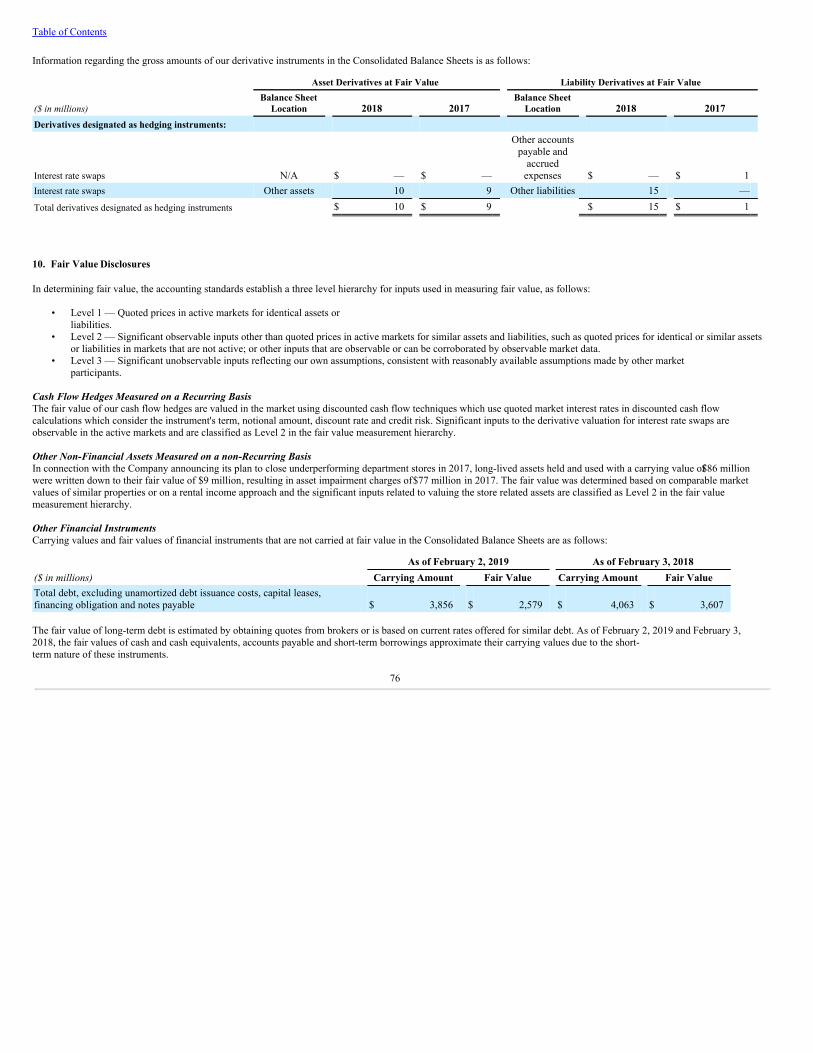
Table of Contents
Information regarding the gross amounts of our derivative instruments in the Consolidated Balance Sheets is as follows:
Asset Derivatives at Fair Value Liability Derivatives at Fair Value
($ in millions)Balance Sheet
Location 2018 2017 Balance Sheet
Location 2018 2017Derivatives designated as hedging instruments:
Interest rate swaps N/A $ — $ —
Other accountspayable and
accruedexpenses $ — $ 1
Interest rate swaps Other assets 10 9 Other liabilities 15 —Total derivatives designated as hedging instruments $ 10 $ 9 $ 15 $ 1
10. Fair Value Disclosures
In determining fair value, the accounting standards establish a three level hierarchy for inputs used in measuring fair value, as follows:
• Level 1 — Quoted prices in active markets for identical assets orliabilities.
• Level 2 — Significant observable inputs other than quoted prices in active markets for similar assets and liabilities, such as quoted prices for identical or similar assetsor liabilities in markets that are not active; or other inputs that are observable or can be corroborated by observable market data.
• Level 3 — Significant unobservable inputs reflecting our own assumptions, consistent with reasonably available assumptions made by other marketparticipants.
Cash Flow Hedges Measured on a Recurring BasisThe fair value of our cash flow hedges are valued in the market using discounted cash flow techniques which use quoted market interest rates in discounted cash flowcalculations which consider the instrument's term, notional amount, discount rate and credit risk. Significant inputs to the derivative valuation for interest rate swaps areobservable in the active markets and are classified as Level 2 in the fair value measurement hierarchy.
Other Non-Financial Assets Measured on a non-Recurring BasisIn connection with the Company announcing its plan to close underperforming department stores in 2017, long-lived assets held and used with a carrying value of $86 millionwere written down to their fair value of $9 million, resulting in asset impairment charges of $77 million in 2017. The fair value was determined based on comparable marketvalues of similar properties or on a rental income approach and the significant inputs related to valuing the store related assets are classified as Level 2 in the fair valuemeasurement hierarchy.
Other Financial InstrumentsCarrying values and fair values of financial instruments that are not carried at fair value in the Consolidated Balance Sheets are as follows:
As of February 2, 2019 As of February 3, 2018($ in millions) Carrying Amount Fair Value Carrying Amount Fair ValueTotal debt, excluding unamortized debt issuance costs, capital leases,financing obligation and notes payable $ 3,856 $ 2,579 $ 4,063 $ 3,607
The fair value of long-term debt is estimated by obtaining quotes from brokers or is based on current rates offered for similar debt. As of February 2, 2019 and February 3,2018, the fair values of cash and cash equivalents, accounts payable and short-term borrowings approximate their carrying values due to the short-term nature of these instruments.
76

Table of Contents
Concentrations of Credit Risk We have no significant concentrations of credit risk.
11. Credit Facility
The Company has a $2,350 million senior secured asset-based credit facility (2017 Credit Facility), comprised of a $2,350 million revolving line of credit (Revolving Facility).During the second quarter of 2017, we amended the Revolving Facility to, among other things, extend the maturity date to June 20, 2022 and to lower the interest rate spread by75 basis points. All borrowings under the 2017 Credit Facility accrue interest at a rate equal to, at the Company's option, a base rate or an adjusted LIBOR rate plus a spread.
The 2017 Credit Facility is secured by a perfected first-priority security interest in substantially all of our eligible credit card receivables, accounts receivable and inventory. TheRevolving Facility is available for general corporate purposes, including the issuance of letters of credit. Pricing under the Revolving Facility is tiered based on our utilizationunder the line of credit. JCP’s obligations under the 2017 Credit Facility are guaranteed by J. C. Penney Company, Inc.
The borrowing base under the Revolving Facility is limited to a maximum of 85% of eligible accounts receivable, plus 90% of eligible credit card receivables, plus 90% of theliquidation value of our inventory, net of certain reserves. Letters of credit reduce the amount available to borrow by their face value. In addition, the maximum availability islimited by a minimum excess availability threshold which is the lesser of 10% of the borrowing base or $200 million, subject to a minimum threshold requirement of $150million.
As of the end of 2018, we had no borrowings outstanding under the Revolving Facility. In addition, as of the end of 2018, we had $1,685 million available for borrowing, ofwhich $155 million was reserved for outstanding standby and import letters of credit, none of which have been drawn on, leaving $1,530 million for future borrowings. Theapplicable rate for standby and import letters of credit was 1.75% and 0.875%, respectively, while the required commitment fee was 0.375% for the unused portion of theRevolving Facility.
77
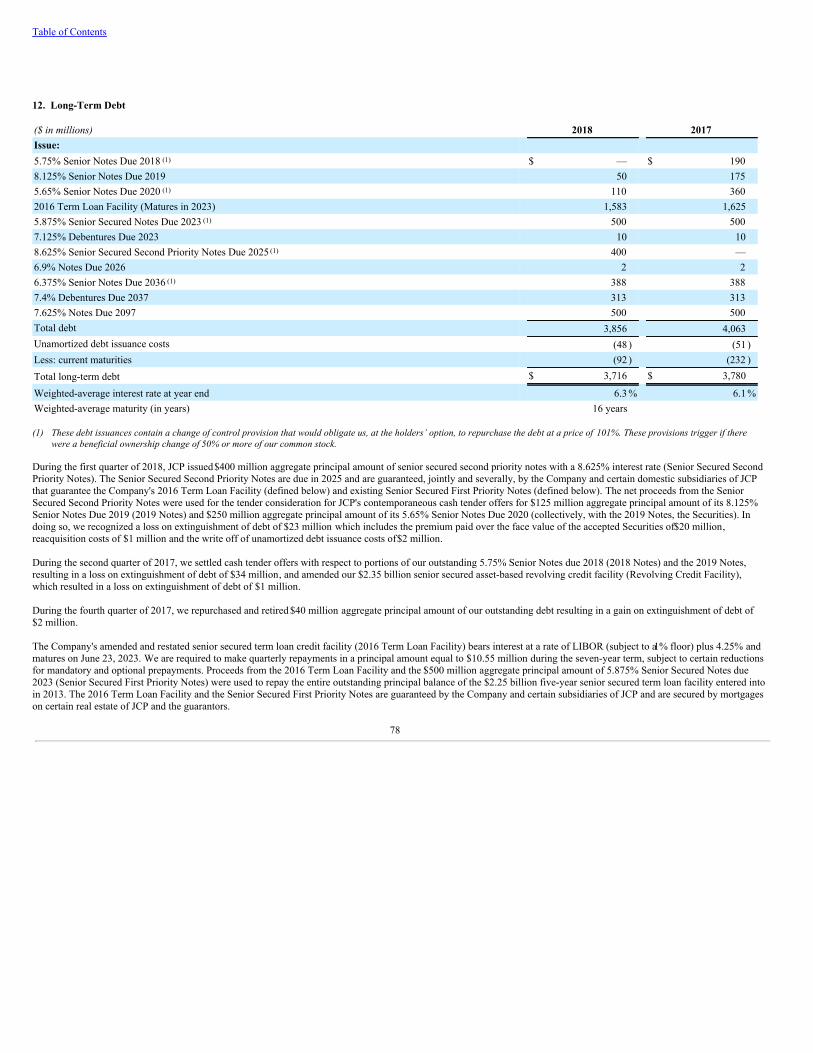
Table of Contents
12. Long-Term Debt
($ in millions) 2018 2017Issue: 5.75% Senior Notes Due 2018 (1) $ — $ 1908.125% Senior Notes Due 2019 50 1755.65% Senior Notes Due 2020 (1) 110 3602016 Term Loan Facility (Matures in 2023) 1,583 1,6255.875% Senior Secured Notes Due 2023 (1) 500 5007.125% Debentures Due 2023 10 108.625% Senior Secured Second Priority Notes Due 2025 (1) 400 —6.9% Notes Due 2026 2 26.375% Senior Notes Due 2036 (1) 388 3887.4% Debentures Due 2037 313 3137.625% Notes Due 2097 500 500Total debt 3,856 4,063Unamortized debt issuance costs (48 ) (51 )Less: current maturities (92 ) (232 )Total long-term debt $ 3,716 $ 3,780
Weighted-average interest rate at year end 6.3 % 6.1 %Weighted-average maturity (in years) 16 years
(1) These debt issuances contain a change of control provision that would obligate us, at the holders’ option, to repurchase the debt at a price of 101%. These provisions trigger if there
were a beneficial ownership change of 50% or more of our common stock.
During the first quarter of 2018, JCP issued $400 million aggregate principal amount of senior secured second priority notes with a 8.625% interest rate (Senior Secured SecondPriority Notes). The Senior Secured Second Priority Notes are due in 2025 and are guaranteed, jointly and severally, by the Company and certain domestic subsidiaries of JCPthat guarantee the Company's 2016 Term Loan Facility (defined below) and existing Senior Secured First Priority Notes (defined below). The net proceeds from the SeniorSecured Second Priority Notes were used for the tender consideration for JCP's contemporaneous cash tender offers for $125 million aggregate principal amount of its 8.125%Senior Notes Due 2019 (2019 Notes) and $250 million aggregate principal amount of its 5.65% Senior Notes Due 2020 (collectively, with the 2019 Notes, the Securities). Indoing so, we recognized a loss on extinguishment of debt of $23 million which includes the premium paid over the face value of the accepted Securities of $20 million,reacquisition costs of $1 million and the write off of unamortized debt issuance costs of $2 million.
During the second quarter of 2017, we settled cash tender offers with respect to portions of our outstanding 5.75% Senior Notes due 2018 (2018 Notes) and the 2019 Notes,resulting in a loss on extinguishment of debt of $34 million, and amended our $2.35 billion senior secured asset-based revolving credit facility (Revolving Credit Facility),which resulted in a loss on extinguishment of debt of $1 million.
During the fourth quarter of 2017, we repurchased and retired $40 million aggregate principal amount of our outstanding debt resulting in a gain on extinguishment of debt of$2 million.
The Company's amended and restated senior secured term loan credit facility (2016 Term Loan Facility) bears interest at a rate of LIBOR (subject to a 1% floor) plus 4.25% andmatures on June 23, 2023. We are required to make quarterly repayments in a principal amount equal to $10.55 million during the seven-year term, subject to certain reductionsfor mandatory and optional prepayments. Proceeds from the 2016 Term Loan Facility and the $500 million aggregate principal amount of 5.875% Senior Secured Notes due2023 (Senior Secured First Priority Notes) were used to repay the entire outstanding principal balance of the $2.25 billion five-year senior secured term loan facility entered intoin 2013. The 2016 Term Loan Facility and the Senior Secured First Priority Notes are guaranteed by the Company and certain subsidiaries of JCP and are secured by mortgageson certain real estate of JCP and the guarantors.
78
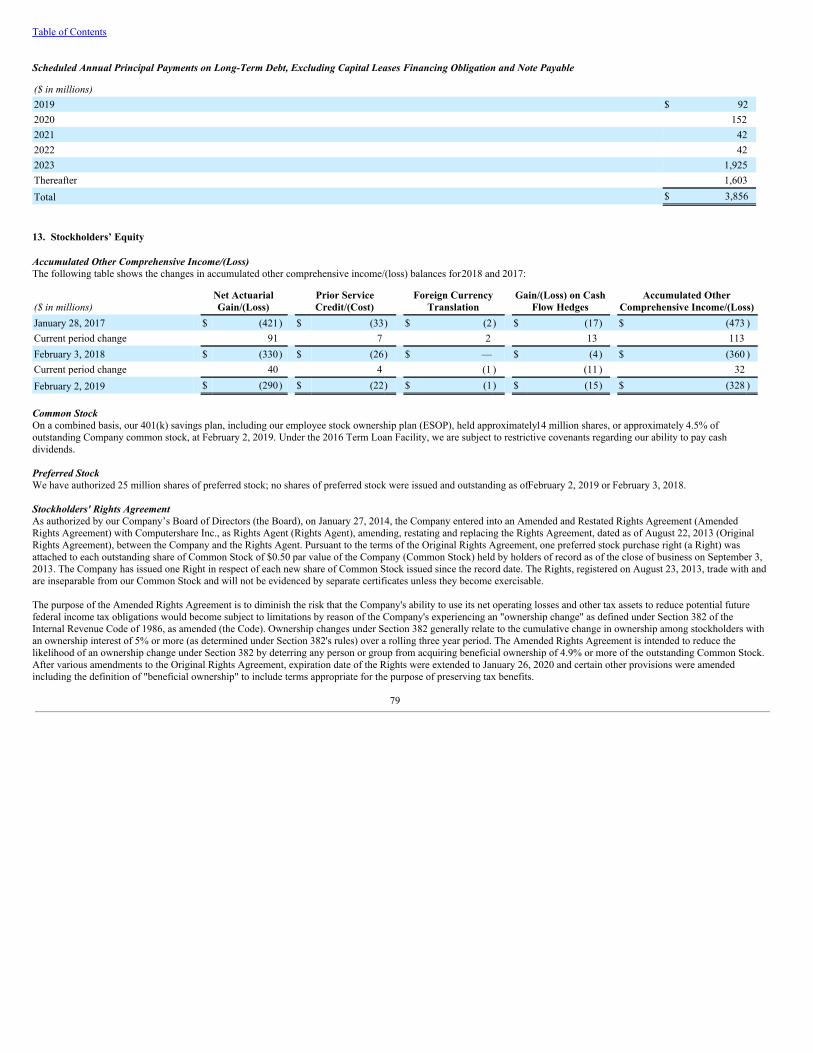
Table of Contents
Scheduled Annual Principal Payments on Long-Term Debt, Excluding Capital Leases Financing Obligation and Note Payable
($ in millions) 2019 $ 922020 1522021 422022 422023 1,925Thereafter 1,603Total $ 3,856
13. Stockholders’ Equity
Accumulated Other Comprehensive Income/(Loss)The following table shows the changes in accumulated other comprehensive income/(loss) balances for 2018 and 2017:
($ in millions) Net ActuarialGain/(Loss)
Prior ServiceCredit/(Cost)
Foreign CurrencyTranslation
Gain/(Loss) on CashFlow Hedges
Accumulated OtherComprehensive Income/(Loss)
January 28, 2017 $ (421) $ (33) $ (2) $ (17) $ (473 )Current period change 91 7 2 13 113February 3, 2018 $ (330) $ (26) $ — $ (4) $ (360 )Current period change 40 4 (1 ) (11 ) 32February 2, 2019 $ (290) $ (22) $ (1) $ (15) $ (328 )
Common Stock On a combined basis, our 401(k) savings plan, including our employee stock ownership plan (ESOP), held approximately 14 million shares, or approximately 4.5% ofoutstanding Company common stock, at February 2, 2019. Under the 2016 Term Loan Facility, we are subject to restrictive covenants regarding our ability to pay cashdividends.
Preferred Stock We have authorized 25 million shares of preferred stock; no shares of preferred stock were issued and outstanding as of February 2, 2019 or February 3, 2018.
Stockholders' Rights AgreementAs authorized by our Company’s Board of Directors (the Board), on January 27, 2014, the Company entered into an Amended and Restated Rights Agreement (AmendedRights Agreement) with Computershare Inc., as Rights Agent (Rights Agent), amending, restating and replacing the Rights Agreement, dated as of August 22, 2013 (OriginalRights Agreement), between the Company and the Rights Agent. Pursuant to the terms of the Original Rights Agreement, one preferred stock purchase right (a Right) wasattached to each outstanding share of Common Stock of $0.50 par value of the Company (Common Stock) held by holders of record as of the close of business on September 3,2013. The Company has issued one Right in respect of each new share of Common Stock issued since the record date. The Rights, registered on August 23, 2013, trade with andare inseparable from our Common Stock and will not be evidenced by separate certificates unless they become exercisable.
The purpose of the Amended Rights Agreement is to diminish the risk that the Company's ability to use its net operating losses and other tax assets to reduce potential futurefederal income tax obligations would become subject to limitations by reason of the Company's experiencing an "ownership change" as defined under Section 382 of theInternal Revenue Code of 1986, as amended (the Code). Ownership changes under Section 382 generally relate to the cumulative change in ownership among stockholders withan ownership interest of 5% or more (as determined under Section 382's rules) over a rolling three year period. The Amended Rights Agreement is intended to reduce thelikelihood of an ownership change under Section 382 by deterring any person or group from acquiring beneficial ownership of 4.9% or more of the outstanding Common Stock.After various amendments to the Original Rights Agreement, expiration date of the Rights were extended to January 26, 2020 and certain other provisions were amendedincluding the definition of "beneficial ownership" to include terms appropriate for the purpose of preserving tax benefits.
79
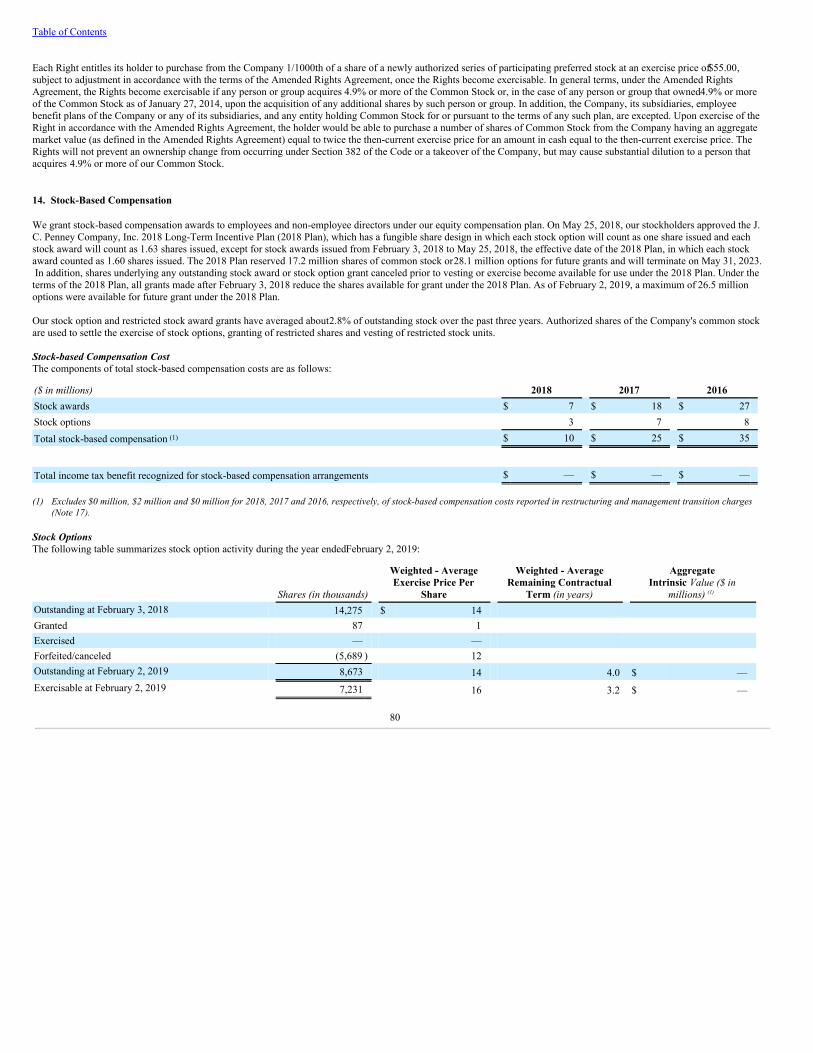
Table of Contents
Each Right entitles its holder to purchase from the Company 1/1000th of a share of a newly authorized series of participating preferred stock at an exercise price of $55.00,subject to adjustment in accordance with the terms of the Amended Rights Agreement, once the Rights become exercisable. In general terms, under the Amended RightsAgreement, the Rights become exercisable if any person or group acquires 4.9% or more of the Common Stock or, in the case of any person or group that owned 4.9% or moreof the Common Stock as of January 27, 2014, upon the acquisition of any additional shares by such person or group. In addition, the Company, its subsidiaries, employeebenefit plans of the Company or any of its subsidiaries, and any entity holding Common Stock for or pursuant to the terms of any such plan, are excepted. Upon exercise of theRight in accordance with the Amended Rights Agreement, the holder would be able to purchase a number of shares of Common Stock from the Company having an aggregatemarket value (as defined in the Amended Rights Agreement) equal to twice the then-current exercise price for an amount in cash equal to the then-current exercise price. TheRights will not prevent an ownership change from occurring under Section 382 of the Code or a takeover of the Company, but may cause substantial dilution to a person thatacquires 4.9% or more of our Common Stock.
14. Stock-Based Compensation
We grant stock-based compensation awards to employees and non-employee directors under our equity compensation plan. On May 25, 2018, our stockholders approved the J.C. Penney Company, Inc. 2018 Long-Term Incentive Plan (2018 Plan), which has a fungible share design in which each stock option will count as one share issued and eachstock award will count as 1.63 shares issued, except for stock awards issued from February 3, 2018 to May 25, 2018, the effective date of the 2018 Plan, in which each stockaward counted as 1.60 shares issued. The 2018 Plan reserved 17.2 million shares of common stock or 28.1 million options for future grants and will terminate on May 31, 2023. In addition, shares underlying any outstanding stock award or stock option grant canceled prior to vesting or exercise become available for use under the 2018 Plan. Under theterms of the 2018 Plan, all grants made after February 3, 2018 reduce the shares available for grant under the 2018 Plan. As of February 2, 2019, a maximum of 26.5 millionoptions were available for future grant under the 2018 Plan.
Our stock option and restricted stock award grants have averaged about 2.8% of outstanding stock over the past three years. Authorized shares of the Company's common stockare used to settle the exercise of stock options, granting of restricted shares and vesting of restricted stock units.
Stock-based Compensation CostThe components of total stock-based compensation costs are as follows:
($ in millions) 2018 2017 2016Stock awards $ 7 $ 18 $ 27Stock options 3 7 8Total stock-based compensation (1) $ 10 $ 25 $ 35
Total income tax benefit recognized for stock-based compensation arrangements $ — $ — $ —
(1) Excludes $0 million, $2 million and $0 million for 2018, 2017 and 2016, respectively, of stock-based compensation costs reported in restructuring and management transition charges(Note 17).
Stock Options The following table summarizes stock option activity during the year ended February 2, 2019:
Shares (in thousands)
Weighted - AverageExercise Price Per
Share
Weighted - AverageRemaining Contractual
Term (in years)
AggregateIntrinsic Value ($ in
millions) (1) Outstanding at February 3, 2018 14,275 $ 14 Granted 87 1 Exercised — — Forfeited/canceled (5,689 ) 12 Outstanding at February 2, 2019 8,673 14 4.0 $ —Exercisable at February 2, 2019 7,231 16 3.2 $ —
80
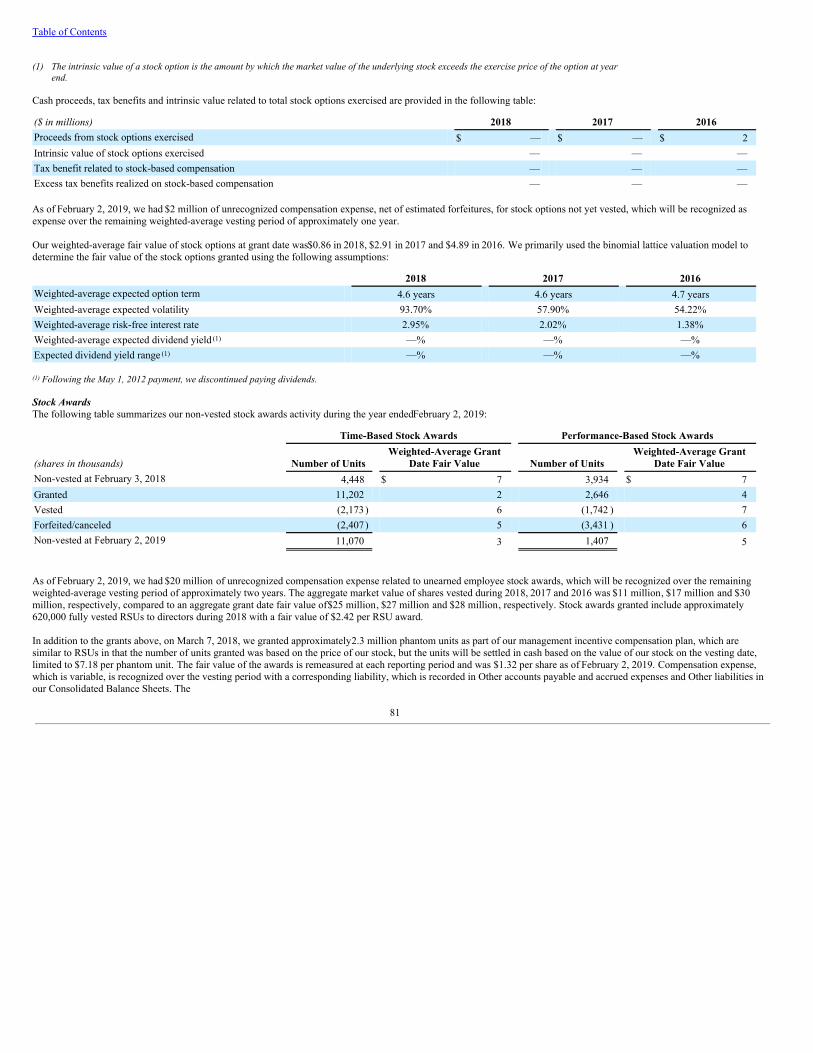
Table of Contents
(1) The intrinsic value of a stock option is the amount by which the market value of the underlying stock exceeds the exercise price of the option at year
end.
Cash proceeds, tax benefits and intrinsic value related to total stock options exercised are provided in the following table:
($ in millions) 2018 2017 2016Proceeds from stock options exercised $ — $ — $ 2Intrinsic value of stock options exercised — — —Tax benefit related to stock-based compensation — — —Excess tax benefits realized on stock-based compensation — — —
As of February 2, 2019, we had $2 million of unrecognized compensation expense, net of estimated forfeitures, for stock options not yet vested, which will be recognized asexpense over the remaining weighted-average vesting period of approximately one year.
Our weighted-average fair value of stock options at grant date was $0.86 in 2018, $2.91 in 2017 and $4.89 in 2016. We primarily used the binomial lattice valuation model todetermine the fair value of the stock options granted using the following assumptions:
2018 2017 2016Weighted-average expected option term 4.6 years 4.6 years 4.7 yearsWeighted-average expected volatility 93.70% 57.90% 54.22%Weighted-average risk-free interest rate 2.95% 2.02% 1.38%Weighted-average expected dividend yield (1) —% —% —%Expected dividend yield range (1) —% —% —%
(1) Following the May 1, 2012 payment, we discontinued paying dividends.
Stock AwardsThe following table summarizes our non-vested stock awards activity during the year ended February 2, 2019:
Time-Based Stock Awards Performance-Based Stock Awards
(shares in thousands) Number of Units Weighted-Average Grant
Date Fair Value Number of Units Weighted-Average Grant
Date Fair ValueNon-vested at February 3, 2018 4,448 $ 7 3,934 $ 7Granted 11,202 2 2,646 4Vested (2,173) 6 (1,742 ) 7Forfeited/canceled (2,407) 5 (3,431 ) 6Non-vested at February 2, 2019 11,070 3 1,407 5
As of February 2, 2019, we had $20 million of unrecognized compensation expense related to unearned employee stock awards, which will be recognized over the remainingweighted-average vesting period of approximately two years. The aggregate market value of shares vested during 2018, 2017 and 2016 was $11 million, $17 million and $30million, respectively, compared to an aggregate grant date fair value of $25 million, $27 million and $28 million, respectively. Stock awards granted include approximately620,000 fully vested RSUs to directors during 2018 with a fair value of $2.42 per RSU award.
In addition to the grants above, on March 7, 2018, we granted approximately 2.3 million phantom units as part of our management incentive compensation plan, which aresimilar to RSUs in that the number of units granted was based on the price of our stock, but the units will be settled in cash based on the value of our stock on the vesting date,limited to $7.18 per phantom unit. The fair value of the awards is remeasured at each reporting period and was $1.32 per share as of February 2, 2019. Compensation expense,which is variable, is recognized over the vesting period with a corresponding liability, which is recorded in Other accounts payable and accrued expenses and Other liabilities inour Consolidated Balance Sheets. The
81
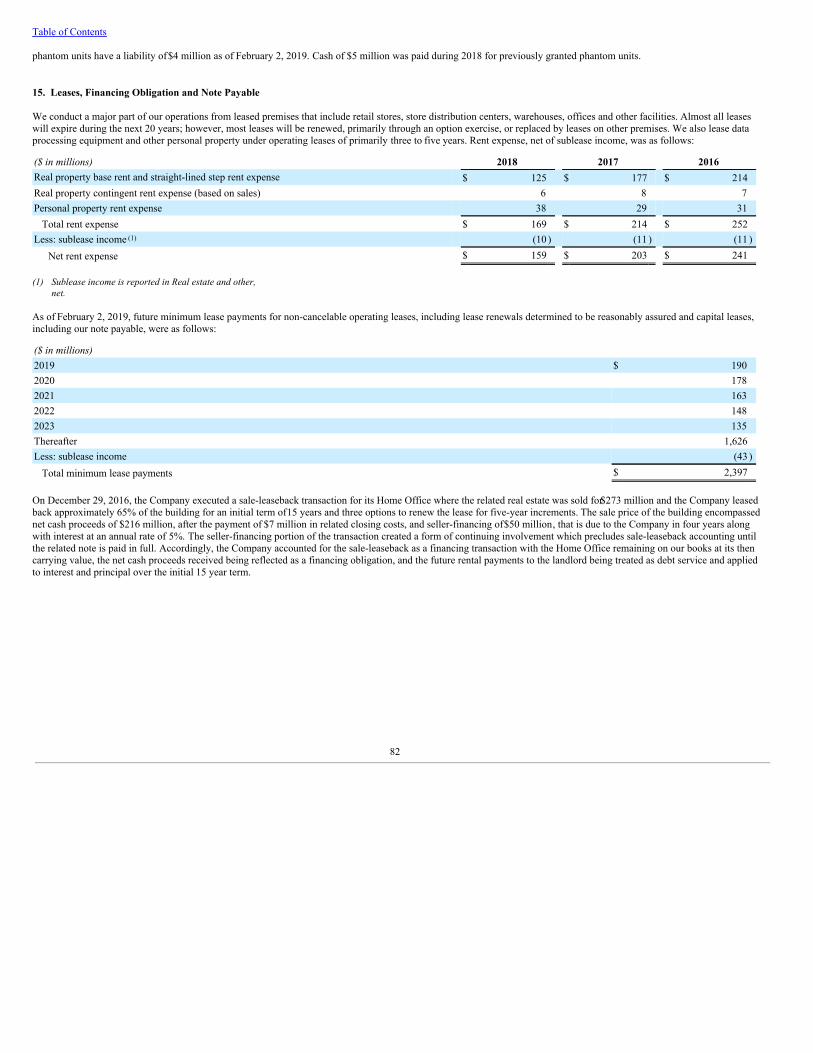
Table of Contents
phantom units have a liability of $4 million as of February 2, 2019. Cash of $5 million was paid during 2018 for previously granted phantom units.
15. Leases, Financing Obligation and Note Payable
We conduct a major part of our operations from leased premises that include retail stores, store distribution centers, warehouses, offices and other facilities. Almost all leaseswill expire during the next 20 years; however, most leases will be renewed, primarily through an option exercise, or replaced by leases on other premises. We also lease dataprocessing equipment and other personal property under operating leases of primarily three to five years. Rent expense, net of sublease income, was as follows:
($ in millions) 2018 2017 2016Real property base rent and straight-lined step rent expense $ 125 $ 177 $ 214Real property contingent rent expense (based on sales) 6 8 7Personal property rent expense 38 29 31
Total rent expense $ 169 $ 214 $ 252Less: sublease income (1) (10 ) (11 ) (11 )
Net rent expense $ 159 $ 203 $ 241
(1) Sublease income is reported in Real estate and other,net.
As of February 2, 2019, future minimum lease payments for non-cancelable operating leases, including lease renewals determined to be reasonably assured and capital leases,including our note payable, were as follows:
($ in millions) 2019 $ 1902020 1782021 1632022 1482023 135Thereafter 1,626Less: sublease income (43 )
Total minimum lease payments $ 2,397
On December 29, 2016, the Company executed a sale-leaseback transaction for its Home Office where the related real estate was sold for $273 million and the Company leasedback approximately 65% of the building for an initial term of 15 years and three options to renew the lease for five-year increments. The sale price of the building encompassednet cash proceeds of $216 million, after the payment of $7 million in related closing costs, and seller-financing of $50 million, that is due to the Company in four years alongwith interest at an annual rate of 5%. The seller-financing portion of the transaction created a form of continuing involvement which precludes sale-leaseback accounting untilthe related note is paid in full. Accordingly, the Company accounted for the sale-leaseback as a financing transaction with the Home Office remaining on our books at its thencarrying value, the net cash proceeds received being reflected as a financing obligation, and the future rental payments to the landlord being treated as debt service and appliedto interest and principal over the initial 15 year term.
82
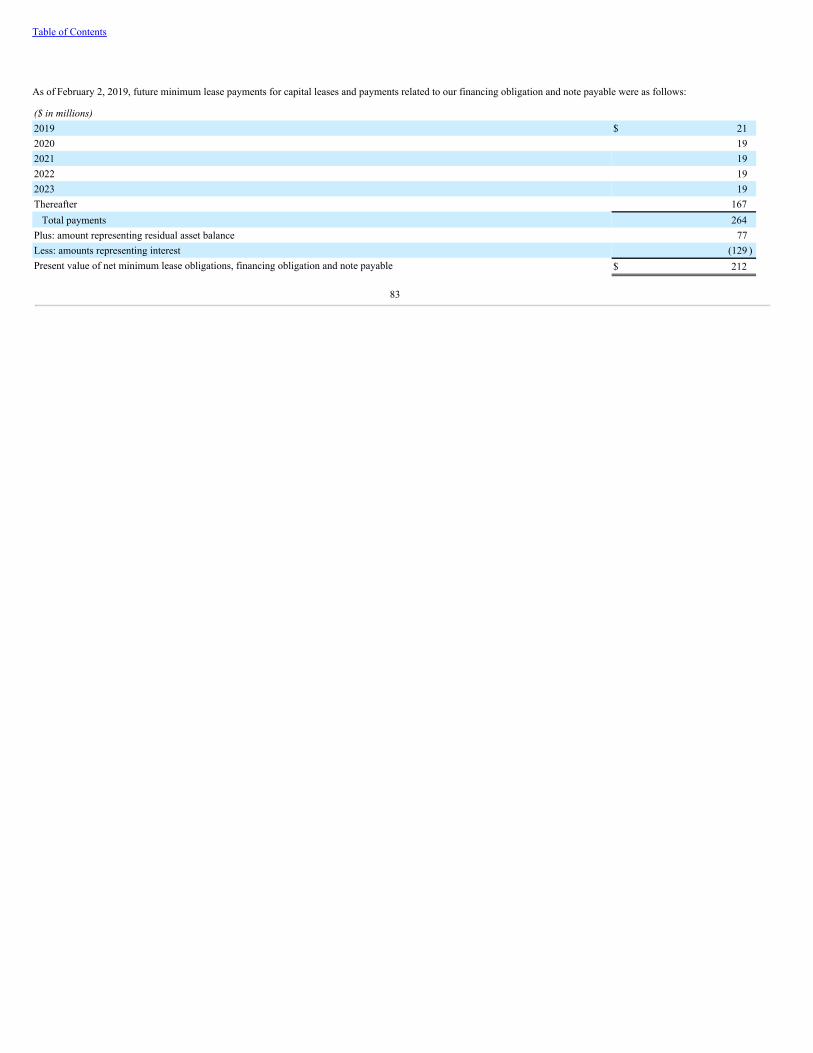
Table of Contents
As of February 2, 2019, future minimum lease payments for capital leases and payments related to our financing obligation and note payable were as follows:
($ in millions) 2019 $ 212020 192021 192022 192023 19Thereafter 167
Total payments 264Plus: amount representing residual asset balance 77Less: amounts representing interest (129 )Present value of net minimum lease obligations, financing obligation and note payable $ 212
83
Table of Contents
16. Retirement Benefit Plans
We provide retirement pension benefits, postretirement health and welfare benefits, as well as 401(k) savings, profit-sharing and stock ownership plan benefits to varioussegments of our workforce. Retirement benefits are an important part of our total compensation and benefits program designed to retain and attract qualified, talentedemployees. Pension benefits are provided through defined benefit pension plans consisting of a non-contributory qualified pension plan (Primary Pension Plan) and, for certainmanagement employees, non-contributory supplemental retirement plans, including a 1997 voluntary early retirement plan. Retirement and other benefits include:
Defined Benefit Pension PlansPrimary Pension Plan – fundedSupplemental retirement plans – unfunded Other Benefit PlansPostretirement benefits – medical and dentalDefined contribution plans:
401(k) savings, profit-sharing and stock ownership planDeferred compensation plan
Defined Benefit Pension Plans
Primary Pension Plan — FundedThe Primary Pension Plan is a funded non-contributory qualified pension plan, initiated in 1966 and closed to new entrants on January 1, 2007. The plan is funded by Companycontributions to a trust fund, which are held for the sole benefit of participants and beneficiaries.
Supplemental Retirement Plans — UnfundedWe have unfunded supplemental retirement plans, which provide retirement benefits to certain management employees. We pay ongoing benefits from operating cash flow andcash investments. The plans are a Supplemental Retirement Program and a Benefit Restoration Plan. Participation in the Supplemental Retirement Program is limited toemployees who were annual incentive-eligible management employees as of December 31, 1995. Benefits for these plans are based on length of service and final averagecompensation. The Benefit Restoration Plan is intended to make up benefits that could not be paid by the Primary Pension Plan due to governmental limits on the amount ofbenefits and the level of pay considered in the calculation of benefits. The Supplemental Retirement Program is a non-qualified plan that was designed to allow eligiblemanagement employees to retire at age 60 with retirement income comparable to the age 65 benefit provided under the Primary Pension Plan and Benefit Restoration Plan. Inaddition, the Supplemental Retirement Program offers participants who leave between ages 60 and 62 benefits equal to the estimated social security benefits payable at age 62.The Supplemental Retirement Program also continues Company-paid term life insurance at a declining rate until it is phased out at age 70. Employee-paid term life insurancethrough age 65 is continued under a separate plan (Supplemental Term Life Insurance Plan for Management Profit-Sharing Employees).
Voluntary Early Retirement ProgramIn 2017, the Company initiated a Voluntary Early Retirement Program (VERP) for approximately 6,000 eligible associates. Eligibility for the VERP included home office,stores and supply chain personnel who met certain criteria related to age and years of service as of January 31, 2017. The consideration period for eligible associates to acceptthe VERP ended on March 31, 2017. Based on the approximately 2,800 associates who elected to accept the VERP, we incurred a total charge of $112 million for specialretirement benefits. The special retirement benefits increased the projected benefit obligation (PBO) of the Primary Pension Plan and the Supplemental Pension Plans by $88million and $24 million, respectively. In addition, we incurred curtailment charges of $7 million related to our Primary Pension Plan and Supplemental Pension Plans as a resultof the reduction in the expected years of future service related to these plans. We also recognized settlement expense of $13 million in 2017 due to higher lump-sum paymentactivity to retirees primarily as a result of the VERP executed earlier in the year.
84
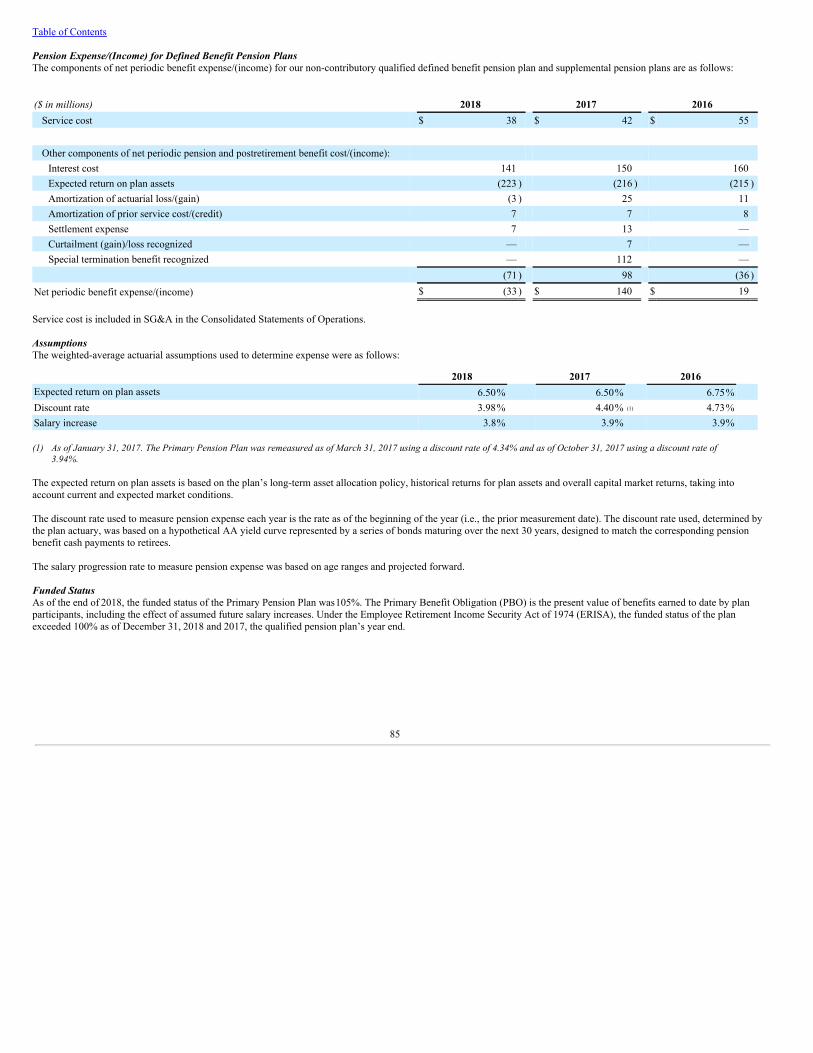
Table of Contents
Pension Expense/(Income) for Defined Benefit Pension PlansThe components of net periodic benefit expense/(income) for our non-contributory qualified defined benefit pension plan and supplemental pension plans are as follows:
($ in millions) 2018 2017 2016
Service cost $ 38 $ 42 $ 55
Other components of net periodic pension and postretirement benefit cost/(income): Interest cost 141 150 160Expected return on plan assets (223 ) (216 ) (215 )Amortization of actuarial loss/(gain) (3 ) 25 11Amortization of prior service cost/(credit) 7 7 8Settlement expense 7 13 —Curtailment (gain)/loss recognized — 7 —Special termination benefit recognized — 112 —
(71 ) 98 (36 )Net periodic benefit expense/(income) $ (33 ) $ 140 $ 19
Service cost is included in SG&A in the Consolidated Statements of Operations.
Assumptions The weighted-average actuarial assumptions used to determine expense were as follows:
2018 2017 2016 Expected return on plan assets 6.50% 6.50% 6.75% Discount rate 3.98% 4.40% (1) 4.73% Salary increase 3.8% 3.9% 3.9%
(1) As of January 31, 2017. The Primary Pension Plan was remeasured as of March 31, 2017 using a discount rate of 4.34% and as of October 31, 2017 using a discount rate of
3.94%.
The expected return on plan assets is based on the plan’s long-term asset allocation policy, historical returns for plan assets and overall capital market returns, taking intoaccount current and expected market conditions.
The discount rate used to measure pension expense each year is the rate as of the beginning of the year (i.e., the prior measurement date). The discount rate used, determined bythe plan actuary, was based on a hypothetical AA yield curve represented by a series of bonds maturing over the next 30 years, designed to match the corresponding pensionbenefit cash payments to retirees.
The salary progression rate to measure pension expense was based on age ranges and projected forward.
Funded StatusAs of the end of 2018, the funded status of the Primary Pension Plan was 105%. The Primary Benefit Obligation (PBO) is the present value of benefits earned to date by planparticipants, including the effect of assumed future salary increases. Under the Employee Retirement Income Security Act of 1974 (ERISA), the funded status of the planexceeded 100% as of December 31, 2018 and 2017, the qualified pension plan’s year end.
85
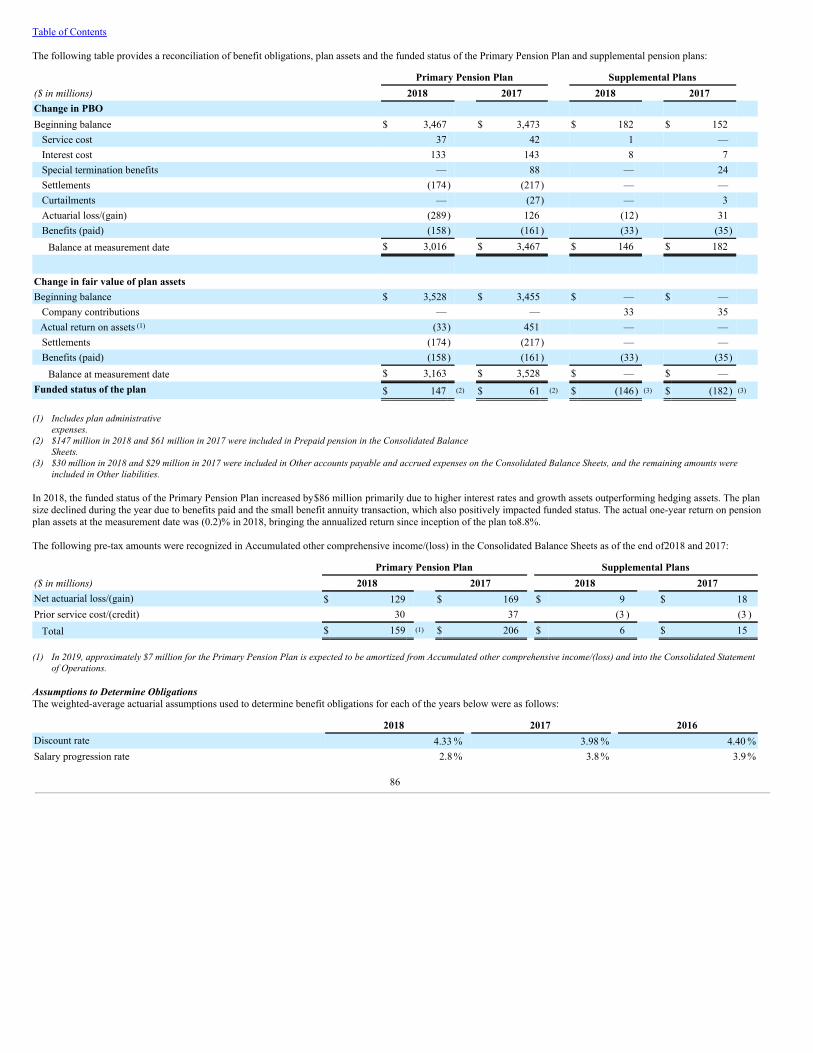
Table of Contents
The following table provides a reconciliation of benefit obligations, plan assets and the funded status of the Primary Pension Plan and supplemental pension plans:
Primary Pension Plan Supplemental Plans ($ in millions) 2018 2017 2018 2017 Change in PBO Beginning balance $ 3,467 $ 3,473 $ 182 $ 152
Service cost 37 42 1 — Interest cost 133 143 8 7 Special termination benefits — 88 — 24 Settlements (174) (217) — — Curtailments — (27) — 3 Actuarial loss/(gain) (289) 126 (12) 31 Benefits (paid) (158) (161) (33) (35)
Balance at measurement date $ 3,016 $ 3,467 $ 146 $ 182
Change in fair value of plan assets Beginning balance $ 3,528 $ 3,455 $ — $ —
Company contributions — — 33 35 Actual return on assets (1) (33) 451 — — Settlements (174) (217) — — Benefits (paid) (158) (161) (33) (35)
Balance at measurement date $ 3,163 $ 3,528 $ — $ — Funded status of the plan $ 147 (2) $ 61 (2) $ (146) (3) $ (182) (3)
(1) Includes plan administrative
expenses.(2) $147 million in 2018 and $61 million in 2017 were included in Prepaid pension in the Consolidated Balance
Sheets.(3) $30 million in 2018 and $29 million in 2017 were included in Other accounts payable and accrued expenses on the Consolidated Balance Sheets, and the remaining amounts were
included in Other liabilities.
In 2018, the funded status of the Primary Pension Plan increased by $86 million primarily due to higher interest rates and growth assets outperforming hedging assets. The plansize declined during the year due to benefits paid and the small benefit annuity transaction, which also positively impacted funded status. The actual one-year return on pensionplan assets at the measurement date was (0.2)% in 2018, bringing the annualized return since inception of the plan to 8.8%.
The following pre-tax amounts were recognized in Accumulated other comprehensive income/(loss) in the Consolidated Balance Sheets as of the end of 2018 and 2017:
Primary Pension Plan Supplemental Plans($ in millions) 2018 2017 2018 2017Net actuarial loss/(gain) $ 129 $ 169 $ 9 $ 18Prior service cost/(credit) 30 37 (3 ) (3 )
Total $ 159 (1) $ 206 $ 6 $ 15
(1) In 2019, approximately $7 million for the Primary Pension Plan is expected to be amortized from Accumulated other comprehensive income/(loss) and into the Consolidated Statementof Operations.
Assumptions to Determine ObligationsThe weighted-average actuarial assumptions used to determine benefit obligations for each of the years below were as follows:
2018 2017 2016Discount rate 4.33 % 3.98 % 4.40 %Salary progression rate 2.8 % 3.8 % 3.9 %
86
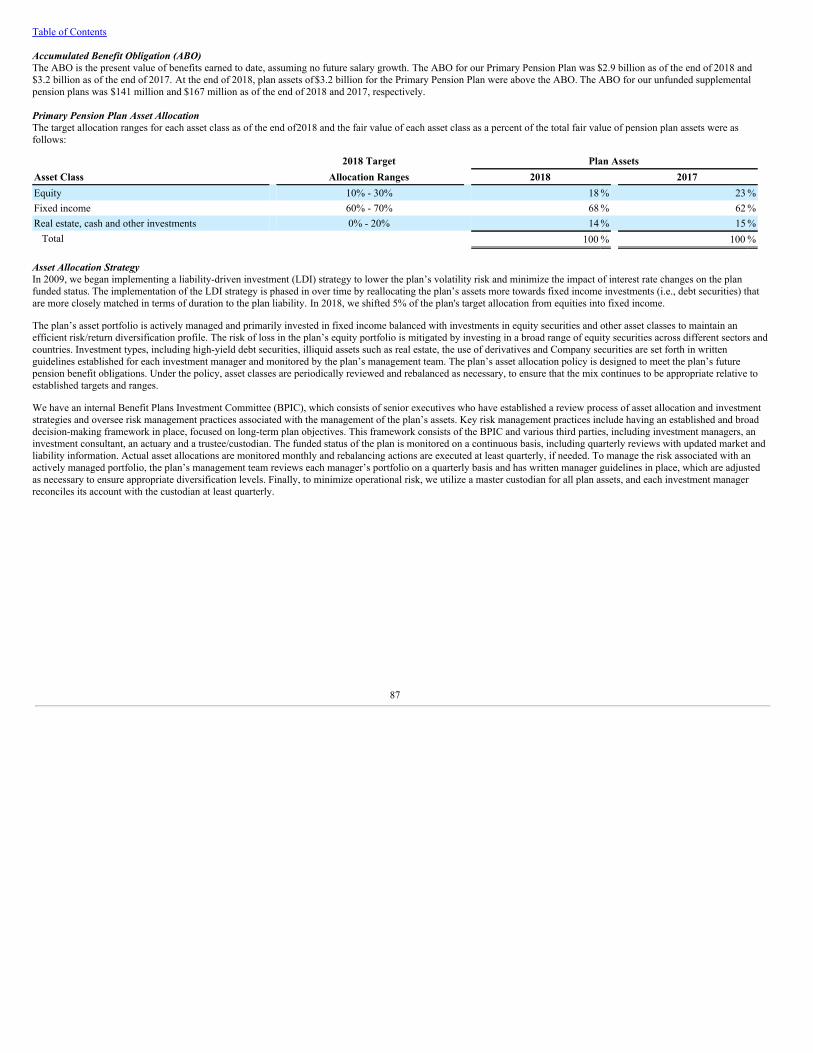
Table of Contents
Accumulated Benefit Obligation (ABO)The ABO is the present value of benefits earned to date, assuming no future salary growth. The ABO for our Primary Pension Plan was $2.9 billion as of the end of 2018 and$3.2 billion as of the end of 2017. At the end of 2018, plan assets of $3.2 billion for the Primary Pension Plan were above the ABO. The ABO for our unfunded supplementalpension plans was $141 million and $167 million as of the end of 2018 and 2017, respectively.
Primary Pension Plan Asset AllocationThe target allocation ranges for each asset class as of the end of 2018 and the fair value of each asset class as a percent of the total fair value of pension plan assets were asfollows:
2018 Target Plan AssetsAsset Class Allocation Ranges 2018 2017Equity 10% - 30% 18 % 23 %Fixed income 60% - 70% 68 % 62 %Real estate, cash and other investments 0% - 20% 14 % 15 %
Total 100 % 100 %
Asset Allocation StrategyIn 2009, we began implementing a liability-driven investment (LDI) strategy to lower the plan’s volatility risk and minimize the impact of interest rate changes on the planfunded status. The implementation of the LDI strategy is phased in over time by reallocating the plan’s assets more towards fixed income investments (i.e., debt securities) thatare more closely matched in terms of duration to the plan liability. In 2018, we shifted 5% of the plan's target allocation from equities into fixed income.
The plan’s asset portfolio is actively managed and primarily invested in fixed income balanced with investments in equity securities and other asset classes to maintain anefficient risk/return diversification profile. The risk of loss in the plan’s equity portfolio is mitigated by investing in a broad range of equity securities across different sectors andcountries. Investment types, including high-yield debt securities, illiquid assets such as real estate, the use of derivatives and Company securities are set forth in writtenguidelines established for each investment manager and monitored by the plan’s management team. The plan’s asset allocation policy is designed to meet the plan’s futurepension benefit obligations. Under the policy, asset classes are periodically reviewed and rebalanced as necessary, to ensure that the mix continues to be appropriate relative toestablished targets and ranges.
We have an internal Benefit Plans Investment Committee (BPIC), which consists of senior executives who have established a review process of asset allocation and investmentstrategies and oversee risk management practices associated with the management of the plan’s assets. Key risk management practices include having an established and broaddecision-making framework in place, focused on long-term plan objectives. This framework consists of the BPIC and various third parties, including investment managers, aninvestment consultant, an actuary and a trustee/custodian. The funded status of the plan is monitored on a continuous basis, including quarterly reviews with updated market andliability information. Actual asset allocations are monitored monthly and rebalancing actions are executed at least quarterly, if needed. To manage the risk associated with anactively managed portfolio, the plan’s management team reviews each manager’s portfolio on a quarterly basis and has written manager guidelines in place, which are adjustedas necessary to ensure appropriate diversification levels. Finally, to minimize operational risk, we utilize a master custodian for all plan assets, and each investment managerreconciles its account with the custodian at least quarterly.
87
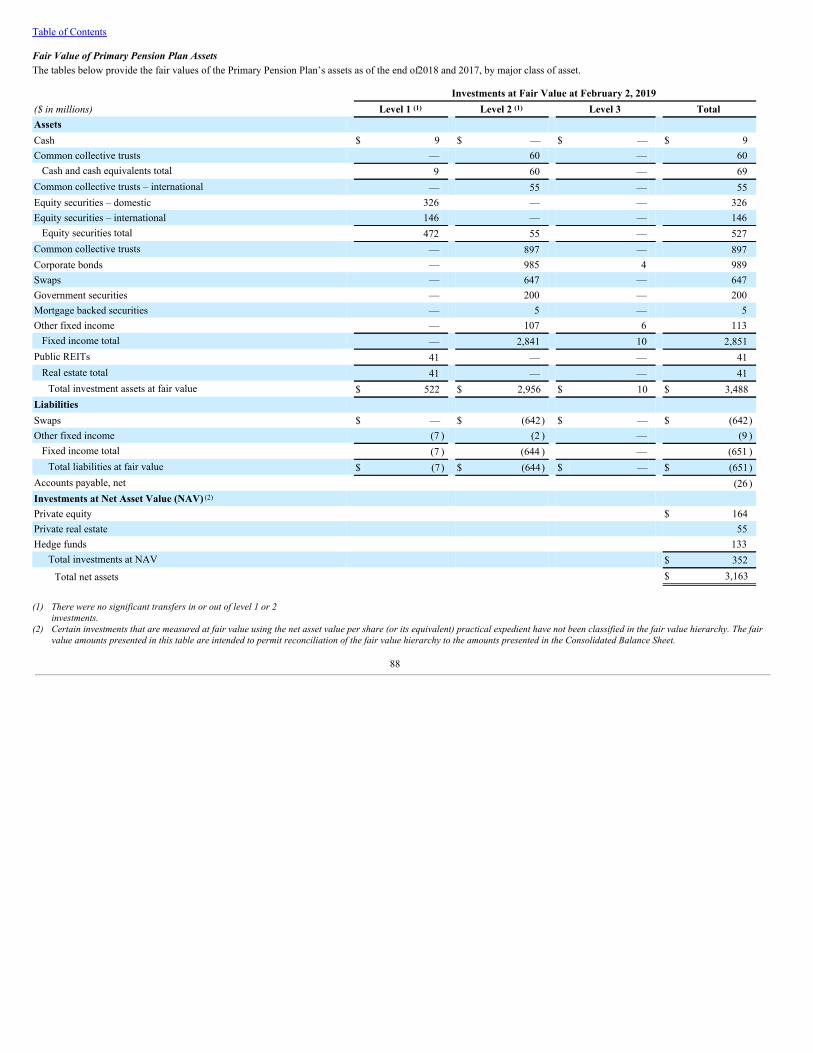
Table of Contents
Fair Value of Primary Pension Plan AssetsThe tables below provide the fair values of the Primary Pension Plan’s assets as of the end of 2018 and 2017, by major class of asset.
Investments at Fair Value at February 2, 2019($ in millions) Level 1 (1) Level 2 (1) Level 3 TotalAssets Cash $ 9 $ — $ — $ 9Common collective trusts — 60 — 60
Cash and cash equivalents total 9 60 — 69Common collective trusts – international — 55 — 55Equity securities – domestic 326 — — 326Equity securities – international 146 — — 146
Equity securities total 472 55 — 527Common collective trusts — 897 — 897Corporate bonds — 985 4 989Swaps — 647 — 647Government securities — 200 — 200Mortgage backed securities — 5 — 5Other fixed income — 107 6 113
Fixed income total — 2,841 10 2,851Public REITs 41 — — 41
Real estate total 41 — — 41Total investment assets at fair value $ 522 $ 2,956 $ 10 $ 3,488
Liabilities Swaps $ — $ (642) $ — $ (642)Other fixed income (7 ) (2 ) — (9 )
Fixed income total (7 ) (644 ) — (651 )Total liabilities at fair value $ (7) $ (644) $ — $ (651)
Accounts payable, net (26 )Investments at Net Asset Value (NAV) (2) Private equity $ 164Private real estate 55Hedge funds 133
Total investments at NAV $ 352Total net assets $ 3,163
(1) There were no significant transfers in or out of level 1 or 2
investments.(2) Certain investments that are measured at fair value using the net asset value per share (or its equivalent) practical expedient have not been classified in the fair value hierarchy. The fair
value amounts presented in this table are intended to permit reconciliation of the fair value hierarchy to the amounts presented in the Consolidated Balance Sheet.
88
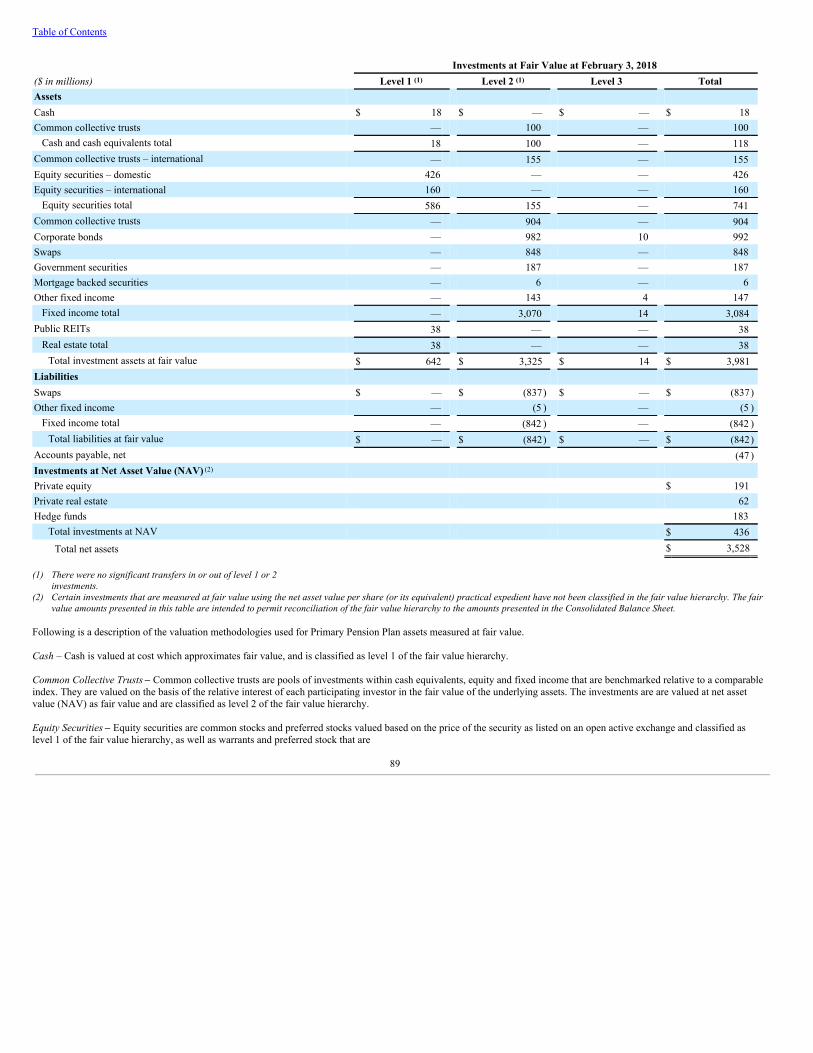
Table of Contents
Investments at Fair Value at February 3, 2018($ in millions) Level 1 (1) Level 2 (1) Level 3 TotalAssets Cash $ 18 $ — $ — $ 18Common collective trusts — 100 — 100
Cash and cash equivalents total 18 100 — 118Common collective trusts – international — 155 — 155Equity securities – domestic 426 — — 426Equity securities – international 160 — — 160
Equity securities total 586 155 — 741Common collective trusts — 904 — 904Corporate bonds — 982 10 992Swaps — 848 — 848Government securities — 187 — 187Mortgage backed securities — 6 — 6Other fixed income — 143 4 147
Fixed income total — 3,070 14 3,084Public REITs 38 — — 38
Real estate total 38 — — 38Total investment assets at fair value $ 642 $ 3,325 $ 14 $ 3,981
Liabilities Swaps $ — $ (837) $ — $ (837)Other fixed income — (5 ) — (5 )
Fixed income total — (842 ) — (842 )Total liabilities at fair value $ — $ (842) $ — $ (842)
Accounts payable, net (47 )Investments at Net Asset Value (NAV) (2) Private equity $ 191Private real estate 62Hedge funds 183
Total investments at NAV $ 436Total net assets $ 3,528
(1) There were no significant transfers in or out of level 1 or 2investments.
(2) Certain investments that are measured at fair value using the net asset value per share (or its equivalent) practical expedient have not been classified in the fair value hierarchy. The fairvalue amounts presented in this table are intended to permit reconciliation of the fair value hierarchy to the amounts presented in the Consolidated Balance Sheet.
Following is a description of the valuation methodologies used for Primary Pension Plan assets measured at fair value.
Cash – Cash is valued at cost which approximates fair value, and is classified as level 1 of the fair value hierarchy.
Common Collective Trusts – Common collective trusts are pools of investments within cash equivalents, equity and fixed income that are benchmarked relative to a comparableindex. They are valued on the basis of the relative interest of each participating investor in the fair value of the underlying assets. The investments are are valued at net assetvalue (NAV) as fair value and are classified as level 2 of the fair value hierarchy.
Equity Securities – Equity securities are common stocks and preferred stocks valued based on the price of the security as listed on an open active exchange and classified aslevel 1 of the fair value hierarchy, as well as warrants and preferred stock that are
89
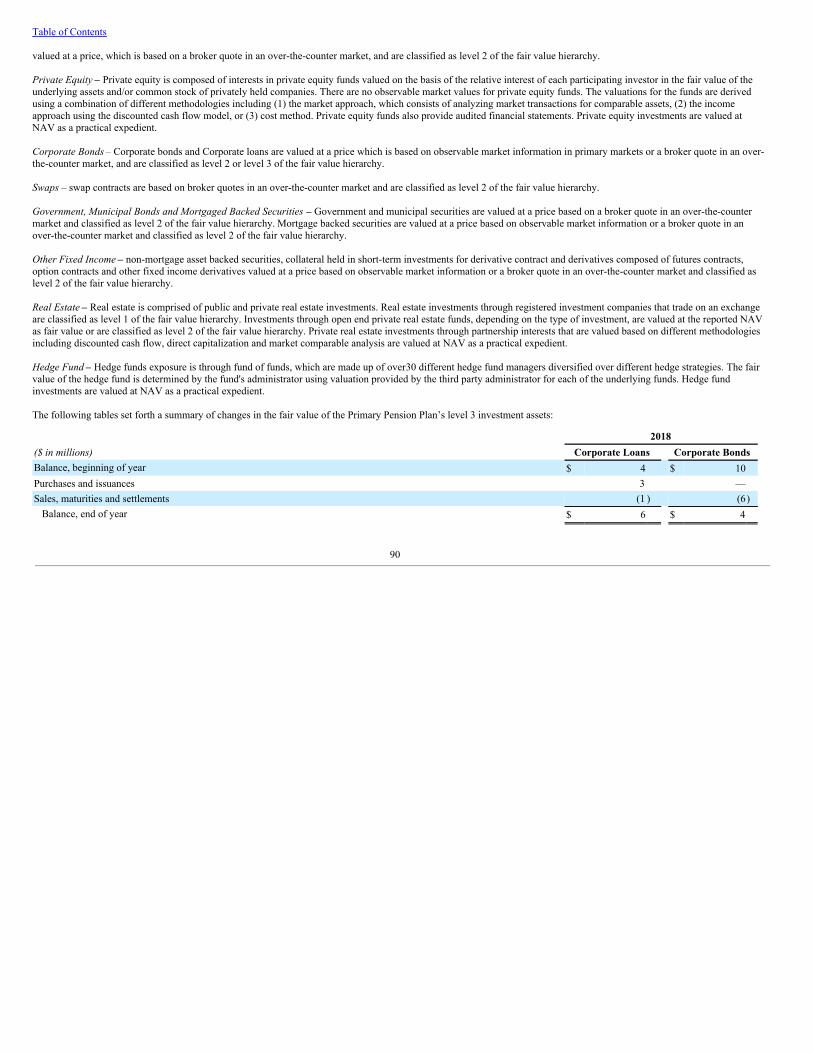
Table of Contents
valued at a price, which is based on a broker quote in an over-the-counter market, and are classified as level 2 of the fair value hierarchy.
Private Equity – Private equity is composed of interests in private equity funds valued on the basis of the relative interest of each participating investor in the fair value of theunderlying assets and/or common stock of privately held companies. There are no observable market values for private equity funds. The valuations for the funds are derivedusing a combination of different methodologies including (1) the market approach, which consists of analyzing market transactions for comparable assets, (2) the incomeapproach using the discounted cash flow model, or (3) cost method. Private equity funds also provide audited financial statements. Private equity investments are valued atNAV as a practical expedient.
Corporate Bonds – Corporate bonds and Corporate loans are valued at a price which is based on observable market information in primary markets or a broker quote in an over-the-counter market, and are classified as level 2 or level 3 of the fair value hierarchy.
Swaps – swap contracts are based on broker quotes in an over-the-counter market and are classified as level 2 of the fair value hierarchy.
Government, Municipal Bonds and Mortgaged Backed Securities – Government and municipal securities are valued at a price based on a broker quote in an over-the-countermarket and classified as level 2 of the fair value hierarchy. Mortgage backed securities are valued at a price based on observable market information or a broker quote in anover-the-counter market and classified as level 2 of the fair value hierarchy.
Other Fixed Income – non-mortgage asset backed securities, collateral held in short-term investments for derivative contract and derivatives composed of futures contracts,option contracts and other fixed income derivatives valued at a price based on observable market information or a broker quote in an over-the-counter market and classified aslevel 2 of the fair value hierarchy.
Real Estate – Real estate is comprised of public and private real estate investments. Real estate investments through registered investment companies that trade on an exchangeare classified as level 1 of the fair value hierarchy. Investments through open end private real estate funds, depending on the type of investment, are valued at the reported NAVas fair value or are classified as level 2 of the fair value hierarchy. Private real estate investments through partnership interests that are valued based on different methodologiesincluding discounted cash flow, direct capitalization and market comparable analysis are valued at NAV as a practical expedient.
Hedge Fund – Hedge funds exposure is through fund of funds, which are made up of over 30 different hedge fund managers diversified over different hedge strategies. The fairvalue of the hedge fund is determined by the fund's administrator using valuation provided by the third party administrator for each of the underlying funds. Hedge fundinvestments are valued at NAV as a practical expedient.
The following tables set forth a summary of changes in the fair value of the Primary Pension Plan’s level 3 investment assets:
2018($ in millions) Corporate Loans Corporate BondsBalance, beginning of year $ 4 $ 10Purchases and issuances 3 —Sales, maturities and settlements (1 ) (6)
Balance, end of year $ 6 $ 4
90
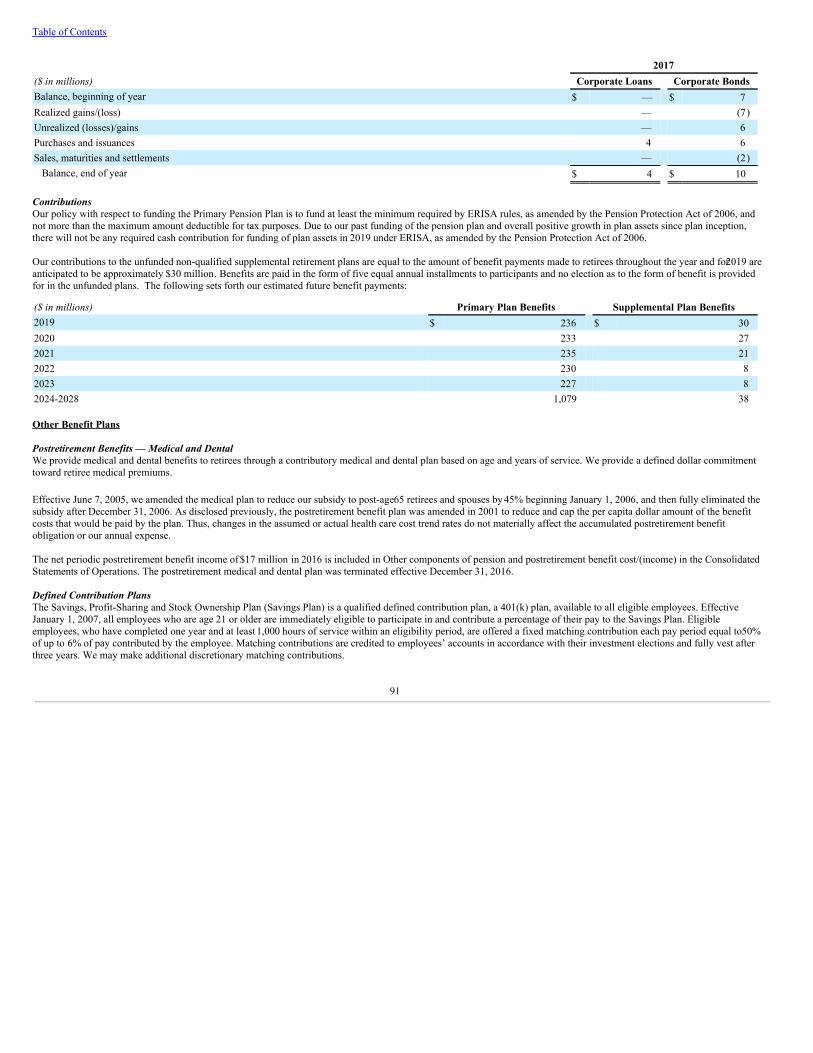
Table of Contents
2017($ in millions) Corporate Loans Corporate BondsBalance, beginning of year $ — $ 7Realized gains/(loss) — (7)Unrealized (losses)/gains — 6Purchases and issuances 4 6Sales, maturities and settlements — (2)
Balance, end of year $ 4 $ 10
ContributionsOur policy with respect to funding the Primary Pension Plan is to fund at least the minimum required by ERISA rules, as amended by the Pension Protection Act of 2006, andnot more than the maximum amount deductible for tax purposes. Due to our past funding of the pension plan and overall positive growth in plan assets since plan inception,there will not be any required cash contribution for funding of plan assets in 2019 under ERISA, as amended by the Pension Protection Act of 2006.
Our contributions to the unfunded non-qualified supplemental retirement plans are equal to the amount of benefit payments made to retirees throughout the year and for 2019 areanticipated to be approximately $30 million. Benefits are paid in the form of five equal annual installments to participants and no election as to the form of benefit is providedfor in the unfunded plans. The following sets forth our estimated future benefit payments:
($ in millions) Primary Plan Benefits Supplemental Plan Benefits2019 $ 236 $ 302020 233 272021 235 212022 230 82023 227 82024-2028 1,079 38
Other Benefit Plans
Postretirement Benefits — Medical and DentalWe provide medical and dental benefits to retirees through a contributory medical and dental plan based on age and years of service. We provide a defined dollar commitmenttoward retiree medical premiums.
Effective June 7, 2005, we amended the medical plan to reduce our subsidy to post-age 65 retirees and spouses by 45% beginning January 1, 2006, and then fully eliminated thesubsidy after December 31, 2006. As disclosed previously, the postretirement benefit plan was amended in 2001 to reduce and cap the per capita dollar amount of the benefitcosts that would be paid by the plan. Thus, changes in the assumed or actual health care cost trend rates do not materially affect the accumulated postretirement benefitobligation or our annual expense.
The net periodic postretirement benefit income of $17 million in 2016 is included in Other components of pension and postretirement benefit cost/(income) in the ConsolidatedStatements of Operations. The postretirement medical and dental plan was terminated effective December 31, 2016.
Defined Contribution Plans The Savings, Profit-Sharing and Stock Ownership Plan (Savings Plan) is a qualified defined contribution plan, a 401(k) plan, available to all eligible employees. EffectiveJanuary 1, 2007, all employees who are age 21 or older are immediately eligible to participate in and contribute a percentage of their pay to the Savings Plan. Eligibleemployees, who have completed one year and at least 1,000 hours of service within an eligibility period, are offered a fixed matching contribution each pay period equal to 50%of up to 6% of pay contributed by the employee. Matching contributions are credited to employees’ accounts in accordance with their investment elections and fully vest afterthree years. We may make additional discretionary matching contributions.
91
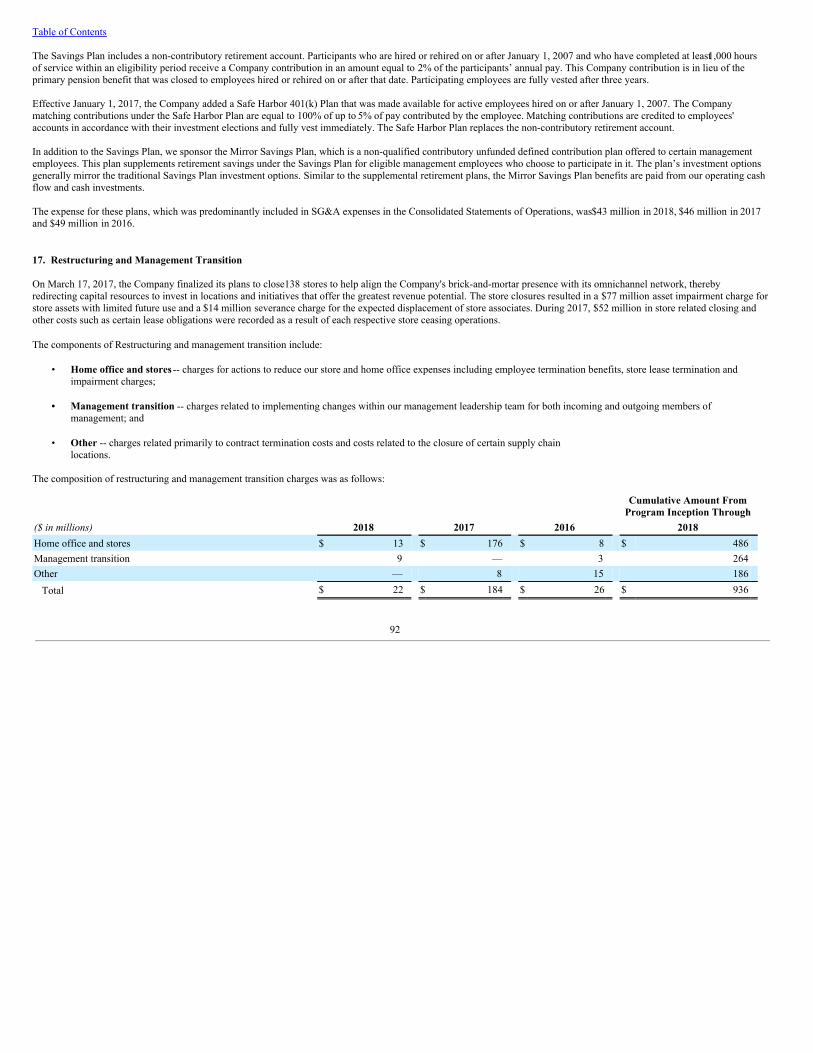
Table of Contents
The Savings Plan includes a non-contributory retirement account. Participants who are hired or rehired on or after January 1, 2007 and who have completed at least 1,000 hoursof service within an eligibility period receive a Company contribution in an amount equal to 2% of the participants’ annual pay. This Company contribution is in lieu of theprimary pension benefit that was closed to employees hired or rehired on or after that date. Participating employees are fully vested after three years.
Effective January 1, 2017, the Company added a Safe Harbor 401(k) Plan that was made available for active employees hired on or after January 1, 2007. The Companymatching contributions under the Safe Harbor Plan are equal to 100% of up to 5% of pay contributed by the employee. Matching contributions are credited to employees'accounts in accordance with their investment elections and fully vest immediately. The Safe Harbor Plan replaces the non-contributory retirement account.
In addition to the Savings Plan, we sponsor the Mirror Savings Plan, which is a non-qualified contributory unfunded defined contribution plan offered to certain managementemployees. This plan supplements retirement savings under the Savings Plan for eligible management employees who choose to participate in it. The plan’s investment optionsgenerally mirror the traditional Savings Plan investment options. Similar to the supplemental retirement plans, the Mirror Savings Plan benefits are paid from our operating cashflow and cash investments.
The expense for these plans, which was predominantly included in SG&A expenses in the Consolidated Statements of Operations, was $43 million in 2018, $46 million in 2017and $49 million in 2016.
17. Restructuring and Management Transition
On March 17, 2017, the Company finalized its plans to close 138 stores to help align the Company's brick-and-mortar presence with its omnichannel network, therebyredirecting capital resources to invest in locations and initiatives that offer the greatest revenue potential. The store closures resulted in a $77 million asset impairment charge forstore assets with limited future use and a $14 million severance charge for the expected displacement of store associates. During 2017, $52 million in store related closing andother costs such as certain lease obligations were recorded as a result of each respective store ceasing operations.
The components of Restructuring and management transition include:
• Home office and stores -- charges for actions to reduce our store and home office expenses including employee termination benefits, store lease termination andimpairment charges;
• Management transition -- charges related to implementing changes within our management leadership team for both incoming and outgoing members ofmanagement; and
• Other -- charges related primarily to contract termination costs and costs related to the closure of certain supply chainlocations.
The composition of restructuring and management transition charges was as follows:
Cumulative Amount From
Program Inception Through($ in millions) 2018 2017 2016 2018Home office and stores $ 13 $ 176 $ 8 $ 486Management transition 9 — 3 264Other — 8 15 186
Total $ 22 $ 184 $ 26 $ 936
92
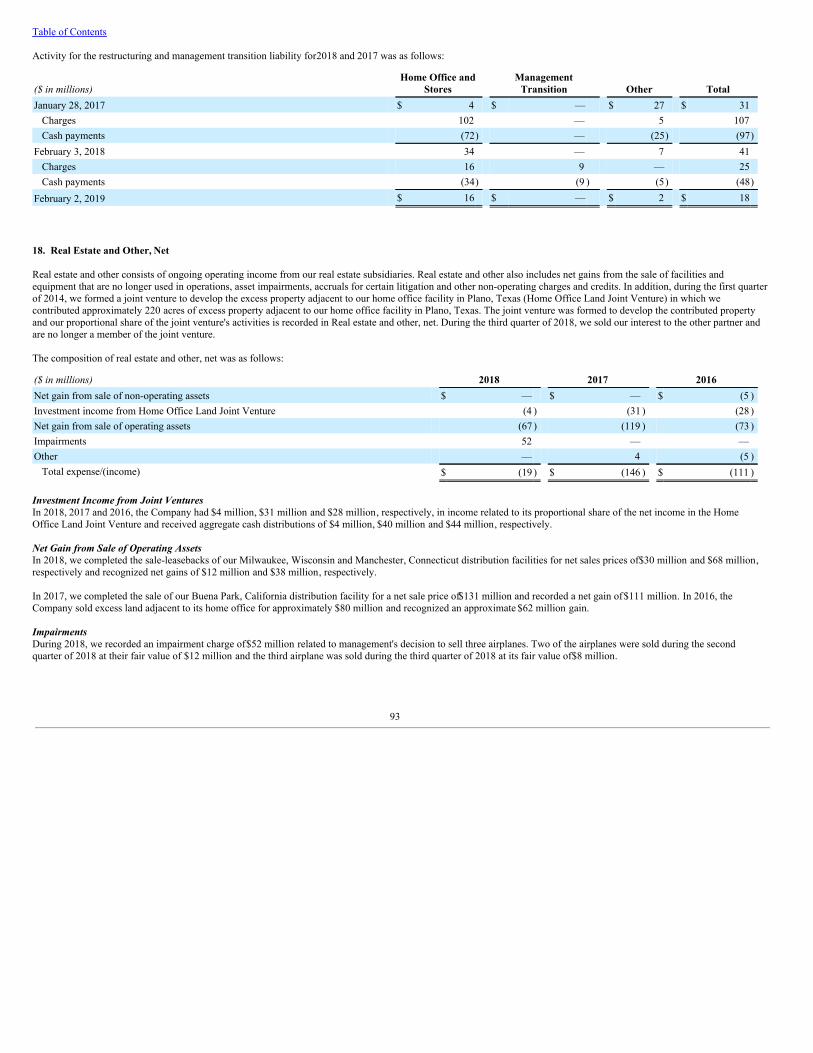
Table of Contents
Activity for the restructuring and management transition liability for 2018 and 2017 was as follows:
($ in millions) Home Office and
Stores Management
Transition Other TotalJanuary 28, 2017 $ 4 $ — $ 27 $ 31
Charges 102 — 5 107Cash payments (72) — (25) (97)
February 3, 2018 34 — 7 41Charges 16 9 — 25Cash payments (34) (9 ) (5) (48)
February 2, 2019 $ 16 $ — $ 2 $ 18
18. Real Estate and Other, Net
Real estate and other consists of ongoing operating income from our real estate subsidiaries. Real estate and other also includes net gains from the sale of facilities andequipment that are no longer used in operations, asset impairments, accruals for certain litigation and other non-operating charges and credits. In addition, during the first quarterof 2014, we formed a joint venture to develop the excess property adjacent to our home office facility in Plano, Texas (Home Office Land Joint Venture) in which wecontributed approximately 220 acres of excess property adjacent to our home office facility in Plano, Texas. The joint venture was formed to develop the contributed propertyand our proportional share of the joint venture's activities is recorded in Real estate and other, net. During the third quarter of 2018, we sold our interest to the other partner andare no longer a member of the joint venture.
The composition of real estate and other, net was as follows:
($ in millions) 2018 2017 2016Net gain from sale of non-operating assets $ — $ — $ (5 )Investment income from Home Office Land Joint Venture (4 ) (31 ) (28 )Net gain from sale of operating assets (67 ) (119 ) (73 )Impairments 52 — —Other — 4 (5 )
Total expense/(income) $ (19 ) $ (146 ) $ (111 )
Investment Income from Joint VenturesIn 2018, 2017 and 2016, the Company had $4 million, $31 million and $28 million, respectively, in income related to its proportional share of the net income in the HomeOffice Land Joint Venture and received aggregate cash distributions of $4 million, $40 million and $44 million, respectively.
Net Gain from Sale of Operating AssetsIn 2018, we completed the sale-leasebacks of our Milwaukee, Wisconsin and Manchester, Connecticut distribution facilities for net sales prices of $30 million and $68 million,respectively and recognized net gains of $12 million and $38 million, respectively.
In 2017, we completed the sale of our Buena Park, California distribution facility for a net sale price of $131 million and recorded a net gain of $111 million. In 2016, theCompany sold excess land adjacent to its home office for approximately $80 million and recognized an approximate $62 million gain.
ImpairmentsDuring 2018, we recorded an impairment charge of $52 million related to management's decision to sell three airplanes. Two of the airplanes were sold during the secondquarter of 2018 at their fair value of $12 million and the third airplane was sold during the third quarter of 2018 at its fair value of $8 million.
93
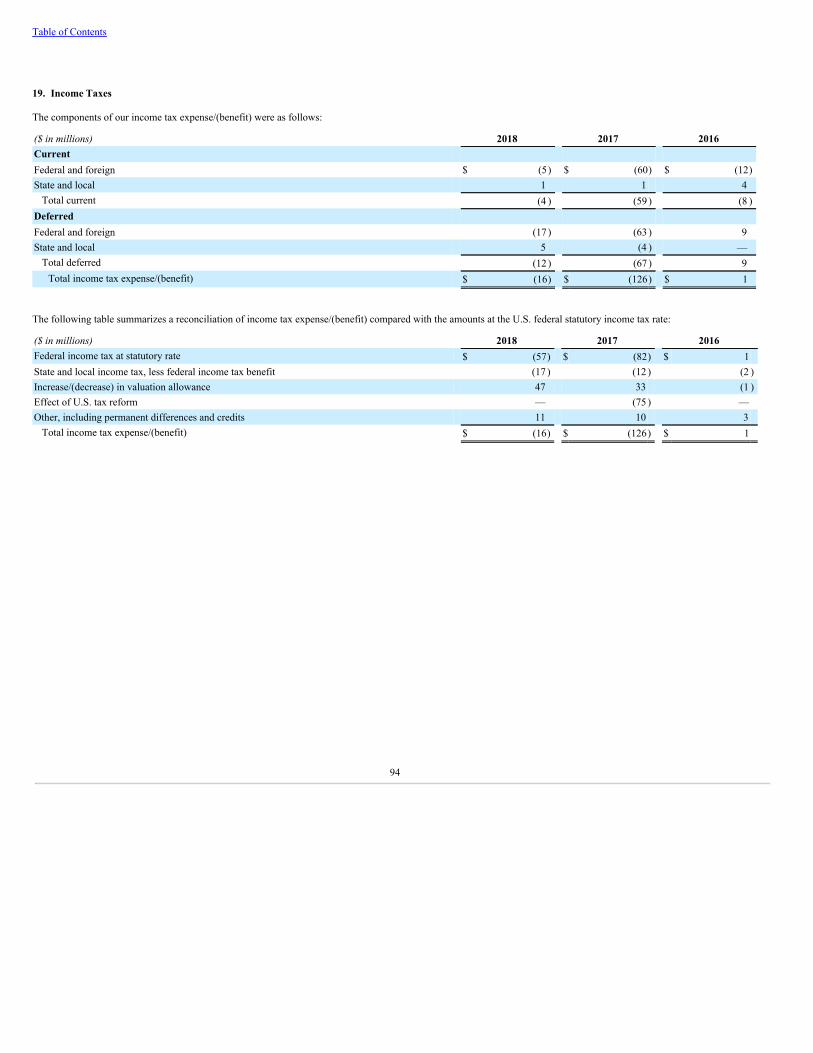
Table of Contents
19. Income Taxes
The components of our income tax expense/(benefit) were as follows:
($ in millions) 2018 2017 2016Current Federal and foreign $ (5) $ (60) $ (12)State and local 1 1 4
Total current (4 ) (59 ) (8 )Deferred Federal and foreign (17 ) (63 ) 9State and local 5 (4 ) —
Total deferred (12 ) (67 ) 9Total income tax expense/(benefit) $ (16) $ (126) $ 1
The following table summarizes a reconciliation of income tax expense/(benefit) compared with the amounts at the U.S. federal statutory income tax rate:
($ in millions) 2018 2017 2016Federal income tax at statutory rate $ (57) $ (82) $ 1State and local income tax, less federal income tax benefit (17 ) (12 ) (2 )Increase/(decrease) in valuation allowance 47 33 (1 )Effect of U.S. tax reform — (75 ) —Other, including permanent differences and credits 11 10 3
Total income tax expense/(benefit) $ (16) $ (126) $ 1
94
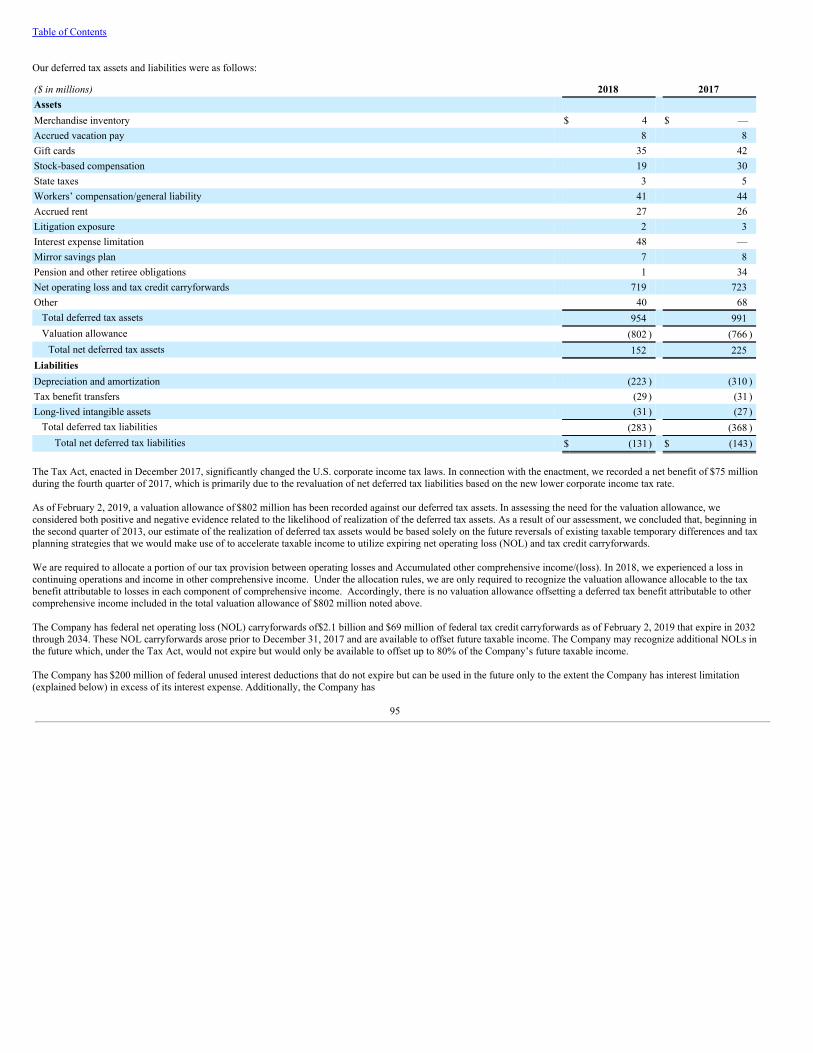
Table of Contents
Our deferred tax assets and liabilities were as follows:
($ in millions) 2018 2017Assets Merchandise inventory $ 4 $ —Accrued vacation pay 8 8Gift cards 35 42Stock-based compensation 19 30State taxes 3 5Workers’ compensation/general liability 41 44Accrued rent 27 26Litigation exposure 2 3Interest expense limitation 48 —Mirror savings plan 7 8Pension and other retiree obligations 1 34Net operating loss and tax credit carryforwards 719 723Other 40 68
Total deferred tax assets 954 991Valuation allowance (802 ) (766 )
Total net deferred tax assets 152 225Liabilities Depreciation and amortization (223 ) (310 )Tax benefit transfers (29 ) (31 )Long-lived intangible assets (31 ) (27 )
Total deferred tax liabilities (283 ) (368 )Total net deferred tax liabilities $ (131) $ (143)
The Tax Act, enacted in December 2017, significantly changed the U.S. corporate income tax laws. In connection with the enactment, we recorded a net benefit of $75 millionduring the fourth quarter of 2017, which is primarily due to the revaluation of net deferred tax liabilities based on the new lower corporate income tax rate.
As of February 2, 2019, a valuation allowance of $802 million has been recorded against our deferred tax assets. In assessing the need for the valuation allowance, weconsidered both positive and negative evidence related to the likelihood of realization of the deferred tax assets. As a result of our assessment, we concluded that, beginning inthe second quarter of 2013, our estimate of the realization of deferred tax assets would be based solely on the future reversals of existing taxable temporary differences and taxplanning strategies that we would make use of to accelerate taxable income to utilize expiring net operating loss (NOL) and tax credit carryforwards.
We are required to allocate a portion of our tax provision between operating losses and Accumulated other comprehensive income/(loss). In 2018, we experienced a loss incontinuing operations and income in other comprehensive income. Under the allocation rules, we are only required to recognize the valuation allowance allocable to the taxbenefit attributable to losses in each component of comprehensive income. Accordingly, there is no valuation allowance offsetting a deferred tax benefit attributable to othercomprehensive income included in the total valuation allowance of $802 million noted above.
The Company has federal net operating loss (NOL) carryforwards of $2.1 billion and $69 million of federal tax credit carryforwards as of February 2, 2019 that expire in 2032through 2034. These NOL carryforwards arose prior to December 31, 2017 and are available to offset future taxable income. The Company may recognize additional NOLs inthe future which, under the Tax Act, would not expire but would only be available to offset up to 80% of the Company’s future taxable income.
The Company has $200 million of federal unused interest deductions that do not expire but can be used in the future only to the extent the Company has interest limitation(explained below) in excess of its interest expense. Additionally, the Company has
95
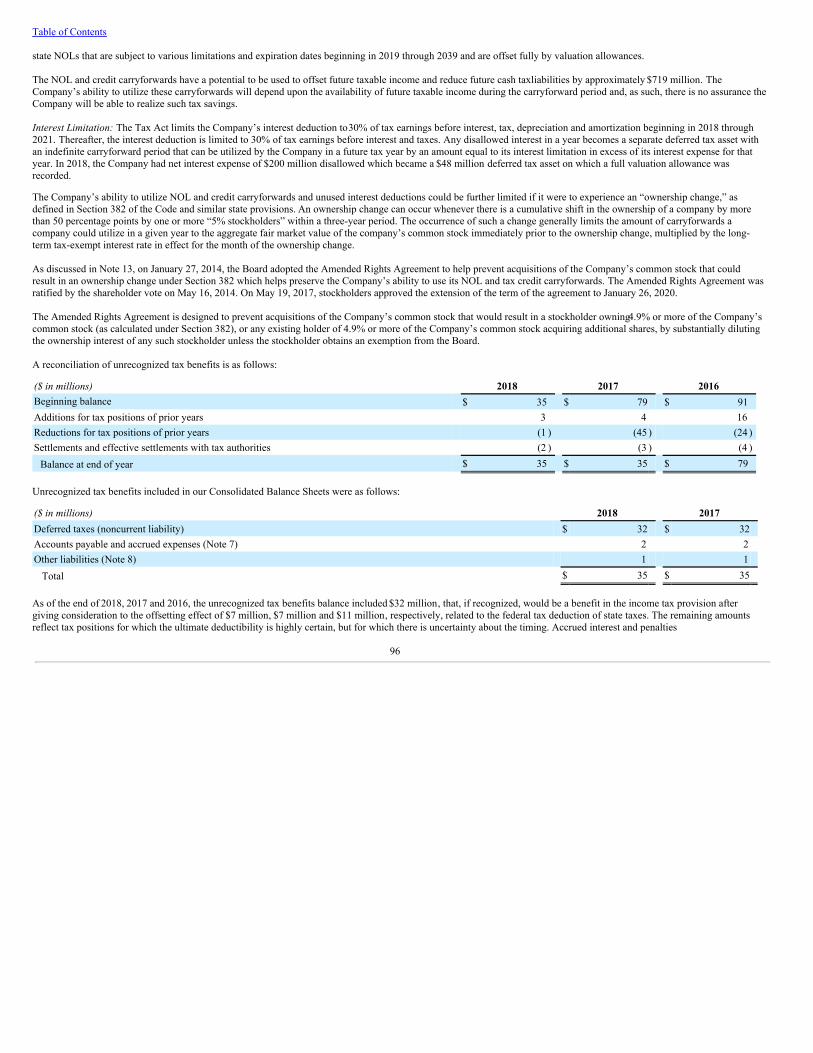
Table of Contents
state NOLs that are subject to various limitations and expiration dates beginning in 2019 through 2039 and are offset fully by valuation allowances.
The NOL and credit carryforwards have a potential to be used to offset future taxable income and reduce future cash tax liabilities by approximately $719 million. TheCompany’s ability to utilize these carryforwards will depend upon the availability of future taxable income during the carryforward period and, as such, there is no assurance theCompany will be able to realize such tax savings.
Interest Limitation: The Tax Act limits the Company’s interest deduction to 30% of tax earnings before interest, tax, depreciation and amortization beginning in 2018 through2021. Thereafter, the interest deduction is limited to 30% of tax earnings before interest and taxes. Any disallowed interest in a year becomes a separate deferred tax asset withan indefinite carryforward period that can be utilized by the Company in a future tax year by an amount equal to its interest limitation in excess of its interest expense for thatyear. In 2018, the Company had net interest expense of $200 million disallowed which became a $48 million deferred tax asset on which a full valuation allowance wasrecorded.
The Company’s ability to utilize NOL and credit carryforwards and unused interest deductions could be further limited if it were to experience an “ownership change,” asdefined in Section 382 of the Code and similar state provisions. An ownership change can occur whenever there is a cumulative shift in the ownership of a company by morethan 50 percentage points by one or more “5% stockholders” within a three-year period. The occurrence of such a change generally limits the amount of carryforwards acompany could utilize in a given year to the aggregate fair market value of the company’s common stock immediately prior to the ownership change, multiplied by the long-term tax-exempt interest rate in effect for the month of the ownership change.
As discussed in Note 13, on January 27, 2014, the Board adopted the Amended Rights Agreement to help prevent acquisitions of the Company’s common stock that couldresult in an ownership change under Section 382 which helps preserve the Company’s ability to use its NOL and tax credit carryforwards. The Amended Rights Agreement wasratified by the shareholder vote on May 16, 2014. On May 19, 2017, stockholders approved the extension of the term of the agreement to January 26, 2020.
The Amended Rights Agreement is designed to prevent acquisitions of the Company’s common stock that would result in a stockholder owning 4.9% or more of the Company’scommon stock (as calculated under Section 382), or any existing holder of 4.9% or more of the Company’s common stock acquiring additional shares, by substantially dilutingthe ownership interest of any such stockholder unless the stockholder obtains an exemption from the Board.
A reconciliation of unrecognized tax benefits is as follows:
($ in millions) 2018 2017 2016Beginning balance $ 35 $ 79 $ 91Additions for tax positions of prior years 3 4 16Reductions for tax positions of prior years (1 ) (45 ) (24 )Settlements and effective settlements with tax authorities (2 ) (3 ) (4 )
Balance at end of year $ 35 $ 35 $ 79
Unrecognized tax benefits included in our Consolidated Balance Sheets were as follows:
($ in millions) 2018 2017Deferred taxes (noncurrent liability) $ 32 $ 32Accounts payable and accrued expenses (Note 7) 2 2Other liabilities (Note 8) 1 1
Total $ 35 $ 35
As of the end of 2018, 2017 and 2016, the unrecognized tax benefits balance included $32 million, that, if recognized, would be a benefit in the income tax provision aftergiving consideration to the offsetting effect of $7 million, $7 million and $11 million, respectively, related to the federal tax deduction of state taxes. The remaining amountsreflect tax positions for which the ultimate deductibility is highly certain, but for which there is uncertainty about the timing. Accrued interest and penalties
96
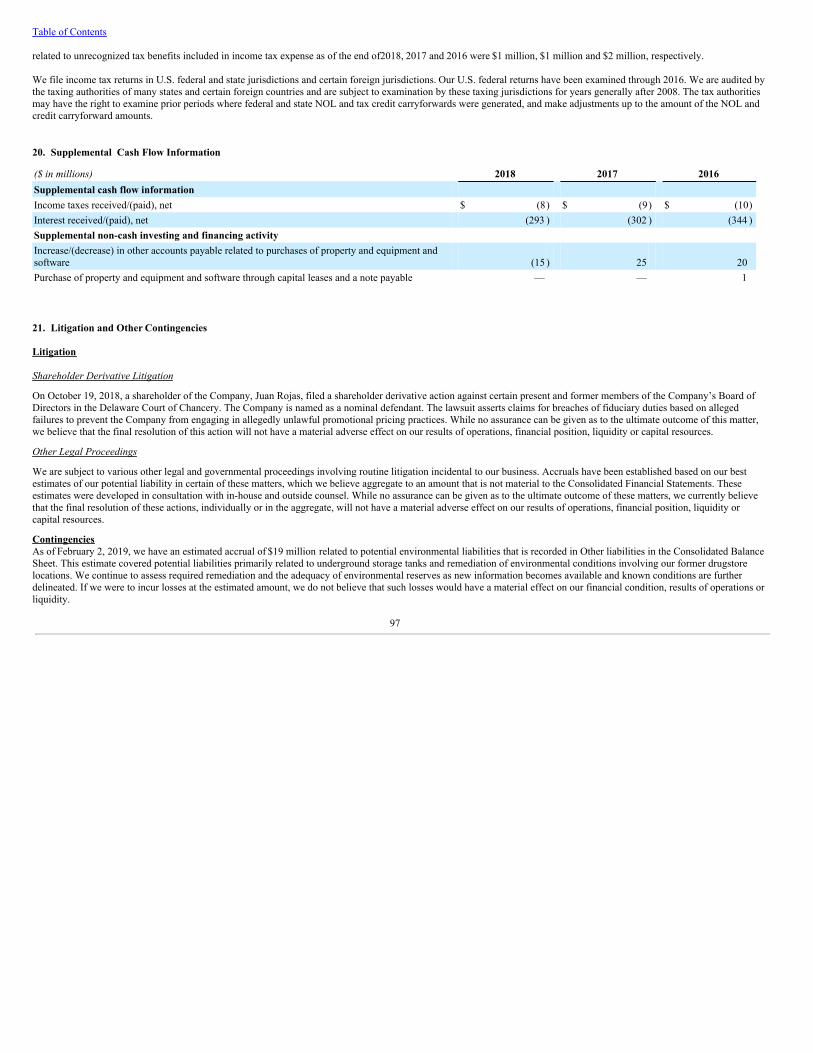
Table of Contents
related to unrecognized tax benefits included in income tax expense as of the end of 2018, 2017 and 2016 were $1 million, $1 million and $2 million, respectively. We file income tax returns in U.S. federal and state jurisdictions and certain foreign jurisdictions. Our U.S. federal returns have been examined through 2016. We are audited bythe taxing authorities of many states and certain foreign countries and are subject to examination by these taxing jurisdictions for years generally after 2008. The tax authoritiesmay have the right to examine prior periods where federal and state NOL and tax credit carryforwards were generated, and make adjustments up to the amount of the NOL andcredit carryforward amounts.
20. Supplemental Cash Flow Information
($ in millions) 2018 2017 2016Supplemental cash flow information Income taxes received/(paid), net $ (8) $ (9) $ (10)Interest received/(paid), net (293 ) (302 ) (344 )Supplemental non-cash investing and financing activity Increase/(decrease) in other accounts payable related to purchases of property and equipment andsoftware (15 ) 25 20Purchase of property and equipment and software through capital leases and a note payable — — 1
21. Litigation and Other Contingencies
Litigation
Shareholder Derivative Litigation
On October 19, 2018, a shareholder of the Company, Juan Rojas, filed a shareholder derivative action against certain present and former members of the Company’s Board ofDirectors in the Delaware Court of Chancery. The Company is named as a nominal defendant. The lawsuit asserts claims for breaches of fiduciary duties based on allegedfailures to prevent the Company from engaging in allegedly unlawful promotional pricing practices. While no assurance can be given as to the ultimate outcome of this matter,we believe that the final resolution of this action will not have a material adverse effect on our results of operations, financial position, liquidity or capital resources.
Other Legal Proceedings
We are subject to various other legal and governmental proceedings involving routine litigation incidental to our business. Accruals have been established based on our bestestimates of our potential liability in certain of these matters, which we believe aggregate to an amount that is not material to the Consolidated Financial Statements. Theseestimates were developed in consultation with in-house and outside counsel. While no assurance can be given as to the ultimate outcome of these matters, we currently believethat the final resolution of these actions, individually or in the aggregate, will not have a material adverse effect on our results of operations, financial position, liquidity orcapital resources.
ContingenciesAs of February 2, 2019, we have an estimated accrual of $19 million related to potential environmental liabilities that is recorded in Other liabilities in the Consolidated BalanceSheet. This estimate covered potential liabilities primarily related to underground storage tanks and remediation of environmental conditions involving our former drugstorelocations. We continue to assess required remediation and the adequacy of environmental reserves as new information becomes available and known conditions are furtherdelineated. If we were to incur losses at the estimated amount, we do not believe that such losses would have a material effect on our financial condition, results of operations orliquidity.
97
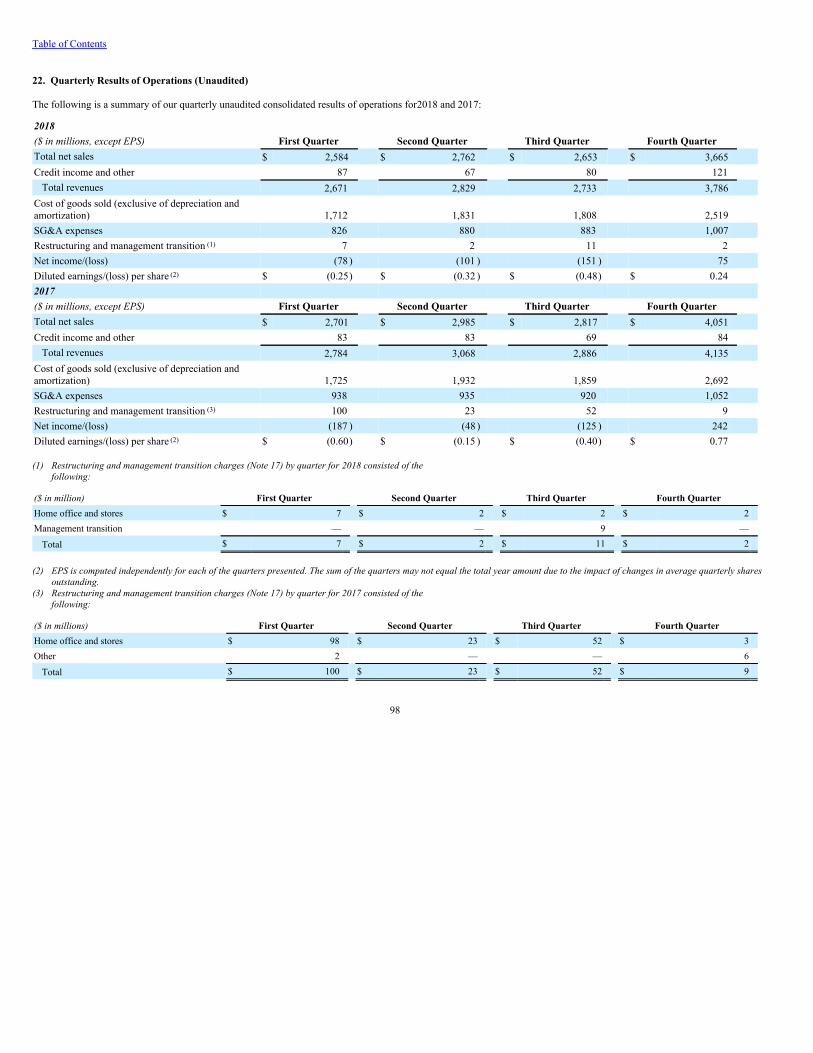
Table of Contents
22. Quarterly Results of Operations (Unaudited)
The following is a summary of our quarterly unaudited consolidated results of operations for 2018 and 2017:
2018 ($ in millions, except EPS) First Quarter Second Quarter Third Quarter Fourth Quarter Total net sales $ 2,584 $ 2,762 $ 2,653 $ 3,665
Credit income and other 87 67 80 121 Total revenues 2,671 2,829 2,733 3,786
Cost of goods sold (exclusive of depreciation andamortization) 1,712 1,831 1,808 2,519 SG&A expenses 826 880 883 1,007
Restructuring and management transition (1) 7 2 11 2 Net income/(loss) (78 ) (101 ) (151 ) 75Diluted earnings/(loss) per share (2) $ (0.25) $ (0.32 ) $ (0.48) $ 0.24 2017 ($ in millions, except EPS) First Quarter Second Quarter Third Quarter Fourth Quarter Total net sales $ 2,701 $ 2,985 $ 2,817 $ 4,051 Credit income and other 83 83 69 84
Total revenues 2,784 3,068 2,886 4,135 Cost of goods sold (exclusive of depreciation andamortization) 1,725 1,932 1,859 2,692SG&A expenses 938 935 920 1,052
Restructuring and management transition (3) 100 23 52 9 Net income/(loss) (187 ) (48 ) (125 ) 242 Diluted earnings/(loss) per share (2) $ (0.60) $ (0.15 ) $ (0.40) $ 0.77
(1) Restructuring and management transition charges (Note 17) by quarter for 2018 consisted of thefollowing:
($ in million) First Quarter Second Quarter Third Quarter Fourth QuarterHome office and stores $ 7 $ 2 $ 2 $ 2Management transition — — 9 —
Total $ 7 $ 2 $ 11 $ 2
(2) EPS is computed independently for each of the quarters presented. The sum of the quarters may not equal the total year amount due to the impact of changes in average quarterly shares
outstanding.(3) Restructuring and management transition charges (Note 17) by quarter for 2017 consisted of the
following:
($ in millions) First Quarter Second Quarter Third Quarter Fourth QuarterHome office and stores $ 98 $ 23 $ 52 $ 3Other 2 — — 6
Total $ 100 $ 23 $ 52 $ 9
98

EXHIBIT 21
SUBSIDIARIES OF THE REGISTRANT
Set forth below is a direct subsidiary of the Company as of March 19, 2019. All of the voting securities of this subsidiary are owned by the Company.
SubsidiariesJ. C. Penney Corporation, Inc. (Delaware)The names of other subsidiaries have been omitted because these unnamed subsidiaries, considered in the aggregate as a single subsidiary, do not constitute a significantsubsidiary.
Exhibit 23
Consent of Independent Registered Public Accounting Firm
The Board of Directors
J. C. Penney Company, Inc.:
We consent to the incorporation by reference in the registration statements on Form S-8 (Registration Nos: 33-28390-99, 33-66070-99, 333-33343-99, 333-27329-99, 333-62066-99, 333-125356, 333-159349, 333-182202, 333-182825, 333-196151, 333-208059, 333-211539, 333-211540, 333-225288 and 333-225965) and on Form S-3(Registration No. 333-211536-01) of J. C. Penney Company, Inc. of our reports dated March 19, 2019, with respect to the consolidated balance sheets of J. C. PenneyCompany, Inc. as of February 2, 2019 and February 3, 2018, the related consolidated statements of operations, comprehensive income/(loss), stockholders’ equity, and cashflows for each of the years in the three-year period ended February 2, 2019, and the related notes, and the effectiveness of internal control over financial reporting as of February2, 2019, which reports appear in the February 2, 2019 annual report on Form 10‑K of J. C. Penney Company, Inc. .
Our report dated March 19, 2019, on the consolidated balance sheets of J. C. Penney Company, Inc. and subsidiaries as of February 2, 2019 and February 3, 2018, and therelated consolidated statements of operations, comprehensive income/ (loss), stockholders’ equity, and cash flows for each of the years in the three-year period ended February2, 2019, contains an explanatory paragraph that states that effective February 4, 2018 the Company adopted the Accounting Standard Codification Topic 606, Revenue fromContracts with Customers, which changed its method of accounting for its revenue from contracts with customers and that the Company elected to change its method ofaccounting for merchandise inventories for its Internet operations from the lower of standard cost (representing average vendor cost) or net realizable value to the lower of costor market determined by the retail inventory method during the fiscal- year ended February 3, 2018.
/s/ KPMG LLP
Dallas, TexasMarch 19, 2019
Exhibit 24
POWER OF ATTORNEYKNOW ALL MEN BY THESE PRESENTS THAT each of the undersigned directors and officers of J. C. PENNEY COMPANY, INC., a Delaware corporation, which will filewith the Securities and Exchange Commission, Washington, D.C. (“Commission”), under the provisions of the Securities Exchange Act of 1934, as amended, its Annual Reporton Form 10-K for the fiscal year ended February 2, 2019 (“Annual Report”), hereby constitutes and appoints Michael Fung, Andrew Drexler and Brandy Treadway, and each ofthem, his or her true and lawful attorneys-in-fact and agents, with full power to each of them to act without the others, for him or her and in his or her name, place, and stead, inany and all capacities, to sign said Annual Report, which is about to be filed, and any and all subsequent amendments to said Annual Report, and to file said Annual Report sosigned, and any and all subsequent amendments thereto so signed, with all exhibits thereto, and any and all documents in connection therewith, and to appear before theCommission in connection with any matter relating to said Annual Report, hereby granting to the attorneys-in-fact and agents, and each of them, full power and authority to doand perform any and all acts and things requisite and necessary to be done in and about the premises as fully and to all intents and purposes as he or she might or could do inperson, hereby ratifying and confirming all that such attorneys-in-fact and agents, or any of them, may lawfully do or cause to be done by virtue hereof.
IN WITNESS WHEREOF, the undersigned have executed this Power of Attorney as of the 18th day of March, 2019.
/s/ Jill Soltau /s/ Michael Fung
Jill SoltauChief Executive Officer; Director(principal executive officer)
Michael FungInterim Executive Vice President, Chief Financial Officer(principal financial officer)
/s/ Andrew S. Drexler /s/ Ronald W. TysoeAndrew S. DrexlerSenior Vice President, Chief Accounting Officer and Controller(principal accounting officer)
Ronald W. TysoeChairman of the Board; Director
/s/ Paul Brown /s/ Amanda GinsbergPaul BrownDirector
Amanda GinsbergDirector
/s/ Wonya Y. Lucas /s/ B. Craig OwensWonya Y. LucasDirector
B. Craig OwensDirector
/s/ Lisa A. Payne /s/ Debora A. PlunkettLisa A. PayneDirector
Debora A. PlunkettDirector
/s/ Leonard H. Roberts /s/ Javier G. TeruelLeonard H. RobertsDirector
Javier G. TeruelDirector
/s/ R. Gerald Turner R. Gerald TurnerDirector
Exhibit 31.1
CERTIFICATION
I, Jill Soltau, certify that:
1. I have reviewed this Annual Report on Form 10-K of J. C. Penney Company,Inc.;
2. Based on my knowledge, this report does not contain any untrue statement of a material fact or omit to state a material fact necessary to make the statements made, inlight of the circumstances under which such statements were made, not misleading with respect to the period covered by this report;
3. Based on my knowledge, the financial statements, and other financial information included in this report, fairly present in all material respects the financial condition,results of operations and cash flows of the registrant as of, and for, the periods presented in this report;
4. The registrant's other certifying officer(s) and I are responsible for establishing and maintaining disclosure controls and procedures (as defined in Exchange Act Rules13a-15(e) and 15d-15(e)) and internal control over financial reporting (as defined in Exchange Act Rules 13a-15(f) and 15d-15(f)) for the registrant and have:
(a) Designed such disclosure controls and procedures, or caused such disclosure controls and procedures to be designed under our supervision, to ensure thatmaterial information relating to the registrant, including its consolidated subsidiaries, is made known to us by others within those entities, particularly duringthe period in which this report is being prepared;
(b) Designed such internal control over financial reporting, or caused such internal control over financial reporting to be designed under our supervision, toprovide reasonable assurance regarding the reliability of financial reporting and the preparation of financial statements for external purposes in accordancewith generally accepted accounting principles;
(c) Evaluated the effectiveness of the registrant's disclosure controls and procedures and presented in this report our conclusions about the effectiveness of thedisclosure controls and procedures, as of the end of the period covered by this report based on such evaluation; and
(d) Disclosed in this report any change in the registrant's internal control over financial reporting that occurred during the registrant's most recent fiscal quarter(the registrant's fourth fiscal quarter in the case of an annual report) that has materially affected, or is reasonably likely to materially affect, the registrant'sinternal control over financial reporting; and
5. The registrant's other certifying officer(s) and I have disclosed, based on our most recent evaluation of internal control over financial reporting, to the registrant'sauditors and the audit committee of the registrant's board of directors (or persons performing the equivalent functions):
(a) All significant deficiencies and material weaknesses in the design or operation of internal control over financial reporting which are reasonably likely toadversely affect the registrant's ability to record, process, summarize and report financial information; and
(b) Any fraud, whether or not material, that involves management or other employees who have a significant role in the registrant's internal control over financialreporting.
Date: March 19, 2019
/s/ Jill Soltau Jill Soltau Chief Executive Officer
Exhibit 31.2
CERTIFICATION
I, Michael Fung, certify that:
1. I have reviewed this Annual Report on Form 10-K of J. C. Penney Company,Inc.;
2. Based on my knowledge, this report does not contain any untrue statement of a material fact or omit to state a material fact necessary to make the statements made, inlight of the circumstances under which such statements were made, not misleading with respect to the period covered by this report;
3. Based on my knowledge, the financial statements, and other financial information included in this report, fairly present in all material respects the financial condition,results of operations and cash flows of the registrant as of, and for, the periods presented in this report;
4. The registrant's other certifying officer(s) and I are responsible for establishing and maintaining disclosure controls and procedures (as defined in Exchange Act Rules13a-15(e) and 15d-15(e)) and internal control over financial reporting (as defined in Exchange Act Rules 13a-15(f) and 15d-15(f)) for the registrant and have:
(a) Designed such disclosure controls and procedures, or caused such disclosure controls and procedures to be designed under our supervision, to ensure thatmaterial information relating to the registrant, including its consolidated subsidiaries, is made known to us by others within those entities, particularly duringthe period in which this report is being prepared;
(b) Designed such internal control over financial reporting, or caused such internal control over financial reporting to be designed under our supervision, toprovide reasonable assurance regarding the reliability of financial reporting and the preparation of financial statements for external purposes in accordancewith generally accepted accounting principles;
(c) Evaluated the effectiveness of the registrant's disclosure controls and procedures and presented in this report our conclusions about the effectiveness of thedisclosure controls and procedures, as of the end of the period covered by this report based on such evaluation; and
(d) Disclosed in this report any change in the registrant's internal control over financial reporting that occurred during the registrant's most recent fiscal quarter(the registrant's fourth fiscal quarter in the case of an annual report) that has materially affected, or is reasonably likely to materially affect, the registrant'sinternal control over financial reporting; and
5. The registrant's other certifying officer(s) and I have disclosed, based on our most recent evaluation of internal control over financial reporting, to the registrant'sauditors and the audit committee of the registrant's board of directors (or persons performing the equivalent functions):
(a) All significant deficiencies and material weaknesses in the design or operation of internal control over financial reporting which are reasonably likely toadversely affect the registrant's ability to record, process, summarize and report financial information; and
(b) Any fraud, whether or not material, that involves management or other employees who have a significant role in the registrant's internal control over financialreporting.
Date: March 19, 2019
/s/ Michael Fung Michael Fung Interim Executive Vice President, Chief Financial Officer
Exhibit 32.1
CERTIFICATION PURSUANT TO18 U.S.C. SECTION 1350,
AS ADOPTED PURSUANT TOSECTION 906 OF THE SARBANES-OXLEY ACT OF 2002
In connection with the Annual Report of J. C. Penney Company, Inc. (the “Company”) on Form 10-K for the period ending February 2, 2019 (the “Report”), I, Jill Soltau, ChiefExecutive Officer of the Company, certify, pursuant to 18 U.S.C. Section 1350, as adopted pursuant to Section 906 of the Sarbanes-Oxley Act of 2002, that to my knowledge:
(1) the Report fully complies with the requirements of section 13(a) or 15(d) of the Securities Exchange Act of 1934;and
(2) the information contained in the Report fairly presents, in all material respects, the financial condition and results of operations of theCompany.
DATED this 19th day of March 2019.
/s/ Jill SoltauJill SoltauChief Executive Officer
Exhibit 32.2
CERTIFICATION PURSUANT TO18 U.S.C. SECTION 1350,
AS ADOPTED PURSUANT TOSECTION 906 OF THE SARBANES-OXLEY ACT OF 2002
In connection with the Annual Report of J. C. Penney Company, Inc. (the “Company”) on Form 10-K for the period ending February 2, 2019 (the “Report”), I, Michael Fung, Interim Executive Vice President, Chief Financial Officer of the Company, certify, pursuant to 18 U.S.C. Section 1350, as adopted pursuant to Section 906 of the Sarbanes-Oxley Act of 2002, that to my knowledge:
(1) the Report fully complies with the requirements of section 13(a) or 15(d) of the Securities Exchange Act of 1934;
and(2) the information contained in the Report fairly presents, in all material respects, the financial condition and results of operations of the
Company.
DATED this 19th day of March 2019.
/s/ Michael FungMichael FungInterim Executive Vice President, ChiefFinancial Officer
Top Related