


Languages
Pages
Legal


An Introductionto Gruppo Campari
&
2004 First Half Results Highlights
Italian Investor Conference
Tokyo, 12 October 2004

SLIDE 2
An introduction to Gruppo CampariEnzo Visone, Chief Executive Officer

SLIDE 3
Gruppo Campari today
> Campari is Italy’s largest producer and distributor of branded spirits,the sixth largest globally
> Campari’s portfolio includes four of the top 100 premium spiritsbrands in the world (Campari, CampariSoda, SKYY Vodka, Cynar) aswell as Cinzano, the second best-selling brand in the global vermouthcategory
> The Group’s largest markets are Italy, US, Germany and Brazil
> Campari’s distribution network covers more than 190 countriesworld-wide
> Campari markets an attractive portfolio of third party brandscomplementing its offering

SLIDE 4
Tradition and development
> 1860: Gaspare Campari invents Campari’s formula andestablishes the business
> 1904: Beginning of industrial phase
> 1932: Launch of CampariSoda - the world’s first pre-mix
> 1950: Major efforts in developing international distribution
> 1995: Beginning of acquisition activity
> 2001: Initial Public Offering on the ItalianStock Exchange

SLIDE 5
Continuing growthFive consecutive years of solid performance
Net turnover EBITDA
EBITA and EBIT EPS and adj. EPS
(1) EPS adjusted for GW amortisation, exceptionals and tax effects
366434
494
661714
-100200300400500600700800
1999 2000 2001 2002 2003
€ m
illio
nCAGR 1999/2003
+18%
86105 114
160 169
-
50
100
150
200
1999 2000 2001 2002 2003
€ m
illio
n
CAGR 1999/2003 +18%
75
93 100
142151
67
85 89
115 122
0
20
40
60
80
100
120
140
160
1999 2000 2001 2002 2003
€ m
illio
n
EBITA EBIT
CAGR EBITA 1999/2003 +19%CAGR EBIT 1999/2003 +16%
1.87 1.822.18
2.982.75
2.00
2.52 2.49
3.212.96
0.00
0.50
1.00
1.50
2.00
2.50
3.00
3.50
4.00
1999 2000 2001 2002 2003
€
EPS EPS adj. (1)
CAGR EPS 1999/2003 +10%CAGR adj. EPS 1999/2003 +10%

SLIDE 6
The 6th player in the spirits industryIMPACT global ranking
Rank Rank Rank Number of 2003E Percent Change2004 2003 2002 Company Top 100 Brands 9-ltr cases m. 2002-2003E
1 1 1 Diageo 16 70.5 5.4%2 3 2 Allied Domecq 13 29.6 3.33 2 4 Pernod Ricard 12 27.7 2.04 4 3 Bacardi Ltd 5 27.6 1.75 5 5 Brown-Forman 5 14.1 1.2
Total Top 5 51 169.4 3.56 6 7 Campari Group (1) 4 8.2 4.17 7 6 V&S Vin & Sprit AB 1 8.1 7.78 9 12 Remy Cointreau SA 4 7.3 3.89 8 8 Jim Beam Brands 3 7.2 -1.910 11 10 Tequila Cuervo SA 1 5.8 5.5
Total Top 10 64 206.0 3.611 10 9 William Grant & Sons 2 5.3 -4.312 12 13 De Kuyper BV 1 4.8 1.513 14 15 Brugal & Co. 1 4.0 7.514 13 14 Eckes AG 3 3.9 -4.715 15 11 Moet-Hennessy (LVMH) 1 3.4 5.0
Total Top 15 72 227.3 3.3Other Companies 28 44.1 2.4Total Top 100 100 271.4 3.1
Source: IMPACT Databank, February 2004(1) Includes: Campari, CampariSoda, SKYY Vodka, Cynar
SLIDE 7
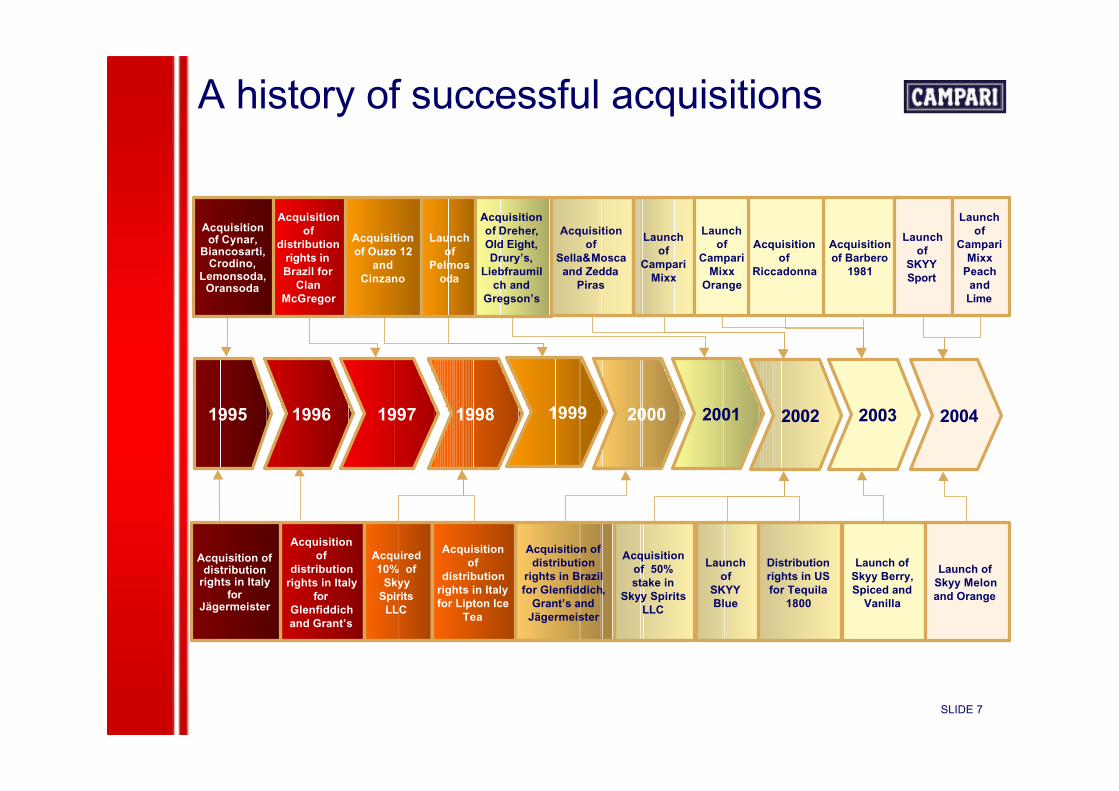
A history of successful acquisitions
2000
Acquisition ofdistribution
rights in Brazilfor Glenfiddich,
Grant’s andJägermeister
1996
Acquisitionof
distributionrights in Italy
forGlenfiddichand Grant’s
1997
Acquisitionof
distributionrights inBrazil for
ClanMcGregor
1999
Acquisitionof Ouzo 12
andCinzano
Launchof
Pelmosoda
1998
Acquired10% of
SkyySpirits
LLC
Acquisitionof
distributionrights in Italyfor Lipton Ice
Tea
1995
Acquisitionof Cynar,
Biancosarti,Crodino,
Lemonsoda,Oransoda
Acquisition ofdistribution
rights in Italyfor
Jägermeister
Acquisitionof Dreher,Old Eight,Drury’s,
Liebfraumilch and
Gregson’s
2001 2002
Acquisitionof
Sella&Moscaand Zedda
Piras
Acquisitionof 50%stake in
Skyy SpiritsLLC
Launchof
CampariMixx
Launchof
SKYYBlue
Distributionrights in USfor Tequila
1800
2003
Launchof
CampariMixx
Orange
Acquisitionof Barbero
1981
2004
Launch ofSkyy Berry,Spiced and
Vanilla
Launch ofSkyy Melonand Orange
Acquisitionof
Riccadonna
Launchof
SKYYSport
Launchof
CampariMixx
Peachand
Lime

SLIDE 8
Third party distributorsJoint venture for distribution in UK, Belgium, Holland, Spain
Direct distribution
Campari’s global presence
Present in 190 countriesOfficesOwn plantsWineries

SLIDE 9
Campari’s growth strategy
Campari pursues solid growth while maintaining focus oncosts optimisation and production & distribution efficiencies
Organic growth External growth
> Consolidation of existing business
> Exploit untapped markets forCampari
> Maintain solid growth in US andcontinue internationaldevelopment for SKYY Vodka
> Re-launch of Cinzano> Consolidate solid performance of
local / regional brands> Development in emerging markets> New product development
> Selective strategic acquisitions withfocus on highly profitable spiritbrands
> Continual monitoring foropportunities to increase criticalmass in selected markets
> Solid financial position capable ofreinforcing expansion policies

SLIDE 10
Advertising & promotion that ensures thesuccess of Campari’s business model
A specific portfolio of world-class brands
Strong financial position
Proven track record in acquisitions andbrand / company integration
Campari’s success factors

SLIDE 11
Key international brands
> Campari is the Group’s flagship brand, apowerful icon of Italian class and style
> Campari represented 16% of Group’ssales in 2003
> Campari is:
– international (sold in 190 countries)
– unique (it defines its category)
– dynamic and trendy (outdoorconsumption, relevant to a modern lifestyle)
> Campari’s largest markets are Italy, Brazil,Germany
Campari

SLIDE 12
Key international brands
> SKYY is the pure, premium vodka thatdefines contemporary cocktail style
> Acquired in 2001, SKYY is one of thefastest growing vodkas in the US
> SKYY represented 14% of Group’s salesin 2003
> Named as “Hot Brand” in the US byImpact for the 9th consecutive year
> Total of six flavours in addition to thecore vodka brand (SKYY Citrus, SKYYBerry, SKYY Spiced, SKYY Vanilla, SKYYMelon, SKYY Orange)
> Strong potential outside the US
SKYY Vodka
SLIDE 13

SLIDE 14
SLIDE 15

SLIDE 16

SLIDE 17
Key international brands
> Cinzano is a truly internationalbrand
– no.2 vermouth in the world
– a major producer of sparkling wines
> One brand, two main features
– a 250 year history
– strongly linked to Italian style,heritage and tradition
> Cinzano represented 10% of Group’ssales in 2003
> Acquired in 1999, Cinzano isdistributed in over 100 countries
Cinzano

SLIDE 18
CampariSodaCrodino
Ouzo 12
> Market leaders in the single-serve aperitifmarket in Italy
Key local / regional brands
> Worldwide leader in the Ouzo market> Major markets are Greece and Germany
> Market leader in the conhaque category inBrazilDreher
> No.2 and No.3 brands in the admix whiskycategory in Brazil
Old EightDrury’s
Aperol> Leading brand in the aperitif market in Italy
with a strong potential in specificinternational markets
SKYY Blue > Leading brand in the ready-to-drinks’market in the US, recently launched in Japanand Australia

SLIDE 19
2004 First Half Results HighlightsPaolo Marchesini, Chief Financial Officer

SLIDE 20
> Growth continues in sales and at all levels of profitability– positive contribution of newly-acquired Barbero 1891 S.p.A.
– good performance enjoyed by existing business– impact of exchange rates still negative
Six months ended 30 June 2004Key financial results
1H 2004 % change % change€ million at constant exchange at actual exchange
Net sales 367.4 +13.3% +10.4%
EBITDA 84.7 +13.1% +7.4%
EBITA 75.9 +11.0% +7.1%
EBIT 58.3 +7.3% +2.4%
Profit before taxes and minority interests 55.0 +13.1% +7.0%
Group profit before taxes 48.7 +17.5% +11.8%
Group net profit 30.9 +18.0% +10.7%

SLIDE 21
Breakdown of sales growth2004 first half sales
Notes:(1) Includes:- sales of Barbero 1891 S.p.A. (€ 28.5m), fully consolidated as of December 2003- sales of Qingdao Sella & Mosca Winery Co. Ltd. and Société Civile Immobiliaire de la Margue (€ 0.4 m),fully consolidated as of January 2004
> 4.6% organic sales growth
> Continued strong performance of newly-acquired Barbero brands> Exchange rates still unfavourable
1H 2003 Externalgrowth (1)
Organicgrowth
Currencyeffects
1H 2004
€332.7m
€28.9m+8.7%
€15.4m+4.6%
€(9.6)m-2.9%
€367.4 m+10.4%

SLIDE 22
Net sales by regionPositive development in Italy and the Americas
Italy + 18.6% Europe - 2.7%
Americas + 0.7% 1H 2004 sales by region € 367.4 m
1H 2003 External Organic Currency 1H 2004
€ 169.1m
+13.7%+4.9% +0.0%
€ 200.7m+18.6%
Italy54.6%
Europe17.1%
Americas25.9%
RoW2.5%
1H 2003 External Organic Currency 1H 2004
€ 94.3m€ 95.0m
+0.7%+0.3%+9.3%
-8.9%
USA77.5%
Brazil 19.0%
Other 3.5%
USA73.5%
Brazil 21.7%
Other 4.8%
1H 2003 External Organic Currency 1H 2004
+7.4% -9.4%
-0.7%
€ 62.7m-2.7%€ 64.4m

SLIDE 23
Net sales by segmentPositive performance enjoyed by all segments
Spirits + 10.4% Wines + 22.9%
Soft drinks + 3.0%1H 2004 sales by segment
€ 367.4 m
1H 2003 External Organic Currency 1H 2004
€ 36.4m +9.7%
€ 44.7m+22.9%+14.9%
-1.7%
1H 2003 External Organic Currency 1H 2004
€ 75.5m 0.0%+3.0% 0.0%
€ 77.7m+3.0%
Spirits65.5%
Wines12.2%
Other1.2%
SoftDrinks21.1%
1H 2003 External Organic Currency 1H 2004
€ 217.8m +10.7% +3.8%
-4.1%
€ 240.6m+10.4%

SLIDE 24
Key brands sales performance
Campari15%
CampariSoda11%
SKYY Vodka11%
Crodino9%Cinzano
6%
Aperol4%
Campari Mixx2%
Other soft drinks (6)
12%
Other revenues1%
Ouzo 122%
Brazilian brands4%
Sella&Mosca3%
Jaegermeister (3)
2%
Cynar2%
tequila 1800(3)
6%
Other spirits (4)
8%
Other wines (5)
2%
Notes:
(1) Excl. Campari Mixx(2) Incl. SKYY Vodka (+2.8% at constant exchange) and
SKYY flavoured vodkas (-17.3% at constant exchange)
(3) Agency brand(4) Incl. Whiskies, Zedda Piras(5) Incl. Riccadonna
(6) Incl. carbonated soft drinks, Lipton Ice Tea
Spirits
Wines
Soft drinks
1H 2004 sales by product(in value at actual exchange)
1H 2004/1H 2003 % change in valueat constantexchange
at actual exchange
Spirits Campari (1) +6.0% +4.1% CampariSoda +6.2% +6.2% SKYY (2) -0.7% -10.2% Cynar -1.1% -1.9% Ouzo 12 +10.6% +9.8% Brazilian brands +25.1% +22.6% Jaegermeister (3) -1.1% -1.1% tequila 1800 (3) +30.7% +17.8%
Wines Cinzano sparkling wines +4.9% +3.9% Cinzano vermouths +5.5% +2.2% Sella & Mosca +12.2% +11.7%
Soft drinks Crodino +8.7% +8.7% Carbonated soft drinks -5.3% -5.3%

SLIDE 25
1H 2003stated
1H 2003unallocated
costs (1)
1H 2003restated
External Organic (2) Currency 1H 2004restated
1H 2004unallocated
costs (3)
1H 2004stated
€105.1m+14.9%
€91.5m€ 0m €91.5m
€7.8m+8.5%
€9.2m+10.1%
€(3.4)m-3.7%
€(1.0)m
€104.1m+13.8%
Notes:
(1) Unallocated production costs, relating to new Novi Ligure plant, were recorded in second half-year of 2003(2) 9.0% organic growth (€ 8.2 m) after 1H 2004 unallocated costs
(3) 1H 2004 unallocated production costs relate to new Novi Ligure plant (mainly depreciation charges)
Consolidated trading profitGrowth analysis

SLIDE 26
Consolidated trading profitAnalysis by segment
Spirits + 14.7% Wines - 3.5%
Soft drinks + 19.7%1H 2004 trading profit by segment
€ 105.1 m
1H 2003 External Organic Currency 1H 2004
€ 6.2m +6.0%€ 6.0m-3.5%-3.4%
-6.1%
1H 2003 External Organic Currency 1H 2004
€ 13.5m 0.0%+19.7%
0.0%
€ 16.1m+19.7%
1H 2003 External Organic Currency 1H 2004
€ 71.6m+10.2%
+8.6%
-4.1%
€ 82.2m+14.7%
Spirits78.2%
Wines5.7%
Other0.8%
Soft Drinks15.3%

SLIDE 27
Analysis of P&LMargins on net sales
> Advertising & Promotion down from 20.8% to 19.5% on net revenues
> Amortisation of GW increased to € 17.6m from € 13.9m
> Net financial expenses down to € 3.9m from € 5.0m
1H 2004 1H 2003
€ m % € m %Net sales 367.4 100.0% 332.7 100.0%
Gross margin 218.5 59.5% 198.1 59.5%Trading profit 104.1 28.3% 91.5 27.5%EBIT 58.3 15.9% 56.9 17.1%Pretax profit after minorities 48.7 13.3% 43.6 13.1%Net income 30.9 8.4% 28.0 8.4%
EBITDA 84.7 23.1% 78.9 23.7%
EBITA 75.9 20.7% 70.9 21.3%

SLIDE 28
Cash flow and balance sheet analysis
Cash flow
Dividend
> Total dividend of € 24.7m paid in May 2004. Dividend per shareof € 0.88, in line with past years
> Operating Working Capital at 20.8% of LTM sales at 30 June 2004
> Net financial indebtedness at 30 June 2004: € 303m
> Debt to Equity ratio at 30 June 2004: 55.1%
Balance sheet
1H 2004 FY 2003€ m € m
Cash Flow from operating activities before change in OWC 46.6 106.7
Cash Flow from operating activities 46.6 75.9
Capex (9.4) (12.5)Free Cash Flow 37.2 63.4
SLIDE 29
Outlook and conclusionEnzo Visone, Chief Executive Officer

SLIDE 30
Outlook and conclusion
> Outlook for the second half of 2004 remains unchanged
> Italy: positive performance of all main brands is expected to continue,notwithstanding weak consumer confidence
> Europe: weak performance of German market due to low propensity to consumeand adverse weather conditions is expected to be contrasted by positiveperformance of other major European markets
> US: favourable trend in SKYY Vodka depletions supports a positive outlookalthough the brand continues to face strong competition in premium vodka market.Exchange rate scenario remains uncertain
> Brazil: positive performance of Brazilian business is expected to continue in thesecond half of 2004
> Strong contribution of newly-acquired Barbero brands is expected to continue,with particular reference to the main brand Aperol on the Italian market

SLIDE 31
Supplementary schedules
Schedule - 1 Campari stock performance
Schedule - 2 Shareholders’ structure
Schedule - 3 1H 2004 Consolidated income statement
Schedule - 4 1H 2004 Consolidated balance sheet (invested capital and financing sources)
Schedule - 5 1H 2004 Consolidated balance sheet (asset and liabilities)
Schedule - 6 1H 2004 Consolidated cash flow
Schedule - 7 1H 2004 Currency effects on net sales
Schedule - 8 Average exchange rates
Schedule - 9 Brand portfolio

SLIDE 32
Campari stock performanceSupplementaryschedule - 1
32
33
34
35
36
37
38
39
40
41
42
43
44
45
46
Oct-03 Oct-03 Nov-03 Dec-03 Jan-04 Feb-04 Mar-04 Apr-04 May-04 Jun-04 Jul-04 Aug-04 Sep-04 Oct-04
Pric
e C
ampa
ri st
ock
(Eur
o)
-
1.0
2.0
3.0
4.0
5.0
6.0
7.0
8.0
9.0
10.0
11.0
12.0
13.0
14.0
15.0
16.0
17.0
Equ
ity tu
rnov
er (
mln
Eur
o)
Campari (Equity turnover) Campari (stock price) FTSE 300 Eurotop Beverages (rebased) SP/Mib
Performance last 12 months
Performance in 2004 YTD
Absolute 17.0% 8.6%Relative to Sp/Mib 4.5% 2.2%Relative to FTSE 300 Beverages -1.3% -0.7%
Share price as of 05/10/04: € 41.77Market capitalisation as of 05/10/04 : € 1.2 billion

SLIDE 33
Shareholder structureFree float composition
Notes:(1) Purchase of own shares aimed at servicing the stock option plan
Except for those mentioned above, there are no other shareholders with interests of more than 2% of the share capital who have givennotice to Consob and Davide Campari-Milano S.p.A. according to the Consob regulation 11971/99, Art. 117 regarding obligation to notifymajor holdings
Free float 46%
Supplementaryschedule - 2
Other36.2%
Garavoglia family51.0%
Morgan Stanley Investment
Management2.1%
Treasury (1)3.2%Fidelity Investments
2.0% Lazard Asset Management
2.1%Cedar Rock Capital
3.5%

SLIDE 34
Consolidated income statementSupplementaryschedule - 3
1H 2004 1H 2003 Change€ m % € m % %
Net sales (1) 367.4 100.0% 332.7 100.0% 10.4%Cost of materials (122.4) -33.3% (113.9) -34.2% 7.5%Production costs (26.5) -7.2% (20.7) -6.2% 27.8%Total cost of goods (148.9) -40.5% (134.6) -40.5% 10.6%Gross margin 218.5 59.5% 198.1 59.5% 10.3%Advertising and promotion (71.5) -19.5% (69.2) -20.8% 3.3%Sales and distribution expenses (42.9) -11.7% (37.4) -11.2% 14.9%Trading profit 104.1 28.3% 91.5 27.5% 13.8%General and administrative expenses (26.4) -7.2% (23.7) -7.1% 11.9%Other operating income 0.3 0.1% 3.5 1.1% -91.0%Goodwill and trademark amortisation (17.6) -4.8% (13.9) -4.2% 26.3%Non-recurring costs (2.1) -0.6% (0.5) -0.2% 289.7%EBIT 58.3 15.9% 56.9 17.1% 2.4%Net financial income (expenses) (3.9) -1.1% (5.0) -1.5% -20.1%Income (losses) on net rates 0.0 0.0% (0.5) -0.2%Other non operating income (expenses) 0.6 0.2% 0.0 0.0%Pretax profit 55.0 15.0% 51.4 15.5% 7.0%Minority interests (6.3) -1.7% (7.8) -2.4% -19.9%Pretax profit after minorities 48.7 13.3% 43.6 13.1% 11.8%Taxes (17.8) -4.8% (15.6) -4.7% 13.7%
Net income 30.9 8.4% 28.0 8.4% 10.7%
Depreciation of tangible assets (7.6) -2.1% (6.8) -2.0% 12.7%Amortisation of intangible assets (2) (18.8) -5.1% (15.2) -4.6% 23.7%Total D&A (26.4) -7.2% (22.0) -6.6% 20.3%
EBITDA 84.7 23.1% 78.9 23.7% 7.4%
EBITA (3) 75.9 20.7% 70.9 21.3% 7.1%
Notes:(1) Net of discounts and excise duty(2) Include amortisation of goodwill, trademarks and other intangible assets(3) EBITA = EBIT before amortisation of goodwill and trademarks

SLIDE 35
Consolidated balance sheetInvested capital and financing sources
Supplementaryschedule - 4
30 June 2004 31 December 2003 30 June 2003€ m € m € m
Inventories 125.7 106.4 104.2Trade receivables 177.9 174.2 164.7Trade payables (147.6) (127.6) (117.0)Operating working capital 156.0 153.0 151.9
Other current assets and liabilities (29.1) (34.1) (30.1)Net Working Capital 126.9 118.9 121.8
Employees’ leaving indemnity ("T.F.R") (15.3) (15.6) (13.3)Deferred taxes 2.0 (0.2) 1.8Other non current liabilities (19.0) (21.8) (17.8)Other liabilities (32.3) (37.6) (29.3)
Tangible assets 158.9 152.4 154.2Intangible assets 567.0 571.6 442.5Financial assets 35.8 44.7 42.1Total fixed assets 761.7 768.7 638.8
Invested Capital 856.3 850.0 731.3
Group Equity (550.3) (548.2) (494.2)Minority interest (3.0) (4.7) (4.2)Net financial position (303.0) (297.1) (232.9)
Financing sources (856.3) (850.0) (731.3)

SLIDE 36
Consolidated balance sheet Assets and liabilities
Supplementaryschedule - 5
30 June 2004 31 December 2003 30 June 2003€ m € m € m
Cash and banks 173.5 133.6 55.6Marketable securities 7.8 1.9 1.9Trade receivables 177.9 174.2 164.7Inventories 125.7 106.4 104.2Other current assets 51.7 55.4 39.9
Total current assets 536.6 471.5 366.3
Tangible assets 158.9 152.4 154.2Goodwill, net of depreciation 536.5 552.2 427.6Other intangible fixed assets, net of depreciation 30.3 19.4 14.9Equity investments 0.1 7.8 7.6Other assets 5.8 5.8 3.5Own shares 30.0 31.0 31.0
Total non current assets 761.6 768.6 638.8Total assets 1,298.2 1,240.1 1,005.1
Bank borrowings 52.9 30.1 122.4Trade payables 147.6 127.6 117.0Other current liabilities 70.1 78.1 61.5Total current liabilities 270.6 235.8 300.9
Medium and long term loans 426.9 398.1 165.1Employees’ leaving indemnity ("T.F.R.") 15.3 15.6 13.3Other non current liabilities 32.1 37.7 27.4Minority interests 3.0 4.7 4.2Total non current liabilities 477.3 456.1 210.0
Group Equity 550.3 548.2 494.2Total liabilities and net equity 1,298.2 1,240.1 1,005.1

SLIDE 37
Consolidated cash flow (1/2)Supplementary
schedule - 6
30 June 2004 at constant
perimeter(1)
30 June 2003
31 December 2003
€ m € m € mProfit before taxes 48.8 43.5 120.2Depreciation and amortization 26.4 22.0 47.0Gains on sale of fixed assets (0.4) (0.4) (34.4)Other non cash items 0.4 0.0 10.5Use of provisions (0.6) 0.0 (4.1)Income taxes (17.8) (15.6) (40.3)Provision (payment) for employees' leaving indemnity (0.3) 0.1 (0.1)Deferred taxes 1.2 (1.8) 3.2Net change in tax credits and liabilities (15.4) 10.9 5.3Net change in other assets and liabilities, other than OWC 4.4 0.7 (0.5)Cash flow generated by operating activitiesbefore net change in operating working capital 46.6 59.5 106.7Trade receivables (2.8) (28.0) (19.0)Inventories (16.9) (9.9) (6.3)Trade payables 19.7 (0.1) (5.4)Net change in Operating Working Capital (0.0) (37.9) (30.8)Cash flow generated by operating activities 46.6 21.5 75.9Acquisition of tangible fixed assets (8.8) (16.5) (28.4)Payables to suppliers for Novi Ligure investments 0.0 (17.0) (17.0)Income from disposals of tangible fixed assets 1.0 1.0 40.3Acquisition of intangible fixed assets (12.9) (4.2) (7.4)Acquisition of new subsidiaries, net of cash acquired (2) (2.8) 0.0 (155.6)Net change in equity investments 0.7 1.1 0.3Acquisition of own shares 1.0 0.0 0.0Net change in marketable securities (5.9) 2.4 2.3Change in financial receivables 0.5 0.0 0.1Change in minority interests (1.6) (5.8) 0.7Net cash flow generated by investing activities (28.9) (39.1) (164.8)
SLIDE 38
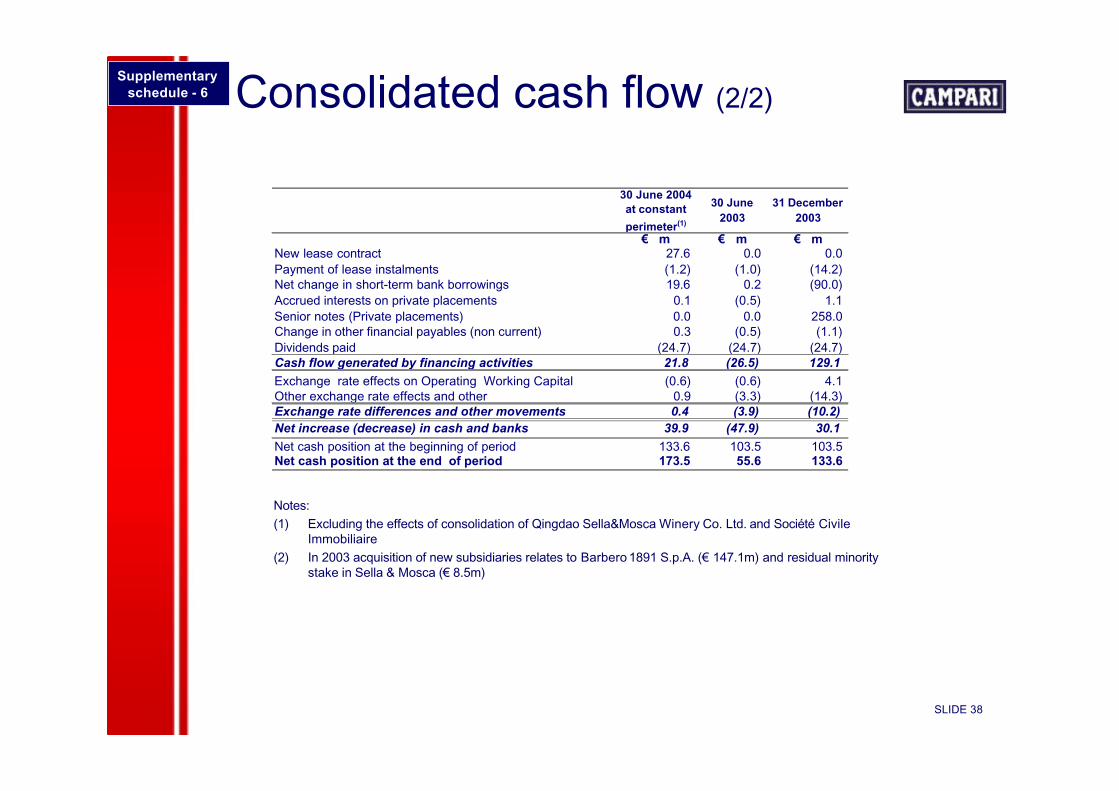
Consolidated cash flow (2/2)Supplementary
schedule - 6
Notes:(1) Excluding the effects of consolidation of Qingdao Sella&Mosca Winery Co. Ltd. and Société Civile
Immobiliaire(2) In 2003 acquisition of new subsidiaries relates to Barbero 1891 S.p.A. (€ 147.1m) and residual minority
stake in Sella & Mosca (€ 8.5m)
30 June 2004 at constant
perimeter(1)
30 June 2003
31 December 2003
€ m € m € mNew lease contract 27.6 0.0 0.0Payment of lease instalments (1.2) (1.0) (14.2)Net change in short-term bank borrowings 19.6 0.2 (90.0)Accrued interests on private placements 0.1 (0.5) 1.1Senior notes (Private placements) 0.0 0.0 258.0Change in other financial payables (non current) 0.3 (0.5) (1.1)Dividends paid (24.7) (24.7) (24.7)Cash flow generated by financing activities 21.8 (26.5) 129.1Exchange rate effects on Operating Working Capital (0.6) (0.6) 4.1Other exchange rate effects and other 0.9 (3.3) (14.3)Exchange rate differences and other movements 0.4 (3.9) (10.2)Net increase (decrease) in cash and banks 39.9 (47.9) 30.1Net cash position at the beginning of period 133.6 103.5 103.5Net cash position at the end of period 173.5 55.6 133.6

SLIDE 39
Currency effectsNet sales
Supplementaryschedule - 7
Consolidated net sales by segment1H 2004 1H 2003 Change of which:
€ m % € m % % external organic currencySpirits 240.6 65.5% 217.8 65.5% 10.4% 10.7% 3.8% -4.1%Wines 44.7 12.2% 36.4 10.9% 22.9% 9.7% 14.9% -1.7%Soft drinks 77.7 21.1% 75.5 22.7% 3.0% 0.0% 3.0% 0.0%Other revenues 4.4 1.2% 3.0 0.9% 44.9% 67.8% -21.8% -1.1%Total 367.4 100% 332.7 100% 10.4% 8.7% 4.6% -2.9%
Consolidated net sales by region1H 2004 1H 2003 Change of which:
€ m % € m % % external organic currencyItaly 200.7 54.6% 169.1 50.8% 18.6% 13.7% 4.9% 0.0%Europe 62.7 17.1% 64.4 19.4% -2.7% 7.4% -9.4% -0.7%Americas (1) 95.0 25.9% 94.3 28.4% 0.7% 0.3% 9.3% -8.9%RoW 9.0 2.5% 4.8 1.4% 88.1% 14.1% 89.8% -15.8%Total 367.4 100% 332.7 100% 10.4% 8.7% 4.6% -2.9%
(1) Breakdown of Americas1H 2004 1H 2003 Change of which:
€ m % € m % % external organic currencyUSA 69.9 73.5% 73.1 77.5% -4.5% 0.0% 6.1% -10.6%Brazil 20.6 21.7% 17.9 19.0% 15.3% 0.0% 17.6% -2.3%Other countries 4.5 4.8% 3.3 3.5% 36.0% 8.0% 35.5% -7.5%Total 95.0 100% 94.3 100% 0.7% 0.3% 9.3% -8.9%

SLIDE 40
Average exchange ratesHistoric rates
Supplementaryschedule - 8
1H 2004 1H 2003 % change
Brazilian Real : 1 Euro 3.642 3.569Euro : 1 Brazilian Real 0.2746 0.2802 -2.0%
US dollar : 1 Euro 1.228 1.105Euro : 1 US dollar 0.8145 0.9050 -10.0%
1Q 2004 1Q 2003 % change
Brazilian Real : 1 Euro 3.622 3.750Euro : 1 Brazilian Real 0.2761 0.2667 3.5%
US dollar : 1 Euro 1.251 1.073Euro : 1 US dollar 0.7995 0.9316 -14.2%
2Q 2004 2Q 2003 % change
Brazilian Real : 1 Euro 3.662 3.389Euro : 1 Brazilian Real 0.2731 0.2951 -7.5%
US dollar : 1 Euro 1.205 1.137Euro : 1 US dollar 0.8299 0.8797 -5.7%

SLIDE 41
2004 - Own brands
Wines Soft
RTDSpirits
Supplementaryschedule - 9

SLIDE 42
2004 - Third party brandsSupplementary
schedule - 9

For additional information:Investor Relations - Gruppo Campari
Phone: +39 02 6225 330; Fax: +39 02 6225 479E-mail: [email protected]; Website: www.campari.com/ir
Top Related