


Languages
Pages
Legal

I N V E S T O R P R E S E N T A T I O N
May 2018
Hafslund
Disclaimer
Certain statements included within this presentation contain (and oral communications made by or on behalf of Hafslund may contain)
forward-looking information, including, without limitation, those relating to (a) forecasts, projections and estimates, (b) statements of
managements' plans, objectives and strategies for Hafslund, such as planned expansions and investments, (c) targeted volumes and costs,
capacities or rates, start-up costs, cost reductions and profit objectives, (d) various expectations about future developments in Hafslund's
markets and governmental regulations, (e) results of operations, (f) margins, (g) growth rates, (h) risk management, as well as (i)
statements preceded by "expected", "scheduled", "targeted", "planned", "propose", "intended" or similar statements.
Although Hafslund believes that the expectations reflected in such forward-looking statements are reasonable, these forward-looking
statements are based on a number of assumptions and forecasts that, by their nature, involve risk and uncertainty. Various factors could
cause Hafslund’s actual results to differ materially from those projected in a forward-looking statement or affect the extent to which a
particular projection is realized. Factors that could cause these differences include, but are not limited to, world economic growth and other
economic indicators, including rates of inflation and industrial production, trends in Hafslund's key markets, energy prices and changes in
governmental regulations.
No assurance can be given that such expectations will prove to have been correct. Hafslund disclaims any obligation to update or revise
any forward-looking statement, whether as a result of new information, future events or otherwise.
2
Agenda
3
• Overview of Hafslund
• The grid industry in Norway
• Hafslund Networks
• Debt structure
• Financials
• Summary
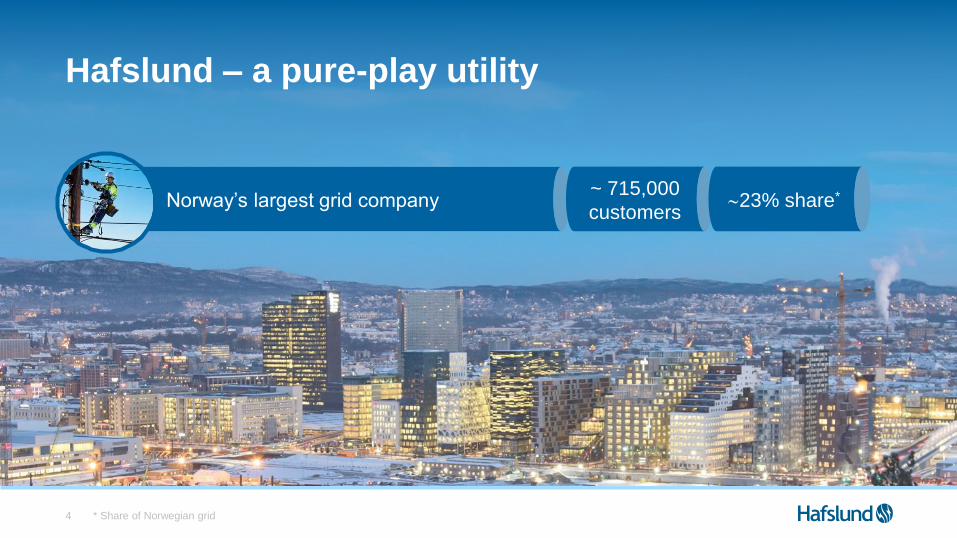
Hafslund – a pure-play utility
* Share of Norwegian grid4
Norway’s largest grid company~ 715,000
customers23% share*

More than 100 years of history
5
1986
Nycomed part of
Hafslund
1898
Hafslund
established
1996
De-merger
Hafslund
Nycomed
2002-2005
• Restructuring
• Integration
• Value creation
2008
• Focus on
renewable
energy
• Spin off:
Infratek
2008-2012
• Established
power sales in
the Nordics
• Spin off:
Security, REC,
venture, fiber,
etc.
2013 -
• An integrated
and focues
energy
company
2014
• Acquisition of
Fortum’s
network
business in
Norway
• Strengthened
focus on
powersales
Sweden and
Finland
2017
• City of Oslo de-
listed Hafslund
and sold
Production, Heat
and Markets to
E-CO and
Fortum
• Hafslund
restructured to a
pure-play grid
company

The restructuring of Hafslund facilitates organic and structural growth
The restructuring of Hafslund
* Full stock exchange notice can be found here: https://newsweb.oslobors.no/message/447015 and the press article from the City of Oslo
can be found here: https://www.oslo.kommune.no/politikk-og-administrasjon/politikk/byradet/for-pressen/pressemeldinger/6
Proposed re-organisationHafslund today
100 %
The City of Oslo
Networks
Hafslund prior to 4 August 2017
MARKETSPRODUCTION
NETWORKS HEAT
NewCo
City of Oslo
• The combined ownership of Hafslund and E-CO is
subject to approval by the City Council of Oslo and
necessary approvals from regulatory authorities.
• The combined ownership is expected to be completed
in second quarter 2018.*
100 %
100 %100 %

Details on the restructuring
The restructuring of Hafslund was completed on 4 August 2017
1 E-CO: Production: http://www.e-co.no/Norsk/Forside/Om_E-CO/
2 Fortum: No. of power sales customers: http://apps.fortum.fi/investors/Fortum_Q1_2017_Interim_Report.pdf7
Heat Markets
100 %100 %
100 %
50 %
10 %
Structure prior to transaction Structure after 4 August 2017
Networks
100 %
50 %100 %
Other
shareholders
100 % 54 % 34 % 12 %
Networks Production Heat Markets KEA
KEA
0.7 mill customers 1.7 TWh 1.1 + 1.35 mill customers2
*
0.7 mill customers 3.1 TWh* 1.7 TWh 1.1 mill customers* 3.1 + 10 TWh1
Production
90 %
The City of OsloThe City of Oslo
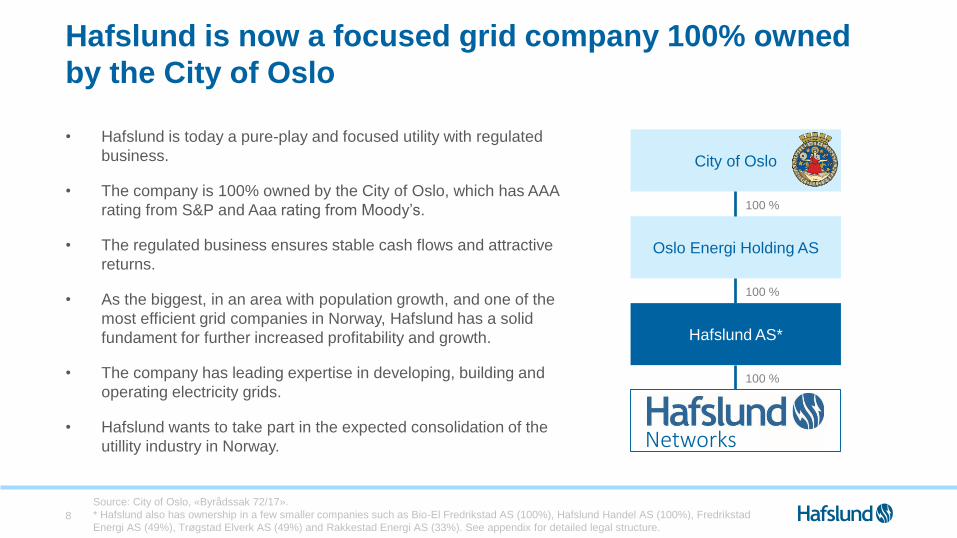
Hafslund is now a focused grid company 100% owned
by the City of Oslo
• Hafslund is today a pure-play and focused utility with regulated
business.
• The company is 100% owned by the City of Oslo, which has AAA
rating from S&P and Aaa rating from Moody’s.
• The regulated business ensures stable cash flows and attractive
returns.
• As the biggest, in an area with population growth, and one of the
most efficient grid companies in Norway, Hafslund has a solid
fundament for further increased profitability and growth.
• The company has leading expertise in developing, building and
operating electricity grids.
• Hafslund wants to take part in the expected consolidation of the
utillity industry in Norway.
Source: City of Oslo, «Byrådssak 72/17».
* Hafslund also has ownership in a few smaller companies such as Bio-El Fredrikstad AS (100%), Hafslund Handel AS (100%), Fredrikstad
Energi AS (49%), Trøgstad Elverk AS (49%) and Rakkestad Energi AS (33%). See appendix for detailed legal structure.8
City of Oslo
Oslo Energi Holding AS
Hafslund AS*
Hafslund Nett AS
100 %
100 %
100 %
Networks
Agenda
9
• Overview of Hafslund
• The grid industry in Norway
• Hafslund Networks
• Debt structure
• Financials
• Summary

The Norwegian grid industry is highly fragmented
Hafslund is by far the largest grid company in Norway
* RAB = regulated asset base (Nw. Avkastningsgrunnlag / NVE-kapital)
Source: NVE, income calculation for 2018 based on 2016 figures, excluding Statnett (TSO).10
0
1
2
3
4
5
6
7
8
9
1 5 9
13
17
21
25
29
33
37
41
45
49
53
57
61
65
69
73
77
81
85
89
93
97
10
1
10
5
10
9
11
3
11
7
12
1
12
5
12
9
13
3
13
7
RA
B*
(NO
K b
n)
Norway has a total of 130 grid companies The 10 largest grid companies in Norway (2016)
Hafslund (2017)
RAB: NOK 9,8 bn
Median RAB of
NOK ~100 mill
Hafslund (2017)
RAB: NOK 9,8 bn
2,0
TR
ØN
DE
RE
NE
RG
I
1,9
4,3
EID
SIV
A
LY
SE
SK
AG
ER
AK
BK
K
3,53,1
4,1
AG
DE
R
NT
E
2,01,7
TR
OM
S
HA
UG
ALA
ND
HA
FS
LU
ND
9,8
5,3

There is still potential for further growth
Source: company websites11
Hafslund is one of the largest grid companies
in the Nordics… …but is small in an European context
Over 26 mill. grid customers
3.2 mill. grid customers
35 mill. grid customers
35 mill. grid customers
13.2 mill. grid customers
7.8 mill. grid customers
709,000
+40%
HafslundVattenfall
930,000
870,000
990,000
Radius Elnet
910,000
EllevioE.ON
13 mill. grid customers
Number of customers
Hafslund is one of the most efficient grid companies in Norway
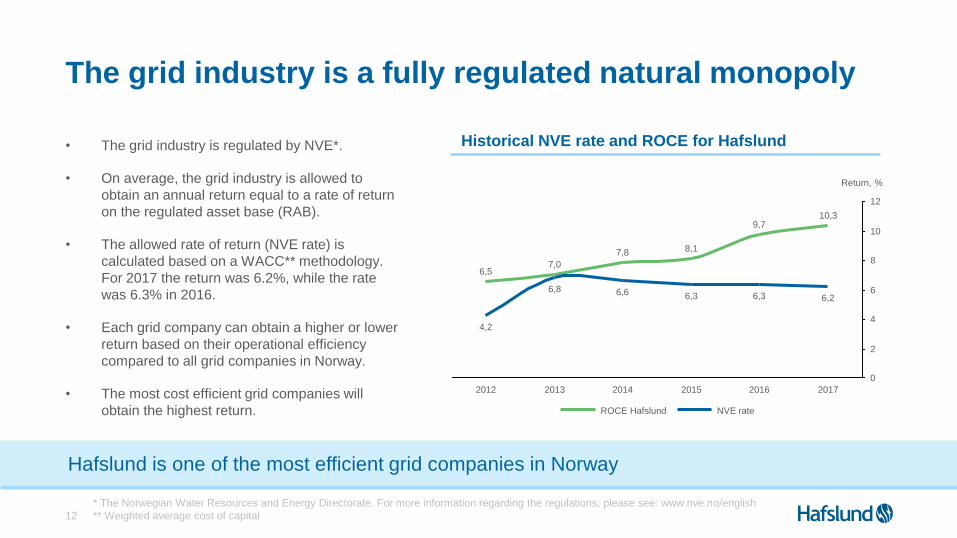
The grid industry is a fully regulated natural monopoly
• The grid industry is regulated by NVE*.
• On average, the grid industry is allowed to
obtain an annual return equal to a rate of return
on the regulated asset base (RAB).
• The allowed rate of return (NVE rate) is
calculated based on a WACC** methodology.
For 2017 the return was 6.2%, while the rate
was 6.3% in 2016.
• Each grid company can obtain a higher or lower
return based on their operational efficiency
compared to all grid companies in Norway.
• The most cost efficient grid companies will
obtain the highest return.
* The Norwegian Water Resources and Energy Directorate. For more information regarding the regulations, please see: www.nve.no/english
** Weighted average cost of capital12
0
4
8
6
2
10
12
6,2
2016
9,7
6,6
20152014
7,8
6,8
2013
10,3
2017
6,36,3
8,1
Return, %
2012
7,0
4,2
6,5
ROCE Hafslund NVE rate
Historical NVE rate and ROCE for Hafslund
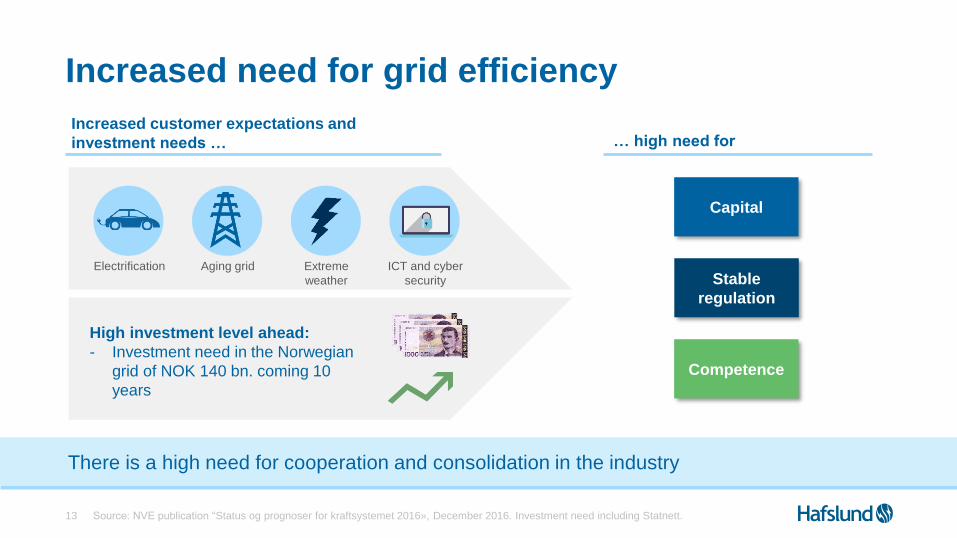
There is a high need for cooperation and consolidation in the industry
Increased need for grid efficiency
Source: NVE publication “Status og prognoser for kraftsystemet 2016», December 2016. Investment need including Statnett.13
Increased customer expectations and
investment needs … … high need for
High investment level ahead:
- Investment need in the Norwegian
grid of NOK 140 bn. coming 10
years
Capital
Competence
Stable
regulation
Electrification Aging grid Extreme
weather
ICT and cyber
security

Regulatory trend towards more separation between grid business and other businesses in the utility value chain
Solid and stable regulatory framework
* In Norway, there is three grid levels; Central grid, regional grid and distribution grid. The TSO, Statnett owns the central grid, while the ~130 grid
companies own the regional grid and distribution grid. 14
ProductionCentral grid/
Statnett
Distribution
grid*Retail
CustomerDownstreamUpstream
Enterprise
Private
Power Exchange
Agenda
15
• Overview of Hafslund
• The grid industry in Norway
• Hafslund Networks
• Debt structure
• Financials
• Summary

* RAB = regulated asset base; ROCE = return on capital employed16
Key data
Number of customers ~715,000
Energy delivered 2017 19.6 TWh
Share of Norwegian grid ~ 23%
RAB 2017 NOK 9.8 bn.
ROCE 2017 10.3%
Efficiency score 2018 (e) 113%
Regulated revenue 2018 (e) NOK 2.9 bn.
Snapshot
• Critical infrastructure
• Located in the extended Oslo region,
with significant population growth
• Regional and distribution grid
• Natural monopoly, fully regulated
through the Energy Act
• One of Norway’s most efficient grid
operators with high uptime
Hafslund: The largest grid operator in Norway

17
Priorities: Growth and operational efficiency
Hafslund’s network area
AMS
Hafslund to invests NOK 2.1
billion in AMS to 700‘ customers
by 2019
Organic growth
- Automatic meters (AMS)
- Reinvestments in the grid
- Population growth
Structural growth
- Primarily in geographical proximity
Operational efficiency
- High uptime and low costs
- Exploit benefits of digitalization
- Leading competence environment
AreaStrategic priorities
Target:
The best grid company in Norway
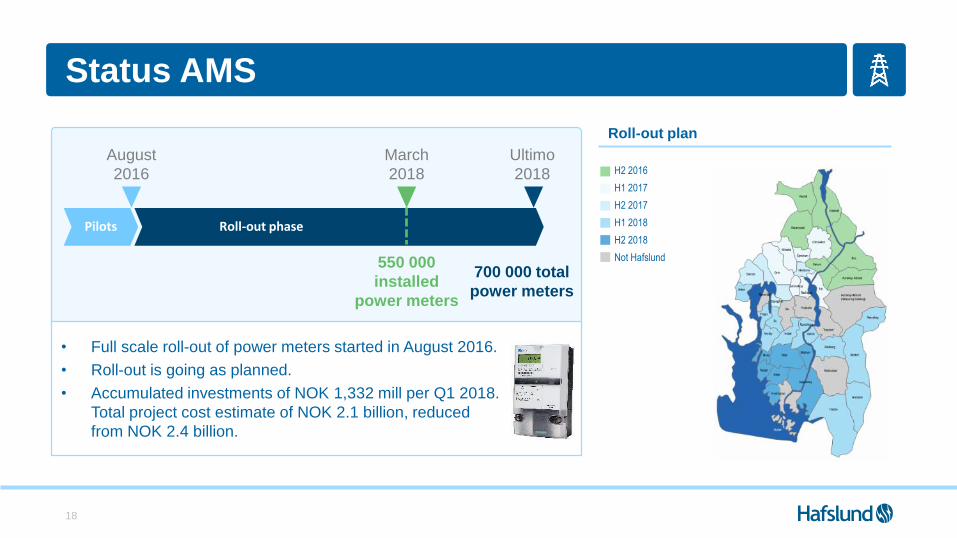
Status AMS
18
Roll-out phase
700 000 total
power meters
August
2016
• Full scale roll-out of power meters started in August 2016.
• Roll-out is going as planned.
• Accumulated investments of NOK 1,332 mill per Q1 2018.
Total project cost estimate of NOK 2.1 billion, reduced
from NOK 2.4 billion.
Pilots
March
2018
Ultimo
2018
550 000
installed
power meters
Roll-out plan
H2 2016
H1 2017
H2 2017
H1 2018
H2 2018
Not Hafslund

There is further potential for improved operations, investments and development of a modern power grid in eastern Norway. Hafslund seeks both organic and structural growth.
Strong track record from grid acquisition in 2014
19
Today Hafslund owns both the regional and distribution
grid in Oslo, Akershus and most of Østfold
Grid in Østfold:
- 100,000 customers
- NOK 1 bn in RAB
✓ NOK 60 mill. in
reduced operational
costs annually
✓ Increased
competence
✓ Improved
coordination
Hafslund Networks Hafslund Networks
Until 2014 Fortum owned most of the distribution grid in the
county of Østfold, while Hafslund owned the regional grid

A robust grid is key for green and sustainable solutions
Source: Ruters annual report 2015, SSB.no 20
Population growth and
electrification
Increased share of
renewable energy
• A robust grid is required to ensure
efficient deployment of all
renewable power generation, both
in Norway and in Europe.
• Higher degree of variable
renewable power into the system
requires more capacity and
smarter grids.
Smart grid and
smart cities
• A strong grid is needed to meet
the increased power demand due
to population growth and
electrification.
• Electrification of transport can
alone reduce Oslo's emissions by
up to 900,000 tons of CO2
annually.
• Smart cities and smart grids are
essential to meet tomorrow's
renewable society.
• Digitalization of the network will
increase the quality of power
supplied and facilitate increased
energy savings.

Agenda
21
• Overview of Hafslund
• The grid industry in Norway
• Hafslund Networks
• Debt structure
• Financials
• Summary

All the interest-bearing debt was moved to Hafslund AS as part of the restructuring. Hafslund AS has after the restructuring established a new revolving credit facility of NOK 2.5 bn, providing Hafslund with a robust financing structure with sufficient liquidity to cover at least the next 12 months’ maturities.
Loan portfolio Hafslund AS after restructuring
NIBD = net interest-bearing debt; EBITDA estimated last twelve months as per 30 December 2017 for Hafslund AS including subsidiaries.22
Interest-bearing debt per category as of 31 March 2018
(MNOK)
Cash
1,447
Bonds
1,742
Bank loans
5,148
Net interest
bearing debt
5,443
Key metrics loan portfolio
MNOK March 18
Gross interest-bearing debt 6,890
Net interest-bearing debt 5,443
Average coupon rate 2.7%
Average time to maturity 3.2 years
Share of fixed interest rate 33%
NIDB / EBITDA 3,3x
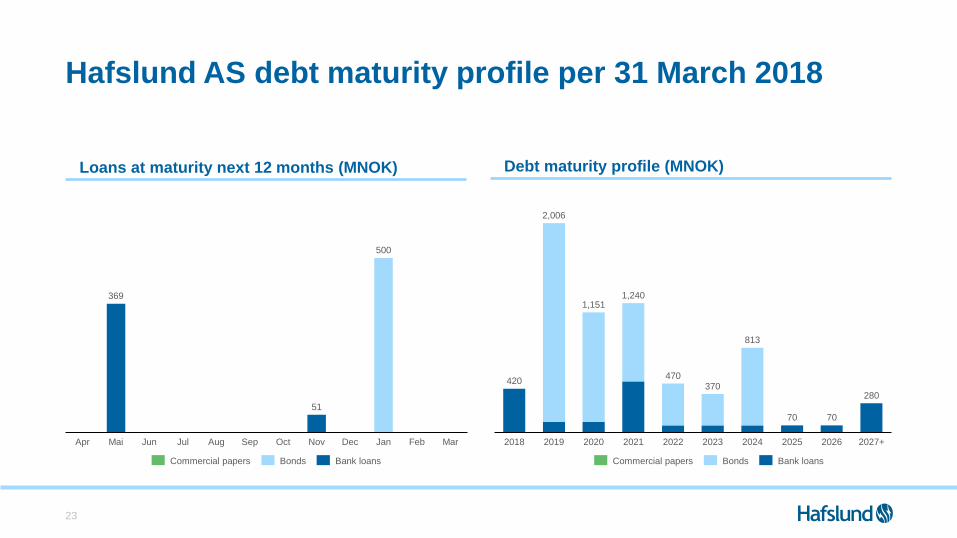
Hafslund AS debt maturity profile per 31 March 2018
23
Loans at maturity next 12 months (MNOK) Debt maturity profile (MNOK)
51
500
JulJunApr Mai Aug FebSep Oct Nov Dec
369
Jan Mar
Commercial papers Bonds Bank loans
420
70 70
280
2020
2,006
2018 2019 20222021 2023 2024 2025 2026 2027+
1,1511,240
470370
813
Commercial papers Bank loansBonds

Information from the City of Oslo regarding the debt
structure in Hafslund AS
24
City of Oslo stock exchange notice on 26 April:
“Hafslund AS will own Distribution as a fully
regulated grid company, and ensure stabile future
earnings for its owners and lenders. The Company
will aim to maintain a credit profile which will form
basis for borrowing terms and conditions
comparable with those of Hafslund ASA today. It is
expected that all existing interest-bearing debt in
Hafslund ASA is transferred to Hafslund AS and
that parts of this debt will be redeemed to achieve
the desired balance sheet, dividend capacity and
creditworthiness for Hafslund AS.”
Summons to bond holder meetings on 13 June:
The City of Oslo has not resolved a cash dividend from Hafslund AS to
the City of Oslo in 2017, after completion of the announced transactions.
Furthermore, it is the City of Oslo's assessment that the estimated cash
holdings in Hafslund AS specified in the balance sheet will be sufficient
to reduce the gross interest-bearing debt so that Hafslund AS as a well-
established grid company can maintain comparable borrowing terms
with today's Hafslund ASA. Gross interest-bearing debt is expected to
become approximately equal to net interest-bearing debt during the first
half of 2018. Hafslund AS' capital need will increase somewhat by the
end of 2018, partly due to the completion of the rollout of automatic
meters (the AMS project). It is not expected that the net interest-bearing
debt / EBITDA in Hafslund AS will exceed 5x.
Agenda
25
• Overview of Hafslund
• The grid industry in Norway
• Hafslund Networks
• Debt structure
• Financials
• Summary

Historical financials – Hafslund AS (I)
Hafslund AS figures includes the reported business area Networks and Other business for Hafslund AS
Source: Hafslund ASA annual report 201626
2 000
1 600
400
800
-400
1 200
0
1 659
1 654
1 435121
1 045
2012
980
2013
54
2016
1 314
1 161
1 107
-65
2017
1 388
197
20152014
-41
1 5851 634
1 675
5
Other business NetworksHafslund AS
Historical EBITDA – Hafslund AS (MNOK)
Other business primarily includes:
• Staff and support functions.
• Embriq (sold 2015).
• Incineration plants Østfold (partly
sold in 2015 and 2016, only Bio-El
Fredrikstad left from 2017).
• Results from affiliated companies;
Fredrikstad Energi (49%), Trøgstad
Elverk (49%) and Rakkestad
Energi (33%).
Acquisition of Fortum
Distribution AS in 2014
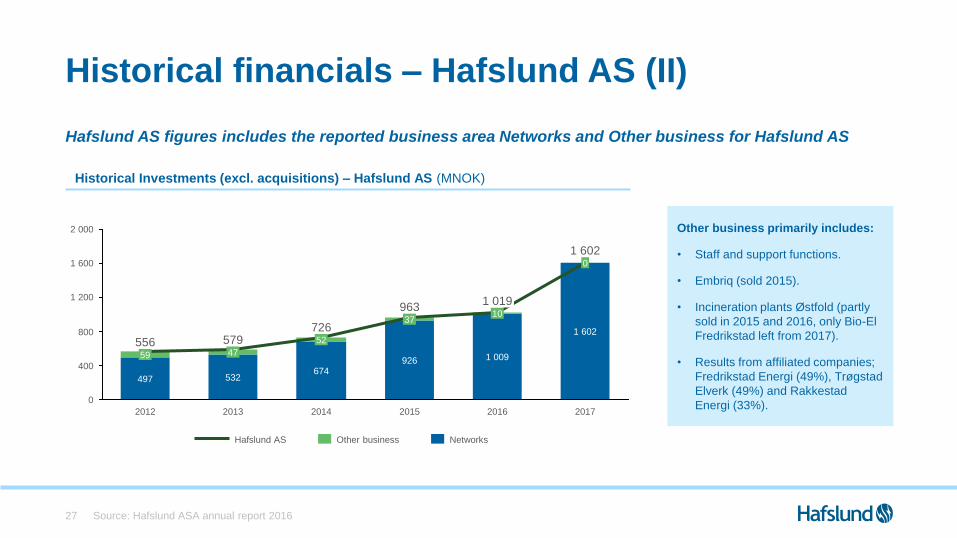
Historical financials – Hafslund AS (II)
Hafslund AS figures includes the reported business area Networks and Other business for Hafslund AS
Source: Hafslund ASA annual report 201627
1 600
2 000
0
800
400
1 200
579726 1 602
2017
37
674
0
963
1 602
926
20142013 2015
52
532
47
2012
556
497
59
10
1 019
2016
1 009
Hafslund AS Other business Networks
Historical Investments (excl. acquisitions) – Hafslund AS (MNOK)
Other business primarily includes:
• Staff and support functions.
• Embriq (sold 2015).
• Incineration plants Østfold (partly
sold in 2015 and 2016, only Bio-El
Fredrikstad left from 2017).
• Results from affiliated companies;
Fredrikstad Energi (49%), Trøgstad
Elverk (49%) and Rakkestad
Energi (33%).

Consolidated balance sheet Hafslund AS per
31 March 2018
* Balance sheet prior to the restructuring.28
NOK million 31.03.18 31.12.17 30.09.17
Intangible assets 624 624 624
Property, plant and equipment 12,095 11,937 11,610
Financial assets 319 321 336
Receivables and inventories 664 1,335 720
Cash and cash equivalents 1,447 1,105 2,066
Assets 15,149 15,323 15,355
Equity (controlling interests) 4,916 4,762 4,656
Equity (attributable to minority) 0 0 0
Provisions 1,076 1,224 1,167
Long-term interest-bearing liabilities 5,951 6,462 6,504
Current interest-bearing liabilities 939 1,197 1,803
Current non-interest-bearing liabilities 2,267 1,678 1,225
Liabilities and equity 15,149 15,323 15,355
Equity share 32% 31% 30%
Net debt / EBITDA 3,3x 4.0x 3.9x

Hafslund Network – solid historical performance
Source: Hafslund annual report 2016 and Q4 2017 report.29
Network: NVE rate and regulated asset base (RAB) Network: Return on capital employed (ROCE)
Network: EBITDA* Network: Investments
Acquisition of Fortum
Distribution AS
8
10
0
12
4
8
2
10
66
0
2
4 6.26.8
6.36.6
4.2
6.3
%NOKb
8.8
2015
7.97.6
2013 20172014
9.8
20162012
6.1 6.3
NVE-rate RAB
6
8
4
2
0
12
10
2014
7.87.0
8.1
2012
10.3
2013
6.5
2015 2016
9.7
2017
%
ROCE
0,0
1,0
2,0
1,5
0,5
NOKb
2017
1,0 1,1
2012
1,7
2016
1,4
2013
1,7
20152014
1,3
EBITDA
1.0
2.0
1.5
0.0
0.5
1.0
NOKb
1.6
2016 2017
0.7
0.5
2013
0.5
2014
0.9
2012 2015
Acquisitions Investments
Agenda
30
• Overview of Hafslund
• The grid industry in Norway
• Hafslund Networks
• Debt structure
• Financials
• Summary

Hafslund – a pure-play utility
31
• The largest grid company in Norway with
709,000 customers
• Natural monopoly and fully regulated business
• High operational efficiency and stable returns
• Solid cash flow and strong credit metrics
• Seeking organic and structural growth
• 100% owned by the City of Oslo, rated AAA
by S&P and Aaa by Moody’s
Summary
Robust capital
structure
Profitable growth
Health, Safety and Environment
High operational
efficiency
Sustainable
solutions
Stable
regulations
Key priorities
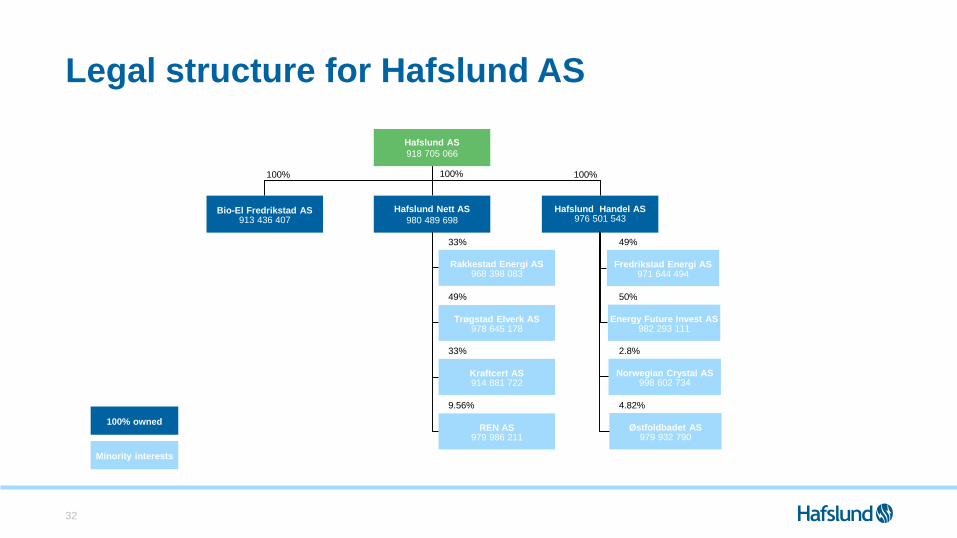
Legal structure for Hafslund AS
32
Fredrikstad Energi AS971 644 494
Energy Future Invest AS982 293 111
49%
Norwegian Crystal AS998 602 734
2.8%
50%
Østfoldbadet AS979 932 790
4.82%
Hafslund AS
918 705 066
Rakkestad Energi AS968 398 083
Trøgstad Elverk AS978 645 178
33%
49%
Kraftcert AS914 881 722
33%
Hafslund Handel AS976 501 543
Bio-El Fredrikstad AS913 436 407
Hafslund Nett AS
980 489 698
100% 100%100%
REN AS979 986 211
9.56%
100% owned
Minority interests
Additional information
• Additional information is available from Hafslund’s website:
www.hafslund.no
• CFO, Heidi Ulmo
Tel: + 47 909 19 325
• Head of Finance and Investor Relations, Martin S. Lundby
Tel: +47 416 14 448
33

Top Related