


Languages
Pages
Legal


HAL Id: hal-00611657https://hal.archives-ouvertes.fr/hal-00611657
Submitted on 26 Jul 2011
HAL is a multi-disciplinary open accessarchive for the deposit and dissemination of sci-entific research documents, whether they are pub-lished or not. The documents may come fromteaching and research institutions in France orabroad, or from public or private research centers.
L’archive ouverte pluridisciplinaire HAL, estdestinée au dépôt et à la diffusion de documentsscientifiques de niveau recherche, publiés ou non,émanant des établissements d’enseignement et derecherche français ou étrangers, des laboratoirespublics ou privés.
Investigation of mercury concentrations in fur of phocidseals using stable isotopes as tracers of trophic levels
and geographical regionsAurore Aubail, Jonas Teilmann, Rune Dietz, Frank Rigét, Tero Harkonen,
Olle Karlsson, Aqqalu Rosing-Asvid, Florence Caurant
To cite this version:Aurore Aubail, Jonas Teilmann, Rune Dietz, Frank Rigét, Tero Harkonen, et al.. Investigation ofmercury concentrations in fur of phocid seals using stable isotopes as tracers of trophic levels andgeographical regions. Polar Biology, Springer Verlag, 2011, 34 (9), pp.1411-1420. �10.1007/s00300-011-0996-z�. �hal-00611657�
1
Investigation of mercury concentrations in fur of phocid seals using stable isotopes as tracers
of trophic levels and geographical regions
Aurore Aubail a, b,
*, Jonas Teilmann a, Rune Dietz a, Frank Rigét
a, Tero Harkonen
c, Olle Karlsson
c,
Aqqalu Rosing-Asvid d, Florence Caurant
b
a National Environmental Research Institute, Aarhus University, Frederiksborgvej 399, P.O. Box 358, DK-4000 Roskilde, Denmark
b Littoral, Environnement et Sociétés (LIENSs), UMR 6250, CNRS-Université de La Rochelle, 2 rue Olympe de Gouges, F-17042 La
Rochelle cedex, France
c Department of Contaminant Research, Swedish Museum of Natural History, P.O. Box 50007, S-10405 Stockholm, Sweden
d Greenland Institute of Natural Resources, P.O. Box 570, 3900 Nuuk, Greenland
* Corresponding author:
E-mail address: [email protected]
Tel.: +33 546507629; Fax.: +33 546458264

2
Abstract
Recent studies have shown that the complementary analysis of mercury (Hg) concentrations and
stable isotopic ratios of nitrogen (δ15
N) and carbon (δ13
C) can be useful for investigating the trophic
influence on the Hg exposure and accumulation in marine top predators. In this study, we propose
to evaluate the interspecies variability of Hg concentrations in phocids from polar areas and to
compare Hg bioaccumulation between both hemispheres. Mercury concentrations, δ15
N and δ13
C
were measured in fur from 85 individuals representing 7 phocidae species, a Ross seal
(Ommatophoca rossii), Weddell seals (Leptonychotes weddellii), crabeater seals (Lobodon
carcinophaga), harbour seals (Phoca vitulina), grey seals (Halichoerus grypus), ringed seals (Phoca
hispida), and a bearded seal (Erignathus barbatus), from Greenland, Denmark and Antarctica. Our
results showed a positive correlation between Hg concentrations and δ15
N values among all
individuals. Seals from the Northern ecosystems displayed greater Hg concentrations, δ15
N and δ13
C
values than those from the Southern waters. Those geographical differences in Hg and stable
isotopes values were likely due to higher environmental Hg concentrations and somewhat greater
number of steps in Arctic food webs. Moreover, dissimilarities in feeding habits among species
were shown through δ15
N and δ13
C analysis, resulting in an important interspecific variation in fur
Hg concentrations. A trophic segregation was observed between crabeater seals and the other
species, resulting from the very specific diet of krill of this species and leading to the lowest
observed Hg concentrations.
Key words: Hg, nitrogen, carbon, hair, Arctic, Antarctica

3
Introduction
Mercury (Hg) is a global contaminant released into the ecosystem from both natural and
anthropogenic sources (Pacyna et al. 2006). The gaseous elemental form of this metal is very
volatile, and once in the atmosphere, it can be transported from mid to high latitudes over long
distances, and thereby reach the polar regions (Brooks et al. 2005). Although Hg is partly re-emitted
to the air, it is accumulated in organisms and biomagnified in the trophic chain in polar ecosystems
(Atwell et al. 1998; Bargagli et al. 1998). Thus, organisms feeding on species at high trophic levels
generally show greater Hg concentrations than those feeding on species at lower trophic levels.
Since marine mammals mainly are exposed to Hg through their diet (Aguilar et al. 1999),
differences in foraging strategies and feeding habits among species may lead to differences in
exposure to Hg, resulting in interspecific disparities in concentrations of Hg.
Biological factors like age, sex or physiological status are known to influence the diet, and thereby,
the exposure and accumulation of Hg in many species. However, differences in Hg concentrations
can also result from geographical or temporal variations in the environmental levels of Hg. Whether
differences in Hg concentrations among species result from differences in diet or environmental
levels of Hg can be investigated by analysing naturally occurring variations in stable isotopes of
nitrogen (15
N and 14
N) and carbon (13
C and 12
C) (Hobson and Welch 1992). The underlying
principle is that ratios of heavier vs lighter isotopes of nitrogen and carbon in tissues of predators
can be traced to those of their prey as these two elements are assimilated through the diet.
Consumer tissues are stepwise enriched in 15
N relative to those of their prey, and consequently,
δ15
N measurements can be used to determine the trophic position of organisms (Minagawa and
Wada 1984). In contrast, δ13
C values vary little through the food chain (<1‰), and can thus help to
determine the source of carbon used by primary consumers in a food web, and provide information
on the foraging habitat of the studied organisms (Fry and Sherr 1984). Furthermore, turn over rates
of stable isotopes in tissues vary with the metabolic rate of the tissue (Tieszen et al. 1983), and
isotopic analyses can give information on feeding habits over the last days, weeks, months or years,
depending on which tissue types are analysed.
Phocid seals are long-lived marine mammals at the top of food chains in polar ecosystems. Using
stable isotopes of nitrogen and carbon as tracers of the trophic level and habitat use respectively, we
investigated if concentrations of Hg in seal species from different geographical areas could be used
to determine the trophic levels they prey upon. We studied a Ross seal (Ommatophoca rossii),
Weddell seals (Leptonychotes weddellii) and crabeater seals (Lobodon carcinophaga) from
4
Antarctic regions, harbour seals (Phoca vitulina) and grey seals (Halichoerus grypus) found
throughout coastal regions of the Northern hemisphere, and ringed seals (Phoca hispida) and a
bearded seal (Erignathus barbatus), which both show Northern circumpolar distributions (Reeves et
al. 1992).
While the Ross seal has a varied diet based on squid, fish and krill, and the Weddell seal mainly
feeds on fish, but also on various cephalopods and crustaceans, the crabeater seal is specialised on
feeding almost exclusively on Antarctic krill (Bowen et al. 2002). In the Northern hemisphere,
harbour and grey seals feed on a wide range of organisms, pelagic and benthic fish, cephalopods
and crustaceans (Reeves et al. 1992). Finally, ringed seals are believed to feed mainly on a variety
of fish and invertebrates such as amphipods, euphausiids and cephalopods, while the bearded seal
consumes mainly benthic invertebrates, i.e. clams, crustaceans, cephalopods as well as some fish
(Reeves et al. 1992). Pauly et al. (1998) estimated the trophic levels of several marine mammals
mainly by stomach content analysis. Values for trophic levels ranged from 3.3 for the crabeater seal
to 4.1 for the Ross seal. Estimated values were 3.4 for bearded seals, 3.8 for ringed seals, harbour
seals and grey seals, whereas it was estimated at 4.0 for Weddell seals.
Soft tissues are commonly used for analysis of metals and stable isotopes. However, fur provides a
non-invasive way to investigate metals and stable isotopes of seals. Fur is keratin-based containing
records of metallic and isotopic elements which are deposited there during the annual moult.
Mercury is one of the trace elements transported to the fur follicles via the blood supply (Ikemoto et
al. 2004), and subsequently incorporated into the hair during periods of growth (Brookens et al.
2007). Hair is widely used as an indicator of blood Hg levels for mammals, and particularly for
humans, and has been used as an indicator of exposure to the environmental pollution also in
pinnipeds (Brookens et al. 2007; Gray et al. 2008; Ikemoto et al. 2004; Medvedev et al. 1997;
Watanabe et al. 1996; Wenzel et al. 1993; Yamamoto et al. 1987).
The purpose of this study was to determine Hg concentrations in the fur of seven species of phocid
seals from different geographical areas, and to evaluate the influence of biological factors in the
bioaccumulation process. Stable isotope analyses were used to evaluate differences or similarities in
the diet or in the foraging habitat among species that could explain variations in Hg concentrations.
We also evaluated if fur can be used for monitoring of Hg in phocid seals in the future.

5
Materials and methods
Sampling procedure and preparation
Hair samples of 85 seals were obtained from seven phocid seal species, i.e. Ross seal, Weddell seal,
crabeater seal, harbour seal, grey seal, ringed seal, and bearded seal. The samples were collected
from three distinct geographical areas, Ross Sea, Antarctica (Ant), Denmark (Dk), and Greenland
(Gr) (cf. Fig. 1). Samples were taken in the period 1996 - 2009. Length and weight of the animals
were recorded, and age was estimated visually based on size and fur colour, according to three
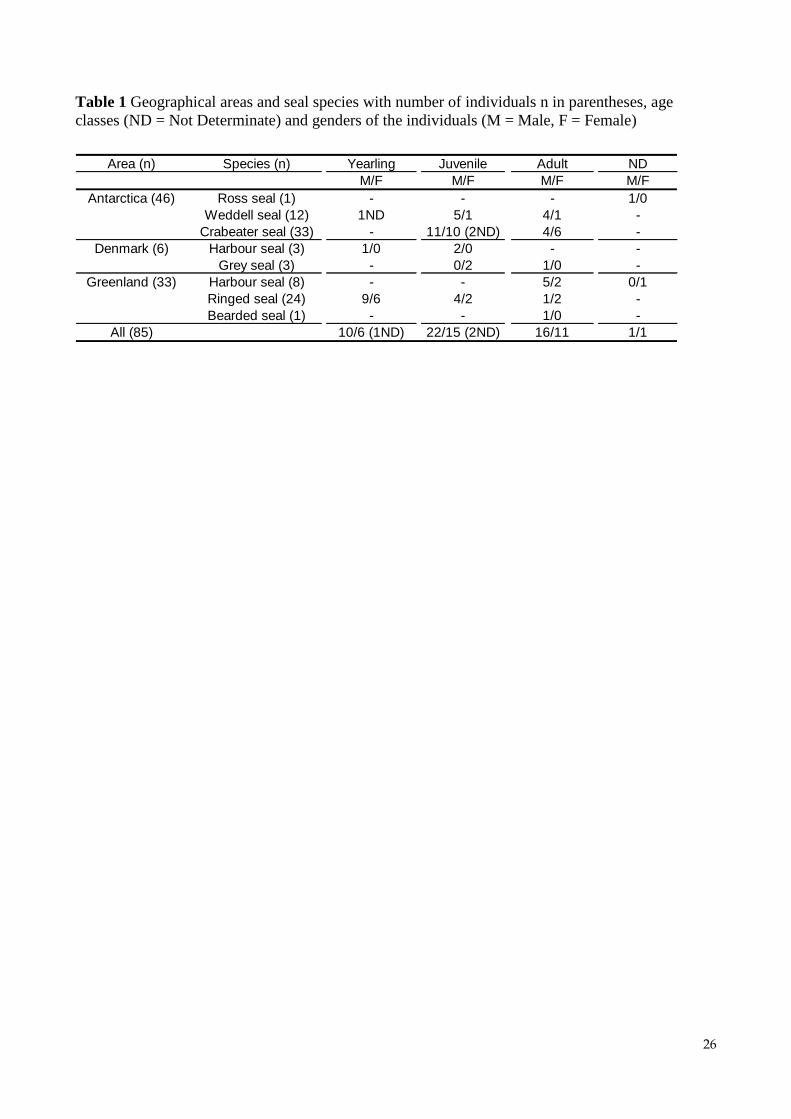
classes (yearling, juvenile and adult). Number of individuals, estimated age and gender are
summarised for each species in Table 1.
Samples were stored in polyethylene plastic bags and kept at -20°C. Prior to analysis, fur samples
were washed in a diluted standard detergent (RBS 35; Bie & Berntsen A/S, Denmark).
Subsequently, the hair samples were rinsed in several ultra-pure Milli-Q water baths, and dried for
24 hours at room temperature.
Analytical procedures, instrumentation and quality assurance for Hg measurements
The Hg measurements were performed at the laboratory of the National Environmental Research
Institute in Roskilde, Denmark, using a solid sample atomic absorption spectrometer AMA-254
(Advanced Mercury Analyser-254 from LECO, Sweden). A homogenised subsample of 5 to 10 mg
of fur was analysed from each individual. The use of this apparatus does not require chemical pre-
treatment, which reduces risks for contamination or loss of Hg. The analytical process consists of a
drying period at 120°C prior to a combustion phase at 750°C, which leads to desorption of Hg from
the samples. The Hg vapour produced is subsequently carried by an oxygen flow to a gold
amalgamator, and trapped on its surface. The collected Hg is thereafter released from the
amalgamator by a short heat-up to 900°C, and carried in a pulse through a spectrophotometer,
where Hg is measured by UV absorption. The operating times used for this study, i.e. drying,
decomposition, and waiting time, were 30, 150, and 45 s, respectively. The instrument is described
in detail elsewhere (Hall and Pelchat 1997).
The accuracy and reproducibility of the method were tested by including human hair (IAEA-086)
reference material at the beginning and at the end of the analysis cycle, and by running it every 10
samples. Results of quality controls showed a good precision with a relative standard deviation of
3.9%. The accuracy was 96% of the assigned concentration (n = 9). The National Environmental
Research Institute participates in the international inter-laboratory comparison exercises conducted

6
by the EEC (QUASIMEME), and showed satisfactory results in the latest test in 2007 for the AMA-
254 (0 < z < 0.5). All data are presented on a dry weight basis (dw) and the detection limit is 0.1
ng.g-1
dw.
Analytical procedures and instrumentation for stable isotope measurements
A homogenised aliquot of approximately 0.5 mg of hair from each individual was weighted and
loaded into tin capsules.
Relative abundances of stable isotopes of carbon (δ13
C) and nitrogen (δ15
N) were determined using
an elemental analyser (Flash EA 1112 fitted with a “No Blank” option, Thermo Scientific, Milan,
Italy) coupled to an isotope ratio mass spectrometer (Delta V Advantage with a Conflo IV interface,
Thermo Scientific, Bremen, Germany). Stable isotope results are expressed in delta notation (δ),
defined as the part per thousand (‰) deviation from a standard material:
δ13
C or δ15
N = [(Rsample / Rstandard) − 1] × 103,
where Rsample and Rstandard are the fractions of heavy to light isotopes in the sample and
standard, respectively. The international standards are the Pee Dee Belemnite (PDB) marine fossil
limestone formation from South Carolina for δ13
C, and atmospheric nitrogen for δ15
N.
The analytical precision of the measurements was < 0.06‰ for carbon and < 0.1‰ for nitrogen,
based on replicate measurements of acetanilide as internal laboratory reference material.
Statistical analysis
Prior to the statistical analyses, the Hg data were log-transformed (base e) to reduce skewness and
fit parametric requirements. Shapiro–Wilk and Bartlett test were applied to test the assumptions of
parametric tests, such as analysis of variance (ANOVA) and linear regression analysis. In few
cases, the assumptions were not fulfilled because of a couple of high Hg concentration values.
However, ANOVA tests are robust to small deviations of the data from the normal distribution (Zar
2009).
Standard parametric tests such linear regression analysis and analysis of variance, were applied to
test for the influence of factors (i.e. age category, sex, species and region of sampling) on the log-
transformed Hg concentrations or δ13
C and δ15
N values. If the first runs of ANOVA test showed no
significance of the interaction between two factors, the interaction factor was removed and the test
re-run. Tukey HSD (Honestly Significant Difference) test was used as a posterior ANOVA test to
determine which means were significantly different from one another. Wilcoxon tests were used to
7
test for differences in log-transformed Hg concentrations or stable isotope ratios between two
species from the same region or among individuals from the same species originating from two
regions. Non-parametric test Spearman rank correlation were used to test the relationships between
Hg concentrations, δ13
C and δ15
N values.
The number of individuals was low for some of the species, and only crabeater seals, Weddell seals
and ringed seals were represented by more than 10 individuals (Table 1). All species (7 species, 85
individuals) are shown on the graphs, but the bearded seal (n = 1) and the Ross seal (n = 1) are
excluded from statistical analyses due to low sample size.
The significance level was set to p = 0.05.
The statistical analyses were performed using the free software R, version 2.1.1 (R Development
Core Team 2008).

8
Results
Hg concentrations and stable isotope ratios
Mercury concentrations in the hair ranged from 0.07 µg.g-1
dw for the crabeater seal to 30.6 µg.g-1
dw for the harbour seal, and mean concentrations increased in the sequence: crabeater seals < Ross
seal < bearded seal < Weddell seals < ringed seals < harbour seals (Dk) < grey seals < harbour seals
(Gr) (Table 2). Nitrogen stable isotopic ratios in hair of the different seal species varied from 6.02‰
for the crabeater seals to 19.33‰ for the ringed seals (crabeater seals < Ross seal < Weddell seals <
bearded seal < harbour seals = grey seals < ringed seals, for mean values), while δ13
C values ranged
from -25.11‰ for the crabeater seals to -15.06‰ for the harbour seals (crabeater seals < Weddell
seals < Ross seal < grey seals < ringed seals < harbour seals (Dk) < bearded seal < harbour seals
(Gr), for mean values) (Table 2).
Influence of sex and age classes
Only adult individuals were selected to test the factor sex. However, the three categories of age
(yearling, juvenile and adult) were not all well represented for each species (Table 1). Thus, the
influence of sex on Hg concentrations was tested only on the crabeater seals, while the influence of
age classes was tested on crabeater seals, Weddell seals and ringed seals.
No difference in Hg concentrations between genders was recorded among the crabeater seals (One-
way ANOVA, F = 0.26; p = 0.62). Figure 2 shows Hg levels for the different age classes for
crabeater seals, Weddell seals and ringed seals. Log-transformed Hg concentrations increased
significantly with age for crabeater seals (One-way ANOVA, F = 221.1, p < 0.001), where adults
showed a higher mean Hg concentration (0.61 µg.g-1
dw) compared with juveniles (0.11 µg.g-1
dw).
However, no significant differences among age classes were found for Weddell seals (F = 1.71, p =
0.23) or ringed seals (F = 2.7, p = 0.09).
The δ15
N and δ13
C values also differed significantly among age groups for the crabeater seals (One-
way ANOVA, F = 9.53, p = 0.004 and F = 113.3, p < 0.001, respectively), with the adults of this
species showing lower mean δ15
N and δ13
C values ± standard errors (7.26 ± 0.27‰, -23.38 ±
0.16‰, respectively, n = 10) than the juvenile individuals (7.89 ± 0.07‰, -24.67 ± 0.04‰,
respectively, n = 23) (Fig. 3). However, this difference in δ15
N and δ13
C values between age groups
was not significant for the Weddell seals (F = 0.65, p = 0.55 and F = 4.20, p = 0.051, respectively)
and the ringed seals (F = 0.31, p = 0.73 and F = 1.30, p = 0.29, respectively). Age specific

9
differences were not tested for in ringed seals due to small sample sizes in age groups yearlings and
juveniles.
Influence of the species and the geographical area
The average Hg concentration increased in the sequence: crabeater seals (Ant), Ross seal (Ant),
bearded seal (Gr), Weddell seals (Ant), ringed seals (Gr), harbour seals (Dk), grey seals (Dk),
harbour seals (Gr) (Table 2). Highly significant differences between species were found for log-
transformed Hg concentrations (One-way ANOVA, F = 84.73, p < 0.001) and δ15
N and δ13
C values
(F = 648.8, p < 0.001 and F = 537, p < 0.001, respectively), with the crabeater seal showing the
lowest Hg, δ15
N and δ13
C values of all species (Fig. 4A/B). Tukey HSB tests showed that crabeater
seals had significantly lower Hg concentrations compared with the other species, and that Hg
concentrations in hair of harbour seals were significantly greater than in Weddell seals and ringed
seals (Table 2, Fig. 4A). Moreover, the δ15
N values differed among the species, except for between
harbour seals and grey seals (Table 2, Fig. 4A) while δ13
C values also varied among the species
except for between ringed seals and grey seals (Table 2, Fig. 4B).
No significant difference was found for Hg (Wilcoxon, W = 6, p = 0.7), δ15
N (W = 6, p = 0.7) and
δ13
C (W = 6, p = 0.7) contents in hairs between harbour seals from Denmark and Greenland;
however, it is worth noticing that the number of individuals was low and age groups were not
comparable. Significant differences were found for Hg, δ15
N and δ13
C values in hair from seals
collected in the three regions. Subsequent Tukey tests revealed that Antarctic seals had lower values
of Hg, δ15
N and δ13
C while there were no significant differences between Greenland and Denmark
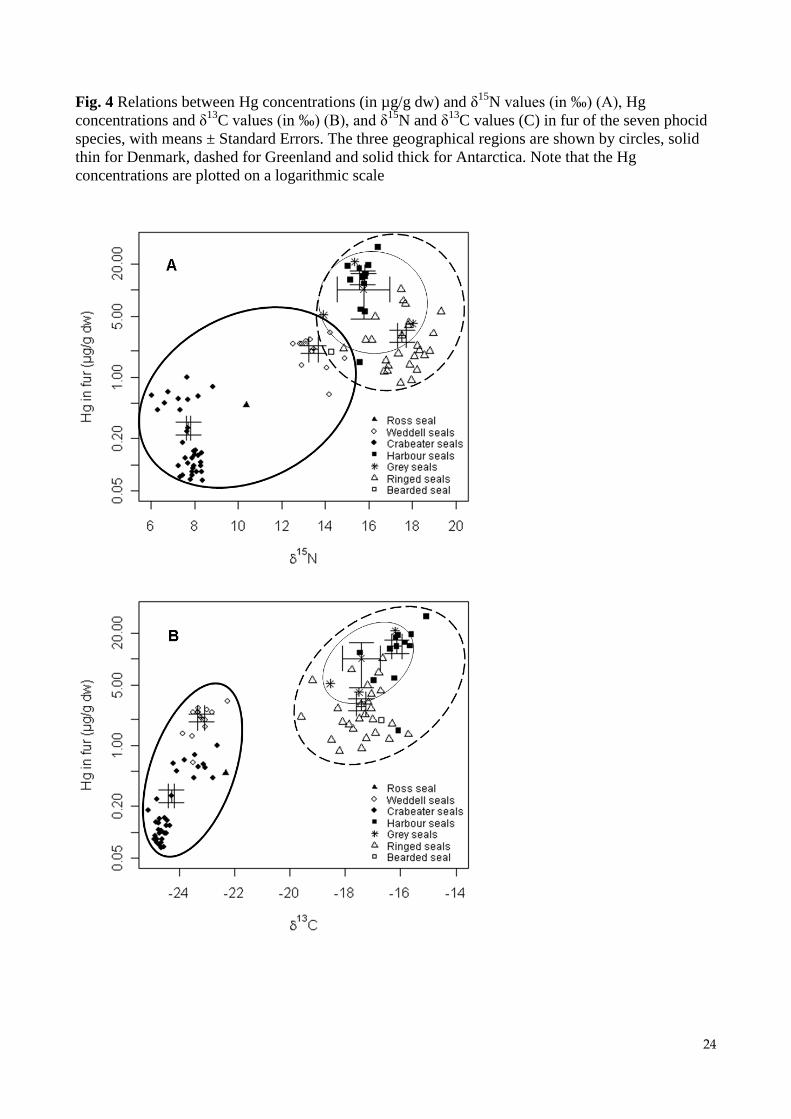
(Table 2, Fig. 4). Significant correlations were also found between log-transformed Hg
concentrations and δ15
N values (Spearman’s correlation, = 0.68, p < 0.001, Fig. 4A, y = 0.133x –
1.673), log-transformed Hg and δ13
C values ( = 0.83, p < 0.001, Fig. 4B, y = 0.168x + 3.514), and
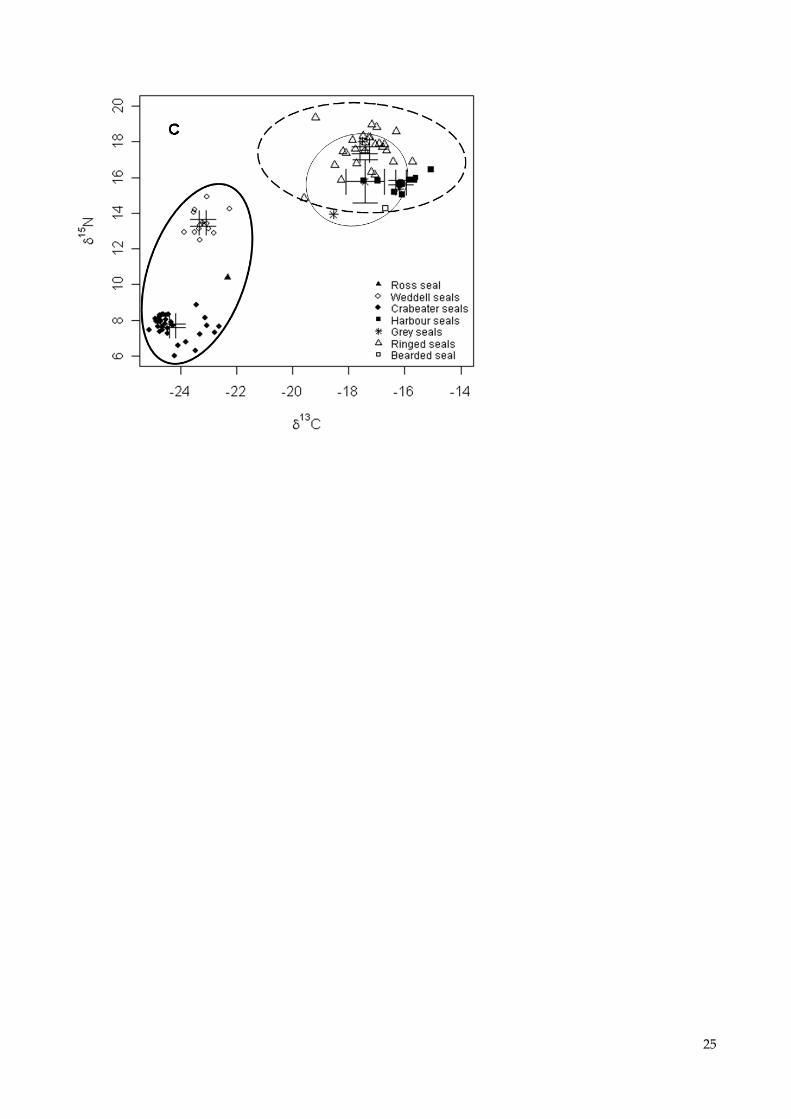
δ15
N and δ13
C values ( = 0.76, p < 0.001, Fig. 4C, y = 1.064x + 34.835) including all species.
10
Discussion
Influence of sex and age groups on Hg concentrations in fur
The influence of gender on Hg concentrations varies among studies and species. Thus, a study
carried out on fur from Baikal seals Phoca sibirica showed no difference in Hg concentrations
between genders (Watanabe et al. 1996), whereas Wenzel et al. (1993) observed higher levels and a
greater variability in Hg concentrations in fur from female compared to male harbour seals. In the
same way, greater concentrations of Hg were found in fur from adult male Pacific harbour seals
Phoca vitulina richardii and leopard seals Hydrurga leptonyx as compared with females in both
species (Brookens et al. 2007; Gray et al. 2008). Gender specific differences in Hg concentrations
could be the result of sexual dimorphism or dissimilarities in dietary intake or dietary preferences
between male and female seals. This could be partially linked to the different energy requirement
for gestation and lactation. Crabeater seals do not show any marked sexual dimorphism (Shirihai
2007), and no significant differences for Hg concentrations between male and female crabeater
seals were found, which would be consistent with comparable exposure for both genders in this
species.
Concentrations of Hg increased significantly with age in crabeater seals, but not for the Weddell
seals or the ringed seals (Fig 2). Such age related differences have been previously reported for
harbour seals (Brookens et al. 2007; Wenzel et al. 1993) and ringed seals (Medvedev et al. 1997).
Increasing concentrations with age in our study likely result from a difference in foraging habits
between juveniles and adults, which was confirmed by the significant difference in δ15
N and δ13
C
values among age classes detected for the crabeater seals (Fig. 3). The greater variability of δ15
N
values for the adults compared to the juvenile crabeater seals suggests that older individuals feed on
a wider range of prey than younger seals. In addition, the distinct δ13
C values displayed by the
juvenile individuals and the adults indicate that they have different feeding habitats. Since δ13
C
values are generally greater in benthic or sea-ice algae than in pelagic algae (Fry and Sherr 1984;
Tamelander et al. 2006), our results, with significantly lower δ13
C values in the juveniles, suggest
that juvenile individuals may forage mainly krill in the water column. Previous findings indicate
that despite the high degree of specialisation of this species on a single prey resource, i.e. krill,
crabeater seals have the behavioural plasticity to forage successfully under a wide range of
environmental conditions, for example, at varying depths and duration of dives and selecting prey in
a greater panel if necessary (Burns et al. 2004). Similarly to our study, higher δ13
C values have

11
previously been observed in adult and subadult crabeater seals compared to juveniles and pups by
Zhao et al. (2004), though no statistical difference between age classes was found in that study.
Differences in diving and foraging behaviour between adults and juveniles, and ontogenetic shifts in
diet have previously been documented in several species of phocid seals (Born et al. 2004; Burns et
al. 1998; Holst et al. 2001; Lowry et al. 1980; Reeves et al. 1992). Generally, newly weaned pups
forage less efficiently and have more limited diving capacity compared with older seals, leading to
differences in diet (Holst et al. 2001; Reeves et al. 1992). Similarly to crabeater seals, distinct δ13
C
values were observed between juvenile and adult individuals of ringed seals and Weddell seals,
suggesting that juvenile seals of those species tend to explore different foraging habitats than the
adults. One such example is the dichotomy among Weddell seal yearlings, where some individuals
predominantly feed on benthic species in shallow waters, whereas others mainly forage in the same
deep-water pelagic zone as the adults do (Burns et al. 1998).
Differences among geographical areas and species (feeding strategies)
Phocid seals renew their fur once a year over a relatively short period, the annual moult, which
occurs at different times of year depending on species (Berta 2002). The hair grows rapidly and
discontinuously, and concentrations of Hg measured in the hair reflect the availability of Hg to the
growing pile via blood during the annual moult (Berlin 1979). Most seals moult within a two-
months period (Stutz 1967), and Hg concentrations in fur result from the diet composition during or
prior to the moulting period. In addition, the moulting period occurs from late spring to late summer
in both hemispheres. As a result, months during which it occurs differ, and species from the
Northern hemisphere tend to moult between May and September, whereas species from the
Southern hemisphere moult between December and February (Reeves et al. 1992; Shirihai 2007).
Thus, seasonal variations in the origin of Hg, its long-range atmospheric transport and its deposition
-including Mercury Depletion Events or MDEs which have been shown to occur at the respective
springtime in both Arctic (Schroeder et al. 1998) and Antarctica (Ebinghaus et al. 2002)-, may have
a great influence on the Hg exposure and bioaccumulation in the seals.
Levels of Hg concentrations in fur of species from Antarctica did not exceed 3.5 µg.g-1
dw which
was relatively low compared to those from Greenland and Denmark, and earlier studies of Hg levels
in hair from Antarctic pinnipeds have not reported concentrations exceeding 11 µg.g-1
dw (Gray et
al. 2008; Yamamoto et al. 1987). Although this difference can be related to the fact that the various
species have different feeding habits, the global distribution pattern of released Hg may also
contribute to those differences in Hg concentrations observed in seals from the Northern and the
Southern hemispheres. Indeed, the total deposition pattern of Hg (dry and wet deposition) in the

12
2000’s shows that concentrations of Hg are much lower in the Southern hemisphere than in the
Northern hemisphere (AMAP/UNEP 2008).
The variation in stable isotopic values between species from Northern and Southern polar
ecosystems could likely reflect geographical differences in the δ15
N and δ13
C values at the base of
food webs. Phocid seals from Northern ecosystems generally show greater δ15
N values and
significantly greater δ13
C values than those from Southern waters (Fig. 4). However, δ15
N values
reported for producers do not differ between both hemispheres. Horton et al. (2009) determined a
mean value of approximately 6.5‰ (range between 4 and 8‰) for phytoplankton and 6‰ for ice
algae (range between 4 and 7‰) from different studies carried out in the Arctic. Mincks et al.
(2008) reported similar mean values in the West Antarctic Peninsula Shelf, ranging from 3.3 to
7.5‰ for phytoplankton and from 4.5 and 6‰ for ice algae. Thus, the δ15
N values found in our
study would imply a greater number of steps in the Arctic food web and thus higher trophic levels
for seals. Earlier studies have shown that Hg concentrations in biota increase with the trophic levels
(i.e. δ15
N values), i.e. predators feeding on high trophic levels usually show higher Hg
concentrations than those feeding on lower levels (Atwell et al. 1998; Campbell et al. 2005). The
biomagnification of Hg in the food web is also demonstrated in our study by the greater Hg
concentrations as well as δ15
N values exhibited by the Northern hemisphere species.
Concerning carbon stable isotopes ratios, Rau et al. (1982) reported distinct latitudinal trends in
plankton δ13
C between the Northern and Southern oceans, with δ13
C values of the Southern ocean
decreasing more and faster toward the South Pole than toward the North Pole. The isotopic results
of our study illustrate these latitudinal variations of δ13
C values between Northern and Southern
oceans, the phocid seal species from Antarctic waters showing lower δ13
C values of approximately
4‰ relative to the Arctic species (Table 2). In addition, some of the variations in δ13
C values could
also be due to the influence of the different foraging habitats of the species, which imply various
carbon sources, i.e. pelagic, sympagic or benthic. It seems indeed that the sympagic or ice-
associated algae, which exhibits approximately mean δ13
C values of -20 to -18‰ in both polar
regions (see review in Horton et al. 2009; Mincks et al. 2008) would influence more the δ13
C values
of the Arctic seals (mean value of -16.95 ± 0.94‰ (sd)), and especially the ringed seals, than the
Antarctic ones (-23.95 ± 0.81‰). Thus, it would indicate a greater participation of the Northern
species in the sympagic food web than the Southern ones. As a result, according to the type of food
web and prey species on which seals feed, the Hg exposure and bioaccumulation would be
different.

13
Thus, the sequence of Hg impregnation was harbour seal > grey seal > ringed seal > bearded seal >
Weddell seal > Ross seal > crabeater seal, which may reflect the influence of differences in diet of
these species. The crabeater seal showed the lowest Hg (0.26 ± 0.04 µg.g-1
dw) and δ15
N values
(7.70 ± 0.11‰) in fur of all investigated seals, which is the result of its very specific diet, almost
entirely composed of krill (Bowen et al. 2002). Of the three species from the Southern Ocean, the
Weddell seal exhibited the greatest Hg concentration (2.09 ± 0.21 µg.g-1
dw) and δ15
N value (13.46
± 0.21‰). These high values reflect its diet consisting of pelagic fish, which are believed to be the
predominant prey items of the Weddell seal in McMurdo Sound, near our sampling area, although
this species has also been reported feeding on cephalopods and crustaceans (Burns et al. 1998).
Among the phocid seal species from the Northern hemisphere, harbour seals had greater Hg levels
than ringed seals, although a bit lower δ15
N values were found in ringed seals (Table 2). Harbour
seals and ringed seals are small pinnipeds, feeding on a large variety of organisms, including fish,
cephalopods and various crustaceans (Reeves et al. 1992). Pauly et al. (1998) reported the harbour
seal being on a slightly higher trophic level (TL = 4) than the ringed seal (TL = 3.8). Our sample of
Greenlandic harbour seals consisted of adults whereas ringed seals from Greenlandic waters were
mainly represented by yearlings. The elevated δ15
N values showed by the ringed seals in our study
(17.64 ± 0.18‰) may be caused by the fact that the diet of yearlings partly included milk, which
would give this pattern, as also found for Steller sea lions (Eumetopias jubatus) (Hobson and Sease
1998). This maternal input to ringed seal yearlings is supported by the greater δ15
N values displayed
by this age group compared to the adult one. Similarly, the greater Hg concentrations in adult
harbour seals could result from that they feed on larger prey with greater burdens of Hg than ringed
seal yearlings.
No significant difference in Hg concentrations, δ15
N or δ13
C values was found between harbour
seals and grey seals from Danish waters, which is in concordance with results from Pauly et al.
(1998), who estimated both species to the same trophic level at 4. The grey seal feeds on schooling
fish, squid, cephalopods and occasionally sea birds (Barros and Clarke 2002), and a great variability
in both Hg concentrations and stable isotopic ratio values was observed for this species, reflecting a
wide range of prey from various foraging areas, but likely also the low sample size.
Finally, no significant difference was found in Hg contents in hair among harbour seals from
Greenlandic and Danish waters, but the sample size was small for this species, and samples from
Greenland and Denmark were not comparable since the Greenlandic sample of harbour seals
consisted of adults, whereas the Danish sample was composed of a yearling and juvenile animals.
However, whereas all individuals showed similar δ15
N values, suggesting a more or less similar
diet, greater δ13
C values found in the Greenlandic harbour seals compared to Danish ones, may

14
reflect either a difference in the foraging strategy, related to the age dissimilarity, or a difference in
the isotopic carbon signature of the two geographical areas. Furthermore, this difference could also
highlight the influence of the ice-associated producers on the Greenlandic seals δ13
C values, as
shown by the greater δ13
C value of ice algae compared to the phytoplankton one (Horton et al.
2009; Tamelander et al. 2006). The greater δ13
C values of the Greenlandic harbour seals compared
to those from Danish waters may thus underline the role of the sympagic food web in the Arctic
marine ecosystem.

15
Conclusion
This study showed consistent variations in Hg concentrations and δ15
N and δ13
C values among
species and geographical regions. This demonstrates that fur is a good tissue for monitoring
exposure to Hg in phocid seals and for reconstructing their exposure history through their diet,
especially with the non-destructive and invasive sampling protocols relative to this tissue. The
significant correlation between Hg concentrations and δ15
N values highlighted the biomagnification
of Hg in the food webs. The comparison of both hemispheres showed the greater Hg concentrations
in the Northern one, which would be the result of a greater contamination and /or somewhat longer
food chains in the Arctic. Our study confirmed the tight link between Hg exposure and feeding
habits (as revealed by δ15
N and δ13
C values) of seals. Thus, measurements of Hg contents in
organisms in an ecosystem can provide information on the trophic levels of species and age groups.
In the most optimal way, Hg analysis should be combined with isotopic tracers, although the
seasonal and vertical variations in δ15
N and δ13
C values in the water column and with latitudes may
somehow introduce a bias in the interpretation of the results. The use of these analytical tools
contributes to a better understanding of local ecosystem functions permitting investigations of
partitioning of habitat use and trophic levels of similar species co-existing within the same
ecosystem.
Acknowledgements
We would like to thank all the people who helped collecting the samples in the field, especially the
crew of the Swedish icebreaker “Oden” who skilfully managed to find the seals and manoeuvre
through the dense pack ice around Antarctica. Special acknowledgement to Carine Churlaud from
the Centre Commun d’Analyses (La Rochelle, France) for her valuable input on the Hg analysis,
and to Pierre Richard and Gaël Guillou from LIENSs (UMR 6250 CNRS-La Rochelle University,
France) for their contribution and advice on the stable isotope analysis. This study was financed by
The Dancea Programme, KVUG (Kommissionen for Videnskabelige Undersøgelser i Grønland),
the Swedish Research Council, the Swedish Polar Institute, the Poitou-Charentes region and the
M.L. Furnestin-Faure foundation. Finally, we also thank Travis Horton, Liying Zhao and a third
anonymous reviewer for their contribution to this manuscript through their relevant comments.

16
References
Aguilar A, Borrell A, Pastor T (1999) Biological factors affecting variability of persistent pollutant
levels in cetaceans. J Cetacean Res Manag Special Issue 1:83-116
AMAP/UNEP (2008) Technical Background Report to the Global Atmospheric Mercury
Assessment. Arctic Monitoring and Assessment Programme / UNEP Chemicals Branch. 159 pp
Atwell L, Hobson KA, Welch HE (1998) Biomagnification and bioaccumulation of mercury in an
arctic marine food web: insights from stable nitrogen isotope analysis. Can J Fish Aquat Sci
55:1114-1121
Bargagli R, Monaci F, Sanchez-Hernandez JC, Cateni D (1998) Biomagnification of mercury in an
Antarctic marine coastal food web. Mar Ecol Prog Ser 169:65-76
Barros NB, Clarke MR (2002) Diet. In: Perrin WF, Würsig B, Thewissen JGM (eds) Encyclopedia
of marine mammals. Academic Press, pp 323-327
Berlin M (1979) Mercury. In: Frigberg L, Nordberg G, Vouk VB (eds) Handbook on the toxicology
of metals. Elsevier, Amsterdam, pp 503-530
Berta A (2002) Pinnipedia, overview. In: Perrin WF, Würsig B, Thewissen JGM (eds)
Encyclopedia of marine mammals. Academic Press, pp 903-911
Born EW, Teilmann J, Riget F (2004) Habitat Use of Ringed Seals (Phoca hispida) in the North
Water Area (North Baffin Bay). Arctic 57, 129-142
Bowen WD, Beck CA, Austin DA (2002) Pinniped ecology. In: Perrin WF, Würsig B, Thewissen
JGM. (eds) Encyclopedia of marine mammals. Academic Press, pp 911-921
Brookens TJ, Harvey JT, O'Hara TM (2007) Trace element concentrations in the Pacific harbor seal
(Phoca vitulina richardii) in central and northern California. Sci Total Environ 372:676-692
17
Brooks S, Lindberg S, Gordeev V, Christensen J, Gusev A, Macdonald R, Marcy S, Puckett K,
Travnikov O, Wilson S (2005) Transport pathways and processes leading to environmental
exposure. In: AMAP Assessment 2002: Heavy metals in the Arctic. Arctic Monitoring and
Assessment Programme (AMAP), Oslo, pp 11-41
Burns JM, Trumble SJ, Castellini MA, Testa JW (1998) The diet of Weddell seals in McMurdo
Sound, Antarctica as determined from scat collections and stable isotope analysis. Polar Biol
19:272-282
Burns JM, Costa DP, Fedak MA, Hindell MA, Bradshaw CJA, Gales NJ, McDonald B, Trumble SJ,
Crocker DE (2004) Winter habitat use and foraging behavior of crabeater seals along the Western
Antarctic Peninsula. Deep-Sea Res Pt II 51:2279-2303
Campbell LM, Norstrom RJ, Hobson KA, Muir DCG, Backus S, Fisk AT (2005) Mercury and other
trace elements in a pelagic Arctic marine food web (Northwater Polynya, Baffin Bay). Sci Total
Environ 351:247-263
Ebinghaus R, Kock HH, Temme C, Einax JW, Löwe AG, Richter A, Burrows JP, Schroeder WH
(2002) Antarctic springtime depletion of atmospheric mercury. Environ Sci Technol 36:1238-1244
Fry B, Sherr EB (1984) δ13
C Measurements As Indicators of Carbon Flow in Marine and Fresh-
Water Ecosystems. Contrib Mar Sci 27:13-47
Gray R, Canfield P, Rogers T (2008) Trace element analysis in the serum and hair of Antarctic
leopard seal, Hydrurga leptonyx, and Weddell seal, Leptonychotes weddellii. Sci Total Environ
399:202-215
Hall GEM, Pelchat P (1997) Evaluation of a direct solid sampling atomic absorption spectrometer
for the trace determination of mercury geological samples. Analyst 122 (9):921-924
Hobson KA, Welch HE (1992) Determination of Trophic Relationships Within A High Arctic
Marine Food Web Using δ13
C and δ15
N Analysis. Mar Ecol Prog Ser 84:9-18
Hobson KA, Sease JL (1998) Stable isotope analyses of tooth annuli reveal temporal dietary
records: An example using steller sea lions. Mar Mamm Sci 14:116-129

18
Holst M, Stirling I, Hobson KA (2001) Diet of ringed seals (Phoca hispida) on the east and west
sides of the North Water Polynya, northern Baffin Bay. Mar Mamm Sci 17:888-908
Horton TW, Blum JD, Xie Z, Hren M, Chamberlain CP (2009) Stable isotope food-web analysis
and mercury biomagnification in polar bears (Ursus maritimus). Polar Res 28:443-454
Ikemoto T, Kunito T, Watanabe I, Yasunaga G, Baba N, Miyazaki N, Petrov EA, Tanabe S (2004)
Comparison of trace element accumulation in Baikal seals (Pusa sibirica), Caspian seals (Pusa
caspica) and northern fur seals (Callorhinus ursinus). Environ Pollut 127:83-97
Lowry LF, Frost KJ, Burns JJ (1980) Variability in the Diet of Ringed Seals, Phoca hispida, in
Alaska. Can J Fish Aquat Sci 37:2254-2261
Medvedev N, Panichev N, Hyvarinen H (1997) Levels of heavy metals in seals of Lake Ladoga and
the White Sea. Sci Total Environ 206:95-105
Minagawa M, Wada E (1984) Stepwise Enrichment of N-15 Along Food-Chains - Further Evidence
and the Relation Between δ15
N and Animal Age. Geochim Cosmochim Ac 48:1135-1140
Mincks SL, Smith CR, Jeffreys RM, Sumida PYG (2008) Trophic structure on the West Antarctic
Peninsula shelf: Detritivory and benthic inertia revealed by δ13
C and δ15
N analysis. Deep-Sea Res
Pt II 55:2502-2514
Pacyna EG, Pacyna JM, Steenhuisen F, Wilson S (2006) Global anthropogenic mercury emission
inventory for 2000. Atmos Environ 40:4048-4063
Pauly D, Trites AW, Capuli E, Christensen V (1998) Diet composition and trophic levels of marine
mammals. ICES J Mar Sci 55:467-481
R Development Core Team R (2008) A language and environment for statistical computing.
Foundation for Statistical Computing, Vienna, Austria; ISBN 3-900051-07-0, URL http://www.R-
project.org

19
Rau GH, Sweeney RE, Kaplan IR (1982) Plankton C-13/C-12 Ratio Changes with Latitude -
Differences Between Northern and Southern Oceans. Deep-Sea Res 29:1035-1039
Reeves RR, Stewart BS, Leatherwood S (1992) The Sierra Club Handbook of Seals and Sirenians.
Sierra Club Books, San Francisco
Schroeder WH, Anlauf KG, Barrie LA, Lu JY, Steffen A, Schneeberger DR, Berg T (1998) Arctic
springtime depletion of mercury. Nature 394:331-332
Shirihai H (2007) Seals. In: Kirwan GM (ed) A Complete Guide to Antarctic Wildlife – The Birds
and Marine Mammals of the Antarctic Continent and the Southern Ocean, 2nd edn. A & C Black,
London, pp 332-354
Stutz SS (1967) Moult in Pacific Harbour Seal Phoca Vitulina Richardi. J Fish Res Board Can
24:435-441
Tamelander T, Renaud PE, Hop H, Carroll ML, Ambrose Jr WG, Hobson K (2006) Trophic
relationships and pelagic-benthic coupling during summer in the Barents Sea Marginal Ice Zone
revealed by stable carbon and nitrogen isotope measurements. Mar Ecol Prog Ser 310:33-46
Tieszen LL, Boutton TW, Tesdahl KG, Slade NA (1983) Fractionation and Turnover of Stable
Carbon Isotopes in Animal-Tissues - Implications for δ13
C Analysis of Diet. Oecologia 57:32-37
Watanabe I, Ichihashi H, Tanabe S, Amano M, Miyazaki N, Petrov EA, Tatsukawa R (1996) Trace
element accumulation in Baikal seal (Phoca sibirica) from the Lake Baikal. Environ Pollut 94:169-
179
Wenzel C, Adelung D, Kruse H, Wassermann O (1993) Trace-Metal Accumulation in Hair and
Skin of the Harbor Seal, Phoca-Vitulina. Mar Pollut Bull 26:152-155
Yamamoto Y, Honda K, Hidaka H, Tatsukawa R (1987) Tissue Distribution of Heavy-Metals in
Weddell Seals (Leptonychotes weddellii). Mar Pollut Bull 18:164-169
Zar JH (2009) Biostatistical analysis: International edition. Pearson Education
20
Zhao LY, Castellini MA, Mau TL, Trumble SJ (2004) Trophic interactions of Antarctic seals as
determined by stable isotope signatures. Polar Biol 27:368-373

21
Fig. 1 Map of the world showing the three geographical areas, Antarctica (Ant), Denmark (Dk),
Greenland (Gr), of fur sampling of the phocid species

22
Fig. 2 Comparisons of Hg concentrations in fur (in µg/g dw) among age classes for the Weddell
seals, crabeater seals and ringed seals. The upper and lower hinges represent the quartiles, the
vertical lines, the maximum and minimum data values and the bold line represents the median value
while the points are outliers

23
Fig. 3 Relations between δ15
N (‰) vs δ13
C (‰) values for the three age classes (filled circle =
yearling, open circle = juvenile, open triangle = adult) for the Weddell seals, crabeater seals and
ringed seals
24
Fig. 4 Relations between Hg concentrations (in µg/g dw) and δ15
N values (in ‰) (A), Hg
concentrations and δ13
C values (in ‰) (B), and δ15
N and δ13
C values (C) in fur of the seven phocid
species, with means ± Standard Errors. The three geographical regions are shown by circles, solid
thin for Denmark, dashed for Greenland and solid thick for Antarctica. Note that the Hg
concentrations are plotted on a logarithmic scale
25
26
Table 1 Geographical areas and seal species with number of individuals n in parentheses, age
classes (ND = Not Determinate) and genders of the individuals (M = Male, F = Female)
Area (n) Species (n) Yearling Juvenile Adult ND
M/F M/F M/F M/F
Antarctica (46) Ross seal (1) - - - 1/0
Weddell seal (12) 1ND 5/1 4/1 -
Crabeater seal (33) - 11/10 (2ND) 4/6 -
Denmark (6) Harbour seal (3) 1/0 2/0 - -
Grey seal (3) - 0/2 1/0 -
Greenland (33) Harbour seal (8) - - 5/2 0/1
Ringed seal (24) 9/6 4/2 1/2 -
Bearded seal (1) - - 1/0 -
All (85) 10/6 (1ND) 22/15 (2ND) 16/11 1/1

27
Table 2 Mercury concentrations and stable isotopic ratios of nitrogen (δ15
N) and carbon (δ13
C)
(mean values ± standard error SE and range) in fur samples of the various phocid species from the
different geographical areas
Area Species
Mean ± SE Range Mean ± SE Range Mean ± SE Range
Antarctica Ross seal
Weddell seal 2.09 ± 0.21 0.63-3.22 13.46 ± 0.21 12.51-14.89 -23.2 ± 0.12 -23.86-(-22.24)
Crabeater seal 0.26 ± 0.04 0.07-0.99 7.7 ± 0.11 6.02-8.84 -24.28 ± 0.12 -25.11-(-22.63)
Denmark Harbour seal 7.79 ± 1.99 5.63-11.77 15.75 ± 0.05 15.65-15.82 -16.87 ± 0.36 -17.46-(-16.21)
Grey seal 10.11 ± 5.47 4.11-21.03 15.76 ± 1.20 13.92-18.03 -17.41 ± 0.68 -18.54-(-16.20)
Greenland Harbour seal 16.27 ± 2.86 1.49-30.60 15.69 ± 0.16 15.03-16.44 -15.86 ± 0.15 -16.37-(-15.06)
Ringed seal 3.06 ± 0.49 0.87-10.28 17.64 ± 0.18 15.86-19.33 -17.33 ± 0.16 -19.18-(-15.72)
Bearded seal
All 3.45 ± 0.61 0.07-30.60 12.75 ± 0.47 6.02-19.33 -20.76 ± 0.39 -25.11-(-15.06)
Hg (µg/g dw) δ15
N (‰) δ13
C (‰)
-16.7114.261.97
0.48 10.38 -22.31
Top Related