


Languages
Pages
Legal

Executive Summary ES-1
Executive Summary An emissions inventory that identifies and quantifies a country's primary anthropogenic1 sources and sinks of
greenhouse gases is essential for addressing climate change. This inventory adheres to both (1) a comprehensive
and detailed set of methodologies for estimating sources and sinks of anthropogenic greenhouse gases, and (2) a
common and consistent mechanism that enables Parties to the United Nations Framework Convention on Climate
Change (UNFCCC) to compare the relative contribution of different emission sources and greenhouse gases to
climate change.
In 1992, the United States signed and ratified the UNFCCC. As stated in Article 2 of the UNFCCC, “The ultimate
objective of this Convention and any related legal instruments that the Conference of the Parties may adopt is to
achieve, in accordance with the relevant provisions of the Convention, stabilization of greenhouse gas
concentrations in the atmosphere at a level that would prevent dangerous anthropogenic interference with the
climate system. Such a level should be achieved within a time-frame sufficient to allow ecosystems to adapt
naturally to climate change, to ensure that food production is not threatened and to enable economic development to
proceed in a sustainable manner.”2
Parties to the Convention, by ratifying, “shall develop, periodically update, publish and make available…national
inventories of anthropogenic emissions by sources and removals by sinks of all greenhouse gases not controlled by
the Montreal Protocol, using comparable methodologies…”3 The United States views this report as an opportunity
to fulfill these commitments.
This chapter summarizes the latest information on U.S. anthropogenic greenhouse gas emission trends from 1990
through 2014. To ensure that the U.S. emissions inventory is comparable to those of other UNFCCC Parties, the
estimates presented here were calculated using methodologies consistent with those recommended in the 2006
Intergovernmental Panel on Climate Change (IPCC) Guidelines for National Greenhouse Gas Inventories (IPCC
2006). The structure of this report is consistent with the UNFCCC guidelines for inventory reporting.4
Box ES-1: Methodological Approach for Estimating and Reporting U.S. Emissions and Sinks
In following the UNFCCC requirement under Article 4.1 to develop and submit national greenhouse gas emissions
inventories, the gross emissions total presented in this report for the United States excludes emissions and sinks
from LULUCF. The net emissions total presented in this report for the United States includes emissions and sinks
from LULUCF. All emissions and sinks are calculated using internationally-accepted methods provided by the
1 The term “anthropogenic,” in this context, refers to greenhouse gas emissions and removals that are a direct result of human
activities or are the result of natural processes that have been affected by human activities (IPCC 2006). 2 Article 2 of the Framework Convention on Climate Change published by the UNEP/WMO Information Unit on Climate
Change. See <http://unfccc.int>. 3 Article 4(1)(a) of the United Nations Framework Convention on Climate Change (also identified in Article 12). Subsequent
decisions by the Conference of the Parties elaborated the role of Annex I Parties in preparing national inventories. See
<http://unfccc.int>. 4 See <http://unfccc.int/resource/docs/2013/cop19/eng/10a03.pdf >.
ES-2 Inventory of U.S. Greenhouse Gas Emissions and Sinks: 1990–2014
IPCC.5 Additionally, the calculated emissions and sinks in a given year for the United States are presented in a
common manner in line with the UNFCCC reporting guidelines for the reporting of inventories under this
international agreement.6 The use of consistent methods to calculate emissions and sinks by all nations providing
their inventories to the UNFCCC ensures that these reports are comparable. In this regard, U.S. emissions and sinks
reported in this Inventory report are comparable to emissions and sinks reported by other countries. The manner that
emissions and sinks are provided in this Inventory is one of many ways U.S. emissions and sinks could be
examined; this Inventory report presents emissions and sinks in a common format consistent with how countries are
to report inventories under the UNFCCC. The report itself follows this standardized format, and provides an
explanation of the IPCC methods used to calculate emissions and sinks, and the manner in which those calculations
are conducted.
On October 30, 2009, the U.S. Environmental Protection Agency (EPA) published a rule for the mandatory
reporting of greenhouse gases from large greenhouse gas emissions sources in the United States. Implementation of
40 CFR Part 98 is referred to as the Greenhouse Gas Reporting Program (GHGRP). 40 CFR part 98 applies to direct
greenhouse gas emitters, fossil fuel suppliers, industrial gas suppliers, and facilities that inject carbon dioxide (CO2)
underground for sequestration or other reasons.7 Reporting is at the facility level, except for certain suppliers of
fossil fuels and industrial greenhouse gases. The GHGRP dataset and the data presented in this Inventory report are
complementary and, as indicated in the respective methodological and planned improvements sections in this
report’s chapters, EPA is using the data, as applicable, to improve the national estimates presented in this Inventory.
ES.1. Background Information Greenhouse gases trap heat and make the planet warmer. The most important greenhouse gases directly emitted by
humans include CO2, methane (CH4), nitrous oxide (N2O), and several other fluorine-containing halogenated
substances. Although the direct greenhouse gases CO2, CH4, and N2O occur naturally in the atmosphere, human
activities have changed their atmospheric concentrations. From the pre-industrial era (i.e., ending about 1750) to
2014, concentrations of these greenhouse gases have increased globally by 43, 160, and 21 percent, respectively
(IPCC 2013 and NOAA/ESRL 2016). This annual report estimates the total national greenhouse gas emissions and
removals associated with human activities across the United States.
Global Warming Potentials Gases in the atmosphere can contribute to climate change both directly and indirectly. Direct effects occur when the
gas itself absorbs radiation. Indirect radiative forcing occurs when chemical transformations of the substance
produce other greenhouse gases, when a gas influences the atmospheric lifetimes of other gases, and/or when a gas
affects atmospheric processes that alter the radiative balance of the earth (e.g., affect cloud formation or albedo).8
The IPCC developed the Global Warming Potential (GWP) concept to compare the ability of each greenhouse gas to
trap heat in the atmosphere relative to another gas.
The GWP of a greenhouse gas is defined as the ratio of the time-integrated radiative forcing from the instantaneous
release of 1 kilogram (kg) of a trace substance relative to that of 1 kg of a reference gas (IPCC 2013). Direct
radiative effects occur when the gas itself is a greenhouse gas. The reference gas used is CO2, and therefore GWP-
5 See <http://www.ipcc-nggip.iges.or.jp/public/index.html>. 6 See <http://unfccc.int/resource/docs/2013/cop19/eng/10a03.pdf#page=2>. 7 See < http://www.epa.gov/ghgreporting> and <http://ghgdata.epa.gov/ghgp/main.do>. 8 Albedo is a measure of the Earth’s reflectivity, and is defined as the fraction of the total solar radiation incident on a body that
is reflected by it.
Executive Summary ES-3
weighted emissions are measured in million metric tons of CO2 equivalent (MMT CO2 Eq.).9,10 All gases in this
Executive Summary are presented in units of MMT CO2 Eq. Emissions by gas in unweighted mass tons are
provided in the Trends chapter of this report.
UNFCCC reporting guidelines for national inventories require the use of GWP values from the IPCC Fourth
Assessment Report (AR4) (IPCC 2007).11 To comply with international reporting standards under the UNFCCC,
official emission estimates are reported by the United States using AR4 GWP values, which have replaced the
previously required use of IPCC Second Assessment Report (SAR) (IPCC 1996) GWP values in the Inventory. All
estimates are provided throughout the report in both CO2 equivalents and unweighted units. A comparison of
emission values using the AR4 GWP values versus the SAR (IPCC 1996), and the IPCC Fifth Assessment Report
(AR5) (IPCC 2013) GWP values can be found in Chapter 1 and, in more detail, in Annex 6.1 of this report. The
GWP values used in this report are listed below in Table ES-1.
Table ES-1: Global Warming Potentials (100-Year Time Horizon) Used in this Report
Gas GWP
CO2 1
CH4a 25
N2O 298
HFC-23 14,800
HFC-32 675
HFC-125 3,500
HFC-134a 1,430
HFC-143a 4,470
HFC-152a 124
HFC-227ea 3,220
HFC-236fa 9,810
HFC-4310mee 1,640
CF4 7,390
C2F6 12,200
C4F10 8,860
C6F14 9,300
SF6 22,800
NF3 17,200
Source: IPCC (2007) a The CH4 GWP includes the direct
effects and those indirect effects due
to the production of tropospheric
ozone and stratospheric water vapor.
The indirect effect due to production
of CO2 is not included.
9 Carbon comprises 12/44 of carbon dioxide by weight. 10 One teragram is equal to 1012 grams or one million metric tons. 11 See <http://unfccc.int/resource/docs/2013/cop19/eng/10a03.pdf >.
ES-4 Inventory of U.S. Greenhouse Gas Emissions and Sinks: 1990–2014
ES.2. Recent Trends in U.S. Greenhouse Gas Emissions and Sinks
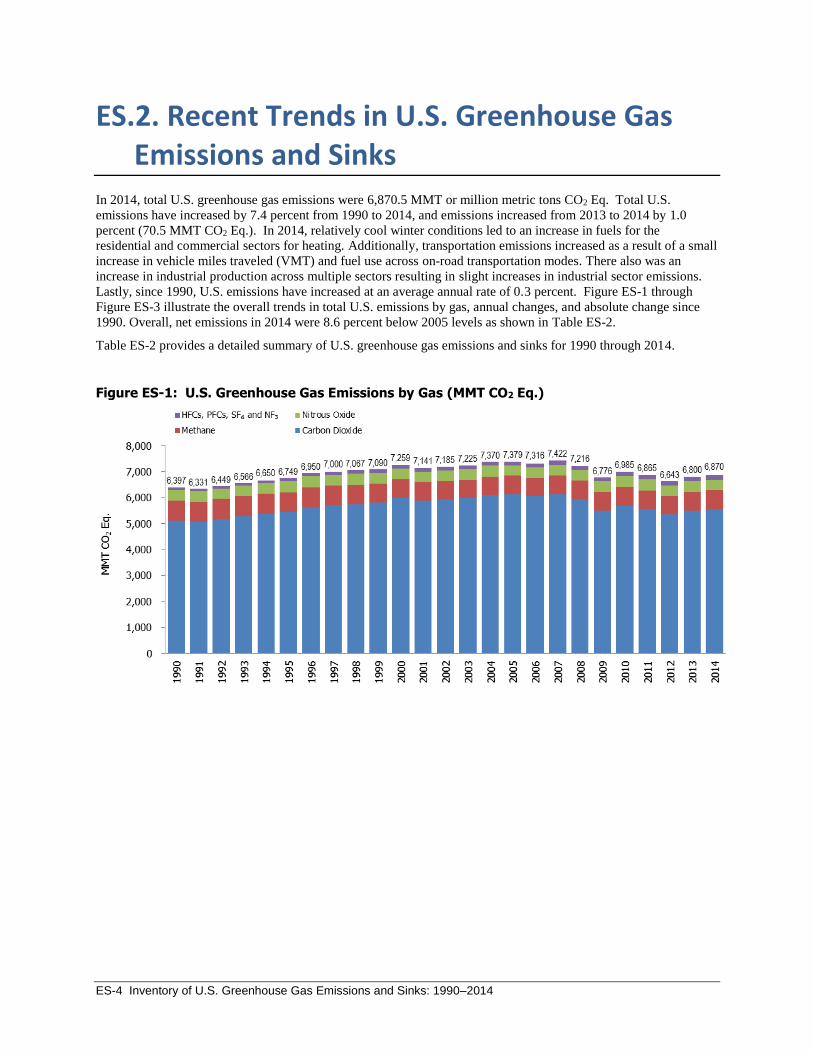
In 2014, total U.S. greenhouse gas emissions were 6,870.5 MMT or million metric tons CO2 Eq. Total U.S.
emissions have increased by 7.4 percent from 1990 to 2014, and emissions increased from 2013 to 2014 by 1.0
percent (70.5 MMT CO2 Eq.). In 2014, relatively cool winter conditions led to an increase in fuels for the
residential and commercial sectors for heating. Additionally, transportation emissions increased as a result of a small
increase in vehicle miles traveled (VMT) and fuel use across on-road transportation modes. There also was an
increase in industrial production across multiple sectors resulting in slight increases in industrial sector emissions.
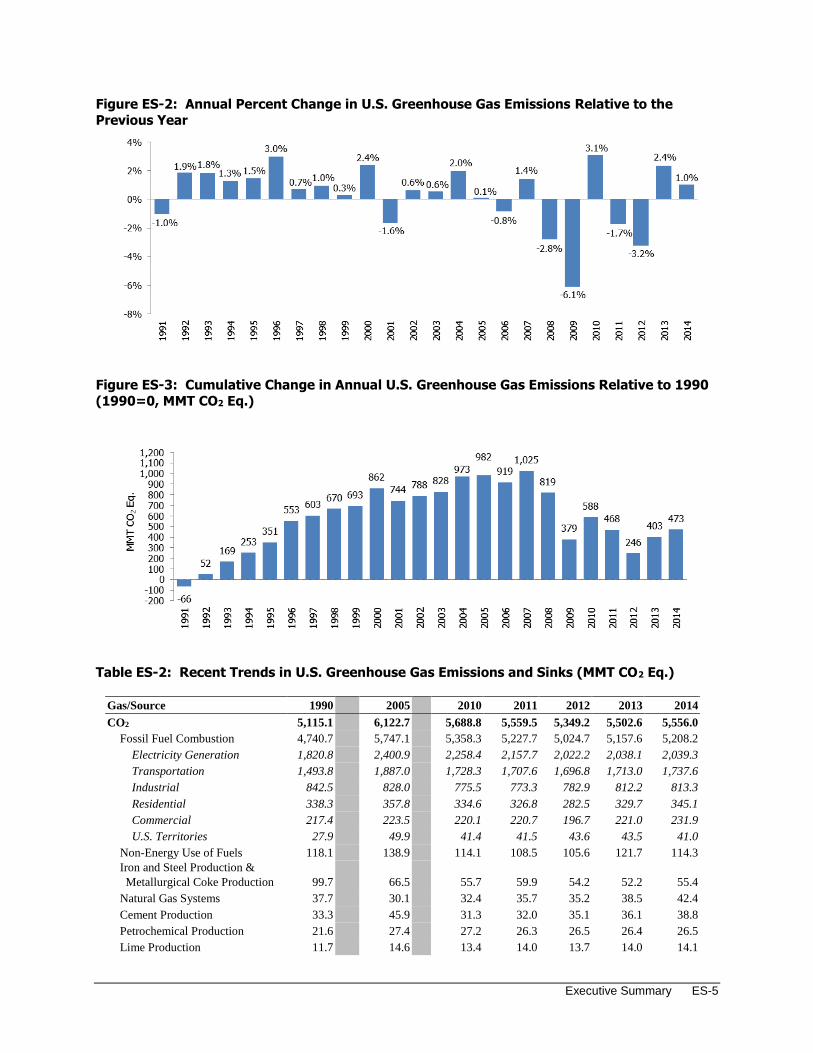
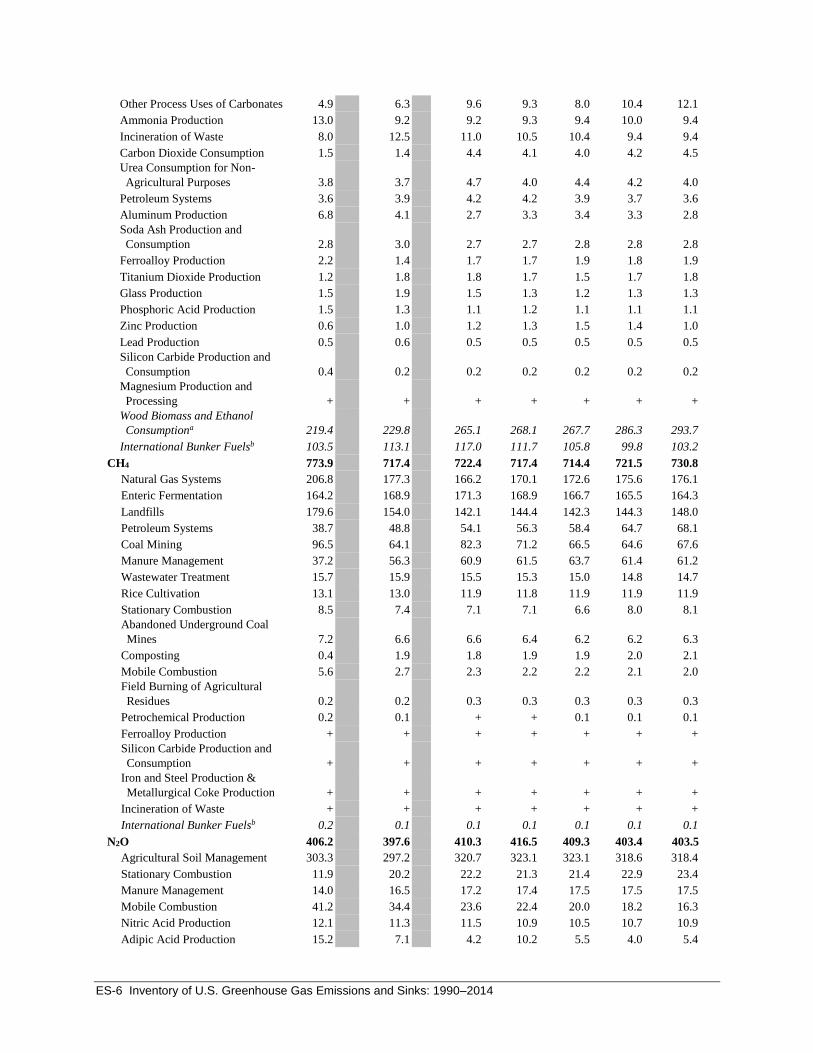
Lastly, since 1990, U.S. emissions have increased at an average annual rate of 0.3 percent. Figure ES-1 through
Figure ES-3 illustrate the overall trends in total U.S. emissions by gas, annual changes, and absolute change since
1990. Overall, net emissions in 2014 were 8.6 percent below 2005 levels as shown in Table ES-2.
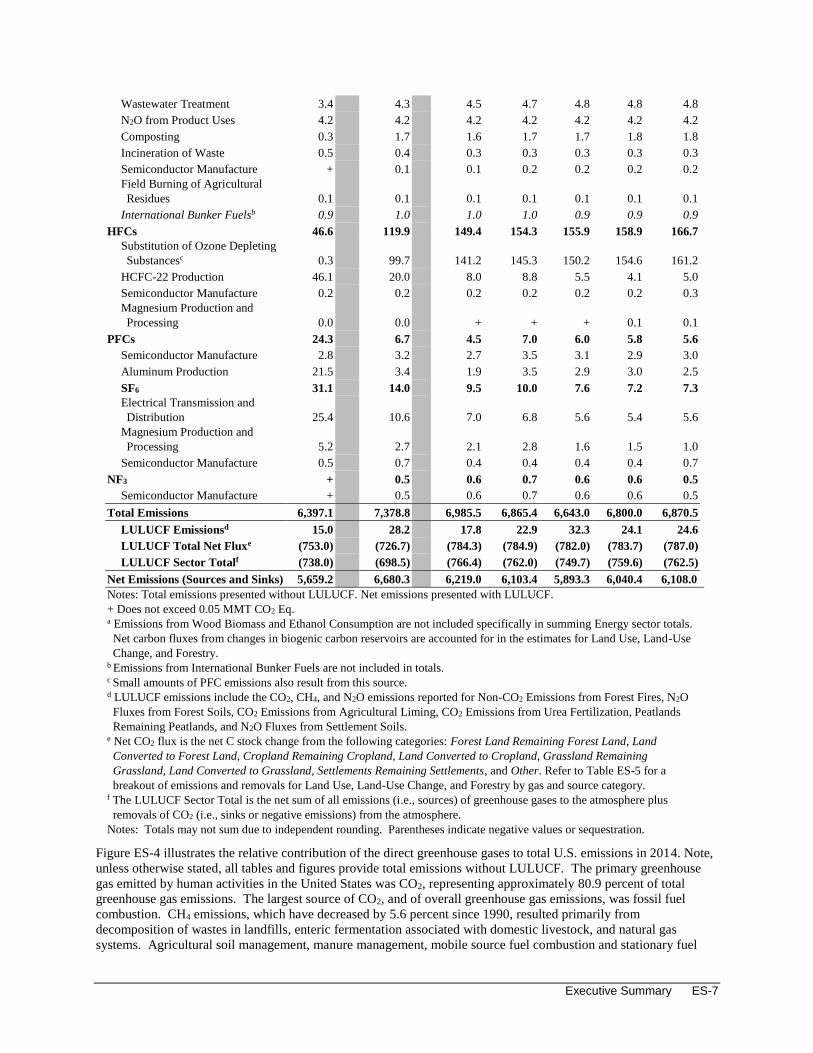
Table ES-2 provides a detailed summary of U.S. greenhouse gas emissions and sinks for 1990 through 2014.
Figure ES-1: U.S. Greenhouse Gas Emissions by Gas (MMT CO2 Eq.)
Executive Summary ES-5
Figure ES-2: Annual Percent Change in U.S. Greenhouse Gas Emissions Relative to the
Previous Year
Figure ES-3: Cumulative Change in Annual U.S. Greenhouse Gas Emissions Relative to 1990
(1990=0, MMT CO2 Eq.)
Table ES-2: Recent Trends in U.S. Greenhouse Gas Emissions and Sinks (MMT CO2 Eq.)
Gas/Source 1990 2005 2010 2011 2012 2013 2014
CO2 5,115.1 6,122.7 5,688.8 5,559.5 5,349.2 5,502.6 5,556.0
Fossil Fuel Combustion 4,740.7 5,747.1 5,358.3 5,227.7 5,024.7 5,157.6 5,208.2
Electricity Generation 1,820.8 2,400.9 2,258.4 2,157.7 2,022.2 2,038.1 2,039.3
Transportation 1,493.8 1,887.0 1,728.3 1,707.6 1,696.8 1,713.0 1,737.6
Industrial 842.5 828.0 775.5 773.3 782.9 812.2 813.3
Residential 338.3 357.8 334.6 326.8 282.5 329.7 345.1
Commercial 217.4 223.5 220.1 220.7 196.7 221.0 231.9
U.S. Territories 27.9 49.9 41.4 41.5 43.6 43.5 41.0
Non-Energy Use of Fuels 118.1 138.9 114.1 108.5 105.6 121.7 114.3
Iron and Steel Production &
Metallurgical Coke Production 99.7 66.5 55.7 59.9 54.2 52.2 55.4
Natural Gas Systems 37.7 30.1 32.4 35.7 35.2 38.5 42.4
Cement Production 33.3 45.9 31.3 32.0 35.1 36.1 38.8
Petrochemical Production 21.6 27.4 27.2 26.3 26.5 26.4 26.5
Lime Production 11.7 14.6 13.4 14.0 13.7 14.0 14.1
ES-6 Inventory of U.S. Greenhouse Gas Emissions and Sinks: 1990–2014
Other Process Uses of Carbonates 4.9 6.3 9.6 9.3 8.0 10.4 12.1
Ammonia Production 13.0 9.2 9.2 9.3 9.4 10.0 9.4
Incineration of Waste 8.0 12.5 11.0 10.5 10.4 9.4 9.4
Carbon Dioxide Consumption 1.5 1.4 4.4 4.1 4.0 4.2 4.5
Urea Consumption for Non-
Agricultural Purposes 3.8 3.7 4.7 4.0 4.4 4.2 4.0
Petroleum Systems 3.6 3.9 4.2 4.2 3.9 3.7 3.6
Aluminum Production 6.8 4.1 2.7 3.3 3.4 3.3 2.8
Soda Ash Production and
Consumption 2.8 3.0 2.7 2.7 2.8 2.8 2.8
Ferroalloy Production 2.2 1.4 1.7 1.7 1.9 1.8 1.9
Titanium Dioxide Production 1.2 1.8 1.8 1.7 1.5 1.7 1.8
Glass Production 1.5 1.9 1.5 1.3 1.2 1.3 1.3
Phosphoric Acid Production 1.5 1.3 1.1 1.2 1.1 1.1 1.1
Zinc Production 0.6 1.0 1.2 1.3 1.5 1.4 1.0
Lead Production 0.5 0.6 0.5 0.5 0.5 0.5 0.5
Silicon Carbide Production and
Consumption 0.4 0.2 0.2 0.2 0.2 0.2 0.2
Magnesium Production and
Processing + + + + + + +
Wood Biomass and Ethanol
Consumptiona 219.4 229.8 265.1 268.1 267.7 286.3 293.7
International Bunker Fuelsb 103.5 113.1 117.0 111.7 105.8 99.8 103.2
CH4 773.9 717.4 722.4 717.4 714.4 721.5 730.8
Natural Gas Systems 206.8 177.3 166.2 170.1 172.6 175.6 176.1
Enteric Fermentation 164.2 168.9 171.3 168.9 166.7 165.5 164.3
Landfills 179.6 154.0 142.1 144.4 142.3 144.3 148.0
Petroleum Systems 38.7 48.8 54.1 56.3 58.4 64.7 68.1
Coal Mining 96.5 64.1 82.3 71.2 66.5 64.6 67.6
Manure Management 37.2 56.3 60.9 61.5 63.7 61.4 61.2
Wastewater Treatment 15.7 15.9 15.5 15.3 15.0 14.8 14.7
Rice Cultivation 13.1 13.0 11.9 11.8 11.9 11.9 11.9
Stationary Combustion 8.5 7.4 7.1 7.1 6.6 8.0 8.1
Abandoned Underground Coal
Mines 7.2 6.6 6.6 6.4 6.2 6.2 6.3
Composting 0.4 1.9 1.8 1.9 1.9 2.0 2.1
Mobile Combustion 5.6 2.7 2.3 2.2 2.2 2.1 2.0
Field Burning of Agricultural
Residues 0.2 0.2 0.3 0.3 0.3 0.3 0.3
Petrochemical Production 0.2 0.1 + + 0.1 0.1 0.1
Ferroalloy Production + + + + + + +
Silicon Carbide Production and
Consumption + + + + + + +
Iron and Steel Production &
Metallurgical Coke Production + + + + + + +
Incineration of Waste + + + + + + +
International Bunker Fuelsb 0.2 0.1 0.1 0.1 0.1 0.1 0.1
N2O 406.2 397.6 410.3 416.5 409.3 403.4 403.5
Agricultural Soil Management 303.3 297.2 320.7 323.1 323.1 318.6 318.4
Stationary Combustion 11.9 20.2 22.2 21.3 21.4 22.9 23.4
Manure Management 14.0 16.5 17.2 17.4 17.5 17.5 17.5
Mobile Combustion 41.2 34.4 23.6 22.4 20.0 18.2 16.3
Nitric Acid Production 12.1 11.3 11.5 10.9 10.5 10.7 10.9
Adipic Acid Production 15.2 7.1 4.2 10.2 5.5 4.0 5.4
Executive Summary ES-7
Wastewater Treatment 3.4 4.3 4.5 4.7 4.8 4.8 4.8
N2O from Product Uses 4.2 4.2 4.2 4.2 4.2 4.2 4.2
Composting 0.3 1.7 1.6 1.7 1.7 1.8 1.8
Incineration of Waste 0.5 0.4 0.3 0.3 0.3 0.3 0.3
Semiconductor Manufacture + 0.1 0.1 0.2 0.2 0.2 0.2
Field Burning of Agricultural
Residues 0.1 0.1 0.1 0.1 0.1 0.1 0.1
International Bunker Fuelsb 0.9 1.0 1.0 1.0 0.9 0.9 0.9
HFCs 46.6 119.9 149.4 154.3 155.9 158.9 166.7
Substitution of Ozone Depleting
Substancesc 0.3 99.7 141.2 145.3 150.2 154.6 161.2
HCFC-22 Production 46.1 20.0 8.0 8.8 5.5 4.1 5.0
Semiconductor Manufacture 0.2 0.2 0.2 0.2 0.2 0.2 0.3
Magnesium Production and
Processing 0.0 0.0 + + + 0.1 0.1
PFCs 24.3 6.7 4.5 7.0 6.0 5.8 5.6
Semiconductor Manufacture 2.8 3.2 2.7 3.5 3.1 2.9 3.0
Aluminum Production 21.5 3.4 1.9 3.5 2.9 3.0 2.5
SF6 31.1 14.0 9.5 10.0 7.6 7.2 7.3
Electrical Transmission and
Distribution 25.4 10.6 7.0 6.8 5.6 5.4 5.6
Magnesium Production and
Processing 5.2 2.7 2.1 2.8 1.6 1.5 1.0
Semiconductor Manufacture 0.5 0.7 0.4 0.4 0.4 0.4 0.7
NF3 + 0.5 0.6 0.7 0.6 0.6 0.5
Semiconductor Manufacture + 0.5 0.6 0.7 0.6 0.6 0.5
Total Emissions 6,397.1 7,378.8 6,985.5 6,865.4 6,643.0 6,800.0 6,870.5
LULUCF Emissionsd 15.0 28.2 17.8 22.9 32.3 24.1 24.6
LULUCF Total Net Fluxe (753.0) (726.7) (784.3) (784.9) (782.0) (783.7) (787.0)
LULUCF Sector Totalf (738.0) (698.5) (766.4) (762.0) (749.7) (759.6) (762.5)
Net Emissions (Sources and Sinks) 5,659.2 6,680.3 6,219.0 6,103.4 5,893.3 6,040.4 6,108.0
Notes: Total emissions presented without LULUCF. Net emissions presented with LULUCF.
+ Does not exceed 0.05 MMT CO2 Eq. a Emissions from Wood Biomass and Ethanol Consumption are not included specifically in summing Energy sector totals.
Net carbon fluxes from changes in biogenic carbon reservoirs are accounted for in the estimates for Land Use, Land-Use
Change, and Forestry. b Emissions from International Bunker Fuels are not included in totals. c Small amounts of PFC emissions also result from this source. d LULUCF emissions include the CO2, CH4, and N2O emissions reported for Non-CO2 Emissions from Forest Fires, N2O
Fluxes from Forest Soils, CO2 Emissions from Agricultural Liming, CO2 Emissions from Urea Fertilization, Peatlands
Remaining Peatlands, and N2O Fluxes from Settlement Soils. e Net CO2 flux is the net C stock change from the following categories: Forest Land Remaining Forest Land, Land
Converted to Forest Land, Cropland Remaining Cropland, Land Converted to Cropland, Grassland Remaining
Grassland, Land Converted to Grassland, Settlements Remaining Settlements, and Other. Refer to Table ES-5 for a
breakout of emissions and removals for Land Use, Land-Use Change, and Forestry by gas and source category. f The LULUCF Sector Total is the net sum of all emissions (i.e., sources) of greenhouse gases to the atmosphere plus
removals of CO2 (i.e., sinks or negative emissions) from the atmosphere.
Notes: Totals may not sum due to independent rounding. Parentheses indicate negative values or sequestration.
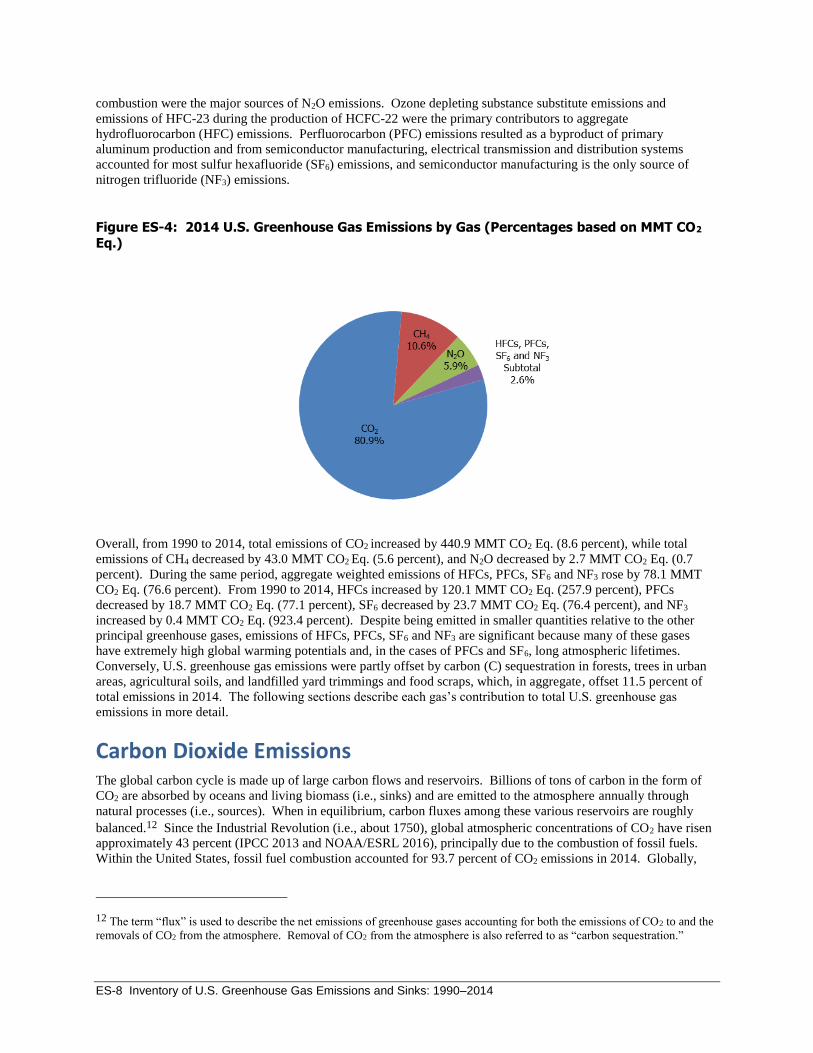
Figure ES-4 illustrates the relative contribution of the direct greenhouse gases to total U.S. emissions in 2014. Note,
unless otherwise stated, all tables and figures provide total emissions without LULUCF. The primary greenhouse
gas emitted by human activities in the United States was CO2, representing approximately 80.9 percent of total
greenhouse gas emissions. The largest source of CO2, and of overall greenhouse gas emissions, was fossil fuel
combustion. CH4 emissions, which have decreased by 5.6 percent since 1990, resulted primarily from
decomposition of wastes in landfills, enteric fermentation associated with domestic livestock, and natural gas
systems. Agricultural soil management, manure management, mobile source fuel combustion and stationary fuel
ES-8 Inventory of U.S. Greenhouse Gas Emissions and Sinks: 1990–2014
combustion were the major sources of N2O emissions. Ozone depleting substance substitute emissions and
emissions of HFC-23 during the production of HCFC-22 were the primary contributors to aggregate
hydrofluorocarbon (HFC) emissions. Perfluorocarbon (PFC) emissions resulted as a byproduct of primary
aluminum production and from semiconductor manufacturing, electrical transmission and distribution systems
accounted for most sulfur hexafluoride (SF6) emissions, and semiconductor manufacturing is the only source of
nitrogen trifluoride (NF3) emissions.
Figure ES-4: 2014 U.S. Greenhouse Gas Emissions by Gas (Percentages based on MMT CO2 Eq.)
Overall, from 1990 to 2014, total emissions of CO2 increased by 440.9 MMT CO2 Eq. (8.6 percent), while total
emissions of CH4 decreased by 43.0 MMT CO2 Eq. (5.6 percent), and N2O decreased by 2.7 MMT CO2 Eq. (0.7
percent). During the same period, aggregate weighted emissions of HFCs, PFCs, SF6 and NF3 rose by 78.1 MMT
CO2 Eq. (76.6 percent). From 1990 to 2014, HFCs increased by 120.1 MMT CO2 Eq. (257.9 percent), PFCs
decreased by 18.7 MMT CO2 Eq. (77.1 percent), SF6 decreased by 23.7 MMT CO2 Eq. (76.4 percent), and NF3
increased by 0.4 MMT CO2 Eq. (923.4 percent). Despite being emitted in smaller quantities relative to the other
principal greenhouse gases, emissions of HFCs, PFCs, SF6 and NF3 are significant because many of these gases
have extremely high global warming potentials and, in the cases of PFCs and SF6, long atmospheric lifetimes.
Conversely, U.S. greenhouse gas emissions were partly offset by carbon (C) sequestration in forests, trees in urban
areas, agricultural soils, and landfilled yard trimmings and food scraps, which, in aggregate, offset 11.5 percent of
total emissions in 2014. The following sections describe each gas’s contribution to total U.S. greenhouse gas
emissions in more detail.
Carbon Dioxide Emissions The global carbon cycle is made up of large carbon flows and reservoirs. Billions of tons of carbon in the form of
CO2 are absorbed by oceans and living biomass (i.e., sinks) and are emitted to the atmosphere annually through
natural processes (i.e., sources). When in equilibrium, carbon fluxes among these various reservoirs are roughly
balanced.12 Since the Industrial Revolution (i.e., about 1750), global atmospheric concentrations of CO2 have risen
approximately 43 percent (IPCC 2013 and NOAA/ESRL 2016), principally due to the combustion of fossil fuels.
Within the United States, fossil fuel combustion accounted for 93.7 percent of CO2 emissions in 2014. Globally,
12 The term “flux” is used to describe the net emissions of greenhouse gases accounting for both the emissions of CO2 to and the
removals of CO2 from the atmosphere. Removal of CO2 from the atmosphere is also referred to as “carbon sequestration.”
Executive Summary ES-9
approximately 32,190 MMT of CO2 were added to the atmosphere through the combustion of fossil fuels in 2013, of
which the United States accounted for approximately 16 percent.13 Changes in land use and forestry practices can
also emit CO2 (e.g., through conversion of forest land to agricultural or urban use) or can act as a sink for CO2 (e.g.,
through net additions to forest biomass). Although fossil fuel combustion is the greatest source of CO2 emissions,
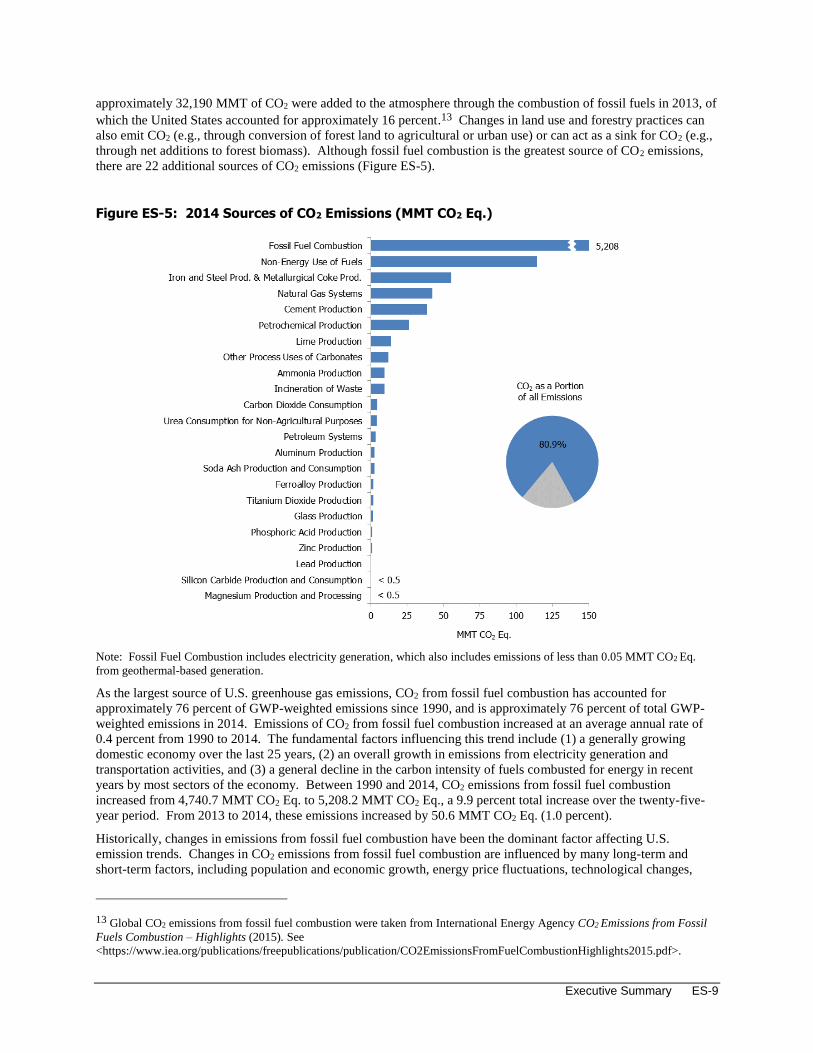
there are 22 additional sources of CO2 emissions (Figure ES-5).
Figure ES-5: 2014 Sources of CO2 Emissions (MMT CO2 Eq.)
Note: Fossil Fuel Combustion includes electricity generation, which also includes emissions of less than 0.05 MMT CO2 Eq.
from geothermal-based generation.
As the largest source of U.S. greenhouse gas emissions, CO2 from fossil fuel combustion has accounted for
approximately 76 percent of GWP-weighted emissions since 1990, and is approximately 76 percent of total GWP-
weighted emissions in 2014. Emissions of CO2 from fossil fuel combustion increased at an average annual rate of
0.4 percent from 1990 to 2014. The fundamental factors influencing this trend include (1) a generally growing
domestic economy over the last 25 years, (2) an overall growth in emissions from electricity generation and
transportation activities, and (3) a general decline in the carbon intensity of fuels combusted for energy in recent
years by most sectors of the economy. Between 1990 and 2014, CO2 emissions from fossil fuel combustion
increased from 4,740.7 MMT CO2 Eq. to 5,208.2 MMT CO2 Eq., a 9.9 percent total increase over the twenty-five-
year period. From 2013 to 2014, these emissions increased by 50.6 MMT CO2 Eq. (1.0 percent).
Historically, changes in emissions from fossil fuel combustion have been the dominant factor affecting U.S.
emission trends. Changes in CO2 emissions from fossil fuel combustion are influenced by many long-term and
short-term factors, including population and economic growth, energy price fluctuations, technological changes,
13 Global CO2 emissions from fossil fuel combustion were taken from International Energy Agency CO2 Emissions from Fossil
Fuels Combustion – Highlights (2015). See
<https://www.iea.org/publications/freepublications/publication/CO2EmissionsFromFuelCombustionHighlights2015.pdf>.
ES-10 Inventory of U.S. Greenhouse Gas Emissions and Sinks: 1990–2014
energy fuel choices, and seasonal temperatures. In the short term, the overall consumption of fossil fuels in the
United States fluctuates primarily in response to changes in general economic conditions, energy prices, weather,
and the availability of non-fossil alternatives. For example, in a year with increased consumption of goods and
services, low fuel prices, severe summer and winter weather conditions, nuclear plant closures, and lower
precipitation feeding hydroelectric dams, there would likely be proportionally greater fossil fuel consumption than a
year with poor economic performance, high fuel prices, mild temperatures, and increased output from nuclear and
hydroelectric plants. In the long term, energy consumption patterns respond to changes that affect the scale of
consumption (e.g., population, number of cars, and size of houses), the efficiency with which energy is used in
equipment (e.g., cars, power plants, steel mills, and light bulbs), and behavioral choices (e.g., walking, bicycling, or
telecommuting to work instead of driving).
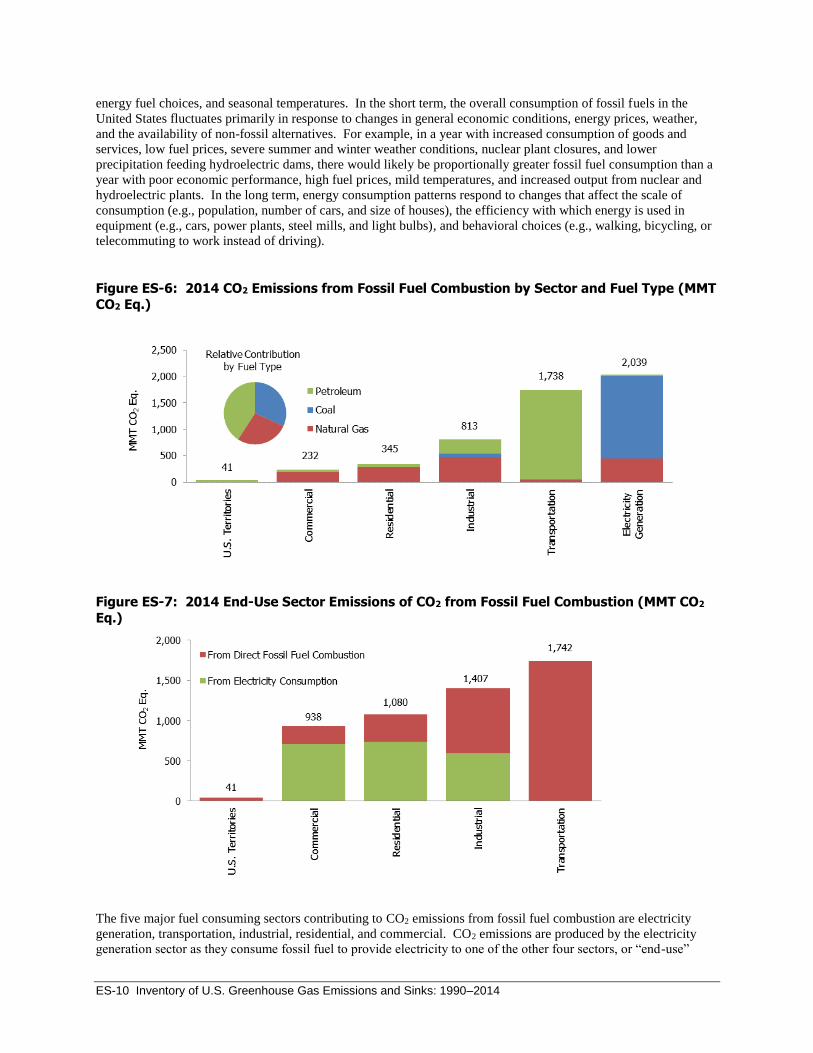
Figure ES-6: 2014 CO2 Emissions from Fossil Fuel Combustion by Sector and Fuel Type (MMT
CO2 Eq.)
Figure ES-7: 2014 End-Use Sector Emissions of CO2 from Fossil Fuel Combustion (MMT CO2
Eq.)
The five major fuel consuming sectors contributing to CO2 emissions from fossil fuel combustion are electricity
generation, transportation, industrial, residential, and commercial. CO2 emissions are produced by the electricity
generation sector as they consume fossil fuel to provide electricity to one of the other four sectors, or “end-use”
Executive Summary ES-11
sectors. For the discussion below, electricity generation emissions have been distributed to each end-use sector on
the basis of each sector’s share of aggregate electricity consumption. This method of distributing emissions assumes
that each end-use sector consumes electricity that is generated from the national average mix of fuels according to
their carbon intensity. Emissions from electricity generation are also addressed separately after the end-use sectors
have been discussed.
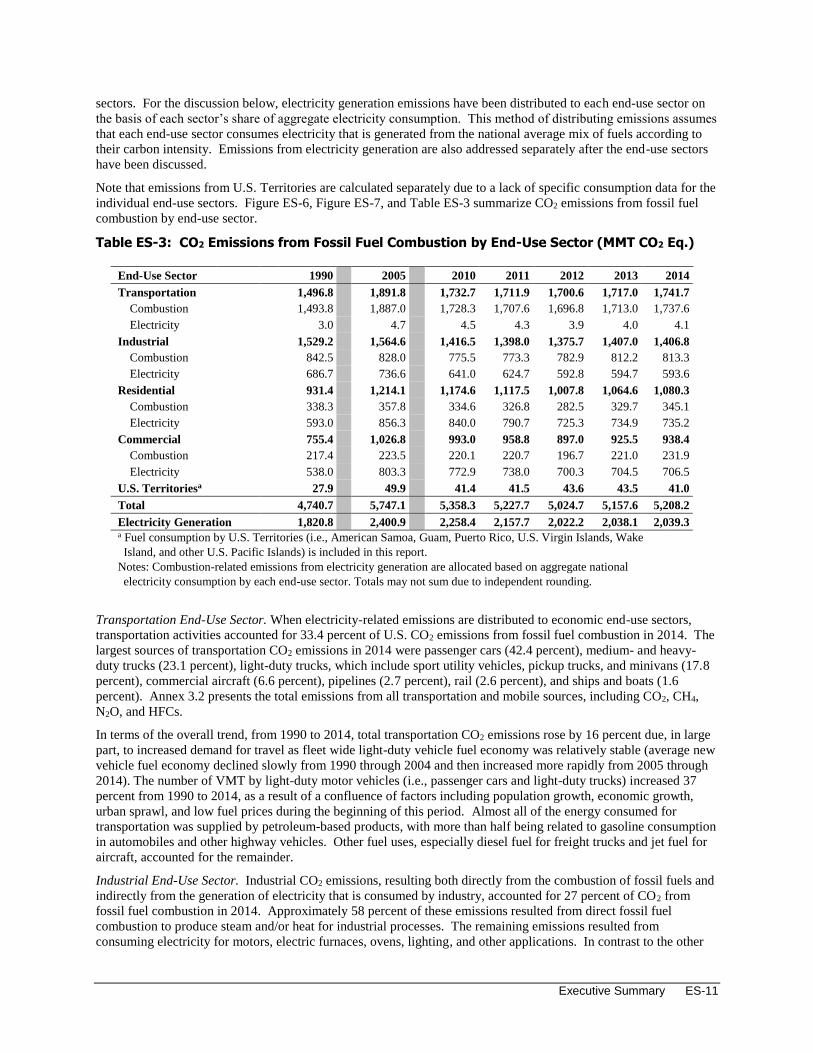
Note that emissions from U.S. Territories are calculated separately due to a lack of specific consumption data for the
individual end-use sectors. Figure ES-6, Figure ES-7, and Table ES-3 summarize CO2 emissions from fossil fuel
combustion by end-use sector.
Table ES-3: CO2 Emissions from Fossil Fuel Combustion by End-Use Sector (MMT CO2 Eq.)
End-Use Sector 1990 2005 2010 2011 2012 2013 2014
Transportation 1,496.8 1,891.8 1,732.7 1,711.9 1,700.6 1,717.0 1,741.7
Combustion 1,493.8 1,887.0 1,728.3 1,707.6 1,696.8 1,713.0 1,737.6
Electricity 3.0 4.7 4.5 4.3 3.9 4.0 4.1
Industrial 1,529.2 1,564.6 1,416.5 1,398.0 1,375.7 1,407.0 1,406.8
Combustion 842.5 828.0 775.5 773.3 782.9 812.2 813.3
Electricity 686.7 736.6 641.0 624.7 592.8 594.7 593.6
Residential 931.4 1,214.1 1,174.6 1,117.5 1,007.8 1,064.6 1,080.3
Combustion 338.3 357.8 334.6 326.8 282.5 329.7 345.1
Electricity 593.0 856.3 840.0 790.7 725.3 734.9 735.2
Commercial 755.4 1,026.8 993.0 958.8 897.0 925.5 938.4
Combustion 217.4 223.5 220.1 220.7 196.7 221.0 231.9
Electricity 538.0 803.3 772.9 738.0 700.3 704.5 706.5
U.S. Territoriesa 27.9 49.9 41.4 41.5 43.6 43.5 41.0
Total 4,740.7 5,747.1 5,358.3 5,227.7 5,024.7 5,157.6 5,208.2
Electricity Generation 1,820.8 2,400.9 2,258.4 2,157.7 2,022.2 2,038.1 2,039.3
a Fuel consumption by U.S. Territories (i.e., American Samoa, Guam, Puerto Rico, U.S. Virgin Islands, Wake
Island, and other U.S. Pacific Islands) is included in this report.
Notes: Combustion-related emissions from electricity generation are allocated based on aggregate national
electricity consumption by each end-use sector. Totals may not sum due to independent rounding.
Transportation End-Use Sector. When electricity-related emissions are distributed to economic end-use sectors,
transportation activities accounted for 33.4 percent of U.S. CO2 emissions from fossil fuel combustion in 2014. The
largest sources of transportation CO2 emissions in 2014 were passenger cars (42.4 percent), medium- and heavy-
duty trucks (23.1 percent), light-duty trucks, which include sport utility vehicles, pickup trucks, and minivans (17.8
percent), commercial aircraft (6.6 percent), pipelines (2.7 percent), rail (2.6 percent), and ships and boats (1.6
percent). Annex 3.2 presents the total emissions from all transportation and mobile sources, including CO2, CH4,
N2O, and HFCs.
In terms of the overall trend, from 1990 to 2014, total transportation CO2 emissions rose by 16 percent due, in large
part, to increased demand for travel as fleet wide light-duty vehicle fuel economy was relatively stable (average new
vehicle fuel economy declined slowly from 1990 through 2004 and then increased more rapidly from 2005 through
2014). The number of VMT by light-duty motor vehicles (i.e., passenger cars and light-duty trucks) increased 37
percent from 1990 to 2014, as a result of a confluence of factors including population growth, economic growth,
urban sprawl, and low fuel prices during the beginning of this period. Almost all of the energy consumed for
transportation was supplied by petroleum-based products, with more than half being related to gasoline consumption
in automobiles and other highway vehicles. Other fuel uses, especially diesel fuel for freight trucks and jet fuel for
aircraft, accounted for the remainder.
Industrial End-Use Sector. Industrial CO2 emissions, resulting both directly from the combustion of fossil fuels and
indirectly from the generation of electricity that is consumed by industry, accounted for 27 percent of CO2 from
fossil fuel combustion in 2014. Approximately 58 percent of these emissions resulted from direct fossil fuel
combustion to produce steam and/or heat for industrial processes. The remaining emissions resulted from
consuming electricity for motors, electric furnaces, ovens, lighting, and other applications. In contrast to the other
ES-12 Inventory of U.S. Greenhouse Gas Emissions and Sinks: 1990–2014
end-use sectors, emissions from industry have steadily declined since 1990. This decline is due to structural changes
in the U.S. economy (i.e., shifts from a manufacturing-based to a service-based economy), fuel switching, and
efficiency improvements.
Residential and Commercial End-Use Sectors. The residential and commercial end-use sectors accounted for 21
and 18 percent, respectively, of CO2 emissions from fossil fuel combustion in 2014. Both sectors relied heavily on
electricity for meeting energy demands, with 68 and 75 percent, respectively, of their emissions attributable to
electricity consumption for lighting, heating, cooling, and operating appliances. The remaining emissions were due
to the consumption of natural gas and petroleum for heating and cooking. Emissions from the residential and
commercial end-use sectors have increased by 16 percent and 24 percent since 1990, respectively, due to increasing
electricity consumption for lighting, heating, air conditioning, and operating appliances.
Electricity Generation. The United States relies on electricity to meet a significant portion of its energy demands.
Electricity generators consumed 34 percent of total U.S. energy uses from fossil fuels and emitted 39 percent of the
CO2 from fossil fuel combustion in 2014. The type of fuel combusted by electricity generators has a significant
effect on their emissions. For example, some electricity is generated through non-fossil fuel options such as nuclear,
hydroelectric, or geothermal energy. Including all electricity generation modes, generators relied on coal for
approximately 39 percent of their total energy requirements in 2014.14 In addition, the coal used by electricity
generators accounted for 93 percent of all coal consumed for energy in the United States in 2014.15 Recently, a
decrease in the carbon intensity of fuels consumed to generate electricity has occurred due to a decrease in coal
consumption, and increased natural gas consumption and other generation sources. Including all electricity
generation modes, electricity generators used natural gas for approximately 27 percent of their total energy
requirements in 2014.16 Across the time series, changes in electricity demand and the carbon intensity of fuels used
for electricity generation have a significant impact on CO2 emissions.
Other significant CO2 trends included the following:
Carbon dioxide emissions from non-energy use of fossil fuels decreased by 3.8 MMT CO2 Eq. (3.2 percent)
from 1990 through 2014. Emissions from non-energy uses of fossil fuels were 114.3 MMT CO2 Eq. in
2014, which constituted 2.1 percent of total national CO2 emissions, approximately the same proportion as
in 1990.
Carbon dioxide emissions from iron and steel production and metallurgical coke production have declined
by 44.3 MMT CO2 Eq. (44.5 percent) from 1990 through 2014, due to restructuring of the industry,
technological improvements, and increased scrap steel utilization.
Carbon dioxide emissions from ammonia production (9.4 MMT CO2 Eq. in 2014) decreased by 3.6 MMT
CO2 Eq. (27.7 percent) since 1990. Ammonia production relies on natural gas as both a feedstock and a
fuel, and as such, market fluctuations and volatility in natural gas prices affect the production of ammonia.
Total net flux from (i.e., net CO2 removals) from Land Use, Land-Use Change, and Forestry increased by
34.1 MMT CO2 Eq. (4.5 percent) from 1990 through 2014. This increase was primarily due to an increase
in the rate of net C accumulation in forest and urban tree carbon stocks. Annual carbon accumulation in
landfilled yard trimmings and food scraps slowed over this period, while the rate of carbon accumulation in
urban trees increased.
Box ES-2: Use of Ambient Measurements Systems for Validation of Emission Inventories
In following the UNFCCC requirement under Article 4.1 to develop and submit national greenhouse gas emission
inventories, the emissions and sinks presented in this report are organized by source and sink categories and
calculated using internationally-accepted methods provided by the IPCC.17 Several recent studies have measured
emissions at the national or regional level (e.g., Petron 2012, Miller et al. 2013) with results that differ from EPA’s
estimate of emissions. A recent study reviewed technical literature on CH4 emissions and estimated CH4 emissions
14 See <http://www.eia.gov/energyexplained/index.cfm?page=electricity_in_the_united_states >. 15 See Table 6.2 Coal Consumption by Sector of EIA 2016. 16 See <http://www.eia.gov/energyexplained/index.cfm?page=electricity_in_the_united_states >. 17 See <http://www.ipcc-nggip.iges.or.jp/public/index.html>.
Executive Summary ES-13
from all anthropogenic sources (e.g., livestock, oil and gas, waste emissions) to be greater than EPA’s estimate
(Brandt et al. 2014). EPA has engaged with researchers on how remote sensing, ambient measurement, and inverse
modeling techniques for greenhouse gas emissions could assist in improving the understanding of inventory
estimates. An area of particular interest in EPA’s outreach efforts is how these data can be used in a manner
consistent with this Inventory report’s transparency on its calculation methodologies, and the ability of these
techniques to attribute emissions and removals from remote sensing to anthropogenic sources, as defined by the
IPCC for this report, versus natural sources and sinks. In working with the research community on ambient
measurement and remote sensing techniques to improve national greenhouse gas inventories, EPA relies upon
guidance from the IPCC on the use of measurements and modeling to validate emission inventories.18
Methane Emissions Methane (CH4) is 25 times as effective as CO2 at trapping heat in the atmosphere (IPCC 2007). Over the last two
hundred and fifty years, the concentration of CH4 in the atmosphere increased by 160 percent (IPCC 2013 and
CDIAC 2015). Anthropogenic sources of CH4 include natural gas and petroleum systems, agricultural activities,
landfills, coal mining, wastewater treatment, stationary and mobile combustion, and certain industrial processes (see
Figure ES-8).
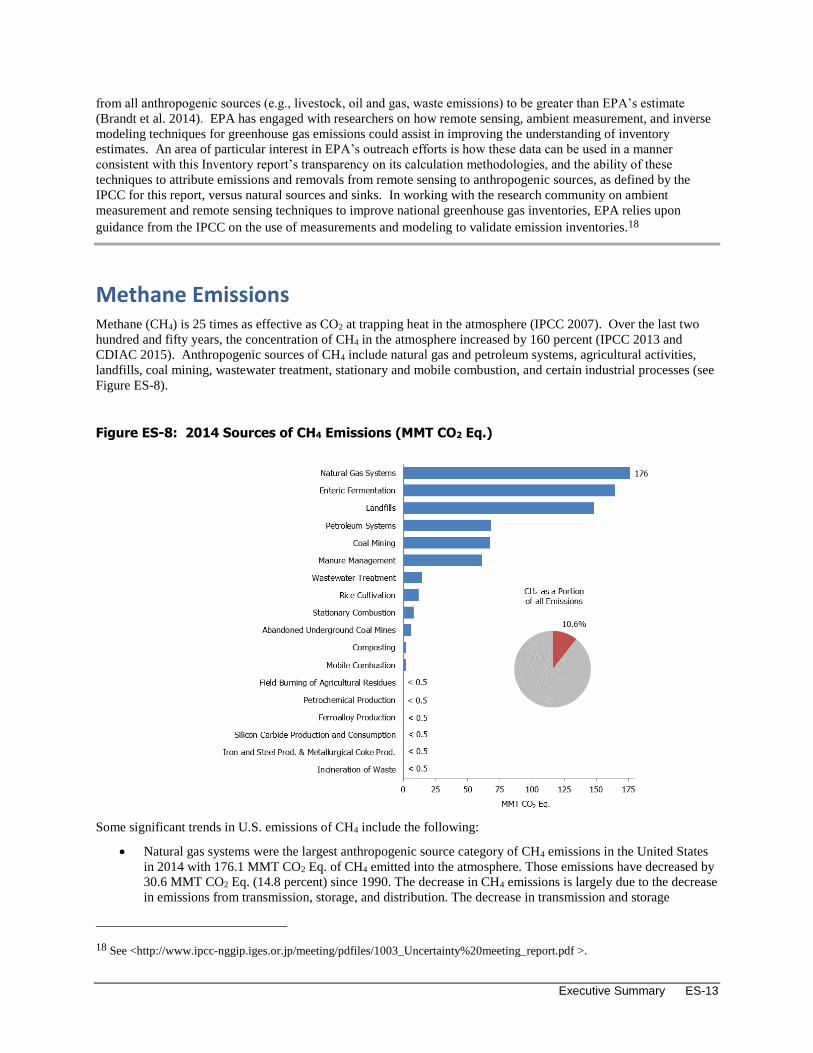
Figure ES-8: 2014 Sources of CH4 Emissions (MMT CO2 Eq.)
Some significant trends in U.S. emissions of CH4 include the following:
Natural gas systems were the largest anthropogenic source category of CH4 emissions in the United States
in 2014 with 176.1 MMT CO2 Eq. of CH4 emitted into the atmosphere. Those emissions have decreased by
30.6 MMT CO2 Eq. (14.8 percent) since 1990. The decrease in CH4 emissions is largely due to the decrease
in emissions from transmission, storage, and distribution. The decrease in transmission and storage
18 See <http://www.ipcc-nggip.iges.or.jp/meeting/pdfiles/1003_Uncertainty%20meeting_report.pdf >.
ES-14 Inventory of U.S. Greenhouse Gas Emissions and Sinks: 1990–2014
emissions is largely due to reduced compressor station emissions (including emissions from compressors
and fugitives). The decrease in distribution emissions is largely attributed to increased use of plastic piping,
which has lower emissions than other pipe materials, and station upgrades at metering and regulating
(M&R) stations.
Petroleum systems are the fourth anthropogenic source of CH4 emissions in the United States (68.1 MMT
CO2 Eq.), accounting for 9.3 percent of total CH4 emissions in 2014. From 1990 to 2014, CH4 emissions
from petroleum systems increased by 29.4 MMT CO2 Eq. (or 76 percent). This increase is due primarily to
increases in emissions from production equipment.
Enteric fermentation is the second largest anthropogenic source of CH4 emissions in the United States. In
2014, enteric fermentation CH4 emissions were 164.3 MMT CO2 Eq. (22.5 percent of total CH4 emissions),
which represents an increase of 0.1 MMT CO2 Eq. (0.1 percent) since 1990. This increase in emissions
from 1990 to 2014 generally follows the increasing trends in cattle populations. From 1990 to 1995
emissions increased and then generally decreased from 1996 to 2004, mainly due to fluctuations in beef
cattle populations and increased digestibility of feed for feedlot cattle. Emissions increased from 2005 to
2007, as both dairy and beef populations underwent increases and the literature for dairy cow diets
indicated a trend toward a decrease in feed digestibility for those years. Emissions decreased again from
2008 to 2014 as beef cattle populations again decreased.
Landfills are the third largest anthropogenic source of CH4 emissions in the United States (148.0 MMT
CO2 Eq.), accounting for 20.2 percent of total CH4 emissions in 2014. From 1990 to 2014, CH4 emissions
from landfills decreased by 31.6 MMT CO2 Eq. (17.6 percent), with small increases occurring in some
interim years. This downward trend in emissions can be attributed to a 21 percent reduction in the amount
of decomposable materials (i.e., paper and paperboard, food scraps, and yard trimmings) discarded in MSW
landfills over the time series (EPA 2015b) and an increase in the amount of landfill gas collected and
combusted (i.e., used for energy or flared),19 which has more than offset the additional CH4 emissions
resulting from an increase in the amount of municipal solid waste landfilled.
Methane emissions from manure management increased by 64.7 percent since 1990, from 37.2 MMT CO2
Eq. in 1990 to 61.2 MMT CO2 Eq. in 2014. The majority of this increase was from swine and dairy cow
manure, since the general trend in manure management is one of increasing use of liquid systems, which
tends to produce greater CH4 emissions. The increase in liquid systems is the combined result of a shift to
larger facilities, and to facilities in the West and Southwest, all of which tend to use liquid systems. Also,
new regulations limiting the application of manure nutrients have shifted manure management practices at
smaller dairies from daily spread to manure managed and stored on site.
Nitrous Oxide Emissions Nitrous oxide (N2O) is produced by biological processes that occur in soil and water and by a variety of
anthropogenic activities in the agricultural, energy-related, industrial, and waste management fields. While total
N2O emissions are much lower than CO2 emissions, N2O is approximately 300 times more powerful than CO2 at
trapping heat in the atmosphere (IPCC 2007). Since 1750, the global atmospheric concentration of N2O has risen by
approximately 21 percent (IPCC 2013 and CDIAC 2015). The main anthropogenic activities producing N2O in the
United States are agricultural soil management, stationary fuel combustion, fuel combustion in motor vehicles,
manure management, and nitric acid production (see Figure ES-9).
19 Carbon dioxide emissions from landfills are not included specifically in summing waste sector totals. Net carbon fluxes from
changes in biogenic carbon reservoirs are accounted for in the estimates for Land Use, Land-Use Change, and Forestry.
Executive Summary ES-15
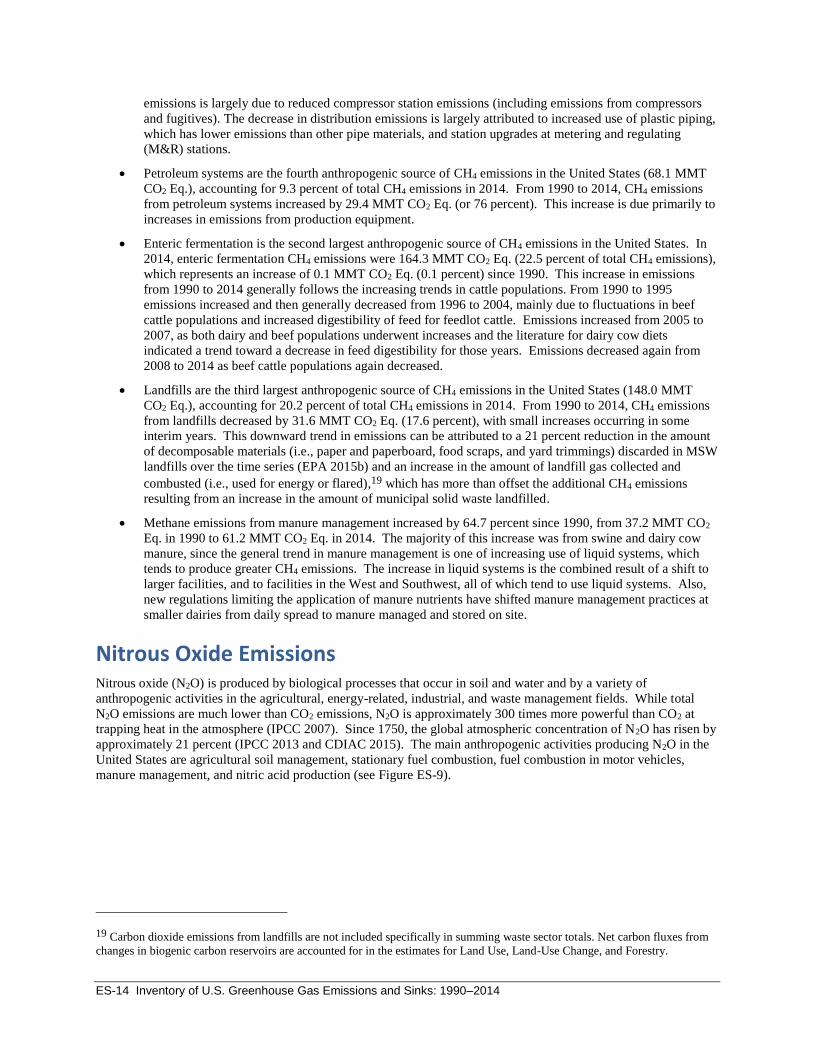
Figure ES-9: 2014 Sources of N2O Emissions (MMT CO2 Eq.)
Some significant trends in U.S. emissions of N2O include the following:
Agricultural soils accounted for approximately 78.9 percent of N2O emissions and 4.6 percent of total
emissions in the United States in 2014. Estimated emissions from this source in 2014 were 318.4 MMT
CO2 Eq. Annual N2O emissions from agricultural soils fluctuated between 1990 and 2014, although overall
emissions were 5.0 percent higher in 2014 than in 1990. Year-to-year fluctuations are largely a reflection
of annual variation in weather patterns, synthetic fertilizer use, and crop production.
Nitrous oxide emissions from stationary combustion increased 11.5 MMT CO2 Eq. (96.4 percent) from
1990 through 2014. Nitrous oxide emissions from this source increased primarily as a result of an increase
in the number of coal fluidized bed boilers in the electric power sector.
In 2014, total N2O emissions from manure management were estimated to be 17.5 MMT CO2 Eq.;
emissions were 14.0 MMT CO2 Eq. in 1990. These values include both direct and indirect N2O emissions
from manure management. Nitrous oxide emissions have remained fairly steady since 1990. Small
changes in N2O emissions from individual animal groups exhibit the same trends as the animal group
populations, with the overall net effect that N2O emissions showed a 24.9 percent increase from 1990 to
2014 and a 0.1 percent decrease from 2013 through 2014. Overall shifts toward liquid systems have driven
down the emissions per unit of nitrogen excreted.
Nitrous oxide emissions from mobile combustion decreased 24.9 MMT CO2 Eq. (60.4 percent) from 1990
through 2014, primarily as a result of N2O national emission control standards and emission control
technologies for on-road vehicles.
Nitrous oxide emissions from adipic acid production were 5.4 MMT CO2 Eq. in 2014, and have decreased
significantly since 1990 due to both the widespread installation of pollution control measures in the late
1990s and plant idling in the late 2000s. Emissions from adipic acid production have decreased by 64.2
percent since 1990 and by 67.8 percent since a peak in 1995.
ES-16 Inventory of U.S. Greenhouse Gas Emissions and Sinks: 1990–2014
HFC, PFC, SF6, and NF3 Emissions Hydrofluorocarbons (HFCs) and perfluorocarbons (PFCs) are families of synthetic chemicals that are used as
alternatives to ozone depleting substances (ODS), which are being phased out under the Montreal Protocol and
Clean Air Act Amendments of 1990. Hydrofluorocarbons and PFCs do not deplete the stratospheric ozone layer,
and are therefore acceptable alternatives under the Montreal Protocol on Substances that Deplete the Ozone Layer.
These compounds, however, along with SF6 and NF3, are potent greenhouse gases. In addition to having high global
warming potentials, SF6 and PFCs have extremely long atmospheric lifetimes, resulting in their essentially
irreversible accumulation in the atmosphere once emitted. Sulfur hexafluoride is the most potent greenhouse gas the
IPCC has evaluated (IPCC 2013).
Other emissive sources of these gases include HCFC-22 production, electrical transmission and distribution systems,
semiconductor manufacturing, aluminum production, and magnesium production and processing (see Figure ES-10).
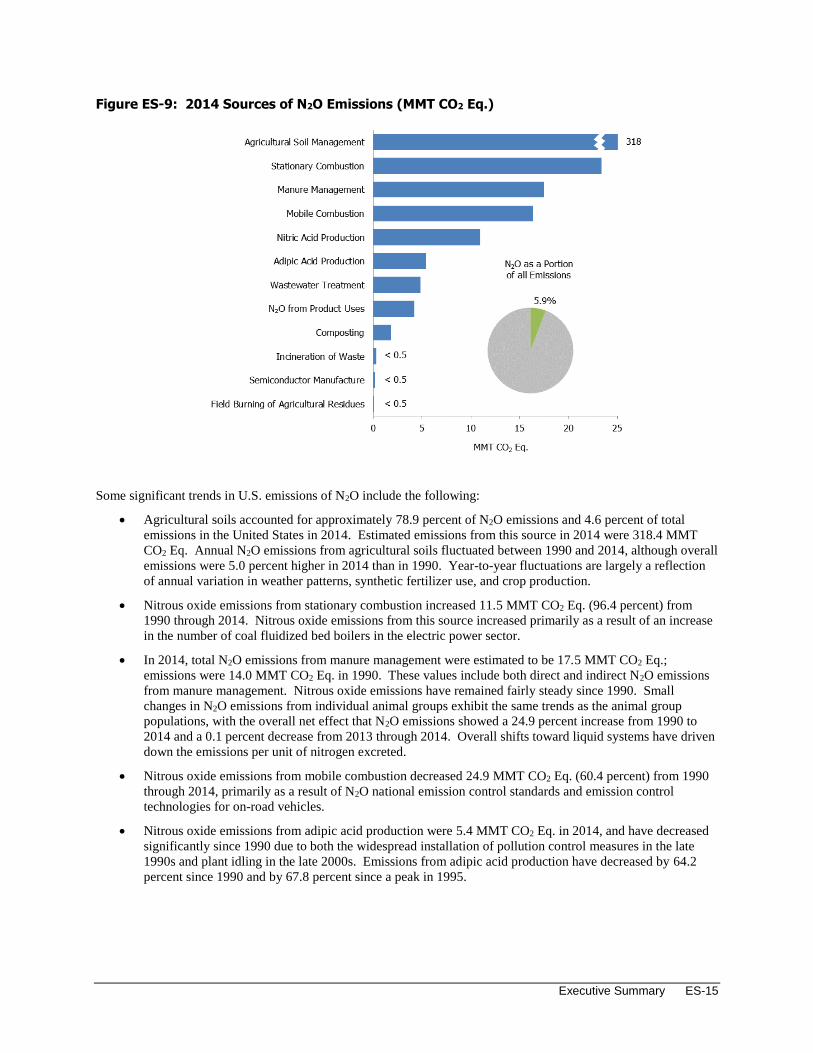
Figure ES-10: 2014 Sources of HFCs, PFCs, SF6, and NF3 Emissions (MMT CO2 Eq.)
Some significant trends in U.S. HFC, PFC, SF6, and NF3 emissions include the following:
Emissions resulting from the substitution of ODS (e.g., chlorofluorocarbons [CFCs]) have been
consistently increasing, from small amounts in 1990 to 161.2 MMT CO2 Eq. in 2014. This increase was in
large part the result of efforts to phase out CFCs and other ODS in the United States. In the short term, this
trend is expected to continue, and will likely continue over the next decade as hydrochlorofluorocarbons
(HCFCs), which are interim substitutes in many applications, are themselves phased out under the
provisions of the Copenhagen Amendments to the Montreal Protocol.
GWP-weighted PFC, HFC, SF6, and NF3 emissions from semiconductor manufacture have increased by
27.4 percent from 1990 to 2014, due to industrial growth and the adoption of emission reduction
technologies. Within that time span, emissions peaked in 1999, the initial year of EPA’s PFC
Reduction/Climate Partnership for the Semiconductor Industry, but have since declined to 4.5 MMT CO2
Eq. in 2014 (a 49.8 percent decrease relative to 1999).
Sulfur hexafluoride emissions from electric power transmission and distribution systems decreased by 77.9
percent (19.8 MMT CO2 Eq.) from 1990 to 2014. There are two potential causes for this decrease: (1) a
sharp increase in the price of SF6 during the 1990s and (2) a growing awareness of the environmental
Executive Summary ES-17
impact of SF6 emissions through programs such as EPA’s SF6 Emission Reduction Partnership for Electric
Power Systems.
Perfluorocarbon emissions from aluminum production decreased by 88.2 percent (18.9 MMT CO2 Eq.)
from 1990 to 2014. This decline is due both to reductions in domestic aluminum production and to actions
taken by aluminum smelting companies to reduce the frequency and duration of anode effects.
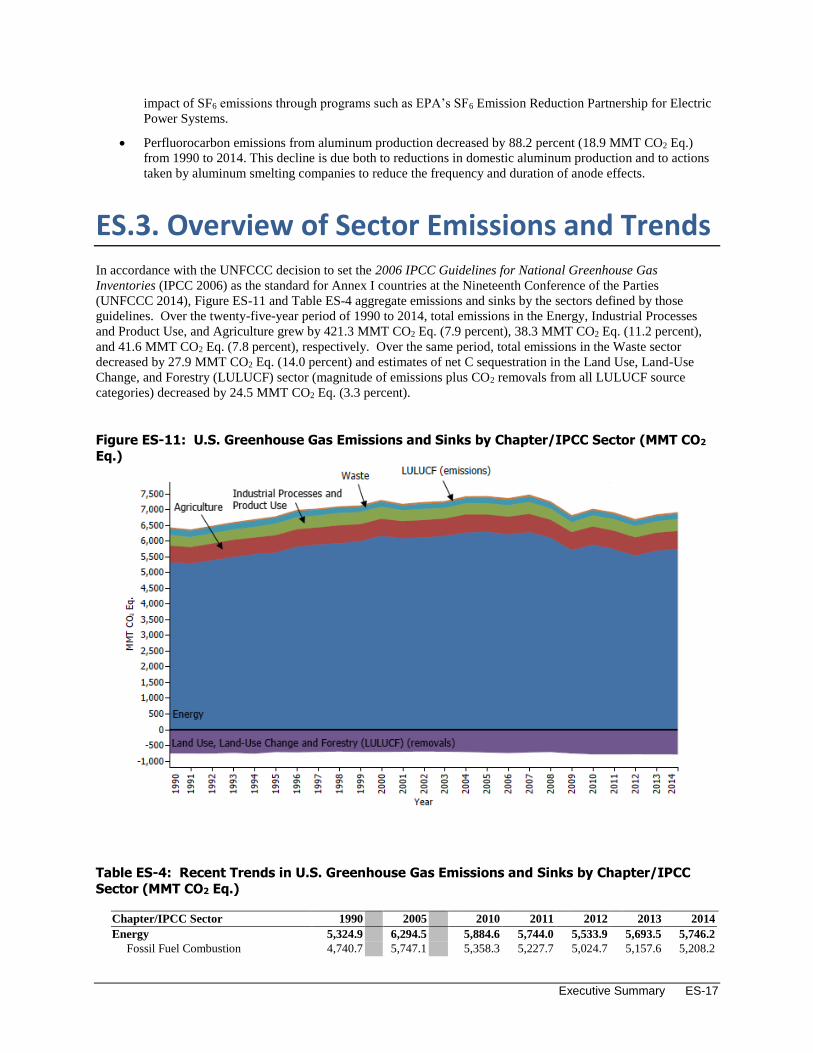
ES.3. Overview of Sector Emissions and Trends In accordance with the UNFCCC decision to set the 2006 IPCC Guidelines for National Greenhouse Gas
Inventories (IPCC 2006) as the standard for Annex I countries at the Nineteenth Conference of the Parties
(UNFCCC 2014), Figure ES-11 and Table ES-4 aggregate emissions and sinks by the sectors defined by those
guidelines. Over the twenty-five-year period of 1990 to 2014, total emissions in the Energy, Industrial Processes
and Product Use, and Agriculture grew by 421.3 MMT CO2 Eq. (7.9 percent), 38.3 MMT CO2 Eq. (11.2 percent),
and 41.6 MMT CO2 Eq. (7.8 percent), respectively. Over the same period, total emissions in the Waste sector
decreased by 27.9 MMT CO2 Eq. (14.0 percent) and estimates of net C sequestration in the Land Use, Land-Use
Change, and Forestry (LULUCF) sector (magnitude of emissions plus CO2 removals from all LULUCF source
categories) decreased by 24.5 MMT CO2 Eq. (3.3 percent).
Figure ES-11: U.S. Greenhouse Gas Emissions and Sinks by Chapter/IPCC Sector (MMT CO2
Eq.)
Table ES-4: Recent Trends in U.S. Greenhouse Gas Emissions and Sinks by Chapter/IPCC
Sector (MMT CO2 Eq.)
Chapter/IPCC Sector 1990 2005 2010 2011 2012 2013 2014
Energy 5,324.9 6,294.5 5,884.6 5,744.0 5,533.9 5,693.5 5,746.2
Fossil Fuel Combustion 4,740.7 5,747.1 5,358.3 5,227.7 5,024.7 5,157.6 5,208.2
ES-18 Inventory of U.S. Greenhouse Gas Emissions and Sinks: 1990–2014
Natural Gas Systems 244.5 207.4 198.6 205.7 207.8 214.0 218.5
Non-Energy Use of Fuels 118.1 138.9 114.1 108.5 105.6 121.7 114.3
Petroleum Systems 42.3 52.8 58.2 60.5 62.2 68.4 71.7
Coal Mining 96.5 64.1 82.3 71.2 66.5 64.6 67.6
Stationary Combustion 20.4 27.6 29.2 28.4 28.0 30.9 31.5
Mobile Combustion 46.9 37.1 25.9 24.7 22.2 20.3 18.4
Incineration of Waste 8.4 12.8 11.4 10.9 10.7 9.7 9.7
Abandoned Underground Coal Mines 7.2 6.6 6.6 6.4 6.2 6.2 6.3
Industrial Processes and Product Use 340.9 354.3 353.0 370.5 360.1 363.5 379.2
Substitution of Ozone Depleting
Substances 0.3 99.7 141.2 145.3 150.2 154.6 161.2
Iron and Steel Production &
Metallurgical Coke Production 99.7 66.6 55.7 59.9 54.2 52.2 55.4
Cement Production 33.3 45.9 31.3 32.0 35.1 36.1 38.8
Petrochemical Production 21.8 27.5 27.3 26.4 26.5 26.5 26.6
Lime Production 11.7 14.6 13.4 14.0 13.7 14.0 14.1
Other Process Uses of Carbonates 4.9 6.3 9.6 9.3 8.0 10.4 12.1
Nitric Acid Production 12.1 11.3 11.5 10.9 10.5 10.7 10.9
Ammonia Production 13.0 9.2 9.2 9.3 9.4 10.0 9.4
Electrical Transmission and
Distribution 25.4 10.6 7.0 6.8 5.6 5.4 5.6
Adipic Acid Production 15.2 7.1 4.2 10.2 5.5 4.0 5.4
Aluminum Production 28.3 7.6 4.6 6.8 6.4 6.2 5.4
HCFC-22 Production 46.1 20.0 8.0 8.8 5.5 4.1 5.0
Semiconductor Manufacture 3.6 4.7 4.0 5.1 4.5 4.2 4.7
Carbon Dioxide Consumption 1.5 1.4 4.4 4.1 4.0 4.2 4.5
N2O from Product Uses 4.2 4.2 4.2 4.2 4.2 4.2 4.2
Urea Consumption for Non-
Agricultural Purposes 3.8 3.7 4.7 4.0 4.4 4.2 4.0
Soda Ash Production and
Consumption 2.8 3.0 2.7 2.7 2.8 2.8 2.8
Ferroalloy Production 2.2 1.4 1.7 1.7 1.9 1.8 1.9
Titanium Dioxide Production 1.2 1.8 1.8 1.7 1.5 1.7 1.8
Glass Production 1.5 1.9 1.5 1.3 1.2 1.3 1.3
Magnesium Production and
Processing 5.2 2.7 2.1 2.8 1.7 1.5 1.2
Phosphoric Acid Production 1.5 1.3 1.1 1.2 1.1 1.1 1.1
Zinc Production 0.6 1.0 1.2 1.3 1.5 1.4 1.0
Lead Production 0.5 0.6 0.5 0.5 0.5 0.5 0.5
Silicon Carbide Production and
Consumption 0.4 0.2 0.2 0.2 0.2 0.2 0.2
Agriculture 532.0 552.2 582.3 583.1 583.3 575.3 573.6
Agricultural Soil Management 303.3 297.2 320.7 323.1 323.1 318.6 318.4
Enteric Fermentation 164.2 168.9 171.3 168.9 166.7 165.5 164.3
Manure Management 51.1 72.9 78.1 78.9 81.2 78.9 78.7
Rice Cultivation 13.1 13.0 11.9 11.8 11.9 11.9 11.9
Field Burning of Agricultural
Residues 0.3 0.3 0.4 0.4 0.4 0.4 0.4
Waste 199.3 177.8 165.5 167.8 165.7 167.8 171.4
Landfills 179.6 154.0 142.1 144.4 142.3 144.3 148.0
Wastewater Treatment 19.0 20.2 19.9 19.9 19.8 19.6 19.5
Composting 0.7 3.5 3.5 3.5 3.7 3.9 3.9
Total Emissionsa 6,397.1 7,378.8 6,985.5 6,865.4 6,643.0 6,800.0 6,870.5
Land Use, Land-Use Change, and
Forestry (738.0) (698.5) (766.4) (762.0) (749.7) (759.6) (762.5)
Forest Land (718.7) (675.8) (736.5) (725.6) (717.4) (726.8) (730.0)
Cropland 38.5 25.9 34.0 17.1 21.1 21.1 22.3
Grassland 26.2 39.8 32.0 43.0 43.9 44.1 44.2
Executive Summary ES-19
Wetlands 1.1 1.1 1.0 0.9 0.8 0.8 0.8
Settlements (59.0) (78.2) (83.8) (84.8) (85.8) (87.1) (88.2)
Other (26.0) (11.4) (13.2) (12.7) (12.2) (11.7) (11.6)
Net Emissions (Sources and Sinks)b 5,659.2 6,680.3 6,219.0 6,103.4 5,893.3 6,040.4 6,108.0
Notes: Total emissions presented without LULUCF. Net emissions presented with LULUCF. a Total emissions without LULUCF. b Total emissions with LULUCF.
Notes: Totals may not sum due to independent rounding. Parentheses indicate negative values or sequestration.
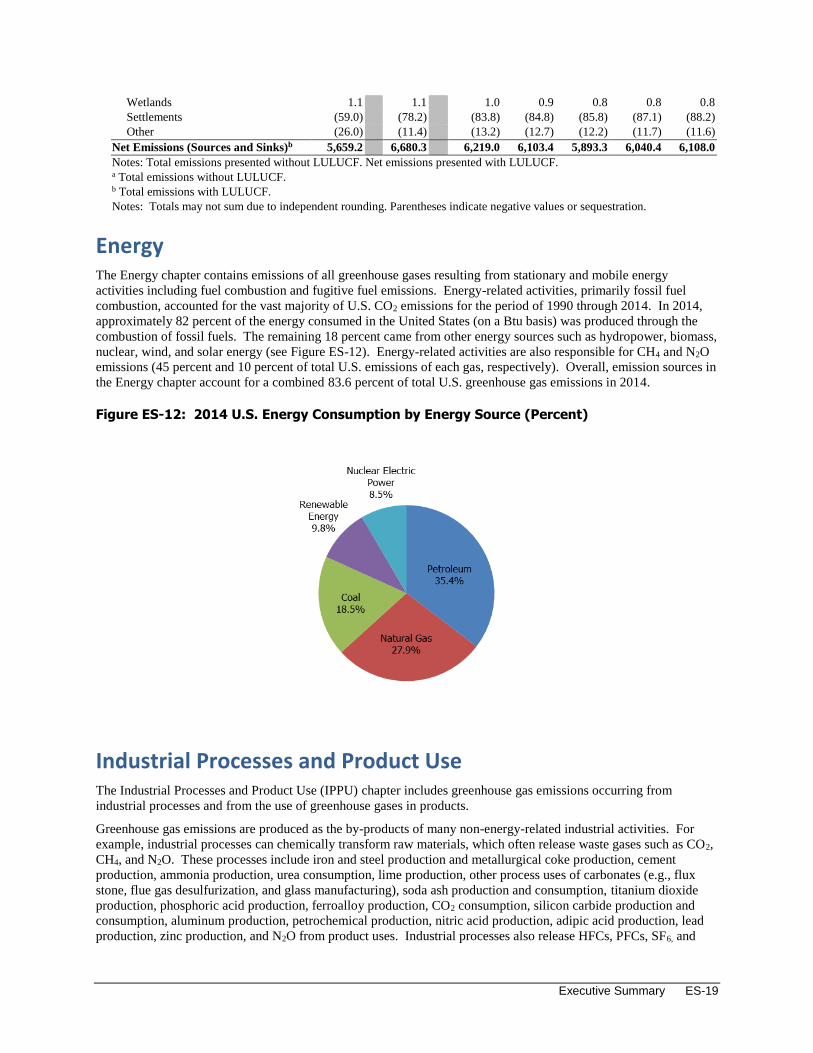
Energy The Energy chapter contains emissions of all greenhouse gases resulting from stationary and mobile energy
activities including fuel combustion and fugitive fuel emissions. Energy-related activities, primarily fossil fuel
combustion, accounted for the vast majority of U.S. CO2 emissions for the period of 1990 through 2014. In 2014,
approximately 82 percent of the energy consumed in the United States (on a Btu basis) was produced through the
combustion of fossil fuels. The remaining 18 percent came from other energy sources such as hydropower, biomass,
nuclear, wind, and solar energy (see Figure ES-12). Energy-related activities are also responsible for CH4 and N2O
emissions (45 percent and 10 percent of total U.S. emissions of each gas, respectively). Overall, emission sources in
the Energy chapter account for a combined 83.6 percent of total U.S. greenhouse gas emissions in 2014.
Figure ES-12: 2014 U.S. Energy Consumption by Energy Source (Percent)
Industrial Processes and Product Use The Industrial Processes and Product Use (IPPU) chapter includes greenhouse gas emissions occurring from
industrial processes and from the use of greenhouse gases in products.
Greenhouse gas emissions are produced as the by-products of many non-energy-related industrial activities. For
example, industrial processes can chemically transform raw materials, which often release waste gases such as CO2,
CH4, and N2O. These processes include iron and steel production and metallurgical coke production, cement
production, ammonia production, urea consumption, lime production, other process uses of carbonates (e.g., flux
stone, flue gas desulfurization, and glass manufacturing), soda ash production and consumption, titanium dioxide
production, phosphoric acid production, ferroalloy production, CO2 consumption, silicon carbide production and
consumption, aluminum production, petrochemical production, nitric acid production, adipic acid production, lead
production, zinc production, and N2O from product uses. Industrial processes also release HFCs, PFCs, SF6, and

ES-20 Inventory of U.S. Greenhouse Gas Emissions and Sinks: 1990–2014
NF3. In addition to their use as ODS substitutes, HFCs, PFCs, SF6, NF3, and other fluorinated compounds are
employed and emitted by a number of other industrial sources in the United States. These industries include
aluminum production, HCFC-22 production, semiconductor manufacture, electric power transmission and
distribution, and magnesium metal production and processing. Overall, emission sources in the Industrial Process
and Product Use chapter account for 5.5 percent of U.S. greenhouse gas emissions in 2014.
Agriculture The Agriculture chapter contains anthropogenic emissions from agricultural activities (except fuel combustion,
which is addressed in the Energy chapter, and agricultural CO2 fluxes, which are addressed in the Land Use, Land-
Use Change, and Forestry chapter). Agricultural activities contribute directly to emissions of greenhouse gases
through a variety of processes, including the following source categories: enteric fermentation in domestic livestock,
livestock manure management, rice cultivation, agricultural soil management, and field burning of agricultural
residues. CH4 and N2O were the primary greenhouse gases emitted by agricultural activities. CH4 emissions from
enteric fermentation and manure management represented 22.5 percent and 8.4 percent of total CH4 emissions from
anthropogenic activities, respectively, in 2014. Agricultural soil management activities such as fertilizer application
and other cropping practices were the largest source of U.S. N2O emissions in 2014, accounting for 78.9 percent. In
2014, emission sources accounted for in the Agricultural chapters were responsible for 8.3 percent of total U.S.
greenhouse gas emissions.
Land Use, Land-Use Change, and Forestry The Land Use, Land-Use Change, and Forestry chapter contains emissions of CH4 and N2O, and emissions and
removals of CO2 from forest management, other land-use activities, and land-use change. Forest management
practices, tree planting in urban areas, the management of agricultural soils, and the landfilling of yard trimmings
and food scraps resulted in a net removal of CO2 (C sequestration) in the United States. Forests (including
vegetation, soils, and harvested wood) accounted for 87 percent of total 2014 CO2 removals, urban trees accounted
for 11 percent, landfilled yard trimmings and food scraps accounted for 1.4 percent, and mineral and organic soil C
stock changes from Cropland Remaining Cropland accounted for 1.0 percent of the total CO2 removals in 2014. The
net forest sequestration is a result of net forest growth and increasing forest area, as well as a net accumulation of C
stocks in harvested wood pools. The net sequestration in urban forests is a result of net tree growth in these areas.
In agricultural soils, mineral and organic soils sequester approximately as much C as is emitted from these soils
through liming and urea fertilization. The mineral soil C sequestration is largely due to the conversion of cropland
to permanent pastures and hay production, a reduction in summer fallow areas in semi-arid areas, an increase in the
adoption of conservation tillage practices, and an increase in the amounts of organic fertilizers (i.e., manure and
sewage sludge) applied to agriculture lands. The landfilled yard trimmings and food scraps net sequestration is due
to the long-term accumulation of yard trimming carbon and food scraps in landfills.
LULUCF activities in 2014 resulted in a net increase in C stocks (i.e., net CO2 removals) of 787.0 MMT CO2 Eq.
(Table ES-5). 20 This represents an offset of 11.5 percent of total (i.e., gross) greenhouse gas emissions in 2014.
Emissions from land use, land-use change, and forestry activities in 2014 are 24.6 MMT CO2 Eq. and represent 0.4
percent of total greenhouse gas emissions.21 Between 1990 and 2014, total C sequestration in the LULUCF sector
increased by 4.5 percent, primarily due to an increase in the rate of net C accumulation in forest and urban tree C
stocks. Annual C accumulation in landfilled yard trimmings and food scraps slowed over this period, while the rate
of annual C accumulation increased in urban trees.
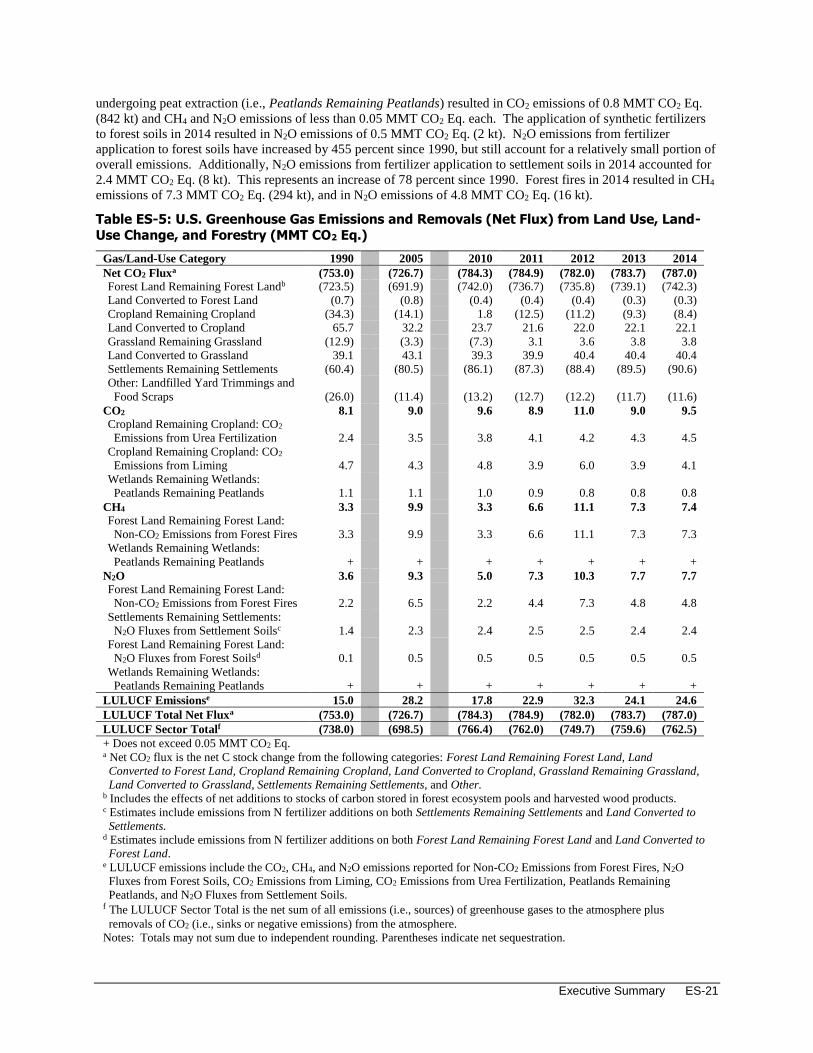
Carbon dioxide removals are presented in Table ES-5 along with CO2, CH4, and N2O emissions for LULUCF source
categories. Liming and urea fertilization in 2014 resulted in CO2 emissions of 8.7 MMT CO2 Eq. (8,653 kt). Lands
20 Net CO2 flux is the net C stock change from the following categories: Forest Land Remaining Forest Land, Land Converted to
Forest Land, Cropland Remaining Cropland, Land Converted to Cropland, Grassland Remaining Grassland, Land Converted
to Grassland, Settlements Remaining Settlements, and Other. 21 LULUCF emissions include the CO2, CH4, and N2O emissions reported for Non-CO2 Emissions from Forest Fires, N2O
Fluxes from Forest Soils, CO2 Emissions from Liming, CO2 Emissions from Urea Fertilization, Peatlands Remaining Peatlands,
and N2O Fluxes from Settlement Soils.
Executive Summary ES-21
undergoing peat extraction (i.e., Peatlands Remaining Peatlands) resulted in CO2 emissions of 0.8 MMT CO2 Eq.
(842 kt) and CH4 and N2O emissions of less than 0.05 MMT CO2 Eq. each. The application of synthetic fertilizers
to forest soils in 2014 resulted in N2O emissions of 0.5 MMT CO2 Eq. (2 kt). N2O emissions from fertilizer
application to forest soils have increased by 455 percent since 1990, but still account for a relatively small portion of
overall emissions. Additionally, N2O emissions from fertilizer application to settlement soils in 2014 accounted for
2.4 MMT CO2 Eq. (8 kt). This represents an increase of 78 percent since 1990. Forest fires in 2014 resulted in CH4
emissions of 7.3 MMT CO2 Eq. (294 kt), and in N2O emissions of 4.8 MMT CO2 Eq. (16 kt).
Table ES-5: U.S. Greenhouse Gas Emissions and Removals (Net Flux) from Land Use, Land-Use Change, and Forestry (MMT CO2 Eq.)
Gas/Land-Use Category 1990 2005 2010 2011 2012 2013 2014
Net CO2 Fluxa (753.0) (726.7) (784.3) (784.9) (782.0) (783.7) (787.0) Forest Land Remaining Forest Landb (723.5) (691.9) (742.0) (736.7) (735.8) (739.1) (742.3)
Land Converted to Forest Land (0.7) (0.8) (0.4) (0.4) (0.4) (0.3) (0.3)
Cropland Remaining Cropland (34.3) (14.1) 1.8 (12.5) (11.2) (9.3) (8.4)
Land Converted to Cropland 65.7 32.2 23.7 21.6 22.0 22.1 22.1
Grassland Remaining Grassland (12.9) (3.3) (7.3) 3.1 3.6 3.8 3.8
Land Converted to Grassland 39.1 43.1 39.3 39.9 40.4 40.4 40.4
Settlements Remaining Settlements (60.4) (80.5) (86.1) (87.3) (88.4) (89.5) (90.6)
Other: Landfilled Yard Trimmings and
Food Scraps (26.0) (11.4) (13.2) (12.7) (12.2) (11.7) (11.6)
CO2 8.1 9.0 9.6 8.9 11.0 9.0 9.5 Cropland Remaining Cropland: CO2
Emissions from Urea Fertilization 2.4 3.5 3.8 4.1 4.2 4.3 4.5
Cropland Remaining Cropland: CO2
Emissions from Liming 4.7 4.3 4.8 3.9 6.0 3.9 4.1
Wetlands Remaining Wetlands:
Peatlands Remaining Peatlands 1.1 1.1 1.0 0.9 0.8 0.8 0.8
CH4 3.3 9.9 3.3 6.6 11.1 7.3 7.4 Forest Land Remaining Forest Land:
Non-CO2 Emissions from Forest Fires 3.3 9.9 3.3 6.6 11.1 7.3 7.3
Wetlands Remaining Wetlands:
Peatlands Remaining Peatlands + + + + + + +
N2O 3.6 9.3 5.0 7.3 10.3 7.7 7.7 Forest Land Remaining Forest Land:
Non-CO2 Emissions from Forest Fires 2.2 6.5 2.2 4.4 7.3 4.8 4.8
Settlements Remaining Settlements:
N2O Fluxes from Settlement Soilsc 1.4 2.3 2.4 2.5 2.5 2.4 2.4
Forest Land Remaining Forest Land:
N2O Fluxes from Forest Soilsd 0.1 0.5 0.5 0.5 0.5 0.5 0.5
Wetlands Remaining Wetlands:
Peatlands Remaining Peatlands + + + + + + +
LULUCF Emissionse 15.0 28.2 17.8 22.9 32.3 24.1 24.6
LULUCF Total Net Fluxa (753.0) (726.7) (784.3) (784.9) (782.0) (783.7) (787.0)
LULUCF Sector Totalf (738.0) (698.5) (766.4) (762.0) (749.7) (759.6) (762.5)
+ Does not exceed 0.05 MMT CO2 Eq. a Net CO2 flux is the net C stock change from the following categories: Forest Land Remaining Forest Land, Land
Converted to Forest Land, Cropland Remaining Cropland, Land Converted to Cropland, Grassland Remaining Grassland,
Land Converted to Grassland, Settlements Remaining Settlements, and Other. b Includes the effects of net additions to stocks of carbon stored in forest ecosystem pools and harvested wood products. c Estimates include emissions from N fertilizer additions on both Settlements Remaining Settlements and Land Converted to
Settlements. d Estimates include emissions from N fertilizer additions on both Forest Land Remaining Forest Land and Land Converted to
Forest Land. e LULUCF emissions include the CO2, CH4, and N2O emissions reported for Non-CO2 Emissions from Forest Fires, N2O
Fluxes from Forest Soils, CO2 Emissions from Liming, CO2 Emissions from Urea Fertilization, Peatlands Remaining
Peatlands, and N2O Fluxes from Settlement Soils. f The LULUCF Sector Total is the net sum of all emissions (i.e., sources) of greenhouse gases to the atmosphere plus
removals of CO2 (i.e., sinks or negative emissions) from the atmosphere.
Notes: Totals may not sum due to independent rounding. Parentheses indicate net sequestration.
ES-22 Inventory of U.S. Greenhouse Gas Emissions and Sinks: 1990–2014
Waste The Waste chapter contains emissions from waste management activities (except incineration of waste, which is
addressed in the Energy chapter). Landfills were the largest source of anthropogenic greenhouse gas emissions in
the Waste chapter, accounting for 86.3 percent of this chapter’s emissions, and 20.2 percent of total U.S. CH4
emissions.22 Additionally, wastewater treatment accounts for 11.4 percent of Waste emissions, 2.0 percent of U.S.
CH4 emissions, and 1.2 percent of U.S. N2O emissions. Emissions of CH4 and N2O from composting are also
accounted for in this chapter, generating emissions of 2.1 MMT CO2 Eq. and 1.8 MMT CO2 Eq., respectively.
Overall, emission sources accounted for in the Waste chapter generated 2.5 percent of total U.S. greenhouse gas
emissions in 2014.
ES.4. Other Information
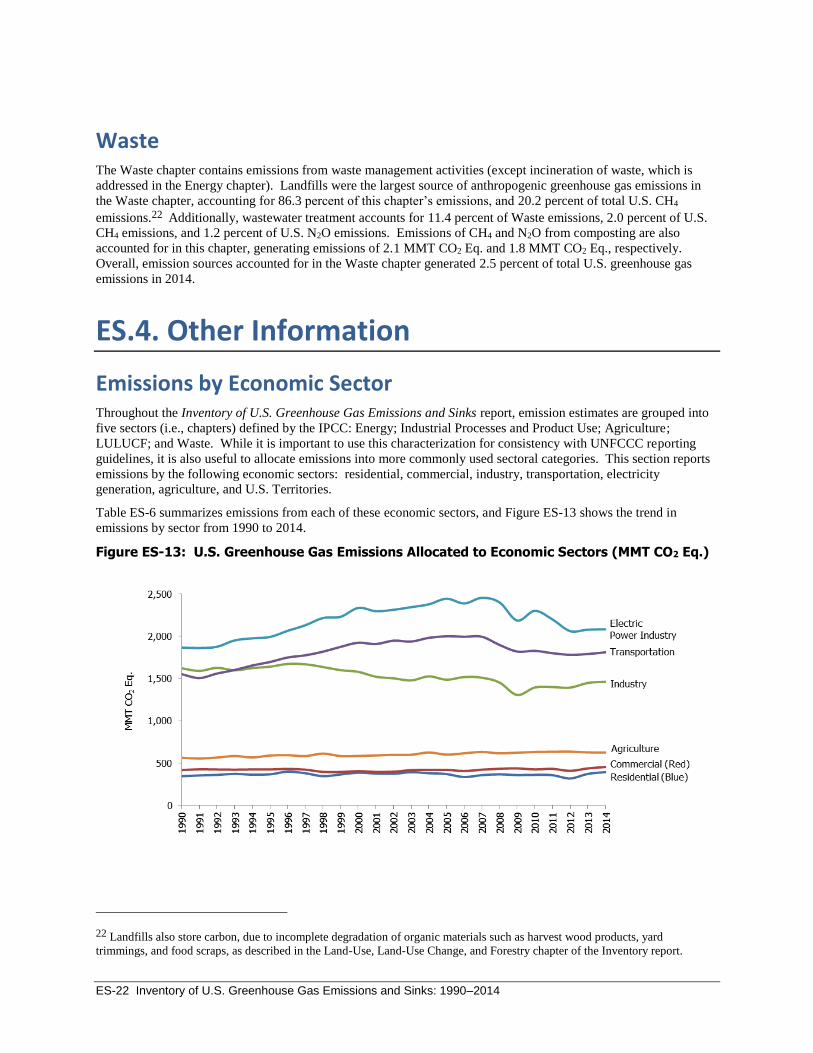
Emissions by Economic Sector Throughout the Inventory of U.S. Greenhouse Gas Emissions and Sinks report, emission estimates are grouped into
five sectors (i.e., chapters) defined by the IPCC: Energy; Industrial Processes and Product Use; Agriculture;
LULUCF; and Waste. While it is important to use this characterization for consistency with UNFCCC reporting
guidelines, it is also useful to allocate emissions into more commonly used sectoral categories. This section reports
emissions by the following economic sectors: residential, commercial, industry, transportation, electricity
generation, agriculture, and U.S. Territories.
Table ES-6 summarizes emissions from each of these economic sectors, and Figure ES-13 shows the trend in
emissions by sector from 1990 to 2014.
Figure ES-13: U.S. Greenhouse Gas Emissions Allocated to Economic Sectors (MMT CO2 Eq.)
22 Landfills also store carbon, due to incomplete degradation of organic materials such as harvest wood products, yard
trimmings, and food scraps, as described in the Land-Use, Land-Use Change, and Forestry chapter of the Inventory report.
Executive Summary ES-23
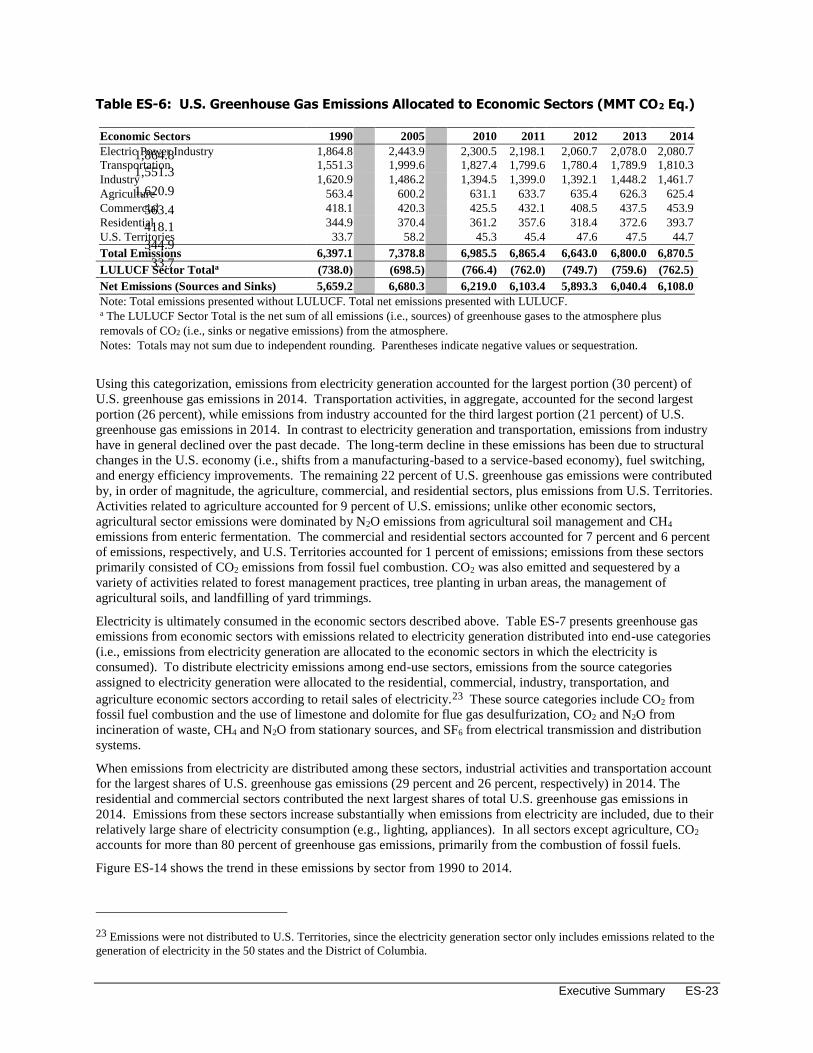
Table ES-6: U.S. Greenhouse Gas Emissions Allocated to Economic Sectors (MMT CO2 Eq.)
Economic Sectors 1990 2005 2010 2011 2012 2013 2014
1,864.8
1,551.3
1,620.9
563.4
418.1
344.9
33.7
Electric Power Industry 1,864.8 2,443.9 2,300.5 2,198.1 2,060.7 2,078.0 2,080.7
Transportation 1,551.3 1,999.6 1,827.4 1,799.6 1,780.4 1,789.9 1,810.3
Industry 1,620.9 1,486.2 1,394.5 1,399.0 1,392.1 1,448.2 1,461.7
Agriculture 563.4 600.2 631.1 633.7 635.4 626.3 625.4
Commercial 418.1 420.3 425.5 432.1 408.5 437.5 453.9
Residential 344.9 370.4 361.2 357.6 318.4 372.6 393.7
U.S. Territories 33.7 58.2 45.3 45.4 47.6 47.5 44.7
Total Emissions 6,397.1 7,378.8 6,985.5 6,865.4 6,643.0 6,800.0 6,870.5
LULUCF Sector Totala (738.0) (698.5) (766.4) (762.0) (749.7) (759.6) (762.5)
Net Emissions (Sources and Sinks) 5,659.2 6,680.3 6,219.0 6,103.4 5,893.3 6,040.4 6,108.0
Note: Total emissions presented without LULUCF. Total net emissions presented with LULUCF. a The LULUCF Sector Total is the net sum of all emissions (i.e., sources) of greenhouse gases to the atmosphere plus
removals of CO2 (i.e., sinks or negative emissions) from the atmosphere.
Notes: Totals may not sum due to independent rounding. Parentheses indicate negative values or sequestration.
Using this categorization, emissions from electricity generation accounted for the largest portion (30 percent) of
U.S. greenhouse gas emissions in 2014. Transportation activities, in aggregate, accounted for the second largest
portion (26 percent), while emissions from industry accounted for the third largest portion (21 percent) of U.S.
greenhouse gas emissions in 2014. In contrast to electricity generation and transportation, emissions from industry
have in general declined over the past decade. The long-term decline in these emissions has been due to structural
changes in the U.S. economy (i.e., shifts from a manufacturing-based to a service-based economy), fuel switching,
and energy efficiency improvements. The remaining 22 percent of U.S. greenhouse gas emissions were contributed
by, in order of magnitude, the agriculture, commercial, and residential sectors, plus emissions from U.S. Territories.
Activities related to agriculture accounted for 9 percent of U.S. emissions; unlike other economic sectors,
agricultural sector emissions were dominated by N2O emissions from agricultural soil management and CH4
emissions from enteric fermentation. The commercial and residential sectors accounted for 7 percent and 6 percent
of emissions, respectively, and U.S. Territories accounted for 1 percent of emissions; emissions from these sectors
primarily consisted of CO2 emissions from fossil fuel combustion. CO2 was also emitted and sequestered by a
variety of activities related to forest management practices, tree planting in urban areas, the management of
agricultural soils, and landfilling of yard trimmings.
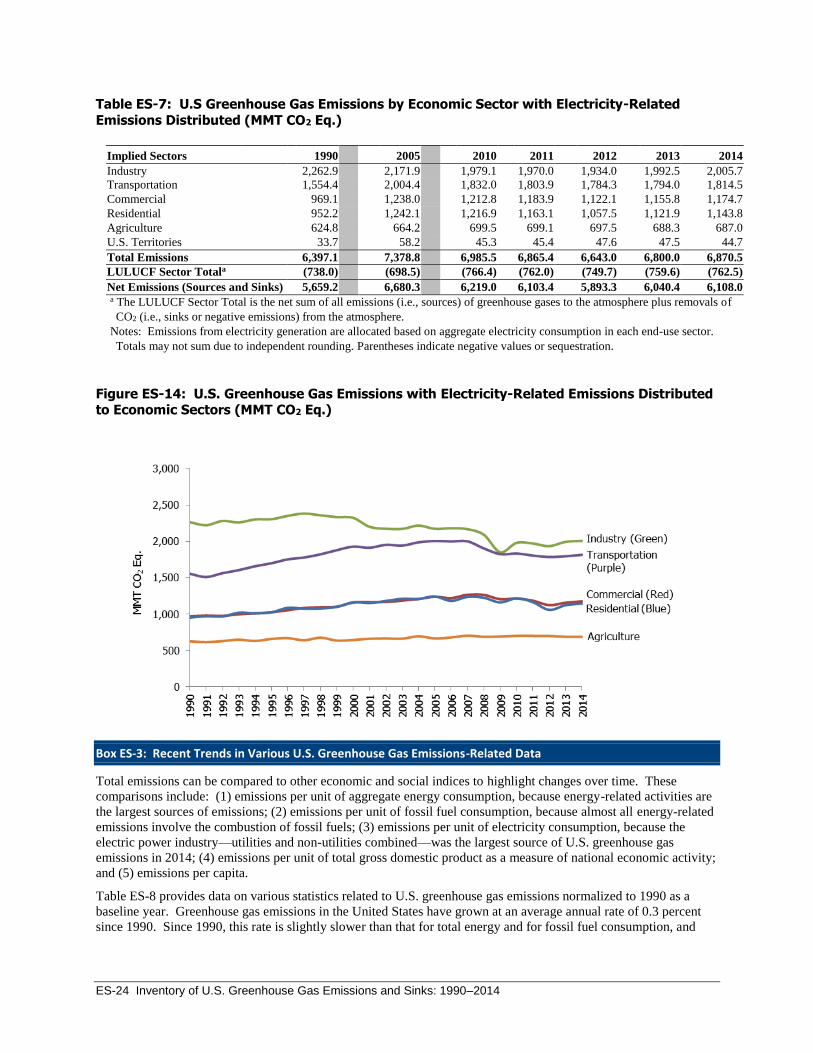
Electricity is ultimately consumed in the economic sectors described above. Table ES-7 presents greenhouse gas
emissions from economic sectors with emissions related to electricity generation distributed into end-use categories
(i.e., emissions from electricity generation are allocated to the economic sectors in which the electricity is
consumed). To distribute electricity emissions among end-use sectors, emissions from the source categories
assigned to electricity generation were allocated to the residential, commercial, industry, transportation, and
agriculture economic sectors according to retail sales of electricity.23 These source categories include CO2 from
fossil fuel combustion and the use of limestone and dolomite for flue gas desulfurization, CO2 and N2O from
incineration of waste, CH4 and N2O from stationary sources, and SF6 from electrical transmission and distribution
systems.
When emissions from electricity are distributed among these sectors, industrial activities and transportation account
for the largest shares of U.S. greenhouse gas emissions (29 percent and 26 percent, respectively) in 2014. The
residential and commercial sectors contributed the next largest shares of total U.S. greenhouse gas emissions in
2014. Emissions from these sectors increase substantially when emissions from electricity are included, due to their
relatively large share of electricity consumption (e.g., lighting, appliances). In all sectors except agriculture, CO2
accounts for more than 80 percent of greenhouse gas emissions, primarily from the combustion of fossil fuels.
Figure ES-14 shows the trend in these emissions by sector from 1990 to 2014.
23 Emissions were not distributed to U.S. Territories, since the electricity generation sector only includes emissions related to the
generation of electricity in the 50 states and the District of Columbia.
ES-24 Inventory of U.S. Greenhouse Gas Emissions and Sinks: 1990–2014
Table ES-7: U.S Greenhouse Gas Emissions by Economic Sector with Electricity-Related
Emissions Distributed (MMT CO2 Eq.)
Implied Sectors 1990 2005 2010 2011 2012 2013 2014
Industry 2,262.9 2,171.9 1,979.1 1,970.0 1,934.0 1,992.5 2,005.7 Transportation 1,554.4 2,004.4 1,832.0 1,803.9 1,784.3 1,794.0 1,814.5 Commercial 969.1 1,238.0 1,212.8 1,183.9 1,122.1 1,155.8 1,174.7 Residential 952.2 1,242.1 1,216.9 1,163.1 1,057.5 1,121.9 1,143.8
Agriculture 624.8 664.2 699.5 699.1 697.5 688.3 687.0 U.S. Territories 33.7 58.2 45.3 45.4 47.6 47.5 44.7 Total Emissions 6,397.1 7,378.8 6,985.5 6,865.4 6,643.0 6,800.0 6,870.5 LULUCF Sector Totala (738.0) (698.5) (766.4) (762.0) (749.7) (759.6) (762.5)
Net Emissions (Sources and Sinks) 5,659.2 6,680.3 6,219.0 6,103.4 5,893.3 6,040.4 6,108.0
a The LULUCF Sector Total is the net sum of all emissions (i.e., sources) of greenhouse gases to the atmosphere plus removals of
CO2 (i.e., sinks or negative emissions) from the atmosphere.
Notes: Emissions from electricity generation are allocated based on aggregate electricity consumption in each end-use sector.
Totals may not sum due to independent rounding. Parentheses indicate negative values or sequestration.
Figure ES-14: U.S. Greenhouse Gas Emissions with Electricity-Related Emissions Distributed to Economic Sectors (MMT CO2 Eq.)
Box ES-3: Recent Trends in Various U.S. Greenhouse Gas Emissions-Related Data
Total emissions can be compared to other economic and social indices to highlight changes over time. These
comparisons include: (1) emissions per unit of aggregate energy consumption, because energy-related activities are
the largest sources of emissions; (2) emissions per unit of fossil fuel consumption, because almost all energy-related
emissions involve the combustion of fossil fuels; (3) emissions per unit of electricity consumption, because the
electric power industry—utilities and non-utilities combined—was the largest source of U.S. greenhouse gas
emissions in 2014; (4) emissions per unit of total gross domestic product as a measure of national economic activity;
and (5) emissions per capita.
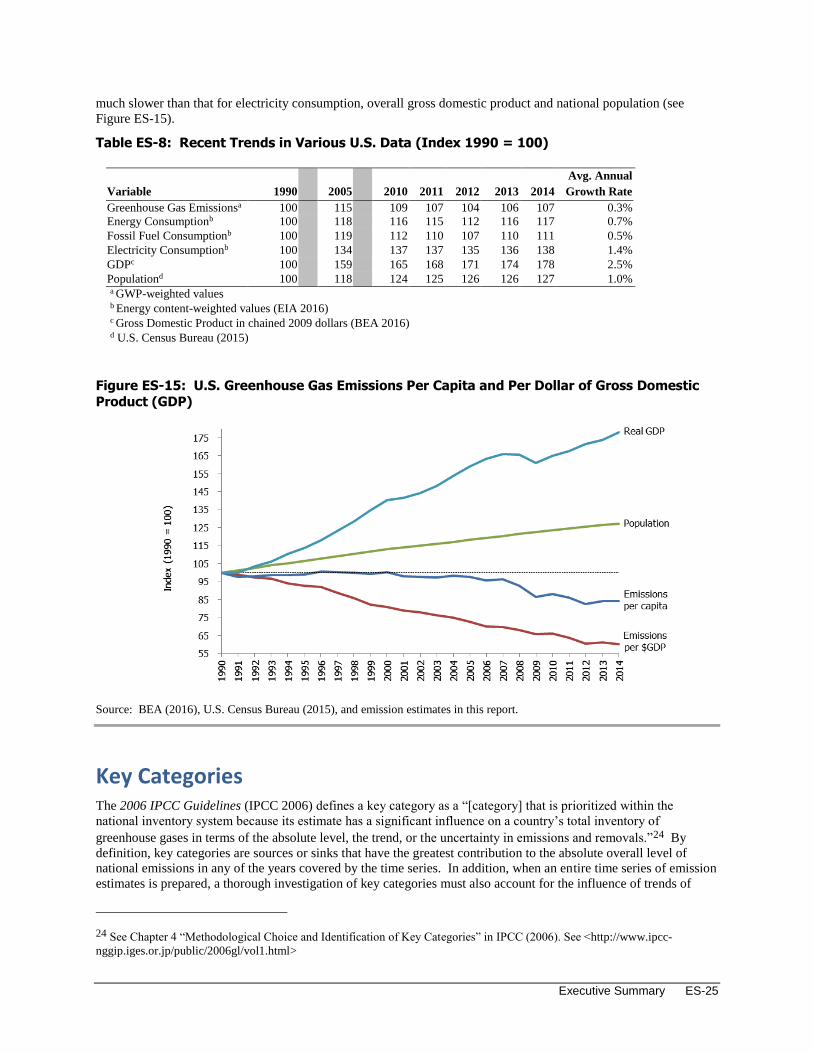
Table ES-8 provides data on various statistics related to U.S. greenhouse gas emissions normalized to 1990 as a
baseline year. Greenhouse gas emissions in the United States have grown at an average annual rate of 0.3 percent
since 1990. Since 1990, this rate is slightly slower than that for total energy and for fossil fuel consumption, and
Executive Summary ES-25
much slower than that for electricity consumption, overall gross domestic product and national population (see
Figure ES-15).
Table ES-8: Recent Trends in Various U.S. Data (Index 1990 = 100)
Variable 1990 2005 2010 2011 2012 2013 2014
Avg. Annual
Growth Rate
Greenhouse Gas Emissionsa 100 115 109 107 104 106 107 0.3% Energy Consumptionb 100 118 116 115 112 116 117 0.7% Fossil Fuel Consumptionb 100 119 112 110 107 110 111 0.5% Electricity Consumptionb 100 134 137 137 135 136 138 1.4% GDPc 100 159 165 168 171 174 178 2.5% Populationd 100 118 124 125 126 126 127 1.0% a GWP-weighted values
b Energy content-weighted values (EIA 2016) c Gross Domestic Product in chained 2009 dollars (BEA 2016) d U.S. Census Bureau (2015)
Figure ES-15: U.S. Greenhouse Gas Emissions Per Capita and Per Dollar of Gross Domestic
Product (GDP)
Source: BEA (2016), U.S. Census Bureau (2015), and emission estimates in this report.
Key Categories The 2006 IPCC Guidelines (IPCC 2006) defines a key category as a “[category] that is prioritized within the
national inventory system because its estimate has a significant influence on a country’s total inventory of
greenhouse gases in terms of the absolute level, the trend, or the uncertainty in emissions and removals.”24 By
definition, key categories are sources or sinks that have the greatest contribution to the absolute overall level of
national emissions in any of the years covered by the time series. In addition, when an entire time series of emission
estimates is prepared, a thorough investigation of key categories must also account for the influence of trends of
24 See Chapter 4 “Methodological Choice and Identification of Key Categories” in IPCC (2006). See <http://www.ipcc-
nggip.iges.or.jp/public/2006gl/vol1.html>
ES-26 Inventory of U.S. Greenhouse Gas Emissions and Sinks: 1990–2014
individual source and sink categories. Finally, a qualitative evaluation of key categories should be performed, in
order to capture any key categories that were not identified in either of the quantitative analyses.
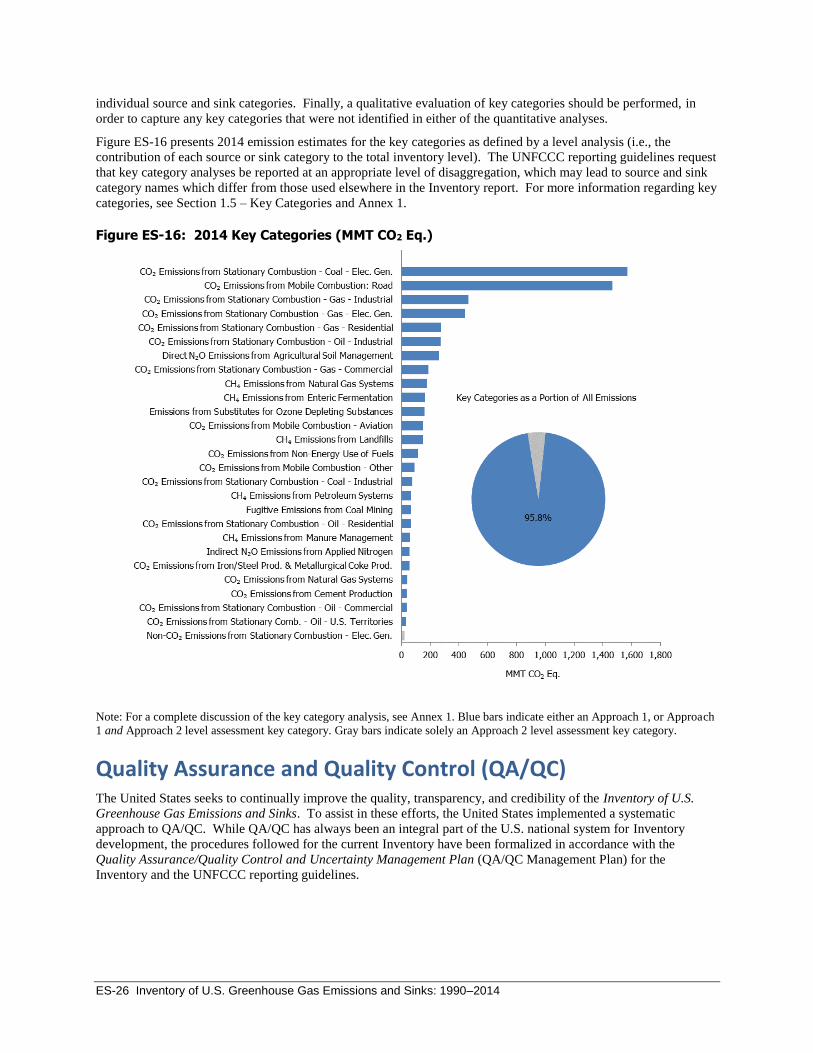
Figure ES-16 presents 2014 emission estimates for the key categories as defined by a level analysis (i.e., the
contribution of each source or sink category to the total inventory level). The UNFCCC reporting guidelines request
that key category analyses be reported at an appropriate level of disaggregation, which may lead to source and sink
category names which differ from those used elsewhere in the Inventory report. For more information regarding key
categories, see Section 1.5 – Key Categories and Annex 1.
Figure ES-16: 2014 Key Categories (MMT CO2 Eq.)
Note: For a complete discussion of the key category analysis, see Annex 1. Blue bars indicate either an Approach 1, or Approach
1 and Approach 2 level assessment key category. Gray bars indicate solely an Approach 2 level assessment key category.
Quality Assurance and Quality Control (QA/QC) The United States seeks to continually improve the quality, transparency, and credibility of the Inventory of U.S.
Greenhouse Gas Emissions and Sinks. To assist in these efforts, the United States implemented a systematic
approach to QA/QC. While QA/QC has always been an integral part of the U.S. national system for Inventory
development, the procedures followed for the current Inventory have been formalized in accordance with the
Quality Assurance/Quality Control and Uncertainty Management Plan (QA/QC Management Plan) for the
Inventory and the UNFCCC reporting guidelines.
Executive Summary ES-27
Uncertainty Analysis of Emission Estimates Uncertainty estimates are an essential element of a complete inventory of greenhouse gas emissions and removals.
Some of the current estimates, such as those for CO2 emissions from energy-related activities and cement
processing, are considered to have low uncertainties. For some other categories of emissions, however, a lack of
data or an incomplete understanding of how emissions are generated increases the uncertainty associated with the
estimates presented. Acquiring a better understanding of the uncertainty associated with inventory estimates is an
important step in helping to prioritize future work and improve the overall quality of the Inventory. Recognizing the
benefit of conducting an uncertainty analysis, the UNFCCC reporting guidelines follow the recommendations of the
2006 IPCC Guidelines (IPCC 2006) and require that countries provide single estimates of uncertainty for source and
sink categories.
Currently, a qualitative discussion of uncertainty is presented for all source and sink categories. Within the
discussion of each emission source, specific factors affecting the uncertainty surrounding the estimates are
discussed. Most sources also contain a quantitative uncertainty assessment, in accordance with UNFCCC reporting
guidelines.
Box ES-4: Recalculations of Inventory Estimates
Each year, emission and sink estimates are recalculated and revised for all years in the Inventory of U.S. Greenhouse
Gas Emissions and Sinks, as attempts are made to improve both the analyses themselves, through the use of better
methods or data, and the overall usefulness of the report. In this effort, the United States follows the 2006 IPCC
Guidelines (IPCC 2006), which states, “Both methodological changes and refinements over time are an essential
part of improving inventory quality. It is good practice to change or refine methods when: available data have
changed; the previously used method is not consistent with the IPCC guidelines for that category; a category has
become key; the previously used method is insufficient to reflect mitigation activities in a transparent manner; the
capacity for inventory preparation has increased; new inventory methods become available; and for correction of
errors.” In general, recalculations are made to the U.S. greenhouse gas emission estimates either to incorporate new
methodologies or, most commonly, to update recent historical data.
In each Inventory report, the results of all methodology changes and historical data updates are presented in the
Recalculations and Improvements chapter; detailed descriptions of each recalculation are contained within each
source's description contained in the report, if applicable. In general, when methodological changes have been
implemented, the entire time series (in the case of the most recent Inventory report, 1990 through 2013) has been
recalculated to reflect the change, per the 2006 IPCC Guidelines (IPCC 2006). Changes in historical data are
generally the result of changes in statistical data supplied by other agencies. References for the data are provided for
additional information.
Top Related