


Languages
Pages
Legal

Introduction to Epidemiology by
Dr. M.Logaraj, M.D,Dept. of community medicine

How these inferences are arrived
Normal pulse rate 60-90/minute Measles & chicken pox mostly occurs during
spring Cancer of stomach more common in Japanese Lung cancer is common among smokers Paracetomol is 90% effective in headache Metronidazole is effective against Amoebiasis
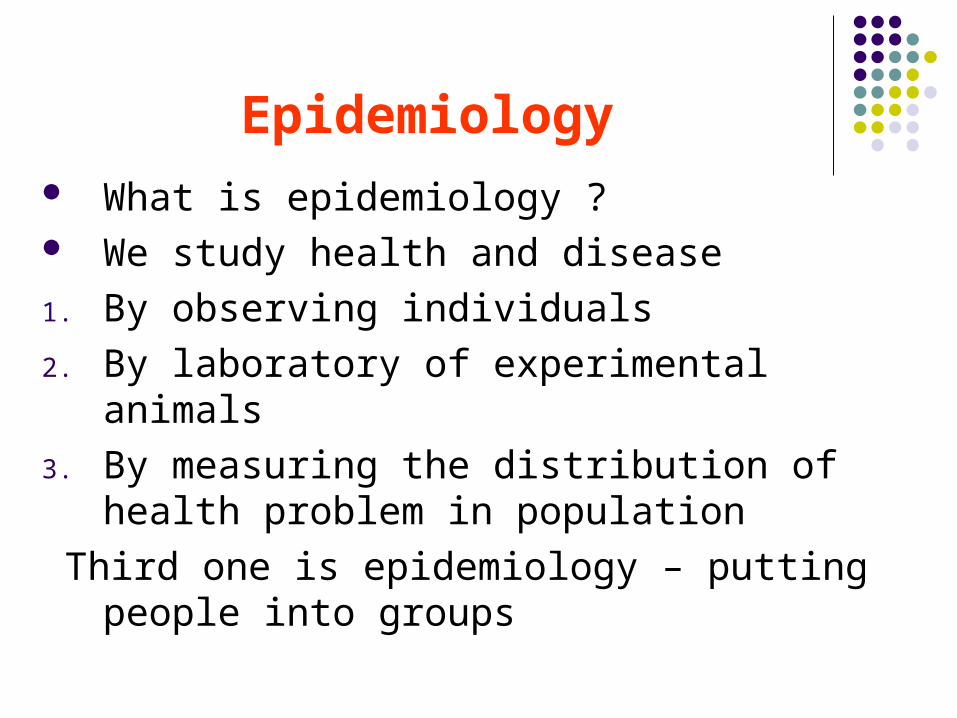
Epidemiology What is epidemiology ? We study health and disease
1. By observing individuals
2. By laboratory of experimental animals
3. By measuring the distribution of health problem in population
Third one is epidemiology – putting people into groups

John snow- epidemic of cholera
Located the home of each person of cholera in London 1854
Found out association between source of water supply and cholera
Cholera – spread by contaminated water before discovery of the organism of cholera

John snow
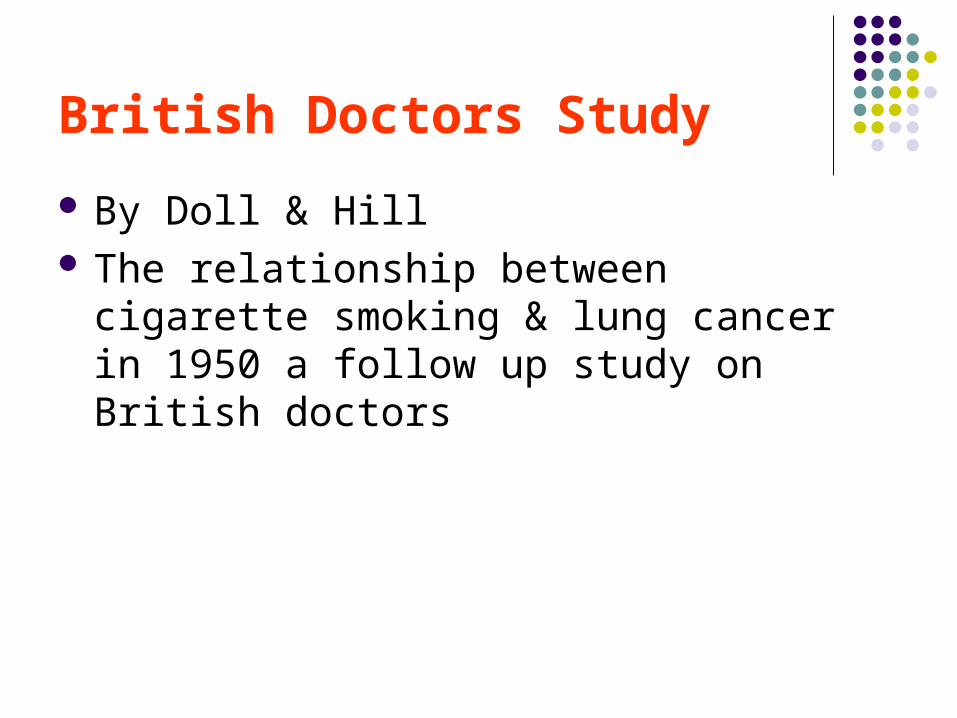
British Doctors Study
By Doll & Hill The relationship between cigarette smoking
& lung cancer in 1950 a follow up study on British doctors

Epidemiology
Epidemiology derived from Greek word Epi-- on or upon demos-- people logos-- the study The study upon the people or population
Definition
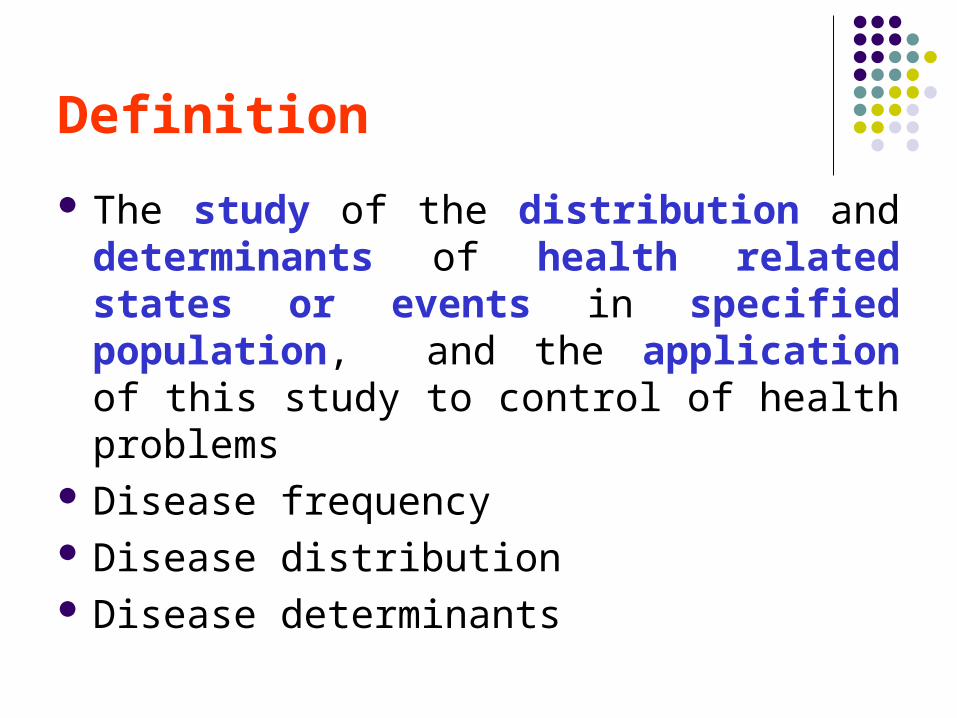
The study of the distribution and determinants of health related states or events in specified population, and the application of this study to control of health problems
Disease frequency Disease distribution Disease determinants

Disease frequency
Epidemiology is concerned with the frequency and pattern of health events in a population
Measurements of frequency of disease, disability or death in the form of rates and ratios
Rates are essential for the comparison of frequency in different population
Comparison may yield important clue for the etiology or formulation of etiological hypothesis

Distribution of disease
Time characteristics include annual occurrence, seasonal occurrence and daily or even hourly occurrence during an epidemic
Place characteristics include geographic variation, urban- rural differences.
Personal characteristics include age, sex, race, marital status, socioeconomic status, Behaviour and environmental exposure
This aspect of study is called as descriptive study
Descriptive epidemiology provides what, when, and where of health related events
What is the event or disease? What is the magnitude? When did it happen? Where did it happen? Who are affected? The important out come distribution study is
formulation of etiological hypothesis

Determinants of disease
Test the etiological hypothesis and identify the underlying causes or risk factors of disease
This aspect of epidemiology is Analytical epidemiology
Which provides why and how of such events by comparing groups with different rates of disease occurrence.
By searching the differences in the characteristics between the diseased and healthy

Making comparison
The basic approach in epidemiology is to make comparison and draw conclusion
By comparison we try to find out curial differences in the host and environmental factors between those affected and not affected
Basic tools of measurement are necessary for the comparison –rates, ratio and proportion

Rate
There were 500 deaths from motor vehicle accident in city A
In epidemiology compare the rates of accident in city a with city B
Rate – elements denominator, numerator, time specification and multiplier.
Crude rates Specific rates Standardized rates

Ratio
Another measure of disease frequency Shows the relation in size between two
quantities The numerator not a component of the
denominator Sex ratio, doctor population ratio, child
woman ratio etc.
Proportion
Shows the relation in magnitude of the part of the whole
The numerator is always included in the denominator
Proportional mortality rate
Measurements of mortality
Mortality data provides the starting point for many epidemiological studies.
Mortality data is relatively easy to collect and reasonably accurate
The basis of mortality data is the death certificate

International death certificate
For national and international comparison a standardized system of recording and classification death
Part I – deals with immediate cause( pneumonia) and underlying cause of death( strangulated hernia)
Part II – deals with associated disease that contributed to the death( diabetes)
Limitation of mortality data
Incomplete reporting of death Lack of accuracy Lack of uniformity Choosing a single cause of death Changing coding system Diseases with low fatality

Uses mortality data
Can explain the trends and differences in overall mortality
Help in prioritization for health action Allocation of scares resource For assessment and monitoring of public
health programmes Gives important clue for epidemiological
research

Commonly used mortality rates and ratio
Crude death rate – simplest measure, lack comparability
Specific death rate – age, disease, income, religion etc.
Case fatality- killing power of disease for acute and not chronic
Proportional mortality rate –cause, age etc. can be used when population data are not available
Survival rate- usually for five years Standardized rates – direct and indirect
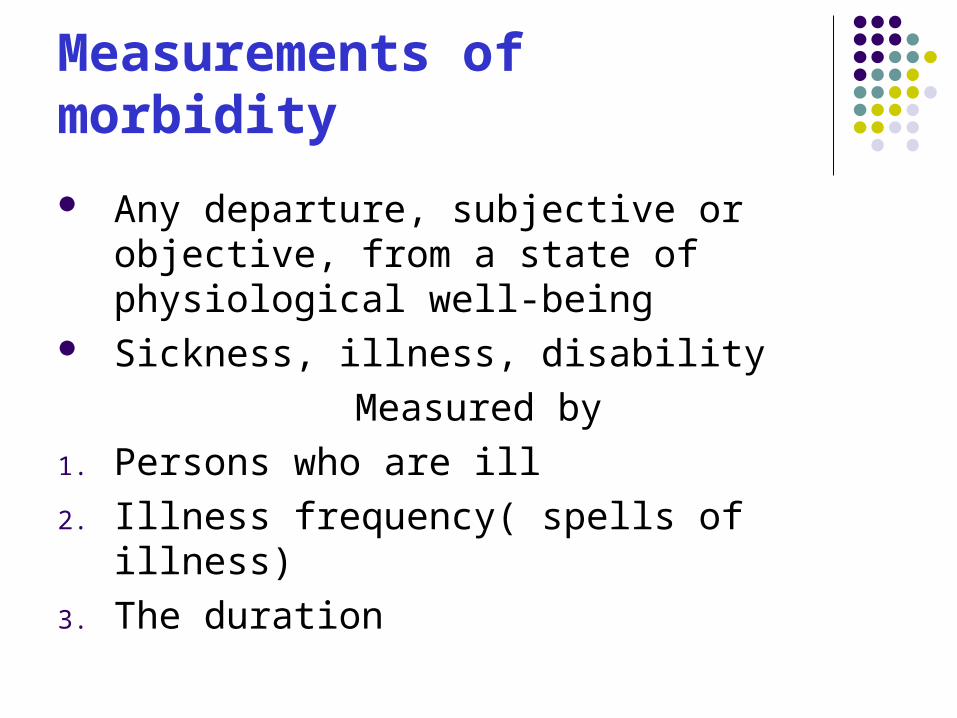
Measurements of morbidity
Any departure, subjective or objective, from a state of physiological well-being
Sickness, illness, disability
Measured by
1. Persons who are ill
2. Illness frequency( spells of illness)
3. The duration

Incidence rate
The number of NEW cases occurring in a defined population during a specific period of time.
Incidence
Number of new cases of specific Disease during a given time period
Population at risk during that period
X 1000

Uses of incidence rate
Taking action to control disease Research into the etiology or causation Research into the pathogenesis Studying distribution of disease Test the efficacy of preventive and
therapeutic measures Used for formulating and testing the
hypothesis

Special incidence rates
Attack rate Used only when the population is exposed to
risk for a limited period of time such as during an epidemic
Usually expressed as a percentage
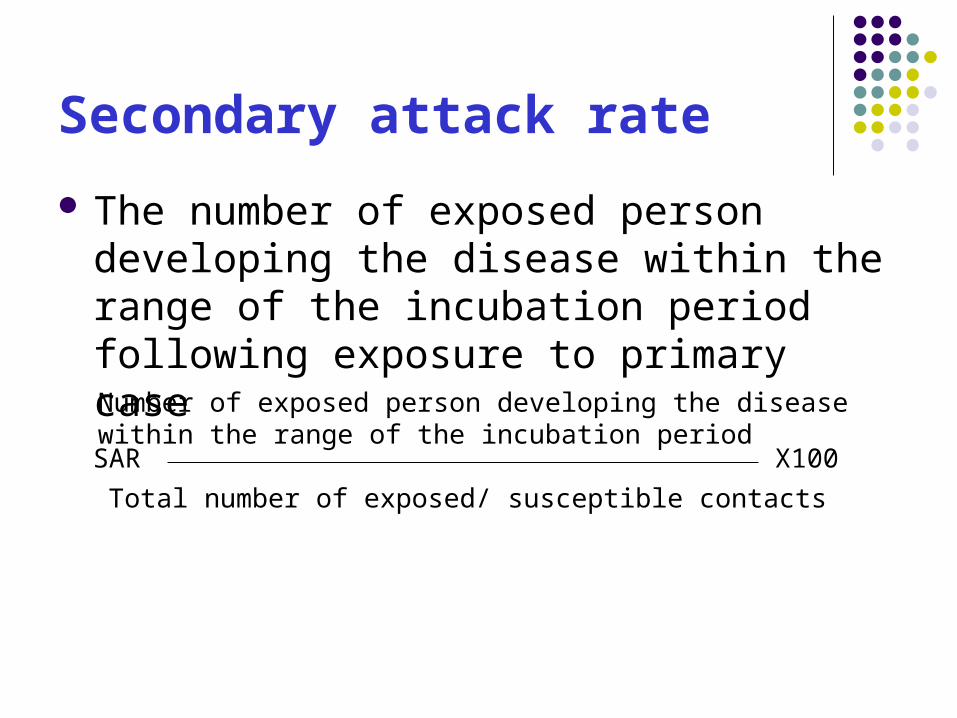
Secondary attack rate
The number of exposed person developing the disease within the range of the incubation period following exposure to primary case
SAR
Number of exposed person developing the disease within the range of the incubation period
Total number of exposed/ susceptible contacts
X100

Secondary Attack Rate
Limited to application in infectious diseases In disease where there are numerous sub-
clinical cases Useful to determine the disease of unknown
etiology is communicable or not Useful in evaluating the effectiveness of
control measures – immunization
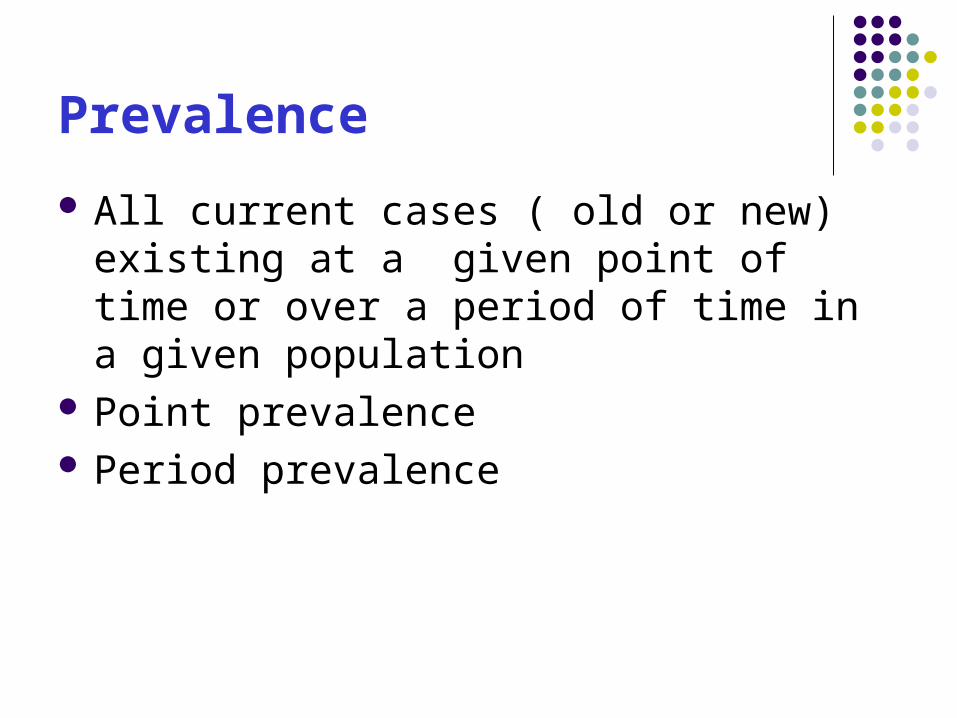
Prevalence
All current cases ( old or new) existing at a given point of time or over a period of time in a given population
Point prevalence Period prevalence
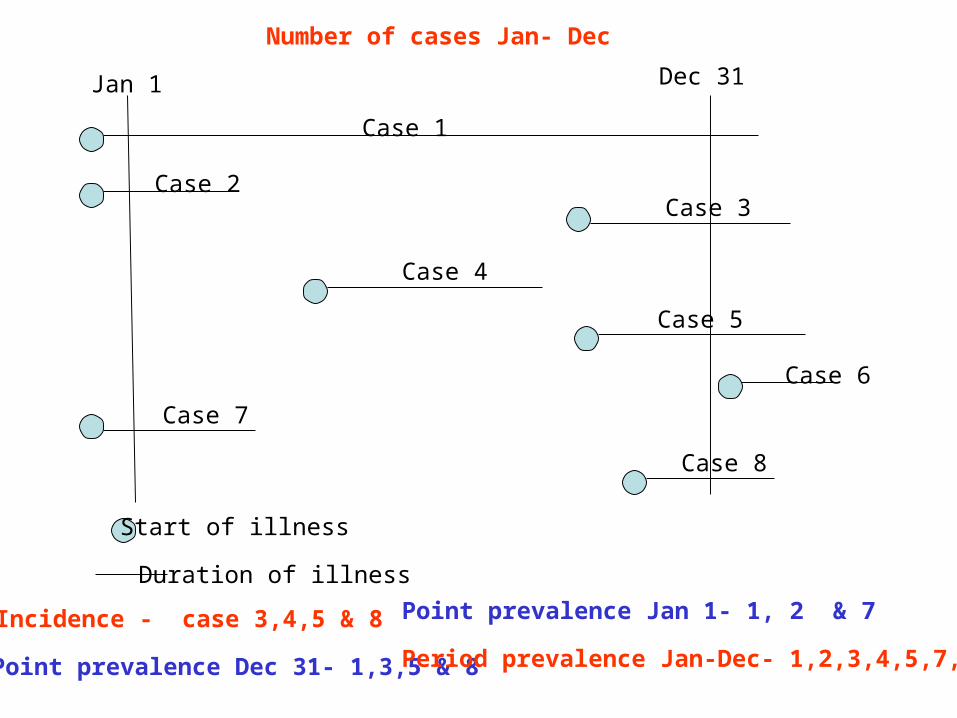
Start of illness
Duration of illness
Incidence - case 3,4,5 & 8
Jan 1 Dec 31
Case 1
Case 2Case 3
Case 4
Case 5
Case 6
Case 7
Case 8
Point prevalence Jan 1- 1, 2 & 7
Point prevalence Dec 31- 1,3,5 & 8 Period prevalence Jan-Dec- 1,2,3,4,5,7,&8
Number of cases Jan- Dec
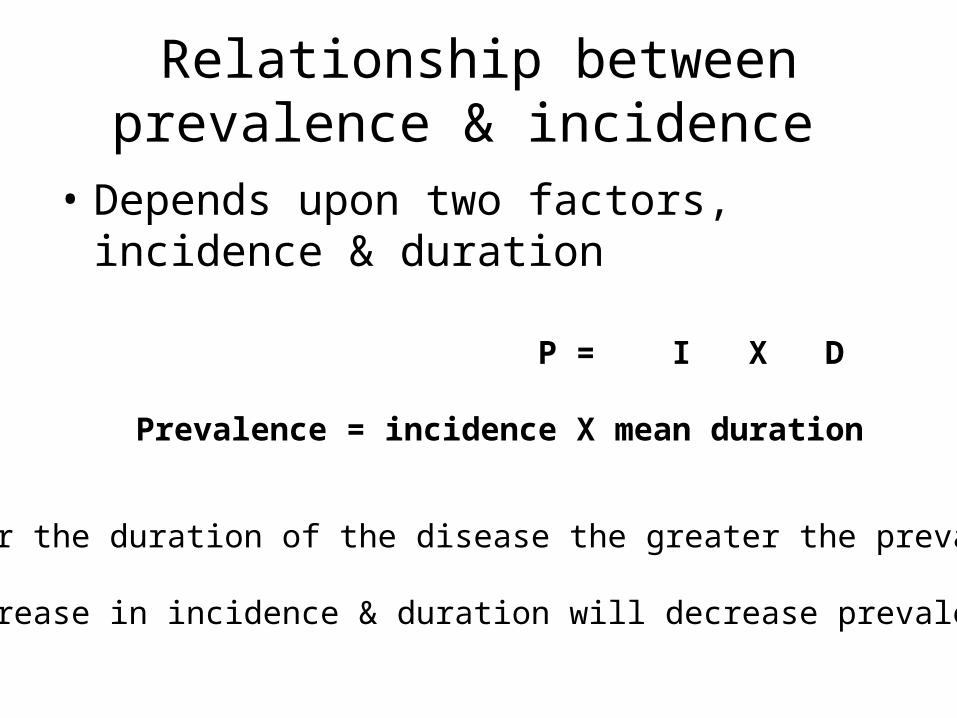
Relationship between prevalence & incidence
• Depends upon two factors, incidence & duration
P = I X D
Prevalence = incidence X mean duration
Longer the duration of the disease the greater the prevalence A decrease in incidence & duration will decrease prevalence

• For chronic diseases (TB)- high prevalence rate relative to incidence
• For acute diseases ( food poisoning, diarrhoea)- prevalence is relatively low compared to incidence
• For acute disease- no prevalence ( No of episodes)
• Treatment decreasing the duration will decrease the prevalence
• Treatment preventing death but no recovery will increase the prevalence
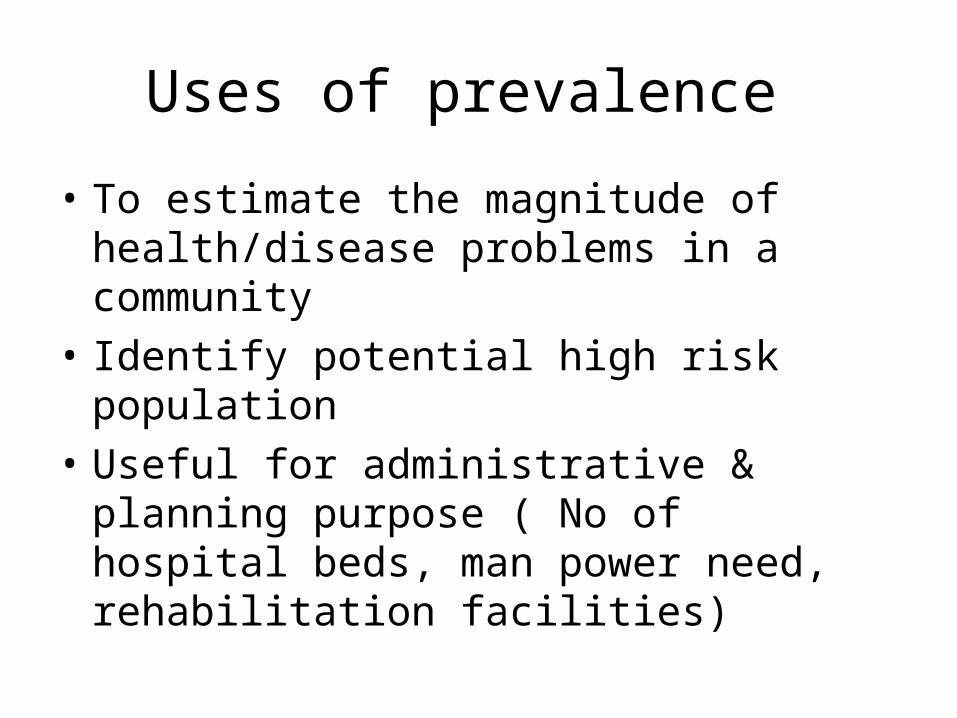
Uses of prevalence
• To estimate the magnitude of health/disease problems in a community
• Identify potential high risk population
• Useful for administrative & planning purpose ( No of hospital beds, man power need, rehabilitation facilities)

Aims of epidemiology
To describe the distribution and magnitude of health and disease problem in human population
To identify etiological factors in the pathogenesis of disease
To provide data essential to the planning, implementation and evaluation of services for the prevention, control and treatment of disease and setting up priorities
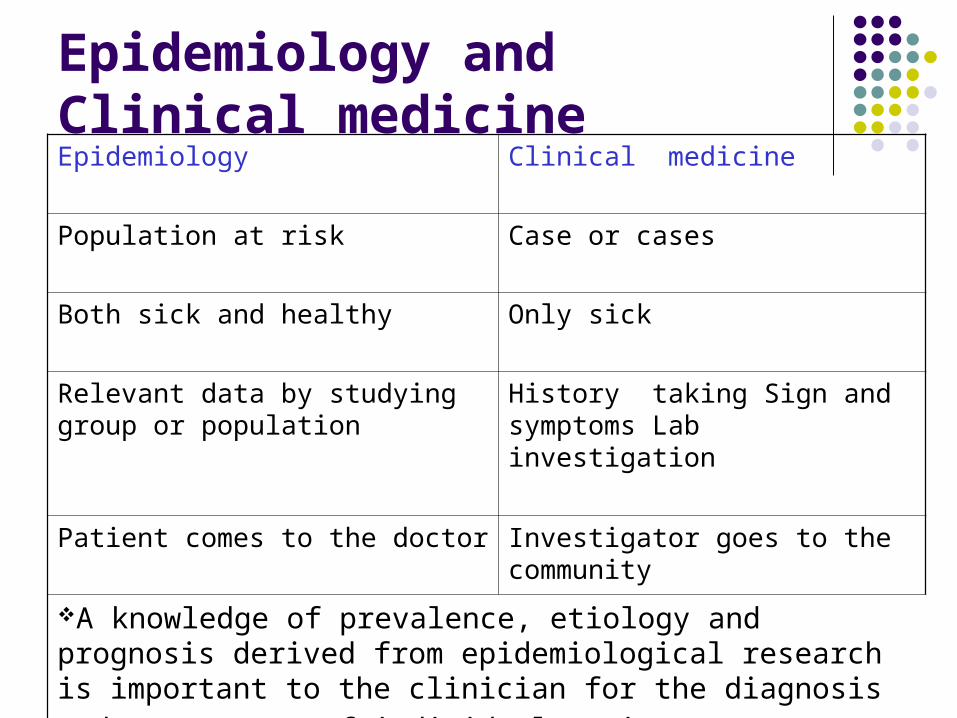
Epidemiology and Clinical medicine Epidemiology Clinical medicine
Population at risk Case or cases
Both sick and healthy Only sick
Relevant data by studying group or population
History taking Sign and symptoms Lab investigation
Patient comes to the doctor Investigator goes to the community
A knowledge of prevalence, etiology and prognosis derived from epidemiological research is important to the clinician for the diagnosis and management of individual patient

Top Related