


Languages
Pages
Legal

Introduction to BC Management, Inc.Introduction to BC Management, Inc.
Founded in March 2000. Headquartered in Irvine, CA. An executive search firm exclusively placing business
continuity, disaster recovery, information security and emergency management professionals internationally.
Confidential assistance in personnel placing. Free e-Newsletter detailing Top Talent & Current Job
Openings. Annual BC/DR salary and BC program review. Benchmarking individual companies on salary and
BC program review.
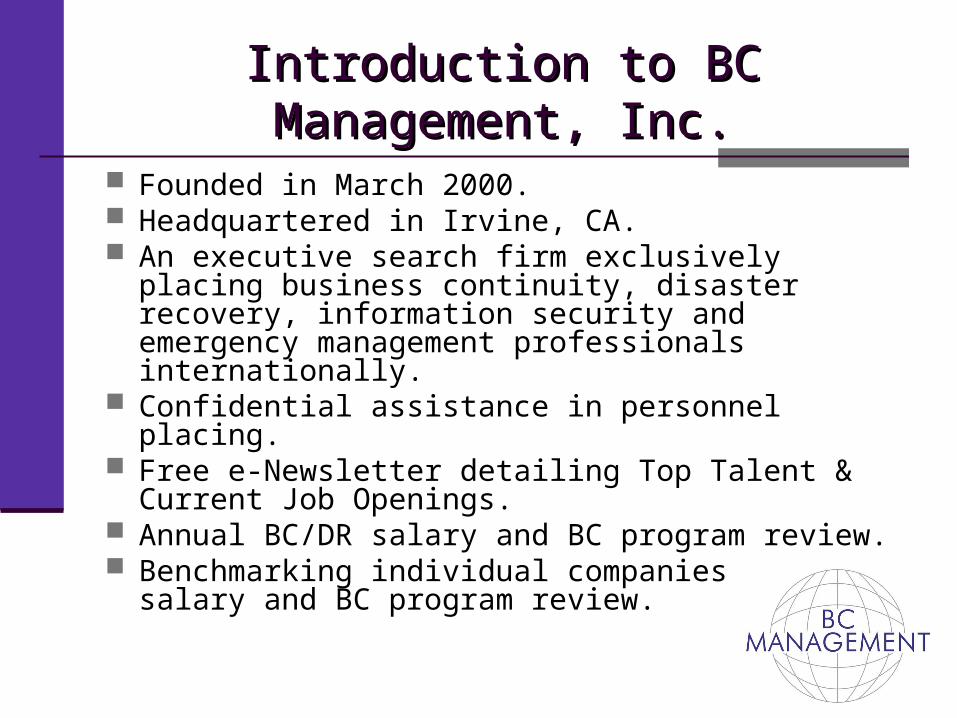
Average Total FTE Compensation by Years of Field Experience - USA
$0
$20,000
$40,000
$60,000
$80,000
$100,000
$120,000
Years of Field Experience
Tota
l Com
pens
atio
n
2004 Comp $78,063 $82,365 $90,315 $92,781 $104,255 $102,779 $107,103
% of Resp. 16% 26% 25% 16% 11% 4% 3%
1-3 yrs 4-6 yrs 7-10yrs 11-15 yrs 16-20 yrs 21-25 yrs 26+ yrs

Average Total FTE C om pensation by Job T itle - U S A
$0
$50,000
$100,000
$150,000
$200,000
$250,000
$300,000
Job Title
Total
Com
pens
ation
M ax $100,000 $153,600 $201,000 $250,000 $195,000 $170,000 $132,500 $102,000 $130,800 $183,000 $187,000 $170,000 $250,000
A vg $61,559 $72,106 $88,504 $109,982 $122,117 $113,182 $89,575 $74,750 $90,883 $107,096 $133,318 $133,144 $229,500
M in $30,000 $22,000 $35,700 $44,700 $45,000 $42,000 $60,000 $50,000 $70,000 $40,700 $82,000 $84,000 $209,000
Entry-level/ A nalyst
P lanner/ C oord./A dmin
M gr/A V P/Pro j M gr
V P/Director Global M gr Sales/M arketing Other F T C onsultant F T Sr. C onsultantF T M anaging
C onsultantF T Sr M gr/
DirectorF T Practice
Leader/PrincipleF T Global
Practice M gr

Average Total FTE Compensation by IT Expertise - USA
$0
$20,000
$40,000
$60,000
$80,000
$100,000
$120,000
IT Expertise (Least to Greatest) - Self Evaluated
Tota
l Com
pens
atio
n
2004 Comp $60,952 $73,174 $86,652 $86,680 $86,646 $82,876 $90,483 $96,786 $95,956 $96,933
% of Resp. 1% 3% 8% 12% 15% 13% 19% 18% 6% 5%
1 2 3 4 5 6 7 8 9 10

Average Total FTE Compensation by Certification - USA
$0
$20,000
$40,000
$60,000
$80,000
$100,000
$120,000
$140,000
Certification
Tota
l Com
pens
atio
n
2003 $103,633 $86,817 $97,154 $122,400 $72,513 $86,166 $106,904 $85,838 $94,037 $86,338 $70,750 $94,328 $90,658 $98,240 $107,750 $79,629 $92,947
2004 $110,550 $88,267 $106,382 $130,800 $77,037 $91,334 $115,694 $86,719 $101,111 $90,351 $77,906 $100,811 $99,607 $98,600 $126,313 $83,607 $98,710
% of Resp 0.6% 0.6% 1.3% 0.5% 7.1% 54.7% 2.4% 1.2% 2.6% 0.9% 0.8% 3.0% 2.9% 1.4% 0.9% 19.1% 12.3%
ARM CPP MBCI FBCI ABCP CBCP MBCP CRP CISA ACP CEM CISSP PMP CHS1,2,3 CISM No Cert Multiple
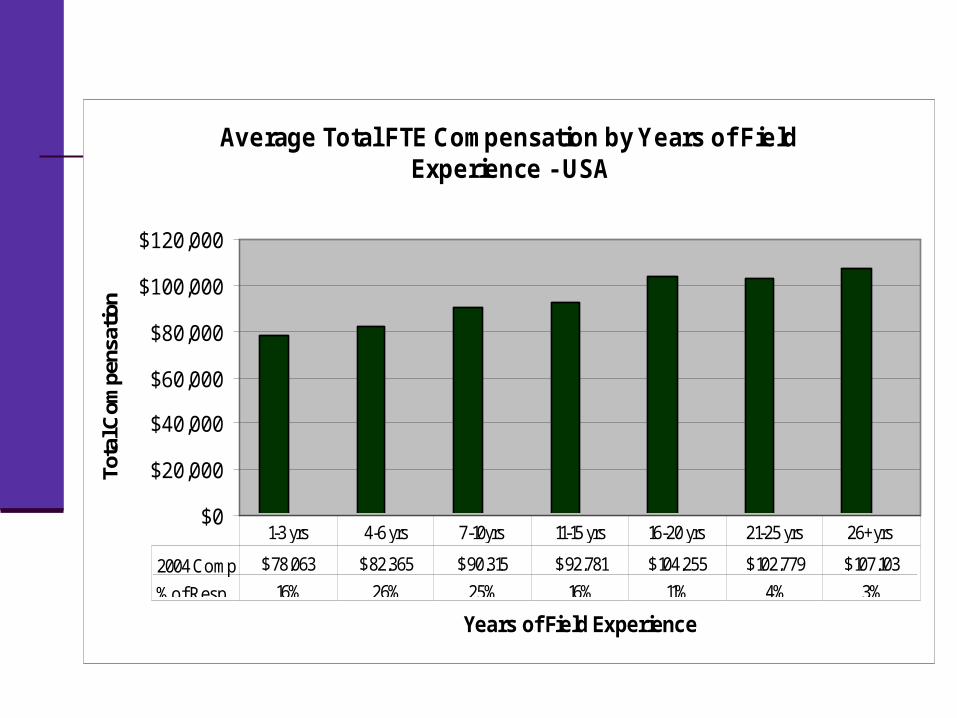
Average Total FTE Compensation by Degree - USA
$0
$20,000
$40,000
$60,000
$80,000
$100,000
$120,000
Degree
To
tal C
om
pen
sati
on
2004 Comp $76,987 $84,807 $89,845 $99,239 $98,438
% of Resp. 14% 17% 47% 21% 1%
High School Associate Bachelor Master PhD/ Doctorate

Average Total FTE Compensation by Industry - USA
$0
$20,000
$40,000
$60,000
$80,000
$100,000
$120,000
Industry
Total
Comp
ensatio
n
2002 $87,973 $77,818 $78,257 $82,353 $104,784 $85,601 $82,617 $69,955 $69,741 $60,086 $102,141 $91,663 $82,204
2003 $82,887 $89,299 $78,218 $82,861 $94,759 $92,964 $90,136 $70,479 $75,817 $92,841 $65,846 $86,532 $87,946 $87,700 $81,546
2004 $88,722 $94,855 $81,983 $86,465 $102,967 $96,645 $92,972 $67,496 $79,210 $96,544 $69,235 $91,034 $94,069 $91,200 $87,126
Financial/ Banking
Utilities Healthcare InsuranceConsulting Services
Mnfg Telecom Transport Gov't Retail EducationInformation
ServicesComputer Services
Petro/ Chemical
Other

Local BCP Salary BenchmarkingLocal BCP Salary Benchmarking
14 Local Respondents to St. Louis, MO.
1.5% of total survey respondents (931 Permanently Full-time employed respondents from the United States.)
Breakout of industry respondents: 9 - Financial/ Banking 2 - Healthcare 1 - Utilities 1 - Government 1 - Consulting Services

Profiling of Local RespondentsProfiling of Local Respondents
3 – Planner/ Coordinator, Administrator 5 – Manager, AVP, Project Manager 3 – VP, Director 1 – Global Manager 2 – Professional Services
1- Consultant 1- Sr. Consultant

Profiling of Local RespondentsProfiling of Local Respondents
46% Business Continuity 36% Disaster Recovery 6% Information Security 6% Emergency Management 2% Risk Management 3% Audit 1% Health & Safety 0% Facilities Management 0% Other

Profiling of Local RespondentsProfiling of Local Respondents
Average of 11-15 years field (BC/DR) experience.
Average of 26-30 years work experience. Average travel is less than 25%. Majority are degreed professionals
4 - Associate, 3 – Bachelor, 5 - Master
Average IT expertise rating of 7 (scale of 1-10 with 10 being the highest).
3 respondents changed jobs in 2004.

Profiling of Local RespondentsProfiling of Local Respondents
100% of respondents are CBCP certified. 2 respondents have obtained 5 different
certifications. 4 respondents attributed a salary increase to
receiving their certification. Average increase in salary - $1,500 Maximum increase in salary - $3,000 Minimum increase in salary - $500
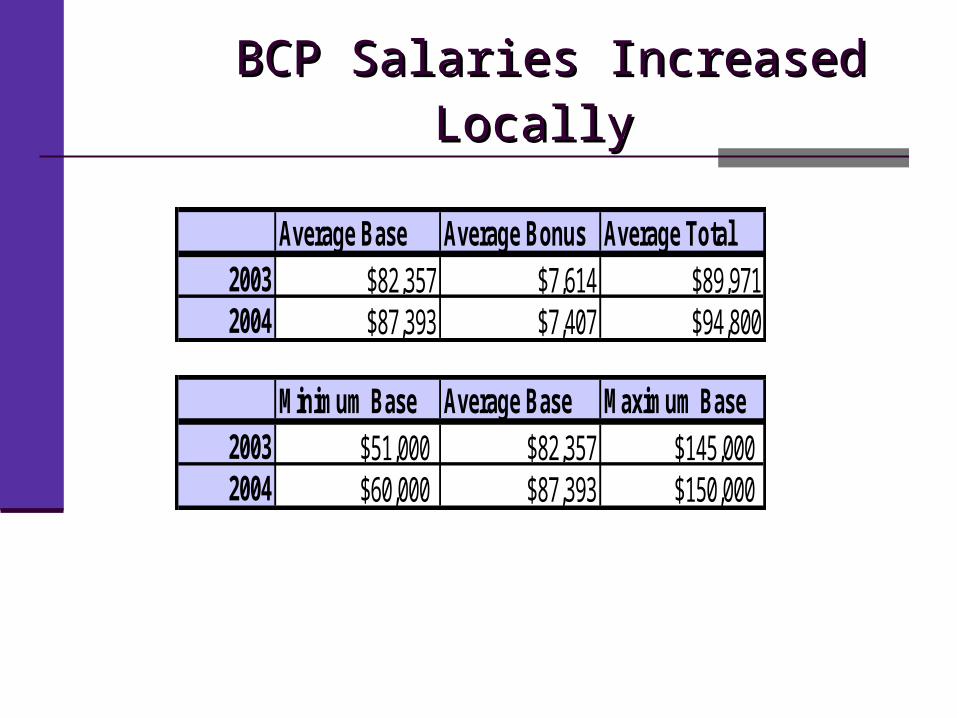
BCP Salaries Increased LocallyBCP Salaries Increased Locally
Average Base Average Bonus Average Total2003 $82,357 $7,614 $89,9712004 $87,393 $7,407 $94,800
Minimum Base Average Base Maximum Base2003 $51,000 $82,357 $145,0002004 $60,000 $87,393 $150,000

Bonus Payout Locally in 2004Bonus Payout Locally in 2004
10 respondents received a bonus locally in 2003 compared to 11 respondents in 2004.
The breakout for those who received bonuses.
Minimum Bonus Average Bonus Maximum Bonus2003 $2,000 $10,660 $37,0002004 $1,500 $9,427 $150,000

Profiling for Local BCP Profiling for Local BCP Managers/ AVP / Project ManagersManagers/ AVP / Project Managers
5 Local Respondents (3 - Financial, 1 – Utility, 1 - Government) 53% Business Continuity 39% Disaster Recovery 2% Information Security 5% Emergency Management 0% Risk Management 0% Audit 1% Health & Safety 0% Facilities Management 0% Other

Profiling for Local BCP Profiling for Local BCP Managers/ AVP / Project Managers Managers/ AVP / Project Managers
Average of 11 - 15 years field (BC/DR) experience.
Average of 26 - 30 years work experience. Less than 25% average travel. 3 respondents obtained a Master degree & 2
respondents obtained an Associate degree. Average IT expertise rating of 8 (scale of 1-10
with 10 being the highest). 2 respondents changed Jobs in 2004.

BCP Salaries Increased for Managers/ BCP Salaries Increased for Managers/ AVP / Project ManagersAVP / Project Managers
Average Base Average Bonus Average Total2003 $89,200 $6,000 $95,2002004 $91,200 $6,800 $98,000
Minimum Base Average Base Maximum Base2003 $71,000 $89,200 $110,0002004 $72,000 $91,200 $110,000

Bonus Payout for Managers/ AVP / Bonus Payout for Managers/ AVP / Project ManagersProject Managers
4 Respondents received bonuses in both 2003 and 2004.
Minimum Bonus Average Bonus Maximum Bonus2003 $2,000 $7,500 $10,0002004 $5,000 $8,500 $11,000

QuestionsQuestions
??BC Management, Inc.Phone: (888) 250-7001Website: www.bcmanagement.com
Top Related