

![Adventures With Social Media [ Video in Slide2]](https://static.fdocuments.in/doc/165x107/54bba16d4a79596e738b4573/adventures-with-social-media-video-in-slide2.jpg)


Languages
Pages
Legal

Introduction slide 2
Facts & Figures slide 3
Full Report Content slide 19

© B
SL T
ransport
atio
n C
onsultants
Gm
bH
& C
o. K
G 2
015
Page 2
Introduction
The “2014 Report on Combined Transport in Europe” was researched and prepared
on behalf of UIC by BSL Transportation Consultants (www.bsl-transportation.com) and
provides detailed information of the combined transport industry in 2013 of which the
following slides propose only an overview.
The full Report proposes a wealth
of information on:
- Market structure
- Volume figures per market segment
-Country O-D matrix of transport volumes
-Terminal assessment
-Seaport activity
- Rail Freight Corridor information
and modal split
- Overview of national support measures
in favor of combined transport
- Market outlook
© B
SL T
ransport
atio
n C
onsultants
Gm
bH
& C
o. K
G 2
015
Page 3
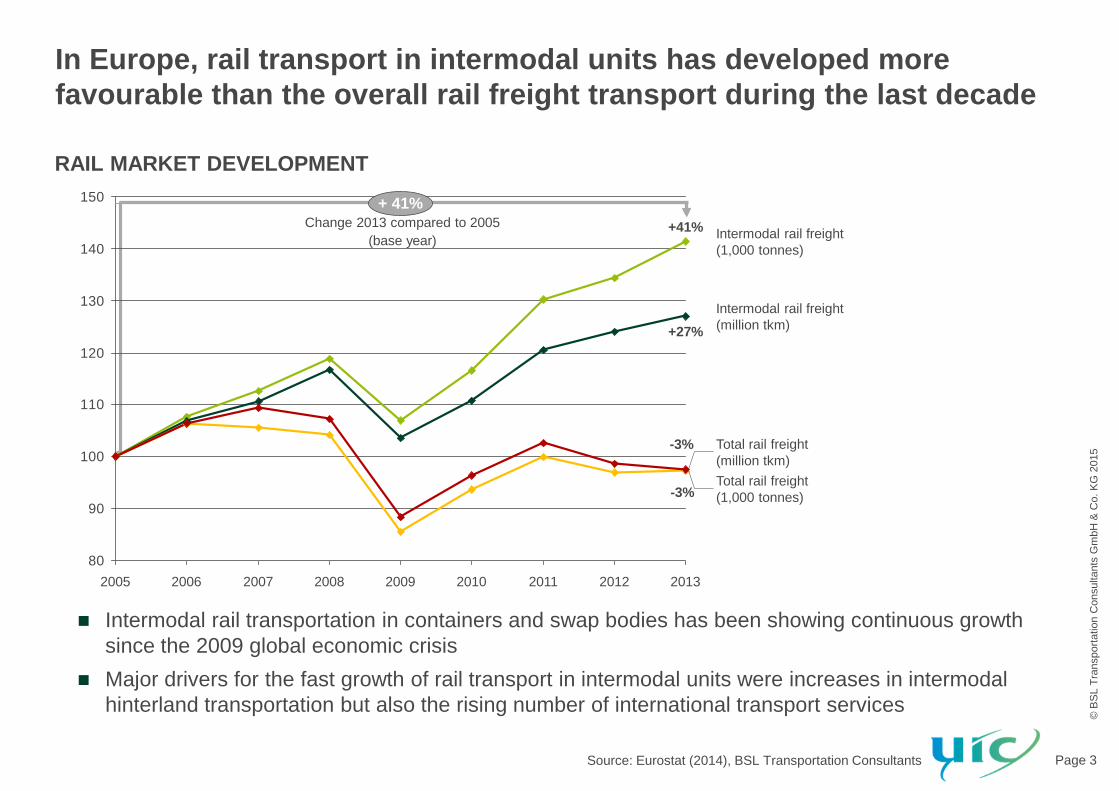
In Europe, rail transport in intermodal units has developed more
favourable than the overall rail freight transport during the last decade
©B
SL T
ransport
atio
n C
onsultan
ts G
mbH
& C
o.
KG
2015
N:\PROJEKTE\UIC\11_097_001_UIC_Kombi_Transport\10_PRÄSENTATIONEN\11_097_001_UIC_Report-slides_v19.pptx
Page 5
Intermodal rail transport has developed more positively than rail freight
transport in general
Source: EUROSTAT
80
90
100
110
120
130
140
150
+27%
+41%
2012201120102009
Total rail freight
(million tkm)
Total rail freight
(1,000 tonnes)
Intermodal rail freight
(million tkm)
Intermodal rail freight
(1,000 tonnes)
2013
-3%
-3%
2008200720062005
+ 41%
Change 2013 compared to 2005
(base year)
NEU
Aktualisiert
Intermodal rail transportation in containers and swap bodies has been showing continuous growth
since the 2009 global economic crisis
Major drivers for the fast growth of rail transport in intermodal units were increases in intermodal
hinterland transportation but also the rising number of international transport services
RAIL MARKET DEVELOPMENT
Source: Eurostat (2014), BSL Transportation Consultants

© B
SL T
ransport
atio
n C
onsultants
Gm
bH
& C
o. K
G 2
015
Page 4
In order to provide a comprehensive dataset on combined transport in
Europe, information on several market segments has been collected
OVERVIEW MARKET SEGMENTS
Combined
transport
Form of transport
Geographical
scope
Focus of
transport chain
accompanied
unaccompanied
domestic
international
continental
maritime
Market segments of rail/road combined transport
A B
A B
A B
A B
Combined transport in the 2014 UIC Report on Combined Transport in Europe
is based on the definition of combined transport (CT) as in the European Council Directive 92/106/EEC
focuses on rail/road-services
Source: BSL Transportation Consultants

© B
SL T
ransport
atio
n C
onsultants
Gm
bH
& C
o. K
G 2
015
Page 5
FORMS OF COMBINED TRANSPORT
The basic market segmentation differentiates between loading units and
whether they are personally accompanied during rail transport
Source: BSL Transportation Consultants, UIC
Intermodal loading units are
transported unaccompanied by rail, i.e.
without a truck driver on the train
Transhipment between road and rail
takes place at terminals, usually by
gantry cranes or reach stackers
Pre-carriage from the loading site to
the consignment terminal/on-carriage
from the receiving terminal to the final
destination is performed by truck
Unaccompanied CT
Lorries are carried on purpose-built
low-floor wagons, while drivers travel
in seated accommodation or
couchettes
Transhipment between road and rail
takes place at terminals, using
mobile ramps
Limited to set routes, e.g. transalpine
Particular requirements needed,
e.g. purpose-built wagons
Accompanied CT
“Rolling road/motorway”
© B
SL T
ransport
atio
n C
onsultants
Gm
bH
& C
o. K
G 2
015
Page 6
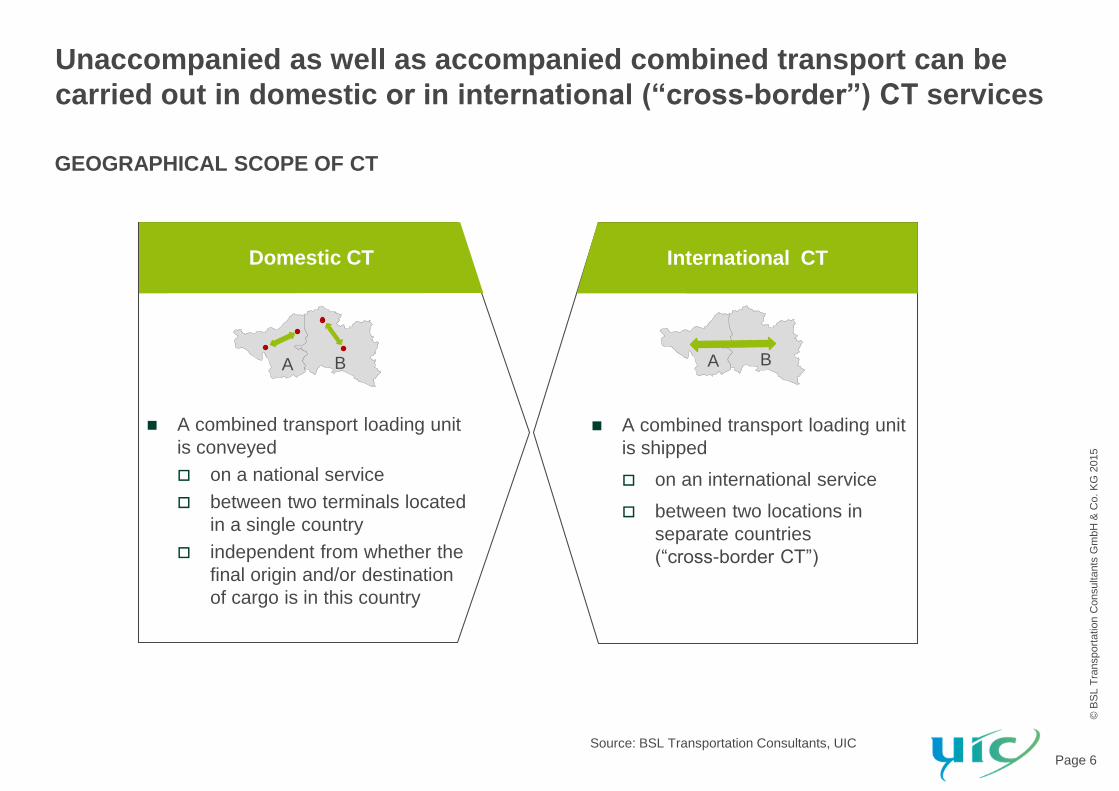
GEOGRAPHICAL SCOPE OF CT
Unaccompanied as well as accompanied combined transport can be
carried out in domestic or in international (“cross-border”) CT services
Source: BSL Transportation Consultants, UIC
A combined transport loading unit
is conveyed
on a national service
between two terminals located
in a single country
independent from whether the
final origin and/or destination
of cargo is in this country
Domestic CT
A combined transport loading unit
is shipped
on an international service
between two locations in
separate countries
(“cross-border CT”)
International CT
A BA B
© B
SL T
ransport
atio
n C
onsultants
Gm
bH
& C
o. K
G 2
015
Page 7
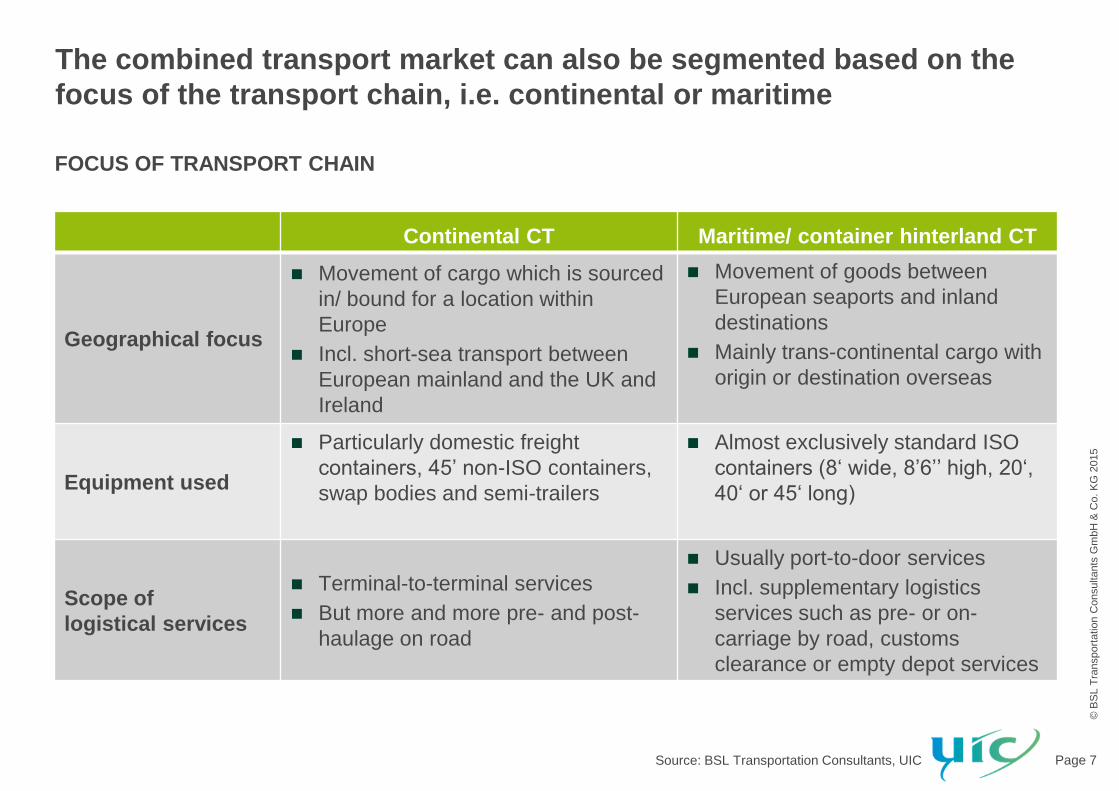
FOCUS OF TRANSPORT CHAIN
The combined transport market can also be segmented based on the
focus of the transport chain, i.e. continental or maritime
Continental CT Maritime/ container hinterland CT
Geographical focus
Movement of cargo which is sourced
in/ bound for a location within
Europe
Incl. short-sea transport between
European mainland and the UK and
Ireland
Movement of goods between
European seaports and inland
destinations
Mainly trans-continental cargo with
origin or destination overseas
Equipment used
Particularly domestic freight
containers, 45’ non-ISO containers,
swap bodies and semi-trailers
Almost exclusively standard ISO
containers (8‘ wide, 8’6’’ high, 20‘,
40‘ or 45‘ long)
Scope of
logistical services
Terminal-to-terminal services
But more and more pre- and post-
haulage on road
Usually port-to-door services
Incl. supplementary logistics
services such as pre- or on-
carriage by road, customs
clearance or empty depot services
Source: BSL Transportation Consultants, UIC

© B
SL T
ransport
atio
n C
onsultants
Gm
bH
& C
o. K
G 2
015
Page 8 Source: BSL Transportation Consultants, UIC
The combined transport industry involves a number of market players
with partly overlapping functions
KEY MARKET PLAYERS
Combined transport services are provided by CT operators who
act as independent intermediaries or brokers between railway companies and potential customer groups
purchase transport capacity from rail companies with volumes
Increasingly, other stake-holder groups which act as CT operators also offer CT services
Trend of past years towards more logistics service provi-ders taking over the operator role continues, particularly in Western Europe
„Classical“ Combined
Transport operators
Railway undertakings
in operator role
Logistics service
providers in
CT operator role Seaports
Provider of CT services
Port operators
in CT operator
role
Terminal
operators
in CT
operator role
Further
market
participants
Key
customer
groups
CT Terminals
Shippers
Shipping lines
Forwarders and
logistics service
providers
Shippers
in CT
operator role
Others,
e.g. inland ports

© B
SL T
ransport
atio
n C
onsultants
Gm
bH
& C
o. K
G 2
015
Page 9
COUNTRIES COVERED
To provide a comprehensive overview on CT in Europe, market players
from more than 30 European countries were identified and contacted
Source: BSL Transportation analysis
©B
SL T
ransport
atio
n C
onsultan
ts G
mbH
& C
o.
KG
2015
N:\PROJEKTE\UIC\11_097_001_UIC_Kombi_Transport\10_PRÄSENTATIONEN\11_097_001_UIC_Report-slides_v23.pptxdata2map.at
MRT
KWT
ESH
Countries covered
Countries of origin
survey participants
ES
FR
PT
IE GB
DENL
BE
LU
AT
IT
CZ
CH
PL
DK
SE
NO
FI
LT
LV
FI
EE
HR
HU
SK
SI
BA
MK
RS
GR
RO
BG
TR
MEKV
AL
BY
RU
UA
MD
RU
MADZ TN
IS
SY
Countries with CT
services of participants
NEU
The report is based on different complementary sources which also include a plausibility check:
A comprehensive data base from an online questionnaire for all relevant market players
Expert interviews with representatives of different stakeholder groups
Desk research involving the most relevant data sets and statistics for different market segments (e.g. UIRR, AGORA and Eurostat)

© B
SL T
ransport
atio
n C
onsultants
Gm
bH
& C
o. K
G 2
015
Page 10
DEVELOPMENT OF TOTAL CT VOLUMES
Compared to 2011, the total volume of combined transport in Europe in
TEU increased by 9%
Source: BSL Transportation analysis, UIRR
2013
20.8
0.8
20.0
2011
19.1
16.6
1.0
18.1
2009
1.0
15.6
2007
18.4
1.0
17.4
2005
14.9
0.8
14.1
CT volume accompaniedCT volume unaccompanied
Segment 2005 2007 2009 2011 2013
CT volume
unaccompanied145.5 181.5 164.6 191.8 203.0
CT volume
accompanied10.2 13.6 15.1 14.9 10.8
Total 155.7 195.1 179.7 206.7 213.8
in
million
TEU
in
million
tonnes
Since the downturn following the global economic crisis in 2009, unaccompanied combined transport has been exhibiting a continuous growth – in terms of TEU and tonnes
Total CT market increase is fully driven by the unaccompanied market segment, while the accompanied CT volume decreased in TEU as well as in tonnage
In 2013, the unaccompanied CT segment’s market share amounts to approx. 95% of the total CT market

© B
SL T
ransport
atio
n C
onsultants
Gm
bH
& C
o. K
G 2
015
Page 11
SPOTLIGHT ANALYSES
The 2014 report on CT is enhanced by four spotlight analyses on
current topics relevant for the CT market in Europe
Source: BSL Transportation Consultants
EU Rail Freight Corridors CT Terminals
Seaports and hinterland National CT measures
Spotlight
analyses
Analysis of CT
terminals connected
with RFCs
Main challenges
seen by market
players
List of major rail-road
CT terminals
©B
SL T
ransport
atio
n C
onsultan
ts G
mbH
& C
o.
KG
2015
©B
SL T
ransport
atio
n C
onsultan
ts G
mbH
& C
o.
KG
2014
N:\PROJEKTE\UIC\11_097_001_UIC_Kombi_Transport\10_PRÄSENTATIONEN\RFCs\11_097_001_UIC_RFC_Karte_150127_neu.pptxdata2map.at
Countries
connected by
RFC2
The Netherlands
Belgium
France
Luxemburg
[Switzerland]
RFC2
Source: BSL Transportation Consultants analysis, RFC2 implementation plan (CID TT 2015 – 8/10/2014 version), discussion with corridor representatives
2010Modal split on RFC2*
RFC 2 North Sea – Mediterranean Corridor
Principal route:
Rotterdam-Antwerp-Luxemburg-Metz-Dijon-Lyon/[Basel]
Total rail freight demand in all countries involved 2010
(in million tonnes)121.4
International** rail freight on RFC2 2010 (in million tonnes) 21.8
Thereof originating from
Belgium 10.1
France 6.5
Netherlands 1.5
Most active regions
(highest tonnage -
sum im- and exports)
Prov Antwerpen (BE) 4.0
Nord-Pas de Calais (FR) 2.2
Prov Liège (BE) 1.4
Number of international trains on RFC2 2010 33,861
Countries
connected by
RFC2
The Netherlands
Belgium
France
Luxemburg
[Switzerland]
Rail
Inland
waterway35%
57%
8%
Road
Rail freight
transport
(tonnage)***
75%
25%Intermodal
trains
Conventional
traffic
International
rail freight volume:
21.8 million tonnes
* Road and inland waterway: approximate values based on CID TT 2015, chapter 2/
transport market study
** Crossing at least one border of the corridor
*** Estimate based on commodity structure of transport and interview discussion
Calculated potential from road modal shift
to rail on RFC 2: max. 28.0 million tonnes
©B
SL T
ransport
atio
n C
onsultan
ts G
mbH
& C
o.
KG
2014
N:\PROJEKTE\UIC\11_097_001_UIC_Kombi_Transport\10_PRÄSENTATIONEN\RFCs\11_097_001_UIC_Kombi_Transport_RFC_Karte_150206.pptx
Seite 3
©B
SL T
ransport
atio
n C
onsultan
ts G
mbH
& C
o.
KG
2014
N:\PROJEKTE\UIC\11_097_001_UIC_Kombi_Transport\10_PRÄSENTATIONEN\RFCs\11_097_001_UIC_RFC_Karte_150127_neu_für_Terminals.pptxdata2map.at
RFC1
RFC 1
Rhine-Alpine Corridor
RFC 6
High-
lighted
More than 5 Terminals
(mentioned in the implementation plan)
Less than 5 Terminals
(mentioned in the implementation plan)
Additional terminals situated on the corridor line
(not mentioned in the implementation plan)
Railway node or junction with other RFC
Alignment RFC 1
Connection to other RFC (implemented in 2013)
Seaport
Connection to other RFC (to be implemented in 2015)
2
1
5 1 Deurne
5
Frenkendorf 1
1 Rekingen
1Domodossola
1 Piacenza
Melzo1
Mannheim & Ludwigshafen5
Freiburg1
Mainz12
2 Karlsruhe
Aarau1
2Busto Arsizio
Germersheim1
1Mortara
Genoa
1
13
1
6
1311
Ghent
2
Basel 1
2
1
1 Milano6Novara 2RFC 6
RFC 2
RFC 2RFC 2
RFC 8
3
*Alessandria
*Tortona
RFC 6
Neuss
2 Cologne
RFC 8
8
3
*Railway Junction
1
RFC 8
3
5
2
4
1
2
1
3
1
1
2
1
1
1
1
2
6
©B
SL T
ransport
atio
n C
onsultan
ts G
mbH
& C
o.
KG
2014
N:\PROJEKTE\UIC\11_097_001_UIC_Kombi_Transport\10_PRÄSENTATIONEN\Seaports\11_097_001_UIC_Seaport_analysis_150202.pptxdata2map.at
MRT
KWT
ESH
Hamburg 39%
Bremerhaven 47%
Barcelona 11%
Felixstowe 28%
Gdynia 41%
Ravenna 12%
Tanger 6%
Rail share of hinterland transport 2013
(only gateway-traffic)
Livorno 13%
Riga 25%
Zeebrugge 29%
(1) Estimation
(2) Rail access nearby port
La Spezia 25%
Trieste 30%
Algeciras 5%
Alicante 0%Cádiz 0%
Leixoes 1%
Liverpool 0%
Oslo 10%
Piraeus 0%
Vigo 0%
Helsinki 2%
Gdansk 36%
FR
DE
UK
ES
PT
IE
LU
NO
PL
SE
FI
LV
CH
EE
AT
BY
IT
UA
CZ
SK
HU
RU
BA RS
RO
MD
MK
GR
BG
TR
SI
Venice 1%
NL
BE
DK
Rotterdam 11%
HR
Antwerp 7%
ME
AL
Koper 61%
KV
LTRU
Rail share of container
hinterland volume
Total container
hinterland volume
©B
SL T
ransport
atio
n C
onsultan
ts G
mbH
& C
o.
KG
2015
N:\PROJEKTE\UIC\11_097_001_UIC_Kombi_Transport\10_PRÄSENTATIONEN\11_097_001_UIC_Report-slides_v23.pptxdata2map.at
National
measures in
favour of CT
Austria
Belgium
France
Germany
Greece
Poland
Serbia
Slovakia
Switzerland
United Kingdom
FR
UK
GR
DE
CH
PL
BE
ATSK
RS
Aktualisiert
Analysis of the RFCs
implemented in 2013
Key corridor charac-
teristics relevant for
CT (volume, main
origins, modal split)
Impact of RFC imple-
mentation on CT
volumes
Overview of national
measures in favour
of CT
Analysis of scope of
funding
Differentiation based
on funding sector
Development of
container throughput
in Europe
Analysis of hinter-
land transportation
(modal split, main
operational needs)
Outlook and
perspectives for CT

© B
SL T
ransport
atio
n C
onsultants
Gm
bH
& C
o. K
G 2
015
Page 12
KEY CHARACTERISTICS OF RFCS (EXAMPLE RFC1)
For each of the six corridors already implemented, the key corridor
characteristics relevant for CT are presented
Source: BSL Transportation analysis, RFC1 implementation plan V1.0, interview with corridor representatives
©B
SL T
ransport
atio
n C
onsultan
ts G
mbH
& C
o.
KG
2015
©B
SL T
ransport
atio
n C
onsultan
ts G
mbH
& C
o.
KG
2014
N:\PROJEKTE\UIC\11_097_001_UIC_Kombi_Transport\10_PRÄSENTATIONEN\RFCs\11_097_001_UIC_RFC_Karte_150127_neu.pptxdata2map.at
RFC1
Countries
connected by
RFC1
The Netherlands
Belgium
Germany
[Switzerland]
Italy
Source: BSL Transportation Consultants Research, RFC1 implementation plan transport market studies, interview with coridor representatives
54%Inland
waterway
Road
32%
Rail
14%
Block trains*
Intermodal
trains56%
20%
24%Single
wagon loadRail volume
32 million tonnes
Ø 1,484
weekly
trains
International
corridor-related
freight trains
RFC 1 Rhine-Alpine Corridor
Principal route:
Zeebrugge-Antwerp/Rotterdam-Duisburg-[Basel]-Milan-Genova
Total international corridor-related freight transport volume 2010
all transport modes (in million tonnes)232.0
Thereof running through
Germany 196.0
Netherlands 143.0
Belgium 57.0
Largest single axis Netherlands - Germany 129.0
Largest single trade lane Rotterdam - Düsseldorf 44.0
International rail freight on RFC1 2010 (in million tonnes) 32.0
Most important rail trade lanes
(highest tonnage)
Northern Italy - Belgian/Dutch seaports 19.9
Northern Italy - Rhine Ruhr area 31.1
Rotterdam - Düsseldorf (NUTS2) 2.0
Countries
connected by
RFC1
The Netherlands
Belgium
Germany
Switzerland
Italy
* In „conventional“traffic
2010Modal split in international
freight traffic on RFC1
Nine Rail Freight
corridors were defined
throughout Europe (six
launched in 2013, three
will be implemented in
November 2015)
The RFCs are
supposed to promote
rail freight transport in
Europe, in order to
increase rail shares in
the transport market
The current rail share in
the corridor’s modal
split and its composition
in intermodal and
conventional traffic
differs among the
corridors

© B
SL T
ransport
atio
n C
onsultants
Gm
bH
& C
o. K
G 2
015
Page 13
TERMINALS CONNECTED WITH RFCS (EXAMPLE RFC21)
For each rail freight corridor, the terminal infrastructure as one of the
potential bottlenecks is analysed
Source: BSL Transportation analysis, RFC2 implementation plan
1) In 2016 corridor extension of RFC2 to the UK.
©B
SL T
ransport
atio
n C
onsultan
ts G
mbH
& C
o.
KG
2014
N:\PROJEKTE\UIC\11_097_001_UIC_Kombi_Transport\10_PRÄSENTATIONEN\RFCs\11_097_001_UIC_Kombi_Transport_RFC_Karte_150129.pptx
Seite 4
©B
SL T
ransport
atio
n C
onsultan
ts G
mbH
& C
o.
KG
2014
N:\PROJEKTE\UIC\11_097_001_UIC_Kombi_Transport\10_PRÄSENTATIONEN\RFCs\11_097_001_UIC_RFC_Karte_150129_neu_für_Terminals.pptxdata2map.at
RFC2
RFC 2
North Sea-Mediterranean
Corridor
High-
lighted
More than 5 Terminals
(mentioned in the implementation plan)
Less than 5 Terminals
(mentioned in the implementation plan)
Additional terminals situated on the corridor line
(not mentioned in the implementation plan)
Railway node or junction with other RFC
Alignment RFC 2
Connection to other RFC (implemented in 2013)
Seaport
Connection to other RFC (to be implemented in 2015)
1
3Mâcon
1Athus
1 Bettembourg
1Charleroi
1Ghlin*Kinkempois
1
1Dourges
1Somain
1 Prouvy
*Aulnoye
1
Ghlin
1Tergnier 1 Reims
*Woippy
Thionville1
Strasbourg2
2 Mulhouse
1Chalindrey
*Il-sur-Tille
Dijon 3
*Ambérieu
Nancy 2
2 Colmar
*Luxembourg
2
1La
Louviére
1Brussel
1Vlissingen
1
1
Valenton6
2 Liége
Rotterdam4
RFC 1
Mechelen
Muizen1
RFC 1
14 10
RFC 1
3
1
Châlons en
Champagne
RFC 1
6 Basel
RFC 1
2 MetzRFC 4
Lyon 4
RFC 6
RFC 8
*Rail Terminal (not further specified)
*Perrigny
1
*Tergnier
RFC 8
3
33
1
5
2
1
1
1
5
1
2
2
1
1
1
6
The intermodal terminal
landscape in Europe is
very complex with a
large number of market
players
Challenge: what is a
terminal? Various
terminal definitions in
place
The development of
intermodal transport
terminals along the Rail
Freight Corridors is one
key element of the
corridor implementation
Assessment of terminal
infrastructure in
connection with each
RFC

© B
SL T
ransport
atio
n C
onsultants
Gm
bH
& C
o. K
G 2
015
Page 14
RAIL HINTERLAND TRANSPORTATION
Sufficient capacity of hinterland corridors and reliable services are
considered to be extremely relevant to promote CT in Europe
Source: BSL Transportation analysis, various port authorities, Portopia, partly estimates (see report for further details)
©B
SL T
ransport
atio
n C
onsultan
ts G
mbH
& C
o.
KG
2014
N:\PROJEKTE\UIC\11_097_001_UIC_Kombi_Transport\10_PRÄSENTATIONEN\Seaports\11_097_001_UIC_Seaport_analysis_150202.pptxdata2map.at
MRT
KWT
ESH
Hamburg 39%
Bremerhaven 47%
Barcelona 11%
Felixstowe 28%
Gdynia 41%
Ravenna 12%
Tanger 6%
Rail share of hinterland transport 2013
(only gateway-traffic)
Livorno 13%
Riga 25%
Zeebrugge 29%
(1) Estimation
(2) Rail access nearby port
La Spezia 25%
Trieste 30%
Algeciras 5%
Alicante 0%Cádiz 0%
Leixoes 1%
Liverpool 0%
Oslo 10%
Piraeus 0%
Vigo 0%
Helsinki 2%
Gdansk 36%
FR
DE
UK
ES
PT
IE
LU
NO
PL
SE
FI
LV
CH
EE
AT
BY
IT
UA
CZ
SK
HU
RU
BA RS
RO
MD
MK
GR
BG
TR
SI
Venice 1%
NL
BE
DK
Rotterdam 11%
HR
Antwerp 7%
ME
AL
Koper 61%
KV
LTRU
Rail share of container
hinterland volume
Total container
hinterland volume
Maritime CT represents a key
segment of the European CT
market
The development of hinterland
transport volumes, and thus
maritime CT, is closely related to
the development of seaborne
container throughput at major
seaports
European ports where rail
traditionally plays a key role in
hinterland transportation are the
North Range ports Hamburg and
Bremerhaven, but also Koper and
Trieste in the Mediterranean
Largest absolute hinterland
volumes in Hamburg (>2.1m TEU)
and Bremen (> 1m TEU)
© B
SL T
ransport
atio
n C
onsultants
Gm
bH
& C
o. K
G 2
015
Page 15
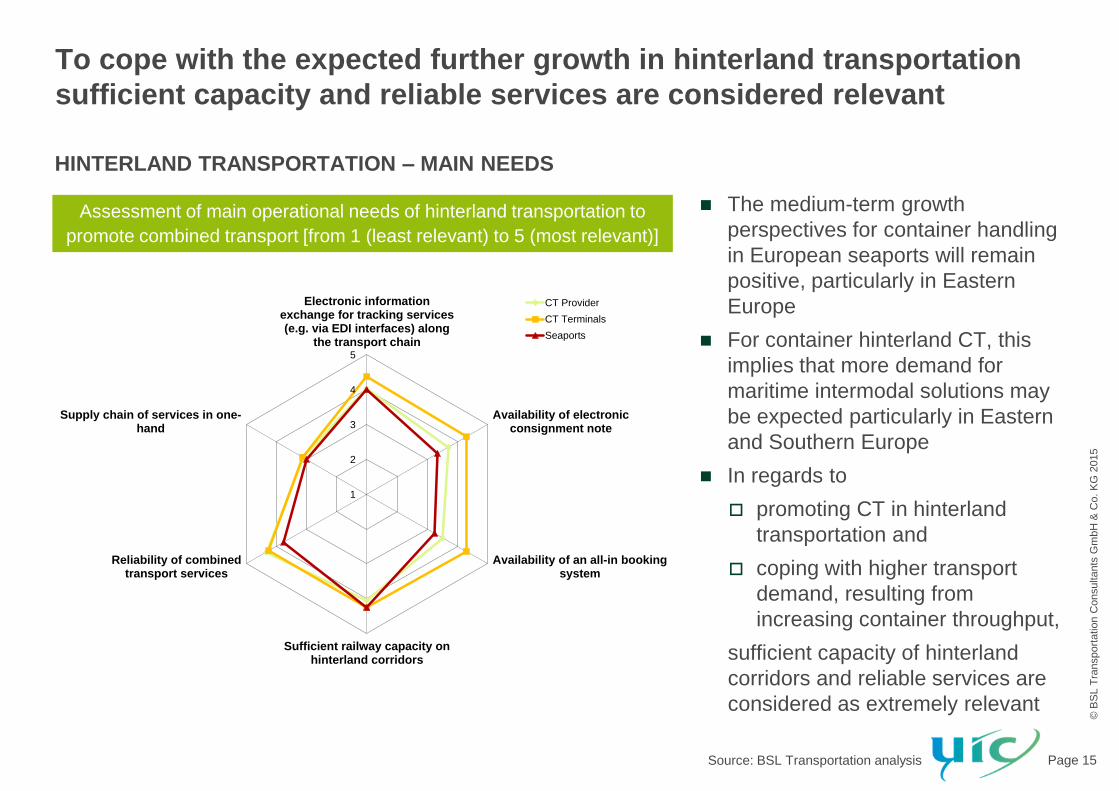
HINTERLAND TRANSPORTATION – MAIN NEEDS
To cope with the expected further growth in hinterland transportation
sufficient capacity and reliable services are considered relevant
Source: BSL Transportation analysis
Assessment of main operational needs of hinterland transportation to
promote combined transport [from 1 (least relevant) to 5 (most relevant)]
1
2
3
4
5
Electronic informationexchange for tracking services(e.g. via EDI interfaces) along
the transport chain
Availability of electronicconsignment note
Availability of an all-in bookingsystem
Sufficient railway capacity onhinterland corridors
Reliability of combinedtransport services
Supply chain of services in one-hand
CT Provider
CT Terminals
Seaports
The medium-term growth
perspectives for container handling
in European seaports will remain
positive, particularly in Eastern
Europe
For container hinterland CT, this
implies that more demand for
maritime intermodal solutions may
be expected particularly in Eastern
and Southern Europe
In regards to
promoting CT in hinterland
transportation and
coping with higher transport
demand, resulting from
increasing container throughput,
sufficient capacity of hinterland
corridors and reliable services are
considered as extremely relevant

© B
SL T
ransport
atio
n C
onsultants
Gm
bH
& C
o. K
G 2
015
Page 16
NATIONAL CT MEASURES
Most of the identified measures in favour of CT are operational, while
infrastructural measures mainly concern rail combined transport
Source: BSL Transportation analysis, national authorities
©B
SL T
ransport
atio
n C
onsultan
ts G
mbH
& C
o.
KG
2015
N:\PROJEKTE\UIC\11_097_001_UIC_Kombi_Transport\10_PRÄSENTATIONEN\11_097_001_UIC_Report-slides_v23.pptxdata2map.at
National
measures in
favour of CT
Austria
Belgium
France
Germany
Greece
Poland
Serbia
Slovakia
Switzerland
United Kingdom
FR
UK
GR
DE
CH
PL
BE
ATSK
RS
Aktualisiert
Seite 4
©B
SL T
ransport
atio
n C
onsultan
ts G
mbH
& C
o.
KG
2013
N:\PROJEKTE\UIC\11_097_001_UIC_Kombi_Transport\10_PRÄSENTATIONEN\Nationale Förderprogramme\11_097_001_UIC_Kombi_Transport_Nationale Förderprogramme_Grafiken_20150202.pptx
Infrastructure
26.3%
Research
21.1%
Operational52.6%
100%
Other CT
Rail + CT
Combined Transport
10%
40%
50%
80%
20%
Funding measures split in funding sector (n= 19 Programmes)Countries with national CT measures Analysis of CT funding measures
Ten countries are identified with current national programmes (in 2014 in force) to support CT activities
Measures that aim at supporting operational activities amount to more than 50% of all identified
programmes
The infrastructural measures mainly concern rail combined transport, while research and operational
programmes cover all kinds of funding scope or combined transport without further specification

© B
SL T
ransport
atio
n C
onsultants
Gm
bH
& C
o. K
G 2
015
Page 17
CT MARKET OUTLOOK
The expected average growth for CT amounts to approx. 4% p.a. varying
widely among the individual company’s assessments
Actual CT volume growth from 2011 to 2013 (+8.9%) outperformed expectations of market participants
two years ago (+3.5%)
The future expectations regarding the CT market remain optimistic with an expected average growth
rate of approx. +4% p.a. for the next years
Companies’ individual forecasts of expected growth rates differ considerably ranging from -5% to more
than 100% p.a.
Source: BSL Transportation analysis
How do you expect your company's total combined rail/road transport volume to develop in the upcoming years (in %)?
2013 2014 2015 2016
+6.0%
+3.9%
+4.1%
Average expectation
2014 to 2016
Average expectation
2014 to 20151)
Average expectation
2013 to 20141)
1) Weighted average (based on volumes)

© B
SL T
ransport
atio
n C
onsultants
Gm
bH
& C
o. K
G 2
015
Page 18
FURTHER CT MARKET POTENTIAL
Further potential for combined transport is expected particularly on the
rail corridor towards Eastern Europe and Turkey
Source: BSL Transportation analysis
17%
Turkey 84%4%
6% 47% 37%
Eastern Europe 96%4% 56% 40%
19% 61%
54%
44%
21%North and East Asia
6%
6% 33%
Central Asia
23% strongly agree
agree
strongly disagree
disagree
“We expect further potential for combined transport on the rail corridor towards…”
Remaining % = no comment
© B
SL T
ransport
atio
n C
onsultants
Gm
bH
& C
o. K
G 2
015
Page 19
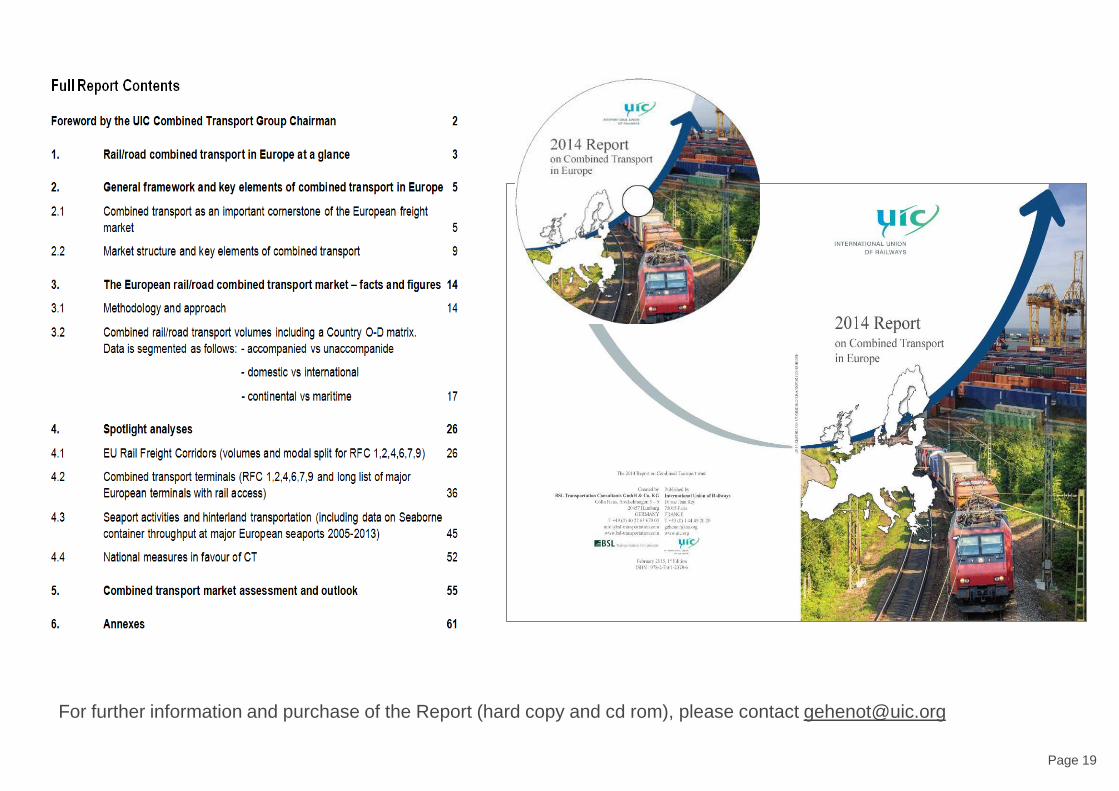
For further information and purchase of the Report (hard copy and cd rom), please contact [email protected]
Top Related