


Languages
Pages
Legal


Presented by
Mark Cambridge, Chief Executive
Claire Smith, Finance Director
May 2014
Interim Results
Six months ended 31 March 2014
The touch solution for all environments

Contents
Overview
Operational
• H1 Touch Volumes by Size & Markets • High Probability Pipeline Analysis
H1 Key Financial Metrics
• Income Statement
• Balance Sheet and Cashflow
Strategic Developments
Summary & Outlook
Appendices
1

Overview
2
Six months ended 31 March
Performance 2014 2013 Comments
Group revenue £8.8m £8.5m 77% of Touch revenues (H1 2013: 74%)
Gross profit £3.0m £2.2m Increased by 35%
Gross profit margin 33.9% 26.0% Mix/volume and operational benefits
Profit before taxation £1.4m £0.8m Increased by 87%
Earnings per share 7.7p 4.1p Increased by 88%
Interim dividend 2.85p 2.75p Increased by 3.6%
Net cash £4.6m £2.8m £3.7m at 30 September 2013

Operational
Total revenues of £8.8m (H1 2013: £8.5m)
• Growth in touch revenues now 77% of total (H1 2013: 74%)
‣ 95% exported (H1 2013: 94%)
Touch
• Revenues up £0.5m to £6.8m (H1 2013: £6.3m)
• Unit volume increased to 62k units (H1 2013: 58k units)
• Improved mix of sensor sizes, significant increase in >30” sizes
‣ Gaming and Signage improving, driving larger sized deployments
• Continuing momentum in large format MPCT™
Non-Touch
• Revenues broadly stable at £2.0m (H1 2013: £2.2m)
‣ ATM display filters account for 76% of total
3

4
H1 Touch Volumes by Size & Markets
PERIOD H1 2013 H1 2014
TOTAL UNITS 58k 62k
SIZE RANGE 0 -14.9" 15 -29.9" 30.0" + 0 -14.9" 15 -29.9" 30.0" +
VOL UNITS 18k 39k 1k 19k 40k 3k
% of TOTAL 31 67 2 30 65 5
VOLUME CHANGE +0.6k +1.3k +2.1k
0
10
20
30
40
2013
2014
2013
2014
2013
2014
2013
2014
2013
2014
2013
2014
0.0 - 9.9" 10.0 -14.9" 15.0 -19.9" 20.0 - 29.9" 30.0 - 49.9" 50.0" +
'000 of Units
Healthcare
Signage
Gaming
Industrial
Telematics
Home
Vending
Financial

H1 Touch Volume by Market
5
0
5
10
15
20
25
30
2012 2013 2014 2012 2013 2014 2012 2013 2014 2012 2013 2014 2012 2013 2014 2012 2013 2014 2012 2013 2014 2012 2013 2014
Healthcare Signage Gaming Telematics Home Industrial Vending Financial
'000 of Units
• 2014 volumes improving across majority of market applications
• Financial - 23% increase in ATM touch, 9ku decrease in bill
payment kiosks to CIS
• Vending improvement driven by ticket machine OEM’s in EMEA
• Signage - primary user of MPCT™ for interactive table systems
• Signage and Gaming main drivers of ultra-large format sizes

High Probability Pipeline Analysis
6
0
10
20
30
40
50
60
No. as of
30 Sept 13
No. going into
Production
No. Dead/Lost No. Re-rated
Mid/Low
No. of New
Prospects
No. as of
31 March 14
51
43
25 3
6
26
Nu
mb
er
of H
igh
Pro
ba
bili
ty P
rosp
ects
MARKET 30/09/13 Production Dead/Lost Re-rated New 31/03/14
Finance 6 0 0 2 6 10
Gaming 4 3 0 0 4 5
Vending 10 4 2 2 4 6
Signage 17 7 1 2 7 14
Industrial 7 4 0 0 4 7
Other 7 7 0 0 1 1

H1 Key Financial Metrics
-2
0
2
4
6
2011 2012 2013 2014
-1.4
0.9
2.8
4.6
Net cash (£m)
0.0
1.0
2.0
3.0
4.0
2011 2012 2013 2014
2.9
3.9
2.2
3.0
Gross profit (£m)
0
6
12
2011 2012 2013 2014
6.4
11.1
4.1
7.7
Earnings per share (p)
0
1
2
3
2011 2012 2013 2014
2.1
2.6 2.75 2.85
Dividend (p)
7
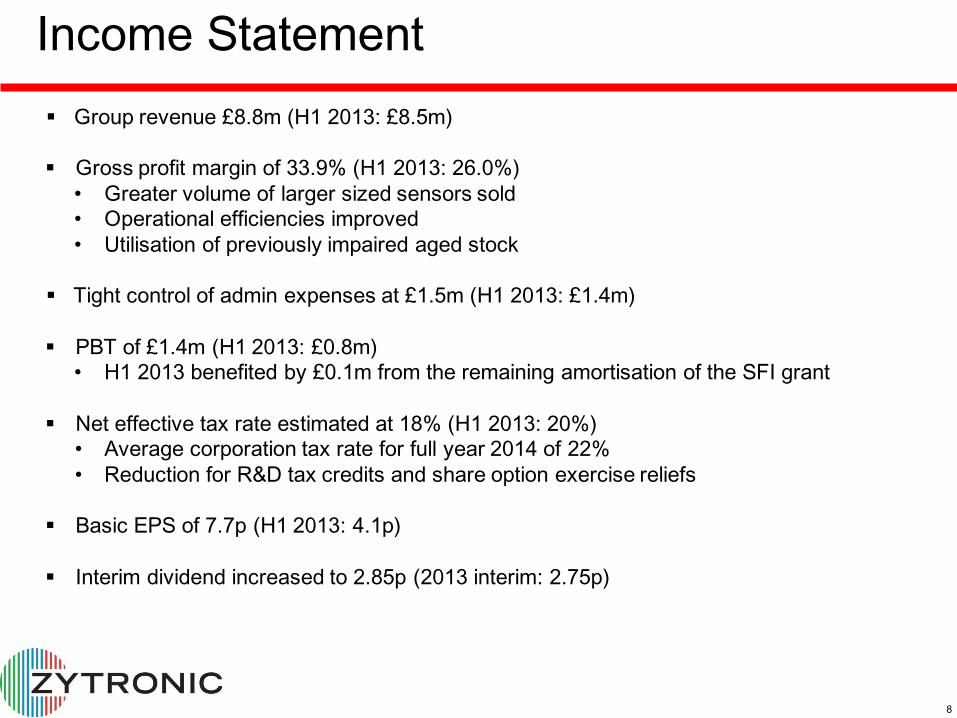
Income Statement
Group revenue £8.8m (H1 2013: £8.5m)
Gross profit margin of 33.9% (H1 2013: 26.0%)
• Greater volume of larger sized sensors sold • Operational efficiencies improved
• Utilisation of previously impaired aged stock
Tight control of admin expenses at £1.5m (H1 2013: £1.4m)
PBT of £1.4m (H1 2013: £0.8m) • H1 2013 benefited by £0.1m from the remaining amortisation of the SFI grant
Net effective tax rate estimated at 18% (H1 2013: 20%)
• Average corporation tax rate for full year 2014 of 22%
• Reduction for R&D tax credits and share option exercise reliefs
Basic EPS of 7.7p (H1 2013: 4.1p)
Interim dividend increased to 2.85p (2013 interim: 2.75p)
8

Group remains in a strong financial position
Currency fluctuation mitigated through natural hedging and FX contracts
Cash position and cashflows
• Strong net cashflow from operating activities £1.9m (H1 2013: £1.7m)
• Cash increased to £6.3m (30 September 2013: £5.5m)
• Borrowings reduced to £1.6m (30 September 2013: £1.7m)
• Intangible fixed asset spend of £0.2m (H1 2013: £0.1m)
• Reduction in working capital of £0.2m (30 September 2013: £0.9m)
• Taxation paid £0.2m (H1 2013: £0.4m)
• 2013 Final dividend payment increased to £1.0m (2013: Final dividend of £0.9m)
Group remains ungeared
Balance Sheet & Cashflow
9

Strategic Developments
Sales Channels
North America channel partner support office • Atlanta based Zytronic Inc. established in February 2014
• Sales Support Engineer appointment from May 2014
New Chinese sales channel initiative
• Export to China - Fast Track Programme
Product development
Large format curved touch solutions
Encrypted touch sensors and displays
Marketing
Website
• Launched microsites for China, Japan and USA
Trade exhibitions during calendar 2014
• ISE digital signage show in January • Infocomm digital signage show in June
• Electronica in November
10
Significantly improved performance
Benefiting from the improving mix of touch sensor solutions across a broad base
Strong customer relationships
Increasing opportunities across target markets
Strong financial position
Continued investment in business development
Current trading has continued at the recently improved levels
Summary & Outlook
11

Appendices
12

Vision & Mission
Vision
Zytronic’s touch sensor product ranges to be pre-eminent in those regions and uses
requiring medium to ultra-large sized touch interactive systems
Mission
Expansion of our global sales footprint, through regional sales channel partnership
agreements
Focus on growing vertical markets where we have a competitive advantage: vending,
public information, industrial, financial and gaming equipment
13

Key Milestone Events
16
YEAR DESCRIPTION
2014 Zytronic Inc. opened in Atlanta, Georgia, for pre and post technical sales support services
2013 MPCT™ touch solution wins two prestigious international engineering awards
2012 Development and patent filing of Mutual Projected Capacitive Technology (MPCT™) touch solution
2011 ZYPOS design win for Bosch Siemen’s Gaggenau induction cooktop. Investment in additional equipment and cleanroom
refurbishment to drive efficiency gains
2010 ZXY100 Series controllers and chipset solution to market
2009 ZYPOS design wins for Coca-Cola Freestyle™ drinks dispensing machine and Aristocrat Indago™ gambling equipment
2008 ZYPOS manufacturing facility operational. Electronics development programme of ZDL ASIC and ARM® processor for
new touch controller
2006 ZYPOS® development. Acquisition of new building for future ZYPOS manufacturing
2005 ZYTOUCH design wins for Petrol Pump applications; Route to market defined through Global Channel partners of Agents
and Value Add Resellers (VAR’s)
2002 ZYTOUCH design wins for ATM’s (2 of the global top 3) and BT Webphone
2001 First Commercial PCT based product to market – trade named ZYTOUCH®
2000 Zytronic quoted on London Stock Exchange (LSE), Alternative Investment Market (AIM)
® are registered trademarks in the UK.
14

Applying a finger due to the body’s self-capacitance changes
the frequency of oscillation. Measuring the change on an XY
array, identifies the 2D touch point.
Capacitive electrodes oscillate at a known frequency
Zytronic’s PCT™ Sensing
Saleable sensor and controller
15

Zytronic’s MPCT™ Sensing
The X axis acts as a transmitter
whilst the Y acts as a receiver. The
common term applied to the
sensing technique is Mutual
Capacitance.
A complex array of X and Y micro-
fine wire electrodes is created to
cover the whole surface of the
touch active area. Point to point
spacing varies between 6 – 15mm
depending upon sensor size.
Each cross-over point in the
array is uniquely addressable,
therefore a number of touch
points are simultaneously
achievable.
16

Competition Comparison
Zytronic’s PCT™ & MPCT™ products used in industrial and
public access markets and not
consumer markets
Historical competing technologies are Acoustic,
Surface Capacitive and Infra-
Red/Optical touch
Increasing competition from ITO
based Projected Capacitive
suppliers (3M, TPK, etc.)
Commercial availability of in-cell
touch by display manufacturers is disruptive, albeit in the small
size ranges
17

Sales & Marketing
Export focused business
Coverage across 61 countries
38 partner agreements
End-User Application Exhibition focus
18
Global Channel Partners - Agents
- Value Add Resellers (VAR)
End-User Applications • Entertainment
• Financial
• Signage
• Vending, etc.
MARKETING - Website
- Trade Exhibitions
- Trade PR
VAR SALES - Direct to OEM
DEMAND
GENERATED
ZYTRONIC SALES - Direct to OEM
- Direct to VAR Channels

19
Touch Markets and Product Uses
Markets
End-use categories
Finance
ATM’s, Bill Payment Kiosks
Gaming
Casino Table Game, Casino Upright Game, Jukebox, Wagering/Lottery
Terminal, Pub Game
Vending
Fuel Vend, Product Vend, Service Vend
Signage
Interactive Tables, Wayfinding Terminals, Menu-boards, POI Systems
Industrial
Human Resource Kiosks, HMI
Other
(Industrial/Agricultural/Marine) GPS, Healthcare, Cooking, Washing,
Home Control
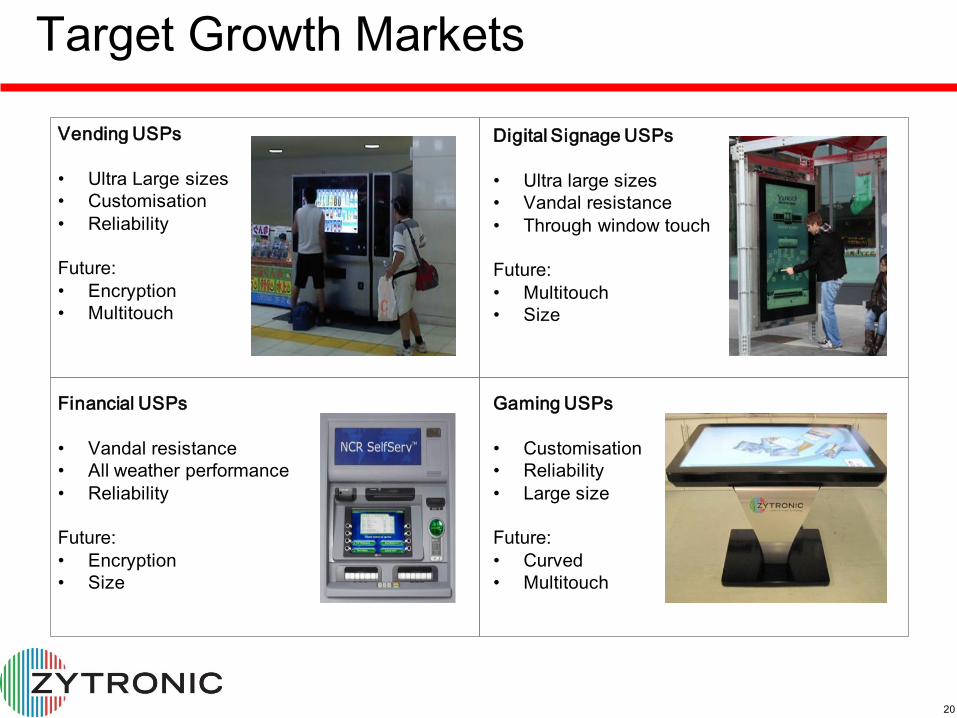
Financial USPs
• Vandal resistance
• All weather performance
• Reliability
Future:
• Encryption
• Size
Gaming USPs
• Customisation
• Reliability
• Large size
Future:
• Curved
• Multitouch
Vending USPs
• Ultra Large sizes
• Customisation
• Reliability
Future:
• Encryption
• Multitouch
Digital Signage USPs
• Ultra large sizes
• Vandal resistance
• Through window touch
Future:
• Multitouch
• Size
Target Growth Markets
20
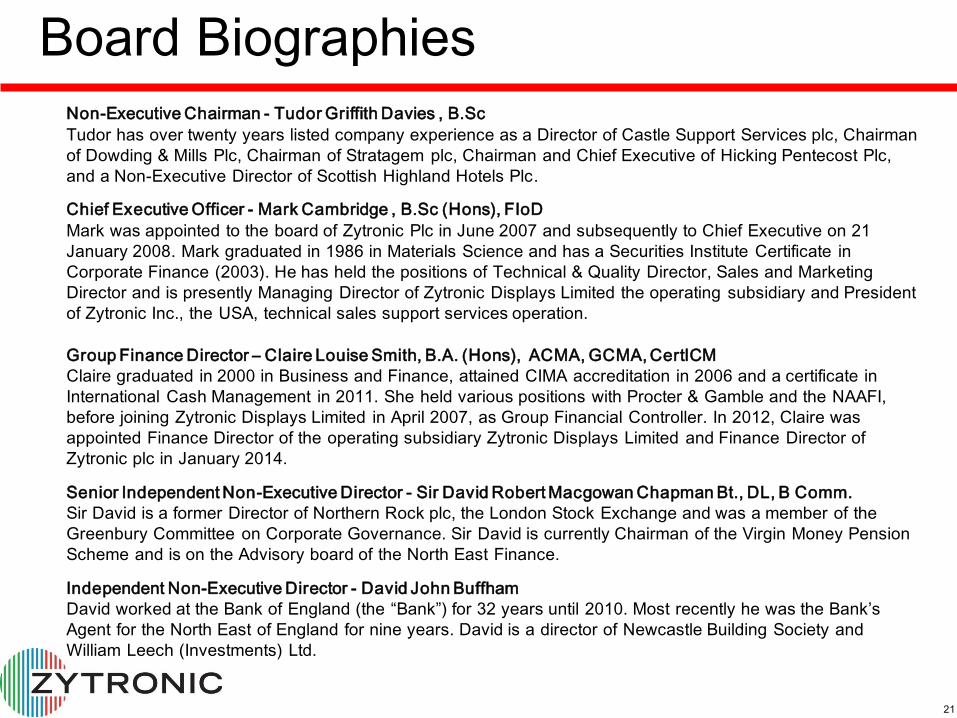
Non-Executive Chairman - Tudor Griffith Davies , B.Sc
Tudor has over twenty years listed company experience as a Director of Castle Support Services plc, Chairman
of Dowding & Mills Plc, Chairman of Stratagem plc, Chairman and Chief Executive of Hicking Pentecost Plc,
and a Non-Executive Director of Scottish Highland Hotels Plc.
Chief Executive Officer - Mark Cambridge , B.Sc (Hons), FIoD
Mark was appointed to the board of Zytronic Plc in June 2007 and subsequently to Chief Executive on 21
January 2008. Mark graduated in 1986 in Materials Science and has a Securities Institute Certificate in
Corporate Finance (2003). He has held the positions of Technical & Quality Director, Sales and Marketing
Director and is presently Managing Director of Zytronic Displays Limited the operating subsidiary and President
of Zytronic Inc., the USA, technical sales support services operation.
Group Finance Director – Claire Louise Smith, B.A. (Hons), ACMA, GCMA, CertICM
Claire graduated in 2000 in Business and Finance, attained CIMA accreditation in 2006 and a certificate in
International Cash Management in 2011. She held various positions with Procter & Gamble and the NAAFI,
before joining Zytronic Displays Limited in April 2007, as Group Financial Controller. In 2012, Claire was
appointed Finance Director of the operating subsidiary Zytronic Displays Limited and Finance Director of
Zytronic plc in January 2014.
Senior Independent Non-Executive Director - Sir David Robert Macgowan Chapman Bt., DL, B Comm.
Sir David is a former Director of Northern Rock plc, the London Stock Exchange and was a member of the
Greenbury Committee on Corporate Governance. Sir David is currently Chairman of the Virgin Money Pension
Scheme and is on the Advisory board of the North East Finance.
Independent Non-Executive Director - David John Buffham
David worked at the Bank of England (the “Bank”) for 32 years until 2010. Most recently he was the Bank’s
Agent for the North East of England for nine years. David is a director of Newcastle Building Society and
William Leech (Investments) Ltd.
Board Biographies
21
Top Related