


Languages
Pages
Legal


Interim Findings and Recommendations from the Whole House Process Evaluation
May 1, 2012
Presented to: Energy Division/CPUC; CEC; ED Consultants; and IOU
Program/Product & EM&V TeamsPrepared by: SBW Consulting, Inc.
Opinion Dynamics CorporationASW Engineering
Part Three of Today’s Presentation
Overview of Whole House Program (Page 3) Study Methodology and Data Collection (Page 12) Interim Report Workbook (Page 15) Recommendations
Marketing (Page 17) Implementation (Page 31) Program Design (Page 42)
Other Findings Relevant to Program Design (Page 58)
2May 1, 2012

Whole House Program Overview
The statewide program offers incentives and other support for two upgrade packages (Basic and Advanced) to homeowners.
Upgrades include house and duct sealing, insulation (attic, duct, wall and floor), windows, HVAC, hot water heater and lighting.
The program recruits, trains and supports a workforce of independent contractors who market the program (primarily in-person), identify efficiency measure packages, perform pre/post testing and EnergyPro modeling (advanced only), and provide IOUs with required documentation.
Utilities conduct QA/QC reviews, approve jobs and pay incentives. Under ARRA other local entities have also paid incentives (ending this year). 3May 1, 2012

Program’s Current Stage of Development Program in a pilot phase through mid 2011. Even now, it is
still working hard to refine procedures and delivery strategies.
Program is still learning what contractors can do (marketing and many technical tasks) and how much training they need.
ARRA funding helped and hurt Provided marketing and incentive support… But, moved the program faster than it was ready Created a complex management environment
Concern over what will happen after ARRA Financing; lack of below market financing options Marketing; losing momentum Losing Assessment Incentives and Premium Incentives
4May 1, 2012
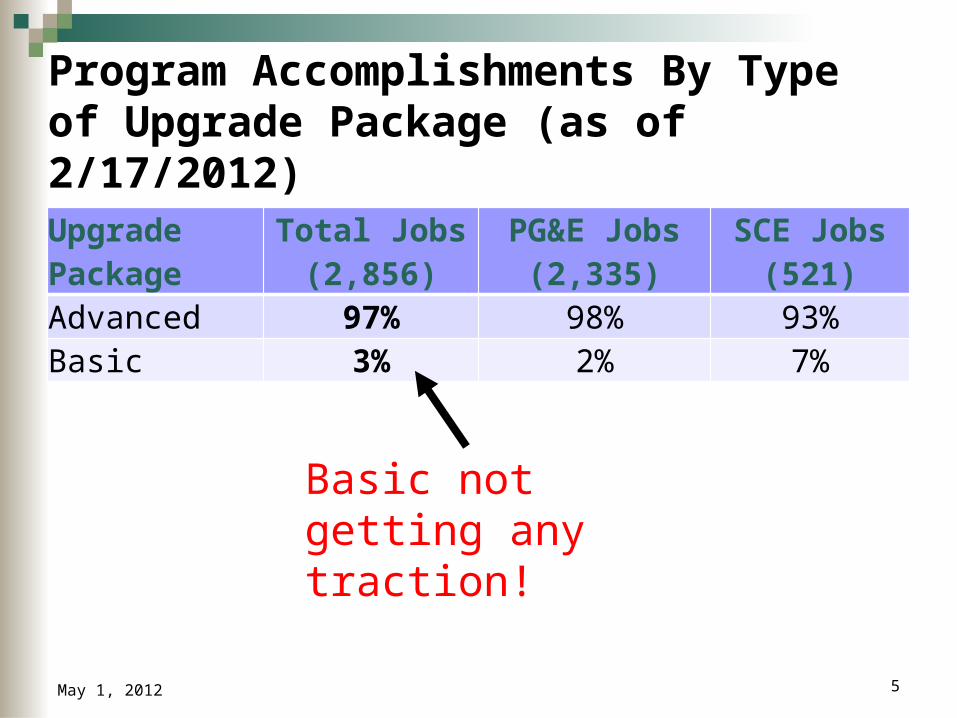
Program Accomplishments By Type of Upgrade Package (as of 2/17/2012)Upgrade Package
Total Jobs (2,856)
PG&E Jobs (2,335)
SCE Jobs (521)
Advanced 97% 98% 93%Basic 3% 2% 7%
5May 1, 2012
Basic not getting any traction!

Jobs Completed and in Pipeline
6May 1, 2012
PG&E / Unknown
PG&E / SMUD
SCE / SCG
TotalPG&E / Other /
Unknown
PG&E / SMUD
SCE / SCG
Total
Completed 660 138 70 868 582 124 51 757 In Pipeline 227 67 17 311 885 599 383 1,867 Total 887 205 87 1,179 1,467 723 434 2,624 Note: Completed projects are those in which IOU records indicate the rebate was approved or the incentive check was sent. In pipeline projects are all other projects, except those that were canceled. Table based on tracking data obtained 2/17/2012.
Evaluation period (7/1/11 - 2/17/12)Pilot period (8/27/10 - 7/1/11)

Contractor Workforce
7May 1, 2012
TypeVolume Group
Count % Count % Count % Count %
Enrolled High 32 23% 2,171 93% 13 13% 495 93%
Low 35 25% 153 7% 18 18% 39 7%
Zero 73 52% - 67 68% -
Total 140 100% 2,324 100% 98 100% 534 100%
BPI Certified, not Enrolled
183 - 58 -
Note: High volume is defined as 10 or more projects in PG&E territory or 5 or more projects in Note: Includes projects from the pilot and post-pilot period; includes cancelled jobsNote: Some contractors serve both IOU territories but usually much more one than the other; Note: BPI records were reviewed 11/5/2011; job records were reviewed 1/17/2012.
SCE/SCG
Contractors Jobs Contractors Jobs
PG&E

Percent Savings Reported by Program
8May 1, 2012
IOUUpgrade
TypeCompleted
JobsPercent Savings
PG&E Advanced 936 31%SCE Advanced 106 27%SCE Basic 15 10%Note: Based on Pilot and post-Pilot completed jobsNote: PG&E values are derived from EGIA database

Job Cost
9May 1, 2012
[Table, graph or figure starts in this cell]
$0
$10,000
$20,000
$30,000
$40,000
$50,000
$60,000
$70,000
$80,000
PG&E Advanced Cost(Check Sent, n=387,
mean=$16,056)
SCE/SCG Advanced Cost(Complete, n=106,
mean=$13,375)
SCE/SCG Basic Cost(Complete, n=15,
mean=$3,463)
Median Mean

Percent Measure Cost Covered by IOU Incentive
10May 1, 2012
[Table, graph or figure starts in this cell]
0%
10%
20%
30%
40%
50%
60%
70%
80%
90%
100%
PG&E Incentive percent of Cost (CheckSent n=387, mean = 23%)
SCE/SCG Incentive percent of Cost(Completed, n=106, mean=27%)
Median Mean

Reduction in House Air Leakage
11May 1, 2012
[Table, graph or figure starts in this cell]
0.00
0.20
0.40
0.60
0.80
1.00
1.20
1.40
SCE/SCG Pre-installation ACH (n=15,mean=.59)
SCE/SCG Post-installation ACH (n=15,mean=.38)
Median Mean

Interim Report Data Collection
Data Collection Task Sample Size / Source Timing
Program Staff Interviews n=25 (9 SCE, 16 PG&E) Nov-Dec 2011
Contractor Interviews n=39 (8 not enrolled), (8 inactive), (8 low volume), (8 high volume), (7 Davis Energy Group)
Feb 2012
Participant Survey n=78 (62 PG&E, 16 SCE) Feb 2012
Local Entities n=12 (8 PG&E, 4 SCE) Dec-Feb 2012
Marketing Effectiveness Survey
PG&E Only, n=81 workshop attendees, n=235 target population in 5 counties
Feb 2012
12May 1, 2012
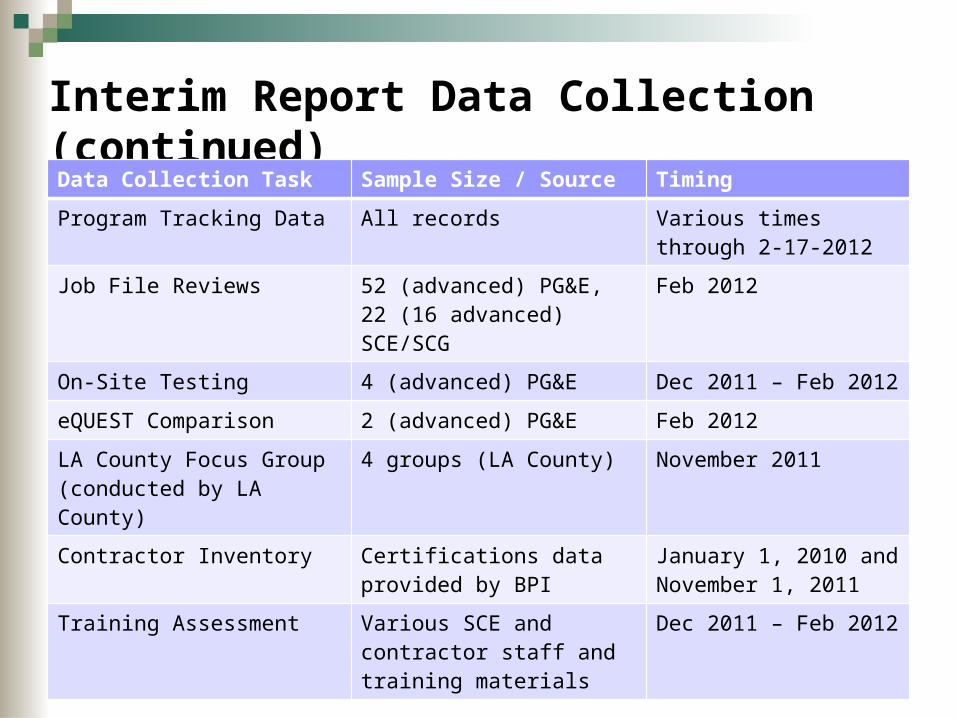
Interim Report Data Collection (continued)
13May 1, 2012
Data Collection Task Sample Size / Source Timing
Program Tracking Data All records Various times through 2-17-2012
Job File Reviews 52 (advanced) PG&E, 22 (16 advanced) SCE/SCG
Feb 2012
On-Site Testing 4 (advanced) PG&E Dec 2011 – Feb 2012
eQUEST Comparison 2 (advanced) PG&E Feb 2012
LA County Focus Group (conducted by LA County)
4 groups (LA County) November 2011
Contractor Inventory Certifications data provided by BPI
January 1, 2010 and November 1, 2011
Training Assessment Various SCE and contractor staff and training materials
Dec 2011 – Feb 2012

Additional Data Collection for Final Report
14May 1, 2012
Data Collection Task Sample Size / Source Timing
Program Tracking Data N=TBD Through fall 2012
Job File Reviews 50 PG&E, 20 SCE/SCG Fall 2012
On-Site Testing 4 PG&E advanced jobs Fall 2012
Program Staff Interviews (same respondents)
9 PG&E, 8 SCE Fall 2012
Contractor Interviews (same respondents)
16 PG&E, 16 SCE 16 Fall 2012
Local Entities (same respondents)
8 PG&E, 4 SCE Fall 2012
Participant Survey 60 PG&E, 25 (summer) 25 (fall) SCE/SCG
PG&E fall 2012SCE/SCG summer and fall 2012
Referral Drop-out Survey 35 PG&E, 25 SCE/SCG Fall 2012

Interim Report Workbook with Findings, Recommendations and Supporting Data Main Tabs
Findings Recommendations Captions (IDs below refer to lines on this Tab) Glossary
Examples Refer To
“Participant Characteristics” (ID=55) “Pre and Post Leakage Rate (ACH) for SCE/SCG jobs”
(ID=37) “Percent Reductions in Whole House and Duct Leakage
Rates” (ID=38)
15May 1, 2012

Recommendations Address Three Areas
Marketing Implementation Program Design
16May 1, 2012

Marketing Recommendations
Contractor Marketing Support Contractor Marketing Efforts (Rec. Tab ID=7)
EUC Website Move EUC Website Control to the IOUs (Rec. Tab ID=8) Implement EUC Website Improvements (Rec. Tab ID=6)
IOU Marketing Strategies (Rec. Tab ID=5) Findings Recommendations
17May 1, 2012

Support Contractor Marketing Efforts
Findings Contractors are the most effective marketing channel 34% of PG&E and 25% of SCE/SCG participants heard
about program through a contractor (most common method)
Contractors say EUC website and door hangers are effective for lead generation
Contractors want whatever support they can get
18May 1, 2012

Support Contractor Marketing Efforts (continued)
Recommendations Provide easily distributable marketing materials for
contractors Door hangers Brochures and fact sheets Allow for co-marketing Support contractor presentations
Relevant To: PG&E and SCE Marketing Staff and BIG & ICFI Marketing Staff
19May 1, 2012

20
Move EUC Website Control to the IOUs Findings
Program staff cannot access customer data and it is impeding ability to market the program
Evaluation staff cannot access customer data; could not conduct non-participant survey
Recommendations Keep one centralized EUC program website Give utilities power to change content and user interface Give IOUs access to customer data so they can do
follow-up marketing with interested customers Relevant To
PG&E and SCE Program Staff and CEC
May 1, 2012

21
Implement EUC Website Improvements Findings
The program currently has one main EUC website
53% of participants went to website and gave moderate to high ratings
LA County’s focus groups delved deeply into the website and illuminated a number of issues
Program staff mentioned issues with website’s ability to educate customers about the program
May 1, 2012
Total
(n=78)PG&E
(n=62)SCE
(n=16)Visited Site 53% 52% 56%Information was easy to understand 8.3 8.5 7.7
Gave a good understanding of program offerings 8.2 8.2 8.2
Accurately reflected my program experience 7.9 8.2 6.9
Note: Means are from those visiting the site, and are derived from 11-point scales where 0 means 'completely disagree' and 10 means 'completely agree'.

22
Implement EUC Website Improvements (continued) Recommendations
LA County's focus group recommendations should be implemented:
Better define where residents should begin their search for general program information when they arrive at the site.
Better communicate that rebates are tied to energy savings. Provide more examples based on different types of homes. Make it clear that all income levels can participate. Provide informational short cuts to help digest information such as
short videos or a step-by-step synopsis. Add a 1-800 number prominently on the home page.
Relevant To PG&E and SCE Marketing Staff and CEC
May 1, 2012
23
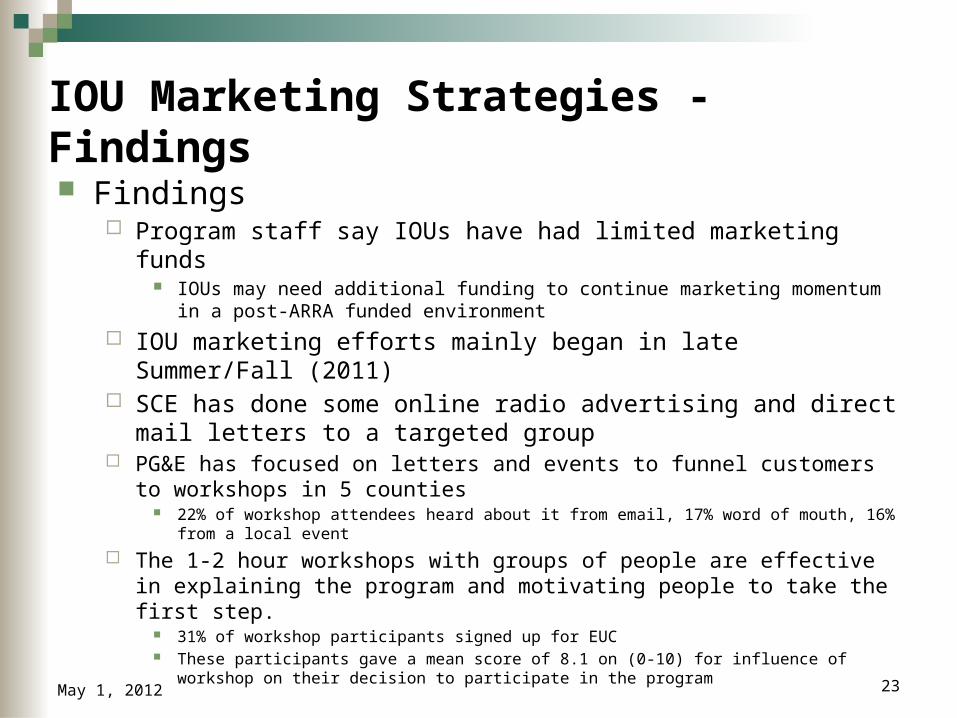
IOU Marketing Strategies - Findings Findings
Program staff say IOUs have had limited marketing funds IOUs may need additional funding to continue marketing momentum in a
post-ARRA funded environment
IOU marketing efforts mainly began in late Summer/Fall (2011) SCE has done some online radio advertising and direct mail
letters to a targeted group PG&E has focused on letters and events to funnel customers to
workshops in 5 counties 22% of workshop attendees heard about it from email, 17% word of mouth, 16% from a
local event
The 1-2 hour workshops with groups of people are effective in explaining the program and motivating people to take the first step.
31% of workshop participants signed up for EUC These participants gave a mean score of 8.1 on (0-10) for influence of workshop on their
decision to participate in the program
May 1, 2012
24
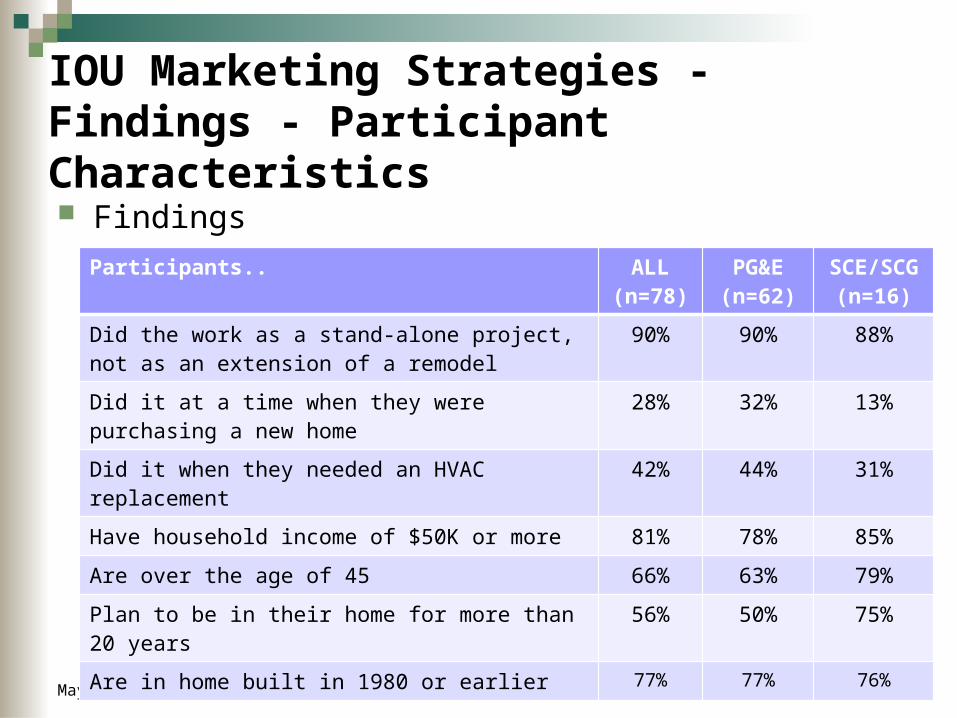
IOU Marketing Strategies - Findings - Participant Characteristics Findings
May 1, 2012
Participants.. ALL (n=78)
PG&E (n=62)
SCE/SCG
(n=16)
Did the work as a stand-alone project, not as an extension of a remodel
90% 90% 88%
Did it at a time when they were purchasing a new home
28% 32% 13%
Did it when they needed an HVAC replacement 42% 44% 31%
Have household income of $50K or more 81% 78% 85%
Are over the age of 45 66% 63% 79%
Plan to be in their home for more than 20 years
56% 50% 75%
Are in home built in 1980 or earlier 77% 77% 76%
25
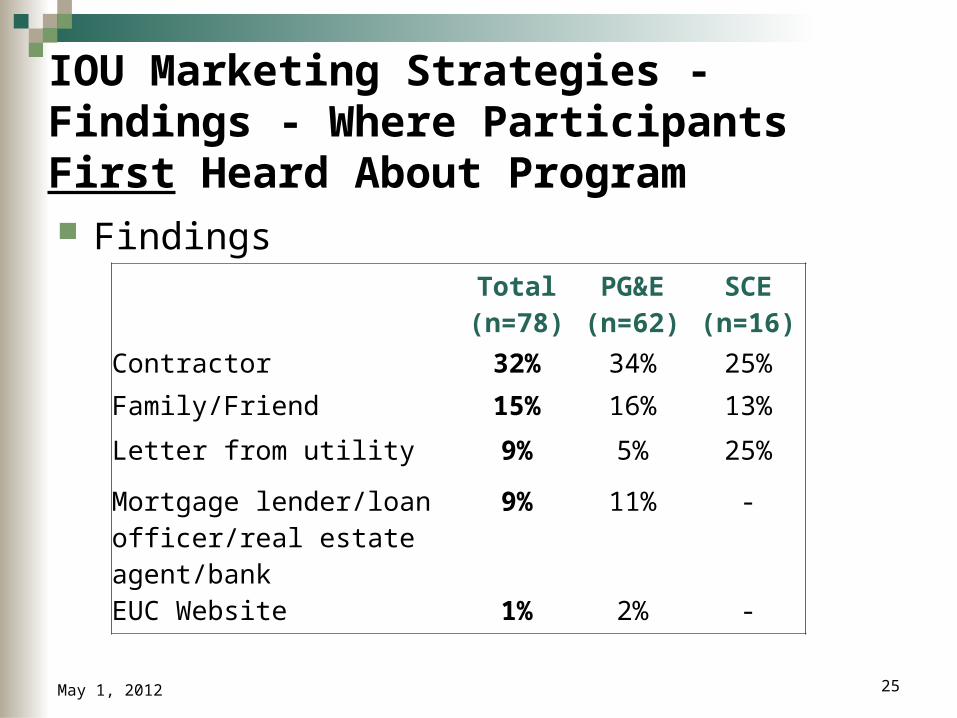
IOU Marketing Strategies - Findings - Where Participants First Heard About Program Findings
May 1, 2012
Total
(n=78)PG&E
(n=62)SCE
(n=16)Contractor 32% 34% 25%
Family/Friend 15% 16% 13%
Letter from utility 9% 5% 25%
Mortgage lender/loan officer/real estate agent/bank
9% 11% -
EUC Website 1% 2% -

26
IOU Marketing Strategies – Findings – Program Benefits Findings
Most important reasons for why participants did a whole house project
Comfort Reducing energy usage/bills Incentives available The home energy assessment
Contractors say most effective messaging is: Comfort Incentives Lowering energy bills Differs based on customer and geography for which benefits they emphasize
May 1, 2012

27
IOU Marketing Strategies - Findings - Participant Program Feedback Findings
Participants are very satisfied with the home assessment report
Mean rating of 4.6 (PG&E 4.6, SCE/SCG 4.6) out of 5 for overall satisfaction with report
Participants very satisfied with contractor interaction and services
92% (PG&E 93%, SCE/SCG 98%) would recommend their contractor
Participants very satisfied with program experience overall Rating overall program satisfaction a 4.6 (PG&E 4.7, SCE/SCG 4.1) (scale 1-
5) Reasons for high ratings include:
Incentives made it more affordable House is more comfortable Saved them money/energy
82% (PG&E 85%, SCE/SCG 69%) gained energy-related knowledge
81% (PG&E 82%, SCE/SCG 75%) participants have seen their energy bill drop
May 1, 2012

28
IOU Marketing Strategies - Recommendations Recommendations
Foster peer-to-peer marketing (High Importance) Leverage positive customer experience so far Customer testimonials Social media
Continue promoting main program benefits Incentives available, lowering energy bills, and home
comfort Value of assessment (identify ways to save)
Continue with email and direct mail marketing to targeted group of customers
Build future target market based on participant characteristics thus far
May 1, 2012

29
IOU Marketing Strategies -Recommendations (continued)
Recommendations Continue with events and workshops Offer brief, step-by-step, explanations & emphasize
importance of whole house Contractors, program staff and LA County’s focus groups
indicated that the program is very complex Contractors & program staff say customers only hear about
the large incentives available from mass media, think they are getting something for free and then contractors spend time educating customers on the whole house approach
SCE's creation of 3 short video clips on website is a good example
May 1, 2012

30
IOU Marketing Strategies -Recommendations (continued)
Recommendations Convene quarterly statewide meetings of all entities
implementing the program Many entities are implementing and marketing this program
statewide Discuss best practices in marketing strategies IOU program staff think this will help
Relevant To: PG&E and SCE Marketing Staff and BIG & ICFI Marketing Staff
May 1, 2012

31
Implementation Recommendations
Training Focus Training and Mentoring On the Top Performing
Contractors (High importance) (Rec. Tab ID=3) Implement SCE Training Assessment Recommendations
(Rec. Tab ID=22-27) Paperwork
Reduce Job Processing Time and QA/QC Requirements (High importance) (Rec. Tab ID=2)
Adopt Common Statewide Job Reporting (Rec. Tab ID=13)
Financing Identify Financing Options for Customers (Rec. Tab ID=1)
May 1, 2012

32
Focus Training and Mentoring on the Top Performing Contractors Findings
The program is putting forth much effort to train all contractors, mentor the top performing ones and attempt to get more contractors into the program, consistent with…
PPM from Statewide PIP 2010-12: “Number of enrolled contracting firms participating in the program”
Large contractors with multiple crews, administrative and sales staff are successfully selling the program and have added staff to continue supporting the program.
93% of the jobs to date are coming from high volume contractors 61% of active contractors have added staff
Smaller contractors are challenged with selling the program and prefer quick replacements/fixes, instead of whole house solutions.
May 1, 2012

33
Focus Training and Mentoring on the Top Performing Contractors (continued) Recommendations
The program should focus efforts on supporting the top contractors
Help them grow customer base Have them serve as models of success for other contractors Place small emphasis on recruiting new contractors until program is
streamlined Need to stop confusing WE&T objectives (large trained
workforce) with resource acquisition objectives (cost-effective savings).
Relevant To PG&E and SCE program staff, BIG and ICFI
May 1, 2012

34
Implement SCE Training Assessment Recommendations
See companion slide show for details on findings and recommendations Whole House Process Evaluation - SCE Training
Assessment 5-1-12.pptx Topics covered
Participation Workshop Basic Path Training Advanced Path Training Online Learning Center Mentoring
May 1, 2012

35
Identify Financing Options for Customers Findings
Program staff believe having below-market financing options available for customers will increase participation; but do not want the utility to be the bank
44% of participants used financing to pay for projects Contractors say customers’ ability to get financing is the
key reason they get/lose jobs LA County focus groups with non-participants found
customer interest in the program increased after learning about below market financing available through LA County
May 1, 2012

36
Identify Financing Options for Customers (Continued)
Recommendations The program should identify and leverage other
financing options that complement the program Options should be listed on the EUC website and in
contractors' marketing materials Relevant To
PG&E and SCE Program Staff
May 1, 2012

37
Reduce Application Processing Times and QA/QC Requirements Findings
Application processing times, data required and QA/QC procedures are the key causes of contractor program dissatisfaction and serve as a disincentive to participate
Nearly every contractor interviewed said that the paperwork required and constant back-and forth with the program to complete an application delays the beginning of their work and the rebate disbursement
Two-thirds of contractors (non-participating, inactive and low volume contractors) mentioned they had jobs in 2011 that would have qualified for the EUC program but chose not to send them through the program (average of 14 jobs per contractor completed outside of program in 2011)
Some contractors are selling against the program because they don’t want to do the paperwork and wait for QA/QC
Refer to “Time Lags Between Key Phases in Projects” (Captions
ID=71)May 1, 2012

38
Reduce Application Processing Times and QA/QC Requirements (continued) Recommendations
A 3-pronged approach is required to tackle this: Better educate contractors on how to meet program requirements
Increased training on how successfully meet requirements See “Whole House Process Evaluation - SCE Training Assessment 5-1-
12.pptx” Reward contractors that meet requirements
Scale back on QA/QC and things that affect processing times Incent them to get paperwork to the program within a short timeframe
Simplify program requirements Reduce paperwork required to only what is necessary Eliminate double-entry in EnergyPro and JRT (already in progress at
SCE)
May 1, 2012

39
Reduce Application Processing Times and QA/QC Requirements (Continued)
SCE should continue its efforts in this area Reduce the number of projects QC’d to a sample Develop protocols for what the QC team should do when they find
discrepancies PG&E should continue its mentoring program for active
contractors Incentive delivery delays are due in part to a combustion appliance
safety inspection that is required for every participant PG&E is working to finalize safety protocols to allow for inspection
of a sample of completed job
Relevant To PG&E and SCE Program Staff, BIG and ICFI
May 1, 2012

Adopt Common Statewide Job Reporting Findings
PG&E and SCE job reporting is different. Based on file review (52 PG&E and 22 SCE/SCG for jobs completed in 7/1/11 – 2/17/12).
SCE application files contain details needed to run EnergyPro and to document EnergyPro output (measures installed and their savings). PG&E application relies on EnergyPro files for this documentation.
Neither PG&E or SCE files contain positive confirmation of remediation actions taken to resolve safety issues (combustion or house air leakage rate)
40May 1, 2012

Adopt Common Statewide Job Reporting (continued) Recommendations
Adopt common statewide pre and post application documentation
Common job reporting would allow for common statewide contractor training and QC/QA procedures and would facilitate job tracking for management reporting and evaluation.
Common report should included measures installed, energy usage, and test results and should be sharable with EnergyPro and program tracking system to avoid data entry duplication.
Reporting should include results of safety related testing (combustion and leakage) along with positive confirmation of remediation actions taken, e.g., installation of mechanical ventilation.
Relevant To PG&E and SCE program staff, BIG and ICFI
41May 1, 2012

Program Design Recommendations
Services Allow Early Installation of HVAC Appliances (Rec. Tab
ID=15) Modify or Drop the Basic Upgrade Package (Rec. Tab
ID=10) Improve Customer Service to Contractors and Customers
(Rec. Tab ID=4) Incentives
Offer Contractor Incentives (Rec. Tab ID=9) Increase Homeowner Incentives (Rec. Tab ID=11) Subsidize the Assessment Cost (Rec. Tab ID=12)
Energy Modeling Improve Whole House Energy Modeling (Rec. Tab ID=20)
42May 1, 2012

Allow Early Installation of HVAC Appliances Findings
HVAC system replacement and water heater replacement are eligible measures.
Contractors state that the application lag time precludes program participation at sites where these appliances need immediate replacement.
PG&E, with a shorter lag time before authorization to proceed, installed more HVAC (61% vs. 38%) and more water heaters (29% vs. 19%).
Refer To “Distribution of Measures in SCE/SCG Advanced Jobs and Advanced
PG&E jobs” (Captions ID=36)
43May 1, 2012

Allow Early Installation of HVAC Appliances (continued)
Recommendations Allow contractors to install new HVAC systems and hot
water heaters prior to approval of preliminary application in cases of need.
Contractors may oversize, due to not knowing what shell measures might be installed later, but this will happen in any case if the replacement is an emergency. If replaced without program assistance the HVAC equipment will be less efficient.
Relevant To PG&E and SCE program staff
44May 1, 2012

45
Modify or Drop the Basic Upgrade Package
Findings Contractors are not interested in supporting the basic
package, the basic package requires attic insulation and many homes don’t have attics, contractors would prefer to sell the more lucrative “advanced” jobs.
Refer to “Contractors Quotes on Basic Package” (Captions ID=12)
Very few basic jobs have been completed
May 1, 2012
Package Total (n=2,856)PG&E
(n=2,335)SCE/SCG (n=521)
Advanced 97% 98% 93%Basic 3% 2% 7%

46
Modify or Drop the Basic Upgrade Package (continued)
Recommendations Reconsider the basic package offering. Should it be
dropped or modified? The program's own staff has some interesting ideas for
modifying it: SCE staff suggested giving customers the choice of up to 15
measures and allow them to pick a minimum of 2 core measures and 3 others. This would allow the basic path to progress as a fixed measure path giving more flexibility to the contractor and homeowner and may also streamline the internal application processing for basic.
Relevant To PG&E and SCE Program Management Staff
May 1, 2012

47
Improve Customer Service to Contractors and Customers Findings
Top suggestion from participants and contractors to improve program was to improve customer service
Participants and contractors unsure who to call for status People who answer not familiar with their project or
status SMUD has a link to a website they give customers that
shows rebate progress Recommendations
Establish a single point of contact for customer and contractor inquiries at each IOU
Knowledgeable about program requirements Access to application and rebate status
May 1, 2012

48
Improve Customer Service to Contractors and Customers (continued)
Automated process with status updates for major project milestones (e.g. application received, project approved for rebate, inspection pending, etc.)
A single rebate-status web-portal and/or dedicated EUC customer/contractor service contact
Implementing this recommendation may mean that the IOUs begin to use the same program tracking database or that each of their databases communicate the same data to a third centralized system. This would require that the IOUs use the same job reporting system and the same QC/QC checkpoints in the process so that the same information could be reported to all customers.
Relevant To PG&E and SCE Customer Service Reps and BIG / ICFI Program
Customer Service Reps
May 1, 2012

49
Offer Contractor Incentives
Findings Incentives currently only go to the customer Contractors are not being compensated for the
additional overhead incurred by program participation The NYSERDA program offers contractors incentives for:
BPI certification tuition Diagnostic equipment Marketing Converting an assessment to a project And more…
May 1, 2012
50
Offer Contractor Incentives (continued)
Recommendations Fund contractors to partially cover their cost for
participation Diagnostic tools Training sessions Administrative resources Turning an assessment into an EUC job Doing high quality work Marketing Look at the NYSERDA model for ideas on how incentives can be
structured to help compensate contractors.
Relevant To PG&E and SCE Program Management Staff
May 1, 2012

51
Increase Homeowner Incentives Findings
63% of participants (57% PG&E, 100% SCE) so far have received additional incentives
On average, customers received 68% more than the IOU gave them (average: $2,800 from IOU, $1,900 in premium).
Recommendations Consider increasing the IOU incentive cap to match
some of the premium incentives that have been offered through ARRA funding.
Notably, program staff is concerned that this will works against their objective of reducing job costs
Relevant To PG&E and SCE Program Management Staff
May 1, 2012

52
Subsidize Assessment Cost
Findings Some local entities have been subsidizing assessments
(offering them for free or giving up to $200). Contractors complained that in areas where the
assessment was free to the customer, contractors spent a lot of time with “tire kickers”.
The average cost of the assessment runs from $99-$700 depending on the contractor.
May 1, 2012

53
Subsidize Assessment Cost (continued)
Recommendations Subsidize the assessment cost by $100-$200. The assessment should not be free (to the customer).
Charging something for the assessment reinforces the value of it. The contractors’ price for the assessment should still be left to the contractor in a free market.
Relevant To PG&E and SCE Program Management Staff
May 1, 2012

Improve Whole House Energy Modeling Findings
QC of the EnergyPro model contributes to long delays in processing applications. Very different approaches being taken by PG&E and SCE. Poor contractor skills contribute to this. Needs more investigation.
File review and on-site review found that contractors are making many mistakes in EnergyPro models.
It is possible that the program is trying to train the wrong people to do this and it may never work no matter what is done in training and QC.
54May 1, 2012

Improve Whole House Energy Modeling (continued)
Contractor responses to EnergyPro Many do not believe it assists in making sales. Many do not believe it identifies all savings opportunities. Many do not trust that it accurately models energy savings. Some said it takes a long time to learn, and is a barrier to
joining the program. Contractor’s would prefer a tool that allows them to
visually show the impacts of multiple alternative packages.
55May 1, 2012

Improve Whole House Energy Modeling (continued)
In the EnergyPro, certain parameters are left at CEC defaults, which creates poor models for individual homes:
Thermostat schedule Internal plug loads Lighting schedules
Comparison of EnergyPro and eQuest for two PG&E jobs identified advantages and disadvantages of EnergyPro, but neither work well with current level of data collection
Refer to “EnergyPro & eQUEST Software: Advantages & Disadvantages” (Captions ID=20) “Sensitivity to Changes in Duct Leakage Percentage (Site 1-1057, Site 2-1058)”
(Captions ID=21) “Sensitivity to Changes in Improved Roof U-Value (Site 2-1058)” (Captions ID=22) Also see other captions under Data Source = “eQUEST Comparison”
56May 1, 2012

Improve Whole House Energy Modeling (continued) Recommendations
To achieve reliable savings estimates, EnergyPro should accept site-specific schedules, obtained by interviewing the residents.
If contractors continue to perform modeling, EnergyPro is preferred over eQUEST due to its simplicity, though alternatives to EnergyPro should be considered.
If modeling professionals are assigned to the energy modeling task, eQUEST would be a better choice due to its greater flexibility and transparency.
Relevant To PG&E and SCE program staff
57May 1, 2012

Other Findings to Consider in Program Design
The number of individuals with active BPI certifications grew dramatically between January 1, 2010 and November 1, 2011. Total active certified individuals grew from 65 to 1,596. The number of certifications (individuals may have more than one type of BPI certification) grew from 88 to 2,349.
Contractors are interested in IOUs helping them to float rebates; however there is uncertainty over whether the utilities will pay them back in a reasonable amount of time.
58May 1, 2012

Other Findings to Consider in Program Design (continued) Participant Awareness, Knowledge, Attitude – Behavior
(AKA-B): Participants are strongly aware of the savings and comfort benefits of the whole house or comprehensive approach but were quite unsure about whether their own homes were efficient.
Contactors AKA-B: Participating contractors are more likely to be convinced about the comfort than the cost benefits of the comprehensive approach, though they are strongly convinced of both. Participating contractors feel a similar level of responsibility to save energy at home as they do in their profession.
The program is successful in raising awareness of the Whole House approach and in educating a portion of the contractor workforce about the value of the Whole House approach. The contractors are in turn educating their clients and potential customers generally through the assessment process itself.
59May 1, 2012

Other Findings to Consider in Program Design (continued)
Nearly all participating contractors intend to promote energy efficiency to their customers.
Uncertainty regarding program longevity serves as a barrier to attract some non-participating contractors to the program. Uncertainly regarding how the program will continue after ARRA funding also inhibits the level of collaboration between the IOUs and local entities.
60May 1, 2012
Other Findings to Consider in Program Design (continued)
San Bernardino testing alternate design: One contractor doing all home audits and no retrofit work. The contractors provide one discounted price to the customer (adding
expected IOU and County Rebate) San Bernardino reimburses the contractor one time San Bernardino recoups money from SCE/SCG after everything is
processed and approved Another suggestion from SCE program staff:
Spread out measure installation over several years after assessment Each 5% increase in overall performance = $500 incentive Allows intervention over time
61May 1, 2012

Summary
Program is complex and new and the environment within which it operates is rapidly changing
There are significant opportunities to improve Marketing Implementation Program Design
Process evaluation has collected considerable data about the market, participants, contractors that can be to improve the program
62May 1, 2012
Top Related