


Languages
Pages
Legal

1
Interactions between Zinc Transporter-8 Gene (SLC30A8) and
Plasma Zinc Concentrations for Impaired Glucose Regulation and
Type 2 Diabetes
Running title: Zinc-SLC30A8 Interaction for T2D
Zhilei Shan a,b
, Wei Bao a,b
, Yan Zhang a,b
, Ying Rong a,b
, Xia Wang a,b
, Yilin Jin a,b
,
Yadong Song a,b
, Ping Yao a,b
, Changhao Sunc, Frank B. Hu
d, *, Liegang Liu
a,b,*
a Department of Nutrition and Food Hygiene, Hubei Key Laboratory of Food
Nutrition and Safety, School of Public Health, Tongji Medical College, Huazhong
University of Science & Technology, 13 Hangkong Road, Wuhan, 430030, P.R.
China.
b MOE Key Lab of Environment and Health, School of Public Health, Tongji Medical
College, Huazhong University of Science & Technology, 13 Hangkong Road, Wuhan,
430030, P.R. China.
c Department of Nutrition and Food Hygiene, Public Health College, Harbin Medical
University, Harbin, P.R .China.
d Departments of Nutrition and Epidemiology, Harvard School of Public Health,
Boston, USA.
*Correspondence to: Dr. Liegang Liu, Department of Nutrition and Food Hygiene,
Hubei Key Laboratory of Food Nutrition and Safety, and Ministry of Education Key
Lab of Environment and Health, School of Public Health, Tongji Medical College,
Huazhong University of Science and Technology, 13 Hangkong Road, Wuhan 430030,
China. Tel: +86 27 83650522; Fax: +86 27 83650522; Email:
[email protected]; Dr. Frank B. Hu, Departments of Nutrition and
Epidemiology, Harvard School of Public Health, 655 Huntington Avenue, 02115
Boston, US. Tel: 617-432-0113, Fax: 617-432-3435. Email:
The first two authors contributed equally to this study.
Page 1 of 30 Diabetes
Diabetes Publish Ahead of Print, published online December 4, 2013
2
ABSTRACT
Though both SLC30A8 rs13266634 SNP and plasma zinc concentrations have been
associated with impaired glucose regulation (IGR) and type 2 diabetes (T2D), their
interactions for IGR and T2D remain unclear. Therefore, to assess zinc-SLC30A8
interactions, we performed a case-control study in 1,796 participants: 218 newly
diagnosed IGR patients, 785 newly diagnosed T2D patients, and 793 individuals with
normal glucose tolerance (NGT). After adjustment for age, sex, BMI, family history
of diabetes and hypertension, the multivariable OR of T2D associated with a 10-µg/dl
higher plasma zinc level was 0.87 (0.85-0.90). Meanwhile, the OR of SLC30A8
rs13266634 homozygous genotypes CC compared with TT was 1.53 (1.11-2.09) for
T2D. Similar associations were found in IGR and IGR&T2D groups. Each 10-µg/dl
increment of plasma zinc was associated with 22% (OR, 0.78; 95% CI, 0.72-0.85)
lower odds of T2D in TT genotype carriers, 17% (0.83; 0.80-0.87) lower odds in CT
genotype carriers, and 7% (0.93; 0.90-0.97) lower odds in CC genotype carriers (P for
interaction = 0.01). Our study suggested that the C allele of rs13266634 was
associated with higher odds of T2D, and higher plasma zinc was associated with
lower odds. The inverse association of plasma zinc concentrations with T2D was
modified by SLC30A8 rs13266634. Further studies are warranted to confirm our
findings and clarify the mechanisms underlying the interaction between plasma zinc
and the SLC30A8 gene in relation to T2D.
Page 2 of 30Diabetes

3
According to the International Diabetes Federation (IDF), the number of diabetic
patients worldwide rose to 371 million in 2012 and is still increasing in almost all
countries (1). Considering the pathogenesis of T2D, it can be described as a complex
disorder because of the interplay of multiple genetic and environmental factors (2).
Nutrient status, as a modifiable factor, could influence glucose homeostasis and
thus represent an important target for T2D prevention and management (3). Zinc is an
essential trace element found in most foods that facilitates catalytic, structural, and
transcriptional actions within cells (4). At the same time, zinc is a critical component
of the catalytic site of over 300 enzymes, implicated in synthesis, storage, and
secretion of insulin, as well as being a signaling molecule after insulin secretion (5).
Some studies have investigated possible associations between zinc status and diabetes;
most reported that patients with diabetes had lower serum/plasma zinc levels (6-14).
SLC30A8 (the zinc transporter-8 gene) has been suggested as an interesting
candidate for studying the interaction with total zinc intake and fasting glucose levels
in individuals without T2D (15). SLC30A8 is almost exclusively expressed in
pancreatic beta cells and encodes a protein that transports zinc from the cytoplasm
into insulin secretory vesicles, an important step in insulin synthesis and secretion
(16). Genome-wide association studies (17-21) and a recent meta-analysis of 36
studies have demonstrated that allele C of the SLC30A8 rs13266634 polymorphism is
associated with increased risk of impaired glucose regulation (IGR) and T2D (22).
However, to our knowledge, no study has examined the interaction between
Page 3 of 30 Diabetes
4
SLC30A8 rs13266634 and plasma zinc concentrations in association with T2D.
Therefore, the objective of our study was to examine the associations between
rs13266634 and plasma zinc concentrations as well as their joint associations and
interactions with newly diagnosed IGR and T2D in a hospital-based case-control
study conducted among a Chinese Han population.
RESEARCH DESIGN AND METHODS
Study population
The study population consisted of 1,796 patients: 218 newly diagnosed IGR patients,
785 newly diagnosed T2D patients, and 793 individuals with normal glucose
tolerance (NGT). Those with newly diagnosed IGR and T2D were consecutively
recruited from first-time patients attending the outpatient clinics of Department of
Endocrinology, Tongji Medical College Hospital, Wuhan, China from December 2004
to November 2007. Concomitantly, we consecutively recruited healthy NGT
individuals who were frequency-matched by age (±5 years) and sex to patients from
an unselected population undergoing a routine health check-up in the same hospital.
The inclusion criteria for patients with newly diagnosed IGR and T2D were: age ≥ 30
years, body mass index (BMI) < 40 kg/m2, no history of a diagnosis of diabetes, and
no history of receiving pharmacological treatment for hyperlipidaemia and
hypertension. Patients with clinically significant neurological, endocrinological, or
other systemic diseases, as well as acute illness and chronic inflammatory or
infectious diseases, were excluded from the study. The inclusion criteria for controls
Page 4 of 30Diabetes
5
were the same as those for patients, except that the age criterion was ≥ 25 years. The
definitions of IFG, IGT, T2D, and NGT met the respective diagnostic criteria
recommended by the World Health Organization in 1999 (23). IGR was defined as
impaired fasting glucose (IFG) [fasting plasma glucose (FPG) ≥ 6.1 mmol/l and < 7.0
mmol/l and 2-h post-glucose load < 7.8 mmol/l] and/or impaired glucose tolerance
(IGT) [FPG < 7.0 mmol/l and 2-h post-glucose load ≥ 7.8 mmol/l and < 11.1 mmol/l].
T2D was diagnosed when FPG ≥ 7.0 mmol/l and/or 2-h post-glucose load ≥ 11.1
mmol/l. A FPG concentration < 6.1 mmol/l, and a 2-h oral glucose tolerance test
(OGTT) plasma glucose concentration < 7.8 mmol/l was considered normal glucose
tolerance (NGT). All the participants enrolled were of Chinese Han ethnicity. They
gave written informed consent to the study and had taken no medication known to
affect glucose tolerance or insulin secretion before participation. The study was
approved by the ethics committee of the Tongji Medical College.
Body composition and blood parameters
Personal information on demography was collected through questionnaires,
including gender, age, history of disease (hypertension and hyperlipemia), and family
history of diabetes. Anthropometric measurements included height (m) and weight (kg)
using standardized techniques. BMI was calculated as weight divided by the square of
height (kg/m2). After a 10-h overnight fast, all participants underwent a 75-g OGTT,
and venous blood samples were collected at 0 and 2 h for determination of FPG,
OGTT2h, fasting plasma insulin (FPI), total cholesterol (TC), triglyceride (TG),
Page 5 of 30 Diabetes

6
homoeostasis model assessment of insulin resistance (HOMA-IR), homoeostasis
model assessment of beta cell function (HOMA-beta), high-density lipoprotein
cholesterol (HDL-C), and low-density lipoprotein cholesterol (LDL-C), as described
in our previous study (24).
Measurement of plasma zinc concentrations
Plasma zinc concentrations were measured in the MOE Key Lab of Environment
and Health and School of Public Health at Tongji Medical College of Huazhong
University of Science and Technology, using inductively coupled plasma mass
spectrometry (ICP-MS) (Agilent 7700 Series, Japan). For quality assurance the CRM
(certified reference material) ClinChek No. 8883 and No. 8884 human plasma
controls were used. For No. 8883 we determined a concentration of: 917 ± 67 µg/L
(certified: 925 ± 185 µg/L) and for No. 8884 we measured: 1314 ± 114 µg/L (certified:
1363 ± 273 µg/L). The limit of detection was 0.0012 µg/L, and all study participants
had plasma zinc levels above the limit of detection. The concentration of our lowest
standard solution (0.02 µg/L) was set as the LOQ (limit of quantitation) for
measurement.
Genotyping
The SLC30A8 polymorphism rs13266634 was genotyped using an allelic
discrimination assay-by-design TaqMan method on an ABI 7900HT PCR system
(Applied Biosystems, Foster City, CA, USA). The primers and labeled
Page 6 of 30Diabetes
7
oligonucleotide probes were designed and supplied by Applied Biosystems. The
TaqMan genotyping reaction was amplified (50°C for 2 min, 95°C for 10 min,
followed by 40 cycles of 92°C for 15 s and 60°C for 1 min), and the endpoint
fluorescent readings were performed by ABI 7900HT data collection and analysis
software version 2.2.1 (SDS 2.2.1). The genotype success rate was 98.12% for
rs13266634. All the SNPs were in accord with Hardy-Weinberg equilibrium (P >0.05
for all).
Statistical analysis
Descriptive statistics were calculated for all demographic and clinical
characteristics of the study subjects. Comparisons of NGT, IGR, and T2D were
performed by Chi-square (categorical variables), t test (continuous variables, normal
distribution), or Mann-Whitney U test (continuous variables, skewed distribution).
For calculation of the odds ratios (ORs) for IGR and T2D, plasma zinc concentrations
were considered continuous variables and categorized in tertiles according to the NGT
group: category 1, < 129.45 µg/dl; category 2, 129.45-197.58 µg/dl and category 3, ≥
197.58 µg/dl. The distributions of genotype were analyzed for deviation from
Hardy-Weinberg equilibrium using a likelihood ratio test. Binary logistic regression
analysis was used to assess the associations of New-IGR and T2D with plasma zinc
concentrations and rs13266634 polymorphisms. ORs and 95% confidence intervals
(CIs) were adjusted for known risk factors for T2D including age, sex, BMI,
hypertension, and family history of diabetes. In addition, we examined the association
Page 7 of 30 Diabetes

8
between plasma zinc concentration (tertiles) and IGR or T2D stratified by rs13266634
polymorphisms (TT, CT, or CC genotypes). We also estimated the joint association of
plasma zinc concentrations (tertiles) and rs13266634 polymorphisms (TT, CT, or CC
genotypes) with IGR or T2D.
To test the interaction between plasma zinc concentrations and rs13266634
polymorphisms in association with T2D, we introduced a multiplicative interaction
term of genotypes (per rs13266634 C allele) and plasma zinc tertile as continuous
variables and added these variables to the same aforementioned multivariate model.
Likelihood ratio test with one degree of freedom was used to assess the significance
of the interaction between plasma zinc concentration and the genotypes, with a
comparison of the likelihood scores of the two models with and without the
interaction term.
Statistical power for the rs13266634-zinc interaction with T2D was calculated
using QUANTO 1.2.4 (http://hydra.usc.edu/gxe). Assuming an OR of 0.31 per plasma
zinc tertile and an OR of 1.27 per rs13266634 C allele (allele frequency 55%), our
study had 80% power to detect an interaction OR of at least 1.35 for T2D.
All data analyses were carried out with SPSS13.0 software packages. P values
presented are two-tailed with significance level of 0.05.
RESULTS
Anthropometric and metabolic characteristics
Anthropometric and metabolic characteristics of the 1,796 participants with NGT,
Page 8 of 30Diabetes
9
T2D, and IGR are reported in Table 1 and Supplementary Table 1. Compared to
controls, the individuals with IGR and T2D were older and had higher BMI, greater
prevalence of family history of diabetes and hypertension, higher levels of TC, TG,
FPG, FPI, and OGTT2h, and lower plasma zinc concentrations. In the insulin
sensitivity indexes, we noted lower HOMA-beta and higher HOMA-IR in T2D, but
the HOMA-IR in IGR was higher only compared with controls.
Associations of plasma zinc concentrations with IGR and T2D
Table 2 presents ORs for IGR and T2D associated with the levels of plasma zinc
concentrations as continuous variables and categorized into tertiles according to their
distribution in the controls. Lower odds for New-IGR and T2D versus controls were
associated with higher plasma zinc concentrations, with a likely dose-response trend.
After adjustment for age, sex, BMI, family history of diabetes, and hypertension, the
multivariable OR for T2D across 10 µg/dl higher plasma zinc was 0.87 (95% CI:
0.85-0.90). Meanwhile, when comparing the highest with the lowest tertile of plasma
zinc, higher plasma zinc concentrations were associated with decreased odds of T2D
(adjusted OR = 0.06; 95% CI: 0.04-0.11). Similar results were obtained in IGR and
IGR&T2D groups.
Associations of rs13266634 polymorphism with IGR and T2D
Minor allele frequencies (T allele) in NGT, IGR, and T2D groups were 47.80,
42.20, and 41.97, respectively (Supplementary Table 2). Compared to the T allele,
Page 9 of 30 Diabetes

10
after adjustment for age, sex, BMI, family history of diabetes and hypertension, the C
allele was associated with increased odds of T2D (OR = 1.27; 95% CI: 1.08-1.51).
The adjusted OR of T2D was 1.53 (95% CI: 1.11-2.09) for homozygous CC
genotypes compared with TT. Similar associations were found in IGR and IGR&T2D
groups.
Interaction between plasma zinc concentrations and rs13266634 polymorphism
on IGR and T2D
Plasma zinc levels were shown for NGT and T2D according to tertiles of plasma
zinc and rs13266634 genotypes (Supplementary figure 1); the inverse association
between plasma zinc and T2D was modified by rs13266634 genotypes (Table 4). The
association between plasma zinc and T2D was weaker in CC genotype carriers and
CT genotype carriers than in TT genotype carriers. The adjusted ORs and 95% CIs of
T2D per each 10 µg/dl increment of plasma zinc were 0.93 (0.90-0.97), 0.83
(0.80-0.87), and 0.78 (0.72-0.85), respectively (P for interaction = 0.01). A similar
interaction was found for IGR&T2D, but not for IGR alone. When the joint effects
were examined, individuals with TT genotype and the highest tertile of plasma zinc
concentration had a much lower risk of IGR&T2D (OR = 0.008; 95% CI: 0.001-0.061)
than those with CC genotype in the lowest zinc tertile (reference) (Figure 1).
DISCUSSION
. To our knowledge, this was the first study to examine the interaction between
Page 10 of 30Diabetes
11
plasma zinc concentrations and SLC30A8 genetic variation for IGR and T2D. We
found that elevated plasma zinc concentrations were associated with lower odds of
newly diagnosed IGR and T2D, with a dose-response trend. As for the SLC30A8
rs13266634, we confirmed the association of the risk allele C with newly diagnosed
IGR and T2D in the Chinese Han population. As expected, a strong interaction was
observed for the SLC30A8 rs13266634 variant and plasma zinc concentrations in
relation to T2D and IGR&T2D. The inverse association between increasing plasma
zinc concentrations and T2D could significantly attenuate in the CT and CC genotype
groups compared with in the TT genotype group. We also observed that the
association between the CC genotype and T2D was mitigated by increasing plasma
zinc concentrations.
Several mechanisms may explain the important role of plasma zinc in the
etiology of T2D. The pancreatic β cell is one of the cell types that contain the most
zinc, because insulin is synthesized and stored in the pancreatic β cell in a solid form,
as a zinc-insulin (2:6) crystal (25). Meanwhile, as an enzymatic cofactor, zinc is also
implicated in all processes of synthesis, storage, and secretion of insulin, as well as
being a signaling molecule after insulin secretion (5, 26). Some of the
insulinomimetic effects of zinc, such as attenuating hyperglycemia and increasing
lipogenesis, can be explained by its influence on insulin signaling at several levels,
inducing phosphorylation of the β subunit of the insulin receptor as well as of Akt (27,
28). Moreover, another line of evidence indicates that zinc may protect insulin and β
cells from death by suppression of proinflammatory cytokines, such as interleukin-1β
Page 11 of 30 Diabetes
12
(29) and nuclear factor kappa B (30), as well as playing a structural role in antioxidant
enzymes (31).
Considering that plasma zinc concentration is a reliable biomarker that can be
used to reflect zinc status or zinc intake (32), our findings are in line with results from
a large 24-year prospective study among women, demonstrating a significant inverse
association between total zinc intake and risk of T2D (33). A recent systematic review
of the relationship between zinc intake and serum/plasma zinc showed that population
differences affected the distribution of plasma zinc concentrations (34). In that review,
the means of plasma zinc in different populations range from 8.5 to 17.48 µmol/l
(55.2 to 113.6 µg/dl), but unfortunately no study was carried out in China.
Nonetheless, the zinc concentration in our study was largely comparable to that in the
literature. Modest to substantial differences in plasma zinc concentration have been
reported in previous studies of patients with T2D compared with control groups
(ranging from 4.2% to more than 50% of the levels in the control group) (6, 9, 14).
We observed a relatively large between-group difference (35% of the levels in the
control group), which could be the result of imbalanced zinc homeostasis in patients
with T2D compared with controls. However, a previous cohort study found reduced
zinc intake was in women who subsequently developed T2D than those who did not
(33). It has been shown that intestinal secretion of zinc can be enhanced by
inflammation (35), and inflammation has been implicated in the pathogenesis of T2D
(36). In addition, our controls are younger than those with diabetes, and the levels of
plasma zinc could decrease with aging because of changes in maximal absorption and
Page 12 of 30Diabetes

13
entire saturation response of zinc (35, 37), although age was adjusted in our analyses.
As ZnT8 is primarily expressed in β cells and is especially required for the
normal accumulation of zinc in β-cell granules, many studies have elucidated the role
of ZnT8 and its encoding gene, SLC30A8 (16, 38). It has been shown both in vitro
and in animal studies that alterations in ZnT8 expression strongly modulate insulin
secretion (38-40). Meanwhile, other observations suggest that the variant rs13266634
in SLC30A8 impairs islet ZnT8 expression, insulin secretion, or glucose homeostasis
(41-43). However, a meta-analysis of 32 epidemiologic studies suggests that the same
variant does not affect insulin secretion from human islets as well as islet expression
of SLC30A8 (44). In the current study, the rs13266634 CC genotype was associated
with a 72.8% higher risk of IGR and a 52.5% higher risk of T2D than was the TT
genotype. However, compared with genotype TT, genotype CT was not associated
with an increased risk of IGR or T2D. Furthermore, it was surprising that this
association was stronger in IGR than in T2D, but the sample size of participants with
IGR was limited.
As has been previously reported in a 14-cohort meta-analysis, total zinc intake
has a stronger protective association with fasting glucose levels in individuals
carrying the glucose-raising A allele of rs11558471 in SLC30A8 than those carrying
C allele (15), but no study has reported on the interaction of zinc and SLC30A8
rs13266634 variants with IGR or T2D. When comprehensively analyzing the effects
of plasma zinc and the SLC30A8 rs13266634 variant on IGR and T2D, we found that
the inverse association of plasma zinc with T2D was attenuated by the rs13266634 C
Page 13 of 30 Diabetes
14
allele, but the inverse association was not abolished even in the CC genotype group.
Moreover, the combination of TT genotype and the highest tertile of plasma zinc
concentration was associated with a much lower odds of IGR&T2D than the
combined CC genotype and the lowest tertile, which confirmed that both the
rs13266634 C allele and decreased plasma zinc could be associated with IGR&T2D.
However, as the plasma zinc concentration increased, the association between CC
genotype and T2D was substantially attenuated. This result is broadly consistent with
the findings of Kanoni et al. (15), that higher total zinc intake blunted the
glucose-raising effect of SLC30A8 variant. One potential explanation for this
interaction is that higher plasma zinc might abolish the impairments of islet ZnT8
expression, insulin secretion, and glucose homeostasis induced by the rs13266634 C
allele (31), so that there was still an inverse association between higher plasma zinc
and T2D even in the CC genotype group. Additional studies on these topics are
needed to provide evidence that variation in SLC30A8 influences the regulation of
zinc transporter activity or the modulation of islet zinc content, which would support
the biological plausibility of the statistical interaction we report here.
Our participants with T2D were confined to the newly diagnosed and drug naive
to exclude the effects of drug interventions, because some drugs may change the
status of metabolism including zinc. Moreover, we used plasma zinc concentration as
a biomarker to measure zinc status to avoid possible bias through dietary assessment,
such as systematic measurement error in diet exposure and the influence of other
nutrients on the bioavailability of zinc (35).
Page 14 of 30Diabetes

15
Although our study showed a strong association between the SLC30A8
rs13266634 variant and plasma zinc concentration on IGR and T2D, it has several
limitations. First, the cross-sectional nature of our study does not allow us to infer any
causality between plasma zinc and IGR or T2D, and plasma zinc level may be
reduced by the development of IGR and T2D. Therefore, these findings should be
confirmed in further prospective cohort studies. Furthermore, although plasma zinc
concentration has been suggested to be a reliable biomarker to reflect zinc status or
zinc intake in individuals with either a low or a high supply of dietary zinc (32),
plasma zinc concentration can change in response to factors unrelated to zinc status or
dietary zinc intake, including tissue catabolism, infection, or inflammation. In
addition, all our participants were of Chinese Han ethnicity, which minimizes the
confounding effects by ethnic background. Whether these results can be generalized
to other populations requires further study.
CONCLUSIONS
The C allele of SLC30A8 rs13266634 was associated with increased ORs for
newly detected IGR and T2D, while elevated plasma zinc concentration showed an
inverse association. The association between plasma zinc levels and T2D was stronger
among individuals carrying the TT genotype of SLC30A8 rs13266634 than those
carrying the CT or CC genotypes. The current findings may contribute to our
understanding of the etiologic role of zinc in T2D development and imply that zinc
intervention for the prevention of T2D may need to be personalized according to
Page 15 of 30 Diabetes

16
SLC30A8 genotypes. Further studies are warranted to confirm our findings and
clarify the mechanisms underlying the interactions between zinc and the SLC30A8
gene for T2D.
AUTHOR CONTRIBUTIONS
Z.S., W.B., Y.Z., Y.R., X.W., Y.J., Y.S., P.Y., C.S., F.H. and L.L. designed and
conducted research; Z.S. and W.B. analyzed data; Z.S., W.B., and L.L. wrote the
paper; and L.L. had primary responsibility for final content. Z.S. and W.B. contributed
equally to the manuscript. All authors read and approved the final manuscript. L.L. is
the guarantor of this work and has full access to all the data in the study and takes
responsibility for the integrity of the data and the accuracy of the data analysis.
ACKNOWLEDGMENTS
No potential conflicts of interest relevant to this article were reported.
This work was funded by the National Science and Technology Support Program
(2012BAI02B02) of China and the National Natural Science Foundation of China
(NSFC 81072291). The funders had no role in study design, data collection and
analysis, decision to publish, or preparation of the manuscript.
Page 16 of 30Diabetes
17
References
1. International Diabetes Federation. IDF Diabetes Atlas.
http://www.idf.org/diabetesatlas/5e/Update2012. Accessed August 6, 2013.
2. Qi L, Hu FB, Hu G. Genes, environment, and interactions in prevention of type 2 diabetes: a
focus on physical activity and lifestyle changes. Curr Mol Med. 2008;8(6):519-32.
3. Bantle JP, Wylie-Rosett J, Albright AL, Apovian CM, Clark NG, Franz MJ, et al. Nutrition
recommendations and interventions for diabetes: a position statement of the American
Diabetes Association. Diabetes Care. 2008;31 Suppl 1:S61-78.
4. Prasad AS. Zinc: an overview. Nutrition. 1995;11(1 Suppl):93-9.
5. Ishihara H, Maechler P, Gjinovci A, Herrera PL, Wollheim CB. Islet beta-cell secretion
determines glucagon release from neighbouring alpha-cells. Nat Cell Biol. 2003;5(4):330-5.
6. Ferdousi S, Mia AR. Serum levels of copper and zinc in newly diagnosed type-2 diabetic
subjects. Mymensingh Med J. 2012;21(3):475-8.
7. Basaki M, Saeb M, Nazifi S, Shamsaei HA. Zinc, copper, iron, and chromium concentrations in
young patients with type 2 diabetes mellitus. Biol Trace Elem Res. 2012;148(2):161-4.
8. Aguilar MV, Saavedra P, Arrieta FJ, Mateos CJ, Gonzalez MJ, Meseguer I, et al. Plasma mineral
content in type-2 diabetic patients and their association with the metabolic syndrome. Ann
Nutr Metab. 2007;51(5):402-6.
9. Al-Maroof RA, Al-Sharbatti SS. Serum zinc levels in diabetic patients and effect of zinc
supplementation on glycemic control of type 2 diabetics. Saudi Med J. 2006;27(3):344-50.
10. Williams NR, Rajput-Williams J, West JA, Nigdikar SV, Foote JW, Howard AN. Plasma,
granulocyte and mononuclear cell copper and zinc in patients with diabetes mellitus. Analyst.
1995;120(3):887-90.
11. Kinlaw WB, Levine AS, Morley JE, Silvis SE, McClain CJ. Abnormal zinc metabolism in type II
diabetes mellitus. Am J Med. 1983;75(2):273-7.
12. Islam MR, Arslan I, Attia J, McEvoy M, McElduff P, Basher A, et al. Is serum zinc level
associated with prediabetes and diabetes?: a cross-sectional study from Bangladesh. PLoS
One. 2013;8(4):e61776.
13. Zargar AH, Shah NA, Masoodi SR, Laway BA, Dar FA, Khan AR, et al. Copper, zinc, and
magnesium levels in non-insulin dependent diabetes mellitus. Postgrad Med J.
1998;74(877):665-8.
14. Masood N, Baloch GH, Ghori RA, Memon IA, Memon MA, Memon MS. Serum zinc and
magnesium in type-2 diabetic patients. J Coll Physicians Surg Pak. 2009;19(8):483-6.
15. Kanoni S, Nettleton JA, Hivert MF, Ye Z, van Rooij FJ, Shungin D, et al. Total zinc intake may
modify the glucose-raising effect of a zinc transporter (SLC30A8) variant: a 14-cohort
meta-analysis. Diabetes. 2011;60(9):2407-16.
16. Chimienti F, Devergnas S, Favier A, Seve M. Identification and cloning of a beta-cell-specific
zinc transporter, ZnT-8, localized into insulin secretory granules. Diabetes. 2004;53(9):2330-7.
17. Sladek R, Rocheleau G, Rung J, Dina C, Shen L, Serre D, et al. A genome-wide association
study identifies novel risk loci for type 2 diabetes. Nature. 2007;445(7130):881-5.
18. Scott LJ, Mohlke KL, Bonnycastle LL, Willer CJ, Li Y, Duren WL, et al. A genome-wide
association study of type 2 diabetes in Finns detects multiple susceptibility variants. Science.
2007;316(5829):1341-5.
Page 17 of 30 Diabetes

18
19. Zeggini E, Weedon MN, Lindgren CM, Frayling TM, Elliott KS, Lango H, et al. Replication of
genome-wide association signals in UK samples reveals risk loci for type 2 diabetes. Science.
2007;316(5829):1336-41.
20. Saxena R, Voight BF, Lyssenko V, Burtt NP, de Bakker PI, Chen H, et al. Genome-wide
association analysis identifies loci for type 2 diabetes and triglyceride levels. Science.
2007;316(5829):1331-6.
21. Wu Y, Li H, Loos RJ, Yu Z, Ye X, Chen L, et al. Common variants in CDKAL1, CDKN2A/B, IGF2BP2,
SLC30A8, and HHEX/IDE genes are associated with type 2 diabetes and impaired fasting
glucose in a Chinese Han population. Diabetes. 2008;57(10):2834-42.
22. Xu K, Zha M, Wu X, Yu Z, Yu R, Xu X, et al. Association between rs13266634 C/T
polymorphisms of solute carrier family 30 member 8 (SLC30A8) and type 2 diabetes, impaired
glucose tolerance, type 1 diabetes--a meta-analysis. Diabetes Res Clin Pract.
2011;91(2):195-202.
23. Alberti KG, Zimmet PZ. Definition, diagnosis and classification of diabetes mellitus and its
complications. Part 1: diagnosis and classification of diabetes mellitus provisional report of a
WHO consultation. Diabet Med. 1998;15(7):539-53.
24. Song F, Jia W, Yao Y, Hu Y, Lei L, Lin J, et al. Oxidative stress, antioxidant status and DNA
damage in patients with impaired glucose regulation and newly diagnosed Type 2 diabetes.
Clin Sci (Lond). 2007;112(12):599-606.
25. Dodson G, Steiner D. The role of assembly in insulin's biosynthesis. Curr Opin Struct Biol.
1998;8(2):189-94.
26. Taylor CG. Zinc, the pancreas, and diabetes: insights from rodent studies and future
directions. Biometals. 2005;18(4):305-12.
27. Ng Y, Ramm G, Lopez JA, James DE. Rapid activation of Akt2 is sufficient to stimulate GLUT4
translocation in 3T3-L1 adipocytes. Cell Metab. 2008;7(4):348-56.
28. Tang X, Shay NF. Zinc has an insulin-like effect on glucose transport mediated by
phosphoinositol-3-kinase and Akt in 3T3-L1 fibroblasts and adipocytes. J Nutr.
2001;131(5):1414-20.
29. von Bulow V, Rink L, Haase H. Zinc-mediated inhibition of cyclic nucleotide
phosphodiesterase activity and expression suppresses TNF-alpha and IL-1 beta production in
monocytes by elevation of guanosine 3',5'-cyclic monophosphate. J Immunol.
2005;175(7):4697-705.
30. Prasad AS, Bao B, Beck FW, Kucuk O, Sarkar FH. Antioxidant effect of zinc in humans. Free
Radic Biol Med. 2004;37(8):1182-90.
31. Jansen J, Karges W, Rink L. Zinc and diabetes--clinical links and molecular mechanisms. J Nutr
Biochem. 2009;20(6):399-417.
32. Lowe NM, Fekete K, Decsi T. Methods of assessment of zinc status in humans: a systematic
review. Am J Clin Nutr. 2009;89(6):2040S-51S.
33. Sun Q, van Dam RM, Willett WC, Hu FB. Prospective study of zinc intake and risk of type 2
diabetes in women. Diabetes Care. 2009;32(4):629-34.
34. Lowe NM, Medina MW, Stammers AL, Patel S, Souverein OW, Dullemeijer C, et al. The
relationship between zinc intake and serum/plasma zinc concentration in adults: a systematic
review and dose-response meta-analysis by the EURRECA Network. Br J Nutr.
2012;108(11):1962-71.
Page 18 of 30Diabetes

19
35. Hambidge KM, Miller LV, Westcott JE, Sheng X, Krebs NF. Zinc bioavailability and homeostasis.
Am J Clin Nutr. 2010;91(5):1478S-83S.
36. Wang X, Bao W, Liu J, Ouyang YY, Wang D, Rong S, et al. Inflammatory markers and risk of
type 2 diabetes: a systematic review and meta-analysis. Diabetes Care. 2013;36(1):166-75.
37. Haase H, Mocchegiani E, Rink L. Correlation between zinc status and immune function in the
elderly. Biogerontology. 2006;7(5-6):421-8.
38. Nicolson TJ, Bellomo EA, Wijesekara N, Loder MK, Baldwin JM, Gyulkhandanyan AV, et al.
Insulin storage and glucose homeostasis in mice null for the granule zinc transporter ZnT8
and studies of the type 2 diabetes-associated variants. Diabetes. 2009;58(9):2070-83.
39. Chimienti F, Devergnas S, Pattou F, Schuit F, Garcia-Cuenca R, Vandewalle B, et al. In vivo
expression and functional characterization of the zinc transporter ZnT8 in glucose-induced
insulin secretion. J Cell Sci. 2006;119(Pt 20):4199-206.
40. Fu Y, Tian W, Pratt EB, Dirling LB, Shyng SL, Meshul CK, et al. Down-regulation of ZnT8
expression in INS-1 rat pancreatic beta cells reduces insulin content and glucose-inducible
insulin secretion. PLoS One. 2009;4(5):e5679.
41. Kirchhoff K, Machicao F, Haupt A, Schafer SA, Tschritter O, Staiger H, et al. Polymorphisms in
the TCF7L2, CDKAL1 and SLC30A8 genes are associated with impaired proinsulin conversion.
Diabetologia. 2008;51(4):597-601.
42. Palmer ND, Goodarzi MO, Langefeld CD, Ziegler J, Norris JM, Haffner SM, et al. Quantitative
trait analysis of type 2 diabetes susceptibility loci identified from whole genome association
studies in the Insulin Resistance Atherosclerosis Family Study. Diabetes. 2008;57(4):1093-100.
43. Staiger H, Machicao F, Stefan N, Tschritter O, Thamer C, Kantartzis K, et al. Polymorphisms
within novel risk loci for type 2 diabetes determine beta-cell function. PLoS One.
2007;2(9):e832.
44. Cauchi S, Del Guerra S, Choquet H, D'Aleo V, Groves CJ, Lupi R, et al. Meta-analysis and
functional effects of the SLC30A8 rs13266634 polymorphism on isolated human pancreatic
islets. Mol Genet Metab. 2010;100(1):77-82.
Page 19 of 30 Diabetes
20
Table 1 Anthropometric and metabolic characteristics of NGT and T2D groups.
Parameters NGT (n=793) T2D (n=785) P
Male, n (%) 490(61.79) 442(56.31) 0.027
Age (years) 42.48(11.59) 50.98(10.82) <0.001
BMI (kg/m2) 22.95(3.87) 24.97(3.97) <0.001
Family history of diabetes, n (%) 60(7.56) 111(14.12) <0.001
Hypertention, n (%) 144(18.14) 263(33.46) <0.001
FPG (mmol/L) 4.56(0.63) 9.82(3.07) <0.001
OGTT2h(mmol/L) 6.44(1.08) 16.49(5.03) <0.001
FPI (µU/mL) 7.07(4.04-9.93) 8.80(5.44-13.79) 0.001
HOMA-beta 88.00(50.63-126.94) 33.08(15.06-62.50) <0.001
HOMA-IR 1.81(0.88-2.76) 3.60(2.18-5.37) <0.001
TC (mmol/L) 4.34(0.91) 4.79(1.43) <0.001
Page 20 of 30Diabetes
21
TG (mmol/L) 1.34(1.16) 1.99(1.45) <0.001
HDL-C (mmol/L) 1.34(0.58) 1.43(0.86) 0.084
LDL-C (mmol/L) 2.69(0.86) 2.59(1.24) 0.199
Zinc (µg/dl) 161.10 (114.56-221.08) 104.96 (85.72-133.69) <0.001
Abbreviations: BMI, body mass index; FPG, fasting plasma glucose; FPI, fasting plasma insulin; HDL-C, high-density lipoprotein cholesterol;
HOMA-beta, homeostasis model assessment of beta cell function; HOMA-IR, homeostasis model assessment of insulin resistance; IGR,
impaired glucose regulation; LDL-C, low-density lipoprotein cholesterol; NGT, normal glucose tolerance; OGTT2h, 2-h post-glucose load;T2D,
type 2 diabetes mellitus; TC, total cholesterol; TG, triglycerides.
Data were presented as number (percentage) for categorical data, mean (standard deviation) for parametrically distributed data or median
(interquartile range) for nonparametrically distributed data.
Page 21 of 30 Diabetes
22
Table 2 Associations of plasma zinc concentrations with IGR and T2D.
Variables
Tertiles of plasma zinc concentration (µg/dl)
Per 10 µg/dl of
plasma zinc
P value for
trend
1 (Lowest) 2 3 (Highest)
< 129.45 129.45-197.58 ≥ 197.58
IGR vs. NGT
No. of cases/controls 141/265 65/264 12/264
Crude OR (95% CI) 1 0.46 (0.33-0.65) 0.09 (0.05-0.16) 0.86 (0.83-0.89) <0.001
Adjusted ORa (95% CI) 1 0.47 (0.32-0.71) 0.10 (0.05-0.21) 0.87 (0.83-0.91) <0.001
T2D vs. NGT
No. of cases/controls 559/265 191/264 35/264 / /
Crude OR (95% CI) 1 0.34 (0.27-0.44) 0.06 (0.04-0.09) 0.85 (0.83-0.87) <0.001
Adjusted ORa (95% CI) 1 0.36 (0.28-0.48) 0.09 (0.06-0.13) 0.87 (0.85-0.89) <0.001
(IGR or T2D) vs. NGT
Page 22 of 30Diabetes
23
No. of cases/controls 700/265 256/264 47/264 / /
Crude OR (95% CI) 1 0.37 (0.29-0.46) 0.07 (0.05-0.10) 0.86 (0.84-0.88) <0.001
Adjusted ORa (95% CI) 1 0.38 (0.29-0.50) 0.09 (0.06-0.13) 0.88 (0.85-0.90) <0.001
a Binary
logistic regression analysis was adjusted for age, sex, BMI, family history of diabetes and hypertension.
Page 23 of 30 Diabetes
24
Table 3 Odd ratios for the association between IGR/T2D and plasma zinc concentrations, according to rs13266234 genotypes.
Genotypes Tertiles of plasma zinc concentrations Per 10 µg/dl of
plasma zinc
P value for
trend
P value for
interaction# 1 (Lowest) 2 3 (Highest)
IGR vs. NGT
TT 1.00 0.50 (0.20-1.21) 0.06 (0.01-0.47) 0.88 (0.80-0.96) 0.006
0.645 CT 1.00 0.46 (0.24-0.90) 0.07 (0.02-0.26) 0.87 (0.81-0.93) < 0.001
CC 1.00 0.45 (0.23-0.88) 0.13 (0.04-0.47) 0.86 (0.80-0.92) < 0.001
T2D vs. NGT
TT 1.00 0.35 (0.20-0.61) Not estimated* 0.78 (0.72-0.85) < 0.001
0.010 CT 1.00 0.32 (0.21-0.50) 0.06 (0.03-0.13) 0.83 (0.80-0.87) < 0.001
CC 1.00 0.40 (0.25-0.64) 0.18 (0.09-0.35) 0.93 (0.90-0.97) < 0.001
(IGR or T2D) vs.
NGT
Page 24 of 30Diabetes
25
TT 1.00 0.36 (0.21-0.62) 0.01 (0.001-0.09) 0.81 (0.76-0.87) < 0.001
0.015 CT 1.00 0.35 (0.23-0.53) 0.06 (0.03-0.12) 0.84 (0.81-0.88) < 0.001
CC 1.00 0.41 (0.26-0.64) 0.17 (0.09-0.32) 0.93 (0.89-0.96) < 0.001
The ORs and 95% CIs were adjusted for age, sex, BMI, family history of diabetes and hypertension.
* The
ORs and 95% CIs were not estimated because there was no DM case in this category.
#The interaction was testing whether the association of IGR/T2M with plasma zinc level is modified by genotype.
Page 25 of 30 Diabetes

26
FIGURE LEGENDS
Figure 1 Joint association of plasma zinc concentrations and SLC30A8
rs13266634 genotypes in relation to IGR&T2D.
The analysis was adjusted for age, sex, BMI, family history of diabetes and
hypertension.
SUPPLEMENTARY MATERIALS
Supplementary Table 1 Anthropometric and metabolic characteristics of NGT
and IGR groups.
Supplementary Table 2 Associations of the SNP rs13266234 with IGR and T2D.
Supplementary figure 1 Plasma zinc levels for NGT and T2D according to
tertiles of plasma zinc and rs13266634 genotypes.
Plasma zinc levels were presented as median (interquartile range).
Page 26 of 30Diabetes

Joint association of plasma zinc concentrations and SLC30A8 rs13266634 genotypes in relation to IGR&T2D. 77x69mm (300 x 300 DPI)
Page 27 of 30 Diabetes
Supplementary Table 1 Anthropometric and metabolic characteristics of NGT
and IGR groups.
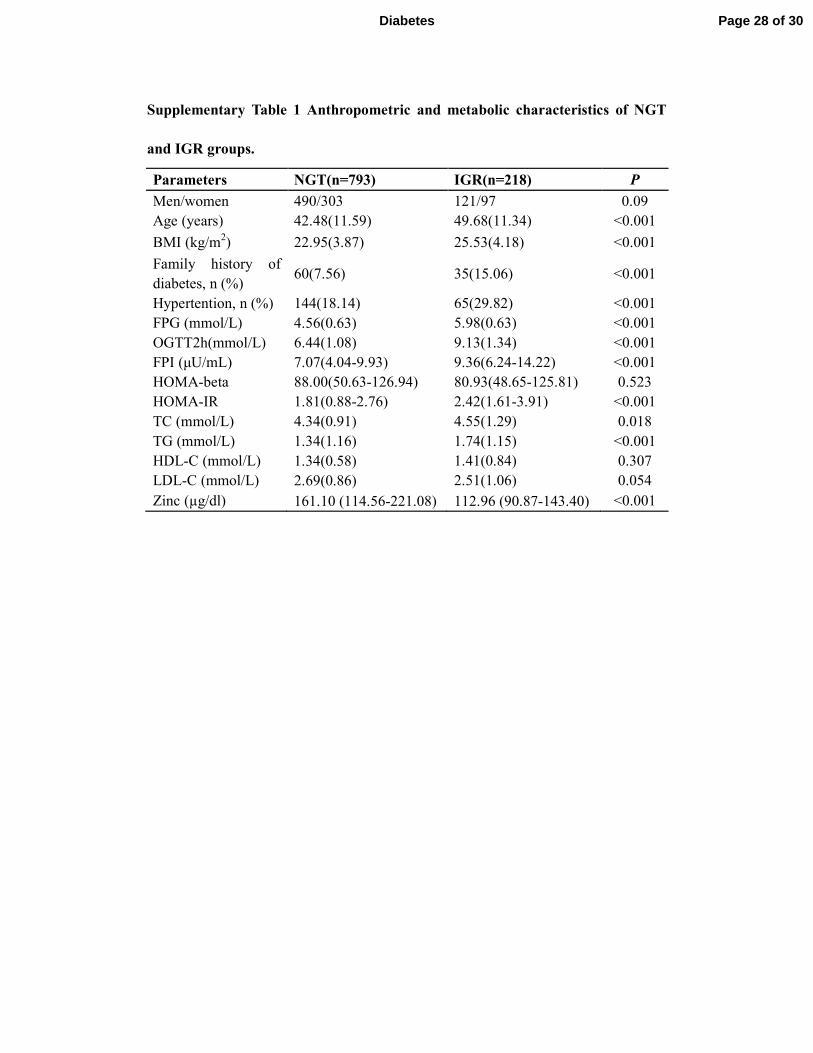
Parameters NGT(n=793) IGR(n=218) P
Men/women 490/303 121/97 0.09
Age (years) 42.48(11.59) 49.68(11.34) <0.001
BMI (kg/m2) 22.95(3.87) 25.53(4.18) <0.001
Family history of
diabetes, n (%) 60(7.56) 35(15.06) <0.001
Hypertention, n (%) 144(18.14) 65(29.82) <0.001
FPG (mmol/L) 4.56(0.63) 5.98(0.63) <0.001
OGTT2h(mmol/L) 6.44(1.08) 9.13(1.34) <0.001
FPI (µU/mL) 7.07(4.04-9.93) 9.36(6.24-14.22) <0.001
HOMA-beta 88.00(50.63-126.94) 80.93(48.65-125.81) 0.523
HOMA-IR 1.81(0.88-2.76) 2.42(1.61-3.91) <0.001
TC (mmol/L) 4.34(0.91) 4.55(1.29) 0.018
TG (mmol/L) 1.34(1.16) 1.74(1.15) <0.001
HDL-C (mmol/L) 1.34(0.58) 1.41(0.84) 0.307
LDL-C (mmol/L) 2.69(0.86) 2.51(1.06) 0.054
Zinc (µg/dl) 161.10 (114.56-221.08) 112.96 (90.87-143.40) <0.001
Page 28 of 30Diabetes
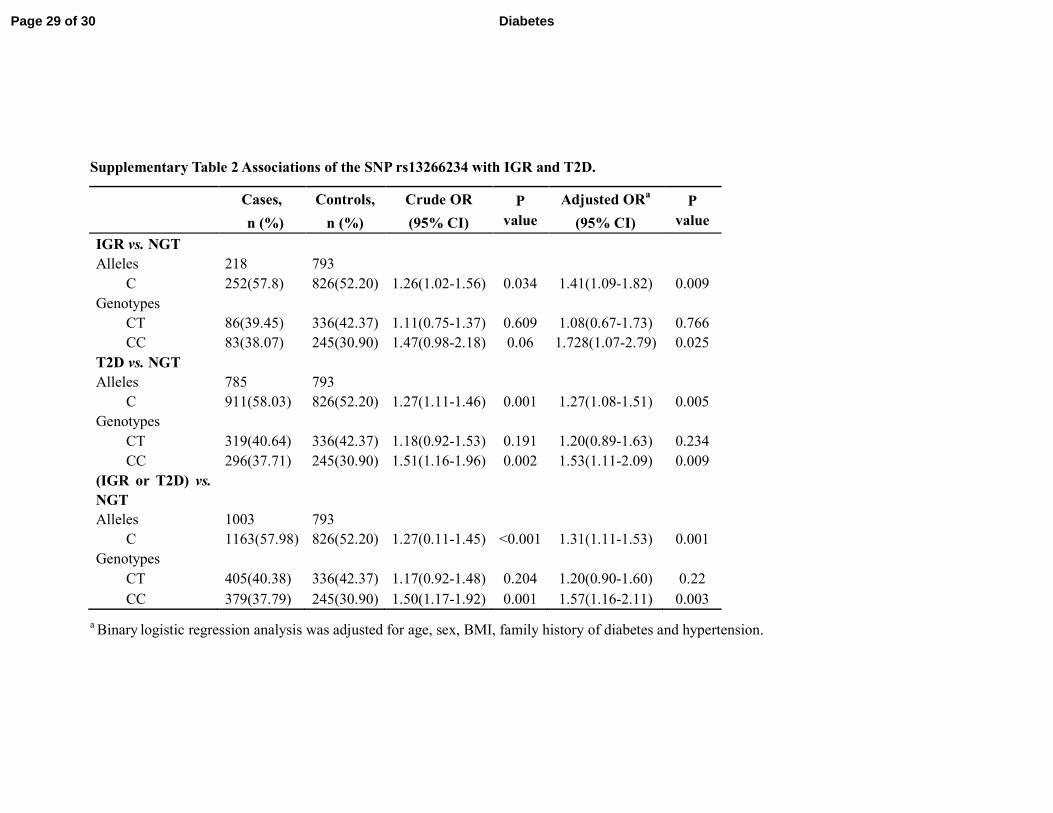
Supplementary Table 2 Associations of the SNP rs13266234 with IGR and T2D.
Cases, Controls, Crude OR P
value
Adjusted ORa P
value n (%) n (%) (95% CI) (95% CI)
IGR vs. NGT
Alleles 218 793
C 252(57.8) 826(52.20) 1.26(1.02-1.56) 0.034 1.41(1.09-1.82) 0.009
Genotypes
CT 86(39.45) 336(42.37) 1.11(0.75-1.37) 0.609 1.08(0.67-1.73) 0.766
CC 83(38.07) 245(30.90) 1.47(0.98-2.18) 0.06 1.728(1.07-2.79) 0.025
T2D vs. NGT
Alleles 785 793
C 911(58.03) 826(52.20) 1.27(1.11-1.46) 0.001 1.27(1.08-1.51) 0.005
Genotypes
CT 319(40.64) 336(42.37) 1.18(0.92-1.53) 0.191 1.20(0.89-1.63) 0.234
CC 296(37.71) 245(30.90) 1.51(1.16-1.96) 0.002 1.53(1.11-2.09) 0.009
(IGR or T2D) vs.
NGT
Alleles 1003 793
C 1163(57.98) 826(52.20) 1.27(0.11-1.45) <0.001 1.31(1.11-1.53) 0.001
Genotypes
CT 405(40.38) 336(42.37) 1.17(0.92-1.48) 0.204 1.20(0.90-1.60) 0.22
CC 379(37.79) 245(30.90) 1.50(1.17-1.92) 0.001 1.57(1.16-2.11) 0.003
a Binary
logistic regression analysis was adjusted for age, sex, BMI, family history of diabetes and hypertension.
Page 29 of 30 Diabetes

Plasma zinc levels for NGT and T2D according to tertiles of plasma zinc and rs13266634 genotypes. 76x55mm (300 x 300 DPI)
Page 30 of 30Diabetes
Top Related