


Languages
Pages
Legal


Integrated analysis of ENVISAT/RA-2 altimeter data and Landsat imagery
for estimating water volume variation of the lakes in Qiangtang Plateau
Jingjuan Liao 1, Jie Wan 1, 2 , Guozhuang Shen 1
1. Key Laboratory of Digital Earth Science, Institute of Remote Sensing and Digital
Earth, Chinese Academy of Sciences, Beijing 100094, E-mail: [email protected] 2. University of Chinese Academy of Sciences, Beijing 100049
ID 10466: Applications of RA Data - Land

Outline
Background 1
2 Test Site and Datasets
3 Method
4 Results and Discussion
5 Summery and future work

Background Objectives of ID 10466: Applications of RA Data - Land
Measure the lake level changes of the Qinghai-Tibet Plateau using radar altimeter data
Measure glaciers elevation in Qinghai-Tibet Plateau using radar altimeter data
Studies carried out
Monitoring the changes of lake level and glacier elevation based on the satellite altimetry technique presented in 2014 Dragon 3 Mid-Term Results Symposium
Integrated analysis of ENVISAT/RA-2 altimeter data and Landsat imagery for estimating water volume variation of the lakes

Background The lake is an important component of the global water resources, closely
related to the survival and development of human beings.
The lakes in Qiangtang Plateau, located in the inland of Qinghai-Tibet Plateau, are hardly affected by human activities. These lakes are the indicator of climate change since they are sensitive to the change of global climate.
To investigate and analyze the lake variation in Qiangtang Plateau has very important significance on revealing the region’s climate change.

Methods of estimating lake water volume
• Water balance Equation Method1
•Bathymetric map Method 2
Background
i i D GI
o o GO
V I OI P R V VO E R V
∆ = −= + + += + +

Landsat、MODIS、CBERS
•Model for estimating water volume
Water volume variation
Lake extent change Lake level change
Method 3
• Lake extent delineation
Background

Background • Lake level extraction
Gauge site Altimetry
ICESat Envisat Cryosat2

Outline
Background 1
2 Test Site and Datasets
3 Method
4 Results and Discussion
5 Summery and future work

Test Site and Datasets Test Site
Lake distribution map Average elevation :4800m Number of lake: 500(>1km2) Main lake: Nam Co, Selin Co, Zhari Nam Co, Dangri Yum Co, Angzi Co, Zigetang Co, Daze Co

Test Site and Datasets
(1) Landsat:MSS in 1970,TM in 1990,ETM+ in 2000 (2) Envisat/RA-2: Level-2 GDR data(2002~2010)
Datasets

Outline
Background 1
2 Test Site and Datasets
3 Method
4 Results and Discussion
5 Summery and future work

Method Lake extent delineation

Method Selection of footprints within the lake
Extract the parameters for each footprint
1Hz range of each footprint
Physical corrections for 1Hz range
1Hz water level of each footprint
Daily lake level
Water level = Satellite Altitude - (Measured Range + Corrections) - geoid
• Extraction of lake level

Method
Extraction of lake extent and level
Establishing level-extent empirical model
Constructing the lake level in 1970
Estimating the water volume variation
Workflow to estimate the water volume variation
H
S2
S1
2 1 1 2 1 21 ( )*( * )3
V H H S S S S∆ = − + +
( )2 22 1 2 1
13
V h R R R Rπ∆ = + +
Increasing water volume (ΔV)
Outline
Background 1
2 Test Site and Datasets
3 Method
4 Results and Discussion
5 Summery and future work

Results and discussion Lake extent change
Year Nam Co
Selin Co
Zhari Nam Co
Dangri Yum Co
Zigetang Co
Angzi Co
Daze Co
1970 1935.9 1679.7 976.4 829.5 191.5 419.3 250.4 1990 1963.9 1763.6 961.0 829.0 200.0 388.8 250.3 2000 1981.5 1816.5 953.5 835.9 210.5 406.8 243.5 2010 2013.5 2349.2 1001.5 847.3 239.7 451.3 289.4
1970-1990 1990-2000 2000-2010 1970-2010 Variation
(km2) Variation rate(%)
Variation (km2)
Variation rate(%)
Variation (km2)
Variation rate(%)
Variation (km2)
Variation rate(%)
Nam Co 27.98 1.45 17.66 0.90 31.99 1.61 77.62 4.01 Selin Co 83.90 4.99 52.90 3.00 532.70 29.33 669.50 39.86
Zhari Nam Co -15.41 -1.58 -7.49 -0.78 48.02 5.04 25.12 2.57 Dangri Yum Co -0.51 -0.06 6.94 0.84 11.35 1.36 17.78 2.14
Zigetang Co 8.50 4.44 10.50 5.25 29.20 13.87 48.20 25.17 Angzi Co -30.50 -7.27 18.04 4.64 44.42 10.92 31.96 7.62 Daze Co -0.10 -0.04 -6.80 -2.72 45.90 18.85 39.00 15.58
Lake extents delineated from Landsat images(km2)
Lake extent variations from 1970 to 2010

Results and discussion Lake level change
Variation rate of the lakes
Lake level change of Selin Co
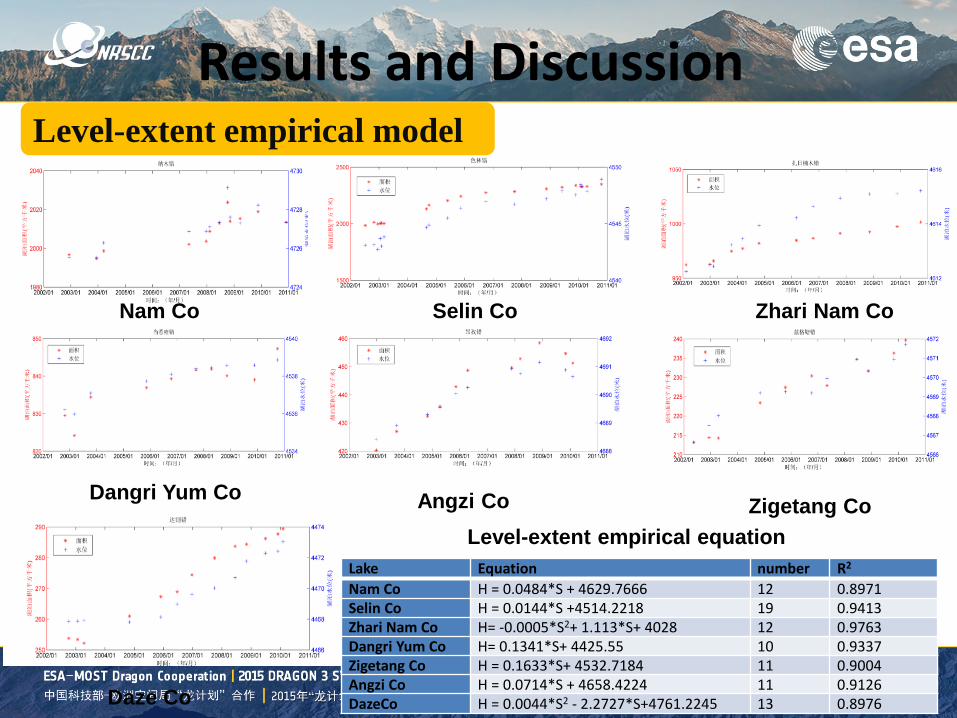
Results and Discussion Level-extent empirical model
Nam Co Selin Co Zhari Nam Co
Dangri Yum Co Angzi Co Zigetang Co
Daze Co
Lake Equation number R2
Nam Co H = 0.0484*S + 4629.7666 12 0.8971 Selin Co H = 0.0144*S +4514.2218 19 0.9413 Zhari Nam Co H= -0.0005*S2+ 1.113*S+ 4028 12 0.9763 Dangri Yum Co H= 0.1341*S+ 4425.55 10 0.9337 Zigetang Co H = 0.1633*S+ 4532.7184 11 0.9004 Angzi Co H = 0.0714*S + 4658.4224 11 0.9126 DazeCo H = 0.0044*S2 - 2.2727*S+4761.2245 13 0.8976
Level-extent empirical equation

Results and discussion Constructing the lake level in 1970, 1990, 2000
2002 & 2010 1970 1990 2000
Extent
(km2) Level (m) Extent Level Extent Level Extent Level
Nam Co 1996.7,
2013.5
4725.654,
4727.332 1935.9 4723.463 1963.9 4724.817 1981.5 4725.672
Selin Co 1985.3,
2349.2
4543.095,
4548.930 1679.7 4538.409 1763.6 4539.618 1816.5 4540.379
Zhari Nam
Co
962.2,
1001.5
4613.150,
4615.219 976.4 4613.868 961.0 4613.096 953.5 4612.315
Dangri Yum
Co
829.5,
847.3
4536.207,
4538.861 829.5 4536.789 829.0 4536.721 835.9 4537.651
Zigetang Co 213.2,
239.7
4566.634,
4571.709 191.5 4563.990 200.0 4565.378 210.5 4567.093
Angzi Co 420.2,
451.3
4688.021,
4690.643 419.3 4688.360 388.8 4686.183 406.8 4687.471
Daze Co 253.8,
289.4
4467.862,
4473.044 250.4 4468.021 250.3 4468.018 243.5 4467.708

Results and discussion Estimation of water volume changes
1970-1990 1990-2000 2000-2010 1970-2010 Nam Co 2.6402 1.6859 3.3161 7.6392 Selin Co 2.0798 1.3635 17.7600 21.0940
Zhari Nam Co -0.7476 -0.7482 2.8392 1.3365 Dangri Yum Co -0.0564 0.7743 1.0184 1.7373
Zigetang Co 0.1903 0.2462 0.7254 1.1629 Angzi Co -0.8797 0.5125 1.3602 0.9932 Daze Co -0.0008 -0.0766 1.4201 1.3546
Estimation of water volume variations(km3)
Water volume variations of the lake

Results and discussion
(1) Different resolutions of Landsat (MSS, TM/ETM+)
(2) Level-extent empirical model
(3) Water volume equation
Uncertainty analysis of water volume estimation

Outline
Background 1
2 Test Site and Datasets
3 Method
4 Results and Discussion
5 Summery and future work

Summery The lake extents were all enlarged in the past forty years. The lake extent
of Selin Co、Nam Co and Zigetang Co were expanding all the time, however, Angzi Co、Zhari Nam Co、Dangri Yum Co and Daze Co were firstly shrunk, then expanded. The lake extent of Selin Co increased about 669.5 km2, thus, Selin Co, exceeding Nam Co, became the largest lake in these seven lakes.
The lake levels in Qinagtang Plateau were increasing from 2002 to 2010, and Selin Co was the fastest increasing in these lakes.
By extracting the lake level and extent of the seven typical lakes, the level-extent empirical model was established, then the lake level of seven lakes in 1970 were constructed by the empirical model, and the water volume variation of seven lakes in forty years were calculated based on the model.

Future work
Extraction of lake level change in China’s main lakes using radar altimeter data Analysis of lake change, linking with
temperature, precipitation and evaporation so on Deliverables, reporting and published papers.

Published paper Jingjuan Liao, Le Gao, and Xiaoming Wang. Numerical simulation and forecasting
of water level for Qinghai Lake using multi-altimeter data between 2002 and 2012, IEEE Journal of Selected Topics in Applied Earth Observations and Remote Sensing, 2014, 7(2): 609 – 622.doi: 10.1109/JSTARS.2013.2291516.
Le Gao, Jingjuan Liao, and Guozhuang Shen. Monitoring lake level changes in the Qinghai-Tibet Plateau using multi-altimeter data (2002-2012), Journal of Applied Remote Sensing, 2013, 7(1), 073470. doi:10.1117/1.JRS.7.073470.
高乐,廖静娟,刘焕玲,郭伟.卫星雷达测高的应用现状及发展趋势, 遥感技术与应用, 2013, 28(6): 978-983.
万杰, 廖静娟,许涛,沈国状,基于ICESat高度计数据评估SRTM数据的精度-以青藏高原地区为例, 国土资源遥感, 2014, 27(1):100-105.
廖静娟,万杰,沈国状, 基于多源遥感数据的羌塘高原典型湖泊水量变化估算研究,第19届中国遥感大会论文集,1671-1678页,西安,2014.9.21

Training of Young Scientists • Ph.D level: Gao Le • M. Sc.level: Wan Jie

Top Related