


Languages
Pages
Legal

ThinkingSpatiallywithArcGISOnline©Esri,2008-2017;CCAttribution-NonCommercial-ShareAlikelicense
http://esri.com/geoinquiriesModule3:Lesson2-TeacherMaterials
1
PatternsofaGrowingPopulation - Instructor Guide
Lessonoverview
StudentswillexploretheroleoftheUnitedStatesCensus.Usingdataobtainedinthe2000Census,theywillexaminepopulationpatternsacrosstheUnitedStates.Studentswillprofiletheirstateandexaminedataonpopulation,populationdensity,andotherinterestingstatisticsonmobilityandInternetaccess.TheywilluseGIStoexamineandinteractwithanumberofgraduatedcolormapsandfilterdatatoanswerrelevantquestions.
EstimatedtimeApproximately60minutes
MaterialsThestudentactivitycanbefoundathttp://esri.com/geoinquiries.
ClickontheThinkingSpatiallyUsingGISlinkandchooseModule3,Lesson2.
ObjectivesAftercompletingthelesson,astudentisabletodothefollowing:
• ExplainpopulationpatternsacrosstheUnitedStates• Profiletheinformationfortheirstate• Interpretthematicmapstoanswerquestionsanddrawconclusions• Workwithtabulardata• Filterdatatofindanswersandmakedecisions
GISToolsandFunctions• Openamapfile• Zoomtodesiredsectionofthemap• Identifyafeatureonamap
Functions• Turnlayersonandoff• Changemapstyle(legend)• Filterattributedata• Labelfeatures• Sortattributes

ThinkingSpatiallywithArcGISOnline©Esri,2008-2017;CCAttribution-NonCommercial-ShareAlikelicense
http://esri.com/geoinquiriesModule3:Lesson2-TeacherMaterials
2
NationalGeographyStandards
Teachingthelesson
Introducingthelesson
Beginthislessonbyreviewingordiscussingthefollowingconcepts.
• Thedifferencebetweentotalpopulationandpopulationdensity• Spatialpatterns:cluster,random,anduniform• HowtheU.S.CensuscanhelpusstudythehistoryoftheUnitedStates• Theuseofstatisticsingeographyandmapping• Howcensusdataissimplifiedsothatitcanbestudiedmoreeasily• TheuniquecharacteristicsofeachregionoftheUnitedStates• Thematicmappingusinggraduatedcolormaps• Theindividualcharacteristicsofyourstateandthepeoplewholivethere
StudentactivityWerecommendthatyoucompletethislessonyourselfbeforecompletingitwithstudents.Thiswillallowyoutomodifytheactivitytoaccommodatethespecificneedsofyourstudents.
ThinkingSpatiallywithArcGISOnline©Esri,2008-2017;CCAttribution-NonCommercial-ShareAlikelicense
http://esri.com/geoinquiriesModule3:Lesson2-TeacherMaterials
3
TeacherNotes• Explainthelessontothestudents,andmakesuretheyknowwheretoanswerthe
questions.• Foryoungergrades,youcanconducttheGISactivityasateacher-ledactivityandhave
studentsfollowalong.YoucanleadstudentsthroughtheGISstepsandaskthemtheassociatedquestionsasaclass.
• Studentswilleachneedaprintedcopyoftheactivitysotheycananswerquestionsthroughout.
• Theycanmarktheiranswersdirectlyontheactivitysheet.Alternatively,youcanprovideaseparateanswersheet.
• Ideally,studentswillhaveaccesstotheirowncomputers.However,studentscancompletethelessoninsmallgroups.
• Somequestionsdorequireclassroomand/orgroupinteraction.Youcandecideonthebestwaytohandlethesequestions.
• WerecommendthatstudentssavetheirworkastheyprogressthroughtheGISactivity.StudentscanuseeithertheSavecommand(tosavetheirchangestotheoriginalmap)ortheSaveAscommand(tosavetheirchangestoanewmap).Pleaseexplaintostudentswhereandhowtheyshouldsavetheirwork.
• Eachstudentwillcompleteaworksheetwhilegoingthroughtheactivity.• Toexplainpopulationdensity,havethestudentscalculatethedensityofthestudentsin
yourclassroom(numberofstudents/areaofclassroom=density).
Thefollowingarethingstolookforwhilethestudentsareworkingonthissetofactivities:
• Arestudentsthinkingabouttheunderlyinggeographicconceptsastheyworkthroughthesteps(suchasthepopulationoftheircommunityandhowpopulationaffectsdecisionmaking)?
• Arestudentsansweringthequestionsastheyworkthroughthesteps?• Arestudentsexperiencinganydifficultieswiththebuttons,tools,andmouseclicking,
etc.?
Concludingthelesson• EngagestudentsinadiscussionabouttheUnitedStatesanditspopulation.Forexample,
youcandiscussissuessuchashowfastthepopulationisgrowing,wherepeopleareliving,andhowpopulationpatternsmightchangeinthefuture.
• HavestudentsdoInternetresearchtolearnmoreaboutthefuturegrowthoftheUnitedStatesand/orworldpopulationandtolearnaboutthenextU.S.Census.
• Askstudentswhattheyknowaboutthepopulationsinothercountries.• Discussthevalueofaccuratelycountingpeople.Forexample,howwouldthisaffectthe
locationofschoolsandconstructionofnewhomes?• Talkabouthowyourcommunitycompareswiththestateandthecountryintermsof
populationandothercharacteristics.Doestheircommunityrepresentthestateasawhole?

ThinkingSpatiallywithArcGISOnline©Esri,2008-2017;CCAttribution-NonCommercial-ShareAlikelicense
http://esri.com/geoinquiriesModule3:Lesson2-TeacherMaterials
4
• Hasthisactivityraisedanyquestionsthattheywouldliketoexplorefurther?HowcanGIShelpthemtolearnaboutpeopleandplaces?
• HowcanGIShelpthemorganizeinformationandfindanswerstoquestions?
Extendingthelesson• Downloada2000Censusformandhaveeachstudentcompletetheform(shortorlong
form).Doaminicensusoftheclassroom.• ExamineotherkindsofquestionsthatcouldbeaskedontheU.S.Census.• ChooseonestatefromeachregionoftheUnitedStatestoprofile,andseehowthose
statescomparetoyours.• Discusspopulationpatternsinthecountryandhowtheyrelatetohistory,landforms,
climate,etc.
References• www.census.gov• http://people.howstuffworks.com/census1.htm• http://www.ourtownamerica.com/sponsor/movingstats.php
ThinkingSpatiallywithArcGISOnline©Esri,2008-2017;CCAttribution-NonCommercial-ShareAlikelicense
http://esri.com/geoinquiriesModule3:Lesson2-TeacherMaterials
5
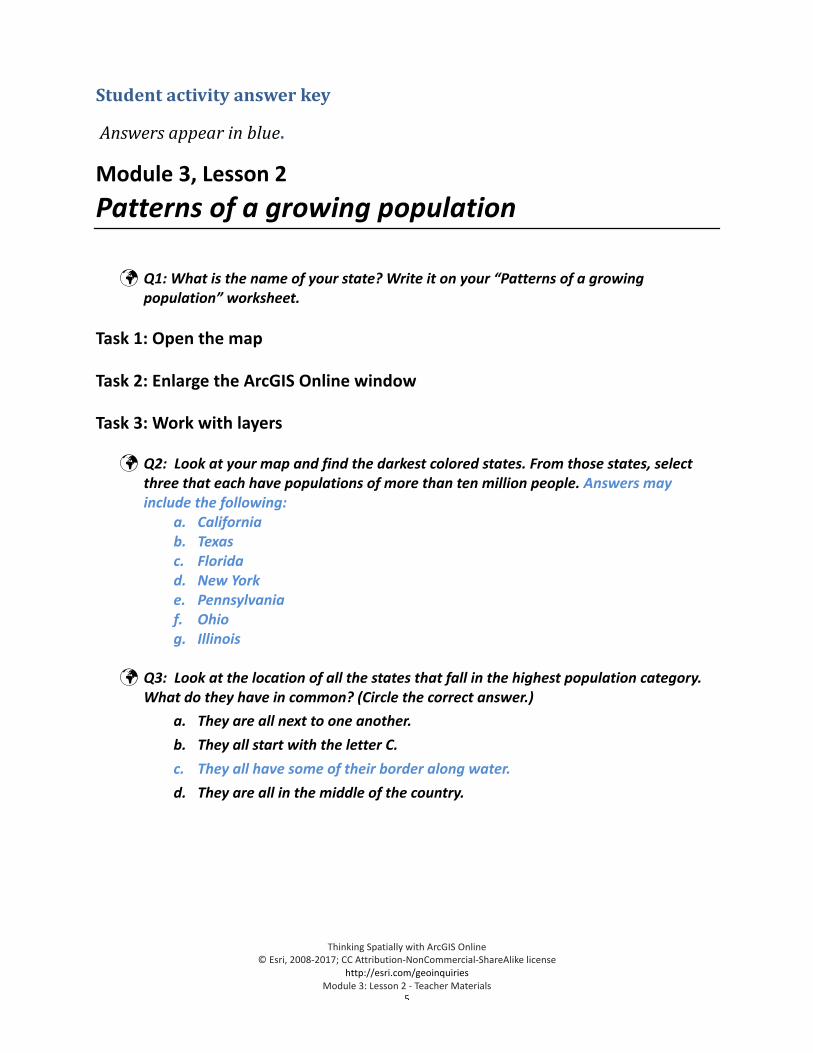
Studentactivityanswerkey
Answersappearinblue.
Module3,Lesson2Patternsofagrowingpopulation
! Q1:Whatisthenameofyourstate?Writeitonyour“Patternsofagrowingpopulation”worksheet.
Task1:Openthemap
Task2:EnlargetheArcGISOnlinewindow
Task3:Workwithlayers
! Q2:Lookatyourmapandfindthedarkestcoloredstates.Fromthosestates,selectthreethateachhavepopulationsofmorethantenmillionpeople.Answersmayincludethefollowing:
a. Californiab. Texasc. Floridad. NewYorke. Pennsylvaniaf. Ohiog. Illinois
! Q3:Lookatthelocationofallthestatesthatfallinthehighestpopulationcategory.Whatdotheyhaveincommon?(Circlethecorrectanswer.)
a. Theyareallnexttooneanother.b. TheyallstartwiththeletterC.c. Theyallhavesomeoftheirborderalongwater.d. Theyareallinthemiddleofthecountry.
ThinkingSpatiallywithArcGISOnline©Esri,2008-2017;CCAttribution-NonCommercial-ShareAlikelicense
http://esri.com/geoinquiriesModule3:Lesson2-TeacherMaterials
6
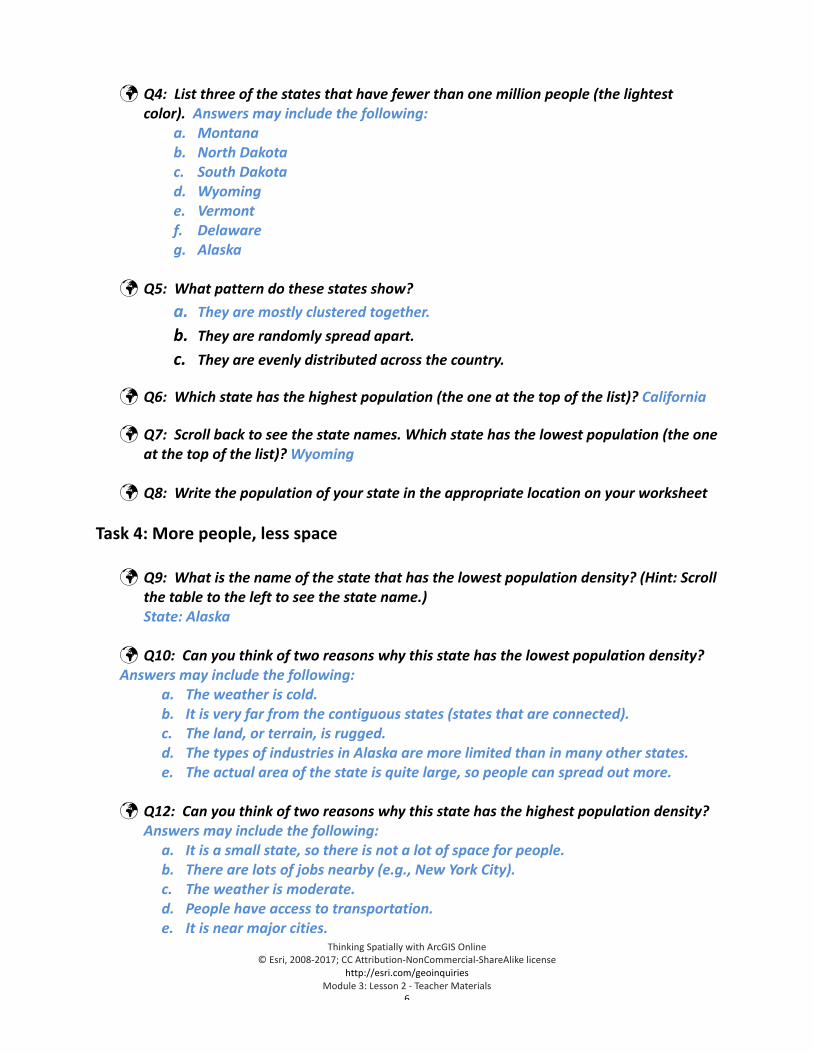
! Q4:Listthreeofthestatesthathavefewerthanonemillionpeople(thelightestcolor).Answersmayincludethefollowing:
a. Montanab. NorthDakotac. SouthDakotad. Wyominge. Vermontf. Delawareg. Alaska
! Q5:Whatpatterndothesestatesshow?a. Theyaremostlyclusteredtogether.b. Theyarerandomlyspreadapart.c. Theyareevenlydistributedacrossthecountry.
! Q6:Whichstatehasthehighestpopulation(theoneatthetopofthelist)?California
! Q7:Scrollbacktoseethestatenames.Whichstatehasthelowestpopulation(theoneatthetopofthelist)?Wyoming
! Q8:Writethepopulationofyourstateintheappropriatelocationonyourworksheet
Task4:Morepeople,lessspace
! Q9:Whatisthenameofthestatethathasthelowestpopulationdensity?(Hint:Scrollthetabletothelefttoseethestatename.)State:Alaska
! Q10:Canyouthinkoftworeasonswhythisstatehasthelowestpopulationdensity?Answersmayincludethefollowing:
a. Theweatheriscold.b. Itisveryfarfromthecontiguousstates(statesthatareconnected).c. Theland,orterrain,isrugged.d. ThetypesofindustriesinAlaskaaremorelimitedthaninmanyotherstates.e. Theactualareaofthestateisquitelarge,sopeoplecanspreadoutmore.
! Q12:Canyouthinkoftworeasonswhythisstatehasthehighestpopulationdensity?Answersmayincludethefollowing:
a. Itisasmallstate,sothereisnotalotofspaceforpeople.b. Therearelotsofjobsnearby(e.g.,NewYorkCity).c. Theweatherismoderate.d. Peoplehaveaccesstotransportation.e. Itisnearmajorcities.

ThinkingSpatiallywithArcGISOnline©Esri,2008-2017;CCAttribution-NonCommercial-ShareAlikelicense
http://esri.com/geoinquiriesModule3:Lesson2-TeacherMaterials
7
! Q13:Lookatyourmapandnoticehowpopulationdensityisspreadacrossthestates.Describeanypatternsyousee.Usewordssuchas“locatedtogether”(orclustered),“withoutanypattern”(orrandom),and“lookingthesameastheothers”(oruniform).Answer:Studentscananswerthiscreatively.Appropriatenesswillvarydependingongradelevel.Thefollowingaresomepointsforstudentstoconsider:• OtherthanCalifornia,Washington,andFlorida,thestateswithhigherdensity
areclusteredintheNortheast.• Thestateswithmid-densityareessentiallyclusteredinthemiddleofthe
country.
! Q14:Whatwasthepopulationdensity(Pop_Dens)ofyourstateatthe2000Census?Writeitonyourworksheet.
Task5:Movingaroundthecountry
! Q15:Chooseanyfivestatesfromthoseselectedandwritetheirnameshere:Answersmayincludethefollowing:
a. NorthDakotab. Wisconsinc. Minnesotad. Iowae. Pennsylvaniaf. Ohiog. WestVirginiah. Kentuckyi. Alabamaj. Mississippik. Louisianal. Michigan
! Q16:Inwhichpartofthecountryaremostofthesestateslocated?a. Eastb. West
! Q17:Discusswithyourclassmateswhyyouthinkpeoplewanttoremainlivinginthesestates.Answer:Thisisjustaconversationthestudentsshouldhaveinordertoanswerthefollowingquestion.

ThinkingSpatiallywithArcGISOnline©Esri,2008-2017;CCAttribution-NonCommercial-ShareAlikelicense
http://esri.com/geoinquiriesModule3:Lesson2-TeacherMaterials
8
! Q18:Listtworeasonswhypeoplewouldnotmoveawayfromthestatetheywerebornin.Answer:Thefollowinganswers,aswellasanyothervalidreasons,areacceptable.
a. Theirfamilylivesthere.b. Theyhavegoodjobs.c. Theyhaveahouse.d. Theycannotaffordtomove.e. Theylikewheretheylive.f. Theyliketheweather.g. Theirfriendslivethere.h. Theyhaveneverleftthestate.
! Q19:Askyourclassmatesiftheywereborninthestatetheylivein.Howmanysaidyes?Howmanysaidno?Answerswillvary.
! Q20:Whatisthepercentofpeoplelivinginthestatethatwerebornthere?Writethisonyourworksheet.Answerswillvary
! Q21:Didyounoticeasignificantchangeinthemap?(Hint:TurnoffandontheBorninAnotherStatelayertotakeanotherlook.)
a. Yesb. No
! Q22:Describethechangeinpatternthatyounoticed.ThedarkercolorsmovedtotheWestofthecountry,showingthatpeopleinthewesthavetypicallymovedtherefromotherstates.
! Q23:Lookatthemap.Whichstateshavethehighestnumberofpeoplewhowereborninanotherstate(thedarkestcolor)?Writetwoofthemhere.Answersmayincludethefollowing:
a. Wyomingb. NewHampshirec. Alaskad. Nevadae. Arizona
ThinkingSpatiallywithArcGISOnline©Esri,2008-2017;CCAttribution-NonCommercial-ShareAlikelicense
http://esri.com/geoinquiriesModule3:Lesson2-TeacherMaterials
9
! Q24Whatdoyouthinkmakesthesestatessopopular?Answersmayincludethefollowing:
• Nicerweather(notinallcases)• Betterjobopportunities• Lowercostofliving/lessexpensivehousing• Betterlifestyle• Attendcollege/university
! Q25:Lookatthemap.Whichstateshavethelowestnumberofpeoplewhowereborninanotherstate(thelightestcolor)?Listthreeofthemhere:Answersmayincludethefollowing:
a. Massachusettsb. NewYorkc. Pennsylvaniad. Illinoise. Louisianaf. Michigan
! Q26:Whydoyouthinksofewpeoplefromotherstatesmovethere?Answersmayincludethefollowing:
a. Highcostoflivingb. Verylargecitiesc. Morepollutiond. Colderweather(notinallcases)e. Alotofpeopleliveincities(urbanareas)
! Q27:Whatisthepercentofpeoplelivinginyourstatewhowereborninanotherstate?Writethisonyourworksheet.
Task6:SurfingtheInternet.
Eachyear,theU.S.CensusperformsasurveycalledtheAmericanCommunitySurvey.ThesurveycollectsinterestingfactsonasmallpercentageoftheU.S.populationandpublishesthemontheWeb.Oneofthepiecesofdatathesurveyexaminesispeople’saccesstotheInternet.TheU.S.CensuscollectsthisinformationforeachhouseholdintheUnitedStates.
ThinkingSpatiallywithArcGISOnline©Esri,2008-2017;CCAttribution-NonCommercial-ShareAlikelicense
http://esri.com/geoinquiriesModule3:Lesson2-TeacherMaterials
10
! Q28:Lookatyourmap.Listthreeofthestateswheremorethan60percentofhouseholdshaveaccesstotheInternet.(Thesewillbethestatesinthedarkestcolor.)Answersmayincludethefollowing:
a. Alaskab. Washingtonc. Minnesotad. Oregone. NewHampshiref. Connecticutg. NewJerseyh. Utahi. Coloradoj. Virginia
! Q29:Lookatyourmap.Whatpatterndoyounoticeamongthestateswheremorethan60percentofthepopulationhasInternetaccess?(Circleallthatapply.)
a. Thereisarandompattern—thesestatesarespreadalloverthecountry.b. Thereisaclusterpattern—thestatesaregroupedtogetherincertainareas.c. Thereisauniformpattern—thestatesarespacedevenlyapart.Answer:aorb—itwilldependonthestudent’sspatialperspective.
! Q30:WhichthreestateshavethelowestpercentofhouseholdswithaccesstotheInternet?Youmighthavetoscrollbacktothelefttoseethenamesofthestates.
a. Mississippib. Arkansasc. Louisiana
! Q31:Inwhichregionofthecountryarethesestateslocated?a. Northb. Southc. Eastd. West
! Q32:WhichthreestateshavethehighestpercentofhouseholdswithaccesstotheInternet?
a. Alaskab. NewHampshirec. Colorado

ThinkingSpatiallywithArcGISOnline©Esri,2008-2017;CCAttribution-NonCommercial-ShareAlikelicense
http://esri.com/geoinquiriesModule3:Lesson2-TeacherMaterials
11
! Q33:Overall,whichpartofthecountryappearstohavethemostaccesstotheInternet?
a. Northb. Southc. Eastd. West
! Q34:WhatisthepercentofInternetaccessforhouseholdsinyourstate?Writethisnumberonyourworksheet.
Task7:SaveyourworkandexitArcGISOnline.
ThinkingSpatiallywithArcGISOnline©Esri,2008-2017;CCAttribution-NonCommercial-ShareAlikelicense
http://esri.com/geoinquiriesModule3:Lesson2-TeacherMaterials
12
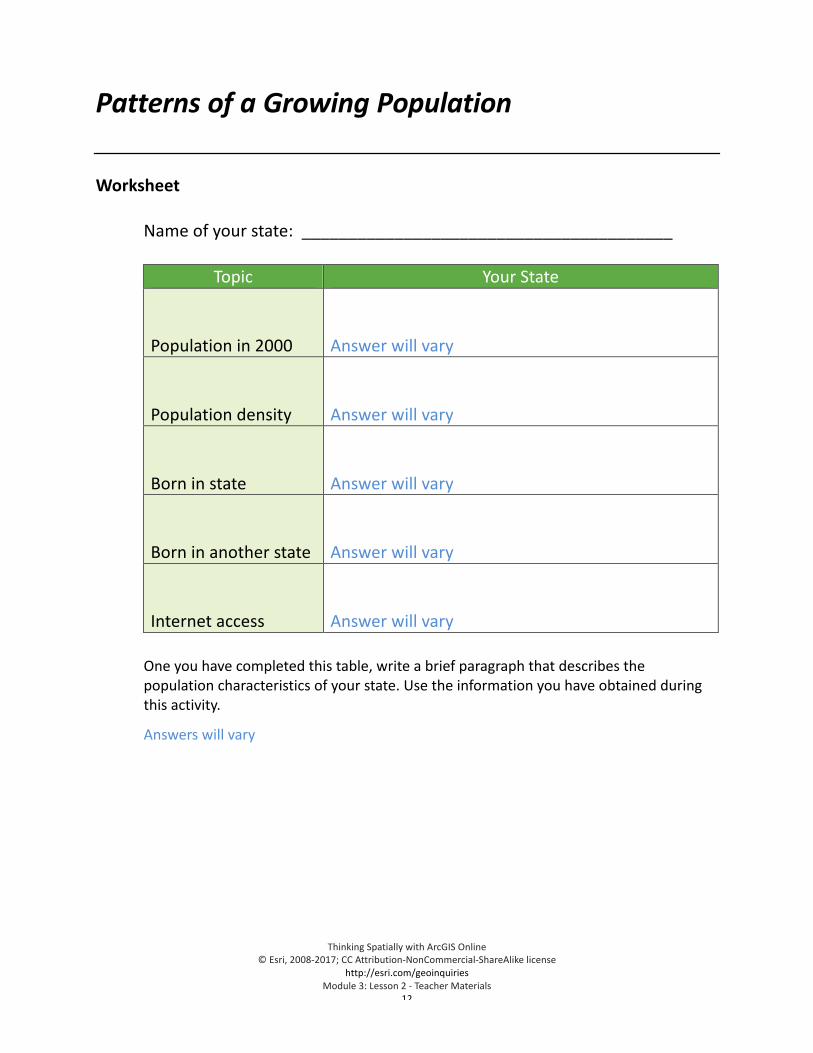
PatternsofaGrowingPopulation
Worksheet
Nameofyourstate:________________________________________
Topic YourState
Populationin2000 Answerwillvary
Populationdensity Answerwillvary
Borninstate Answerwillvary
Borninanotherstate Answerwillvary
Internetaccess Answerwillvary
Oneyouhavecompletedthistable,writeabriefparagraphthatdescribesthepopulationcharacteristicsofyourstate.Usetheinformationyouhaveobtainedduringthisactivity.
Answerswillvary
Top Related