


![[Insert a picture relevant to the context]. INTRODUCTION [Insert a picture relevant to the context]](https://static.fdocuments.in/doc/165x107/56649ca15503460f94960181/insert-a-picture-relevant-to-the-context-introduction-insert-a-picture.jpg)
Languages
Pages
Legal


1

<Insert Picture Here>
Oracle E-Business Suite Supply Chain Release 12.1 Delivering Value in Uncertain Times Kaity Rasmussen Oracle Sales Consultant

3
The following is intended to outline our general product direction. It is intended for information purposes only, and may not be incorporated into any contract. It is not a commitment to deliver any material, code, or functionality, and should not be relied upon in making purchasing decisions. The development, release, and timing of any features or functionality described for Oracle’s products remains at the sole discretion of Oracle.

4
Supply Chain Strategy For Release 12.1
Focus on Opportunities to Achieve Rapid Return Today
Invest in Ways to Standardize and Simplify with a Global Business Platform
Downturns can more than double the likelihood that a firm significantly changes its industry ranking. In addition, firms that make it into the top quartile during a downturn sustain their premium for an average of three years.
Source: Corporate Executive Board, 2008

5
Value Chain Planning Strategy For Release 12.1
• Oracle® Demantra: • Demand Management • Advanced Forecasting and Demand
Modeling • Real-Time Sales and Operations Planning • Predictive Trade Planning • Trade Promotion Optimization • Deductions and Settlement Management
• Oracle® Advanced Planning Command Center • Oracle® Advanced Supply Chain Planning • Oracle® Collaborative Planning • Oracle® Demand Signal Repository • Oracle® Global Order Promising • Oracle® Inventory Optimization • Oracle® Production Scheduling • Oracle® Service Parts Planning • Oracle® Strategic Network Optimization

6
Value Chain Planning Strategy For Release 12.1
• Oracle® Demantra: • Demand Management • Advanced Forecasting and Demand
Modeling • Real-Time Sales and Operations Planning • Predictive Trade Planning • Trade Promotion Optimization • Deductions and Settlement Management
• Oracle® Advanced Planning Command Center • Oracle® Advanced Supply Chain Planning • Oracle® Collaborative Planning • Oracle® Demand Signal Repository • Oracle® Global Order Promising • Oracle® Inventory Optimization • Oracle® Production Scheduling • Oracle® Service Parts Planning • Oracle® Strategic Network Optimization

7
Value Chain Planning Strategy For Release 12.1
• Oracle® Demantra: • Demand Management • Advanced Forecasting and Demand Modeling • Real-Time Sales and Operations Planning • Predictive Trade Planning • Trade Promotion Optimization • Deductions and Settlement Management
• Oracle® Advanced Planning Command Center • Oracle® Advanced Supply Chain Planning • Oracle® Collaborative Planning • Oracle® Demand Signal Repository • Oracle® Global Order Promising • Oracle® Inventory Optimization • Oracle® Production Scheduling • Oracle® Service Parts Planning • Oracle® Strategic Network Optimization + Oracle Manufacturing Operations Center
+ Oracle Landed Cost Management

8
Value Chain Planning Strategy For Release 12.1
• Oracle® Demantra: • Demand Management • Advanced Forecasting and Demand Modeling • Real-Time Sales and Operations Planning • Predictive Trade Planning • Trade Promotion Optimization • Deductions and Settlement Management
• Oracle® Advanced Planning Command Center • Oracle® Advanced Supply Chain Planning • Oracle® Collaborative Planning • Oracle® Demand Signal Repository • Oracle® Global Order Promising • Oracle® Inventory Optimization • Oracle® Production Scheduling • Oracle® Service Parts Planning • Oracle® Strategic Network Optimization + Oracle Manufacturing Operations Center
+ Oracle Landed Cost Management

9
Oracle Advanced Planning Command Center
• Provide insight to key decision makers – Close the loop with embedded analytics – Bridge the gap between analytics and planning
through seamless integration with operational planning applications
– Leverage pre-built dashboards with rich content and KPIs
• Proactively respond to deviations in performance – Identify root cause – Define and evaluate alternative business scenarios – Manage execution of scenarios; assign tasks to
planners and other stakeholders
• Reduce decision making cycle time through process automation – Use BPEL process flows to execute planning
processes – Configure and adapt
Enable holistic view of supply chain performance
Analytical Data
Planning Dashboards and Reports
Business scenario planning
Planning process automation
Execute scenarios
Scenario and Activity Management
Forecasting Supply Planning
Web Service enabled planning processes
Orc
hest
rate
Pl
an
Ana
lyze

10
Oracle Advanced Planning Command Center
• Translates planning data to corporate metrics • Forward looking perspective combined with past trends • Not a data warehouse for “rearview mirror” analysis
– Minimal data replication (archiving/publish of select summary data) • Available with Oracle Advanced Planning 12.1 (May 2008) and runs on
top of: – Demantra Demand Management, Demantra Real-Time Sales and Operations
Planning, Strategic Network Optimization, Inventory Optimization, Advanced Supply Chain Planning
– Context sensitive drill-downs
Today
Summary information
Forward looking planning information
No need to build expensive “rear-view mirror only” disconnected data warehouse

11
Compare scenarios – 360 degree visibility
Pre-built self-service dashboards for comprehensive management analysis with corporate metrics
Analyze across key demand, supply, capacity, finance, and exception metrics

12
Monitor S&OP performance in real time
Compare alternate scenarios
Analyze key Planning metrics
Analyze profit and loss
Analyze constrained forecast
Self service S&OP dashboard for interactive management review

13
Analyze specific product categories, organizations and resource groups
Check your shipment and production trends
Compare previous run to current run exceptions
Compare previous run to current run demand and supply metrics
Self service Supply Chain Plan Analysis dashboard
Monitor operational plans

14
Pre-seeded rich content – KPIs 100+ dimensions and performance metrics

15
Quickly identify problem and root cause
Sudden demand spike
Resource overloaded
Increase in late shipments
Supply shortage
Proactively respond to performance deviations

16
Automate planning process execution
• Assign owners to top level process notes • Optionally skip steps
when resubmitting
Execute and configure your planning processes with BPEL Process Manager

17
Value Chain Planning Strategy For Release 12.1
• Oracle® Demantra: • Demand Management • Advanced Forecasting and Demand Modeling • Real-Time Sales and Operations Planning • Predictive Trade Planning • Trade Promotion Optimization • Deductions and Settlement Management
• Oracle® Advanced Planning Command Center • Oracle® Advanced Supply Chain Planning • Oracle® Collaborative Planning • Oracle® Demand Signal Repository • Oracle® Global Order Promising • Oracle® Inventory Optimization • Oracle® Production Scheduling • Oracle® Service Parts Planning • Oracle® Strategic Network Optimization + Oracle Manufacturing Operations Center
+ Oracle Landed Cost Management

18
Oracle Demand Signal Repository
• Near real-time data to better sense, shape and respond to demand • Consistent data more easily leveraged across teams and applications • Reduced manual effort and cost
• POS sales • Price • Store inventory • Promotional plans • Store replen. rules • Store forecasts
Retail Store Data DEMAND SIGNAL REPOSITORY
• Data sources centrally cleansed, harmonized and aggregated
• Pre-built dashboards and reports • Powerful BI capabilities • “Sense & Respond” event mgmt
CA
PTU
RE
MA
NA
GE
AN
ALY
ZE
RES
PON
D
INTE
GR
ATE
Retail DC/ Distributor Data
• DC shipments • DC inventory • DC replen. rules
Other External Data
• Retail loyalty • IRI/AC Nielsen • 3rd party demographic • Causal (weather,etc.) • RFID/EPC • IMS, NDC, EDI (867, 852),
Scripts, Pedigree • Unstructured text
SOA
-Bas
ed In
tegr
atio
n
SALES & OPERATIONS PLANNING
SUPPLY & DISTRIBUTION PLANNING
PRODUCT LIFECYCLE MANAGEMENT
TRADE PROMOTION PLANNING & OPT
Non-Oracle Applications
DEMANTRA DEMAND MANAGEMENT DEMANTRA SALES & OPERATIONS PLN
ORACLE SUPPLY & DISTRIBUTION PLN ORACLE PRODUCT LIFECYCLE MANAGEMENT
DEMANTRA TRADE PLANNING Pre-Built Integration
Leverage demand insights to drive profitable growth
19
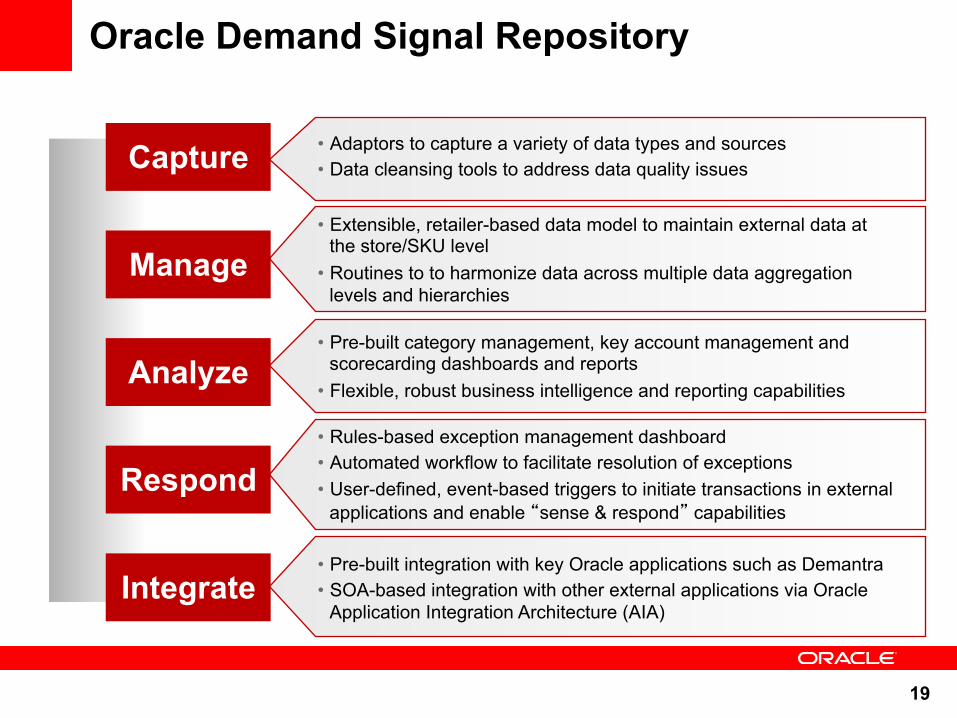
Oracle Demand Signal Repository
Capture
Manage
Analyze
Integrate
• Adaptors to capture a variety of data types and sources • Data cleansing tools to address data quality issues
• Extensible, retailer-based data model to maintain external data at the store/SKU level
• Routines to to harmonize data across multiple data aggregation levels and hierarchies
• Pre-built category management, key account management and scorecarding dashboards and reports
• Flexible, robust business intelligence and reporting capabilities
• Pre-built integration with key Oracle applications such as Demantra • SOA-based integration with other external applications via Oracle
Application Integration Architecture (AIA)
Respond • Rules-based exception management dashboard • Automated workflow to facilitate resolution of exceptions • User-defined, event-based triggers to initiate transactions in external
applications and enable “sense & respond” capabilities

20
Value Chain Planning Strategy For Release 12.1
• Oracle® Demantra: • Demand Management • Advanced Forecasting and Demand Modeling • Real-Time Sales and Operations Planning • Predictive Trade Planning • Trade Promotion Optimization • Deductions and Settlement Management
• Oracle® Advanced Planning Command Center • Oracle® Advanced Supply Chain Planning • Oracle® Collaborative Planning • Oracle® Demand Signal Repository • Oracle® Global Order Promising • Oracle® Inventory Optimization • Oracle® Production Scheduling • Oracle® Service Parts Planning • Oracle® Strategic Network Optimization + Oracle Manufacturing Operations Center
+ Oracle Landed Cost Management

21
Typical benefits of an integrated system
• Reduce inventory investment up to 60% • Reduce service response missed up to 90% • Reduce obsolescence and write-offs due to end-of-life • Reduce same-day inventory requirements • Reduce expediting cost • Reduce customer repeat calls and technician visits • Improve planner productivity • Minimize backorders during product launches • Permanently reduce cost of system integrations

22
Oracle solutions for service planning
Multi-Indentured, Repair Constraints Multi-Echelon Distribution with Repair
Complex MRO Multi-Echelon Distribution, no Repair • Maintain, repair, and overhaul complex equipment and installations
• Repair work order hierarchies • Rotables and serialization • Long range and operational planning • Leverage Complex MRO solution, Demand
Planning, and Advanced Supply Chain Planning • Optionally configure Demantra Demand
Management for advanced forecasting
• Use standard parts without part condition • Use standard BOMs and routings • Use standard work orders for assembly and
repair • Release new buy and assembly orders to
Execution • Leverage Demantra Demand Management for
forecasting • Leverage Advanced Supply Chain Planning for
replenishment
• Distribute, replenish (catalog driven) parts • Fair share allocation • Rebalancing of inventory in distribution
network (circular sourcing) • Optimize cross-network loads • Release recommendations to Execution • Leverage Demantra Demand Management for
forecasting • Leverage ASCP-DRP for replenishment/
redistribution
• Use part condition (“good”, “bad”) • Sourcing accounts for repair at, return to • Define serviceable products and components • Part criticality matrix linked to forecasting
rules • Optimize redistribution and replenishment • Account for supersession (repair to) in
forecasting and replenishment • Unified forecasting and replenishment UI • Release recommendations to Depot Repair
and Spares Management • Leverage Service Parts Planning
Right solution for the right problem

23
Oracle Service Parts Planning
• Simultaneously forecast, replenish and redistribute your service parts across your service supply chain
• More accurately forecast your service parts – Demantra statistical forecasting engine inside for
highest accuracy – Account for intermittent, seasonal, and fast moving
demand patterns – Consider supersession – Forecast spares demand for new products
• Optimize the replenishment and redistribution of parts across the extended service network, integrated with Service Execution
• Enable advanced forecasting, supplier collaboration, and inventory optimization – Manage targeted service levels, representing SLAs,
and budgets (via IO) – Manage service contract customer demand (via
Dem DM) – Collaborate with new buy and repair vendors (via
CP)
Key capabilities

24
Regional DCs Service technicians
Central DC
Repair depot
Customers
Supplier (Repair)
Supplier (New Buy)
On-hand Consigned
Repaired In repair
• Spares Management plans field service engineer trunk stock replenishment • Service Parts Planning plans supply network (up-to trunk stock locations)
– Recognizes usages from field service
Oracle Service Parts Planning
Spares Management Service Parts Planning

25
Oracle’s Service Parts Planning solution
Transform your service operations from cost to profit centers
� Simultaneously forecast, replenish and redistribute your service parts across your service supply chain
� More accurately forecast your service parts
� Optimize the replenishment and redistribution of parts across the extended service network, integrated with Service Execution
� Enable supplier collaboration, inventory optimization, and advanced forecasting processes
26
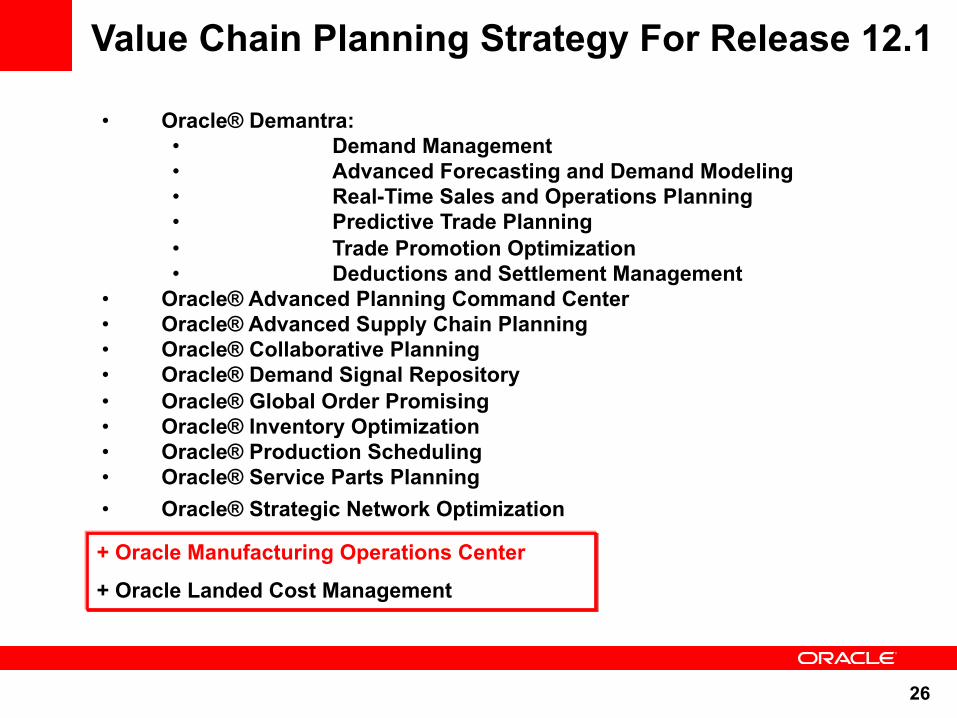
Value Chain Planning Strategy For Release 12.1
• Oracle® Demantra: • Demand Management • Advanced Forecasting and Demand Modeling • Real-Time Sales and Operations Planning • Predictive Trade Planning • Trade Promotion Optimization • Deductions and Settlement Management
• Oracle® Advanced Planning Command Center • Oracle® Advanced Supply Chain Planning • Oracle® Collaborative Planning • Oracle® Demand Signal Repository • Oracle® Global Order Promising • Oracle® Inventory Optimization • Oracle® Production Scheduling • Oracle® Service Parts Planning • Oracle® Strategic Network Optimization + Oracle Manufacturing Operations Center
+ Oracle Landed Cost Management

27
Manufacturing Operations Center At-a-Glance
The Foundation for Continuous
Process Improvement
Automation and Process
Control Systems
ERP Systems
Users
PLC CNC Machines
DCS SCADA Systems
Advanced Process Control
Human Machine Interface
- Prod Sched - Quality - Cost Mgmt …
Manufacturing Operations Data Model
Role-Based Dashboards
Contextual- ization Engine
Corporate BI
Cross-Plant KPIs
Historical Trends
Plant-Specific KPIs
Real-Time Updates
Device-Generated Data
Master Data
Reference and Transaction Data
Production Manager
Plant Mgr / VP of Mfg
MES Shop Floor Communication Drivers
Manual Data
- Output - Status - Process Parameters
Extensible Attribute Framework

28
Role-Based Dashboards and KPIs Deliver Performance Measures by Responsibility
• 55+ KPIs, 90+ measures, reports and alerts out of the box
• Pre-built role-specific dashboards • Graphical views
- Trend charts - Graphs - Tables
• Embedded best-practice calculations and KPIs
• Analytic workflows to drive actions
• Drill-downs into details for root-cause analysis
• Leverages OBIEE+ • Configurable and customizable
- Red-yellow-green indicators
29
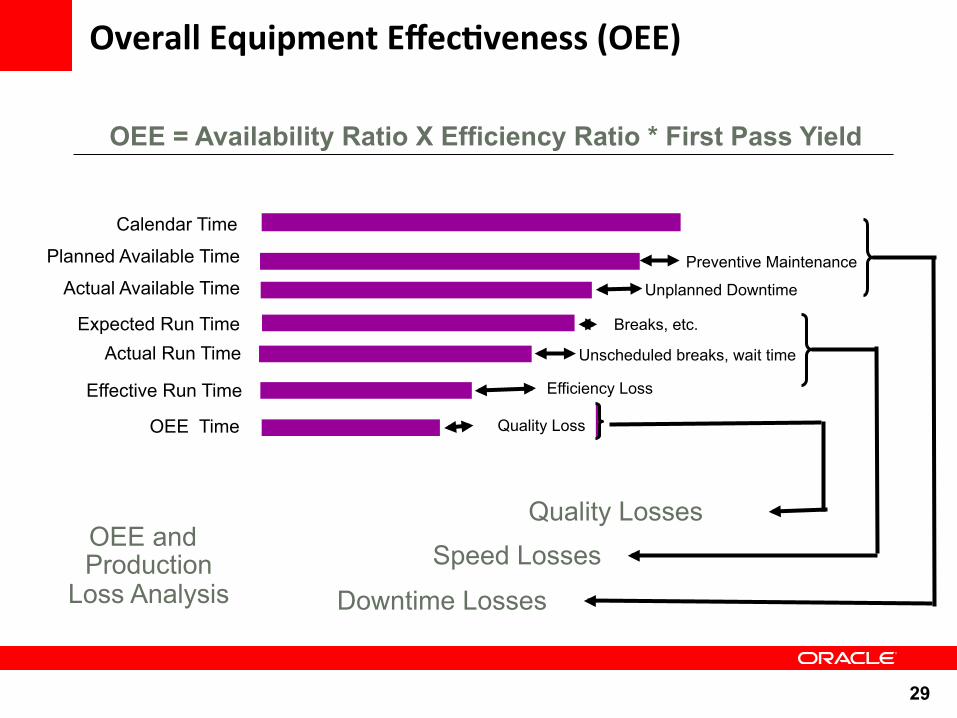
Overall Equipment Effec2veness (OEE)
Calendar Time
Planned Available Time
Actual Available Time
Expected Run Time Actual Run Time
Effective Run Time
OEE Time
Preventive Maintenance
Unplanned Downtime
Breaks, etc.
Unscheduled breaks, wait time
Efficiency Loss
Quality Loss
Quality Losses Speed Losses
Downtime Losses
OEE and Production
Loss Analysis
OEE = Availability Ratio X Efficiency Ratio * First Pass Yield

30
Complete Support for Overall Equipment Effectiveness
1. Monitor Plant OEE 2. Drill down to bottom performing equipment
3. Make sure that it’s a trend not a one-off
4. What’s causing low OEE?
5 a. Low availability- high downtime? 5 a. Low efficiency? 5 a. Low first pass yield?

31
Production Loss Analysis
Effective Production Capacity
Production Loss Analysis Pie Chart
Detailed Production Loss Analysis
Typical scheduled capacity 24 Hrs Effective Capacity
~17.8 Hrs
32
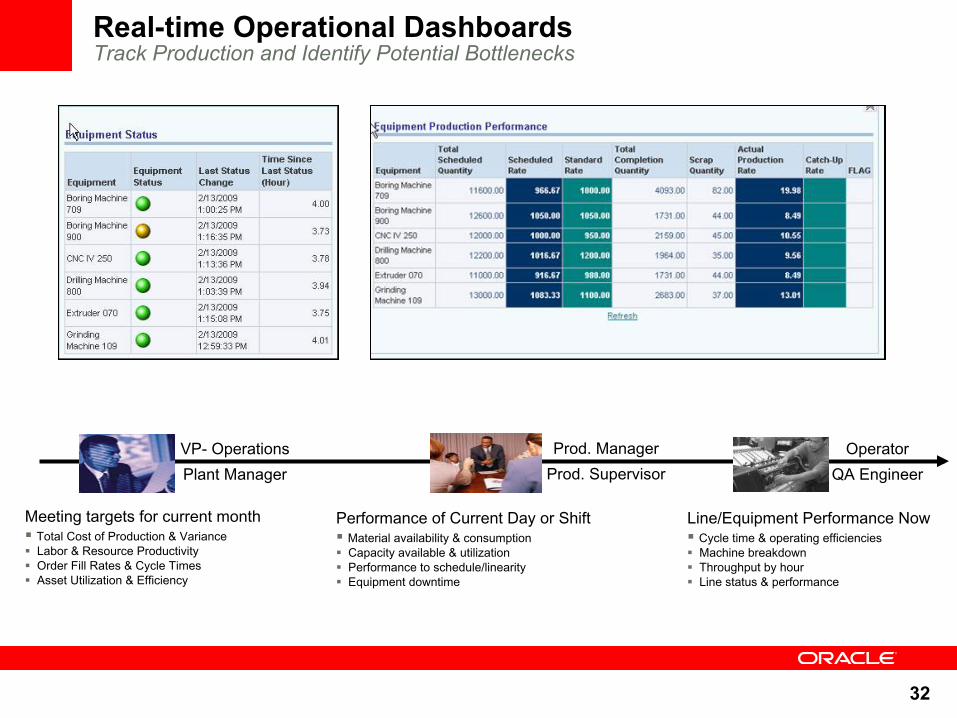
Real-time Operational Dashboards Track Production and Identify Potential Bottlenecks
Meeting targets for current month § Total Cost of Production & Variance § Labor & Resource Productivity § Order Fill Rates & Cycle Times § Asset Utilization & Efficiency
Performance of Current Day or Shift § Material availability & consumption § Capacity available & utilization § Performance to schedule/linearity § Equipment downtime
Line/Equipment Performance Now § Cycle time & operating efficiencies § Machine breakdown § Throughput by hour § Line status & performance
VP- Operations Plant Manager
Prod. Manager Prod. Supervisor
Operator QA Engineer
33
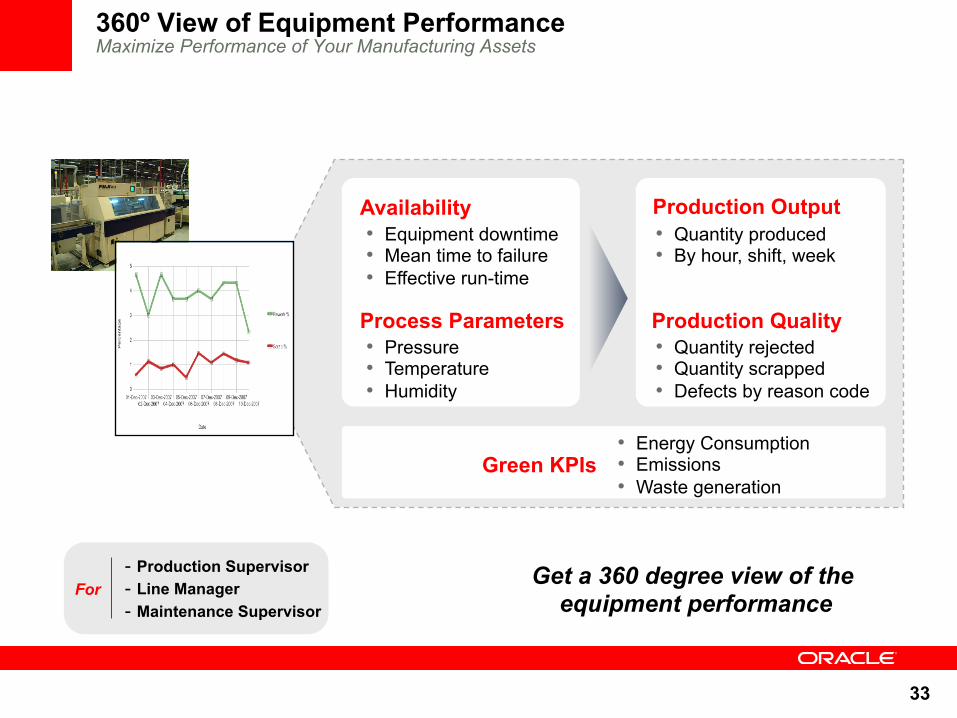
360º View of Equipment Performance Maximize Performance of Your Manufacturing Assets
Get a 360 degree view of the equipment performance
- Production Supervisor - Line Manager - Maintenance Supervisor
For
• Equipment downtime • Mean time to failure • Effective run-time
• Pressure • Temperature • Humidity
• Quantity produced • By hour, shift, week
• Quantity rejected • Quantity scrapped • Defects by reason code
Process Parameters
Availability
Production Quality
Production Output
• Energy Consumption • Emissions • Waste generation
Green KPIs

34
Manufacturing Operations Center
v Real-Time Intelligence for Plant Operations
v Unified Plant Data Repository
v Integration to shop floor systems and equipment
v Supported by Oracle Analytics Platform & Engine
The Foundation for Continuous Process Improvement
Oracle Manufacturing Hub – Key Messages

35
Value Chain Planning Strategy For Release 12.1
• Oracle® Demantra: • Demand Management • Advanced Forecasting and Demand Modeling • Real-Time Sales and Operations Planning • Predictive Trade Planning • Trade Promotion Optimization • Deductions and Settlement Management
• Oracle® Advanced Planning Command Center • Oracle® Advanced Supply Chain Planning • Oracle® Collaborative Planning • Oracle® Demand Signal Repository • Oracle® Global Order Promising • Oracle® Inventory Optimization • Oracle® Production Scheduling • Oracle® Service Parts Planning • Oracle® Strategic Network Optimization + Oracle Manufacturing Operations Center
+ Oracle Landed Cost Management

36
Landed Cost Management Description
• Oracle’s Landed Cost Management application is a new product released on EBS r.12.1.
• Landed Cost Management enables organizations to gain insight into all of the “real” costs associated with acquiring products including broker, terminal, insurance, and transportation fees as well as duties and taxes.
• These costs are initially estimated and then updated with actual amounts as they become known.
• Cost methods and inventory valuations are accurately maintained providing better visibility into an individual product’s profitability and an organization’s outstanding exposure.
• Tightly aligned with Oracle Purchasing, Inventory/Receiving, and Financials.
37
LCM Simple Example Inbound Shipment
Kansas City US Port Vessel Carrier HK Port Shipment to HK
Customer
$100 $2 $3 $20 $3 $2 $140
China Manufacturing Buyer
An additional 40% is added on to the purchase price
$5 Duties
$5 Broker Fees
Total Landed Cost
Issue PO
38
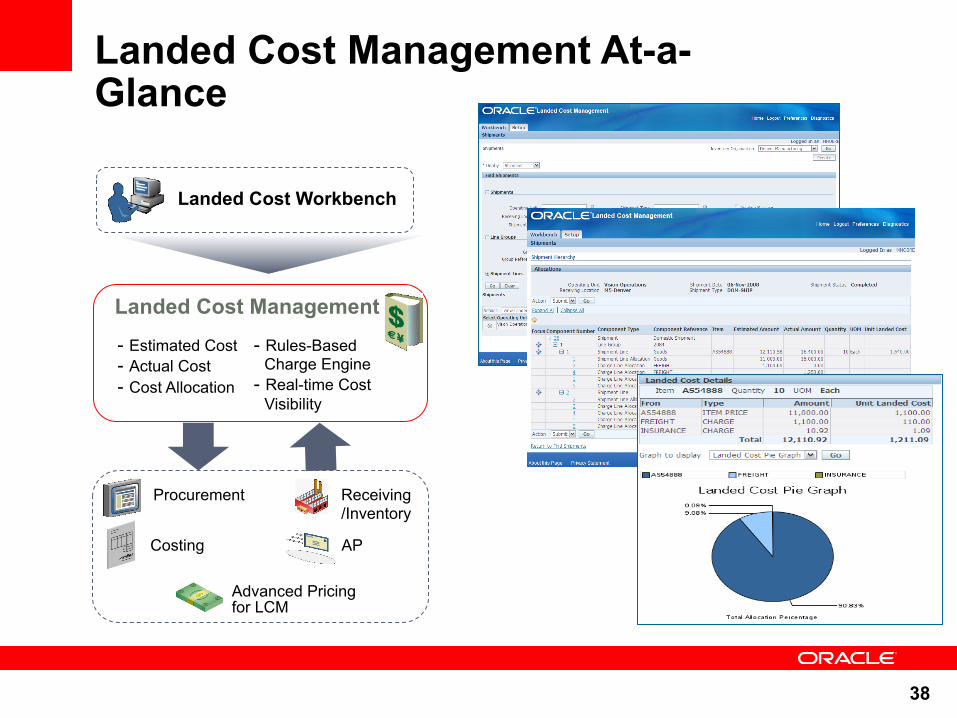
Landed Cost Management At-a-Glance
Procurement
Landed Cost Workbench
- Rules-Based Charge Engine
- Real-time Cost Visibility
- Estimated Cost - Actual Cost - Cost Allocation
Costing
Receiving/Inventory
AP
Landed Cost Management
Advanced Pricing for LCM

39
Landed Cost Management Version 12.1 Flow
Create PO
Receive Goods & Calculate Estimated Landed Cost
Receive Invoices (Trade Documents)
Calculate Actual Landed Cost
Update Inventory Valuation & Accounting
Estimated Landed Cost Actual Landed Cost
Landed Cost Management
Create Inventory Valuation & Accruals
• Landed costs can be initially estimated, either manually or through Oracle Advanced Pricing
• Costs are updated when actual invoices are received • Support for costing at the time of goods receipt as well as
within a “pre-receiving” process
40
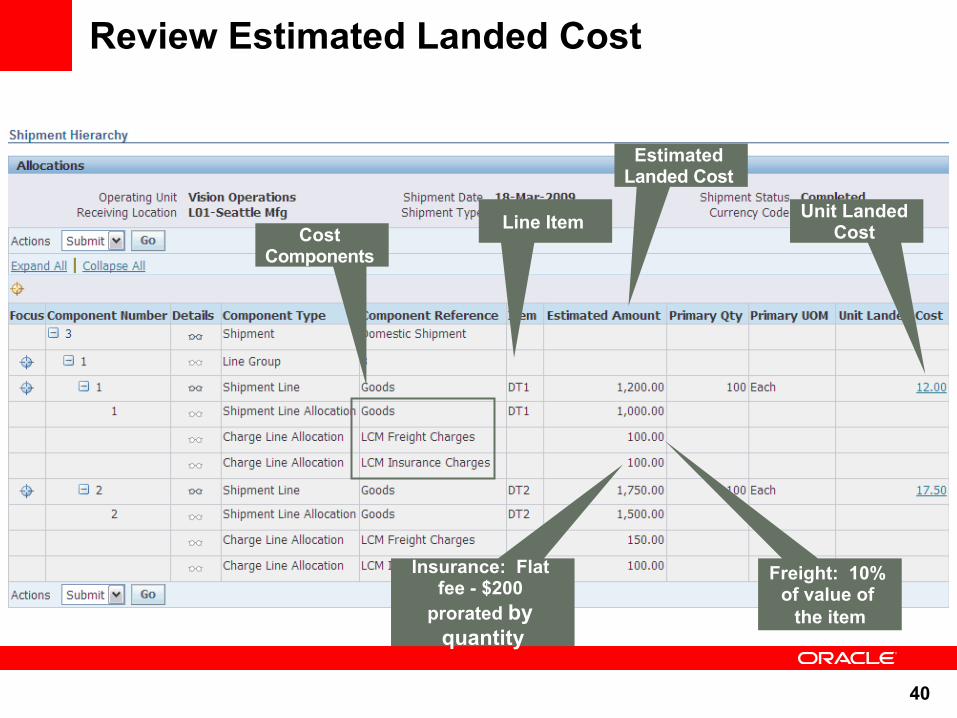
Review Estimated Landed Cost
Line Item
Estimated Landed Cost
Unit Landed Cost Cost
Components
Freight: 10% of value of
the item
Insurance: Flat fee - $200
prorated by quantity

41
Review Actual Landed Cost
The impacts to actual LC from,
Products, Freight and Insurance
Invoices

42
Increase Logistics Efficiency Manage all product cost components with Oracle Landed Cost Management
• WHAT – A flexible, rule-based system for calculating estimated and actual landed costs
• HOW – Integrates seamlessly with Receiving to calculate and pass all estimated or actual landed costs through to Inventory, Costing and Accounting systems
• RESULTS – Optimize product margins, visibility into extended supply chain costs, and decision support for strategic sourcing initiatives
* New Product in 12.1

43
In Summary
Focus on Opportunities to Achieve Rapid Return Today
Invest in Ways to Standardize and Simplify with a Global Business Platform

44
Questions and Answers

45
Top Related