


Languages
Pages
Legal

Smart Grid Technologies Innovation Pathway Study Prepared for the Office of Energy Policy and Systems Analysis
Task Order No. DE-BP0004706
i PREPARED BY ENERGETICS INCORPORATED
Innovation Pathway Study: Smart Grid Technologies
Prepared by Energetics Incorporated1
June 17, 2016
This report was prepared as an account of work sponsored by an agency of the United States
Government. Neither the United States Government nor any agency thereof, nor any of their employees,
makes any warranty, express or implied, or assumes any legal liability or responsibility for the accuracy,
completeness, or usefulness of any information, apparatus, product, or process disclosed, or represents
that its use would not infringe privately owned rights. Reference therein to any specific commercial
product, process, or service by trade name, trademark, manufacturer, or otherwise does not necessarily
constitute or imply its endorsement, recommendation, or favoring by the United States Government or
any agency thereof. The views of the authors do not necessarily reflect those of the United States
Government or any agency thereof.
1Energetics Incorporated, 901 D St SW, Washington, DC 20024;
Smart Grid Technologies Innovation Pathway Study EPSA Task Order No. DE-BP0004706
2 PREPARED BY ENERGETICS INCORPORATED
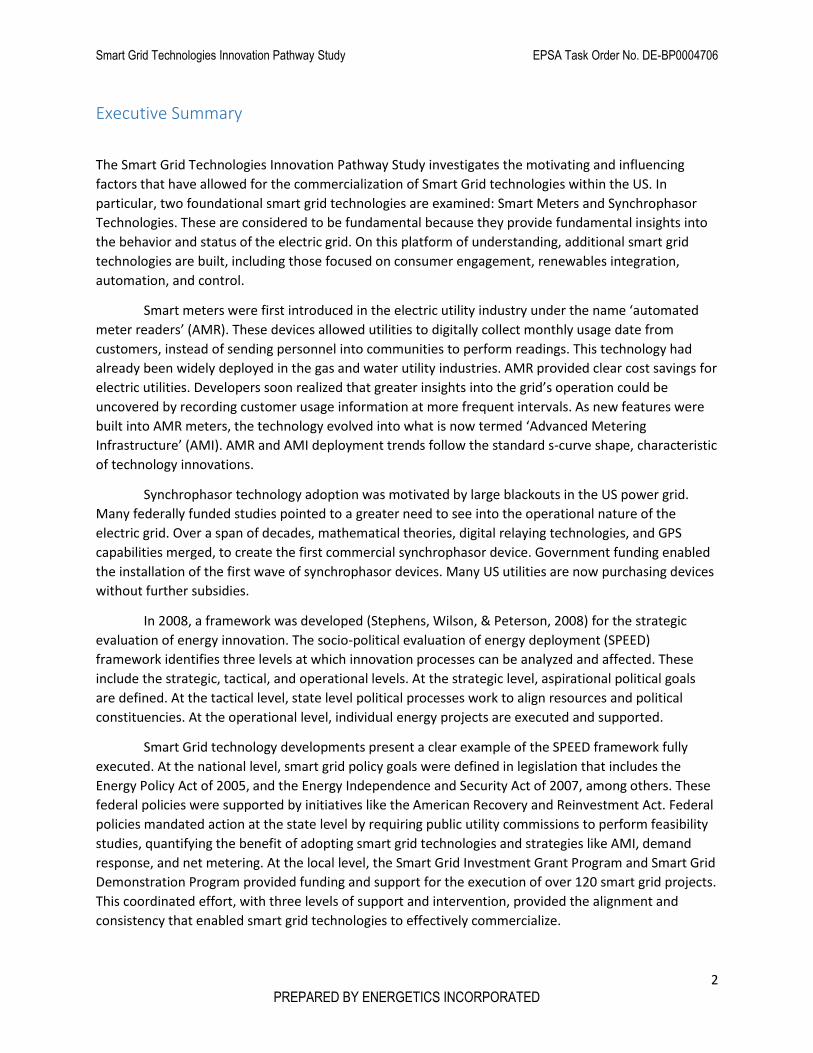
Executive Summary
The Smart Grid Technologies Innovation Pathway Study investigates the motivating and influencing
factors that have allowed for the commercialization of Smart Grid technologies within the US. In
particular, two foundational smart grid technologies are examined: Smart Meters and Synchrophasor
Technologies. These are considered to be fundamental because they provide fundamental insights into
the behavior and status of the electric grid. On this platform of understanding, additional smart grid
technologies are built, including those focused on consumer engagement, renewables integration,
automation, and control.
Smart meters were first introduced in the electric utility industry under the name ‘automated
meter readers’ (AMR). These devices allowed utilities to digitally collect monthly usage date from
customers, instead of sending personnel into communities to perform readings. This technology had
already been widely deployed in the gas and water utility industries. AMR provided clear cost savings for
electric utilities. Developers soon realized that greater insights into the grid’s operation could be
uncovered by recording customer usage information at more frequent intervals. As new features were
built into AMR meters, the technology evolved into what is now termed ‘Advanced Metering
Infrastructure’ (AMI). AMR and AMI deployment trends follow the standard s-curve shape, characteristic
of technology innovations.
Synchrophasor technology adoption was motivated by large blackouts in the US power grid.
Many federally funded studies pointed to a greater need to see into the operational nature of the
electric grid. Over a span of decades, mathematical theories, digital relaying technologies, and GPS
capabilities merged, to create the first commercial synchrophasor device. Government funding enabled
the installation of the first wave of synchrophasor devices. Many US utilities are now purchasing devices
without further subsidies.
In 2008, a framework was developed (Stephens, Wilson, & Peterson, 2008) for the strategic
evaluation of energy innovation. The socio-political evaluation of energy deployment (SPEED)
framework identifies three levels at which innovation processes can be analyzed and affected. These
include the strategic, tactical, and operational levels. At the strategic level, aspirational political goals
are defined. At the tactical level, state level political processes work to align resources and political
constituencies. At the operational level, individual energy projects are executed and supported.
Smart Grid technology developments present a clear example of the SPEED framework fully
executed. At the national level, smart grid policy goals were defined in legislation that includes the
Energy Policy Act of 2005, and the Energy Independence and Security Act of 2007, among others. These
federal policies were supported by initiatives like the American Recovery and Reinvestment Act. Federal
policies mandated action at the state level by requiring public utility commissions to perform feasibility
studies, quantifying the benefit of adopting smart grid technologies and strategies like AMI, demand
response, and net metering. At the local level, the Smart Grid Investment Grant Program and Smart Grid
Demonstration Program provided funding and support for the execution of over 120 smart grid projects.
This coordinated effort, with three levels of support and intervention, provided the alignment and
consistency that enabled smart grid technologies to effectively commercialize.
Smart Grid Technologies Innovation Pathway Study EPSA Task Order No. DE-BP0004706
3 PREPARED BY ENERGETICS INCORPORATED
Contents Executive Summary ................................................................................................................................... 2
Index of Tables .......................................................................................................................................... 4
Index of Figures ......................................................................................................................................... 5
Glossary ..................................................................................................................................................... 6
Introduction .............................................................................................................................................. 7
Background ............................................................................................................................................... 7
Description of Technologies Covered ................................................................................................... 8
Financing Trends Point to Sustained Growth in the Smart Grid Sector .................................................... 8
International Demand for Smart Grid Technologies Will Drive Continued Growth ............................... 11
Analysis of Technology Maturation Trends – Smart Meters .................................................................. 14
Deployment Figures for Smart Meter Networks ................................................................................ 14
Primary Factors Influencing Smart Meter Deployments .................................................................... 17
Analysis of Technology Maturation Trends – Synchrophasors ............................................................... 25
PMU Deployment Curves, Deployment Locations and Data Flows .................................................... 25
Analysis of significant Trends and Events ........................................................................................... 26
Primary Factors and Contributors Impacting Synchrophasor Deployment ........................................ 27
References .............................................................................................................................................. 34
Smart Grid Technologies Innovation Pathway Study EPSA Task Order No. DE-BP0004706
4 PREPARED BY ENERGETICS INCORPORATED
Index of Tables
Table 1: Understanding Different Types of Smart Grid Markets ................................................................................. 12
Table 2: Top 20 ARRA Matching Fund Recipients for Smart Meter Projects ............................................................... 23
Table 3: Mergers and Acquisitions Impacting Smart Meter Market Leaders .............................................................. 23
Table 4: Standards Relevant to Synchrophasor Deployments..................................................................................... 31
Smart Grid Technologies Innovation Pathway Study EPSA Task Order No. DE-BP0004706
5 PREPARED BY ENERGETICS INCORPORATED
Index of Figures
Figure 1: Global Smart Grid Investment by Industry Segment (2010 – 2015) ............................................................... 9
Figure 2: Global Smart Grid Investment by Region (2010 – 2015) ................................................................................ 9
Figure 3: Public Markets Investment in Digital Energy Companies (2004 – 2015) ...................................................... 10
Figure 4: VC/PE Investment in Digital Energy Companies (2004 - 2015) ..................................................................... 10
Figure 5: Digital Energy M&A Deals (2004 - 2015) ...................................................................................................... 11
Figure 6: Smart Grid Export Market, Countries by Rank ............................................................................................. 12
Figure 7: BMI Power SEctor Risk/Reward Index .......................................................................................................... 13
Figure 8: Evolution of Smart Meter Capabilities .......................................................................................................... 14
Figure 9: Cumulative AMR Units Shipped (1995 - 2001) ............................................................................................. 15
Figure 10: Installed Base of Smart Meters (2007 - 2013) ............................................................................................ 16
Figure 11: An Example of Successive Innovation S-Curves .......................................................................................... 16
Figure 12: Advanced Metering Legislation by State (2011) ......................................................................................... 17
Figure 13: Demand Response Legislation by State (2011)........................................................................................... 18
Figure 14: Net Metering Legislation by State (2011) ................................................................................................... 19
Figure 15: AMI Customer Density by State (2013) ...................................................................................................... 20
Figure 16: Cumulative Smart Meter Deployments and SGIG Contribution ................................................................. 21
Figure 17: Market Share for US Smart Meter Suppliers .............................................................................................. 22
Figure 18: Market Share for US AMI Product Supplers ............................................................................................... 22
Figure 19: Total SGIG Synchrophasor Deployments, and NERC regions ..................................................................... 25
Figure 20: Location of PMUs and the Flow of Related Information ............................................................................ 26
Smart Grid Technologies Innovation Pathway Study EPSA Task Order No. DE-BP0004706
6 PREPARED BY ENERGETICS INCORPORATED
Glossary
AEP – American Electric Power NERC – North American Electric Reliability Council
AMI – Advanced Metering Infrastructure NPCC – Northeast Power Coordinating Council
AMR – Automated Meter Reading NYPA – New York Power Authority
ARRA – American Recovery and Reinvestment Act PDC – Phasor Data Concentrator
BPA – Bonneville Power Association PE – Private Equity
CERTS – Consortium for Electric Reliability Technology Solutions
PNNL – Pacific Northwest National Laboratory
DOE – U.S. Department of Energy PMU – Phasor Measurement Unit
DP – Dynamic Pricing PURPA – Public Utility Regulatory Policies Act
DSM – Demand Side Management RD&D – Research Development & Deployment
EIA – Energy Information Administration ROCOF – Rate of Change of Frequency
EIPP – Eastern Interconnection Phasor Project SCADA – Supervisory Control and Data Acquisition
EPAct – Energy Policy Act of 2005 SCDFT – Symmetrical Component Discrete Fourier Transform
EE – Energy Efficiency SCDR – Symmetrical Component Distance Relay
GE – General Electric SGIG – Smart Grid Investment Grant
GPS – Global Positioning Seattleite T&D – Transmission and Distribution
IEEE – Institute of Electrical and Electronics Engineers
TCP/IP – Transmission Control Protocol/Internet Protocol
IEC – International Electrotechnical Commission TVA – Tennessee Valley Authority
ISO – International Organization for Standardization
VC – Venture Capital
LAN – Local Area Network WAMS – Wide Area Monitoring System
M&A – Merger and Acquisition WECC – Western Electricity Coordinating Council
NASPI – North American SynchroPhasor Initiative WAPA – Western Area Power Associatio

Smart Grid Technologies Innovation Pathway Study EPSA Task Order No. DE-BP0004706
7 PREPARED BY ENERGETICS INCORPORATED
Introduction
This paper is part of a larger study that seeks to identify shared attributes and common causal factors
among the pathways of technology innovation in the energy sector. The purpose of this study is to
contribute useful analysis of historical experience to the Department of Energy’s ongoing effort in
energy technology innovation. This whitepaper provides data research and preliminary analysis of the
development of smart grid technologies, including the deployment of advanced electric metering
solutions, and the deployment of synchrophasor technologies.
This series of energy technology innovation studies is being conducted in order to distill lessons that can
be generalized to other energy technologies, especially those currently in early stages of development
or deployment. This paper is not intended to address the challenges and opportunities faced by any
technology in particular, except by providing synoptic observations about the interactions of
government agencies, academia, and the private sector as they relate to the development and
deployment of a new energy technology. Additional papers in this series address technologies including
nuclear power plants, renewable energy technologies, and a literature review of innovation studies.
Background
The Smart Grid is a concept, based on the idea of incorporating knowledge into the management of the
electric grid. Much of the physical infrastructure that comprises the grid has seen little change in the last
100 years. During this same time period, extraordinary changes have revolutionized the industries of
computing and telecommunications. There exists an opportunity to integrate technologies, tools, and
techniques, to enhance the US electric grid in the following ways (Litos Strategic Communications,
2008):
• Ensuring its reliability to degrees never before possible.
• Maintaining its affordability.
• Reinforcing our global competitiveness.
• Fully accommodating renewable and traditional energy sources.
• Potentially reducing our carbon footprint.
• Introducing advancements and efficiencies yet to be envisioned.
This is the promise of the smart grid. A host of technologies have been developed to achieve the goals of
the Smart Grid. Some of these technologies include:
Plug-in electric vehicles and intelligent charging control systems
Zero-net energy commercial buildings
Superconducting electrical cables
Energy storage
Advanced sensors
Visualization technologies
Advanced metering infrastructure
Synchrophasors and phasor measurement units
Dynamic pricing and demand-side management
Smart Grid Technologies Innovation Pathway Study EPSA Task Order No. DE-BP0004706
8 PREPARED BY ENERGETICS INCORPORATED
Description of Technologies Covered
Smart Grid technologies have been recently introduced to the US electric grid. In recent years, many
technological advances have been made, to enhance the planning and operation of the electric grid,
through measurement, analytics, and automation. Many of these technologies are in different stages of
development and commercial success. This report describes the development and deployment of
advanced electrical metering technologies by US electric power utilities, and their adoption of
synchrophasor technologies. These two technologies are considered to fundamental to the deployment
of other Smart Grid technologies and concepts. For example, the ability to frequently and accurately
measure customer electrical usage underpins an electric utility’s ability to offer hourly pricing for
electrical service. The use of synchrophasor technologies allow utilities to measure the state and health
of the grid over vast geographies, in near real-time. This ability to measure is a pre-requisite to creating
visualization tools based on measured data.
Advanced metering infrastructure (AMI) is an integrated system of smart meters, communications
networks, and data management systems that enables two-way communication between utilities and
customers (DOE, Advanced Metering Infrastructure and Customer Systems, 2015). Customer systems
include in-home displays, home area networks, energy management systems, and other customer-side-
of-the-meter equipment that enable smart grid functions in residential, commercial, and industrial
facilities (DOE, Advanced Metering Infrastructure and Customer Systems, 2015).
A synchrophasor is a sophisticated monitoring device that can measure the instantaneous voltage,
current and frequency at specific locations on the grid (DOE, Synchrophasor Applications in Transmission
Systems, 2014). Synchrophasors have been commonly given the following definition:
“Synchrophasors are time-synchronized numbers that represent both the magnitude and phase angle of
the sine waves found in electricity, and are time-synchronized for accuracy. They are measured by high-
speed monitors called Phasor Measurement Units (PMUs) that are 100 times faster than SCADA. PMU
measurements record grid conditions with great accuracy and offer insight into grid stability or stress.
Synchrophasor technology is used for real-time operations and off-line engineering analyses to improve
grid reliability and efficiency and lower operating costs” (DOE, Synchrophasor Applications in
Transmission Systems, 2014).
AMI and synchrophasors are two defining members of the Smart Grid technology suite. This paper
describes the key historical events, technological milestones, commercial deployments, and financial
investments that characterize the growth and success of these two technology areas. The paper
concludes by then describing overarching themes and generalizable takeaways learned from
investigating the innovation processes underlying the commercial success of these Smart Grid
technologies.
Financing Trends Point to Sustained Growth in the Smart Grid Sector
Investments in smart grid technology have seen consistent growth in recent years, indicating a field that
is still maturing. Significant investments in the US, including those funded through the DOE Smart Grid
Investment Grant and Smart Grid Demonstration Project programs, have built confidence in new
technologies. These technologies are starting to see commercial growth in international markets. The
two figures that follow display investment information by technology type, and by geographic region. As
Smart Grid Technologies Innovation Pathway Study EPSA Task Order No. DE-BP0004706
9 PREPARED BY ENERGETICS INCORPORATED
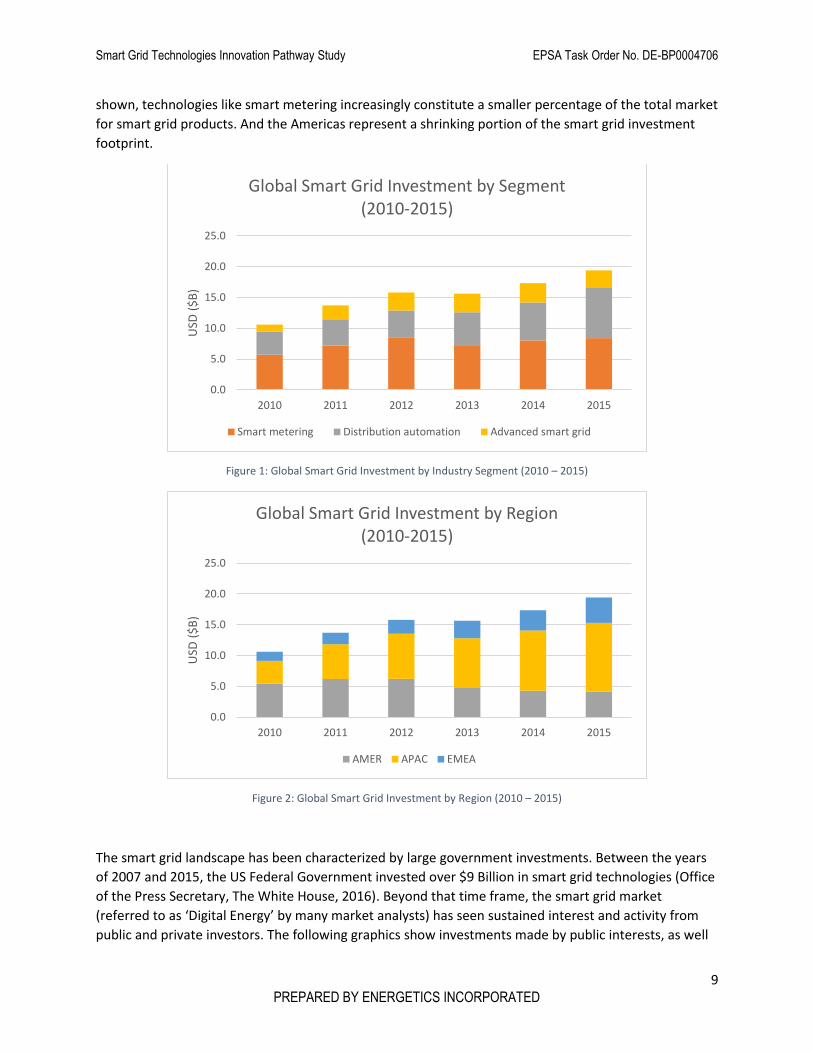
shown, technologies like smart metering increasingly constitute a smaller percentage of the total market
for smart grid products. And the Americas represent a shrinking portion of the smart grid investment
footprint.
Figure 1: Global Smart Grid Investment by Industry Segment (2010 – 2015)
Figure 2: Global Smart Grid Investment by Region (2010 – 2015)
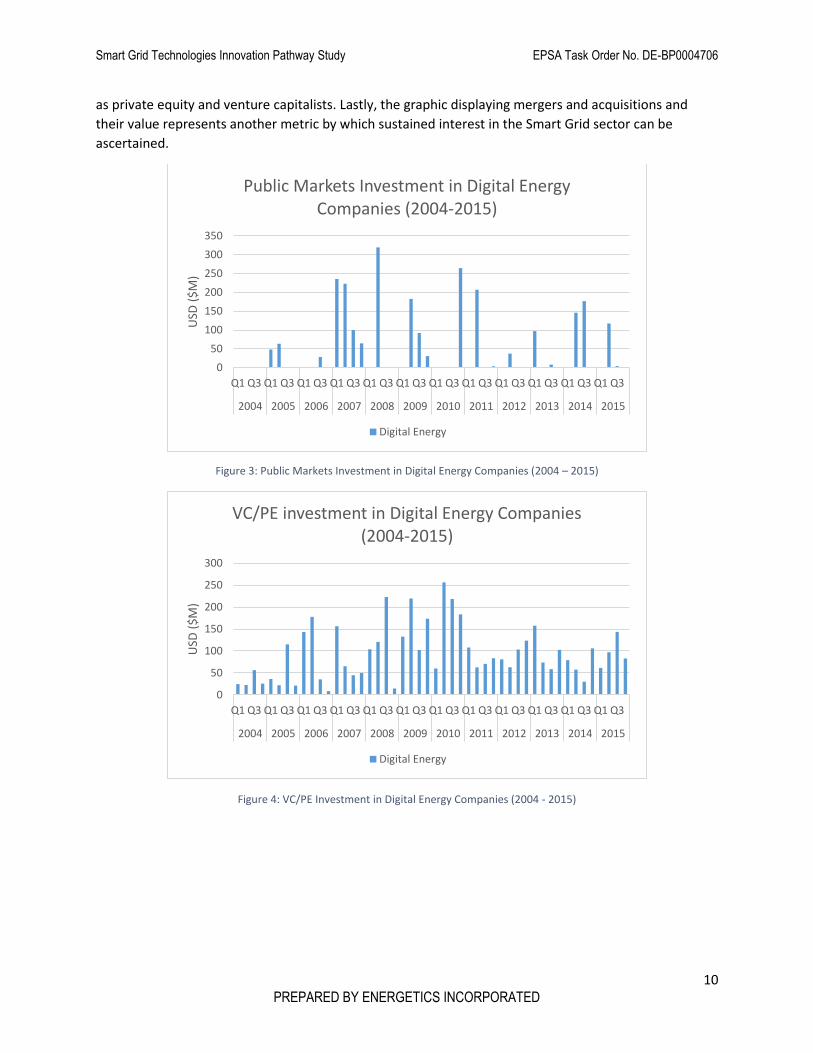
The smart grid landscape has been characterized by large government investments. Between the years
of 2007 and 2015, the US Federal Government invested over $9 Billion in smart grid technologies (Office
of the Press Secretary, The White House, 2016). Beyond that time frame, the smart grid market
(referred to as ‘Digital Energy’ by many market analysts) has seen sustained interest and activity from
public and private investors. The following graphics show investments made by public interests, as well
0.0
5.0
10.0
15.0
20.0
25.0
2010 2011 2012 2013 2014 2015
USD
($
B)
Global Smart Grid Investment by Segment(2010-2015)
Smart metering Distribution automation Advanced smart grid
0.0
5.0
10.0
15.0
20.0
25.0
2010 2011 2012 2013 2014 2015
USD
($
B)
Global Smart Grid Investment by Region(2010-2015)
AMER APAC EMEA
Smart Grid Technologies Innovation Pathway Study EPSA Task Order No. DE-BP0004706
10 PREPARED BY ENERGETICS INCORPORATED
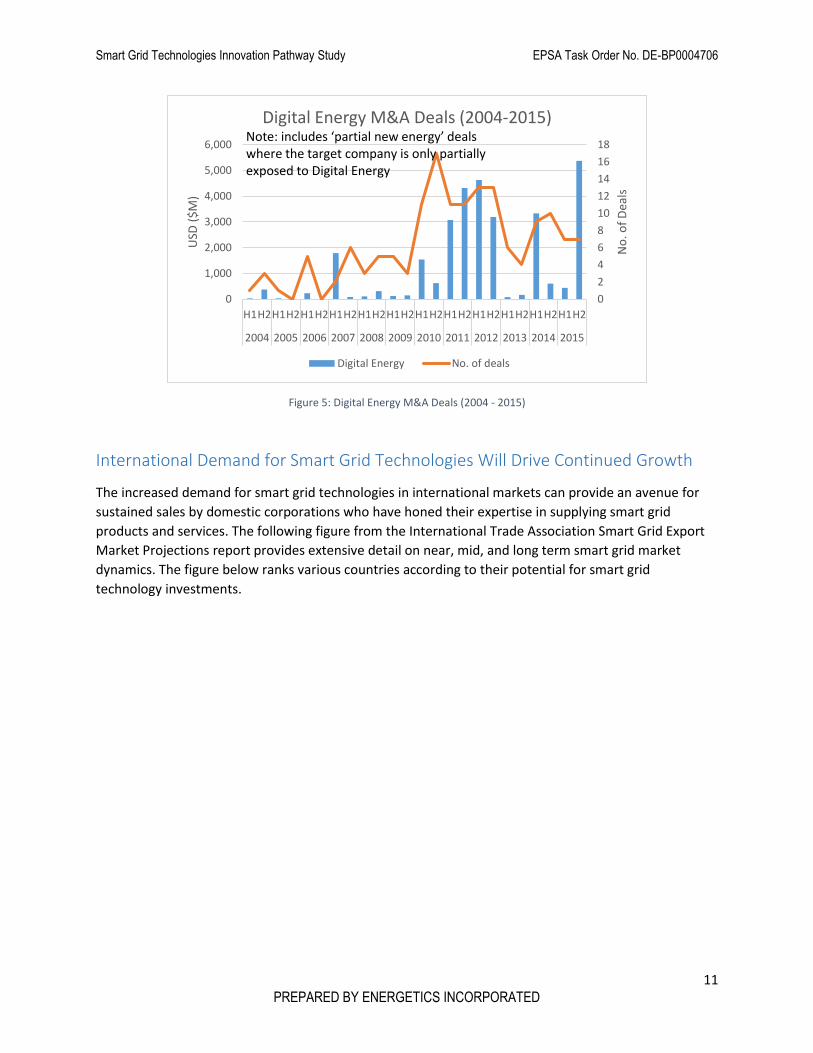
as private equity and venture capitalists. Lastly, the graphic displaying mergers and acquisitions and
their value represents another metric by which sustained interest in the Smart Grid sector can be
ascertained.
Figure 3: Public Markets Investment in Digital Energy Companies (2004 – 2015)
Figure 4: VC/PE Investment in Digital Energy Companies (2004 - 2015)
0
50
100
150
200
250
300
350
Q1 Q3 Q1 Q3 Q1 Q3 Q1 Q3 Q1 Q3 Q1 Q3 Q1 Q3 Q1 Q3 Q1 Q3 Q1 Q3 Q1 Q3 Q1 Q3
2004 2005 2006 2007 2008 2009 2010 2011 2012 2013 2014 2015
USD
($
M)
Public Markets Investment in Digital Energy Companies (2004-2015)
Digital Energy
0
50
100
150
200
250
300
Q1 Q3 Q1 Q3 Q1 Q3 Q1 Q3 Q1 Q3 Q1 Q3 Q1 Q3 Q1 Q3 Q1 Q3 Q1 Q3 Q1 Q3 Q1 Q3
2004 2005 2006 2007 2008 2009 2010 2011 2012 2013 2014 2015
USD
($
M)
VC/PE investment in Digital Energy Companies (2004-2015)
Digital Energy
Smart Grid Technologies Innovation Pathway Study EPSA Task Order No. DE-BP0004706
11 PREPARED BY ENERGETICS INCORPORATED
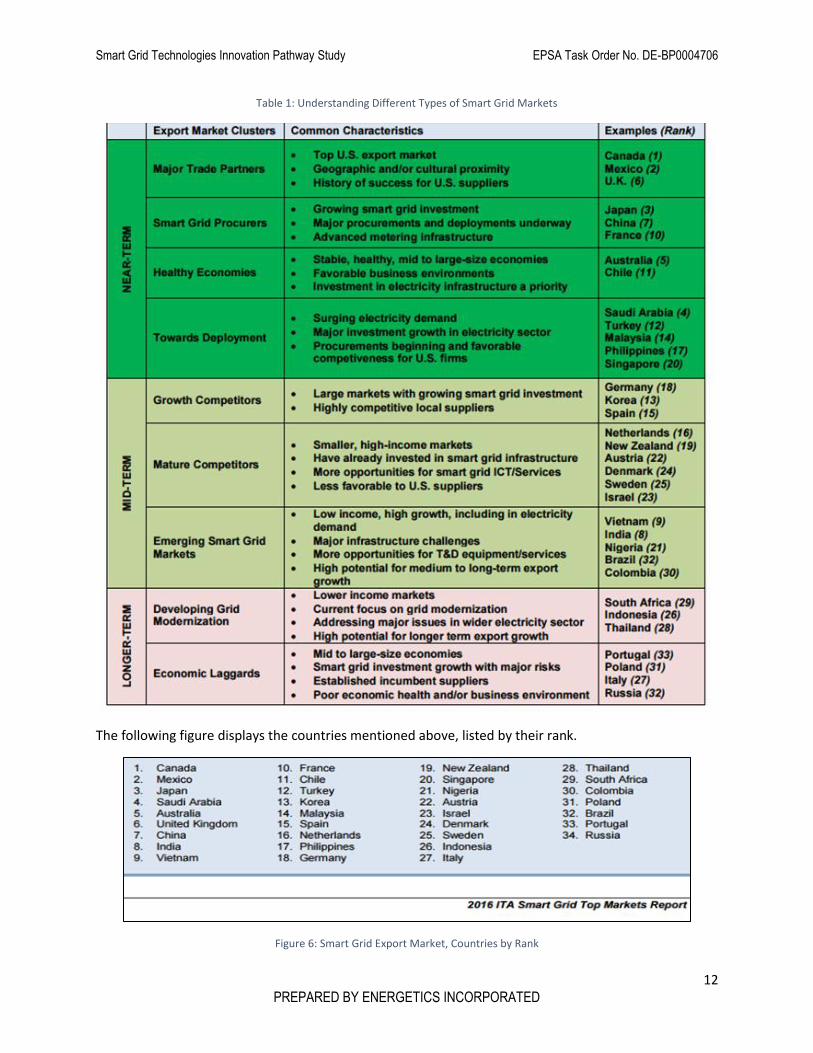
Figure 5: Digital Energy M&A Deals (2004 - 2015)
International Demand for Smart Grid Technologies Will Drive Continued Growth
The increased demand for smart grid technologies in international markets can provide an avenue for
sustained sales by domestic corporations who have honed their expertise in supplying smart grid
products and services. The following figure from the International Trade Association Smart Grid Export
Market Projections report provides extensive detail on near, mid, and long term smart grid market
dynamics. The figure below ranks various countries according to their potential for smart grid
technology investments.
0
2
4
6
8
10
12
14
16
18
0
1,000
2,000
3,000
4,000
5,000
6,000
H1H2H1H2H1H2H1H2H1H2H1H2H1H2H1H2H1H2H1H2H1H2H1H2
2004 2005 2006 2007 2008 2009 2010 2011 2012 2013 2014 2015
No
. of
Dea
ls
USD
($
M)
Digital Energy M&A Deals (2004-2015)
Digital Energy No. of deals
Note: includes ‘partial new energy’ dealswhere the target company is only partiallyexposed to Digital Energy
Smart Grid Technologies Innovation Pathway Study EPSA Task Order No. DE-BP0004706
12 PREPARED BY ENERGETICS INCORPORATED
Table 1: Understanding Different Types of Smart Grid Markets
The following figure displays the countries mentioned above, listed by their rank.
Figure 6: Smart Grid Export Market, Countries by Rank
Smart Grid Technologies Innovation Pathway Study EPSA Task Order No. DE-BP0004706
13 PREPARED BY ENERGETICS INCORPORATED
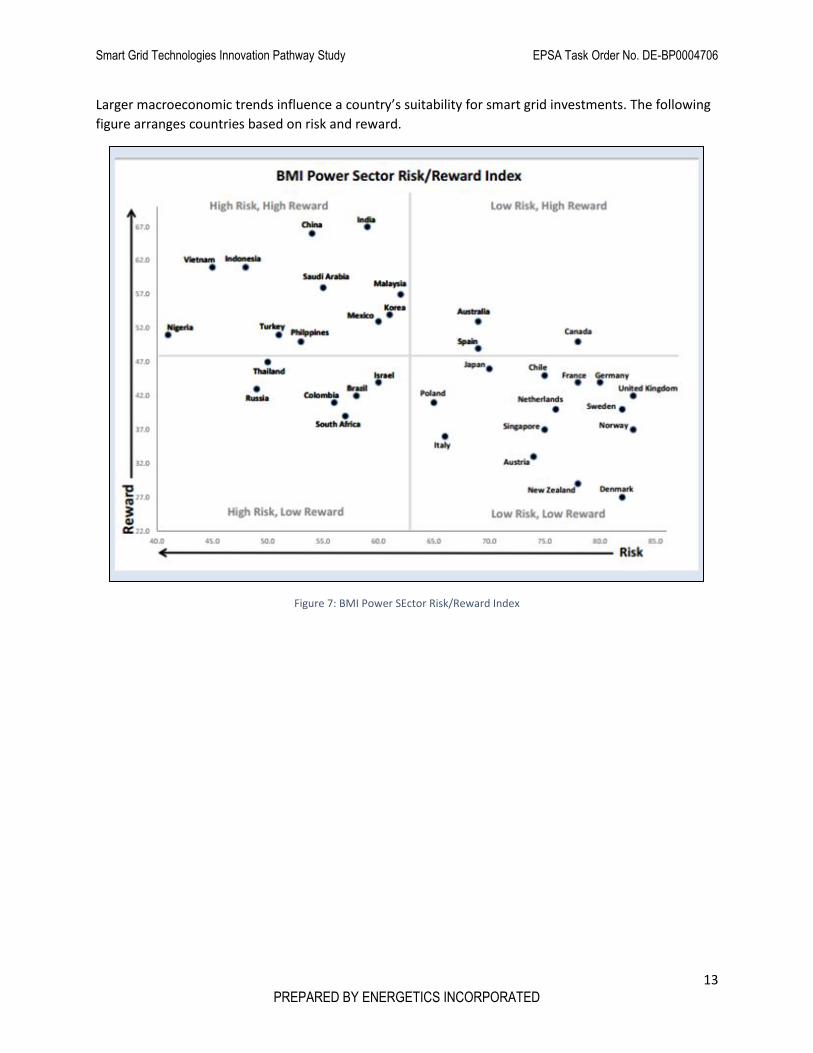
Larger macroeconomic trends influence a country’s suitability for smart grid investments. The following
figure arranges countries based on risk and reward.
Figure 7: BMI Power SEctor Risk/Reward Index
Smart Grid Technologies Innovation Pathway Study EPSA Task Order No. DE-BP0004706
14 PREPARED BY ENERGETICS INCORPORATED
Analysis of Technology Maturation Trends – Smart Meters
Deployments of advanced metering systems by US electric utilities were first recorded by EIA in 2007.
Automated meter reading (AMR) technology helped utilities to reduce costs by eliminating the need to
have a technician physically visit and take readings from every customer meter. Automated meter
reading opened the door for the communication of in-field, digital information back to the utility.
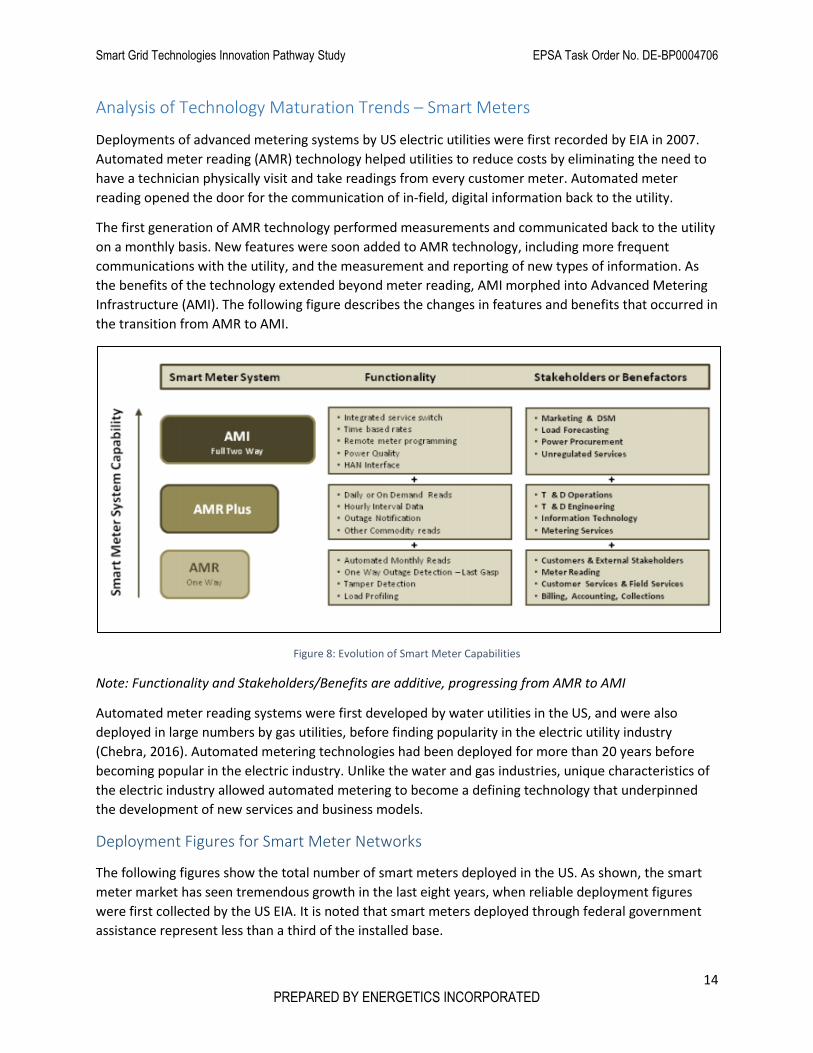
The first generation of AMR technology performed measurements and communicated back to the utility
on a monthly basis. New features were soon added to AMR technology, including more frequent
communications with the utility, and the measurement and reporting of new types of information. As
the benefits of the technology extended beyond meter reading, AMI morphed into Advanced Metering
Infrastructure (AMI). The following figure describes the changes in features and benefits that occurred in
the transition from AMR to AMI.
Figure 8: Evolution of Smart Meter Capabilities
Note: Functionality and Stakeholders/Benefits are additive, progressing from AMR to AMI
Automated meter reading systems were first developed by water utilities in the US, and were also
deployed in large numbers by gas utilities, before finding popularity in the electric utility industry
(Chebra, 2016). Automated metering technologies had been deployed for more than 20 years before
becoming popular in the electric industry. Unlike the water and gas industries, unique characteristics of
the electric industry allowed automated metering to become a defining technology that underpinned
the development of new services and business models.
Deployment Figures for Smart Meter Networks
The following figures show the total number of smart meters deployed in the US. As shown, the smart
meter market has seen tremendous growth in the last eight years, when reliable deployment figures
were first collected by the US EIA. It is noted that smart meters deployed through federal government
assistance represent less than a third of the installed base.
Smart Grid Technologies Innovation Pathway Study EPSA Task Order No. DE-BP0004706
15 PREPARED BY ENERGETICS INCORPORATED
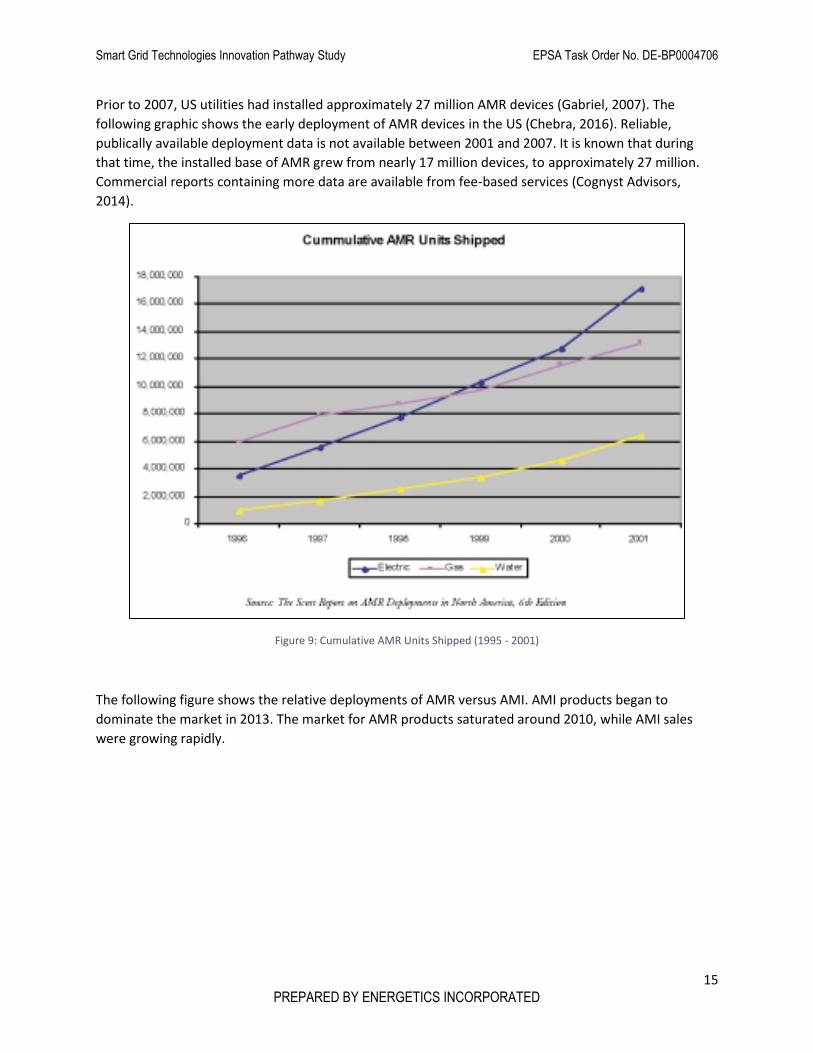
Prior to 2007, US utilities had installed approximately 27 million AMR devices (Gabriel, 2007). The
following graphic shows the early deployment of AMR devices in the US (Chebra, 2016). Reliable,
publically available deployment data is not available between 2001 and 2007. It is known that during
that time, the installed base of AMR grew from nearly 17 million devices, to approximately 27 million.
Commercial reports containing more data are available from fee-based services (Cognyst Advisors,
2014).
Figure 9: Cumulative AMR Units Shipped (1995 - 2001)
The following figure shows the relative deployments of AMR versus AMI. AMI products began to
dominate the market in 2013. The market for AMR products saturated around 2010, while AMI sales
were growing rapidly.

Smart Grid Technologies Innovation Pathway Study EPSA Task Order No. DE-BP0004706
16 PREPARED BY ENERGETICS INCORPORATED
Figure 10: Installed Base of Smart Meters (2007 - 2013)
When one compares the AMI/AMR curve above to the standard innovation s-curve below, one can
clearly see the trend of diminished returns for AMR, as AMI grew in popularity. The APPA noted in their
2007 publication that utility metering was following an s-curve pattern (Gabriel, 2007). Their reference
was related to the displacement of traditional, electromechanical meters with solid-state AMR devices.
Not long after, another s-curve can be seen, as AMR is displaced by AMI.
Figure 11: An Example of Successive Innovation S-Curves
Smart Grid Technologies Innovation Pathway Study EPSA Task Order No. DE-BP0004706
17 PREPARED BY ENERGETICS INCORPORATED
Primary Factors Influencing Smart Meter Deployments
Smart Meters Offered Significant Cost Savings Over Traditional Utility Metering Strategies
The advent of automated meter reading technology prevented utilities from sending service personnel
to every metered customer location on a monthly basis. This alone provided utilities with significant
savings. In addition, many utilities have integrated their smart meter data into outage management
systems, allowing utilities to identify power outages on distribution networks, without sending crews to
search physical areas. Utilities can utilize smart meters to perform trouble shooting remotely, allowing
repairs to be conducted more efficiently. In addition, utilities can use smart meters to remotely connect
and disconnect customer service, eliminating fees for customers and expediting service requests.
State and Federal Policies Encouraged Utilities to Investigate the Benefits of Smart Meters
The Energy Policy Act of 2005 required all state commissions to analyze the feasibility of deploying smart
meters within their jurisdiction, and provide a report of their findings within 18 months (Gabriel, 2007).
PURPA Standard 14, enacted in the 2005 Energy Policy Act (EPACT), consists of the “Time-Based
Metering and Communications” standards (EIA, 2011). This standard requires an electric utility provide a
time-based rate schedule to consumers and enable the electric consumer to manage energy use and
costs through smart meters. The passing of EPACT and PURPA Standard 14 did not include penalties for
states or utilities that chose not to comply. Although some states chose not to enact policies, every state
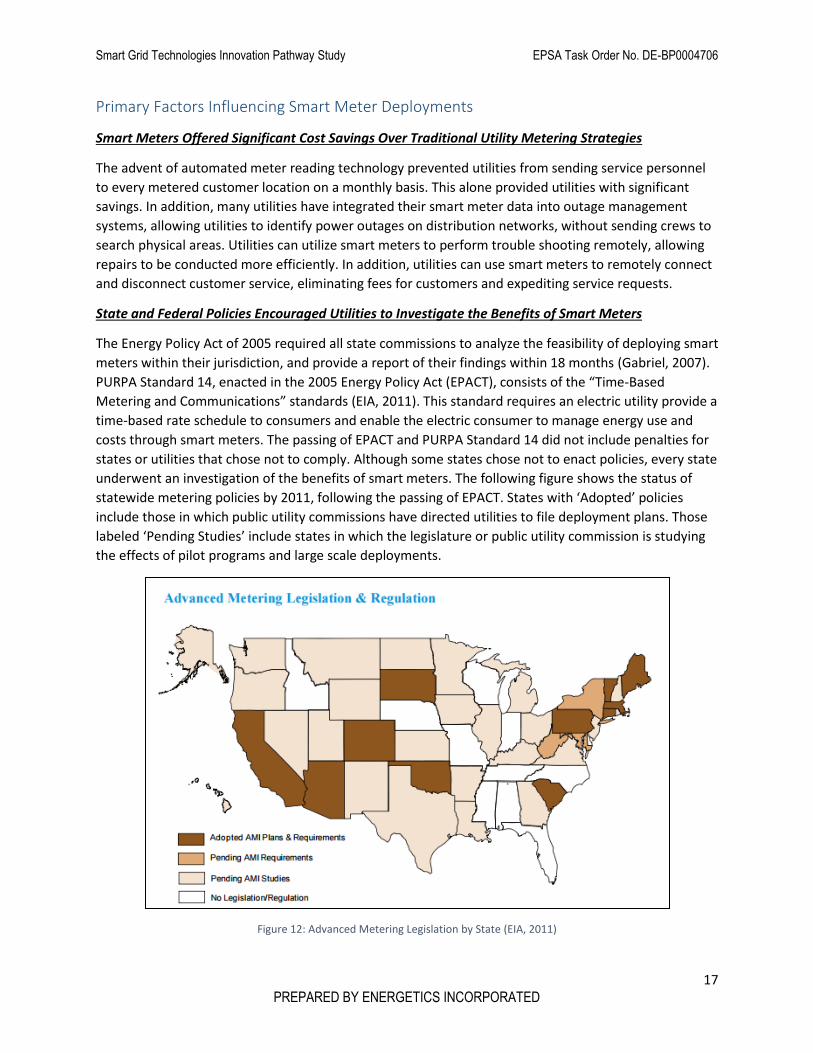
underwent an investigation of the benefits of smart meters. The following figure shows the status of
statewide metering policies by 2011, following the passing of EPACT. States with ‘Adopted’ policies
include those in which public utility commissions have directed utilities to file deployment plans. Those
labeled ‘Pending Studies’ include states in which the legislature or public utility commission is studying
the effects of pilot programs and large scale deployments.
Figure 12: Advanced Metering Legislation by State (EIA, 2011)
Smart Grid Technologies Innovation Pathway Study EPSA Task Order No. DE-BP0004706
18 PREPARED BY ENERGETICS INCORPORATED
Smart Meters Were a Necessary Pre-requisite to Offering New Services to Customers
In efforts to increase operational effectiveness, decrease peak demand, and integrate renewable
resources, utilities have introduced special programs that involve consumer participation. Some of these
programs include demand response, time-of-day pricing, and net metering. Given the past paradigm of
manually metering customer usage on a monthly basis, all of the special programs mentioned would
have been impossible to implement. High accuracy and high resolution customer consumption data are
needed for implementation. Therefore, smart meters were seen as a prerequisite to initiating additional
programs, which each provided unique incentives for rate payers and asset owners.
A 2014 Edison foundation report highlighted the growing prevalence of smart pricing programs in the US
(Institute for Electric Innovation, 2014). The report noted that over 8 million smart metered customers
in California, Delaware, the District of Columbia, Maryland, and Oklahoma, were eligible to participate in
programs which incentivized reductions in electrical demand during peak hours. Smart pricing programs
include Baltimore Gas & Electric’s Smart Energy Rewards, Oklahoma Gas & Electric’s SmartHours, Pepco
and Delmarva Power’s Peak Energy Savings Credit, San Diego Gas & Electric’s Reduce Your Use, and
Southern California Edison’s Save Power Day (Institute for Electric Innovation, 2014).
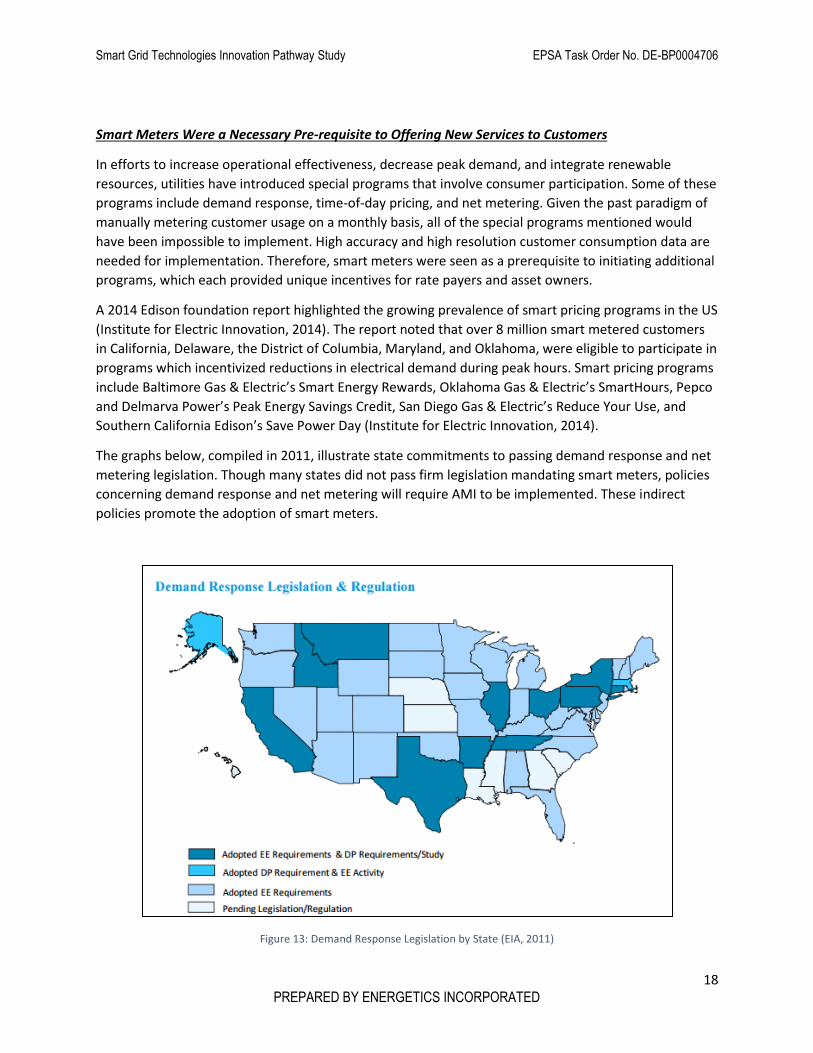
The graphs below, compiled in 2011, illustrate state commitments to passing demand response and net
metering legislation. Though many states did not pass firm legislation mandating smart meters, policies
concerning demand response and net metering will require AMI to be implemented. These indirect
policies promote the adoption of smart meters.
Figure 13: Demand Response Legislation by State (EIA, 2011)
Smart Grid Technologies Innovation Pathway Study EPSA Task Order No. DE-BP0004706
19 PREPARED BY ENERGETICS INCORPORATED
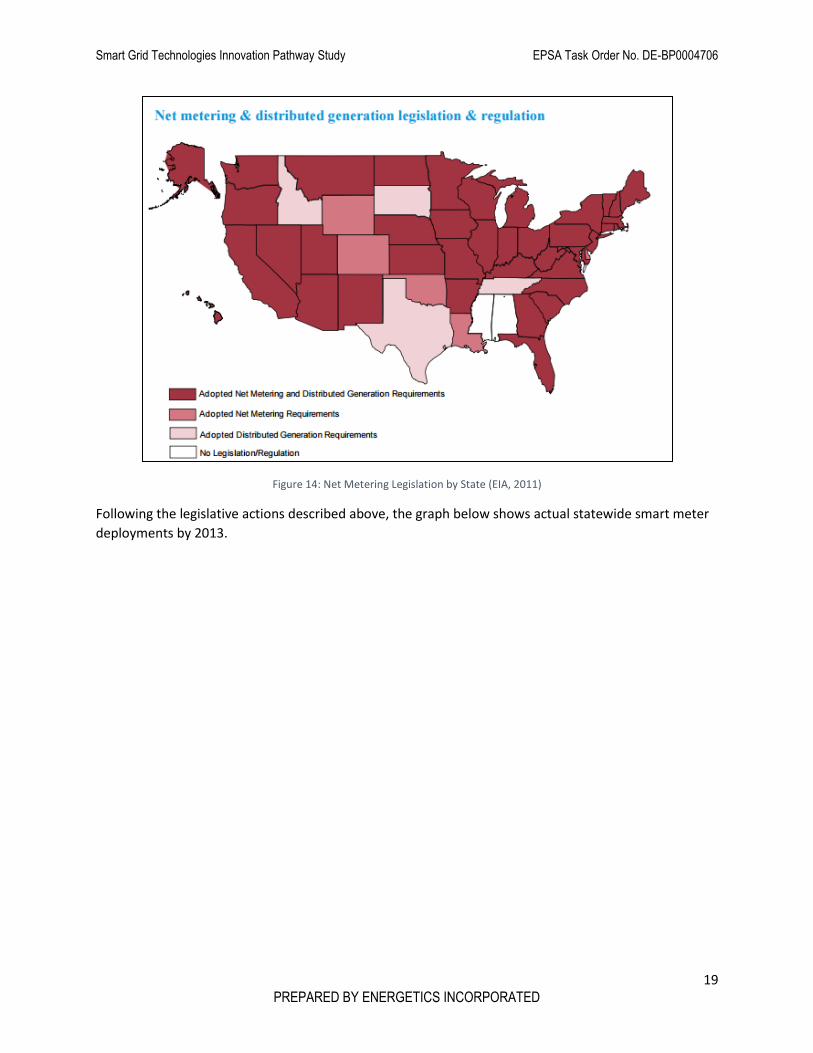
Figure 14: Net Metering Legislation by State (EIA, 2011)
Following the legislative actions described above, the graph below shows actual statewide smart meter
deployments by 2013.
Smart Grid Technologies Innovation Pathway Study EPSA Task Order No. DE-BP0004706
20 PREPARED BY ENERGETICS INCORPORATED
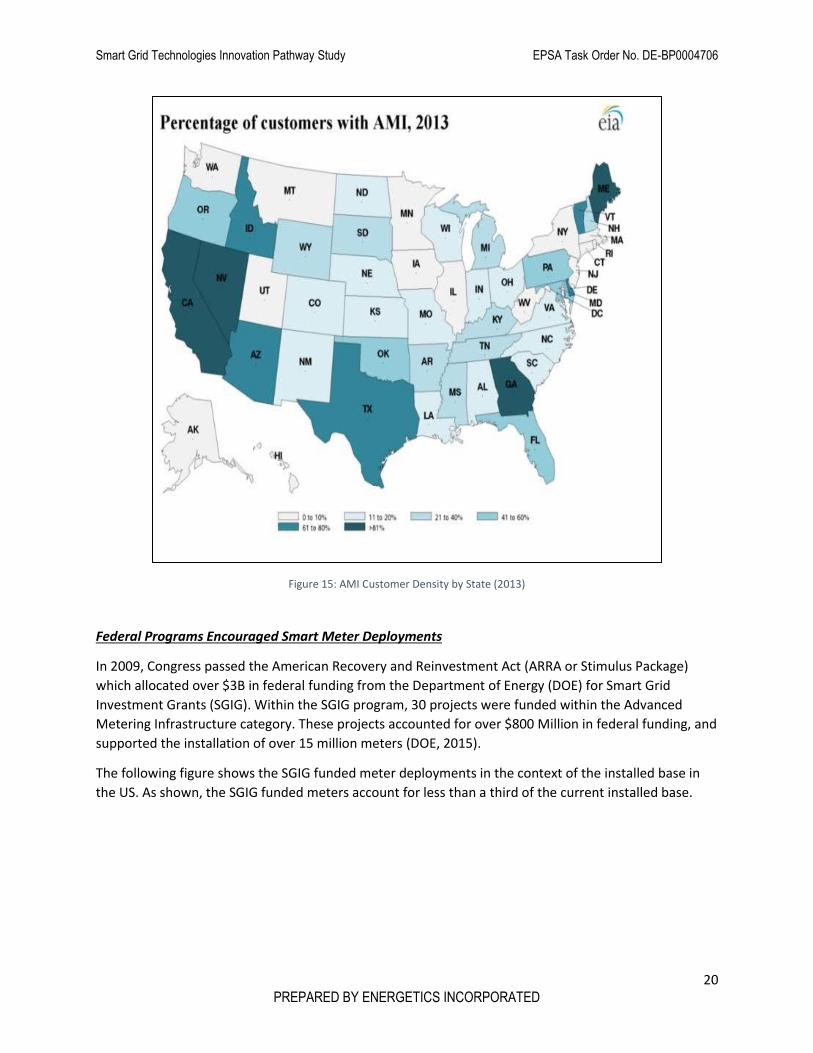
Figure 15: AMI Customer Density by State (2013)
Federal Programs Encouraged Smart Meter Deployments
In 2009, Congress passed the American Recovery and Reinvestment Act (ARRA or Stimulus Package)
which allocated over $3B in federal funding from the Department of Energy (DOE) for Smart Grid
Investment Grants (SGIG). Within the SGIG program, 30 projects were funded within the Advanced
Metering Infrastructure category. These projects accounted for over $800 Million in federal funding, and
supported the installation of over 15 million meters (DOE, 2015).
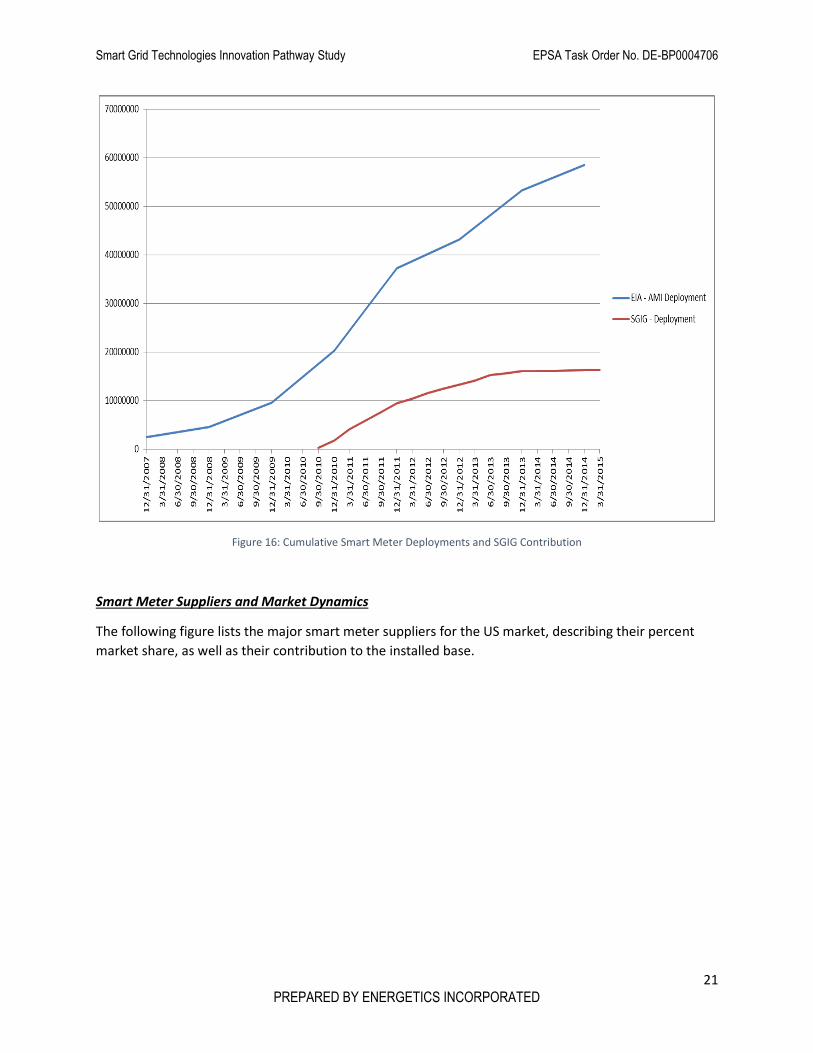
The following figure shows the SGIG funded meter deployments in the context of the installed base in
the US. As shown, the SGIG funded meters account for less than a third of the current installed base.
Smart Grid Technologies Innovation Pathway Study EPSA Task Order No. DE-BP0004706
21 PREPARED BY ENERGETICS INCORPORATED
Figure 16: Cumulative Smart Meter Deployments and SGIG Contribution
Smart Meter Suppliers and Market Dynamics
The following figure lists the major smart meter suppliers for the US market, describing their percent
market share, as well as their contribution to the installed base.
Smart Grid Technologies Innovation Pathway Study EPSA Task Order No. DE-BP0004706
22 PREPARED BY ENERGETICS INCORPORATED
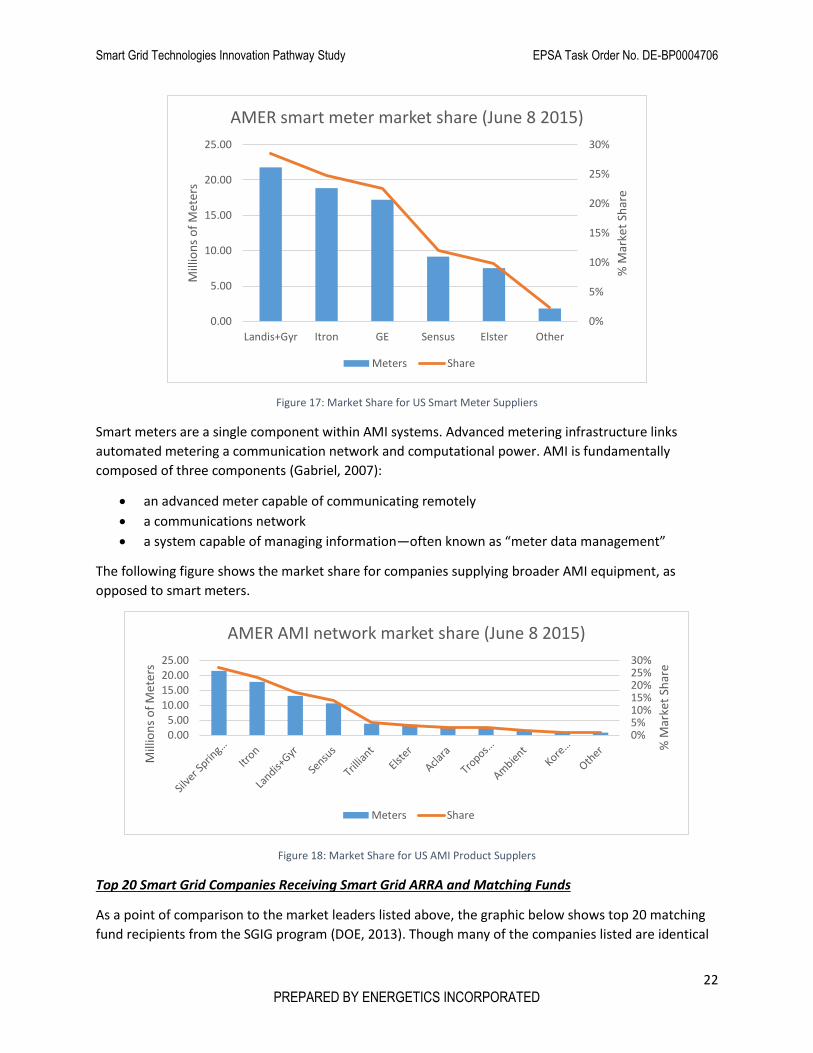
Figure 17: Market Share for US Smart Meter Suppliers
Smart meters are a single component within AMI systems. Advanced metering infrastructure links
automated metering a communication network and computational power. AMI is fundamentally
composed of three components (Gabriel, 2007):
an advanced meter capable of communicating remotely
a communications network
a system capable of managing information—often known as “meter data management”
The following figure shows the market share for companies supplying broader AMI equipment, as
opposed to smart meters.
Figure 18: Market Share for US AMI Product Supplers
Top 20 Smart Grid Companies Receiving Smart Grid ARRA and Matching Funds
As a point of comparison to the market leaders listed above, the graphic below shows top 20 matching
fund recipients from the SGIG program (DOE, 2013). Though many of the companies listed are identical
0%
5%
10%
15%
20%
25%
30%
0.00
5.00
10.00
15.00
20.00
25.00
Landis+Gyr Itron GE Sensus Elster Other
% M
arke
t Sh
are
Mill
ion
s o
f M
eter
s
AMER smart meter market share (June 8 2015)
Meters Share
0%5%10%15%20%25%30%
0.005.00
10.00
15.0020.0025.00
% M
arke
t Sh
are
Mill
ion
s o
f M
eter
s
AMER AMI network market share (June 8 2015)
Meters Share

Smart Grid Technologies Innovation Pathway Study EPSA Task Order No. DE-BP0004706
23 PREPARED BY ENERGETICS INCORPORATED
to the ones above, the SGIG listing contains a greater diversity of actors. The SGIG program encouraged
participation from a number of different companies, though it seems that the program itself was not a
major determining factor in which companies became market leaders in the US.
Table 2: Top 20 ARRA Matching Fund Recipients for Smart Meter Projects (DOE, 2013)
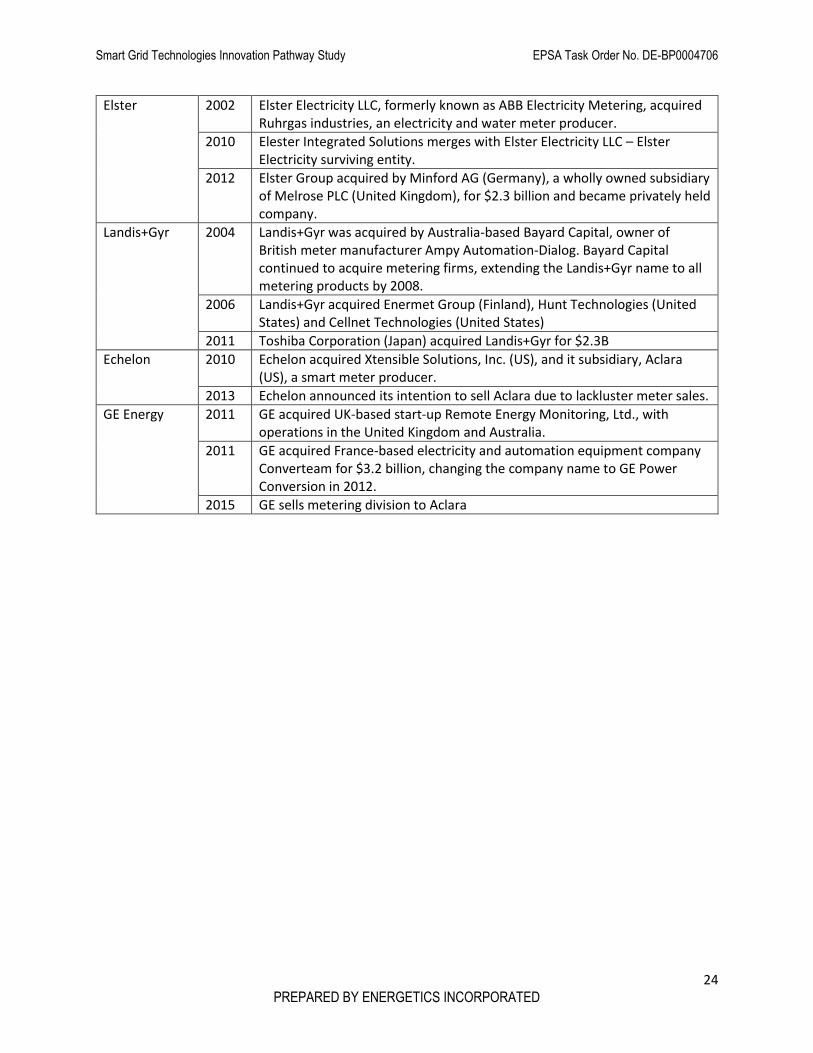
Mergers and Acquisitions Involving Major Suppliers to the U.S. Market, 2003-2013
In the smart meters market, leaders rose to prominence through the acquisition of smaller metering
companies, and through strategic mergers. The chart below details the most significant M&A activity
that impacted the smart meter market (Alejandro, et al., 2014). As shown, GE, Itron, and Landis+Gyr
were all active in building through metering businesses through strategic M&A activities.
Table 3: Mergers and Acquisitions Impacting Smart Meter Market Leaders (Alejandro, et al., 2014)
Company Date Merger/Acquisition
Sensus 2003 Spun off as wholly owned subsidiary through acquisition of Invensys Plc, a metering systems company
Itron 2004 Itron enters the electric meter manufacturing business through acquisition of Schlumberger Electricity Metering
2007 Itron expands presence in smart meters through acquisition of Actaris Metering Systems S.A.
Smart Grid Technologies Innovation Pathway Study EPSA Task Order No. DE-BP0004706
24 PREPARED BY ENERGETICS INCORPORATED
Elster 2002 Elster Electricity LLC, formerly known as ABB Electricity Metering, acquired Ruhrgas industries, an electricity and water meter producer.
2010 Elester Integrated Solutions merges with Elster Electricity LLC – Elster Electricity surviving entity.
2012 Elster Group acquired by Minford AG (Germany), a wholly owned subsidiary of Melrose PLC (United Kingdom), for $2.3 billion and became privately held company.
Landis+Gyr 2004 Landis+Gyr was acquired by Australia-based Bayard Capital, owner of British meter manufacturer Ampy Automation-Dialog. Bayard Capital continued to acquire metering firms, extending the Landis+Gyr name to all metering products by 2008.
2006 Landis+Gyr acquired Enermet Group (Finland), Hunt Technologies (United States) and Cellnet Technologies (United States)
2011 Toshiba Corporation (Japan) acquired Landis+Gyr for $2.3B
Echelon 2010 Echelon acquired Xtensible Solutions, Inc. (US), and it subsidiary, Aclara (US), a smart meter producer.
2013 Echelon announced its intention to sell Aclara due to lackluster meter sales.
GE Energy 2011 GE acquired UK-based start-up Remote Energy Monitoring, Ltd., with operations in the United Kingdom and Australia.
2011 GE acquired France-based electricity and automation equipment company Converteam for $3.2 billion, changing the company name to GE Power Conversion in 2012.
2015 GE sells metering division to Aclara
Smart Grid Technologies Innovation Pathway Study EPSA Task Order No. DE-BP0004706
25 PREPARED BY ENERGETICS INCORPORATED
Analysis of Technology Maturation Trends – Synchrophasors
PMU Deployment Curves, Deployment Locations and Data Flows
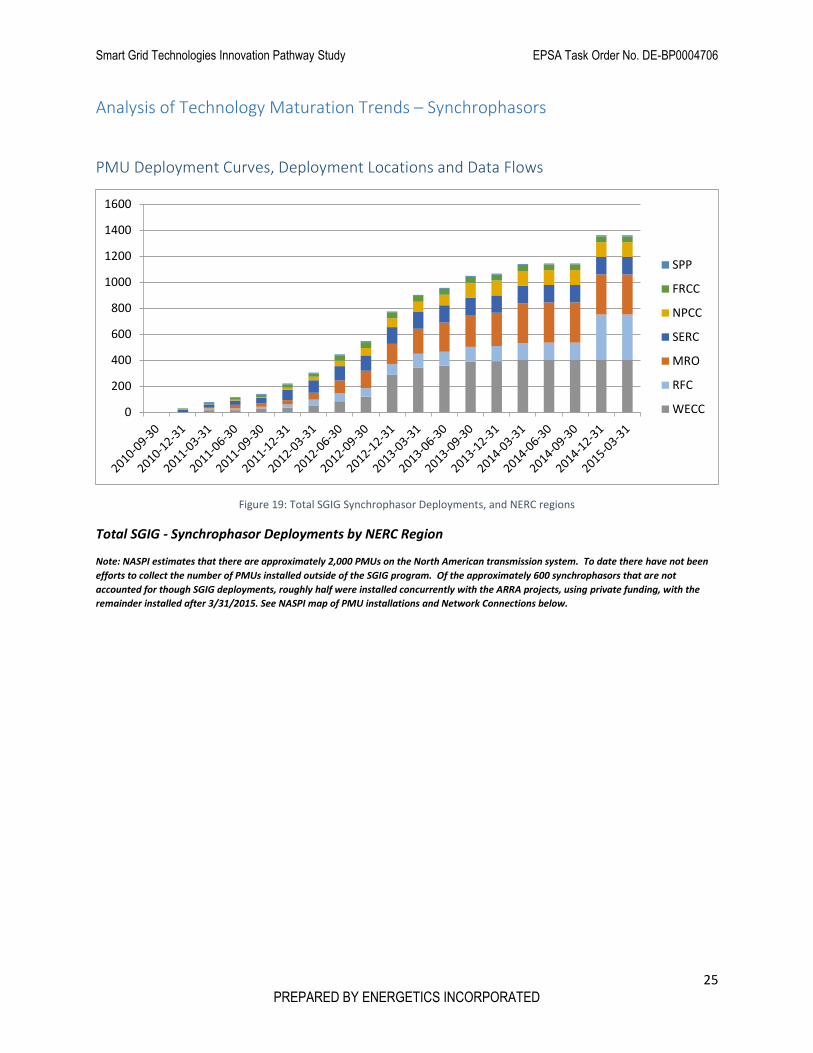
Figure 19: Total SGIG Synchrophasor Deployments, and NERC regions
Total SGIG - Synchrophasor Deployments by NERC Region
Note: NASPI estimates that there are approximately 2,000 PMUs on the North American transmission system. To date there have not been
efforts to collect the number of PMUs installed outside of the SGIG program. Of the approximately 600 synchrophasors that are not
accounted for though SGIG deployments, roughly half were installed concurrently with the ARRA projects, using private funding, with the
remainder installed after 3/31/2015. See NASPI map of PMU installations and Network Connections below.
0
200
400
600
800
1000
1200
1400
1600
SPP
FRCC
NPCC
SERC
MRO
RFC
WECC
Smart Grid Technologies Innovation Pathway Study EPSA Task Order No. DE-BP0004706
26 PREPARED BY ENERGETICS INCORPORATED
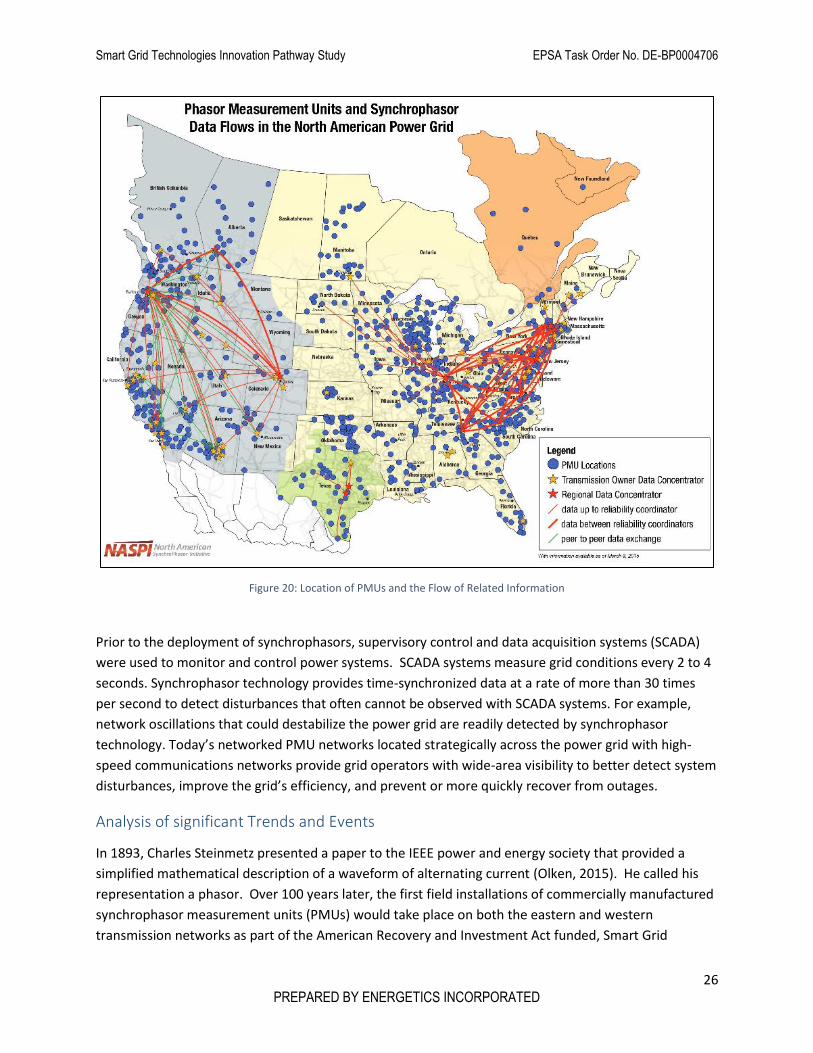
Figure 20: Location of PMUs and the Flow of Related Information
Prior to the deployment of synchrophasors, supervisory control and data acquisition systems (SCADA)
were used to monitor and control power systems. SCADA systems measure grid conditions every 2 to 4
seconds. Synchrophasor technology provides time-synchronized data at a rate of more than 30 times
per second to detect disturbances that often cannot be observed with SCADA systems. For example,
network oscillations that could destabilize the power grid are readily detected by synchrophasor
technology. Today’s networked PMU networks located strategically across the power grid with high-
speed communications networks provide grid operators with wide-area visibility to better detect system
disturbances, improve the grid’s efficiency, and prevent or more quickly recover from outages.
Analysis of significant Trends and Events
In 1893, Charles Steinmetz presented a paper to the IEEE power and energy society that provided a
simplified mathematical description of a waveform of alternating current (Olken, 2015). He called his
representation a phasor. Over 100 years later, the first field installations of commercially manufactured
synchrophasor measurement units (PMUs) would take place on both the eastern and western
transmission networks as part of the American Recovery and Investment Act funded, Smart Grid
Smart Grid Technologies Innovation Pathway Study EPSA Task Order No. DE-BP0004706
27 PREPARED BY ENERGETICS INCORPORATED
Investment Grant Program. The next section of the paper will cover the efforts and events that drove
the RD&D culminating with the commercialization and deployment of networked synchrophasors across
North America.
Primary Factors and Contributors Impacting Synchrophasor Deployment
Developments in Computer Relaying and Release of Global Positioning Satellite (GPS) System Lead to
Development and Initial Deployments of Synchrophasors
On November 9, 1965 at approximately 5:16 PM, approximately 30 million people living in 80,000
square miles in the North Eastern United States experienced what at that time was the largest blackout
in the history of the power grid (Swidler, 1965). That day President Lyndon B. Johnson issued a
Memorandum directing the Federal Power Commission to launch a thorough study of the cause of the
failure and to deliver a report identifying the causes and recommended steps to prevent a recurrence of
the event. On December 6th the Commission delivered a report which amongst the findings noted that
control centers should be equipped with display and recording equipment which provides operators
with as clear a picture of system conditions as possible (Grigsby, 2012).
The blackout in 1965 led to significant research in power system operations (Phadke A. G., 2002). Power
systems introduced wide area measurements as inputs for static state estimators. The new estimators
were designed to provide a real time estimate of the current state of the power system to allow
operators to judge the security of the power system from the point of view of the next contingency.
However, the technology available during the mid-60’s did not allow for simultaneous measurements
with high data rates, thus the wide area measurements and estimators could only provide a “quasi-
steady state approximation to the state of the power system” (Phadke A. G., 2002).
An additional takeaway form the 1965 blackout report was the need for increased coordination
between transmission system operators. In the three years following the 1965 blackout both the
Northeast Power Coordinating Council (NPCC) and Nation Electric Reliability Council, now the North
American Electric Reliability Council (NERC), were founded. NERC, along with the Department of Energy
helped stand up and finance the North American SynchroPhasor Iniative (NASPI), which provides a
forum to promote synchrophasor development and use to improve power system reliability and
viability.
During the 1970’s and 1980’s significant progress was made in developing algorithms for computer
relaying for power equipment and systems. This was a significant breakthrough at the time, when the
available computers were not fast or inexpensive enough to warrant a fully computerized protective
relay. In 1977, Arun G. Phadke, Mohammed Ibrahim and Ted Hibka, working in the Computer
Application Department of American Electic Power (AEP), published the paper, “Fundamental Basis for
Distance Relaying using Symmetrical Components”. The paper was a culmination of their efforts to
create a Symmetrical Component Distance Relay to protect high voltage transmission lines. The relaying
algorithm required the processing of only one equation to determine the fault location for all fault types
that occur on the system, and could be calculated with the microcomputers available at that time.
At this time Jim Thorpe, a professor from Cornell, joined Phadke and the Computer Applications
Department at AEP to assist them in their research. Phadke, Thorpe and Adamiak, building on the
relaying work at AEP, published the first phasor measurement paper, “A New Measurement Technique
Smart Grid Technologies Innovation Pathway Study EPSA Task Order No. DE-BP0004706
28 PREPARED BY ENERGETICS INCORPORATED
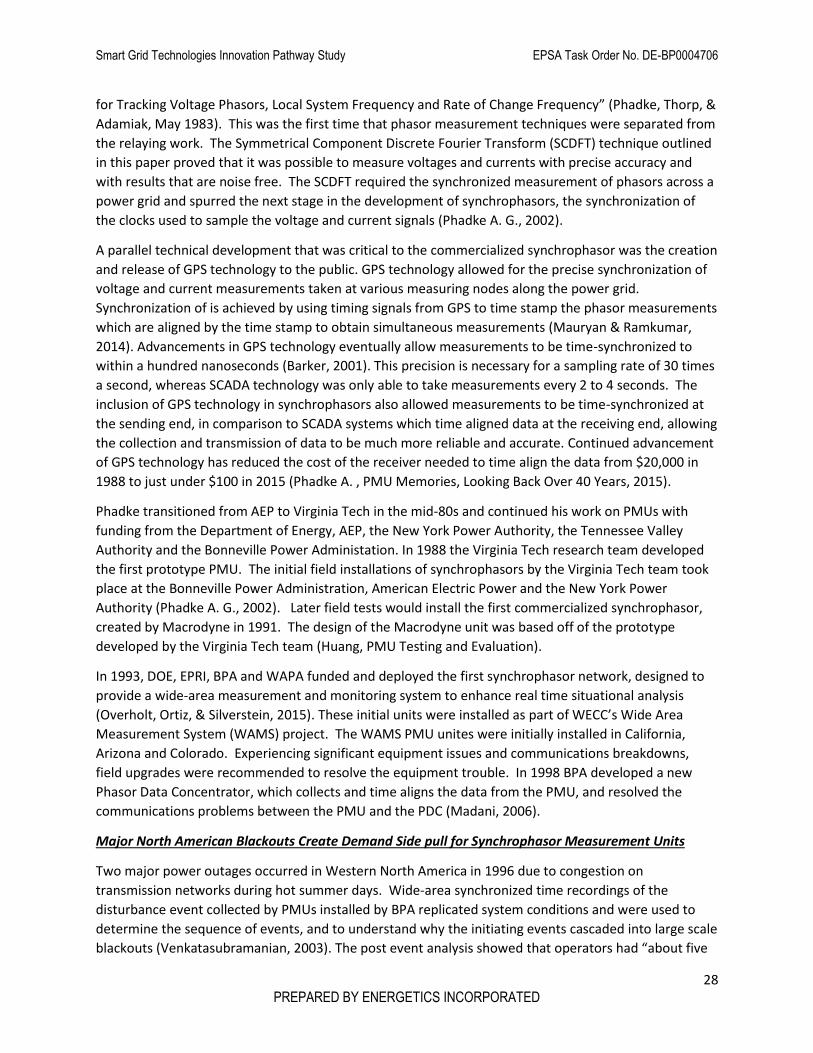
for Tracking Voltage Phasors, Local System Frequency and Rate of Change Frequency” (Phadke, Thorp, &
Adamiak, May 1983). This was the first time that phasor measurement techniques were separated from
the relaying work. The Symmetrical Component Discrete Fourier Transform (SCDFT) technique outlined
in this paper proved that it was possible to measure voltages and currents with precise accuracy and
with results that are noise free. The SCDFT required the synchronized measurement of phasors across a
power grid and spurred the next stage in the development of synchrophasors, the synchronization of
the clocks used to sample the voltage and current signals (Phadke A. G., 2002).
A parallel technical development that was critical to the commercialized synchrophasor was the creation
and release of GPS technology to the public. GPS technology allowed for the precise synchronization of
voltage and current measurements taken at various measuring nodes along the power grid.
Synchronization of is achieved by using timing signals from GPS to time stamp the phasor measurements
which are aligned by the time stamp to obtain simultaneous measurements (Mauryan & Ramkumar,
2014). Advancements in GPS technology eventually allow measurements to be time-synchronized to
within a hundred nanoseconds (Barker, 2001). This precision is necessary for a sampling rate of 30 times
a second, whereas SCADA technology was only able to take measurements every 2 to 4 seconds. The
inclusion of GPS technology in synchrophasors also allowed measurements to be time-synchronized at
the sending end, in comparison to SCADA systems which time aligned data at the receiving end, allowing
the collection and transmission of data to be much more reliable and accurate. Continued advancement
of GPS technology has reduced the cost of the receiver needed to time align the data from $20,000 in
1988 to just under $100 in 2015 (Phadke A. , PMU Memories, Looking Back Over 40 Years, 2015).
Phadke transitioned from AEP to Virginia Tech in the mid-80s and continued his work on PMUs with
funding from the Department of Energy, AEP, the New York Power Authority, the Tennessee Valley
Authority and the Bonneville Power Administation. In 1988 the Virginia Tech research team developed
the first prototype PMU. The initial field installations of synchrophasors by the Virginia Tech team took
place at the Bonneville Power Administration, American Electric Power and the New York Power
Authority (Phadke A. G., 2002). Later field tests would install the first commercialized synchrophasor,
created by Macrodyne in 1991. The design of the Macrodyne unit was based off of the prototype
developed by the Virginia Tech team (Huang, PMU Testing and Evaluation).
In 1993, DOE, EPRI, BPA and WAPA funded and deployed the first synchrophasor network, designed to
provide a wide-area measurement and monitoring system to enhance real time situational analysis
(Overholt, Ortiz, & Silverstein, 2015). These initial units were installed as part of WECC’s Wide Area
Measurement System (WAMS) project. The WAMS PMU unites were initially installed in California,
Arizona and Colorado. Experiencing significant equipment issues and communications breakdowns,
field upgrades were recommended to resolve the equipment trouble. In 1998 BPA developed a new
Phasor Data Concentrator, which collects and time aligns the data from the PMU, and resolved the
communications problems between the PMU and the PDC (Madani, 2006).
Major North American Blackouts Create Demand Side pull for Synchrophasor Measurement Units
Two major power outages occurred in Western North America in 1996 due to congestion on
transmission networks during hot summer days. Wide-area synchronized time recordings of the
disturbance event collected by PMUs installed by BPA replicated system conditions and were used to
determine the sequence of events, and to understand why the initiating events cascaded into large scale
blackouts (Venkatasubramanian, 2003). The post event analysis showed that operators had “about five
Smart Grid Technologies Innovation Pathway Study EPSA Task Order No. DE-BP0004706
29 PREPARED BY ENERGETICS INCORPORATED
minutes to react before the second [transmission] line tripped, at which point the western grid came
apart quickly” (Barker, 2001). A real-time monitoring system could have provided operators with the
necessary information in time to prevent the cascading outage.
The 2003 US-Canada blackout led to a surge in support for CERTS and the EIPP. 50 million power users
were affected by the blackout, with many of the affected living and working in large urban centers with
both large industrial and financial sectors. Estimates on the cost of the 2003 blackout range from $4.5
to $10 B. The Department of Energy frequently cites the total cost of this blackout at $6B (ELCOM,
2004). The final report on the 2003 blackout notes that the need for improved wide area visualization
capabilities had been a reoccurring theme in blackout investigations. The significant economic damages
sustained as a result of the blackout contributed to the demand for technology able to prevent
cascading outages.
At this time real-time PMU systems had been tested in both the eastern and western interconnections,
but as the report identifies, the needed improvements in the quality of these systems would require
“significant new investments in existing or emerging technologies”. The report identifies the
“development of practical real-time applications for wide-area system monitoring using phasor
measurement and other synchronized measuring devices, including post-disturbance applications” as an
important area for reliability research. It further recommends that NERC work with the public and
private sector research organizations to “assess the applicability of existing and new technology to make
the interconnections less susceptible to cascading outages” (FERC).
In 2002, the Department of Energy launched the Eastern Interconnection Phasor Project (EIPP),
executed by the Consortium for Electric Reliability Technology Solutions (CERTS). CERTS was established
to create a coordinated response to transitions occurring in the US electric power system and to
“monitor research on reliability technologies and assure that gaps to not emerge” (certs, 2016). CERTS
is comprised of research entities from industry, academia and the national labs. By 2006 the EIPP work
group was comprised of over 220 stakeholders, broken up into six task teams. Each task team is led by
an industry member with support from a DOE-funded CERTS team member. The task team leads, along
with NERC, CERTS and DOE representation form the Leadership Committee that facilitates
communication and coordination amongst the project team members (Donnelly, Ingram, & Carrol,
2006).
One of the key takeaways from the experience deploying PMUs on the western interconnection was
that the value of synchrophasor technology increases as data is shared by multiple utilities operating
within an interconnection. As part of the EIPP, the Tennessee Valley Authority (TVA) installed a (PDC) to
aggregate the data collected by PMUs installed by utilities on the eastern interconnection. TVA
developed the openPDC software program to organize incoming data. This open source program is
available on the web at www.openpdc.codeplex.com. As of 2011, the TVA PDC was the collection point
for 120 PMUs in the eastern interconnection (Donnelly, Ingram, & Carrol, 2006). Former TVA
employees also went on to form the Grid Protection Alliance, a non-profit corporation which now
manages the openPDC software (Alliance, 2015). Utilities in the Eastern Interconnection are currently in
the process of transitioning to the Eastern Interconnection Data Sharing Network – a new network for
sharing operating reliability data, including both SCADA and synchrophasor data.
In 2006, DOE partnered with NERC to incorporate synchrophasors into NERC committee structure.
DOE’s mandate was focused on research, and at this time it was generally accepted that synchrophasor
Smart Grid Technologies Innovation Pathway Study EPSA Task Order No. DE-BP0004706
30 PREPARED BY ENERGETICS INCORPORATED
technology needed to begin the transition into an operating framework. The two organizations assisted
in combining the western interconnection synchrophasor users with the EIPP to form the North
American Synchrophasor Initiative (NASPI). NASPI is made up of five committees covering operations,
planning, data network management, performance standards and research. Committees are composed
of vendors, academics and utilities, with vendors leading activity in the data network management
committee, academics in the research committee and utilities in the operations, planning and
performance standards committees (Donnelly, Ingram, & Carrol, 2006). The planning and coordination
facilitated by NASPI allowed utilities to maximize the funding available through the ARRA funded SGIG
program.
Large Scale Deployment of Commercialized Synchrophasor’s Due to American Recovery and
Reinvestment Act Funded Smart Grid Investment Grants
In 2009 DOE selected 13 entities and invested $155 million in ARRA funding along with $203 million in
participant cost-share funding to deploy synchrophasor networks. Prior to the SGIG program there were
approximately 166 research-grade, networked PMUs, most installed as part of the WAMs and EIPP
efforts. The SGIG program provided funding for the installation of 1,380 networked PMUs and 226 PDCs
(DOE, Advancement of Synchrophasor Technology, 2016). The efforts also led to the installation of
approximately 600 additional PMUs (NASPI estimates that there are currently more than 2,000
networked PMUs on the North American transmission grid). NASPI is currently working on creating a
PMU registry to identify the exact number and location of PMUs installed.
Aside from the significant penetration of synchrophasor networks, the SGIG program drove significant
advancements in technology performance, technology use, communication network design, and the
development of cybersecurity requirements. The scale of the deployment effort, along with the
coordination amongst participants and other industry players through NASPI, facilitated these major
advancements.
Equipment Testing and Standards For Synchrophasors
Developments to synchrophasor hardware were driven by PMU testing and standards creation. Testing
of PMUs between 1995 and 2005 was led by PNNL. In 2005, PNNL leveraged DOE funds and set up a
PMU testing facility with help and support from BPA (Novosel, Snyder, & Vu, 2007). The testing and
certification of devices to meet industry standards increased user acceptance of the technology.
The use of synchrophasor devices is governed by a variety of codes, standards, and regulations; to
ensure their safe operation, to ensure that common test procedures are used amongst manufacturers,
and to ensure that the resulting products are interoperable. The development of IEEE standards for
synchrophasors facilitated the growth and adoption of the technology. In 1995, IEEE introduced the first
synchrophasor specific standard. However, as synchrophasors were integrated into existing substation
and power system control and communication systems, their use became subject to a host of relevant
standards. The most recent update to the standard regulating Synchrophasor measurements, which
occurred in 2011, requires compliance in both steady state and dynamic conditions, and was a
significant development for the technolog. The following chart describes the standards relevant to the
use and integration of synchrophasors.
Smart Grid Technologies Innovation Pathway Study EPSA Task Order No. DE-BP0004706
31 PREPARED BY ENERGETICS INCORPORATED
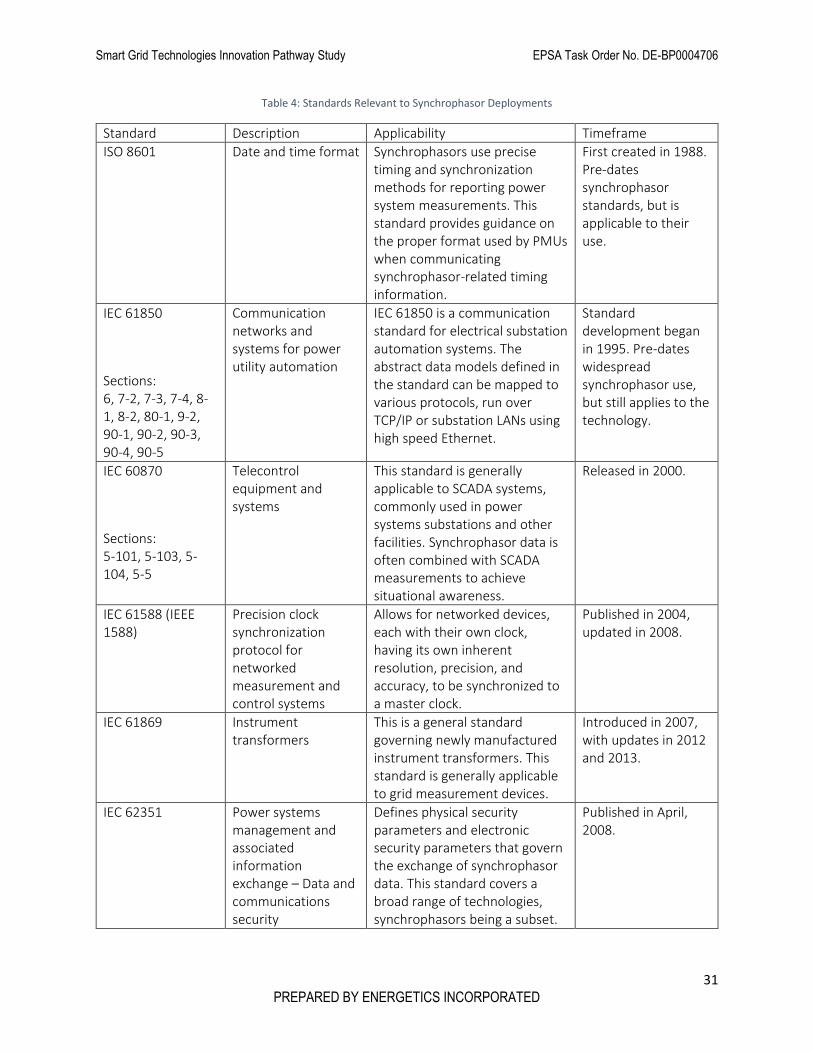
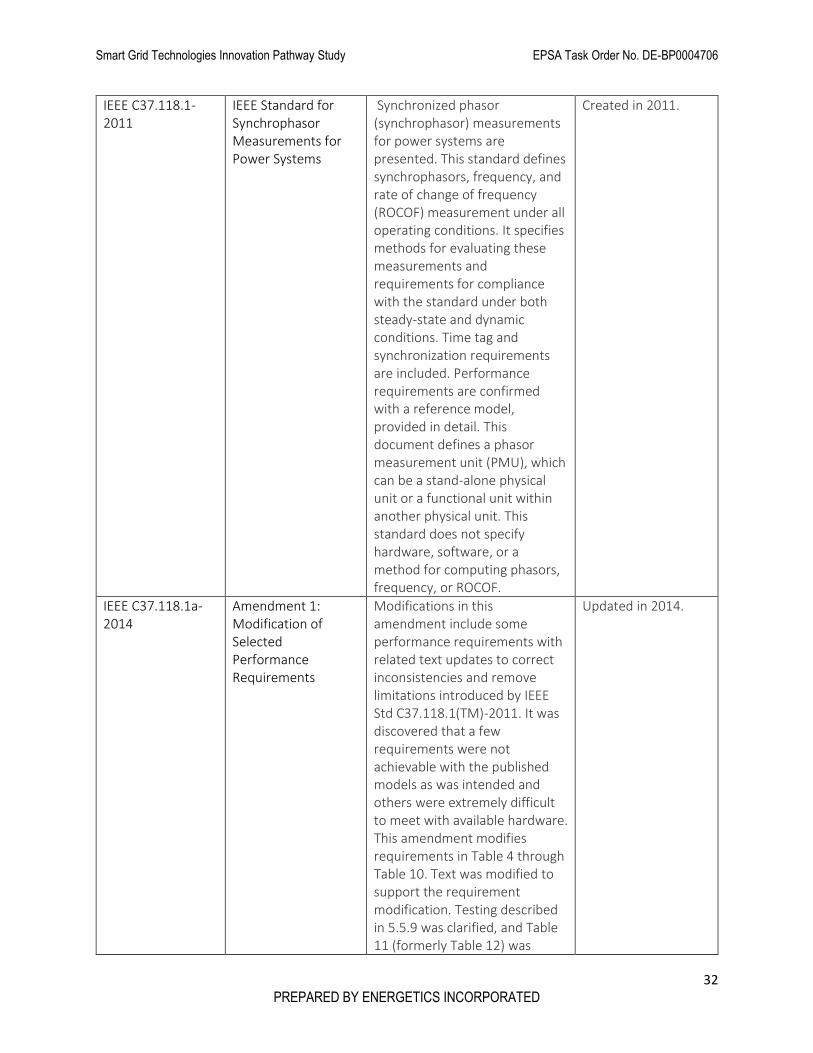
Table 4: Standards Relevant to Synchrophasor Deployments
Standard Description Applicability Timeframe
ISO 8601 Date and time format Synchrophasors use precise timing and synchronization methods for reporting power system measurements. This standard provides guidance on the proper format used by PMUs when communicating synchrophasor-related timing information.
First created in 1988. Pre-dates synchrophasor standards, but is applicable to their use.
IEC 61850
Sections: 6, 7-2, 7-3, 7-4, 8-1, 8-2, 80-1, 9-2, 90-1, 90-2, 90-3, 90-4, 90-5
Communication networks and systems for power utility automation
IEC 61850 is a communication standard for electrical substation automation systems. The abstract data models defined in the standard can be mapped to various protocols, run over TCP/IP or substation LANs using high speed Ethernet.
Standard development began in 1995. Pre-dates widespread synchrophasor use, but still applies to the technology.
IEC 60870
Sections: 5-101, 5-103, 5-104, 5-5
Telecontrol equipment and systems
This standard is generally applicable to SCADA systems, commonly used in power systems substations and other facilities. Synchrophasor data is often combined with SCADA measurements to achieve situational awareness.
Released in 2000.
IEC 61588 (IEEE 1588)
Precision clock synchronization protocol for networked measurement and control systems
Allows for networked devices, each with their own clock, having its own inherent resolution, precision, and accuracy, to be synchronized to a master clock.
Published in 2004, updated in 2008.
IEC 61869 Instrument transformers
This is a general standard governing newly manufactured instrument transformers. This standard is generally applicable to grid measurement devices.
Introduced in 2007, with updates in 2012 and 2013.
IEC 62351 Power systems management and associated information exchange – Data and communications security
Defines physical security parameters and electronic security parameters that govern the exchange of synchrophasor data. This standard covers a broad range of technologies, synchrophasors being a subset.
Published in April, 2008.
Smart Grid Technologies Innovation Pathway Study EPSA Task Order No. DE-BP0004706
32 PREPARED BY ENERGETICS INCORPORATED
IEEE C37.118.1-2011
IEEE Standard for Synchrophasor Measurements for Power Systems
Synchronized phasor (synchrophasor) measurements for power systems are presented. This standard defines synchrophasors, frequency, and rate of change of frequency (ROCOF) measurement under all operating conditions. It specifies methods for evaluating these measurements and requirements for compliance with the standard under both steady-state and dynamic conditions. Time tag and synchronization requirements are included. Performance requirements are confirmed with a reference model, provided in detail. This document defines a phasor measurement unit (PMU), which can be a stand-alone physical unit or a functional unit within another physical unit. This standard does not specify hardware, software, or a method for computing phasors, frequency, or ROCOF.
Created in 2011.
IEEE C37.118.1a-2014
Amendment 1: Modification of Selected Performance Requirements
Modifications in this amendment include some performance requirements with related text updates to correct inconsistencies and remove limitations introduced by IEEE Std C37.118.1(TM)-2011. It was discovered that a few requirements were not achievable with the published models as was intended and others were extremely difficult to meet with available hardware. This amendment modifies requirements in Table 4 through Table 10. Text was modified to support the requirement modification. Testing described in 5.5.9 was clarified, and Table 11 (formerly Table 12) was
Updated in 2014.

Smart Grid Technologies Innovation Pathway Study EPSA Task Order No. DE-BP0004706
33 PREPARED BY ENERGETICS INCORPORATED
modified to match. Annex C was modified to keep it consistent with the rest of the document.
Smart Grid Technologies Innovation Pathway Study EPSA Task Order No. DE-BP0004706
34 PREPARED BY ENERGETICS INCORPORATED
References Alejandro, L., Blair, C., Bloodgood, L., Khan, M., Lawless, M., Meehan, D., . . . Tsuji, K. (2014). Global
Market for Smart Electricity Meters: Government Policies Driving Strong Growth. U.S.
International Trade Commission , Office of Industries. Retrieved from
https://www.usitc.gov/publications/332/id-037smart_meters_final.pdf
Alliance, T. G. (2015). GPA Products. Retrieved from
https://www.gridprotectionalliance.org/products.asp
Barker, B. (2001, May). Synchrophasors: Progeny of a Blackout. Public Power, 63(3).
certs. (2016). About CERTS. (T. C. Solutions, Producer) Retrieved from https://certs.lbl.gov/about-certs
Chebra, R. J. (2016). Beyond Revenue Metering - A New Age for Automatic Meter Reading. Retrieved
from Electric Energy Online:
http://www.electricenergyonline.com/show_article.php?mag=9&article=62
Cognyst Advisors. (2014). Retrieved from The Scott Report: http://www.thescottreport.com/index.html
DOE. (2013). Economic Impact of Recover Act Investments in the Smart Grid. The US Department of
Energy. Retrieved from
https://www.smartgrid.gov/files/Smart_Grid_Economic_Impact_Report.pdf
DOE. (2014). Synchrophasor Applications in Transmission Systems. Retrieved from
https://www.smartgrid.gov/recovery_act/program_impacts/applications_synchrophasor_techn
ology.html
DOE. (2015, March 13). Advanced Metering Infrastructure and Customer Systems. Retrieved from
https://www.smartgrid.gov/recovery_act/deployment_status/sdgp_ami_systems.html
DOE. (2015). RECOVERY ACT SELECTIONS FOR SMART GRID INVESTMENT GRANT AWARDS - BY
CATEGORY. The US Department of Energy. Retrieved from
http://energy.gov/sites/prod/files/SGIG%20Awards%20by%20Category%202011%2011%2015.p
df
DOE. (2016). Advancement of Synchrophasor Technology in Projects Funded by the American Recovery
and Reinvestment Act of 2009. Office of Electricity Delivery and Energy Reliability. US
Department of Energy. Retrieved from
http://www.energy.gov/sites/prod/files/2016/03/f30/Advancement%20of%20Sychrophasor%2
0Technology%20Report%20March%202016.pdf
Donnelly, M., Ingram, M., & Carrol, J. (2006). Proceeding of the 39th Hawaii International Conference on
System Sciences, (p. Eastern Interconnection Phasor Project).
EIA. (2011). Smart Grid Legislative and Regulatory Policies and Case Studies. The US Energy Information
Administration .
ELCOM. (2004). The Economic Impacts of the August 2003 Blackout. Electricity Consumers Resource
Council.
Smart Grid Technologies Innovation Pathway Study EPSA Task Order No. DE-BP0004706
35 PREPARED BY ENERGETICS INCORPORATED
FERC. (n.d.). Final Blackout Report. The Federal Energy Regulatory Commission. Retrieved from
https://www.ferc.gov/industries/electric/indus-act/reliability/blackout/ch7-10.pdf
Gabriel, M. (2007, November - December). Technology advances are bringing advanced metering
infrastructure within reach for more utilities. Public Power. Retrieved from
http://www.publicpower.org/Media/magazine/ArticleDetail.cfm?ItemNumber=20460
Grigsby, L. L. (2012). Wide-Area Monitoring and Situational Analysis. In Power System Stability and
Control (Vols. Third Edition, Volume 5 ). CRC Press.
Huang, H. (n.d.). PMU Testing and Evaluation. BPA, PNNL. Pacific Northwest National Laboratory.
Huang, H. (n.d.). PMU Testing and Evaluation Source. BPA, PNNL. Pacific Northwest National Laboratory.
Institute for Electric Innovation. (2014). Utility-Scale Smart Meter Deployments: Building Block of the
Evolving Power Grid. The Edison Foundation.
Litos Strategic Communications. (2008). The Smart Grid: An Introduction. US Department of Energy.
www.smartgrid.gov.
Madani, V. (2006). Western Interconnection Experience With Phasor Measurements. IEEE Power Systems
Conference and Expedition.
Mauryan, K. C., & Ramkumar, V. (2014). Phasor Measurement Units in Power System Networks - A
Review. INTERNATIONAL JOURNAL OF ADVANCED INFORMATION AND COMMUNICATION
TECHNOLOGY.
Novosel, D., Snyder, B., & Vu, K. (2007). A Business Case Study on Applying Synchrophasor Measurement
Technology and Applications in the California and the Western Electricity Coordinating Council
Grid. KEMA Inc, Energy Research and Development Divison. California Energy Commission.
Retrieved from http://www.energy.ca.gov/2013publications/CEC-500-2013-045/CEC-500-2013-
045-APA-F.pdf
Office of the Press Secretary, The White House. (2016). FACT SHEET: The Recovery Act Made The Largest
Single Investment In Clean Energy In History, Driving The Deployment Of Clean Energy,
Promoting Energy Efficiency, And Supporting Manufacturing. Retrieved from
https://www.whitehouse.gov/the-press-office/2016/02/25/fact-sheet-recovery-act-made-
largest-single-investment-clean-energy
Olken, M. (2015, September - October). Key Developments: Synchrophasor Technology. IEEE Power and
Energy, 13(5).
Overholt, P., Ortiz, D., & Silverstein, A. (2015, September - October). Synchrophasor Technology and the
DOE. IEEE Power and Energy Magazine, 13(5).
Phadke, A. (2015, September - October). PMU Memories, Looking Back Over 40 Years. IEEE Power and
Energy, 13(5).
Phadke, A. (2015, September - October). PMU Memories, Looking Back Over 40 Years. IEEE Power and
Energy, 13(5).
Smart Grid Technologies Innovation Pathway Study EPSA Task Order No. DE-BP0004706
36 PREPARED BY ENERGETICS INCORPORATED
Phadke, A. G. (2002). Synchronized phasor measurements-a historical overview. Transmission and
Distribution Conference and Exhibition 2002: Asia Pacific. IEEE Power and Energy Society.
Retrieved from
http://ieeexplore.ieee.org/stamp/stamp.jsp?tp=&arnumber=1178427&isnumber=26467
Phadke, A. G., Thorp, J. S., & Adamiak, M. G. (May 1983). A New Measurement technique for tracking
voltage phasors, local system frequency, and rate of change of frequency. Summer Power
Meeting of IEEE. San Francisco: Transactions of IEEE on PAS.
Stephens, J. C., Wilson, E. J., & Peterson, T. R. (2008). Socio-Political Evaluation of Energy Deployment
(SPEED): An integrated research framework analyzing energy technology deployment.
Technological forecasting and social change, 75(8).
Swidler, J. C. (1965). REPORT TO THE PRESIDENT BY THE FEDERAL POWER COMMISSION ON THE POWER
FAILURE IN THE NORTHEASTERN UNITED STATES AND THE PROVINCE OF ONTARIO ON
NOVEMBER 9-10, 1965. Federal Power Commission .
Venkatasubramanian, M. V. (2003). Analyzing Blackout Events: Experience from the Major Western
Blackouts in 1996. The Power Systems Engineering Research Center.
Top Related